Attached files
| file | filename |
|---|---|
| 8-K - 8-K - KAPSTONE PAPER & PACKAGING CORP | a12-5023_18k.htm |
| EX-99.1 - EX-99.1 - KAPSTONE PAPER & PACKAGING CORP | a12-5023_1ex99d1.htm |
Exhibit 99.2
|
|
2011 Fourth Quarter and Full Year Review Roger W. Stone Chairman and Chief Executive Officer Andrea K. Tarbox Vice President and Chief Financial Officer February 15, 2012 |
|
|
Forward Looking Statements The information in this presentation and statements made during this presentation may contain certain forward-looking statements within the meaning of federal securities laws. These statements reflect management’s expectations regarding future events and operating performance. These forward-looking statements involve a number of risks and uncertainties. A list of the factors that could cause actual results to differ materially from those expressed in, or underlying, any forward-looking statements can be found in the Company’s filings with the Securities and Exchange Commission, such as its annual and quarterly reports. The Company disclaims any obligation to revise or update such statements to reflect the occurrence of events after the date of this presentation. This presentation refers to non-U.S. GAAP financial information. For a reconciliation to U.S. GAAP financial measures, please refer to the appendix. Forward-Looking Statements Non-GAAP Financial Measures Risk Factors 2 |
|
|
3 Strong, Profitable Growth Millions CAGR of 35% CAGR of 42% KapStone Delivers Net Sales Adj. EBITDA* *Adjusted to exclude alternative fuel mixture credits, non-cash stock compensation, acquisition related costs, and dunnage bag business sold in March 2009 |
|
|
Full Year Financial Results *Adjusted to exclude alternative fuel mixture credit , non-cash stock compensation, and acquisition related costs **Adjusted to exclude items above and cellulosic biofuel tax credits 4 |
|
|
5 Thousands of Tons Thousands of Tons Annual Production Mill Production Increases Sustained high operating rates from legacy mills and inclusion of two months of production from the acquisition drove record production for the FYE 2011 and for Q4 2011 Q4 2011 includes 2 months of USC production of 39 thousand tons 2,700 tons lost due to planned annual maintenance outage Roanoke Rapids’ planned annual outage reduced production by 11,700 tons in Q4 2011 and 10,000 tons in Q4 2010 Finished goods inventory at year-end essentially unchanged from prior year end and in good position Quarterly Production |
|
|
Net Sales Increase 16% Adjusted EBITDA* Surges 74% 6 Full Year 2011 Compared to 2010 *Adjusted to exclude alternative fuel mixture credits, non-cash stock compensation, and acquisition related costs |
|
|
Fourth Quarter Financial Results 7 *Adjusted to exclude alternative fuel mixture and cellulosic biofuel tax credits, non-cash stock compensation, and acquisition related costs **Adjusted to exclude items above and cellulosic biofuel tax credits |
|
|
Acquisition and Higher Volume Increase Net Sales 35% Unit Sales by Product Line 8 Q4 2011 Compared to Q4 2010 Containerboard and Unbleached Kraft Average mill revenue per ton was $620 per ton in Q4 2011 versus $611 in 2010 In Q4 2011, sold 332 thousand tons of paper and 1.0 billion square feet of corrugated products compared to 316 thousand tons of paper sold in prior year 35 thousand tons of containerboard were shipped to our packaging plants Net Sales |
|
|
Acquisition and Higher Volume Drive Adjusted EBITDA* Up 27% 9 Q4 2011 Compared to Q4 2010 *Adjusted to exclude alternative fuel mixture and cellulosic biofuel tax credits, non-cash stock compensation, and USC one-time and start-up costs Higher caustic soda price was primary component of inflation Higher planned maintenance outages were due to more extensive work at RRs and $1 million for Cowpens (newly acquired mill) annual outage |
|
|
Sequential Quarter Comparison *Includes impact of RR’s and Cowpens’ annual planned maintenance outages which reduced production and tons available to be shipped by 14,400 tons and increased maintenance expense by $8 million 10 **Adjusted to exclude alternative fuel mixture tax credits, non-cash stock compensation, and acquisition related costs |
|
|
Net Sales Increase 25% Unit Sales by Product Line 11 Q4 2011 Compared to Q3 2011 Containerboard and Unbleached Kraft Average mill revenue per ton by $19 to $620 in Q4 Price decline in Q4 due to lower export containerboard prices partially offset by kraft paper increases. Less favorable mix due to seasonal decline in Durasorb and kraft paper |
|
|
Planned Annual Maintenance Outages Drive Adjusted EBITDA* Down 10% 12 Q4 2011 Compared to Q3 2011 *Adjusted to exclude non-cash stock compensation, and acquisition one-time and start-up costs Deflation resulted primarily from lower wood costs Lower prices on export containerboard and weaker Euro Seasonal slowdown for DuraSorb and Kraftpak - less favorable product mix |
|
|
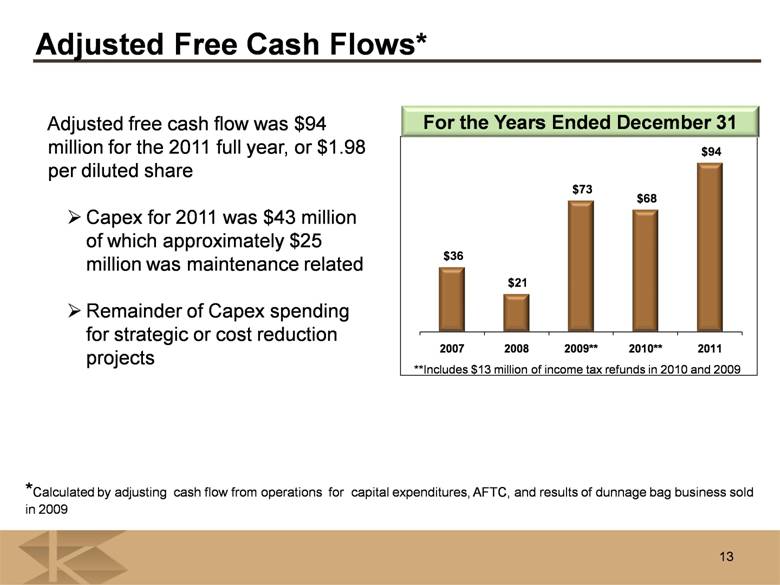
Adjusted Free Cash Flows* Adjusted free cash flow was $94 million for the 2011 full year, or $1.98 per diluted share Capex for 2011 was $43 million of which approximately $25 million was maintenance related Remainder of Capex spending for strategic or cost reduction projects *Calculated by adjusting cash flow from operations for capital expenditures, AFTC, and results of dunnage bag business sold in 2009 For the Years Ended December 31 13 **Includes $13 million of income tax refunds in 2010 and 2009 |
|
|
Strong Balance Sheet at December 31, 2011 14 Net debt $347 million Current interest rate on debt 2.27% Debt to EBITDA ratio per bank agreement 1.83 At Dec. 31, 2011, KapStone had $8 million of cash and $142 million of revolver borrowing capacity In addition, KapStone’s credit facility has a $300 million accordion provision to provide for future borrowing under the same terms and conditions |
|
|
15 Quarter Ended December 31, Year Ended December 31, 2011 2010 2011 2010 Provision (benefit) for income taxes (56,678) 3,171 (23,640) (2,407) Effective tax rate (323.5%) 19.4% (23.6%) (3.8%) Income Tax adjustments: Reversal of tax reserves for AFTC 63,026 - 63,026 - AFTC and Cellulosic biofuel credit - 388 - 23,825 Domestic manufacturing deduction - 422 (1,148) 1,148 Other discrete tax adjustments (80) 1,845 (80) 1,362 Adjusted provision (benefit) for income taxes 6,268 5,826 38,158 23,928 Adjusted effective tax rate 35.8% 35.6% 38.0% 38.2% Tax Notes The USC acquisition provides KapStone with $37 million of pre-tax NOLs Projected book tax rate to be approximately 38.5% in 2012 Cash federal income tax rate expected to be less than 10% |
|
|
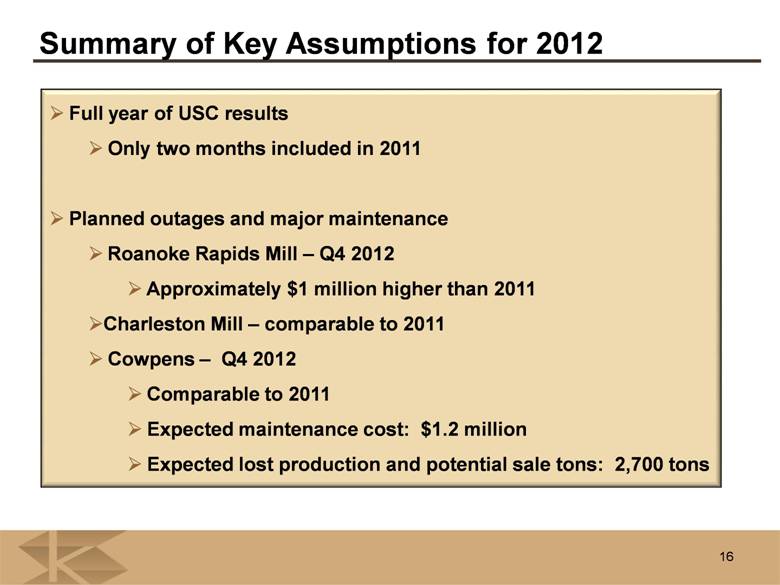
Summary of Key Assumptions for 2012 Full year of USC results Only two months included in 2011 Planned outages and major maintenance Roanoke Rapids Mill – Q4 2012 Approximately $1 million higher than 2011 Charleston Mill – comparable to 2011 Cowpens – Q4 2012 Comparable to 2011 Expected maintenance cost: $1.2 million Expected lost production and potential sale tons: 2,700 tons 16 |
|
|
Summary of Key Assumptions for 2012 Input costs Expect overall flat to slight upward cost pressure Primarily driven by stable wood prices offset with slightly lower OCC Partially offset by higher energy and caustic soda CAPEX - Approximately $60 million Including approximately $10 million for USC including the replacement of the ERP system FX Slight negative compared to 2011 Avg. rate for 2011 was 1.39 17 |