Attached files
| file | filename |
|---|---|
| 8-K - 8-K - PennyMac Mortgage Investment Trust | a12-4549_18k.htm |
| EX-99.1 - EX-99.1 - PennyMac Mortgage Investment Trust | a12-4549_1ex99d1.htm |
Exhibit 99.2
|
|
PennyMac Mortgage Investment Trust February 8, 2012 Fourth Quarter 2011 Earnings Report |

|
|
4Q11 Earnings Report 2 This presentation contains forward-looking statements within the meaning of Section 21E of the Securities Exchange Act of 1934, as amended, regarding management’s beliefs, estimates, projections and assumptions with respect to, among other things, the Company’s financial results, future operations, business plans and investment strategies, as well as industry and market conditions, all of which are subject to change. Words like “believe,” “expect,” “anticipate,” “promise,” “plan,” and other expressions or words of similar meanings, as well as future or conditional verbs such as “will,” “would,” “should,” “could,” or “may” are generally intended to identify forward-looking statements. Actual results and operations for any future period may vary materially from those projected herein, from past results discussed herein, or illustrative examples provided herein. Factors which could cause actual results to differ materially from historical results or those anticipated include, but are not limited to: changes in general business, economic, market and employment conditions from those expected; continued declines in residential real estate and disruption in the U.S. housing market; the availability of, and level of competition for, attractive risk-adjusted investment opportunities in residential mortgage loans and mortgage-related assets that satisfy our investment objectives and investment strategies; changes in our investment or operational objectives and strategies, including any new lines of business; the concentration of credit risks to which we are exposed; the availability, terms and deployment of short-term and long-term capital; unanticipated increases in financing and other costs, including a rise in interest rates; the performance, financial condition and liquidity of borrowers; increased rates of delinquency or decreased recovery rates on our investments; increased prepayments of the mortgage and other loans underlying our investments; changes in regulations or the occurrence of other events that impact the business, operation or prospects of government sponsored enterprises; changes in government support of homeownership; changes in governmental regulations, accounting treatment, tax rates and similar matters; and our ability to satisfy complex rules in order to qualify as a REIT for U.S. federal income tax purposes. You should not place undue reliance on any forward-looking statement and should consider all of the uncertainties and risks described above, as well as those more fully discussed in reports and other documents filed by the Company with the Securities and Exchange Commission from time to time. The Company undertakes no obligation to publicly update or revise any forward-looking statements or any other information contained herein, and the statements made in this presentation are current as of the date of this presentation only. Forward-Looking Statements |

|
|
4Q11 Earnings Report 3 Fourth Quarter Highlights Earned $0.70 per diluted share Increased dividend to $0.55 per share Return on average equity of over 15% Pre-tax income from correspondent segment of $7.4 million Correspondent fundings of nearly $1 billion Correspondent locks of over $1.3 billion Raised $8.7 million of equity to support dramatic growth of correspondent lending business Continued expansion of secured credit facilities to over $1 billion $590 million in NPL facilities $450 million in correspondent facilities Entered into a forward trade to purchase $49 million in unpaid principal balance (UPB) of distressed whole loans |

|
|
4Q11 Earnings Report 4 Growth Opportunities in Distressed Loans and New Originations Legacy Mortgage Assets New Mortgage Market Approximately $420 billion non-agency whole loans are delinquent or in foreclosure (1) Mostly held by large banks, which are reducing their exposure To date most sales have been non-performing loans; however, re-performing loans are beginning to come to market Banks continue to remain under pressure to sell mortgage servicing rights (MSR’s) $1 trillion in annual originations expected in 2012 (2) Approximately $300 billion of this expected through the correspondent channel Regulatory and capital issues are causing some large banks to retreat Evolving potential for more attractive investment in mortgage servicing, e.g., with servicing fee reform PMT will continue to pursue distressed whole loan investments, while also seeking new opportunities, such as MSRs Correspondent volume should steadily increase as this becomes a greater component of PMT’s earnings over the year Total Single Family 1-4 loan data as of September 30, 2011, and delinquency rate of 12.63% (loans that are either delinquent or in foreclosure) as of September 30, 2011 Mortgage Bankers Association forecast, January 18, 2012 (2012 |

|
|
4Q11 Earnings Report 5 Opportunities enabled by PennyMac Loan Services’ operational platform and seller/servicer approvals Returns highly dependent on the ability to recapture borrowers who refinance Transactions would be structured in a manner so that investments qualify as REIT assets Agency MSRs Are Attractive Potential Investments for PMT 16% 20% 25% 0% 14.6% 11.0% 5.6% 10% 17.7% 14.5% 9.8% 20% 21.0% 18.5% 14.8% Unlevered Return Return on Equity assuming 1.0x leverage Life(1) CPR Recapture 16% 20% 25% 0% 24.0% 17.0% 6.2% 10% 30.6% 24.5% 15.1% 20% 38.0% 33.3% 25.7% Life(1) CPR Recapture Year 1 CPR is modeled to be 20%, 25%, and 30%, respectively. |

|
|
Financial Results |

|
|
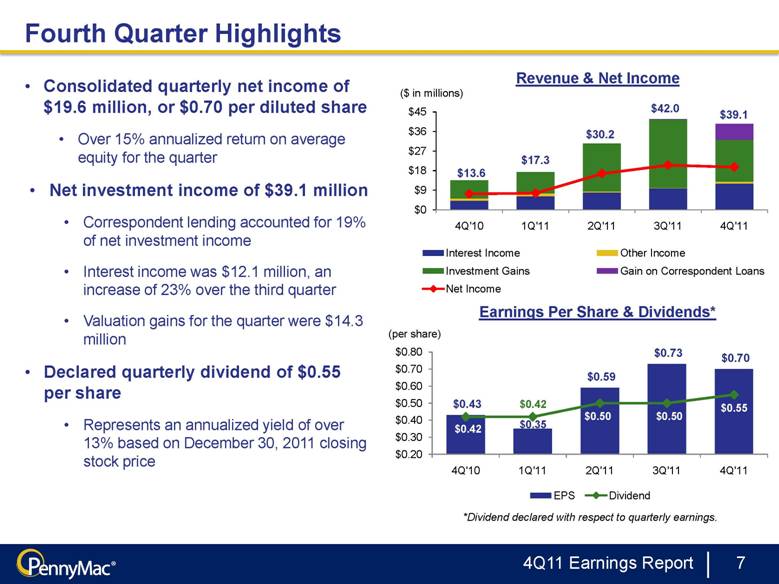
4Q11 Earnings Report 7 Consolidated quarterly net income of $19.6 million, or $0.70 per diluted share Over 15% annualized return on average equity for the quarter Net investment income of $39.1 million Correspondent lending accounted for 19% of net investment income Interest income was $12.1 million, an increase of 23% over the third quarter Valuation gains for the quarter were $14.3 million Declared quarterly dividend of $0.55 per share Represents an annualized yield of over 13% based on December 30, 2011 closing stock price Fourth Quarter Highlights Revenue & Net Income Earnings Per Share & Dividends* *Dividend declared with respect to quarterly earnings. $17.3 $30.2 $42.0 $39.1 $13.6 |
|
|
4Q11 Earnings Report 8 Valuation Changes for the Fourth Quarter Changes reflected in loans’ carrying values: Valuation Changes Performing loans $4,082 Nonperforming loans 10,240 $14,322 Payoffs 5,539 $19,861 Valuation changes for the fourth quarter totaled $14.3 million Gains resulting from payoffs totaled $5.5 million for the quarter Valuation increases have led to very little changes from REO disposition over the year REO sales were $17 million in Q4 and $64 million for all of 2011 Total valuation adjustments of REO at sale were 1.7% of proceeds, or an increase of $1.1 million REO Proceeds and Valuation Changes |

|
|
4Q11 Earnings Report 9 Correspondent Lending is a Growing Portion of PMT’s Earnings Pre-tax income in Q4 2011: $21.3 million Investment Activities: $13.9 million Correspondent Activities: $7.4 million PMT Correspondent Investment consolidated lending activities Revenues: External Net gain on investments 19,155 $ 19,155 $ Interest income 12,136 1,598 10,538 Other 406 839 (433) Net gain on mortgage loans acquired for sale 7,426 7,426 - Total revenues 39,123 $ 9,863 $ 29,260 $ Expenses: Interest 6,473 905 5,568 Other 11,321 1,558 9,763 Total expenses 17,794 $ 2,463 $ 15,331 $ Pre-tax income 21,329 $ 7,400 $ 13,929 $ Total assets at period end 1,386,062 $ 237,382 $ 1,148,680 $ |

|
|
4Q11 Earnings Report 10 Full Year 2011 Highlights Mortgage Assets $726 $808 $1,066 $1,234 Earned consolidated net income of $64.4 million, or $2.41 per diluted share Over 15% return on average equity for 2011 Net investment income: $129 million Continued progress in building correspondent lending business Funded over $500 million in December with a target to fund over $1 billion per month by the end of 2012 Continued consistent and disciplined growth of assets Assets have grown 135% since Q4’10 Correspondent loans held for sale comprised 19% of mortgage assets as of 12/31/11 Net Income and Return on Average Equity(1) ($ in millions) (1)Return on equity calculated using average monthly equity values |

|
|
Correspondent Lending |

|
|
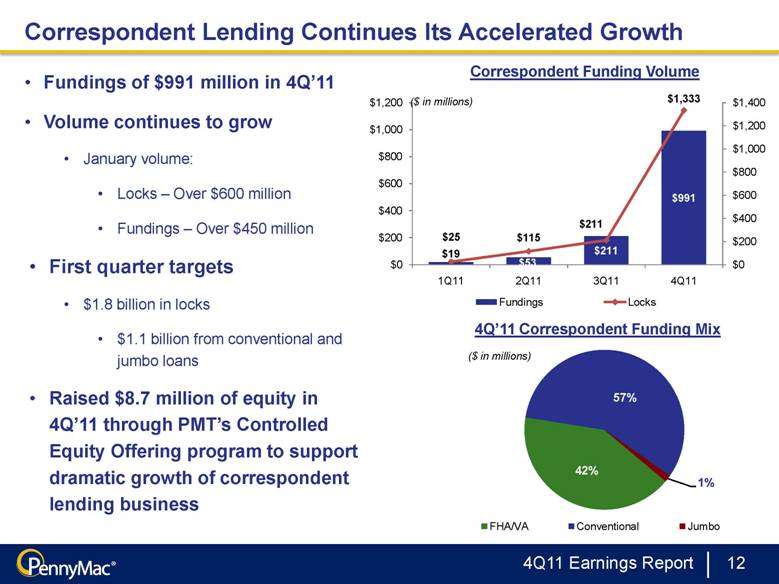
4Q11 Earnings Report 12 Correspondent Lending Continues Its Accelerated Growth Fundings of $991 million in 4Q’11 Volume continues to grow January volume: Locks – Over $600 million Fundings – Over $450 million First quarter targets $1.8 billion in locks $1.1 billion from conventional and jumbo loans Raised $8.7 million of equity in 4Q’11 through PMT’s Controlled Equity Offering program to support dramatic growth of correspondent lending business Correspondent Funding Volume 4Q’11 Correspondent Funding Mix ($ in millions) ($ in millions) |
|
|
4Q11 Earnings Report 13 Correspondent Lending Operations Conventional & Jumbo Fundings Q4 Locks $30mm $697mm $581 million in conventional and jumbo funding Fourth quarter locks of $727 million Conventional: $697 million Jumbo: $30 million Correspondent fundings are high quality prime product Correspondent Lending Group growing with volume Approved 34 new lenders in the fourth quarter, bringing total correspondent partners to 108 Q4’11 Conventional & Jumbo Funding Characteristics 4Q’11 Avg. Jumbo Loan Amount $1,006,169 Avg. Conventional Loan Amount $262,030 WA CLTV 69.2% WA FICO 772 % FICO < 680 1.6% WA DTI 32.0 |

|
|
Distressed Mortgage Investment |

|
|
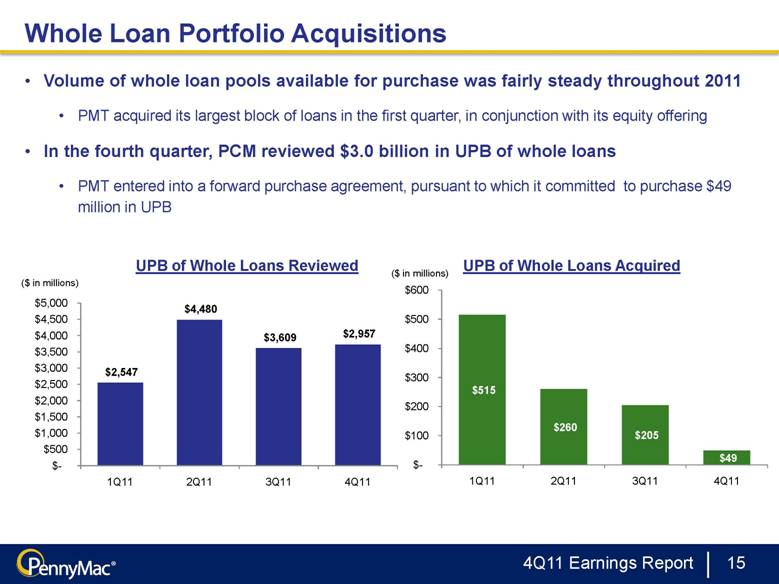
4Q11 Earnings Report 15 Whole Loan Portfolio Acquisitions Volume of whole loan pools available for purchase was fairly steady throughout 2011 PMT acquired its largest block of loans in the first quarter, in conjunction with its equity offering In the fourth quarter, PCM reviewed $3.0 billion in UPB of whole loans PMT entered into a forward purchase agreement, pursuant to which it committed to purchase $49 million in UPB UPB of Whole Loans Reviewed UPB of Whole Loans Acquired ($ in millions) ($ in millions) |
|
|
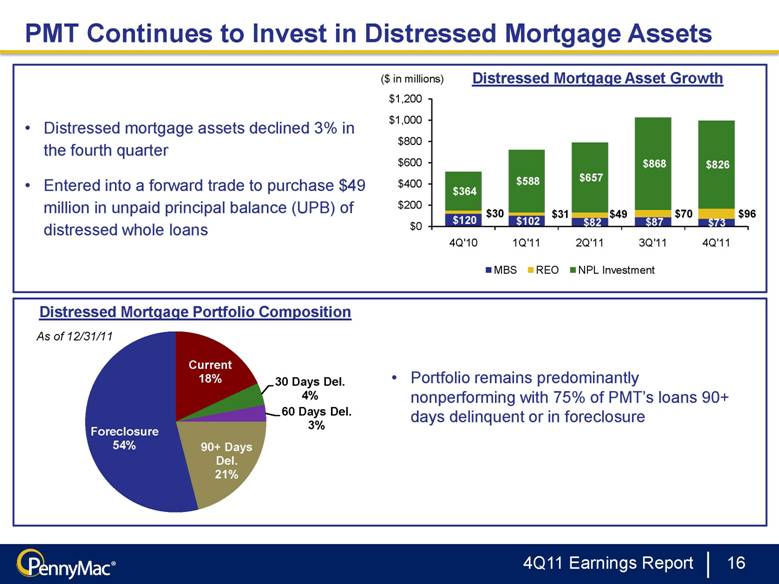
4Q11 Earnings Report 16 PMT Continues to Invest in Distressed Mortgage Assets Distressed mortgage assets declined 3% in the fourth quarter Entered into a forward trade to purchase $49 million in unpaid principal balance (UPB) of distressed whole loans Portfolio remains predominantly nonperforming with 75% of PMT’s loans 90+ days delinquent or in foreclosure Distressed Mortgage Asset Growth Distressed Mortgage Portfolio Composition As of 12/31/11 |
|
|
4Q11 Earnings Report 17 Liquidation Activity for the Quarter Was Strong Liquidation activity was again strong for Q4, led by short sales and REO sales REO sales increased 27% in Q4 Short sale liquidations decreased slightly from the record $52.8 million in Q3 to $48.7 million in Q4 Full payoffs and refinances totaled $4.8 million in UPB, compared to $6.8 million in Q3 90% of PMT’s NPL portfolio had an active resolution path as of the end of the fourth quarter Q4 Liquidation Activity (UPB)(1) Current Pipeline of Nonperforming Loans(1) Excludes subserviced portfolio. ($ in thousands) As of 12/31/11 |

|
|
4Q11 Earnings Report 18 Acquisitions Are Progressing Through the Resolution Process *Ratio of unpaid principal balance remaining to unpaid principal balance at acquisition Purchase Q4 2011 Purchase Q4 2011 Purchase Q4 2011 Balance (M) 515.1 439.1 Balance (M) 259.8 237.8 Balance (M) 542.6 481.8 Pool Factor* 1.00 0.85 Pool Factor* 1.00 0.92 Pool Factor* 1.00 0.89 Current 2.0% 12.1% Current 11.5% 14.7% Current 0.6% 2.6% 30 1.9% 3.7% 30 6.5% 4.7% 30 1.3% 1.7% 60 3.9% 2.0% 60 5.2% 4.2% 60 2.0% 1.3% 90+ 25.9% 18.2% 90+ 31.2% 24.5% 90+ 22.6% 17.4% FC 66.3% 51.1% FC 43.9% 43.5% FC 73.0% 64.2% REO 0.0% 12.8% REO 1.7% 8.3% REO 0.4% 12.7% Q1 2011 Q2 2011 Q3 2011 Q1 2010 Q2 2010 Q3 2010 Q4 2010 Purchase Q4 2011 Purchase Q4 2011 Purchase Q4 2011 Purchase Q4 2011 Balance (M) 182.7 96.0 Balance (M) 195.5 103.7 Balance (M) 146.2 82.5 Balance (M) 277.8 209.5 Pool Factor* 1.00 0.53 Pool Factor* 1.00 0.53 Pool Factor* 1.00 0.56 Pool Factor* 1.00 0.75 Current 6.2% 26.3% Current 5.1% 19.9% Current 1.2% 21.9% Current 5.0% 24.7% 30 1.6% 5.0% 30 2.0% 5.4% 30 0.4% 4.4% 30 4.0% 4.6% 60 5.8% 3.6% 60 4.1% 2.8% 60 1.3% 1.8% 60 5.1% 2.9% 90+ 37.8% 14.1% 90+ 42.8% 11.7% 90+ 38.2% 12.2% 90+ 26.8% 9.8% FC 46.4% 38.5% FC 45.9% 43.1% FC 58.9% 43.7% FC 59.1% 46.9% REO 2.3% 12.4% REO 0.0% 17.0% REO 0.0% 16.0% REO 0.0% 11.1% |

|
|
4Q11 Earnings Report 19 Continue to Progress REO Inventory Through to Liquidation $14.4 million in carrying value of REO was liquidated in Q4, compared to $13.8 million in Q3 $6.7 million of 4Q’11 liquidations had been in REO inventory for 120+ days As of 12/31/11, 54% of REO inventory was aged three months or more, compared to 49% at the end of Q3 *Average days in inventory is value weighted Number of Days in REO Inventory Carrying Value 9/30 ($ in millions) Cumulative % of Total % Liquidated in Q4 Carrying Value 12/31 ($ in millions) Cumulative % of Total 180+ $8.0 11% 34% $22.9 24% 150-179 $6.1 20% 38% $4.3 28% 120-149 $6.9 30% 23% $14.1 43% 90-119 $13.5 49% 24% $10.4 54% 60-89 $6.6 59% 31% $16.9 71% 30-59 $15.0 80% 9% $16.5 89% 0-29 $13.9 100% 8% $10.9 100% Total $69.9 21% $96.0 Average Days in Inventory* 101 days 130 days |

|
|
Financial Statements |

|
|
4Q11 Earnings Report 21 Income Statement PENNYMAC MORTGAGE INVESTMENT TRUST AND SUBSIDIARIES CONSOLIDATED STATEMENTS OF INCOME (Unaudited) (In thousands, except per share data) December 31, 2011 Quarter ended Year ended Investment Income Net gain (loss) on investments: Mortgage - backed securities $(706) $(2,812) Mortgage loans 19,861 85,455 19,155 82,643 Interest income: Short - term investments 18 100 Mortgage - backed securities 510 3,229 Mortgage loans 11,608 32,819 12,136 36,148 Net gain on mortgage loans acquired for sale 7,426 7,633 Results of real estate acquired in settlement of loans (448) 1,079 Net servicing fee income 3 20 Other income 851 1,091 Net investment income 39,123 128,614 Expenses Interest 6,473 16,946 Loan servicing fees 4,194 14,186 Mana gement fees 990 6,740 Compensation 1,330 5,161 Professional services 786 4,434 Other 4,021 8,652 Total expenses 17,794 56,119 Income before provision for income taxes 21,329 72,495 Provision for income taxes 1,680 8,056 Net income $19,649 $64,439 Earnings per share Basic $0.70 $2.41 Diluted $0.70 $2.41 Weighted - average shares outstanding Basic 27,941 26,396 Diluted 28,233 26,679 |

|
|
4Q11 Earnings Report 22 Balance Sheet PENNYMAC MORTGAGE INVESTMENT TRUST AND SUBSIDIARIES CONSOLIDATED BALANCE SHEETS (Unaudited) (In thousands, except share data) December 31, 2011 December 31, 2010 Cash $14,589 $45,447 Short - term investments 30,319 — United States Treasury security 50,000 — Mortgage - backed securities at fair value 72,813 119,872 Mortgage loans acquired for sale at fair value 233,954 3,966 Mortgage loans at fair value 696,266 364,250 Mortgage loans under forward purchase agreements at fair value 129,310 — Real estate acquired in settlement of loans 73,882 29,685 Real estate acquired in settlement of loans under forward purchase agreements 22,138 — Mortgage servicing rights: at fair value 645 — at lower of amortized cost or fair value 5,386 — Principal and interest collections receivable 8,664 8,249 Principal and interest collections receivable under forward purchase agreements 5,299 — Interest receivable 2,099 978 Due from affiliates 347 2,115 Other assets 40,351 14,533 Total assets $1,386,062 $589,095 LIABILITIES Accounts payable and accrued liabilities $9,198 $9,080 Assets sold under agreements to repurchase: Securities 115,493 101,202 Mortgage loans acquired for sale at fair value 212,677 2,494 Mortgage loans at fair value 304,266 144,928 Real estate acquired in settlement of loans 27,494 Borrowings under forward purchase agreements 152,427 — Contingent underwriting fees payable 5,883 5,883 Payable to affiliates 12,166 5,595 Income tax payable 441 — Total liabilities 840,045 269,182 Commitments and contingencies SHAREHOLDERS’ EQUITY Common shares of beneficial interest — authorized, 500,000,000 shares of $0.01 par value; issued and outstanding, 28,404,554 and 16,832,343 shares, respectively 284 168 Additional paid - in capital 518,272 317,175 Retained earnings 27,461 2,570 Total shareholders’ equity 546,017 319,913 Total liabilities and shareholders’ equity $1,386,062 $589,095 |

|
|
4Q11 Earnings Report 23 For questions or comments please contact us at: PennyMac Mortgage Investment Trust 6101 Condor Drive Moorpark, CA 93021 Primary IR contact: Kevin Chamberlain Managing Director, Corporate Communications Phone: 818-224-7442 Email: InvestorRelations@pnmac.com Website: www.PennyMacMortgageInvestmentTrust.com Contact Us |

|
|
PennyMac Mortgage Investment Trust February 8, 2012 Fourth Quarter 2011 Earnings Report |