Attached files
| file | filename |
|---|---|
| 8-K - Silicon Graphics International Corp | q22012earningsrelease8-k.htm |
| EX-99.1 - Q2 EARNINGS RELEASE - Silicon Graphics International Corp | q2earningsreleaseexhibit991.htm |
Earning Slides for Q2 FY12 NASDAQ: SGI February 7, 2012
©2012 SGI Legal Notice Cautionary Statement Regarding Forward Looking Statements This presentation contains forward-looking statements, including statements regarding management’s expectations about the markets, business, products, operating plans and financial performance of Silicon Graphics International Corp. (“SGI”) as of February 7, 2012. Statements containing words such as “will,” “expect,” “believe,” and “intend,” and other statements in the future tense, are forward-looking statements. Any statements contained in this presentation that are not statements of historical fact may be deemed forward-looking statements. Actual outcomes and results may differ materially from the expectations expressed or implied in these statements due to a number of risks and uncertainties, including but not limited to SGI’s international operations; changes in demand for SGI products; economic conditions impacting the purchasing decisions of SGI’s customers; the very competitive market in which SGI operates that may cause pricing pressure on SGI’s solutions, negatively affecting SGI’s gross and operating margins; customer concentration risks; SGI’s increased reliance on sales to U.S. government entities which is subject to the government’s budgetary constraints; SGI’s inability to control the supply, timing of delivery and pricing of essential product components; and significant excess or obsolete inventory that SGI may be required to write off in the future. Detailed information about these and other risks and uncertainties that could affect SGI’s business, financial condition and results of operations is set forth in SGI’s Annual Report on Form 10-K under the caption "Risk Factors," which was filed with the Securities and Exchange Commission (“SEC”) on August 29, 2011, as updated by SGI’s subsequent filings with the SEC, all of which are available at the SEC's web site at http://www.sec.gov. Accordingly, you are cautioned not to place undue reliance on forward-looking statements, which speak only as of the date of this announcement. SGI undertakes no responsibility to update the information in this presentation, except as may be required by law. The SGI logos and SGI product names used or referenced herein are either registered trademarks or trademarks of Silicon Graphics International Corp. or one of its subsidiaries. All other trademarks, trade names, service marks and logos referenced herein belong to their respective holders. Any and all copyright or other proprietary notices that appear herein, together with this Legal Notice, must be retained on this presentation. Non-GAAP Reconciliation All non-GAAP financial measures contained in this presentation are reconciled to GAAP on slide 18 of this presentation. 2
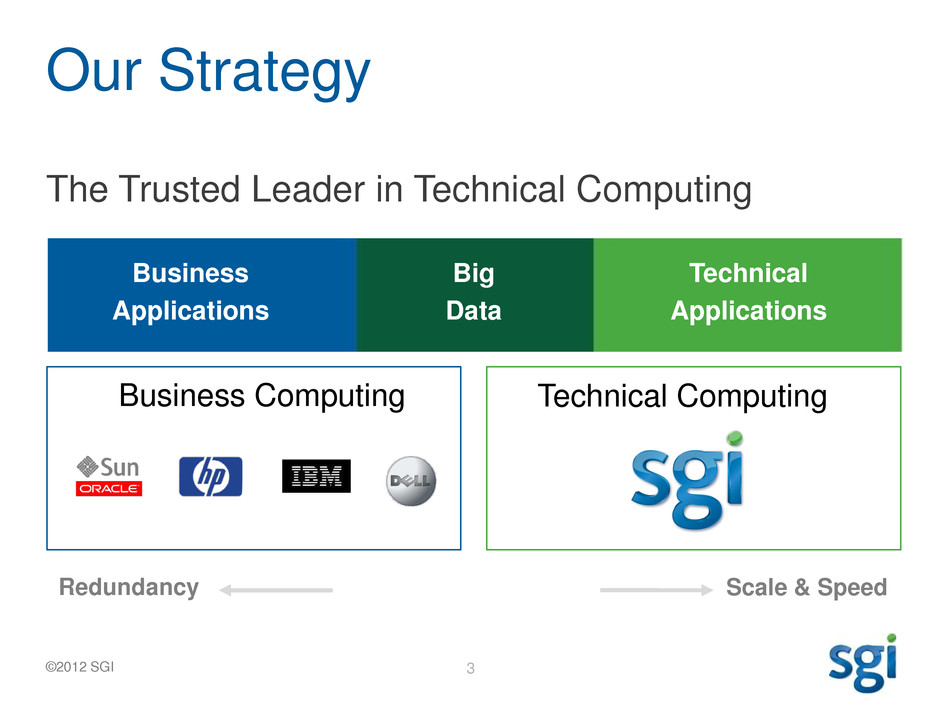
©2012 SGI Our Strategy The Trusted Leader in Technical Computing Business Computing Business Applications Technical Computing Workload Optimized Big Data Technical Applications Redundancy Scale & Speed 3
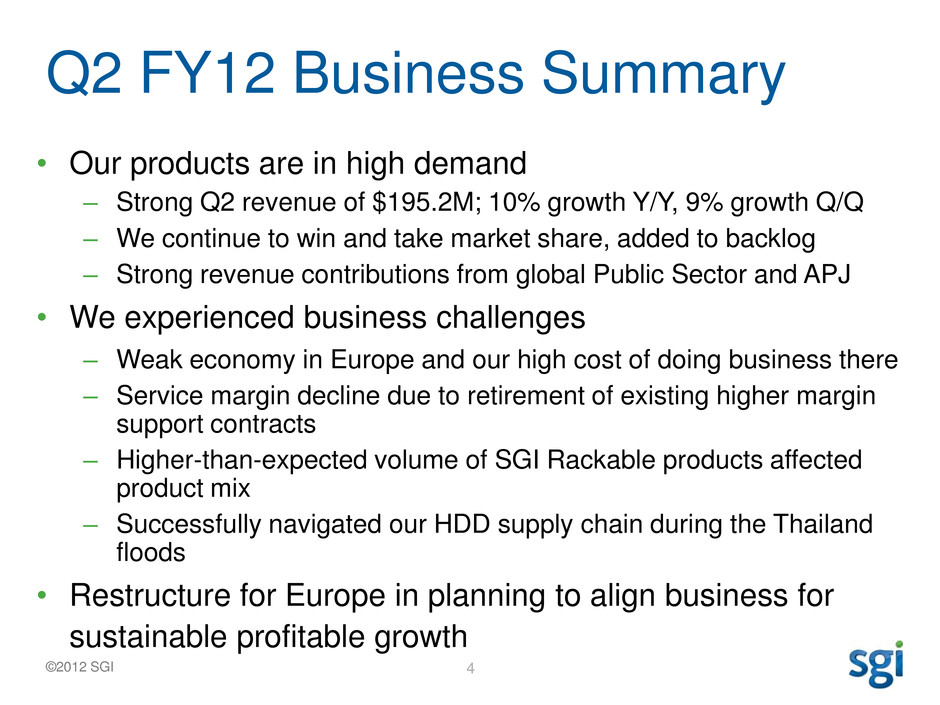
©2012 SGI Q2 FY12 Business Summary • Our products are in high demand – Strong Q2 revenue of $195.2M; 10% growth Y/Y, 9% growth Q/Q – We continue to win and take market share, added to backlog – Strong revenue contributions from global Public Sector and APJ • We experienced business challenges – Weak economy in Europe and our high cost of doing business there – Service margin decline due to retirement of existing higher margin support contracts – Higher-than-expected volume of SGI Rackable products affected product mix – Successfully navigated our HDD supply chain during the Thailand floods • Restructure for Europe in planning to align business for sustainable profitable growth 4
©2012 SGI Q2 FY12 Customer Highlights Americas EMEA APJ 5
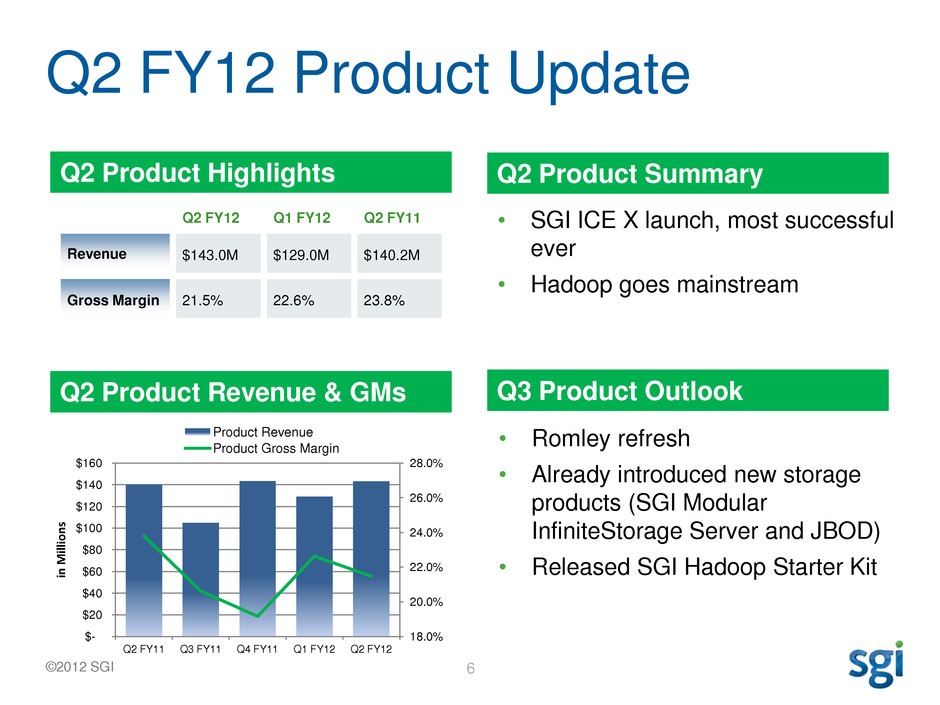
©2012 SGI Q2 FY12 Product Update Q2 Product Highlights Q2 Product Revenue & GMs • SGI ICE X launch, most successful ever • Hadoop goes mainstream • Romley refresh • Already introduced new storage products (SGI Modular InfiniteStorage Server and JBOD) • Released SGI Hadoop Starter Kit Q2 Product Summary Q3 Product Outlook 6 18.0% 20.0% 22.0% 24.0% 26.0% 28.0% $- $20 $40 $60 $80 $100 $120 $140 $160 Q2 FY11 Q3 FY11 Q4 FY11 Q1 FY12 Q2 FY12 in M ill io n s Product Revenue Product Gross Margin Q2 FY12 Q1 FY12 Q2 FY11 Revenue $143.0M $129.0M $140.2M Gross Margin 21.5% 22.6% 23.8%
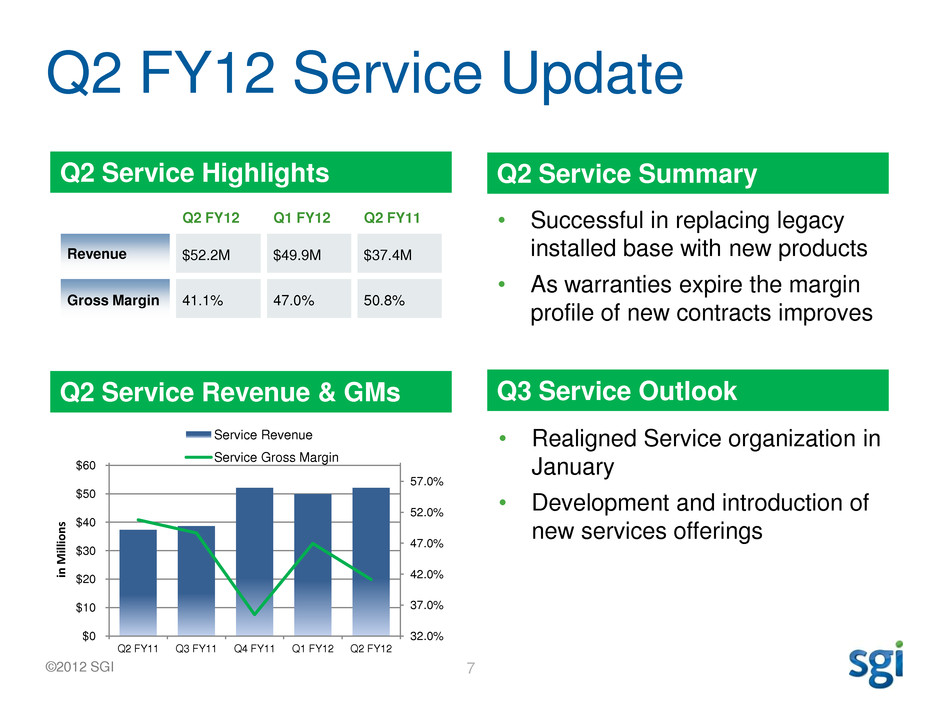
©2012 SGI Q2 FY12 Service Update Q2 Service Highlights Q2 Service Revenue & GMs • Successful in replacing legacy installed base with new products • As warranties expire the margin profile of new contracts improves • Realigned Service organization in January • Development and introduction of new services offerings Q2 Service Summary Q3 Service Outlook 7 Q2 FY12 Q1 FY12 Q2 FY11 Revenue $52.2M $49.9M $37.4M Gross Margin 41.1% 47.0% 50.8% 32.0% 37.0% 42.0% 47.0% 52.0% 57.0% $0 $10 $20 $30 $40 $50 $60 Q2 FY11 Q3 FY11 Q4 FY11 Q1 FY12 Q2 FY12 in M ill io n s Service Revenue Service Gross Margin
Financial Update Q2FY12
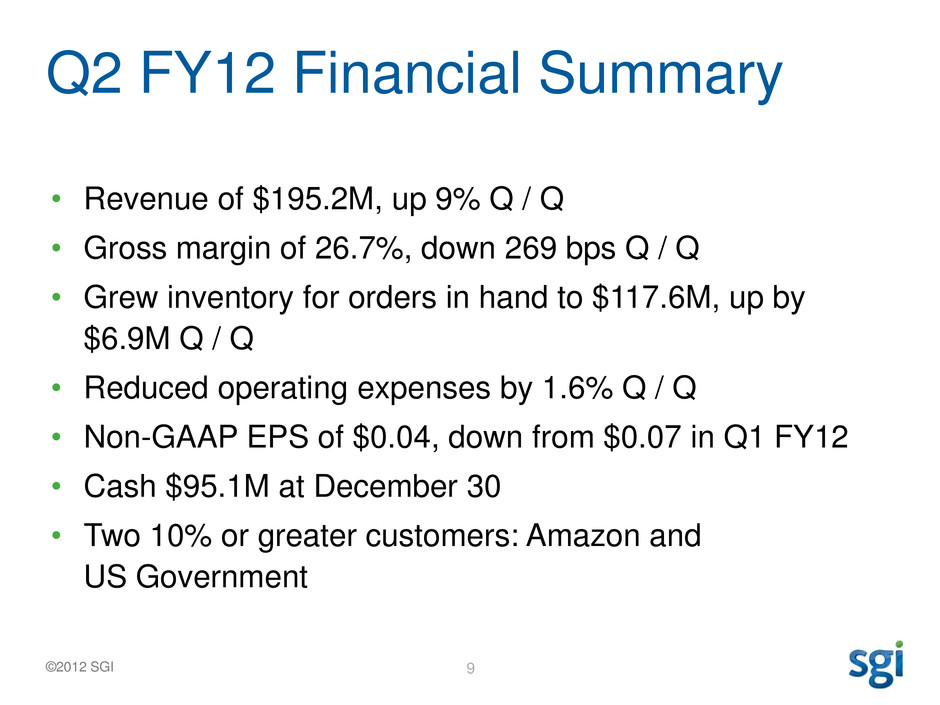
©2012 SGI Q2 FY12 Financial Summary • Revenue of $195.2M, up 9% Q / Q • Gross margin of 26.7%, down 269 bps Q / Q • Grew inventory for orders in hand to $117.6M, up by $6.9M Q / Q • Reduced operating expenses by 1.6% Q / Q • Non-GAAP EPS of $0.04, down from $0.07 in Q1 FY12 • Cash $95.1M at December 30 • Two 10% or greater customers: Amazon and US Government 9
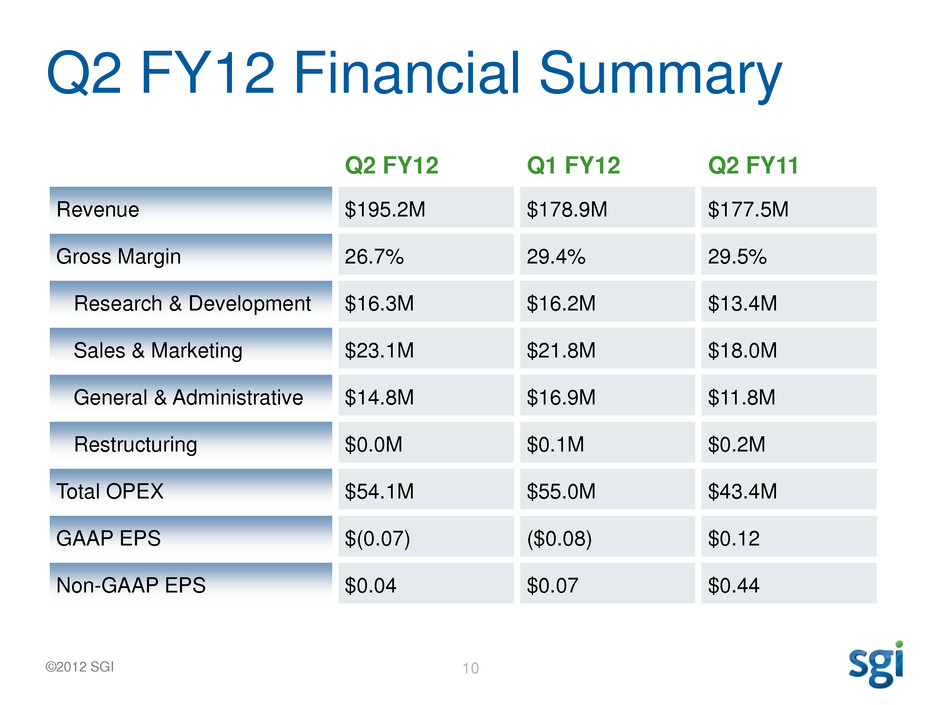
©2012 SGI Q2 FY12 Financial Summary Q2 FY12 Q1 FY12 Q2 FY11 Revenue $195.2M $178.9M $177.5M Gross Margin 26.7% 29.4% 29.5% Research & Development $16.3M $16.2M $13.4M Sales & Marketing $23.1M $21.8M $18.0M General & Administrative $14.8M $16.9M $11.8M Restructuring $0.0M $0.1M $0.2M Total OPEX $54.1M $55.0M $43.4M GAAP EPS $(0.07) ($0.08) $0.12 Non-GAAP EPS $0.04 $0.07 $0.44 10
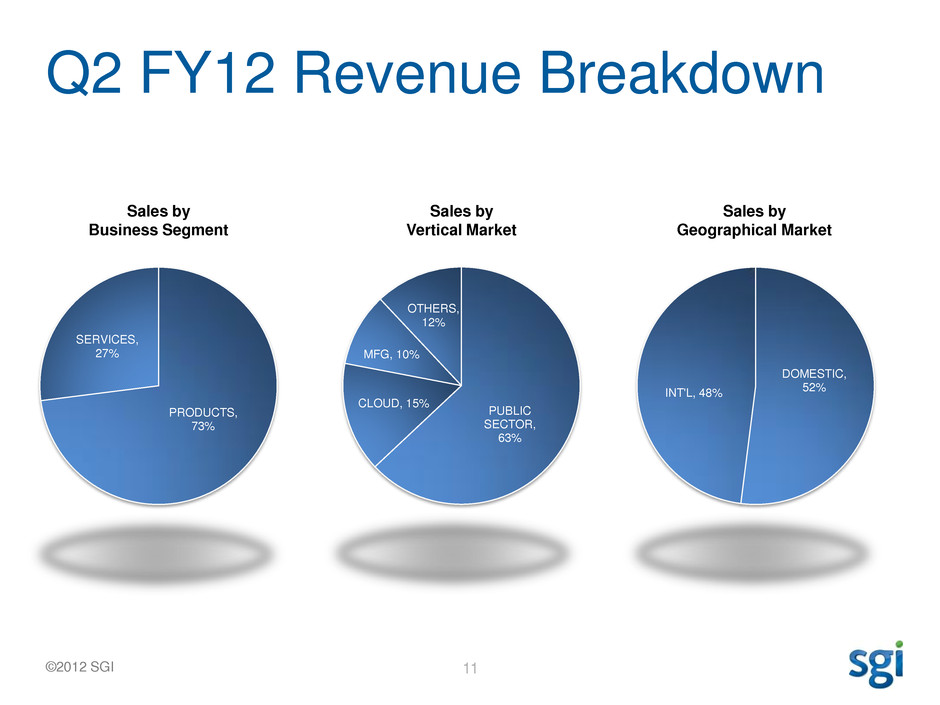
©2012 SGI Q2 FY12 Revenue Breakdown 11 PUBLIC SECTOR, 63% CLOUD, 15% MFG, 10% OTHERS, 12% , 0 Sales by Vertical Market Sales by Geographical Market Sales by Business Segment DOMESTIC, 52% INT'L, 48% PRODUCTS, 73% SERVICES, 27% , 0
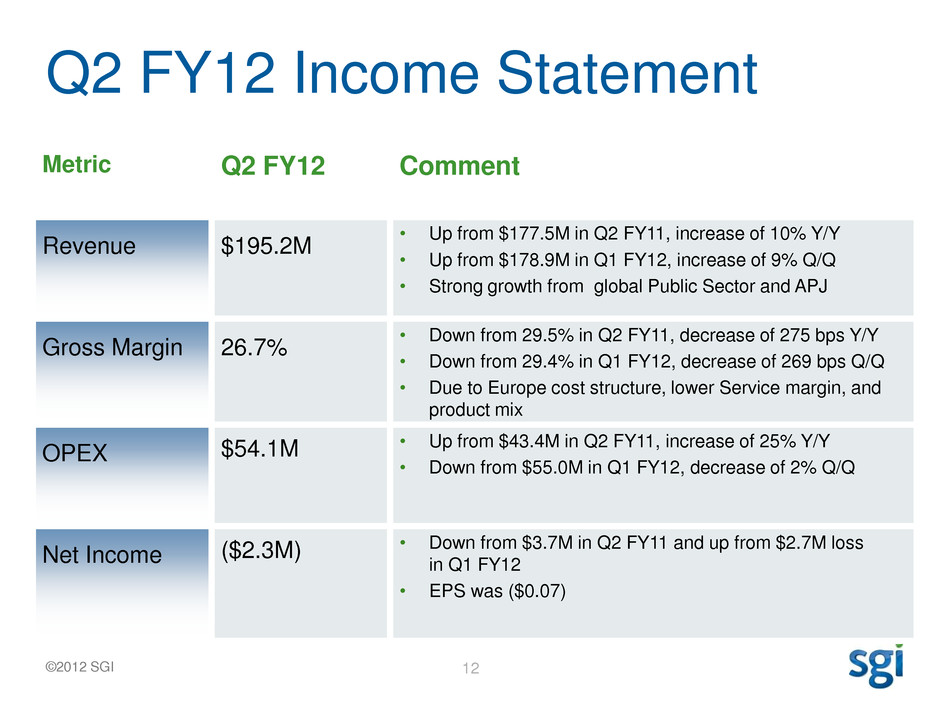
©2012 SGI Q2 FY12 Income Statement 12 Metric Q2 FY12 Comment Revenue $195.2M • Up from $177.5M in Q2 FY11, increase of 10% Y/Y • Up from $178.9M in Q1 FY12, increase of 9% Q/Q • Strong growth from global Public Sector and APJ Gross Margin 26.7% • Down from 29.5% in Q2 FY11, decrease of 275 bps Y/Y • Down from 29.4% in Q1 FY12, decrease of 269 bps Q/Q • Due to Europe cost structure, lower Service margin, and product mix OPEX $54.1M • Up from $43.4M in Q2 FY11, increase of 25% Y/Y • Down from $55.0M in Q1 FY12, decrease of 2% Q/Q Net Income ($2.3M) • Down from $3.7M in Q2 FY11 and up from $2.7M loss in Q1 FY12 • EPS was ($0.07)
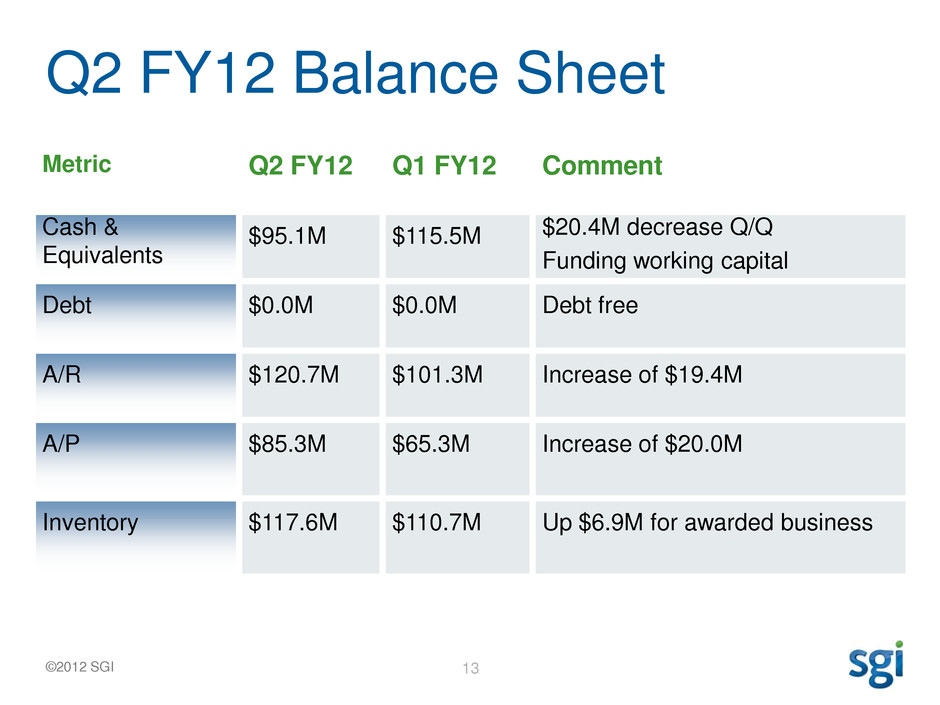
©2012 SGI Q2 FY12 Balance Sheet 13 Metric Q2 FY12 Q1 FY12 Comment Cash & Equivalents $95.1M $115.5M $20.4M decrease Q/Q Funding working capital Debt $0.0M $0.0M Debt free A/R $120.7M $101.3M Increase of $19.4M A/P $85.3M $65.3M Increase of $20.0M Inventory $117.6M $110.7M Up $6.9M for awarded business
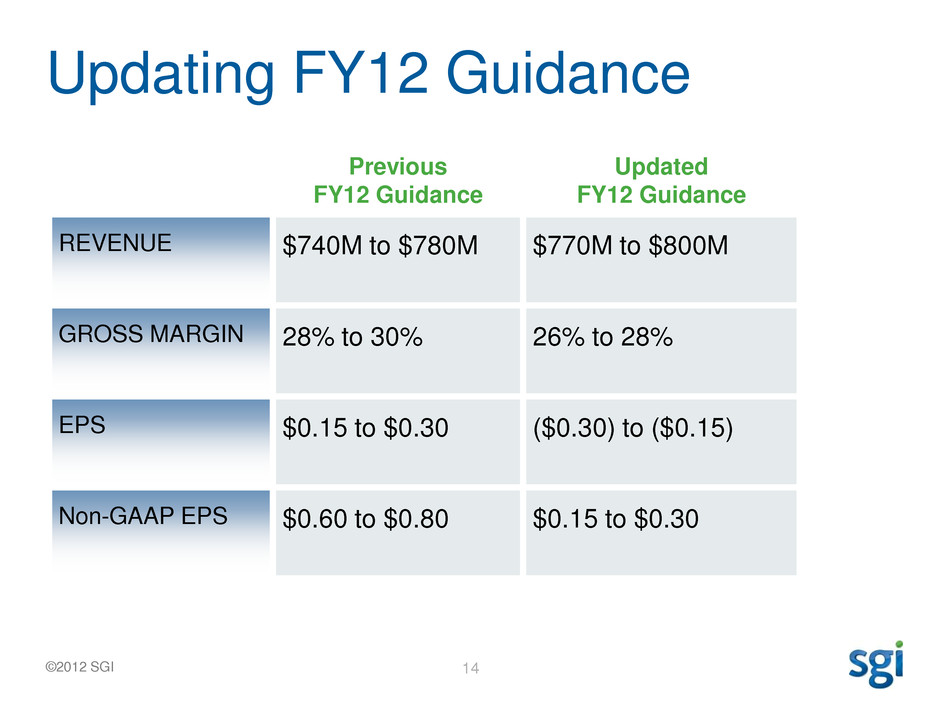
©2012 SGI Updating FY12 Guidance 14 Previous FY12 Guidance Updated FY12 Guidance REVENUE $740M to $780M $770M to $800M GROSS MARGIN 28% to 30% 26% to 28% EPS $0.15 to $0.30 ($0.30) to ($0.15) Non-GAAP EPS $0.60 to $0.80 $0.15 to $0.30
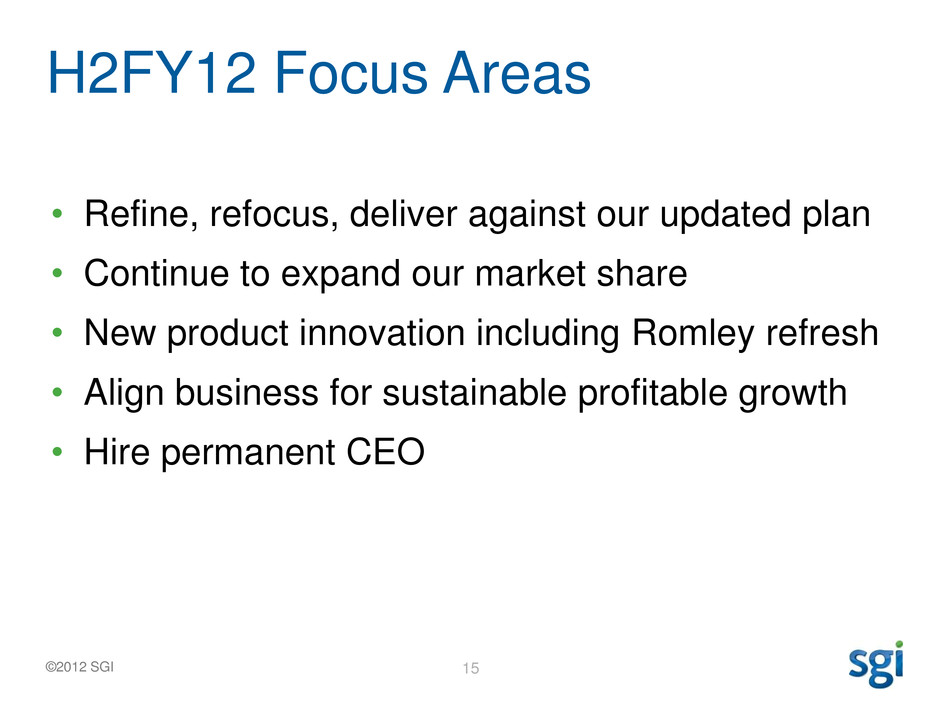
©2012 SGI H2FY12 Focus Areas • Refine, refocus, deliver against our updated plan • Continue to expand our market share • New product innovation including Romley refresh • Align business for sustainable profitable growth • Hire permanent CEO 15
Appendix
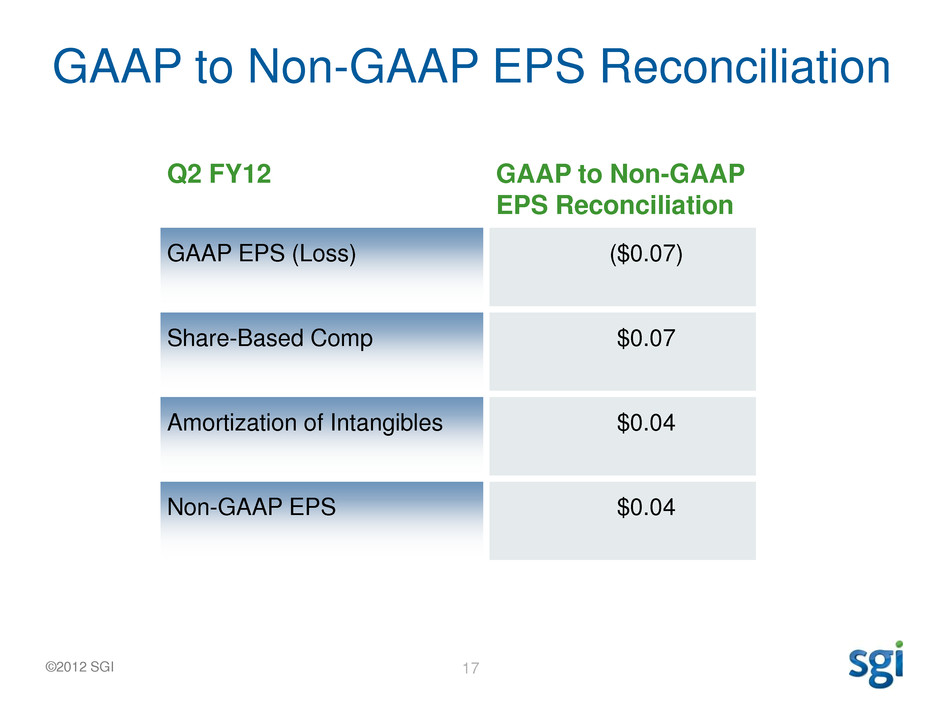
©2012 SGI GAAP to Non-GAAP EPS Reconciliation 17 Q2 FY12 GAAP to Non-GAAP EPS Reconciliation GAAP EPS (Loss) ($0.07) Share-Based Comp $0.07 Amortization of Intangibles $0.04 Non-GAAP EPS $0.04
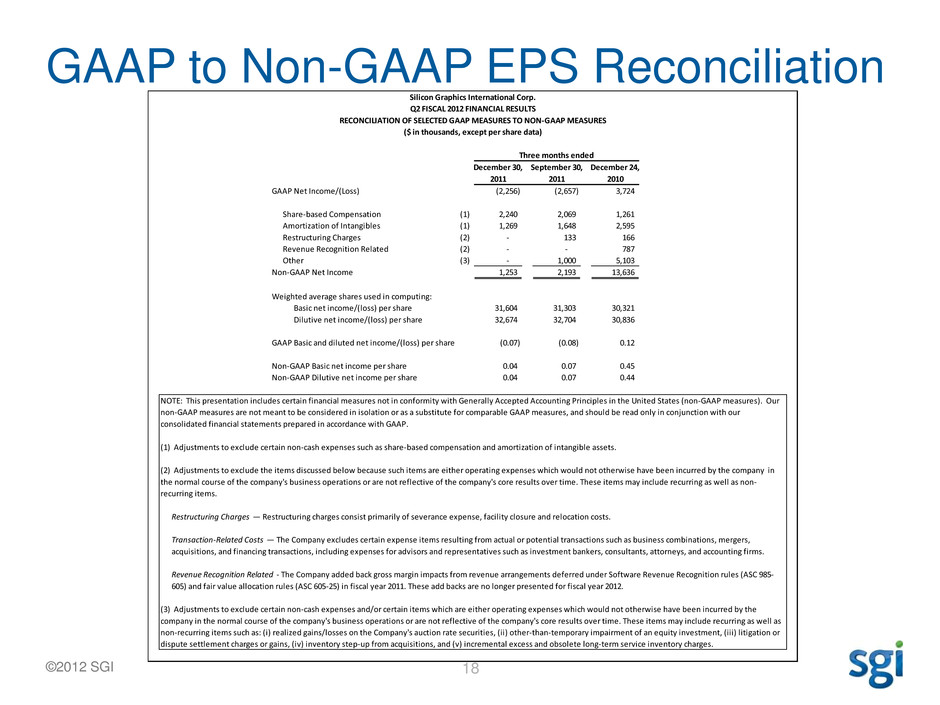
©2012 SGI GAAP to Non-GAAP EPS Reconciliation 18 December 30, September 30, December 24, 2011 2011 2010 GAAP Net Income/(Loss) (2,256) (2,657) 3,724 Share-based Compensation (1) 2,240 2,069 1,261 Amortization of Intangibles (1) 1,269 1,648 2,595 Restructuring Charges (2) - 133 166 Revenue Recognition Related (2) - - 787 Other (3) - 1,000 5,103 Non-GAAP Net Income 1,253 2,193 13,636 Weighted average shares used in computing: Basic net income/(loss) per share 31,604 31,303 30,321 Dilutive net income/(loss) per share 32,674 32,704 30,836 GAAP Basic and diluted net income/(loss) per share (0.07) (0.08) 0.12 Non-GAAP Basic net income per share 0.04 0.07 0.45 Non-GAAP Dilutive net income per share 0.04 0.07 0.44 Restructuring Charges — Restructuring charges consist primarily of severance expense, facility closure and relocation costs. (3) Adjustments to exclude certain non-cash expenses and/or certain items which are either operating expenses which would not otherwise have been incurred by the company in the normal course of the company's business operations or are not reflective of the company's core results over time. These items may include recurring as well as non-recurring items such as: (i) realized gains/losses on the Company's auction rate securities, (ii) other-than-temporary impairment of an equity investment, (iii) litigation or dispute settlement charges or gains, (iv) inventory step-up from acquisitions, and (v) incremental excess and obsolete long-term service inventory charges. Silicon Graphics International Corp. Q2 FISCAL 2012 FINANCIAL RESULTS RECONCILIATION OF SELECTED GAAP MEASURES TO NON-GAAP MEASURES ($ in thousands, except per share data) Three months ended NOTE: This presentation includes certain financial measures not in conformity with Generally Accepted Accounting Principles in the United States (non-GAAP measures). Our non-GAAP measures are not meant to be considered in isolation or as a substitute for comparable GAAP measures, and should be read only in conjunction with our consolidated financial statements prepared in accordance with GAAP. (1) Adjustments to exclude certain non-cash expenses such as share-based compensation and amortization of intangible assets. (2) Adjustments to exclude the items discussed below because such items are either operating expenses which would not otherwise have been incurred by the company in the normal course of the company's business operations or are not reflective of the company's core results over time. These items may include recurring as well as non- recurring items. Transaction-Related Costs — The Company excludes certain expense items resulting from actual or potential transactions such as business combinations, mergers, acquisitions, and financing transactions, including expenses for advisors and representatives such as investment bankers, consultants, attorneys, and accounting firms. Revenue Recognition Related - The Company added back gross margin impacts from revenue arrangements deferred under Software Revenue Recognition rules (ASC 985- 605) and fair value allocation rules (ASC 605-25) in fiscal year 2011. These add backs are no longer presented for fiscal year 2012.
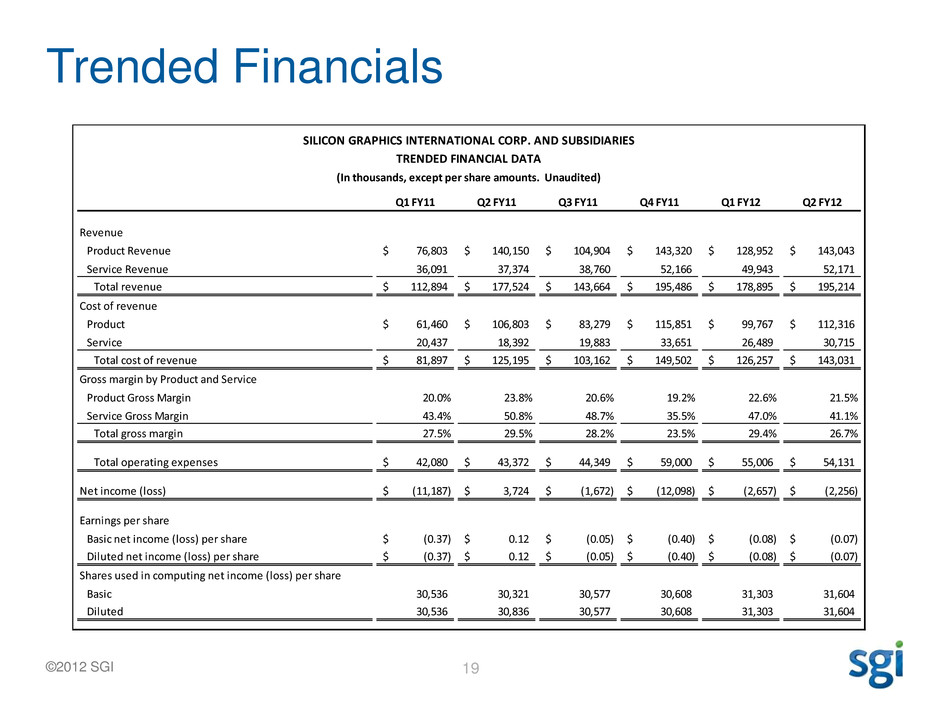
©2012 SGI Trended Financials 19 SILICON GRAPHICS INTERNATIONAL CORP. AND SUBSIDIARIES TRENDED FINANCIAL DATA (In thousands, except per share amounts. Unaudited) Q1 FY11 Q2 FY11 Q3 FY11 Q4 FY11 Q1 FY12 Q2 FY12 Revenue Product Revenue 76,803$ 140,150$ 104,904$ 143,320$ 128,952$ 143,043$ Service Revenue 36,091 37,374 38,760 52,166 49,943 52,171 Total revenue 112,894$ 177,524$ 143,664$ 195,486$ 178,895$ 195,214$ Cost of revenue Product 61,460$ 106,803$ 83,279$ 115,851$ 99,767$ 112,316$ Service 20,437 18,392 19,883 33,651 26,489 30,715 Total cost of revenue 81,897$ 125,195$ 103,162$ 149,502$ 126,257$ 143,031$ Gross margin by Product and Service Product Gross Margin 20.0% 23.8% 20.6% 19.2% 22.6% 21.5% Service Gross Margin 43.4% 50.8% 48.7% 35.5% 47.0% 41.1% Total gross margin 27.5% 29.5% 28.2% 23.5% 29.4% 26.7% Total operating expenses 42,080$ 43,372$ 44,349$ 59,000$ 55,006$ 54,131$ Net income (loss) (11,187)$ 3,724$ (1,672)$ (12,098)$ (2,657)$ (2,256)$ Earnings per share Basic net income (loss) per share (0.37)$ 0.12$ (0.05)$ (0.40)$ (0.08)$ (0.07)$ Diluted net income (loss) per share (0.37)$ 0.12$ (0.05)$ (0.40)$ (0.08)$ (0.07)$ Shares used in computing net income (loss) per share Basic 30,536 30,321 30,577 30,608 31,303 31,604 Diluted 30,536 30,836 30,577 30,608 31,303 31,604
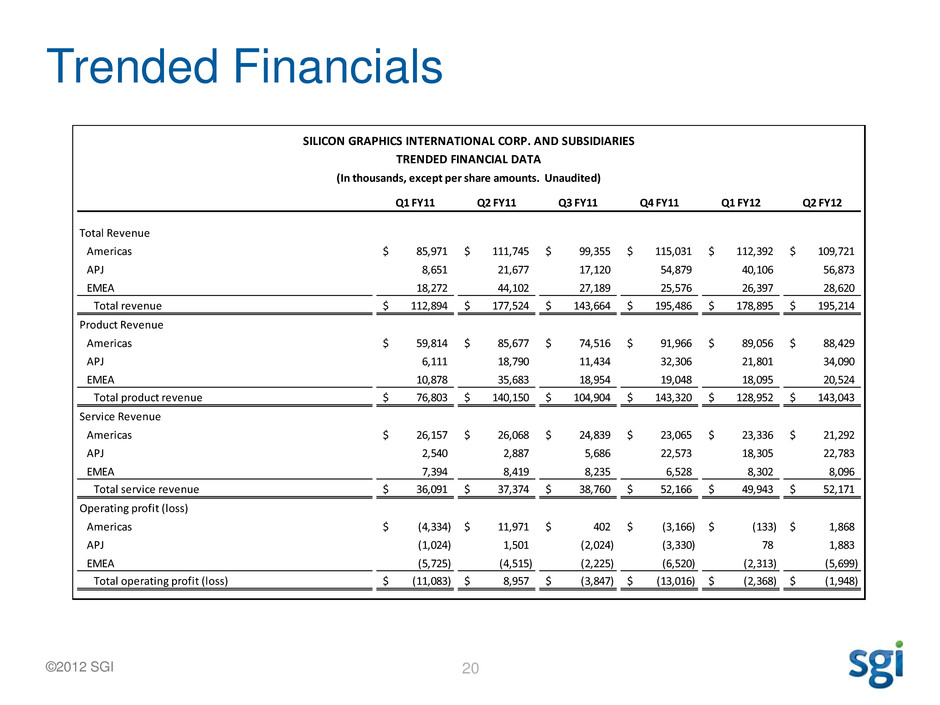
©2012 SGI Trended Financials 20 SILICON GRAPHICS INTERNATIONAL CORP. AND SUBSIDIARIES TRENDED FINANCIAL DATA (In thousands, except per share amounts. Unaudited) Q1 FY11 Q2 FY11 Q3 FY11 Q4 FY11 Q1 FY12 Q2 FY12 Total Revenue Americas 85,971$ 111,745$ 99,355$ 115,031$ 112,392$ 109,721$ APJ 8,651 21,677 17,120 54,879 40,106 56,873 EMEA 18,272 44,102 27,189 25,576 26,397 28,620 Total revenue 112,894$ 177,524$ 143,664$ 195,486$ 178,895$ 195,214$ Product Revenue Americas 59,814$ 85,677$ 74,516$ 91,966$ 89,056$ 88,429$ APJ 6,111 18,790 11,434 32,306 21,801 34,090 EMEA 10,878 35,683 18,954 19,048 18,095 20,524 Total product revenue 76,803$ 140,150$ 104,904$ 143,320$ 128,952$ 143,043$ Service Revenue Americas 26,157$ 26,068$ 24,839$ 23,065$ 23,336$ 21,292$ APJ 2,540 2,887 5,686 22,573 18,305 22,783 EMEA 7,394 8,419 8,235 6,528 8,302 8,096 Total service revenue 36,091$ 37,374$ 38,760$ 52,166$ 49,943$ 52,171$ Operating profit (loss) Americas (4,334)$ 11,971$ 402$ (3,166)$ (133)$ 1,868$ APJ (1,024) 1,501 (2,024) (3,330) 78 1,883 EMEA (5,725) (4,515) (2,225) (6,520) (2,313) (5,699) Total operating profit (loss) (11,083)$ 8,957$ (3,847)$ (13,016)$ (2,368)$ (1,948)$
©2012 SGI 21
