Attached files
| file | filename |
|---|---|
| 8-K - FORM 8-K - GOLUB CAPITAL BDC, Inc. | v301178_8k.htm |

Golub Capital BDC, Inc. Investor Presentation Quarter Ended December 31, 2 0 1 1

Some of the statements in this presentation constitute forward - looking statements, which relate to future events or our future performance or financial condition. The forward - looking statements contained in this presentation involve risks and uncertainties, including statements as to: our future operating results; our business prospects and the prospects of our portfolio companies; the effect of investments that we expect to make; our contractual arrangements and relationships with third parties; actual and potential conflicts of interest with GC Advisors LLC ("GC Advisors") and other affiliates of Golub Capital Incorporated and Golub Capital LLC (collectively, "Golub Capital"); the dependence of our future success on the general economy and its effect on the industries in which we invest; the ability of our portfolio companies to achieve their objectives; the use of borrowed money to finance a portion of our investments; the adequacy of our financing sources and working capital; the timing of cash flows, if any, from the operations of our portfolio companies; the ability of GC Advisors to locate suitable investments for us and to monitor and administer our investments; the ability of GC Advisors or its affiliates to attract and retain highly talented professionals; our ability to qualify and maintain our qualification as a regulated investment company and as a business development company; the impact on our business of the Dodd Frank Wall Street Reform and Consumer Protection Act and the rules and regulations issued thereunder; and the effect of changes to tax legislation and our tax position. Such forward - looking statements may include statements preceded by, followed by or that otherwise include the words “may,” “might,” “will,” “intend,” “should,” “could,” “can,” “would,” “expect,” “believe,” “estimate,” “anticipate,” “predict,” “potential,” “plan” or similar words. We have based the forward - looking statements included in this presentation on information available to us on the date of this presentation, and we assume no obligation to update any such forward - looking statements. Actual results could differ materially from those implied or expressed in our forward - looking statements for any reason, and future results could differ materially from historical performance. Although we undertake no obligation to revise or update any forward - looking statements, whether as a result of new information, future events or otherwise, you are advised to consult any additional disclosures that we may make directly to you or through reports that we have filed or in the future may file with the Securities and Exchange Commission, including annual reports on Form 10 - K, quarterly reports on Form 10 - Q and current reports on Form 8 - K. This presentation contains statistics and other data that has been obtained from or compiled from information made available by third - party service providers. We have not independently verified such statistics or data.

Golub Capital BDC, Inc. Investor Presentation Quarter Ended December 20 1 1 Summary of Quarterly Results First Fiscal Quarter 2012 Highlights ▪ Net investment income for the quarter ended December 31, 2011 was $6.3 million, or $0.29 per share, as compared to $6.5 million, or $0.30 per share, for the quarter ended September 30, 2011. ▪ Net investment income, including net spread payments of $0.7 million from the total return swap (“TRS”), was $0.32 (1) per share for the quarter ended December 31, 2011. ▪ Net increase in net assets resulting from operations for the quarter ended December 31, 2011 was $6.2 million, or $0.28 per share, as compared to $3.0 million, or $0.14 per share, for the quarter ended September 30, 2011. ▪ Net realized and unrealized loss on investments and derivatives of ($0.2) million, or ($0.01) per share, for the quarter ended December 31, 2011 was a result of: ▫ GAAP net realized and unrealized gains on the TRS of $2.1 million, comprised of $1.5 million of unrealized gains primarily driven by a market rally in the prices of broadly syndicated loans referenced in our TRS and an increase in the net interest accrued on the TRS as well as $0.6 million of realized gains from the quarterly cash settlement of the TRS. ▫ Net realized and unrealized losses on investments of ($1.8) million, comprised of ($2.1) million of realized losses on the sale of a non - earning asset, $2.5 million of unrealized appreciation due to the reversal of the unrealized appreciation on the non - earning asset that was sold, and ($2.2) million of unrealized depreciation primarily due to the write - down on one new non - earning asset. ▫ Net realized and unrealized losses on futures contracts of ($0.5) million, comprised of ($0.4) million of losses on the settlement of futures contracts and unrealized losses of ($0.1) million driven by a decreasing ten - year U.S. Treasury rate. 1 (1) – As a supplement to GAAP, the Company has provided this non - GAAP performance result. The Company believes that this non - GAAP financial measure is useful because it is inclusive of net spread payments received on the underlying loans in the TRS which is a recurring source of revenue and liqui dit y to pay dividends to investors. Although this non - GAAP financial measure is intended to enhance investor’s understanding of the Company’s business and performance, this non - GAAP financial measure should not be considered an alternative to GAAP. Refer to slide 2 for a reconciliation to the nearest GAAP measure, earnings per share.

Golub Capital BDC, Inc. Investor Presentation Quarter Ended December 20 1 1 Q1 20 12 Q4 20 1 1 Q3 20 1 1 Q2 20 1 1 Q1 20 1 1 Net investment income per share $ 0.29 $ 0.30 $ 0.28 $ 0.29 $ 0.30 Net spread payments from the TRS (1) 0.03 N/A N/A N/A N/A Net investment income per share + TRS (1) 0.32 N/A N/A N/A N/A Net realized /unrealized (loss) gain per share (0.01) (0.16) 0.03 0.04 0.04 Earnings per share 0.28 0.14 0.31 0.33 0.34 Net asset value per share 14.53 14.56 14.75 14.75 14.74 Distributions paid per share 0.32 0.32 0.32 0.32 0.31 Financial Highlights Q1 20 1 2 Q4 20 1 1 Q3 20 1 1 Q2 20 1 1 Q1 20 1 1 Total Fair Value of Investments (000’s) $ 562,046 $ 459,827 $ 438,593 $ 389,060 $ 382,414 Number of Portfolio Investments 105 103 99 98 98 Average Investment Size (000’s) $ 5,353 $ 4,464 $ 4,430 $ 3,970 $ 3,902 Fair Value as a Percentage of Principal (Loans) 97.7% 97.9% 98.1% 97.8% 97.4% 2 (1) – As a supplement to GAAP, the Company has provided this non - GAAP performance result. The Company believes that this non - GAAP financial measure is useful because it is inclusive of net spread payments received on the underlying loans in the TRS which is a recurring source of revenue and liqui dit y to pay dividends to investors. Although this non - GAAP financial measure is intended to enhance investor’s understanding of the Company’s business and performance, this non - GAAP financial measure should not be considered an alternative to GAAP. Refer to slide 2 for a reconciliation to the nearest GAAP measure, earnings per share.

Golub Capital BDC, Inc. Investor Presentation Quarter Ended December 20 1 1 Summary of Portfolio Highlights Originations and Net Funds Growth ▪ New originations totaled $164 million for the quarter ended December 31, 2011, an increase from $60 million in the quarter ended September 30, 2011. ▪ Net growth in investments in securities, at fair value, for the quarter was a robust $102 million, a 22.2% increase from September 30, 2011. Asset Mix ▪ We continue to make progress on asset mix with new originations comprised of 38% unitranche investments, 29% subordinated/second lien investments, 30% senior secured investments and 3% equity securities. ▪ Unitranche investments increased to 41% of total investments at December 31, 2011 from 39% of total investments at September 30, 2011. ▪ Junior debt investments (subordinated debt and second lien) increased to 20% of total investments at December 31, 2011 from 15% of total investments at September 30, 2011. 3

Golub Capital BDC, Inc. Investor Presentation Quarter Ended December 20 1 1 Select Portfolio Funds Roll Data (in millions) Q1 20 1 2 Q4 20 1 1 Q3 20 1 1 Q2 20 1 1 Q1 20 1 1 New Investment Commitments $ 164.1 $ 59.8 $ 135.8 $ 54.6 $ 113.7 Exits (includes full & partial payoffs) of Investments 42.9 28.9 79.6 46.0 64.1 Net Funds Growth 1 102.2 21.0 49.5 6.6 37.5 Portfolio Highlights Asset Mix Q1 20 1 2 Q4 20 1 1 Q3 20 1 1 Q2 20 1 1 Q1 20 1 1 Senior Secured 37% 44% 47% 56% 59% Unitranche 41% 39% 35% 29% 26% Second Lien 7% 5% 5% 7% 7% Subordinated Debt 13% 10% 11% 6% 6% Equity 2% 2% 2% 2% 2% 1. Net funds growth includes the impact of new investments and exits of investments as noted in the table above, as well as othe r v ariables such as net fundings on revolvers, net change in unamortized fees, net change in unrealized gains (losses), etc. 4

Golub Capital BDC, Inc. Investor Presentation Quarter Ended December 20 1 1 Quarterly Statements of Financial Condition As of (Dollar amounts in thousands , except per share data) December 31, 2011 (unaudited ) September 3 0 , 20 1 1 (audited ) June 3 0 , 20 1 1 (unaudited) March 3 1, 20 1 1 (unaudited) December 3 1, 2 01 0 (unaudited) Assets Investments in securities, at fair value $ 562,046 $ 459,827 $ 438,593 $ 389,060 $ 382,414 Cash and cash equivalents 25,447 46,350 44,117 43,866 41,389 Restricted cash and cash equivalents 14,455 23,416 29,279 16,050 27,618 Receivable for investments sold 1,449 – 17,015 4,389 2,895 Cash collateral on deposit with custodian 21,040 21,162 11,460 – – Other assets 9,593 8,889 6,795 6,154 5,998 Total Assets $ 634,031 $ 559,644 $ 547,259 $ 459,519 $ 460,314 Liabilities Debt $ 311,900 $ 237,683 $ 222,300 $ 194,000 $ 194,000 Interest payable 1,789 1,066 1,194 935 2,576 Management and incentive fee payable 2,722 1,608 1,617 1,590 1,693 Other liabilities 1,460 2,738 1,625 1,017 570 Total Liabilities $ 317,871 243,095 226,736 197,542 198,839 Total Net Assets 316,160 316,549 320,523 261,977 261,475 Total Liabilities and Net Assets $ 634,031 $ 559,644 $ 547,259 $ 459,519 $ 460,314 Net Asset Value per Share $ 14.53 $ 14.56 $ 14.75 $ 14.75 $ 14.74 Debt to Equity 0.99x 0.75x 0.69x 0.74x 0.74x Asset Coverage 1 208.3% 278.6% 243.4% 234.4% 233.0% 1. On September 13, 2011, we received exemptive relief from the SEC to permit us to exclude the debt of our small business inves tme nt company (SBIC) subsidiary from our 200% asset coverage test. As such, as of September 30, 2011, the asset coverage ratio excludes the debentures from the SBIC. For purposes of compliance with the asset coverage ratio test, the Company has agreed with the Staff of the SEC to treat the outstanding notional amount of the TRS, less the initial amount of any cash col lat eral required to be posted by us under the TRS, as a senior security for the life of that instrument. The Company may, however, accord different treatment to the TRS in the future in accordance wit h any applicable new rules or interpretations adopted by the Staff of the SEC. All periods prior to September 30, 2011 include the SBIC debentures in the asset coverage ratio. All periods prior to Decemb er 31, 2011 exclude the outstanding notional amount of the TRS from the asset coverage ratio. 5
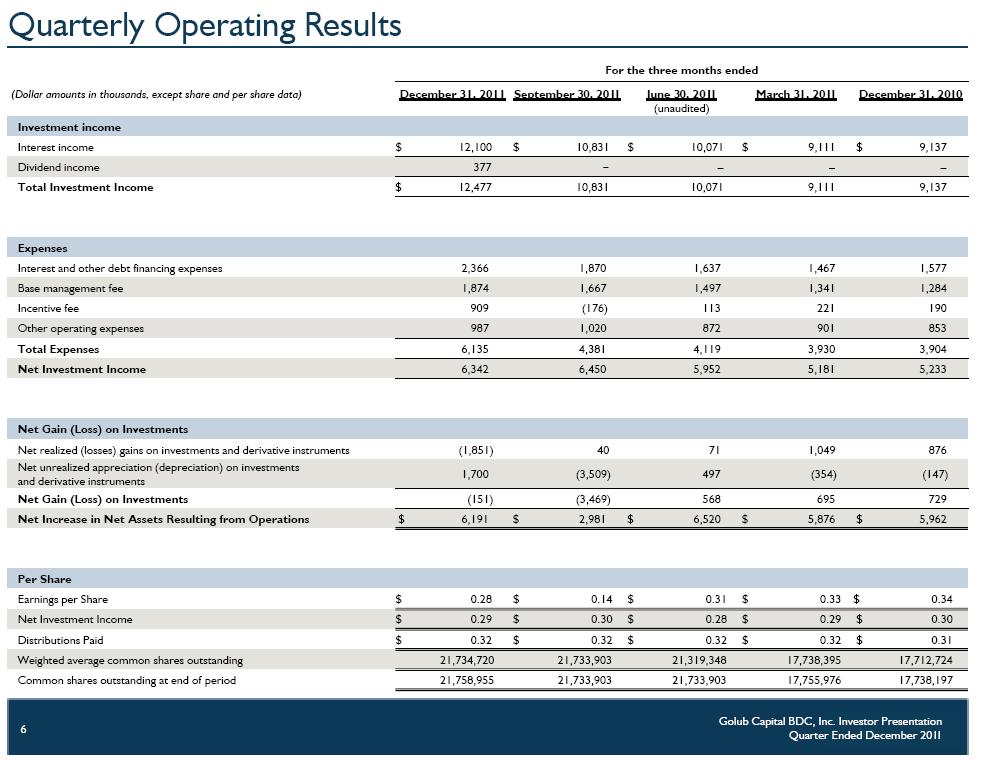
Golub Capital BDC, Inc. Investor Presentation Quarter Ended December 20 1 1 Quarterly Operating Results For the three months ended (Dollar amounts in thousands, except share and per share data) December 31, 2011 September 3 0 , 20 1 1 June 3 0 , 20 1 1 (unaudited) March 3 1, 20 1 1 December 3 1, 2 01 0 Investment income Interest income $ 12,100 $ 10,831 $ 10,071 $ 9,111 $ 9,137 Dividend income 377 – – – – Total Investment Income $ 12,477 10,831 10,071 9,111 9,137 Expenses Interest and other debt financing expenses 2,366 1,870 1,637 1,467 1,577 Base management fee 1,874 1,667 1,497 1,341 1,284 Incentive fee 909 (176) 113 221 190 Other operating expenses 987 1,020 872 901 853 Total Expenses 6,135 4,381 4,119 3,930 3,904 Net Investment Income 6,342 6,450 5,952 5,181 5,233 Net Gain (Loss) on Investments Net realized (losses) gains on investments and derivative instruments (1,851) 40 71 1,049 876 Net unrealized appreciation (depreciation) on investments and derivative instruments 1,700 (3,509) 497 (354) (147) Net Gain (Loss) on Investments (151) (3,469) 568 695 729 Net Increase in Net Assets Resulting from Operations $ 6,191 $ 2,981 $ 6,520 $ 5,876 $ 5,962 Per Share Earnings per Share $ 0.28 $ 0.14 $ 0.31 $ 0.33 $ 0.34 Net Investment Income $ 0.29 $ 0.30 $ 0.28 $ 0.29 $ 0.30 Distributions Paid $ 0.32 $ 0.32 $ 0.32 $ 0.32 $ 0.31 Weighted average common shares outstanding 21,734,720 21,733,903 21,319,348 17,738,395 17,712,724 Common shares outstanding at end of period 21,758,955 21,733,903 21,733,903 17,755,976 17,738,197 6

Golub Capital BDC, Inc. Investor Presentation Quarter Ended December 20 1 1 Portfolio Highlights – Asset Mix New Investment Commitments End of Period Investments 40% 67% 48% 30% 30% 30% 32% 35% 68% 38% 17% 13% 10% 16% 16% - 20,000 40,000 60,000 80,000 100,000 120,000 140,000 160,000 180,000 Q1 2011 Q2 2011 Q3 2011 Q4 2011 Q1 2012 Senior Secured Unitranche Second Lien Subordinated Debt Equity 7% 7% 5% 5% 7% 6% 6% 11% 10% 13% - 100,000 200,000 300,000 400,000 500,000 600,000 Q1 2011 Q2 2011 Q3 2011 Q4 2011 Q1 2012 Senior Secured Unitranche Second Lien Subordinated Debt Equity $54,592 $135,805 17% 10% $113,692 3% 1 % 1% 2 % 59% 56% 47% 44% 26% 29% 35% 39% 11% 6% 7% 6% 2% 2% 2% $382,414 $389,060 $438,593 16% 3 % 2% 37% 41% $459,827 2 % $59,778 $562,046 $164,134 7

Golub Capital BDC, Inc. Investor Presentation Quarter Ended December 20 1 1 Portfolio Highlights – Debt Investment Spread Analysis 1. Total yield on investments is calculated as (a) the actual amount earned on such investments, including interest income and a mor tization of fees and discounts, divided by (b) the daily average of total earning investments at fair value. 2. Interest income yield is calculated as (a) the actual amount earned on such investments, including interest income but exclud ing amortization of fees and discounts, divided by (b) the daily average of total investments at fair value. 3. The weighted average cost of debt is calculated as (a) the actual amount incurred on such debt obligations, divided by (b) th e d aily average of total debt obligations. 4. The weighted average investment spread is calculated as (a) the total yield on investments less (b) the weighted average cost of debt. 10.6% 9.9% 9.6% 9.9% 10.2% 8.1% 8.3% 8.6% 9.1% 9.3% 3.5% 3.2% 3.2% 3.3% 3.5% 7.1% 6.7% 6.4% 6.6% 6.7% 0.30% 0.30% 0.25% 0.37% 0.58% 0.0% 2.0% 4.0% 6.0% 8.0% 10.0% 12.0% Q1 2011 Q2 2011 Q3 2011 Q4 2011 Q1 20112 Total Yield on Investments Interest Income Yield Debt Wtd. Avg. Investment Spread 3-month LIBOR 1 2 3 4 8

Golub Capital BDC, Inc. Investor Presentation Quarter Ended December 20 1 1 Portfolio Highlights – Selected Information Portfolio Rotation – Debt Investments Q1 20 12 Q4 20 1 1 Q3 20 1 1 Q2 20 1 1 Q1 20 1 1 Weighted average rate of new investments 1 9.7% 8.0% 7.8% 7.2% 8.8% Weighted average rate on investments that were sold or paid - off 7.5% 7.2% 5.7% 6.0% 7.1% Weighted average spread over LIBOR of new floating rate investments 7.3% 6.4% 5.3% 5.6% 6.4% Weighted average rate of new fixed rate investments 14.2% N/A 13.7% N/A 13.6% Weighted average fees on new investments 2.1% 1.3% 1.5% 1.2% 2.0% Portfolio Composition – Floating vs. Fixed Investments Q1 20 12 Q4 20 1 1 Q3 20 1 1 Q2 20 1 1 Q1 20 1 1 Percentage of fixed rate investments 13.0% 10.6% 8.1% 6.9% 4.8% Percentage of floating rate investments 84.5% 87.4% 90.3% 91.3% 93.5% Percentage of equity investments 2.5% 2.0% 1.6% 1.8% 1.7% Non - Accrual – Debt Investments Q1 20 1 2 Q4 20 1 1 Q3 20 1 1 Q2 20 1 1 Q1 20 1 1 Non - accrual investments at amortized cost (000’s) $ 11,416 $ 8,711 $ 5,413 $ 4,373 $ 4,373 Non - accrual investments / Total portfolio at amortized cost 2.0% 1.9% 1.2% 1.1% 1.1% Non - accrual investments at fair value (000’s) $ 5,442 $ 2,891 $ 3,360 $ 2,653 $ 2,653 Non - accrual investments / Total portfolio at fair value 1.0% 0.6% 0.8% 0.7% 0.7% 1. Weighted average rate on new investments is based on the contractual interest rate at the time of funding. For variable rate lo ans, the contractual rate would be calculated using current LIBOR, the spread over LIBOR, and the impact of any LIBOR floor. For fixed rate loans, it is the stated fixed rate. 9

Golub Capital BDC, Inc. Investor Presentation Quarter Ended December 20 1 1 Portfolio Highlights – Portfolio Ratings Risk Ratings Definition Rating Definition 5 Borrower is performing above expectations 4 Borrower is generally performing as expected and the risk factors are neutral to favorable 3 Borrower may be out of compliance with debt covenants; however, loan payments are generally not past due 2 Borrower is performing materially below expectations and the loan’s risk has increased materially since origination 1 Borrower p erforming substantially below expectations and the loan’s risk has substantially increased since origination Strong Portfolio Risk Ratings 1. The fair value of the TRS at December 31, 2011, September 30, 2011 and June 30, 2011 was $(390), $(1,845) and $(262), res pec tively. The TRS is included in the above table with an investment performance rating of 4 as of December 31, 2011, September 30, 2011 and June 30, 2011. December 31, 2011 September 30, 2011 June 30, 2011 Investment Performance Rating Investments at Fair Value (in thousands) 1 % of Total Portfolio Investments at Fair Value (in thousands) 1 % of Total Portfolio Investments at Fair Value (in thousands) 1 % of Total Portfolio 5 $ 80,299 14.3% $ 49,691 10.8% $ 55,367 12.6% 4 $ 436,107 77.6% 360,259 78.7% 336,490 76.8% 3 $ 39,808 7.1% 45,141 9.9% 42,607 9.7% 2 $ 5,442 1.0% 2,891 0.6% 4,129 0.9% 1 – – 0.0% – 0.0% Total $ 561,656 100.0% $ 457,982 100.0% $ 438,593 100.0% 10

Golub Capital BDC, Inc. Investor Presentation Quarter Ended December 20 1 1 Credit Quality Credit Quality – Investment Portfolio ▪ Fundamental credit quality remains strong, but non - earning assets as a percentage of total investments increased from 0.6% to 1.0% due to the addition of one new non - earning loan which has a current fair value of $3.4 million. ▪ We disposed of one non - earning account during the quarter for a small net gain compared to its fair value as of September 30, 2011. ▪ 91.9% of the loans in our investment portfolio at fair value have an investment performance rating of 4 or higher, an increase from 89.4% at September 30, 2011. Credit Quality – Derivatives ▪ Unrealized appreciation on the TRS of $1.5 million was primarily a result of improved market pricing on the referenced broadly syndicated loans in the TRS. 11

Golub Capital BDC, Inc. Investor Presentation Quarter Ended December 20 1 1 Common Stock and Distribution Information Common Stock Data Distribution Data Date Declared Record Date Payment Date Amount Per Share Total Amount (In thousands) February 8, 20 1 1 March 18, 20 1 1 March 30, 20 1 1 $0.32 $5,676 May 3, 20 1 1 June 17, 20 1 1 June 29, 20 1 1 $0.32 $6,947 August 4, 2011 September 19, 20 1 1 September 28, 20 1 1 $0.32 $6,955 December 7, 2011 December 19, 20 1 1 December 29, 20 1 1 $0.32 $6,955 February 2, 2012 March 16, 2012 March 29, 2012 $0.32 $8,083 12 Fiscal Year Ended September 30, 2011 High Low End of Period First Quarter $17.95 $15.44 $17.12 Second Quarter $17.60 $15.78 $15.78 Third Quarter $16.30 $14.40 $14.93 Fourth Quarter $15.81 $14.00 $14.85 Fiscal Year Ended September 30, 2012 First Quarter $16.00 $14.16 $15.50

Golub Capital BDC, Inc. Investor Presentation Quarter Ended December 20 1 1 Liquidity and Investment Capacity Cash and Cash Equivalents ▪ Unrestricted cash totaled $25.4 million as of December 31, 2011. ▪ Restricted cash totaled $14.5 million as of December 31, 2011. Restricted cash as of December 31, 2011 was primarily held in our securitization vehicle and is available for new investments that qualify for acquisition by this entity. Senior Secured Revolving Credit Facility ▪ As of December 31, 2011, subject to leverage and borrowing base restrictions, we had approximately $37.1 million available for additional borrowings on our revolving credit facility . Public Offering ▪ On February 3, 2 0 1 2 , we closed on the offering of 3,500,000 shares of common stock at an offering price of $1 5.35 per share, raising $ 53 .7 million in gross proceeds before fees and expenses. ▪ We have granted the underwriters an option to purchase up to an additional 525,000 shares of common stock to cover over - allotments, if any. ▪ A trust organized by Golub Capital for the purpose of awarding incentive compensation to employees, purchased an aggregate of $3.1 million of shares in the offering at the public offering price per share. SBIC Financing On February 3, 2012, we received a commitment approval from the SBA to issue another $30 million in SBIC debentures. SBIC commitments are available subject to customary SBA approval procedures. 13

Golub Capital BDC, Inc. Investor Presentation Quarter Ended December 20 1 1 Regulatory Matters Form 4 Regulatory Filings – Changes in Beneficial Ownership ▪ On December 30, 2011, two of the founding shareholders of Golub Capital BDC, Inc., Golub Capital Company V LLC and Golub Capital Company VI LLC, sold a portion of their shares to a pension fund managed by an existing Golub Capital investor. ▪ These affiliated funds will use the proceeds to invest in middle market loans and equity investments. Asset Coverage Test ▪ For purposes of compliance with the asset coverage ratio test, we have agreed with the Staff of the SEC to treat the outstanding notional amount of the TRS, less the amount of cash collateral on deposit with the custodian under the TRS, as a senior security for the life of the instrument. ▪ Although we have agreed to this treatment, we may accord different treatment to the TRS in the future in accordance with any applicable new rules or interpretations adopted by the Staff of the SEC. 14

Golub Capital BDC, Inc. Investor Presentation Quarter Ended December 20 1 1 Regulatory Matters Investment Advisory Incentive Fee Calculation ▪ Based on discussions with the SEC, we now include the interest spread from the TRS as part of the income component of the incentive fee, as opposed to the capital gains component of the incentive fee. ▪ We previously planned on including the interest spread payments from the TRS in the capital gains component of the incentive fee as this approach is consistent with the GAAP treatment of the interest spread payments. ▪ After reviewing the incentive calculation for the quarter ended December 31, 2011with the interest spread payments included in the income component of the incentive fee, the Investment Adviser decided to irrevocably waive the incremental portion of the incentive fee attributable to the changed treatment of the TRS interest spread payments. ▪ This waiver reduced the incentive fee payable to the Investment Adviser by $647,000 for the three months ended December 31, 2011. 15