Attached files
| file | filename |
|---|---|
| 8-K - FORM 8-K - PTC INC. | form8k.htm |
| EX-99.1 - PRESS RELEASE - PTC INC. | pressrel.htm |
Q1 FISCAL 2012 PREPARED REMARKS
Technology and market leadership, accelerating margin growth, new long-term targets
We set a goal in 2009 to deliver 20% non-GAAP EPS growth annually through FY’14 driven by a revenue CAGR growth of approximately 12% and non-GAAP operating margin expansion of 100 basis points per year. As noted in the table below we have exceeded these margin targets, achieving 200+ basis points of margin improvement in each of FY’10 and FY’11. As part of our ongoing strategy to enhance customer focus, expand our addressable market opportunities and accelerate profitability we are implementing an organizational realignment around five market sectors and restructuring our business. We expect the combination of near-term cost savings from the restructuring and the longer-term benefit of the realignment to improve efficiencies within our Sales and Services organizations. As a result of progress we’ve already made on operating margins coupled with these new initiatives, we are increasing our long-term, non-GAAP operating margin target by 500 basis points to a range of 25% to 27% by FY’15.

We believe we are the technology leader in attractive markets and as we deliver on our organizational realignment, we are positioned to significantly expand our addressable market. Our strategy is to deliver a broad set of sector-specific solutions that span our customers entire product “lifecycle” – from engineering, through supply chain and ultimately into sales and after-market services. Our solutions are focused on the following five sectors: Mechanical CAD (MCAD), Product Lifecycle Management (PLM), Application Lifecycle Management (ALM), Services Lifecycle Management (SLM) and Supply Chain Management (SCM).
We believe this enhanced focus on solutions will drive sustainable revenue growth due to increased customer value and better competitive differentiation. We also believe that over the long-term, our solutions strategy will yield efficiencies within sales and marketing. Along with near-term cost savings associated with our restructuring, we expect the realignment to drive approximately 400 basis points of gross margin expansion through a combination of higher services margins and a lower mix of services revenue. We also intend to reduce our sales and marketing costs (as a percentage of revenue) by approximately 400 basis points over the long-term. Importantly, the efficiencies we garner within the sales and marketing organization allow us to continue to ramp our sales capacity to drive license growth.
We currently characterize the markets we participate in with the 4-box graphic below. As we realign our organization, we intend to transition away from the 4-box framework over time, and we intend to provide information we believe will more fully reflected our business and its opportunities.
Industry analysts estimate that from 2005 through 2010 the PLM market (right half of the 4-box below) has grown in the high single digits, faster than the CAD market (left half of the 4-box below), which being a more mature market has grown in the mid-single digits over the same time frame. In 2011 the CAD industry experienced a strong recovery as manufacturing companies ramped investment in product development through increased engineering capacity around the globe and by re-tooling their workforce with the latest design solutions. Looking forward, analysts continue to expect the CAD market to grow at a 4-5% CAGR from 2010 to 2014; however, we believe we are positioned to outgrow this market based on the early success of our Creo solutions introduced in June 2011. We have seen our technology leadership position in the growth markets translate into growth rates in excess of the overall market, especially in our PLM business, over the past five years. Looking forward, we continue to expect our growth rates to outpace industry analyst estimates of a 7-9% CAGR from 2010 to 2014, based on our technology leadership position in the PLM market and in the broader ‘Enterprise’ sectors including ALM, SLM and SCM.

Non-GAAP Supplemental Information
We provide non-GAAP supplemental information to our GAAP information. PTC's reasons for providing this information are described at the end of this document. GAAP information corresponding to the non-GAAP information provided is contained in “Q1 FY’12 Expenses Commentary and Q2 & FY’12 Outlook” below and in the attached tables. References to non-GAAP revenue for Q1’12 in the discussion that follows exclude a $1.5 million effect of purchase accounting on the fair value of the acquired deferred maintenance balance of MKS Inc. A reconciliation to the corresponding GAAP revenue amount is provided in the revenue tables affected by the adjustment.
Q1 FY’12: Strong first quarter with non-GAAP EPS up 59% year over year
Total non-GAAP revenue for Q1 was $319.8 million (up 20% year over year and 19% on a constant currency basis), at the high end of our guidance of $305 million to $320 million, despite a $4.6 million negative impact from currency movements. Non-GAAP revenue included $20 million from MKS and 4CS (approximately $18.5 million on a GAAP basis). Excluding MKS and 4CS, total non-GAAP revenue growth was 12% year over year. License revenue of $89.1 million was in-line with our guidance of $80 to $95 million - up 18% year over year (17% on a constant currency basis) and up 12% on an organic basis (11% on a constant currency basis).
We delivered non-GAAP maintenance revenue of $155 million (up 18% year over year, in line with our guidance) and we delivered stronger than anticipated services revenue of $76 million (up 27%, compared to our guidance of 18% growth) driven primarily by continued adoption of our Enterprise solutions. Excluding MKS and 4CS, year over year our maintenance and services revenues were up 11% and 17%, respectively. Importantly, we delivered solid, non-GAAP services net margins of 7.6%, which gives us increased confidence in our ability to achieve our target of approximately 9% non-GAAP services net margin in FY’12.
Our Q1 non-GAAP EPS of $0.35 (up 59% year over year) was above our guidance range of $0.28 to $0.32. The results of MKS and 4CS were $0.01 dilutive to our non-GAAP EPS in Q1. MKS and 4CS unfavorably impacted our Q1 GAAP EPS by $0.06. Relative to the tax and Fx rates we used when we established our Q1 guidance ($1.40 USD/EURO), Q1 non-GAAP EPS was unfavorably impacted by $0.01. Q1 GAAP EPS was $0.18, which was at the high end of our guidance range of $0.14 to $0.18. For Q1, our actual simple average Fx rate was $1.37 USD/EURO vs. guidance of $1.40. Our guidance for Q2 assumes $1.30 USD/EURO.
As is highlighted in the 4-box table below:
|
1)
|
Large enterprise PLM (upper right box) license revenue was up 45% year over year and excluding MKS and 4CS was up 34% year over year, continuing the positive rebound in this market that we began to experience in our Q3 ‘11. Our positive outlook on this market is also supported by strength in maintenance and services revenue, which demonstrates robust adoption of our PLM technology; excluding MKS and 4CS, Direct Enterprise services revenue was up 21% year over year and maintenance revenue was up 16% year over year.
|
|
2)
|
Total non-GAAP PLM revenue of $165.9 million (right half of the 4-box), was up 38% year over year.
|
|
3)
|
The significant rebound we experienced in our CAD business in FY ’11 (left half of the 4-box) slowed in Q1’ 12 as expected, with total revenue up 5% and license revenue down 1% year over year. We continue to see positive market response to our Creo® solutions in the third quarter of commercial release.
|
|
4)
|
Growth in the large enterprise CAD market (upper left box) slowed, compared to a very strong Q1’11, with total revenue up 4% and license revenue down 5%.
|
|
5)
|
We experienced solid growth in our SMB business (bottom half of the 4-box), with year-over-year license revenue up 8%. This is our 8th consecutive quarter of year-over-year license and total revenue growth in the Channel.
|
|
6)
|
We had 24 large deals (>$1M in license and services revenue) that contributed $68.8 million in revenue, up 18% year over year. Of the $68.8 million in large deal license and service revenue, approximately $56.5 million was Enterprise (PLM) related, compared to $46.2 million in Q1’11.
|
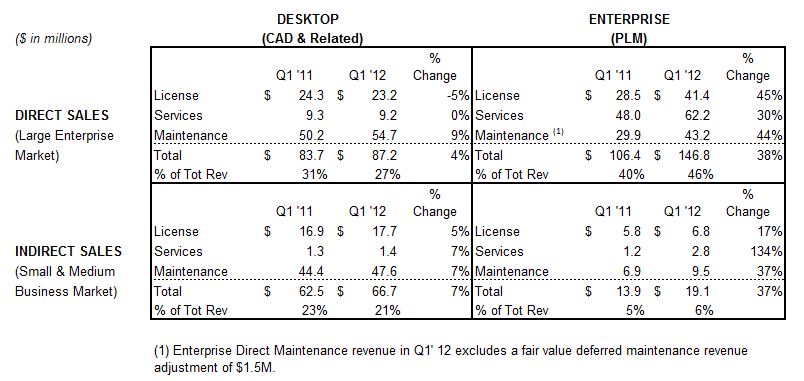
Revenue by 4-Box
The horizontal axis highlights Desktop vs. Enterprise solutions
|
·
|
Desktop solutions include Creo Parametric TM, Mathcad® and a portion of Creo® Elements/Direct TM and a portion of Arbortext® revenue
|
|
·
|
Enterprise solutions include Windchill®,Creo View TM, a portion of Arbortext revenue, and Integrity®
|
The vertical axis highlights Direct vs. Indirect go-to market strategies
|
·
|
Direct sales focuses primarily on the large enterprise market
|
|
·
|
Indirect sales (primarily our VAR reseller channel) focuses primarily on the SMB market
|
Q2 AND FY’12 OUTLOOK: Targets reflect positive market momentum, increased sales capacity and commitment to margin expansion.
In providing guidance for Q2 and setting targets for FY’12, we are weighing company specific factors such as our pipeline of opportunities and our maintenance and services base as well as external considerations, including the macroeconomic environment, currency, and visibility into customer spending patterns. While we are aware of current macroeconomic conditions, this guidance assumes a relatively stable economic environment. We delivered a strong start to FY’12 and continue to plan to deliver a solid growth year. At the same time, consistent with our view at the beginning of FY’12, we have prepared contingency plans in case the economy softens.
For example, while sales capacity hiring remains a key focus, we continue to moderate other hiring and spending. The effect of that was clearly reflected in our non-GAAP Q1 EPS results. In addition, in Q2’12 we are implementing a restructuring that we expect to benefit operating expenses by approximately $5 million per quarter beginning in Q3’12. Combined, we believe these cost savings actions position us to grow FY’12 non-GAAP earnings approximately 30% year over year versus our previous expectation of approximately 20% year-over-year growth. If the economic environment weakens drastically, it would become increasingly difficult or even impossible to hold the earnings target.
Q2’12 AND FY’12 GUIDANCE SUMMARY
Our Q2 and FY’12 guidance are outlined in the table below.

We expect our 2011 acquisitions of MKS and 4CS to add approximately $90 to $100 million in revenue (approximately $3 million of which is non-GAAP) and be slightly accretive to our non-GAAP EPS results in FY’12, as operating profitability is offset by interest payments on the debt and investments we are making in these businesses to capitalize on their long-term growth opportunity. We are increasing our non-GAAP operating margin target from approximately 18.5% to approximately 20%, which represents an improvement of greater than 200 basis points year over year. Our goal is to achieve approximately half of this operating margin expansion by improving gross margins with the remainder coming from operating leverage. We continue to expect that the completion of phase 1 of the Hyundai-Kia engagement along with several initiatives launched in FY’11 will allow us to improve our services net margins into the high single-digits in FY’12. Over the long-term we expect to continue to improve services margins and reduce services mix through the expansion of our services partner ecosystem and solutions that fundamentally require less services.
INITIATING NEW TARGET MODEL
We are very optimistic about the long-term opportunity for PTC and will continue to make strategic investments, notably in direct sales capacity, that we believe are critical to delivering value to our customers. Importantly, we intend to fund increased sales capacity through a combination of tactical and strategic initiatives to position PTC for continued margin expansion. Based on these factors, we are initiating FY’15 targets predicated on revenue growth of 11% to 13%, non-GAAP gross margin of 74% to 76% and non-GAAP operating margin of 25% to 27%.
REVENUE TRENDS
Certain reclassifications between Direct and Indirect and Desktop and Enterprise revenue from previously reported results (Q1’10 through Q4’11) are reflected below. Indirect revenue is comprised of revenue from our reseller channel and from customers classified as Indirect. To the extent a customer changes between the Direct and Indirect classification, we reclassify their historical revenue to align to the current period classification. The reclassifications of prior quarter and annual Direct and Indirect and Desktop and Enterprise revenue were not more than 2% for any single quarterly or annual reporting period.
DIRECT SALES: Strong large deal activity and continued Enterprise momentum
Our direct sales force is primarily focused on selling our Product Development System, which incorporates all of our primary product families, to large enterprise customers. The table below shows direct revenue performance. The key metric we provide in addition to revenue regarding our Direct Sales / Large Enterprise Market performance is Large Deal Activity below.

Q1 direct account revenue was up 23% year over year. As you can see from the 4-box detail on page 4, our growth in this space was driven by 38% growth in Enterprise (PLM) revenue and 4% growth in Desktop (CAD) revenue. The large enterprise PLM market (upper right box) was strong, with license revenue, non-GAAP maintenance revenue and services revenue, up 45%, 44% and 30% year over year, respectively.
License revenue in the large enterprise CAD market (upper left box) decreased 5% year over year.
LARGE DEAL ACTIVITY:
Large deal activity is a significant growth driver and has historically tended to generate 20% to 25% of our total revenue in any given quarter, with the exception of Q4, which historically has been higher. Large deal activity is driven primarily by direct sales teams. We define “large deals” as recognizing more than $1 million of license and service revenue from a customer during a quarter. Note that beginning in Q1’12, we instituted changes to our internal customer reporting that resulted in differences to our previously reported large deal metrics. We have provided the updated historical information in the table below.

In Q1 we had 24 large deals totaling $68.8 million. 10 of these customers were in North America, 9 were in Europe and 5 were in Asia. Of the $68.8 million in license and service revenue, approximately $56.5 million was Enterprise (PLM) related, compared to approximately $46.2 million in Q1’11. Approximately $12.4 million was Desktop (CAD) related, compared to approximately $11.9 million in the year ago period. We have a strong pipeline of large deals that we are working on worldwide. We are winning competitive deals with large global companies and are actively engaged in a substantial number of competitive opportunities with other large global companies.
UPPER LEFT BOX (DIRECT SPACE / DESKTOP PRODUCTS)
This market is highly penetrated with mid-single digit long-term growth rates. During FY’11, we saw substantial year-over-year growth in this market due to both the impact of macro factors (spending in this market had been muted since the end of 2008), as well as excitement about our new Creo CAD platform launched in June 2011, which we believe is a significant enhancement over the functionality and usability of existing CAD products on the market today. In Q1, total revenue grew 4% while license revenue declined 5%. Note that we experienced significant license growth in Q1’11 of 57% year over year, which created difficult comparisons in Q1’12.
Our primary products in this market are Creo Parametric, Creo Elements/ Direct and Arbortext authoring solutions.
UPPER RIGHT BOX (DIRECT SPACE / ENTERPRISE PRODUCTS)

From a near- to medium-term growth perspective, we believe this market offers the most significant opportunity for PTC. Large enterprises are increasingly investing in PLM solutions and we believe Windchill is the premier PLM solution on the market today. This market exhibited strong year over year growth across all three lines of
business and we expect license growth to benefit further going forward due to investment in sales capacity and broadening of our addressable market in ALM, SLM and SCM. Importantly, this is our 7th quarter of consecutive services and maintenance revenue growth on a year-over-year basis, which we believe demonstrates robust adoption of our PLM solutions.
Our primary products in this market are Windchill, Creo View, Arbortext enterprise solutions and Integrity.
INDIRECT SALES: Strong maintenance base and continued signs of improving end markets
Our indirect sales are primarily from the Small and Medium Businesses (SMB) market. Indirect revenue is comprised of revenue from our reseller channel and from customers we have designated as indirect. Our channel partners are focused primarily on selling our MCAD products, such as Creo Parametric, Creo View and Mathcad, and Windchill PDMLink® into the SMB marketplace.

In Q1 indirect account revenue was up 12% year over year. Given that this market is made up of SMB companies, we believe this market is more heavily impacted by macroeconomic factors. Importantly, as reflected in the 4-box detail, we are continuing to see year-over-year improvement in the SMB space: total revenue and license revenue are up year-over-year in both the lower left and lower right boxes for the 8th quarter in a row.
LOWER LEFT BOX (INDIRECT SPACE / DESKTOP PRODUCTS)

We believe this market continues to offer long-term growth potential. The customer base is primarily comprised of SMB customers which we believe are more greatly impacted by macroeconomic factors. Importantly, we are continuing to see improvement in new license sales year-over-year and our maintenance paying base in this market remains stable.
Our primary products in this market are Creo Parametric, Creo Elements/Direct, Mathcad and Arbortext authoring solutions.
LOWER RIGHT BOX (INDIRECT SPACE / ENTERPRISE PRODUCTS)

From a medium- to long-term growth perspective, we believe this market offers a solid growth opportunity. Again, the customer base in this market is primarily comprised of SMB companies, which we believe are more greatly impacted by macroeconomic factors. SMB customers are increasingly interested in PLM solutions and we believe we are well positioned to provide those customers with the right PLM technology to meet their needs.
Our primary products in this market are Windchill and Arbortext enterprise solutions.
REVENUE BY LINE OF BUSINESS
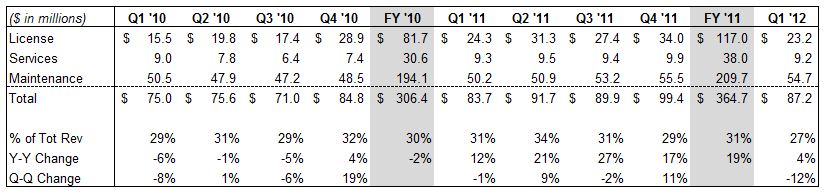
LICENSE: Solid license quarter… Enterprise growth continues to rebound
License sales generate the highest gross margins, which are in the mid- to high 90% range on a non-GAAP basis. License revenue historically has tended to represent 28% to 35% of our total revenue in any given quarter, with Q4 generally being our strongest quarter.
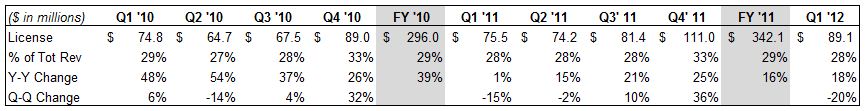
Q1 License revenue of $89.1 million was up 18% year over year (17% on a constant currency basis). Excluding MKS and 4CS, license revenue was up 12% year over year (11% on a constant currency basis). We had 41% year-over-year growth in Enterprise license revenue partially offset by a 1% year-over-year decrease in Desktop license revenue. Our products continue to perform very well in competitive benchmarks, as demonstrated by our large deal (>$1 M in license and service revenue) momentum.
Looking forward to Q2, we are expecting license revenue of $80 to $95 million. For FY’12, we are expecting license revenue growth of approximately 17% on a year-over-year basis, and organic growth in the mid-teens.
SERVICES: Strong growth demonstrates accelerating adoption of our solutions
Our services business provides significant value to our customers, helping them re-engineer their global product development business processes and implement our solutions, and providing them with training on our software. Services revenue has historically tended to represent 20% to 25% of our total revenues in any given quarter.

Q1 Services revenue of $75.6 million was up 27% year over year (up 26% on a constant currency basis), primarily due to strong license revenue and ongoing engagements with PLM customers. Excluding MKS and 4CS, our Direct Enterprise services revenue was up 21% year over year. Our training business, which typically represents about 15% of our total services revenue, was up 16% year over year. Our consulting business, which primarily supports Windchill implementations, was up 28% year over year. This is our 6th consecutive quarter of services growth. We delivered solid, non-GAAP services net margin of 7.6% in Q1’12 (up 330 basis points from the FY’11 non-GAAP services net margin of 4.3%), which gives us increased confidence in our ability to achieve approximately 9% non-GAAP services net margin in FY’12 – a key element of gross margin expansion.
Looking forward to Q2, we are expecting services revenue to be up approximately 19% on a year-over-year basis. For FY’12 we are expecting services revenue to grow approximately 14% on a year-over-year basis. On a constant currency basis, this is an increase of approximately 200 basis points relative to our previous guidance due to continued strong adoption of our Enterprise solutions. We have a solid backlog of services engagements that provides near-term visibility into our services business. With the completion of phase 1 of the Hyundai-Kia engagement in Q1’12 and benefit from other strategic initiatives, we expect our services net margins to improve to approximately 9% in FY’12 (up 470 basis points year over year). Over the long-term we expect to continue to improve services margins into the mid-teens and reduce services mix through the expansion of our Windchill services ecosystem and solutions that fundamentally require less services.
MAINTENANCE: More than 1.5 million active seats
Our maintenance business is an important barometer of customer satisfaction with our solutions. It is also a strong source of recurring revenue for PTC. Maintenance gross margins are in the mid- to high 80% range. Maintenance revenue has historically tended to represent 45% to 50% of our total revenues in any given quarter, with Q4 usually being lower as a percent of total revenue due to historically strong performance of license sales in that quarter.

Q1 maintenance revenue of $155.1 million was up 18% year over year (up 16% on a constant currency basis), reflecting strong execution and the impact of annuity focused business policy modifications. Excluding MKS and 4CS, revenue was up 11% year over year. We believe our maintenance business reflects a solid customer base and the importance customers attribute to our products.
Looking forward to Q2, we are expecting approximately 14% maintenance revenue growth on a year-over-year basis. For FY’12 we are expecting approximately 10% maintenance revenue growth on a year-over-year basis, primarily due to improving license revenue, the addition of MKS maintenance revenue and strong execution.
Active Maintenance Seats
We have more than 1.5 million active maintenance seats of PTC software in use today. We believe the solid base of maintenance-paying customers is a testament to the quality of our products and we also view it as one of our most important assets.
Active Maintenance Seats

We experienced an increase in active maintenance seats across all major product families in Q1. Our overall attach and renewal rates continue to remain strong.
REVENUE BY REGION: Solid results globally
Americas:

Americas revenue in Q1 of $118.3 million was up 18% compared with last year, reflecting increases of 20% and 12% in direct and indirect revenue, respectively. Q1 license revenue in the Americas was up 4% year over year, with direct license revenue up 7% and indirect license revenue down 15%. Sequentially, total revenue was down 10% and license revenue was down 29%.
Europe:

Europe revenue was $133.7 million in Q1, up 24% (23% on a constant currency basis) compared with last year, reflecting increases of 31% and 11% in direct and indirect revenue, respectively. Q1 license revenue in Europe was up 30% year over year, primarily reflecting continued momentum in the Industrial market. Direct license revenue was up 38% and indirect license revenue was up 13%. Sequentially, total revenue was flat and license revenue was down 2%.
Japan:

Japan revenue was $30.5 million in Q1, up 22% (up 14% on a constant currency basis) compared with last year, reflecting increases of 33% and 8% in direct and indirect revenue, respectively. Q1 license revenue in Japan was up 55% compared with last year, with direct license revenue up 127% and indirect license revenue up 25%. Sequentially, total revenue was down 15% and license revenue was down 60%.
Pacific Rim:

Pacific Rim revenue was $37.3 million in Q1, up 11% (11% on a constant currency basis) compared with last year, reflecting increases of 6% and 23% in direct and indirect revenue, respectively. Q1 license revenue in the Pac Rim was up 19% compared with last year, with direct license revenue up 22% and indirect license revenue up 14%. Sequentially, total revenue was down 10% and license revenue was down 12%. China, which represents a significant portion of our Pac Rim revenue, decreased 1% compared to Q1’11.
CURRENCY IMPACT ON RESULTS COMPARED TO THE YEAR AGO PERIOD
Because we have a global business, with Europe and Asia historically representing approximately 65% of our revenue, our results are impacted by currency fluctuations. On a constant currency basis, our revenue increased 19% year over year. Currency fluctuations favorably impacted Q1 GAAP and non-GAAP revenue by $3.2 million and unfavorably impacted Q1 GAAP and non-GAAP expenses by $1.6 million compared to Q1’11 currency rates.
Constant Currency (assumes Q1’11 currency rates)

Looking forward, the guidance we are providing assumes exchange rates of approximately 1.30 USD / EURO and 77 YEN / USD. Our actual simple average Q1 ’11 Fx rate was $1.37 USD / EURO. We do not forecast currency movements; rather we provide detailed constant currency commentary. Currency can significantly impact our results. For example, in FY ’11 and FY’10 currency was a tailwind for PTC when compared to the prior year: revenue was positively impacted by $37 million and $15 million, respectively, and non-GAAP expenses were negatively impacted by $21 million and $10 million, respectively.
As a simple rule of thumb, based on current revenue and expense levels, a $0.10 move on the USD/EURO exchange rate will impact annualized revenue by approximately $30 to $35 million and EPS by approximately $0.07 to $0.08.
Q1 FY’12 EXPENSES COMMENTARY AND Q2 & FY’12 OUTLOOK
Q1 non-GAAP results exclude $13.4 million of stock-based compensation expense, $9.3 million of acquisition- related intangible asset amortization, $2.1 million of acquisition-related expenses related to MKS and 4CS, a $1.5 million fair value adjustment related to MKS deferred maintenance revenue, $0.8 million in other expense and $6.7 million of income tax adjustments. The Q1 non-GAAP results include a tax rate of 25% and 120.6 million diluted shares outstanding. The Q1 GAAP results include a tax rate of 26% and 120.6 million diluted shares outstanding.
Q2’12 non-GAAP guidance excludes the following estimated expenses and their tax effects:
|
·
|
Approximately $20 million of restructuring charge
|
|
·
|
Approximately $1 million of a fair value deferred maintenance revenue adjustment
|
|
·
|
Approximately $13 million of expense related to stock-based compensation
|
|
·
|
Approximately $9 million of acquisition-related intangible asset amortization expense
|
|
·
|
Any acquisition-related expenses
|
FY’12 non-GAAP guidance excludes the following full-year estimated expenses and their tax effects, as well as any one-time tax items:
|
·
|
Approximately $20 million of restructuring charge
|
|
·
|
Approximately $3 million of a fair value deferred maintenance revenue adjustment
|
|
·
|
Approximately $51 million of expense related to stock-based compensation
|
|
·
|
Approximately $36 million of acquisition-related intangible asset amortization expense
|
|
·
|
Approximately $1 million of other expense
|
|
·
|
Any acquisition-related expenses
|
NON-GAAP OPERATING MARGINS

INCOME STATEMENT
Our Q1’12 non-GAAP gross margin was $228 million, or 71.4%, compared to $186 million, or 69.8% in the year ago period. Q1’12 GAAP gross margin was $220 million, or 69.1%, compared to $180 million, or 67.7% in Q1’11.
Our Q1’12 non-GAAP operating expenses were $169 million, up from $151 million in Q1’11, reflecting the acquisition of MKS and investments we have made in the business to add sales capacity and to improve our product portfolio.
From an operating performance perspective, we achieved 18.4% non-GAAP operating margin in Q1’12, compared to 13.3% last year. GAAP operating margin was 10.2% for Q1’12 compared to 6.4% in Q1’11.
Looking forward, we are expecting Q2 ‘12 non-GAAP gross margins of 71% to 73% and non-GAAP operating expenses of approximately $165 million to $172 million, reflecting higher sales and marketing expense related primarily to higher sales expense related to planned hires.
For FY ‘12, we are expecting non-GAAP gross margins of approximately 73%, with Services margins in the high single-digits and non-GAAP operating margins of approximately 20%.
Over the longer-term we intend to increase our non-GAAP gross margin to the 74% to 76% range primarily through improved services gross margins and services revenue mix. We also intend to increase our non-GAAP operating margin to the 25% to 27% range primarily through increased efficiency in our global sales organization.
We made significant investments in FY’09 and FY’10 that have helped us achieve a technology leadership position and have driven substantial revenue growth. In FY’12 we are continuing to invest in sales capacity to capitalize on our technology leadership position, driving revenue growth and creating further operating leverage opportunities over time. Looking forward, we expect to continue to increase our R&D investments, while having R&D as a percentage of revenue to continue to trend toward more normalized historical levels as it did over the back half of FY’11.
TAX RATE
Q1 non-GAAP tax rate was 25%, compared to our expected rate of 24% due to the mix of before-tax-profit by region and one-time discrete items in the quarter. Our GAAP tax rate was 26%.
Looking forward, the Q2 guidance assumes a non-GAAP tax rate of 25% and a GAAP tax rate of 21%. The FY’12 target assumes a non-GAAP tax rate of 25% and a GAAP tax rate of 21%.
STOCK-BASED COMPENSATION
Expenses related to stock-based compensation were 4.2% of non-GAAP revenue in Q1 ’12, compared to 4.1% of non-GAAP revenue in Q1’11. We expect this percentage to decrease to 3.9% in FY’12. In FY’13, we expect that stock-based compensation as a percentage of non-GAAP revenue will continue to trend down annually, ultimately reaching a sustainable long-term target of 3%.
SHARE COUNT / SHARE REPURCHASE
We had 120.6 million fully diluted weighted average shares outstanding for Q1. Our Board has authorized us to repurchase up to $100 million worth of our shares in the period October 1, 2011 through September 30, 2012. We did not repurchase any shares in Q1 ’12.
Looking forward, we expect to have approximately 122 million fully diluted shares outstanding for Q2 and for the full fiscal year. We intend to repurchase $15 million worth of shares in Q2, and an additional $40 million in the remainder of FY ‘12. Our long-term goal is to repurchase stock to offset dilution.
BALANCE SHEET: Solid cash position
CASH / CASH FLOW FROM OPERATIONS
For Q1’12, our cash balance was $187 million, up from $168 million at the end of Q4’11. We generated $36 million from operations in Q1. Uses of cash in the quarter included capital expenditures of $8 million.
Looking forward, we expect to have approximately $190 million in cash at the end of Q2.
DSO
We continue to have strong DSOs of 63 days in Q1 ’12 compared to 62 days in Q4’11 and 60 days in Q1’11.
OUTSTANDING DEBT
At the end of Q1’12, the balance outstanding under our $300 million revolving credit facility was $200 million. As planned, we did not repay any of that amount in Q1, but expect to reduce the outstanding balance by approximately $100 million by Q4’12.
MISCELLANEOUS COMMENTS
HEADCOUNT
Total headcount was 6,110 at the end of Q1 compared to 6,122 at the end of Q4. Headcount at the end of Q1’11 was 5,416.
M&A
We view M&A primarily as a strategic vehicle to further enhance our product portfolio and growth opportunity. We intend to remain opportunistic as it relates to M&A. While we purchased MKS in Q3’11, a large transaction for us, historically, the majority of our M&A opportunities have comprised small, strategic technology tuck-ins. For example, in FY’09 we acquired Relex to expand our quality lifecycle management capabilities and Synapsis (InSight) to build out our product analytics platform, in FY’10 we acquired technology in the fast growing carbon information management market, further enhancing our product analytics platform with “green product development” capabilities, and in Q4’11 we acquired 4CS to enhance our after-market services solutions. We will evaluate other strategic acquisition opportunities of varying size as they arise.
Other Information
As previously disclosed, we have undertaken an investigation of payments by certain business partners and expenses by certain employees in China that raise questions of compliance with laws, including the Foreign Corrupt Practices Act, and/or compliance with our business policies, and we have disclosed the results of that investigation to the United States Department of Justice and the Securities and Exchange Commission. We are cooperating to provide additional information as requested. We are unable to predict the outcome of this matter, which could include fines or other sanctions.
We have received a preliminary inquiry from the Swiss Competition Commission regarding our pricing practices for resellers selling to customers in Switzerland and regarding certain alleged restrictions on reseller sales. The Commission is assessing whether such practices should be considered anti-competitive. This matter is in its preliminary stages and we are unable to predict the outcome. The Commission has authority to impose fines and other sanctions for such matters.
Important Information About Non-GAAP References
PTC provides non-GAAP supplemental information to its financial results. Non-GAAP revenue, operating expenses, margin and EPS exclude a fair value adjustment related to MKS deferred maintenance revenue, stock-based compensation expense, gain on litigation resolution, foreign currency transaction losses related to our acquisition of MKS and a litigation resolution, amortization of acquired intangible assets, acquired in-process research and development expense, acquisition-related expenses, restructuring charges, and the related tax effects of the preceding items and any one-time tax items. We use these non-GAAP measures, and we believe that they assist our investors, to make period-to-period comparisons of our operational performance because they provide a view of our operating results without items that are not, in our view, indicative of our core operating results. We believe that these non-GAAP measures help illustrate underlying trends in our business, and we use the measures to establish budgets and operational goals, communicated internally and externally, for managing our business and evaluating our performance. We believe that providing non-GAAP measures
affords investors a view of our operating results that may be more easily compared to the results of peer companies. In addition, compensation of our executives is based in part on the performance of our business based on these non-GAAP measures. However, non-GAAP information should not be construed as an alternative to GAAP information as the items excluded from the non-GAAP measures often have a material impact on PTC’s financial results. Management uses, and investors should consider, non-GAAP measures in conjunction with our GAAP results.
Forward-Looking Statements
Statements in these prepared remarks that are not historic facts, including statements about our second quarter and fiscal 2012 and other future financial and growth expectations, anticipated tax rates, the expected impact of our planned strategic investments and product releases on our future success, expected market growth rates and the long-term prospects for PTC are forward-looking statements that involve risks and uncertainties that could cause actual results to differ materially from those projected. These risks include the possibility that customers may not purchase our solutions when or at the rates we expect, the possibility the foreign currency exchange rates may vary from our expectations and thereby affect our reported revenue and expense, the possibility that we may not achieve the license, services or maintenance growth rates that we expect, which could result in a different mix of revenue between license, service and maintenance and could impact our EPS results, the possibility that strategic customer wins may not generate the revenue we expect, the possibility that our strategic investments, restructuring and realignment may not have the effects or generate the revenue growth or operating margin improvements we expect, the possibility that we will experience a shortfall in revenue that causes us to decrease or eliminate planned strategic investments in our business, the possibility that we may be unable to attain or maintain a technology leadership position or that any such leadership position may not generate the revenue we expect, the possibility that resource constraints could adversely affect our revenue, and the possibility that the MKS and 4CS businesses may not generate the revenues we expect. In addition, our assumptions concerning our future GAAP and non-GAAP effective income tax rates are based on estimates and other factors that could change, including the geographic mix of our revenue, expenses and profits and loans and cash repatriations from foreign subsidiaries. Other risks and uncertainties that could cause actual results to differ materially from those projected are detailed from time to time in reports we file with the Securities and Exchange Commission, including our Annual Report on Form 10-K and our Quarterly Reports on Form 10-Q.
|
NON-GAAP FINANCIAL MEASURES AND RECONCILIATIONS (UNAUDITED)
|
||||||||||||||||||||||||||||||||||||||||||||||||||||||||||||||||||||||||||||||||||||||||
|
(in thousands)
|
||||||||||||||||||||||||||||||||||||||||||||||||||||||||||||||||||||||||||||||||||||||||
|
GAAP MARGINS
|
||||||||||||||||||||||||||||||||||||||||||||||||||||||||||||||||||||||||||||||||||||||||
|
Q1 '10
|
Q2 '10
|
Q3 '10
|
Q4 '10
|
FY '10
|
Q1 '11
|
Q2 '11
|
Q3 '11
|
Q4 '11
|
FY '11
|
Q1 '12
|
||||||||||||||||||||||||||||||||||||||||||||||||||||||||||||||||||||||||||||||
|
Revenue
|
$ | 258,429 | $ | 240,556 | $ | 242,998 | $ | 268,066 | $ | 1,010,049 | $ | 266,552 | $ | 269,189 | $ | 291,783 | $ | 339,425 | $ | 1,166,949 | $ | 318,276 | ||||||||||||||||||||||||||||||||||||||||||||||||||||||||||||||||||
|
Cost of license revenue
|
8,147 | 8,232 | 7,621 | 7,047 | 31,047 | 5,954 | 6,558 | 7,617 | 8,663 | 28,792 | 7,659 | |||||||||||||||||||||||||||||||||||||||||||||||||||||||||||||||||||||||||||||
|
Cost of service revenue
|
70,524 | 68,934 | 67,090 | 70,100 | 276,648 | 80,107 | 75,213 | 82,792 | 89,864 | 327,976 | 90,560 | |||||||||||||||||||||||||||||||||||||||||||||||||||||||||||||||||||||||||||||
|
Gross Margin
|
$ | 179,758 | 69.6 | % | $ | 163,390 | 67.9 | % | $ | 168,287 | 69.3 | % | $ | 190,919 | 71.2 | % | $ | 702,354 | 69.5 | % | $ | 180,491 | 67.7 | % | $ | 187,418 | 69.6 | % | $ | 201,374 | 69.0 | % | $ | 240,898 | 71.0 | % | $ | 810,181 | 69.4 | % | $ | 220,057 | 69.1 | % | ||||||||||||||||||||||||||||||||||||||||||||
|
Sales & marketing
|
$ | 78,598 | 30.4 | % | $ | 75,137 | 31.2 | % | $ | 79,121 | 32.6 | % | $ | 84,676 | 31.6 | % | $ | 317,532 | 31.4 | % | $ | 84,521 | 31.7 | % | $ | 81,163 | 30.2 | % | $ | 89,106 | 30.5 | % | $ | 98,261 | 28.9 | % | $ | 353,051 | 30.3 | % | $ | 97,778 | 30.7 | % | ||||||||||||||||||||||||||||||||||||||||||||
|
Research & development
|
50,690 | 19.6 | % | 49,960 | 20.8 | % | 50,597 | 20.8 | % | 50,320 | 18.8 | % | 201,567 | 20.0 | % | 51,522 | 19.3 | % | 53,051 | 19.7 | % | 51,103 | 17.5 | % | 55,730 | 16.4 | % | 211,406 | 18.1 | % | 54,993 | 17.3 | % | |||||||||||||||||||||||||||||||||||||||||||||||||||||||
|
General & administrative
|
24,071 | 9.3 | % | 22,807 | 9.5 | % | 22,755 | 9.4 | % | 23,242 | 8.7 | % | 92,875 | 9.2 | % | 23,484 | 8.8 | % | 24,712 | 9.2 | % | 31,882 | 10.9 | % | 30,213 | 8.9 | % | 110,291 | 9.5 | % | 29,572 | 9.3 | % | |||||||||||||||||||||||||||||||||||||||||||||||||||||||
|
Amortization of acquired intangible assets
|
4,058 | 1.6 | % | 3,975 | 1.7 | % | 3,836 | 1.6 | % | 3,736 | 1.4 | % | 15,605 | 1.5 | % | 3,854 | 1.4 | % | 4,266 | 1.6 | % | 4,753 | 1.6 | % | 5,446 | 1.6 | % | 18,319 | 1.6 | % | 5,209 | 1.6 | % | |||||||||||||||||||||||||||||||||||||||||||||||||||||||
|
Operating Expenses
|
$ | 157,417 | 60.9 | % | $ | 151,879 | 63.1 | % | $ | 156,309 | 64.3 | % | $ | 161,974 | 60.4 | % | $ | 627,579 | 62.1 | % | $ | 163,381 | 61.3 | % | $ | 163,192 | 60.6 | % | $ | 176,844 | 60.6 | % | $ | 189,650 | 55.9 | % | $ | 693,067 | 59.4 | % | $ | 187,552 | 58.9 | % | ||||||||||||||||||||||||||||||||||||||||||||
|
GAAP Operating Margin
|
$ | 22,341 | 8.6 | % | $ | 11,511 | 4.8 | % | $ | 11,978 | 4.9 | % | $ | 28,945 | 10.8 | % | $ | 74,775 | 7.4 | % | $ | 17,110 | 6.4 | % | $ | 24,226 | 9.0 | % | $ | 24,530 | 8.4 | % | $ | 51,248 | 15.1 | % | $ | 117,114 | 10.0 | % | $ | 32,505 | 10.2 | % | ||||||||||||||||||||||||||||||||||||||||||||
|
ADJUSTMENTS TO DERIVE NON-GAAP MEASURES
|
||||||||||||||||||||||||||||||||||||||||||||||||||||||||||||||||||||||||||||||||||||||||
|
Q1 '10
|
Q2 '10
|
Q3 '10
|
Q4 '10
|
FY '10
|
Q1 '11
|
Q2 '11
|
Q3 '11
|
Q4 '11
|
FY '11
|
Q1 '12
|
||||||||||||||||||||||||||||||||||||||||||||||||||||||||||||||||||||||||||||||
|
Revenue:
|
||||||||||||||||||||||||||||||||||||||||||||||||||||||||||||||||||||||||||||||||||||||||
|
Fair value of deferred revenue
|
$ | - | 0.0 | % | $ | - | 0.0 | % | $ | - | 0.0 | % | $ | - | 0.0 | % | $ | - | 0.0 | % | $ | - | 0.0 | % | $ | - | 0.0 | % | $ | 693 | 0.2 | % | $ | 1,913 | 0.6 | % | $ | 2,606 | 0.2 | % | $ | 1,522 | 0.5 | % | ||||||||||||||||||||||||||||||||||||||||||||
|
Cost of license revenue:
|
||||||||||||||||||||||||||||||||||||||||||||||||||||||||||||||||||||||||||||||||||||||||
|
Acquired intangible amortization
|
4,898 | 1.9 | % | 4,928 | 2.0 | % | 4,659 | 1.9 | % | 3,882 | 1.4 | % | 18,367 | 1.8 | % | 3,363 | 1.3 | % | 3,339 | 1.2 | % | 3,895 | 1.3 | % | 4,796 | 1.4 | % | 15,393 | 1.3 | % | 4,103 | 1.3 | % | |||||||||||||||||||||||||||||||||||||||||||||||||||||||
|
Stock-based compensation
|
17 | 0.0 | % | 2 | 0.0 | % | 2 | 0.0 | % | 3 | 0.0 | % | 24 | 0.0 | % | 3 | 0.0 | % | 3 | 0.0 | % | 4 | 0.0 | % | 5 | 0.0 | % | 15 | 0.0 | % | 5 | 0.0 | % | |||||||||||||||||||||||||||||||||||||||||||||||||||||||
|
Cost of service revenue:
|
||||||||||||||||||||||||||||||||||||||||||||||||||||||||||||||||||||||||||||||||||||||||
|
Stock-based compensation
|
2,580 | 1.0 | % | 2,241 | 0.9 | % | 2,186 | 0.9 | % | 2,115 | 0.8 | % | 9,122 | 0.9 | % | 2,137 | 0.8 | % | 1,583 | 0.6 | % | 1,857 | 0.6 | % | 2,155 | 0.6 | % | 7,732 | 0.7 | % | 2,513 | 0.8 | % | |||||||||||||||||||||||||||||||||||||||||||||||||||||||
|
Sales & marketing:
|
||||||||||||||||||||||||||||||||||||||||||||||||||||||||||||||||||||||||||||||||||||||||
|
Stock-based compensation
|
3,074 | 1.2 | % | 3,520 | 1.5 | % | 3,471 | 1.4 | % | 3,367 | 1.3 | % | 13,432 | 1.3 | % | 2,429 | 0.9 | % | 2,350 | 0.9 | % | 3,062 | 1.0 | % | 3,587 | 1.1 | % | 11,428 | 1.0 | % | 3,728 | 1.2 | % | |||||||||||||||||||||||||||||||||||||||||||||||||||||||
|
Research & development:
|
||||||||||||||||||||||||||||||||||||||||||||||||||||||||||||||||||||||||||||||||||||||||
|
Stock-based compensation
|
2,659 | 1.0 | % | 2,383 | 1.0 | % | 2,252 | 0.9 | % | 2,186 | 0.8 | % | 9,480 | 0.9 | % | 2,393 | 0.9 | % | 1,749 | 0.6 | % | 2,010 | 0.7 | % | 2,395 | 0.7 | % | 8,547 | 0.7 | % | 2,549 | 0.8 | % | |||||||||||||||||||||||||||||||||||||||||||||||||||||||
|
General & administrative:
|
||||||||||||||||||||||||||||||||||||||||||||||||||||||||||||||||||||||||||||||||||||||||
|
Stock-based compensation
|
5,525 | 2.1 | % | 4,146 | 1.7 | % | 3,599 | 1.5 | % | 3,583 | 1.3 | % | 16,853 | 1.7 | % | 4,065 | 1.5 | % | 4,186 | 1.6 | % | 4,627 | 1.6 | % | 4,802 | 1.4 | % | 17,680 | 1.5 | % | 4,587 | 1.4 | % | |||||||||||||||||||||||||||||||||||||||||||||||||||||||
|
Acquisition-related costs
|
- | 0.0 | % | - | 0.0 | % | - | 0.0 | % | - | 0.0 | % | - | 0.0 | % | - | 0.0 | % | 608 | 0.2 | % | 6,041 | 2.1 | % | 1,112 | 0.3 | % | 7,761 | 0.7 | % | 2,068 | 0.6 | % | |||||||||||||||||||||||||||||||||||||||||||||||||||||||
|
Amortization of acquired intangible assets
|
4,058 | 1.6 | % | 3,975 | 1.7 | % | 3,836 | 1.6 | % | 3,736 | 1.4 | % | 15,605 | 1.5 | % | 3,854 | 1.4 | % | 4,266 | 1.6 | % | 4,753 | 1.6 | % | 5,446 | 1.6 | % | 18,319 | 1.6 | % | 5,209 | 1.6 | % | |||||||||||||||||||||||||||||||||||||||||||||||||||||||
|
Non-GAAP adjustments
|
$ | 22,811 | 8.8 | % | $ | 21,195 | 8.8 | % | $ | 20,005 | 8.2 | % | $ | 18,872 | 7.0 | % | $ | 82,883 | 8.2 | % | $ | 18,244 | 6.8 | % | $ | 18,084 | 6.7 | % | $ | 26,942 | 9.2 | % | $ | 26,211 | 7.7 | % | $ | 89,481 | 7.7 | % | $ | 26,284 | 8.3 | % | ||||||||||||||||||||||||||||||||||||||||||||
|
NON-GAAP MARGINS
|
||||||||||||||||||||||||||||||||||||||||||||||||||||||||||||||||||||||||||||||||||||||||
|
Q1 '10
|
Q2 '10
|
Q3 '10
|
Q4 '10
|
FY '10
|
Q1 '11
|
Q2 '11
|
Q3 '11
|
Q4 '11
|
FY '11
|
Q1 '12
|
||||||||||||||||||||||||||||||||||||||||||||||||||||||||||||||||||||||||||||||
|
Revenue
|
$ | 258,429 | $ | 240,556 | $ | 242,998 | $ | 268,066 | $ | 1,010,049 | $ | 266,552 | $ | 269,189 | $ | 292,476 | $ | 341,338 | $ | 1,169,555 | $ | 319,798 | ||||||||||||||||||||||||||||||||||||||||||||||||||||||||||||||||||
|
Cost of license revenue
|
3,232 | 3,302 | 2,960 | 3,162 | 12,656 | 2,588 | 3,216 | 3,718 | 3,862 | 13,384 | 3,551 | |||||||||||||||||||||||||||||||||||||||||||||||||||||||||||||||||||||||||||||
|
Cost of service revenue
|
67,944 | 66,693 | 64,904 | 67,985 | 267,526 | 77,970 | 73,630 | 80,935 | 87,709 | 320,244 | 88,047 | |||||||||||||||||||||||||||||||||||||||||||||||||||||||||||||||||||||||||||||
|
Gross Margin
|
$ | 187,253 | 72.5 | % | $ | 170,561 | 70.9 | % | $ | 175,134 | 72.1 | % | $ | 196,919 | 73.5 | % | $ | 729,867 | 72.3 | % | $ | 185,994 | 69.8 | % | $ | 192,343 | 71.5 | % | $ | 207,823 | 71.1 | % | $ | 249,767 | 73.2 | % | $ | 835,927 | 71.5 | % | $ | 228,200 | 71.4 | % | ||||||||||||||||||||||||||||||||||||||||||||
|
Sales & marketing
|
$ | 75,524 | 29.2 | % | $ | 71,617 | 29.8 | % | $ | 75,650 | 31.1 | % | $ | 81,309 | 30.3 | % | $ | 304,100 | 30.1 | % | $ | 82,092 | 30.8 | % | $ | 78,813 | 29.3 | % | $ | 86,044 | 29.4 | % | $ | 94,674 | 27.7 | % | $ | 341,623 | 29.2 | % | $ | 94,050 | 29.4 | % | ||||||||||||||||||||||||||||||||||||||||||||
|
Research & development
|
48,031 | 18.6 | % | 47,577 | 19.8 | % | 48,345 | 19.9 | % | 48,134 | 18.0 | % | 192,087 | 19.0 | % | 49,129 | 18.4 | % | 51,302 | 19.1 | % | 49,093 | 16.8 | % | 53,335 | 15.6 | % | 202,859 | 17.3 | % | 52,444 | 16.4 | % | |||||||||||||||||||||||||||||||||||||||||||||||||||||||
|
General & administrative
|
18,546 | 7.2 | % | 18,661 | 7.8 | % | 19,156 | 7.9 | % | 19,659 | 7.3 | % | 76,022 | 7.5 | % | 19,419 | 7.3 | % | 19,918 | 7.4 | % | 21,214 | 7.3 | % | 24,299 | 7.1 | % | 84,850 | 7.3 | % | 22,917 | 7.2 | % | |||||||||||||||||||||||||||||||||||||||||||||||||||||||
|
Amortization of acquired intangible assets
|
- | 0.0 | % | - | 0.0 | % | - | 0.0 | % | - | 0.0 | % | - | 0.0 | % | - | 0.0 | % | - | 0.0 | % | - | 0.0 | % | - | 0.0 | % | - | 0.0 | % | - | 0.0 | % | |||||||||||||||||||||||||||||||||||||||||||||||||||||||
|
Operating Expenses
|
$ | 142,101 | 55.0 | % | $ | 137,855 | 57.3 | % | $ | 143,151 | 58.9 | % | $ | 149,102 | 55.6 | % | $ | 572,209 | 56.7 | % | $ | 150,640 | 56.5 | % | $ | 150,033 | 55.7 | % | $ | 156,351 | 53.5 | % | $ | 172,308 | 50.5 | % | $ | 629,332 | 53.8 | % | $ | 169,411 | 53.0 | % | ||||||||||||||||||||||||||||||||||||||||||||
|
Non-GAAP Operating Margin
|
$ | 45,152 | 17.5 | % | $ | 32,706 | 13.6 | % | $ | 31,983 | 13.2 | % | $ | 47,817 | 17.8 | % | $ | 157,658 | 15.6 | % | $ | 35,354 | 13.3 | % | $ | 42,310 | 15.7 | % | $ | 51,472 | 17.6 | % | $ | 77,459 | 22.7 | % | $ | 206,595 | 17.7 | % | $ | 58,789 | 18.4 | % | ||||||||||||||||||||||||||||||||||||||||||||
|
PARAMETRIC TECHNOLOGY CORPORATION
|
||||||||||||
|
NON-GAAP FINANCIAL MEASURES AND RECONCILIATIONS (UNAUDITED)
|
||||||||||||
|
(in thousands, except per share data)
|
||||||||||||
|
Three Months Ended
|
||||||||||||
|
December 31,
|
January 1,
|
|||||||||||
|
2011
|
2011
|
|||||||||||
|
GAAP gross margin
|
$ | 220,057 | $ | 180,491 | ||||||||
|
Fair value of acquired MKS deferred maintenance
|
||||||||||||
|
revenue
|
1,522 | - | ||||||||||
|
Stock-based compensation
|
2,518 | 2,140 | ||||||||||
|
Amortization of acquired intangible assets
|
||||||||||||
|
included in cost of license revenue
|
4,103 | 3,363 | ||||||||||
|
Non-GAAP gross margin
|
$ | 228,200 | $ | 185,994 | ||||||||
|
GAAP operating income
|
$ | 32,505 | $ | 17,110 | ||||||||
|
Fair value of acquired MKS deferred maintenance
|
||||||||||||
|
revenue
|
1,522 | - | ||||||||||
|
Stock-based compensation
|
13,382 | 11,027 | ||||||||||
|
Amortization of acquired intangible assets
|
||||||||||||
|
included in cost of license revenue
|
4,103 | 3,363 | ||||||||||
|
Amortization of acquired intangible assets
|
5,209 | 3,854 | ||||||||||
|
Acquisition-related charges included in
|
||||||||||||
|
general and administrative expenses
|
2,068 | - | ||||||||||
|
Non-GAAP operating income (1)
|
$ | 58,789 | $ | 35,354 | ||||||||
|
GAAP net income
|
$ | 22,123 | $ | 13,260 | ||||||||
|
Fair value of acquired MKS deferred maintenance
|
||||||||||||
|
revenue
|
1,522 | - | ||||||||||
|
Stock-based compensation
|
13,382 | 11,027 | ||||||||||
|
Amortization of acquired intangible assets
|
||||||||||||
|
included in cost of license revenue
|
4,103 | 3,363 | ||||||||||
|
Amortization of acquired intangible assets
|
5,209 | 3,854 | ||||||||||
|
Acquisition-related charges included in
|
||||||||||||
|
general and administrative expenses
|
2,068 | - | ||||||||||
|
Non-operating foreign currency transaction loss (2)
|
761 | 722 | ||||||||||
|
Income tax adjustments (3)
|
(6,678 | ) | (5,810 | ) | ||||||||
|
Non-GAAP net income
|
$ | 42,490 | $ | 26,416 | ||||||||
|
GAAP diluted earnings per share
|
$ | 0.18 | $ | 0.11 | ||||||||
|
Stock-based compensation
|
0.11 | 0.09 | ||||||||||
|
Income tax adjustments
|
(0.06 | ) | (0.05 | ) | ||||||||
|
Acquisition-related charge
|
0.02 | - | ||||||||||
|
All other items identified above
|
0.10 | 0.07 | ||||||||||
|
Non-GAAP diluted earnings per share
|
$ | 0.35 | $ | 0.22 | ||||||||
| (1 | ) |
Operating margin impact of non-GAAP adjustments:
|
||||||||||
|
Three Months Ended
|
||||||||||||
|
December 31,
|
January 1,
|
|||||||||||
| 2011 | 2011 | |||||||||||
|
GAAP operating margin
|
10.2 | % | 6.4 | % | ||||||||
|
Fair value of deferred maintenance revenue
|
0.5 | % | 0.0 | % | ||||||||
|
Stock-based compensation
|
4.2 | % | 4.2 | % | ||||||||
|
Amortization of acquired intangibles
|
2.9 | % | 2.7 | % | ||||||||
|
Acquisition-related charges
|
0.6 | % | 0.0 | % | ||||||||
|
Non-GAAP operating margin
|
18.4 | % | 13.3 | % | ||||||||
| (2 | ) |
In the first quarter of 2012 we recorded $0.8 million of foreign currency transaction losses related to MKS legal entity mergers completed during the quarter. In the first quarter of 2011 we recorded $0.7 million of foreign currency losses related to a previously announced litigation settlement in Japan.
|
||||||||||
| (3 | ) |
Reflects the tax effects of non-GAAP adjustments for the first quarter of 2012 and 2011, which are calculated by applying the applicable tax rate by jurisdiction to the non-GAAP adjustments listed above, as well as a one-time non-cash charge of $1.4 million related to the impact from a reduction in the statutory tax rate in Japan on deferred tax assets from a litigation settlement.
|
||||||||||