Attached files
| file | filename |
|---|---|
| EX-99.1 - EXHIBIT 99.1 - SCHNITZER STEEL INDUSTRIES, INC. | a50133376ex991.htm |
| 8-K - SCHNITZER STEEL INDUSTRIES, INC. 8-K - SCHNITZER STEEL INDUSTRIES, INC. | a50133376.htm |
Exhibit 99.2

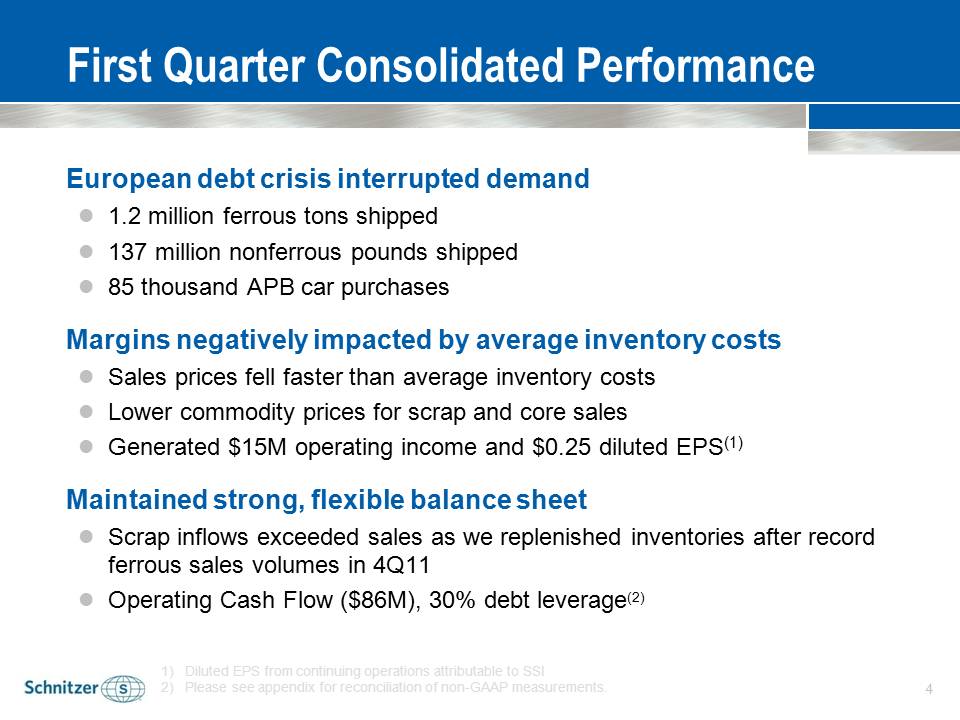
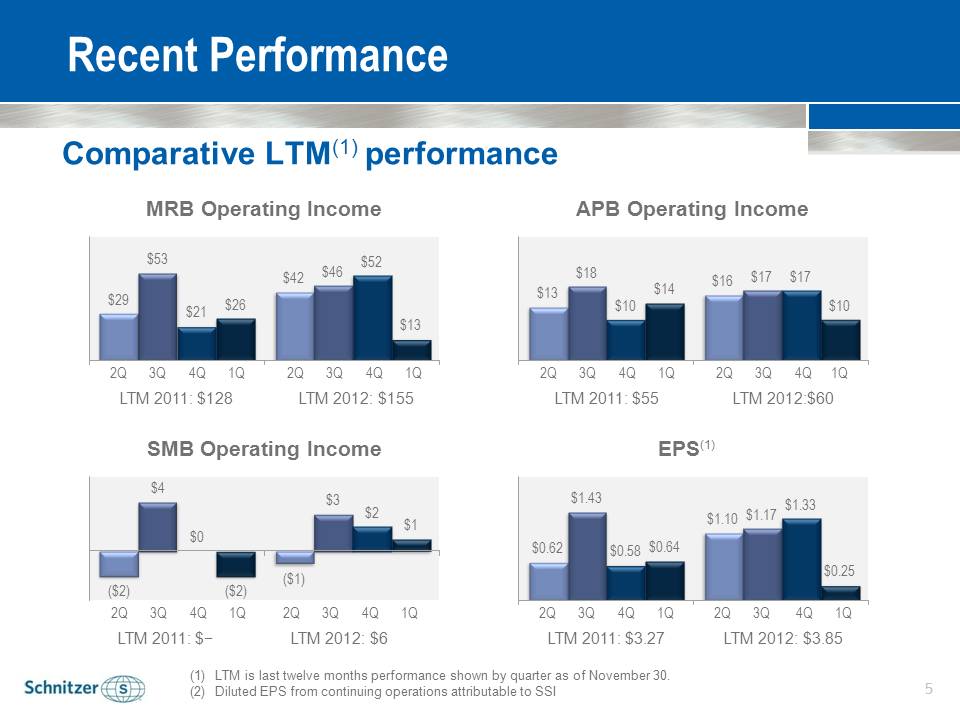
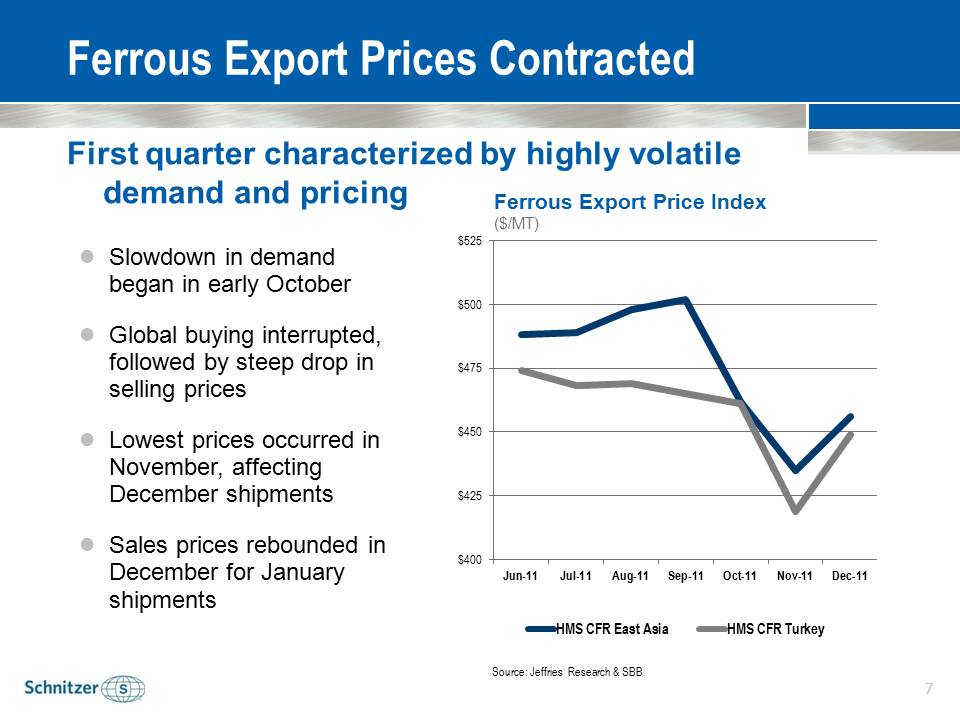
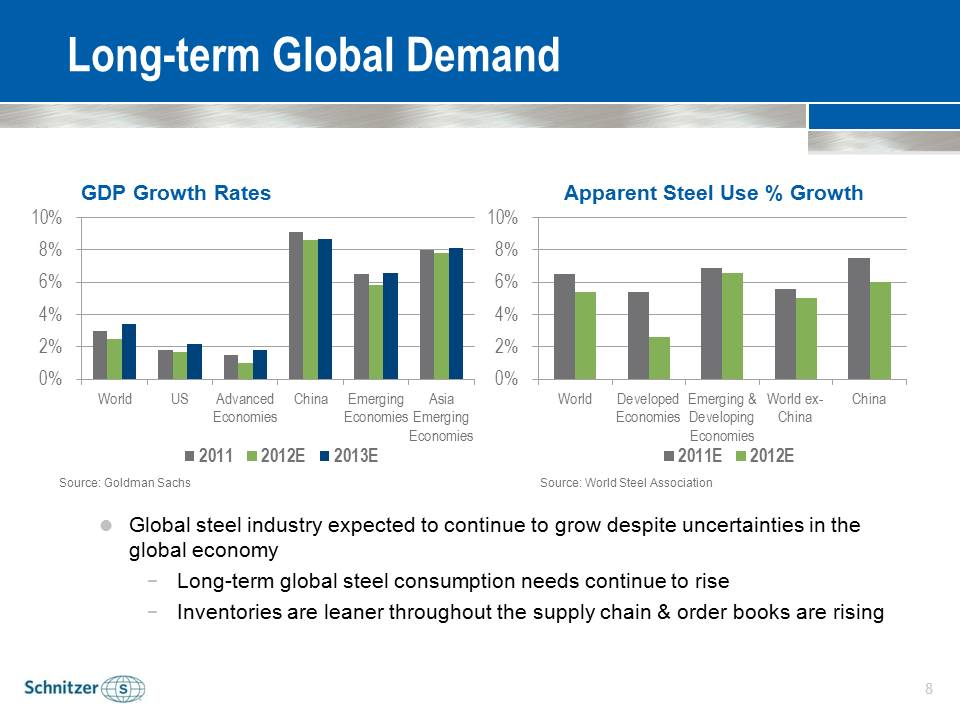
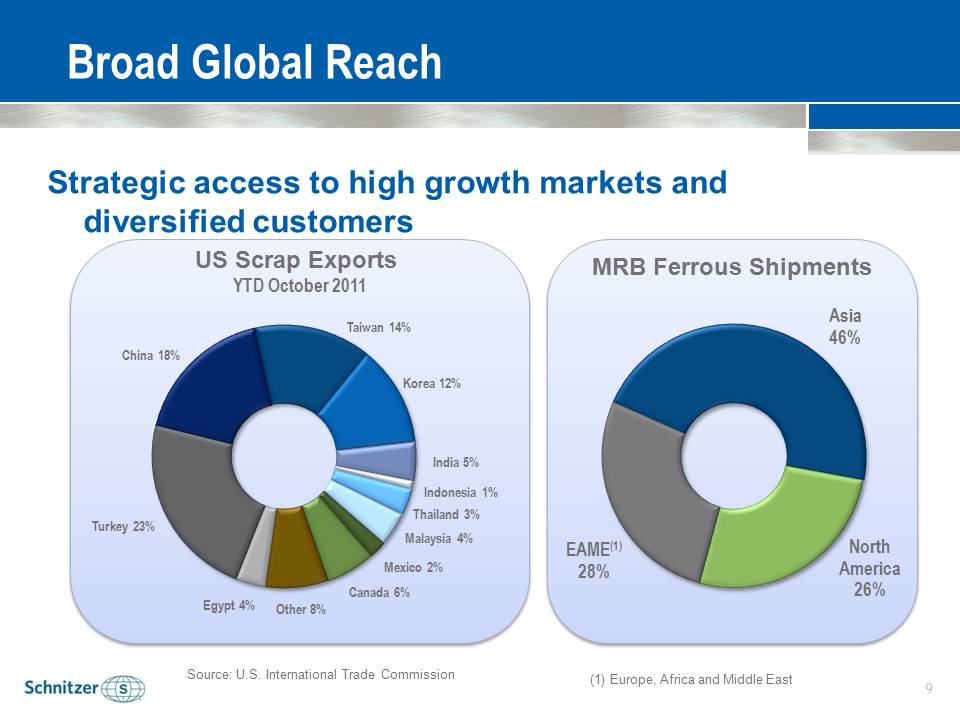
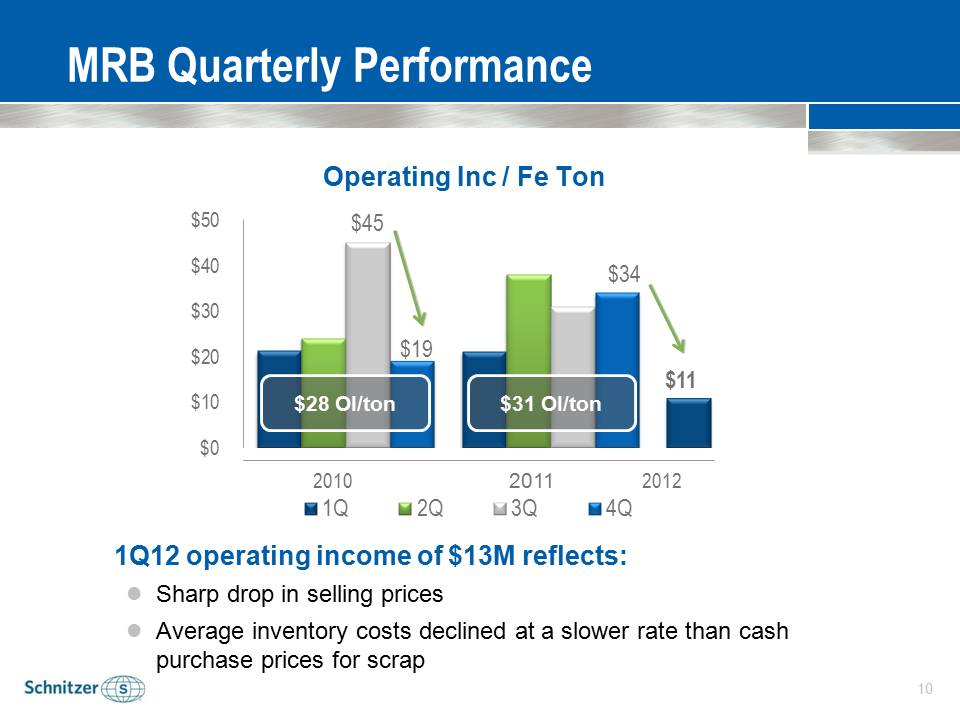
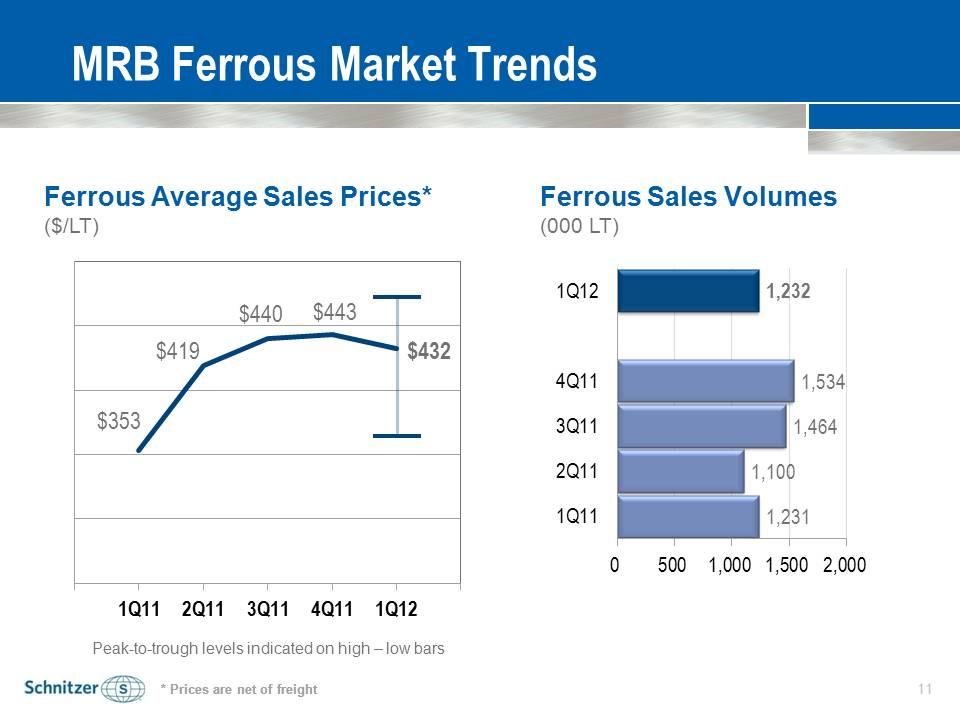
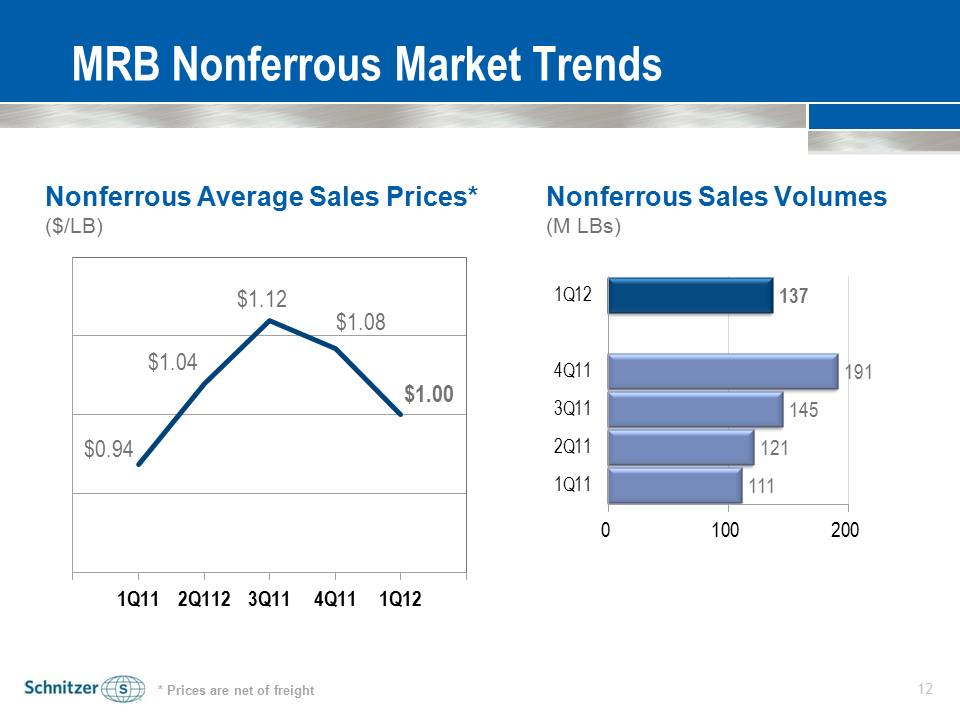
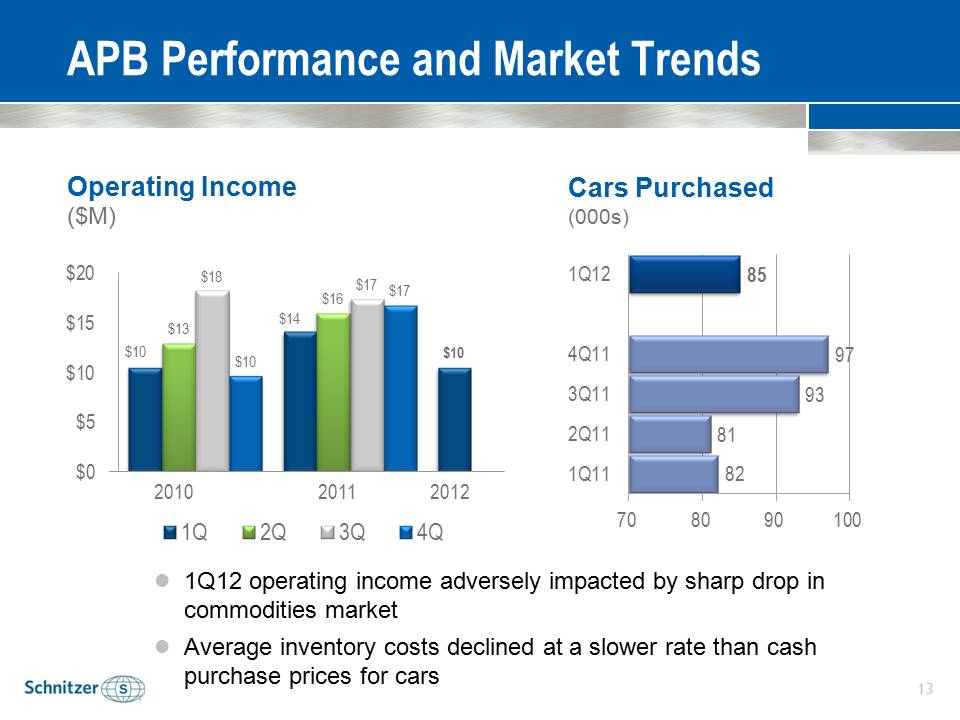
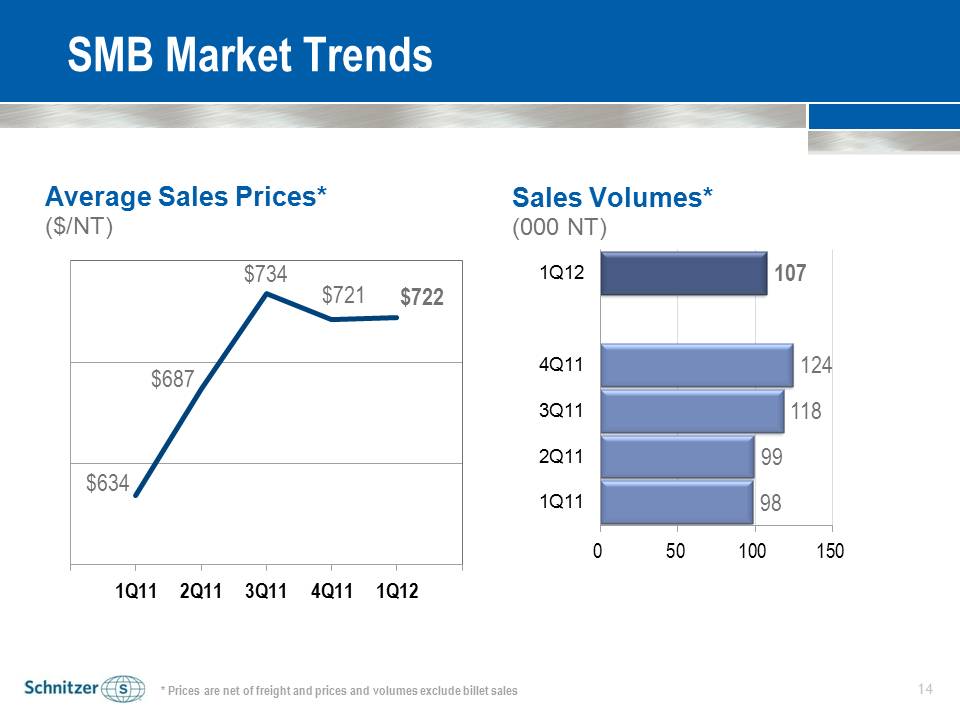
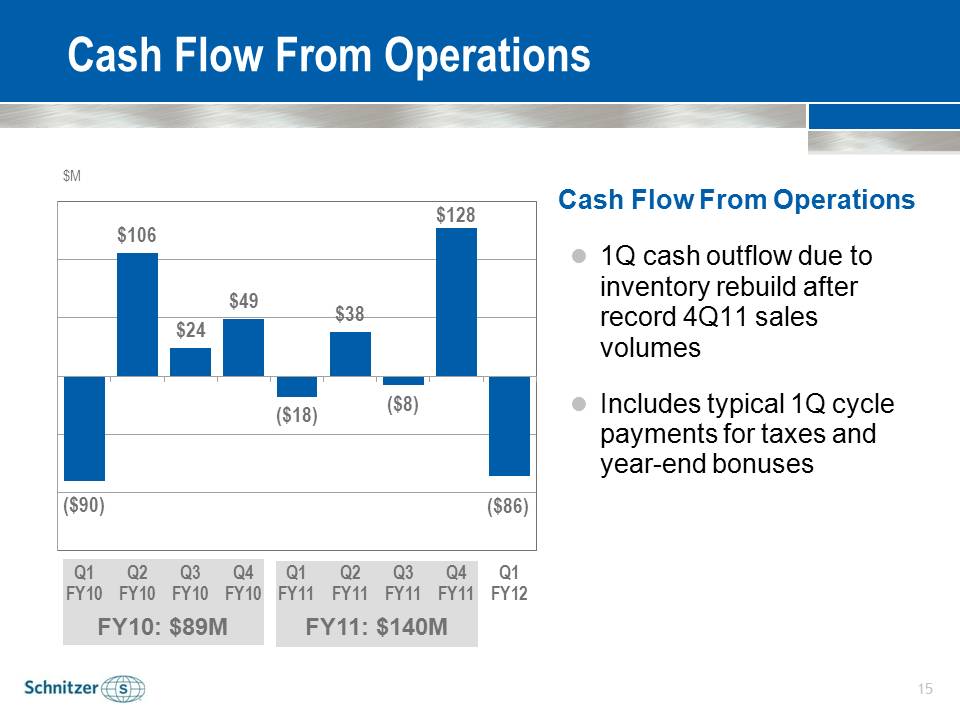
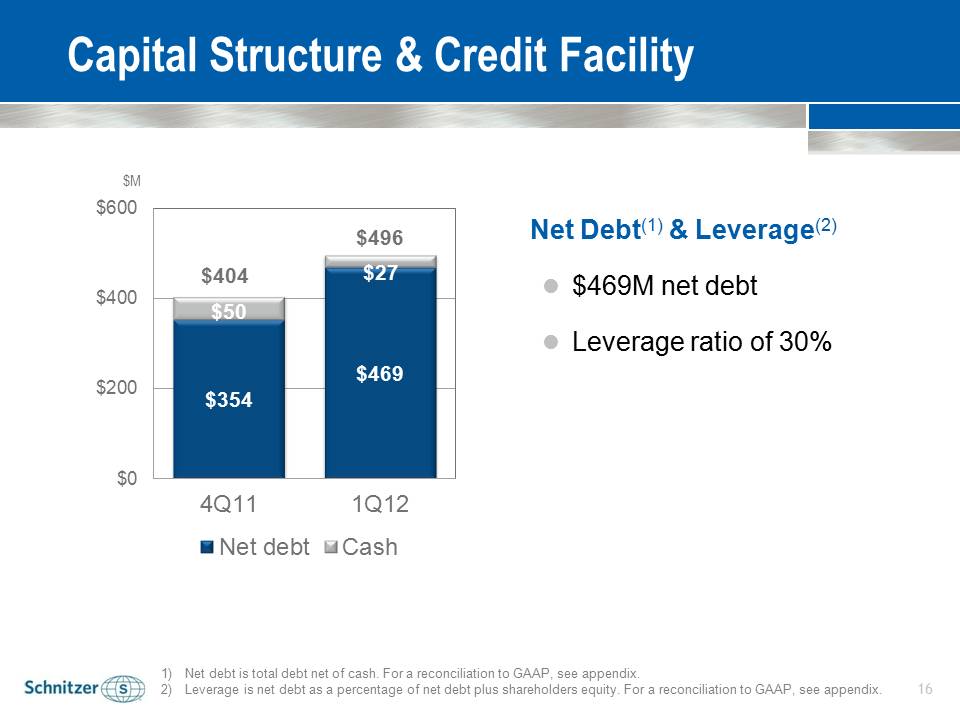
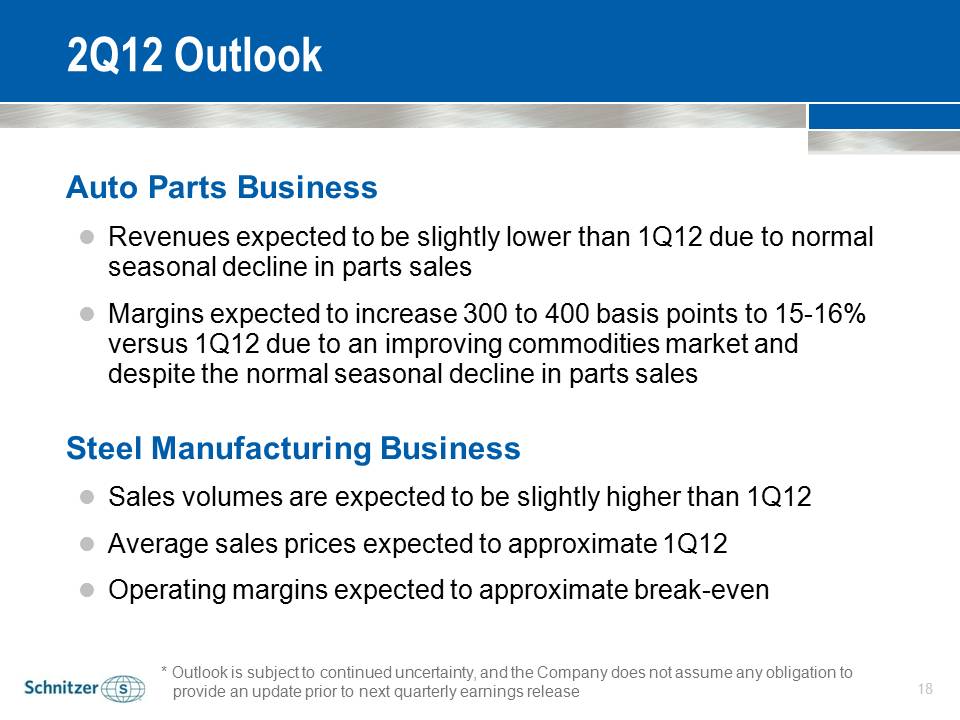

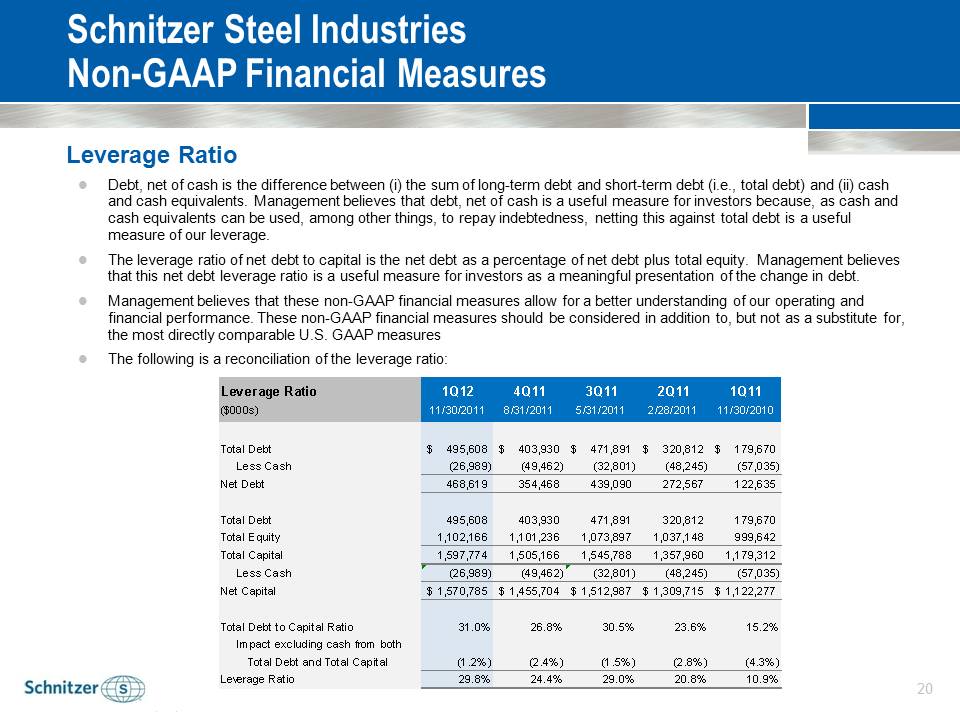
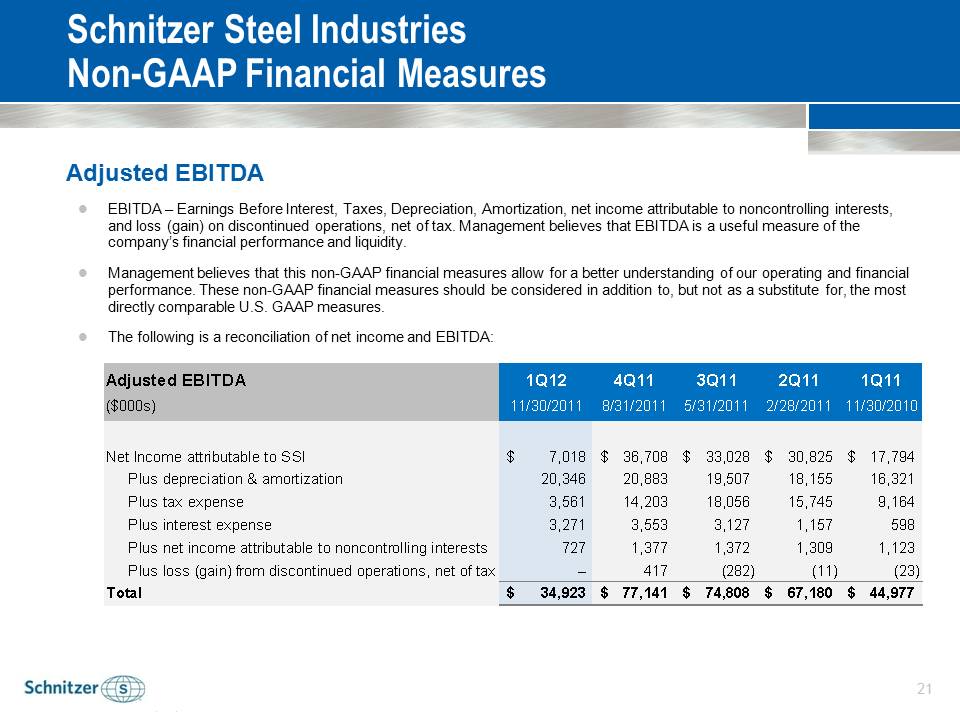
Schnitzer Steel Industries, Inc. First Quarter Fiscal 2012: Earnings Conference Call January 2012 Safe Harbor Statements and information included in this presentation that are not purely historical are forward-looking statements within the meaning of Section 21E of the Securities Exchange Act of 1934 and are made pursuant to the “safe harbor” provisions of the Private Securities Litigation Reform Act of 1995. Forward-looking statements in this presentation include statements regarding our expectations, intentions, beliefs and strategies regarding the future, including statements regarding trends, cyclicality and changes in the markets we sell into; strategic direction; changes to manufacturing and production processes; the cost of compliance with environmental and other laws; expected tax rates, deductions and credits; the realization of deferred tax assets; planned capital expenditures; liquidity positions; ability to generate cash from continuing operations; the potential impact of adopting new accounting pronouncements; expected results, including pricing, sales volumes and profitability; obligations under our retirement plans; savings or additional costs from business realignment and cost containment programs; and the adequacy of accruals. When used in this presentation, the words “believes,” “expects,” “anticipates,” “intends,” “assumes,” “estimates,” “evaluates,” “may,” “could,” “opinions,” “forecasts,” “future,” “forward,” “potential,” “probable,” and similar expressions are intended to identify forward-looking statements. We may make other forward-looking statements from time to time, including in reports filed with the Securities and Exchange Commission, press releases, and public conference calls. All forward-looking statements we make are based on information available to us at the time the statements are made, and we assume no obligation to update any forward-looking statements, except as may be required by law. Our business is subject to the effects of changes in domestic and world economic conditions and a number of other risks and uncertainties that could cause actual results to differ materially from those included in, or implied by, such forward-looking statements. Some of these risks and uncertainties are discussed in "Risk Factors" and "Management's Discussion and Analysis of Financial Condition and Results of Operations" in our most recent annual report on Form 10-K and quarterly report on Form 10-Q. Examples of these risks include: potential environmental cleanup costs related to the Portland Harbor Superfund site; volatile supply and demand conditions affecting prices and volumes in the markets for both our products and raw materials we purchase; difficulties associated with acquisitions and integration of acquired businesses; the impact of goodwill impairment charges; the inability of customers to fulfill their contractual obligations; the impact of foreign currency fluctuations; potential limitations on ability to access credit facilities; the impact of the consolidation in the steel industry; the impact of imports of foreign steel into the U.S.; inability to realize expected benefits from investments in technology; freight rates and availability of transportation; product liability claims; costs associated with compliance with environmental regulations; the adverse impact of climate change; inability to obtain or renew business licenses and permits; compliance with greenhouse gas emission regulations; reliance on employees subject to collective bargaining agreements; and the impact of the underfunded status of multiemployer plans in which we participate. First Quarter 2012 Performance .Consolidated Highlights versus Prior Year (PY) .Operating Performance & Market Trends –Metals Recycling Business (MRB) –Auto Parts Business (APB) –Steel Manufacturing Business (SMB) .Cash Flow & Capital Structure .2Q12 Outlook .European debt crisis interrupted demand .1.2 million ferrous tons shipped .137 million nonferrous pounds shipped .85 thousand APB car purchases .Margins negatively impacted by average inventory costs .Sales prices fell faster than average inventory costs .Lower commodity prices for scrap and core sales .Generated $15M operating income and $0.25 diluted EPS(1) .Maintained strong, flexible balance sheet .Scrap inflows exceeded sales as we replenished inventories after record ferrous sales volumes in 4Q11 .Operating Cash Flow ($86M), 30% debt leverage(2) First Quarter Consolidated Performance 1)Diluted EPS from continuing operations attributable to SSI 2)Please see appendix for reconciliation of non-GAAP measurements. Recent Performance Comparative LTM(1) performance (1)LTM is last twelve months performance shown by quarter as of November 30. (2)Diluted EPS from continuing operations attributable to SSI 1Q 2Q 3Q 4Q $29 $42 $53 $46 $21 $52 $26 $13 MRB Operating Income 2Q 3Q 4Q 1Q 2Q 3Q 4Q 1Q 1Q 2Q 3Q 4Q $13 $16 $18 $17 $10 $17 $14 $10 APB Operating Income 2Q 3Q 4Q 1Q 2Q 3Q 4Q 1Q 1Q 2Q 3Q 4Q ($2) ($1) $4 $3 $0 $2 ($2) $1 SMB Operating Income 2Q 3Q 4Q 1Q 2Q 3Q 4Q 1Q 1Q 2Q 3Q 4Q $0.62 $1.10 $1.43 $1.17 $0.58 $1.33 $0.64 $0.25 EPS(1) 2Q 3Q 4Q 1Q 2Q 3Q 4Q 1Q LTM 2011: $128 LTM 2012: $155 LTM 2011: $55 LTM 2012:$60 LTM.2011:.$- LTM 2012: $6 LTM 2011: $3.27 LTM 2012: $3.85 First Quarter Market Conditions First quarter impacted by macroeconomic uncertainty, driven primarily by European debt crisis .Temporary slowdown in global buying patterns for recycled metals –During October we experienced a several week suspension of buying by global customers –Demand resumed during the latter part of the quarter, but at lower levels for volumes and prices .Prices are approaching 4Q11 levels and improvements expected to benefit performance in January and February Ferrous Export Prices Contracted First quarter characterized by highly volatile demand and pricing .Slowdown in demand began in early October .Global buying interrupted, followed by steep drop in selling prices .Lowest prices occurred in November, affecting December shipments .Sales prices rebounded in December for January shipments $400 $425 $450 $475 $500 $525 Jun-11 Jul-11 Aug-11 Sep-11 Oct-11 Nov-11 Dec-11 HMS CFR East Asia HMS CFR Turkey Source: Jeffries Research & SBB Ferrous Export Price Index ($/MT) Long-term Global Demand 0% 2% 4% 6% 8% 10% World US Advanced Economies China Emerging Economies Asia Emerging Economies 2011 2012E 2013E .Global steel industry expected to continue to grow despite uncertainties in the global economy -Long-term global steel consumption needs continue to rise -Inventories are leaner throughout the supply chain & order books are rising 0% 2% 4% 6% 8% 10% World Developed Economies Emerging & Developing Economies World ex- China China 2011E 2012E Source: Goldman Sachs Source: World Steel Association GDP Growth Rates Apparent Steel Use % Growth Strategic access to high growth markets and diversified customers Broad Global Reach MRB Ferrous Shipments Asia 46% North America 26% EAME(1) 28% (1) Europe, Africa and Middle East Source: U.S. International Trade Commission US Scrap Exports YTD October 2011 Egypt 4% Turkey 23% China 18% Taiwan 14% Korea 12% India 5% Indonesia 1% Thailand 3% Malaysia 4% Mexico 2% Canada 6% Other 8% Operating Inc / Fe Ton MRB Quarterly Performance $11 $45 $19 $34 $0 $10 $20 $30 $40 $50 1Q 2Q 3Q 4Q $31 OI/ton $28 OI/ton 1Q12 operating income of $13M reflects: .Sharp drop in selling prices .Average inventory costs declined at a slower rate than cash purchase prices for scrap 2010 2011 2012 $353 $419 $440 $443 $432 1Q11 2Q11 3Q11 4Q11 1Q12 1,231 1,100 1,464 1,534 1,232 0 500 1,000 1,500 2,000 1Q11 2Q11 3Q11 4Q11 1Q12 MRB Ferrous Market Trends Ferrous Average Sales Prices* ($/LT) Ferrous Sales Volumes (000 LT) * Prices are net of freight * Prices are net of freight Peak-to-trough levels indicated on high – low bars $0.94 $1.04 $1.12 $1.08 $1.00 1Q11 2Q112 3Q11 4Q11 1Q12 Nonferrous Average Sales Prices* ($/LB) MRB Nonferrous Market Trends Nonferrous Sales Volumes (M LBs) * Prices are net of freight 111 121 145 191 137 0 100 200 1Q11 2Q11 3Q11 4Q11 1Q12 $10 $14 $10 $13 $16 $18 $17 $10 $17 $0 $5 $10 $15 $20 1Q 2Q 3Q 4Q Operating Income .($M) APB Performance and Market Trends Cars Purchased (000s) 82 81 93 97 85 70 80 90 100 1Q11 2Q11 3Q11 4Q11 1Q12 2010 2011 2012 .1Q12 operating income adversely impacted by sharp drop in commodities market .Average inventory costs declined at a slower rate than cash purchase prices for cars $634 $687 $734 $721 $722 1Q11 2Q11 3Q11 4Q11 1Q12 Sales Volumes* (000 NT) Average Sales Prices* ($/NT) SMB Market Trends * Prices are net of freight and prices and volumes exclude billet sales 98 99 118 124 107 0 50 100 150 1Q11 2Q11 3Q11 4Q11 1Q12 Cash Flow From Operations Cash Flow From Operations .1Q cash outflow due to inventory rebuild after record 4Q11 sales volumes .Includes typical 1Q cycle payments for taxes and year-end bonuses ($90) $106 $24 $49 ($18) $38 ($8) $128 ($86) Q1 FY10 Q2 FY10 Q3 FY10 Q4 FY10 Q1 FY11 Q2 FY11 Q3 FY11 Q4 FY11 Q1 FY12 FY10: $89M FY11: $140M $M Capital Structure & Credit Facility Net Debt(1) & Leverage(2) .$469M net debt .Leverage ratio of 30% 1)Net debt is total debt net of cash. For a reconciliation to GAAP, see appendix. 2)Leverage is net debt as a percentage of net debt plus shareholders equity. For a reconciliation to GAAP, see appendix. $M $354 $469 $50 $27 $404 $496 $0 $200 $400 $600 4Q11 1Q12 Net debt Cash Metals Recycling Business .Sales volumes –Ferrous and nonferrous volumes expected to increase slightly from 1Q12 .Sales prices –Ferrous and nonferrous average net selling prices expected to approximate 1Q12 .Margins –Operating income per ferrous ton expected to approximately double 1Q12 2Q12 Outlook * Outlook is subject to continued uncertainty, and the Company does not assume any obligation to provide an update prior to next quarterly earnings release steel stripe Auto Parts Business .Revenues expected to be slightly lower than 1Q12 due to normal seasonal decline in parts sales .Margins expected to increase 300 to 400 basis points to 15-16% versus 1Q12 due to an improving commodities market and despite the normal seasonal decline in parts sales Steel Manufacturing Business .Sales volumes are expected to be slightly higher than 1Q12 .Average sales prices expected to approximate 1Q12 .Operating margins expected to approximate break-even 2Q12 Outlook * Outlook is subject to continued uncertainty, and the Company does not assume any obligation to provide an update prior to next quarterly earnings release PPT Schnitzer log steel stripe Question & Answer Session Appendix Schnitzer Steel Industries Non-GAAP Financial Measures Leverage Ratio .Debt, net of cash is the difference between (i) the sum of long-term debt and short-term debt (i.e., total debt) and (ii) cash and cash equivalents. Management believes that debt, net of cash is a useful measure for investors because, as cash and cash equivalents can be used, among other things, to repay indebtedness, netting this against total debt is a useful measure of our leverage. .The leverage ratio of net debt to capital is the net debt as a percentage of net debt plus total equity. Management believes that this net debt leverage ratio is a useful measure for investors as a meaningful presentation of the change in debt. .Management believes that these non-GAAP financial measures allow for a better understanding of our operating and financial performance. These non-GAAP financial measures should be considered in addition to, but not as a substitute for, the most directly comparable U.S. GAAP measures .The following is a reconciliation of the leverage ratio: Schnitzer Steel Industries Non-GAAP Financial Measures Adjusted EBITDA .EBITDA – Earnings Before Interest, Taxes, Depreciation, Amortization, net income attributable to noncontrolling interests, and loss (gain) on discontinued operations, net of tax. Management believes that EBITDA is a useful measure of the company’s.financial.performance.and.liquidity. .Management believes that this non-GAAP financial measures allow for a better understanding of our operating and financial performance. These non-GAAP financial measures should be considered in addition to, but not as a substitute for, the most directly comparable U.S. GAAP measures. .The following is a reconciliation of net income and EBITDA: