Attached files
| file | filename |
|---|---|
| 8-K - FORM 8-K - VISTEON CORP | d280990d8k.htm |
Exhibit 99.1

Visteon Corporation
Deutsche Bank Global Automotive Industry Conference
January 11, 2012
Visteon Overview
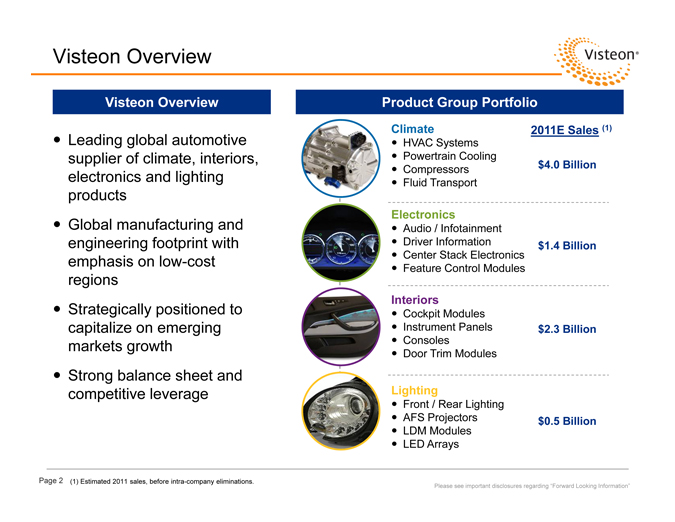
Visteon Overview
Leading global automotive supplier of climate, interiors, electronics and lighting products Global manufacturing and engineering footprint with emphasis on low-cost regions Strategically positioned to capitalize on emerging markets growth Strong balance sheet and competitive leverage
Product Group Portfolio
Climate 2011E Sales (1)
HVAC Systems Powertrain Cooling
Compressors $4.0 Billion
Fluid Transport
Electronics
Audio / Infotainment
Driver Information $1.4 Billion Center Stack Electronics Feature Control Modules
Interiors
Cockpit Modules
Instrument Panels $2.3 Billion Consoles Door Trim Modules
Lighting
Front / Rear Lighting
AFS Projectors $0.5 Billion LDM Modules LED Arrays
Page 2 (1) Estimated 2011 sales, before intra-company eliminations.
Please see important disclosures regarding “Forward Looking Information”
2011 Highlights
Operational
Solid Performance in Turbulent Year
Page 3
Please see important disclosures regarding “Forward Looking Information”
Awarded more than $1 billion in new business – all-time record as percentage of sales Three-year backlog of approximately $1 billion – 42 percent higher than 2010 Launched new facilities and expansions in Morocco, Russia, China, India and Indonesia Improved percent of hourly workforce outside of high-cost countries to 75 from 70 in 2009 Maintained best-in-class safety metrics Improved quality by more than 35 percent Earned quality / performance awards from Ford, Mahindra, Maruti Suzuki, Nissan, Toyota Received PACE Award nomination for innovative zero-leak fitting (Climate) Made significant senior management changes
2011 Highlights (cont’d)
Financial
Asset Optimization
Solid Performance in Turbulent Year
Page 4
Please see important disclosures regarding “Forward Looking Information” and “Use of Non-GAAP Financial Information”
Re-listed on NYSE on January 10
Added to Russell 1000® Index on June 27
Increased margins expected for Electronics, Interiors and Lighting product groups Expect record full-year Adjusted EBITDA
Maintained strongest balance sheet since spin
Committed to fund 2012 and part of 2013 pension obligation with shares
Completed sale of portion of investment in Duckyang joint venture Signed non-binding MOU to sell majority of Interiors business to YFV Announced intent to sell Grace Lake Corporate Center
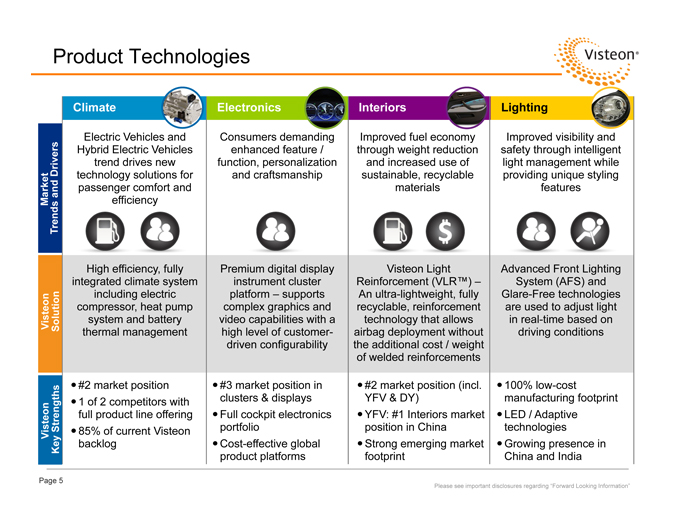
Product Technologies
Visteon Visteon Market Key Strengths Solution Trends and Drivers
Climate Electronics Interiors Lighting
Electric Vehicles and Consumers demanding Improved fuel economy Improved visibility and Hybrid Electric Vehicles enhanced feature / through weight reduction safety through intelligent trend drives new function, personalization and increased use of light management while technology solutions for and craftsmanship sustainable, recyclable providing unique styling passenger comfort and materials features efficiency
High efficiency, fully Premium digital display Visteon Light Advanced Front Lighting integrated climate system instrument cluster Reinforcement (VLR™) – System (AFS) and including electric platform – supports An ultra-lightweight, fully Glare-Free technologies compressor, heat pump complex graphics and recyclable, reinforcement are used to adjust light system and battery video capabilities with a technology that allows in real-time based on thermal management high level of customer- airbag deployment without driving conditions driven configurability the additional cost / weight of welded reinforcements #2 market position #3 market position in #2 market position (incl. 100% low-cost 1 of 2 competitors with clusters & displays YFV & DY) manufacturing footprint full product line offering Full cockpit electronics YFV: #1 Interiors market LED / Adaptive 85% of current Visteon portfolio position in China technologies backlog Cost-effective global Strong emerging market Growing presence in product platforms footprint China and India
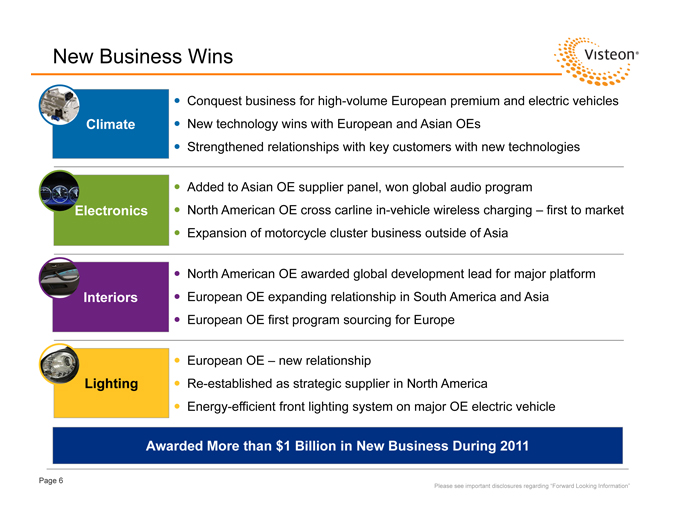
New Business Wins
Awarded More than $1 Billion in New Business During 2011
Page 6
Please see important disclosures regarding “Forward Looking Information”
Conquest business for high-volume European premium and electric vehicles Climate New technology wins with European and Asian OEs Strengthened relationships with key customers with new technologies
Added to Asian OE supplier panel, won global audio program
Electronics North American OE cross carline in-vehicle wireless charging – first to market Expansion of motorcycle cluster business outside of Asia
North American OE awarded global development lead for major platform Interiors European OE expanding relationship in South America and Asia European OE first program sourcing for Europe
European OE – new relationship
Lighting Re-established as strategic supplier in North America Energy-efficient front lighting system on major OE electric vehicle
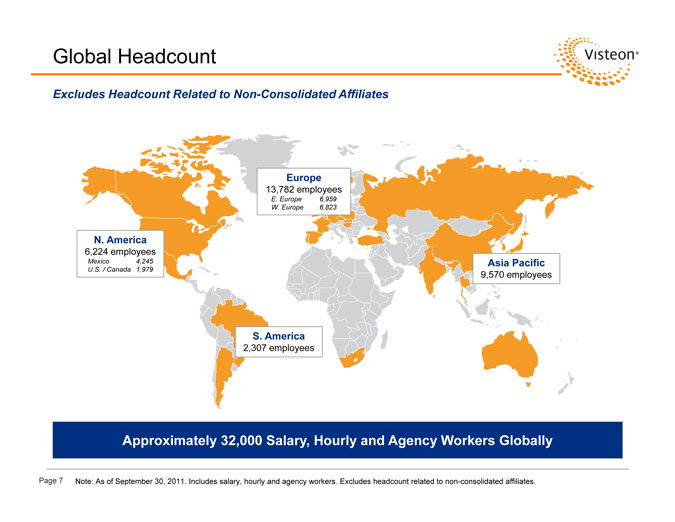
Approximately 32,000 Salary, Hourly and Agency Workers Globally
Page 7 Note: As of September 30, 2011. Includes salary, hourly and agency workers. Excludes headcount related to non-consolidated affiliates.
Global Headcount
Excludes Headcount Related to Non-Consolidated Affiliates
Europe
13,782 employees
E. Europe 6,959 W. Europe 6,823
Asia Pacific
9,570 employees
S. America
2,307 employees
N. America
6,224 employees
Mexico 4,245 U.S. / Canada 1,979
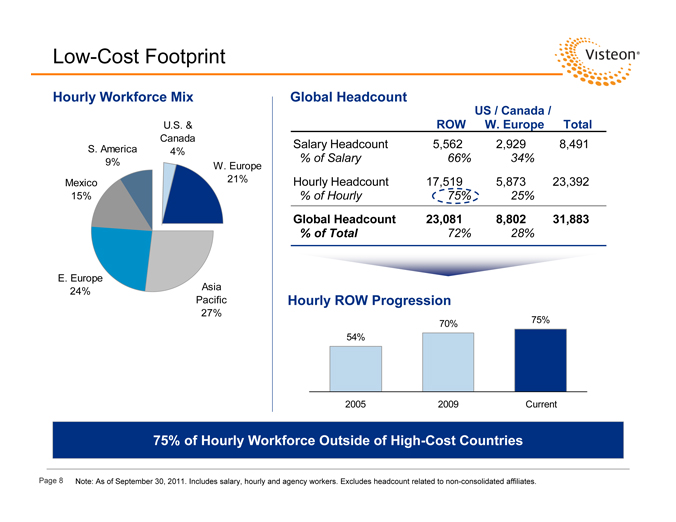
Low-Cost Footprint
Hourly Workforce Mix Global Headcount
U.S. & Canada S. America 4%
9% W. Europe Mexico 21% 15%
E. Europe
24% Asia Pacific 27%
US / Canada / ROW W. Europe Total
Salary Headcount 5,562 2,929 8,491
% of Salary 66% 34%
Hourly Headcount 17,519 5,873 23,392
% of Hourly 75% 25%
Global Headcount 23,081 8,802 31,883
% of Total 72% 28%
Hourly ROW Progression
70% 75% 54%
2005 2009 Current
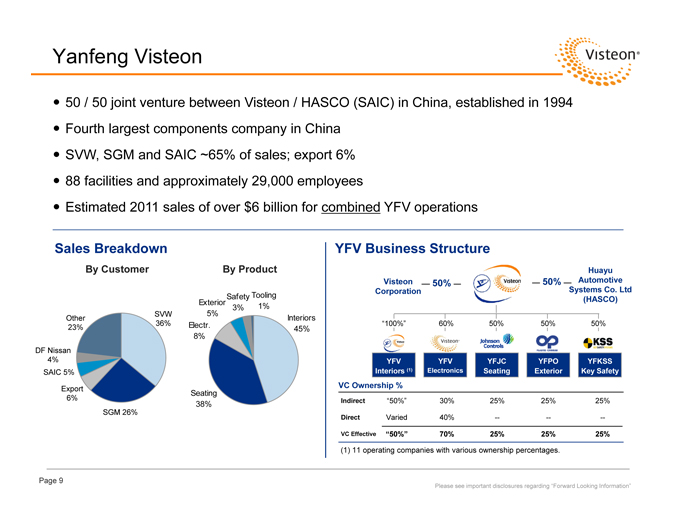
Yanfeng Visteon
50 / 50 joint venture between Visteon / HASCO (SAIC) in China, established in 1994 Fourth largest components company in China SVW, SGM and SAIC ~65% of sales; export 6% 88 facilities and approximately 29,000 employees Estimated 2011 sales of over $6 billion for combined YFV operations
Sales Breakdown
By Customer By Product
Exterior Safety Tooling
5% 3% 1%
SVW Interiors Other 36% Electr.
23% 45% 8% DF Nissan 4% SAIC 5%
Export
Seating 6% 38% SGM 26%
FV Business Structure
Huayu Visteon 50% 50% Automotive Corporation Systems Co. Ltd (HASCO)
“100%” 60% 50% 50% 50%
FV YFV YFJC YFPO YFKSS Interiors (1) Electronics Seating Exterior Key Safety VC Ownership % Indirect “50%” 30% 25% 25% 25%
Direct Varied 40% — — —
VC Effective “50%” 70% 25% 25% 25%
| (1) |
|
11 operating companies with various ownership percentages. |
Page 9
Please see important disclosures regarding “Forward Looking Information”
Proposed Sale of Interiors Business to YFV
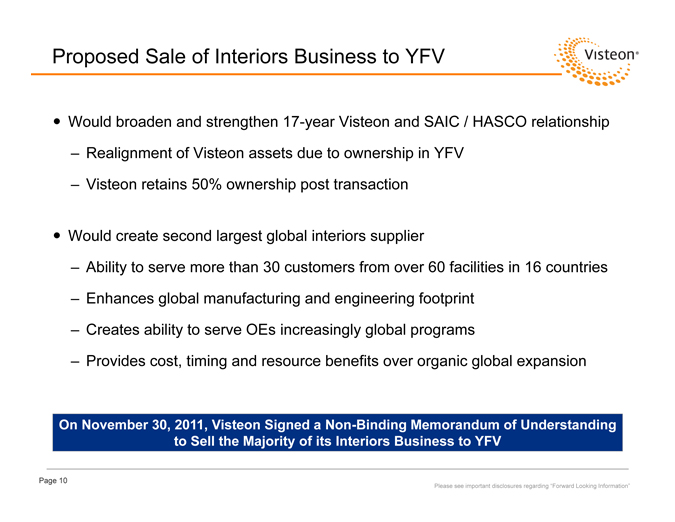
Would broaden and strengthen 17-year Visteon and SAIC / HASCO relationship
– Realignment of Visteon assets due to ownership in YFV
– Visteon retains 50% ownership post transaction
Would create second largest global interiors supplier
– Ability to serve more than 30 customers from over 60 facilities in 16 countries
– Enhances global manufacturing and engineering footprint
– Creates ability to serve OEs increasingly global programs
– Provides cost, timing and resource benefits over organic global expansion
On November 30, 2011, Visteon Signed a Non-Binding Memorandum of Understanding to Sell the Majority of its Interiors Business to YFV
Page 10
Please see important disclosures regarding “Forward Looking Information”
Preliminary 2011 Financial Performance and 2012 Outlook
Pension Liability Initiatives
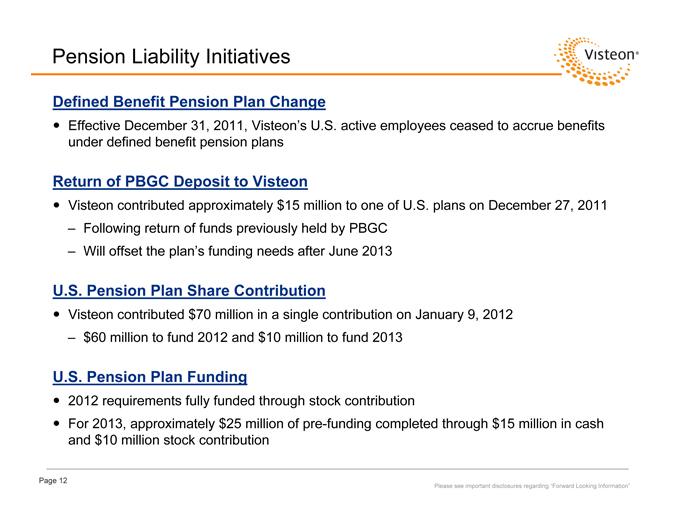
Defined Benefit Pension Plan Change
Effective December 31, 2011, Visteon’s U.S. active employees ceased to accrue benefits under defined benefit pension plans
Return of PBGC Deposit to Visteon
Visteon contributed approximately $15 million to one of U.S. plans on December 27, 2011
– Following return of funds previously held by PBGC
– Will offset the plan’s funding needs after June 2013
U.S. Pension Plan Share Contribution
Visteon contributed $70 million in a single contribution on January 9, 2012
– $60 million to fund 2012 and $10 million to fund 2013
U.S. Pension Plan Funding
2012 requirements fully funded through stock contribution
For 2013, approximately $25 million of pre-funding completed through $15 million in cash and $10 million stock contribution
Page 12
Please see important disclosures regarding “Forward Looking Information”
Page 13
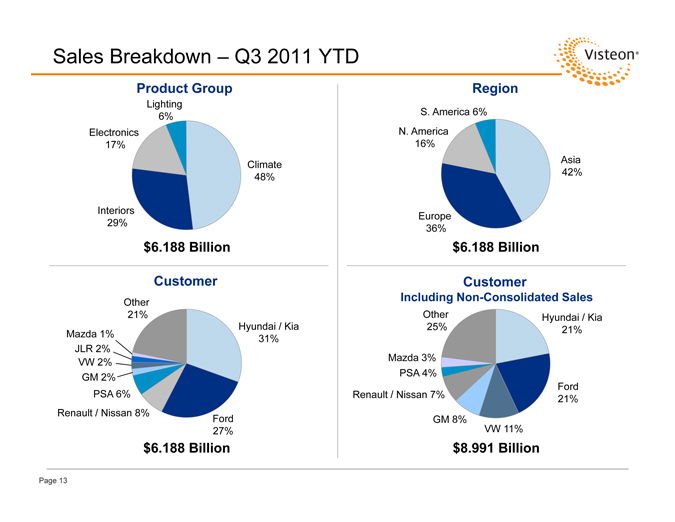
Sales Breakdown – Q3 2011 YTD
Product Group
Lighting 6% Electronics 17%
Climate 48%
Interiors 29%
$6.188 Billion
Region
S. America 6% N. America 16%
Asia 42%
Europe 36%
$6.188 Billion
Customer
Other 21%
Hyundai / Kia Mazda 1% 31% JLR 2% VW 2% GM 2% PSA 6% Renault / Nissan 8% Ford 27%
$6.188 Billion
Customer
Including Non-Consolidated Sales
Other Hyundai / Kia 25% 21%
Mazda 3% PSA 4%
Ford Renault / Nissan 7% 21% GM 8% VW 11%
$8.991 Billion
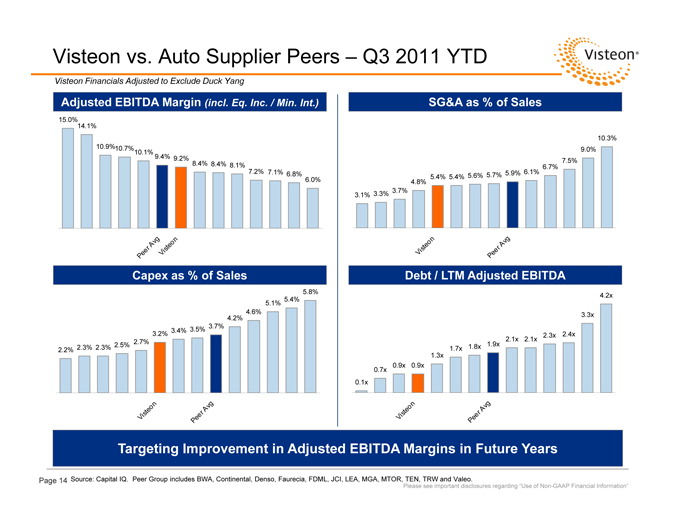
Targeting Improvement in Adjusted EBITDA Margins in Future Years
Page 14
Source: Capital IQ. Peer Group includes BWA, Continental, Denso, Faurecia, FDML, JCI, LEA, MGA, MTOR, TEN, TRW and Valeo.
Please see important disclosures regarding “Use of Non-GAAP Financial Information”
Visteon vs. Auto Supplier Peers – Q3 2011 YTD
Visteon Financials Adjusted to Exclude Duck Yang
Adjusted EBITDA Margin (incl. Eq. Inc. / Min. Int.)
15.0%14.1%
10.9%10.7%
10.1% 9.4% 9.2% 8.4% 8.4% 8.1%
7.2% 7.1% 6.8% 6.0%
v g n A t eo r is Pee V
SG&A as % of Sales
10.3%
9.0%
6.7% 7.5%
5.9% 6.1%
5.4% 5.4% 5.6% 5.7%
4.8%
3.7%
3.1% 3.3%
n Av g isteo r V Pee
Capex as % of Sales
5.8%
5.4%
5.1%
4.2% 4.6%
3.7%
3.4% 3.5%
3.2%
2.7%
2.3% 2.3% 2.5%
2.2%
on Av g te r V i s Pee
Debt / LTM Adjusted EBITDA
4.2x 3.3x 2.3x 2.4x
2.1x 2.1x
1.8x 1.9x
1.7x
1.3x
0.9x 0.9x
0.7x
0.1x
Av g Visteon e r e P
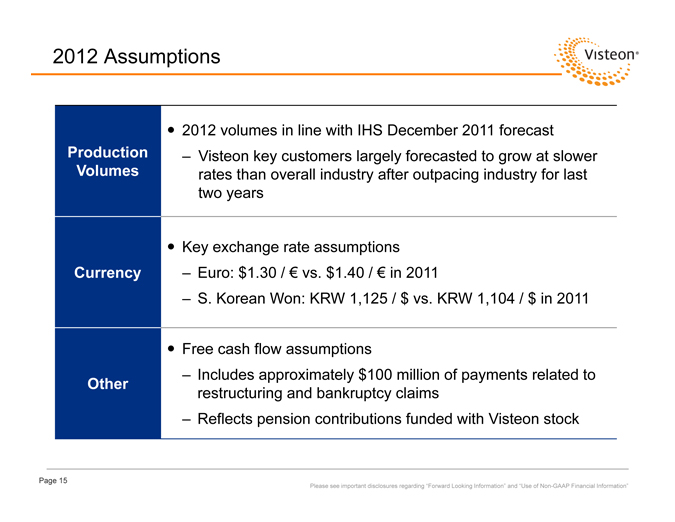
2012 Assumptions
Page 15
Please see important disclosures regarding “Forward Looking Information” and “Use of Non-GAAP Financial Information”
Production Volumes
Currency
Other
2012 volumes in line with IHS December 2011 forecast
– Visteon key customers largely forecasted to grow at slower rates than overall industry after outpacing industry for last two years
Key exchange rate assumptions
– Euro: $1.30 / € vs. $1.40 / € in 2011
– S. Korean Won: KRW 1,125 / $ vs. KRW 1,104 / $ in 2011
Free cash flow assumptions
– Includes approximately $100 million of payments related to restructuring and bankruptcy claims
– Reflects pension contributions funded with Visteon stock
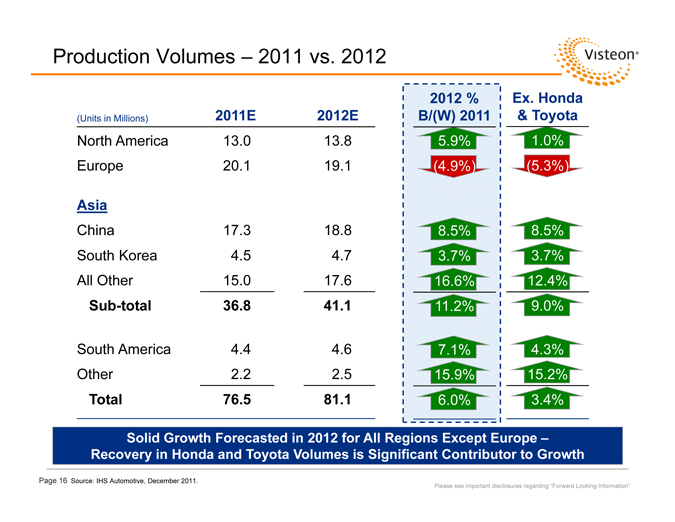
Solid Growth Forecasted in 2012 for All Regions Except Europe –Recovery in Honda and Toyota Volumes is Significant Contributor to Growth
Page 16 Source: IHS Automotive, December 2011.
Please see important disclosures regarding “Forward Looking Information”
Production Volumes – 2011 vs. 2012
2012 % Ex. Honda (Units in Millions) 2011E 2012E B/(W) 2011 & Toyota
North America 13.0 13.8 5.9% 1.0% Europe 20.1 19.1 (4.9%) (5.3%)
Asia
China 17.3 18.8 8.5% 8.5% South Korea 4.5 4.7 3.7% 3.7% All Other 15.0 17.6 16.6% 12.4%
Sub-total 36.8 41.1 11.2% 9.0%
South America 4.4 4.6 7.1% 4.3% Other 2.2 2.5 15.9% 15.2%
Total 76.5 81.1 6.0% 3.4%
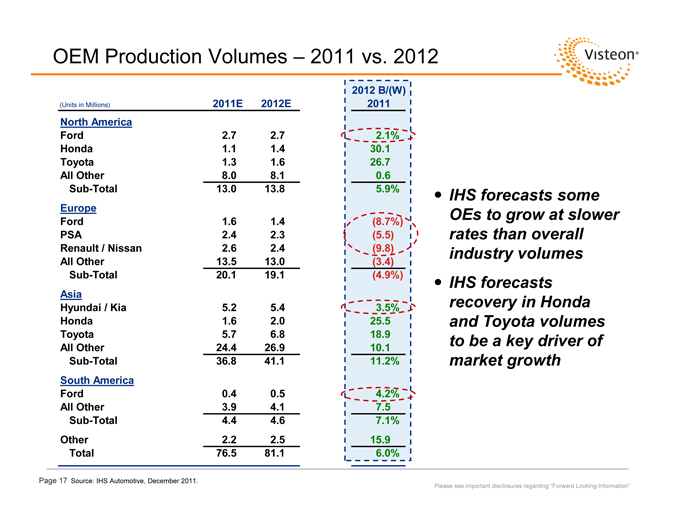
OEM Production Volumes – 2011 vs. 2012
IHS forecasts some OEs to grow at slower rates than overall industry volumes IHS forecasts recovery in Honda and Toyota volumes to be a key driver of market growth
Please see important disclosures regarding “Forward Looking Information”
2012 B/(W)
(Units in Millions) 2011E 2012E 2011
North America
Ford 2.7 2.7 2.1% Honda 1.1 1.4 30.1 Toyota 1.3 1.6 26.7 All Other 8.0 8.1 0.6 Sub-Total 13.0 13.8 5.9% Europe Ford 1.6 1.4 (8.7%) PSA 2.4 2.3 (5.5) Renault / Nissan 2.6 2.4 (9.8) All Other 13.5 13.0 (3.4) Sub-Total 20.1 19.1 (4.9%) Asia Hyundai / Kia 5.2 5.4 3.5% Honda 1.6 2.0 25.5 Toyota 5.7 6.8 18.9 All Other 24.4 26.9 10.1 Sub-Total 36.8 41.1 11.2% South America Ford 0.4 0.5 4.2% All Other 3.9 4.1 7.5 Sub-Total 4.4 4.6 7.1% Other 2.2 2.5 15.9 Total 76.5 81.1 6.0%
Page 17 Source: IHS Automotive, December 2011.
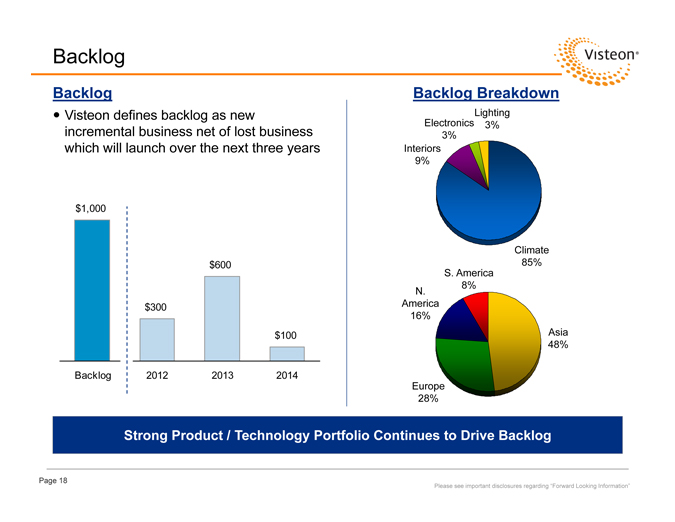
Strong Product / Technology Portfolio Continues to Drive Backlog
Page 18
Please see important disclosures regarding “Forward Looking Information”
Backlog
Backlog
Visteon defines backlog as new incremental business net of lost business which will launch over the next three years
$1,000
$600
$300 $100 Backlog 2012 2013 2014
Backlog Breakdown
Lighting Electronics 3% 3% Interiors 9%
Climate 85%
S. America 8% N.
America 16%
Asia 48%
Europe 28%
2011 Midpoint
2012 Midpoint
Page 19
Please see important disclosures regarding “Forward Looking Information” and “Use of Non-GAAP Financial Information”
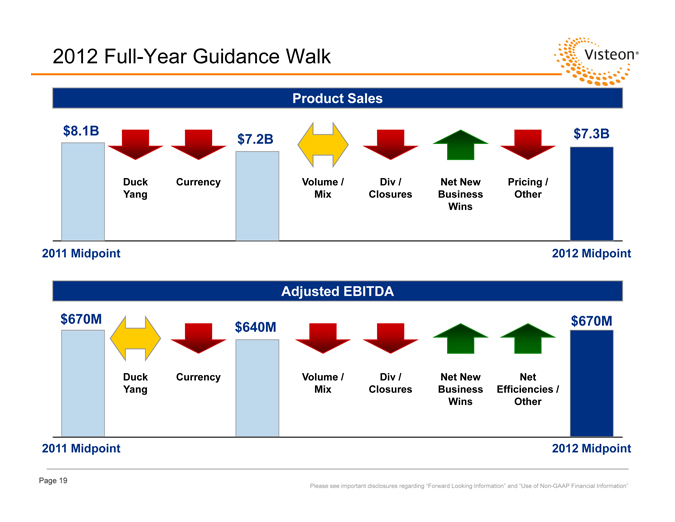
2012 Full-Year Guidance Walk
Product Sales
$8.1B $7.3B $7.2B
Duck Currency Volume / Div / Net New Pricing / Yang Mix Closures Business Other Wins
2011 Midpoint 2012 Midpoint
Adjusted EBITDA
$670M $670M $640M
Duck Currency Volume / Div / Net New Net Yang Mix Closures Business Efficiencies / Wins Other
Page 20
Please see important disclosures regarding “Forward Looking Information” and “Use of Non-GAAP Financial Information”
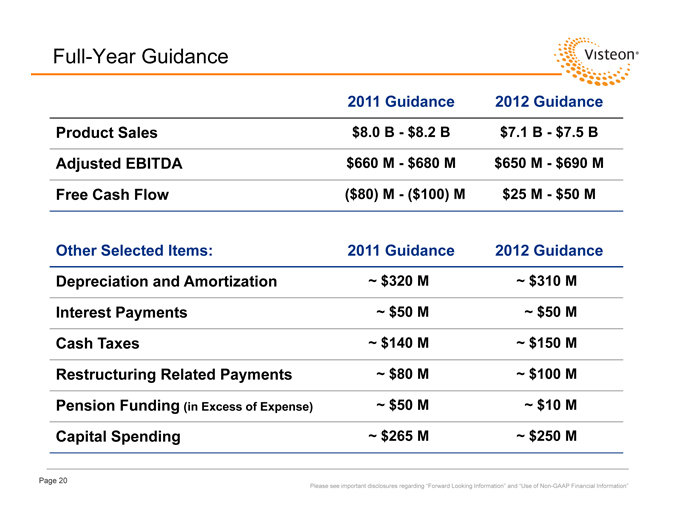
Full-Year Guidance
2011 Guidance 2012 Guidance Product Sales $8.0 B—$8.2 B $7.1 B—$7.5 B Adjusted EBITDA $660 M—$680 M $650 M—$690 M Free Cash Flow ($80) M—($100) M $25 M—$50 M
Other Selected Items: 2011 Guidance 2012 Guidance Depreciation and Amortization ~ $320 M ~ $310 M Interest Payments ~ $50 M ~ $50 M Cash Taxes ~ $140 M ~ $150 M Restructuring Related Payments ~ $80 M ~ $100 M
Pension Funding (in Excess of Expense) ~ $50 M ~ $10 M
Capital Spending ~ $265 M ~ $250 M
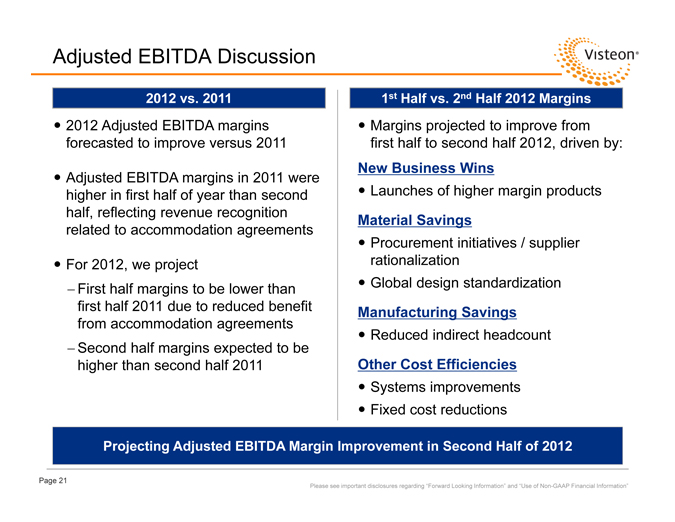
Adjusted EBITDA Discussion
2012 vs. 2011
2012 Adjusted EBITDA margins forecasted to improve versus 2011
Adjusted EBITDA margins in 2011 were higher in first half of year than second half, reflecting revenue recognition related to accommodation agreements
For 2012, we project
First half margins to be lower than first half 2011 due to reduced benefit from accommodation agreements
Second half margins expected to be higher than second half 2011
Projecting Adjusted EBITDA Margin Improvement in Second Half of 2012
Page 21
Please see important disclosures regarding “Forward Looking Information” and “Use of Non-GAAP Financial Information”
1st Half vs. 2nd Half 2012 Margins Margins projected to improve from first half to second half 2012, driven by:
New Business Wins Launches of higher margin products
Material Savings Procurement initiatives / supplier rationalization Global design standardization
Manufacturing Savings Reduced indirect headcount
Other Cost Efficiencies Systems improvements Fixed cost reductions
Key Initiatives
Asset Optimization Margin Improvement Free Cash Flow New Business Wins / Backlog
Focused on Continued Strategy of Optimizing Visteon’s Business Portfolio to Maximize Shareholder Value
Page 22
Please see important disclosures regarding “Forward Looking Information”
Use of Non-GAAP Financial Information
Throughout this presentation, the Company has provided information regarding certain non-GAAP financial measures. These measures include “free cash flow” and “Adjusted EBITDA.” Free cash flow represents cash flow from operating activities less capital expenditures. Adjusted EBITDA represents net income (loss) attributable to Visteon, plus net interest expense, provision for income taxes and depreciation and amortization, as further adjusted to eliminate the impact of asset impairments, gains or losses on divestitures, net restructuring expenses and other reimbursable costs, certain non-recurring employee charges and benefits, reorganization items, and other non-operating gains and losses.
Management believes that free cash flow is useful in analyzing the Company’s ability to service and repay its debt, and it uses the measure for planning and forecasting in future periods, as well as in management compensation decisions. Free cash flow is not a recognized term under accounting principles generally accepted in the United States (“GAAP”) and does not reflect cash used to service debt and does not reflect funds available for investment or other discretionary uses.
Management believes Adjusted EBITDA is useful to investors because it provides meaningful supplemental information regarding the Company’s operating results because the excluded items may vary significantly in timing or amounts and/or may obscure trends useful in evaluating and comparing the Company’s continuing operating activities. Management uses this measure for planning and forecasting in future periods. Adjusted EBITDA is not a recognized term under GAAP and does not purport to be an alternative to net earnings (losses) as an indicator of operating performance or to cash flows from operating activities as a measure of liquidity. Because not all companies use identical calculations, this presentation of Adjusted EBITDA may not be comparable to other similarly titled measures of other companies. Additionally, Adjusted EBITDA is not intended to be a measure of cash flow available for management’s discretionary use, as it does not consider certain cash requirements such as interest payments, tax payments and debt service requirements.
Page 23
Reconciliation of Non-GAAP Financial Information
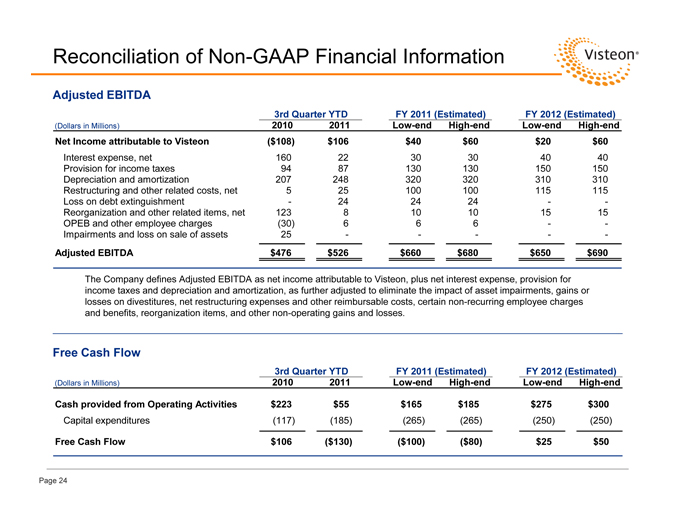
The Company defines Adjusted EBITDA as net income attributable to Visteon, plus net interest expense, provision for income taxes and depreciation and amortization, as further adjusted to eliminate the impact of asset impairments, gains or losses on divestitures, net restructuring expenses and other reimbursable costs, certain non-recurring employee charges and benefits, reorganization items, and other non-operating gains and losses.
Page 24
Adjusted EBITDA
3rd Quarter YTD FY 2011 (Estimated) FY 2012 (Estimated) (Dollars in Millions) 2010 2011 Low-end High-end Low-end High-end Net Income attributable to Visteon ($108) $106 $40 $60 $20 $60
Interest expense, net 160 22 30 30 40 40 Provision for income taxes 94 87 130 130 150 150 Depreciation and amortization 207 248 320 320 310 310 Restructuring and other related costs, net 5 25 100 100 115 115 Loss on debt extinguishment—24 24 24—-Reorganization and other related items, net 123 8 10 10 15 15 OPEB and other employee charges (30) 6 6 6—-Impairments and loss on sale of assets 25———-
Adjusted EBITDA $476 $526 $660 $680 $650 $690
Free Cash Flow
3rd Quarter YTD FY 2011 (Estimated) FY 2012 (Estimated) (Dollars in Millions) 2010 2011 Low-end High-end Low-end High-end
Cash provided from Operating Activities $223 $55 $165 $185 $275 $300
Capital expenditures (117) (185) (265) (265) (250) (250)
Free Cash Flow $106 ($130) ($100) ($80) $25 $50
Forward-Looking Information
This presentation contains “forward-looking statements” within the meaning of the Private Securities Litigation Reform Act of 1995. Forward-looking statements are not guarantees of future results and conditions but rather are subject to various factors, risks and uncertainties that could cause our actual results to differ materially from those expressed in these forward-looking statements, including, but not limited to, your ability to satisfy future capital and liquidity requirements; including our ability to access the credit and capital markets at the times and in the amounts needed and on terms acceptable to us; our ability to comply with financial and other covenants in our credit agreements; and the continuation of acceptable supplier payment terms; your ability to satisfy pension and other post-employment benefit obligations; your ability to access funds generated by foreign subsidiaries and joint ventures on a timely and cost effective basis; conditions within the automotive industry, including (i) the automotive vehicle production volumes and schedules of our customers, and in particular Ford’s and Hyundai-Kia’s vehicle production volumes, (ii) the financial condition of our customers or suppliers and the effects of any restructuring or reorganization plans that may be undertaken by our customers or suppliers or work stoppages at our customers or suppliers, and (iii) possible disruptions in the supply of commodities to us or our customers due to financial distress, work stoppages, natural disasters or civil unrest; new business wins and re-wins do not represent firm orders or firm commitments from customers, but are based on various assumptions, including the timing and duration of product launches, vehicle productions levels, customer price reductions and currency exchange rates; general economic conditions, including changes in interest rates and fuel prices; the timing and expenses related to internal restructurings, employee reductions, acquisitions or dispositions and the effect of pension and other post-employment benefit obligations; increases in raw material and energy costs and our ability to offset or recover these costs, increases in our warranty, product liability and recall costs or the outcome of legal or regulatory proceedings to which we are or may become a party; and those factors identified in our filings with the SEC (including our Annual Report on Form 10-K for the fiscal year ended Dec. 31, 2010).
Caution should be taken not to place undue reliance on our forward-looking statements, which represent our view only as of the date of this presentation, and which we assume no obligation to update.
Page 25

www.visteon.com