Attached files
| file | filename |
|---|---|
| 8-K - GOLUB CAPITAL BDC, Inc. | v242367_8k.htm |

Golub Capital BDC, Inc. Investor Presentation Quarter Ended September 30, 2011

Some of the statements in this presentation constitute forward-looking statements,
which relate to future events or our future performance or financial condition. The forward-looking statements contained in this presentation involve risks and uncertainties, including statements as to: our future operating results; our business prospects and the prospects of our portfolio companies; the effect of investments that we expect to make; our contractual arrangements and relationships with third parties; actual and potential conflicts of interest with GC Advisors LLC ("GC Advisors") and other affiliates of Golub Capital Incorporated and Golub Capital Management LLC (collectively, "Golub Capital"); the dependence of our future success on the general economy and its effect on the industries in which we invest; the ability of our portfolio companies to achieve their objectives; the use of borrowed money to finance a portion of our investments; the adequacy of our financing sources and working capital; the timing of cash flows, if any, from the operations of our portfolio companies; the ability of GC Advisors to locate suitable investments for us and to monitor and administer our investments; the ability
of GC Advisors or its affiliates to attract and retain highly talented professionals; our
ability to qualify and maintain our qualification as a regulated investment company and
as a business development company; the impact on our business of the Dodd Frank Wall Street Reform and Consumer Protection Act and the rules and regulations issued thereunder; and the effect of changes to tax legislation and our tax position. Such forward-looking statements may include statements preceded by, followed by
or that otherwise include the words “may,” “might,” “will,” “intend,” “should,” “could,” “can,” “would,” “expect,” “believe,” “estimate,” “anticipate,” “predict,” “potential,” “plan” or similar words. We have based the forward-looking statements included in this presentation on information available to us on the date of this presentation, and we assume no obligation to update any such forward-looking statements. Actual results could differ materially from those implied or expressed in our forward-looking statements for any reason, and future results could differ materially from historical performance. Although we undertake no obligation to revise or update any forward-looking statements, whether as a result of new information, future events or otherwise, you are advised to consult any additional disclosures that we may make directly to you or through reports that we have filed or in the future may file with the Securities and Exchange Commission, including annual reports on Form 10-K, quarterly reports on Form 10-Q and current reports on Form 8-K. This presentation contains statistics and other data that has been obtained from or compiled from information made available by third-party service providers. We have not independently verified such statistics or data.
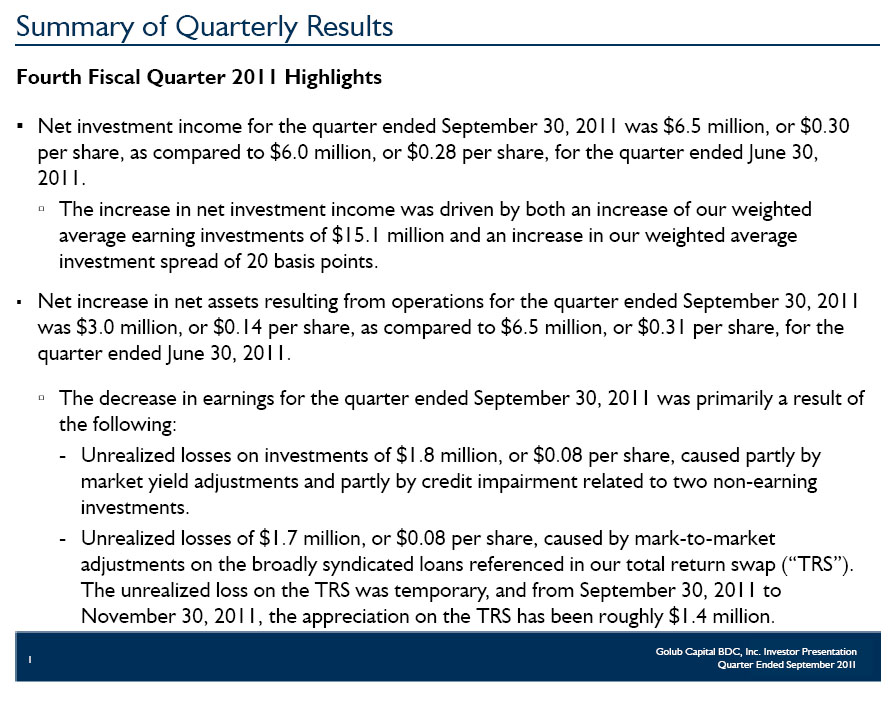
Summary of Quarterly Results Fourth Fiscal Quarter 2011 Highlights Net investment income for the quarter ended September 30, 2011 was $6.5 million, or $0.30 per share, as compared to $6.0 million, or $0.28 per share, for the quarter ended June 30, 2011. The increase in net investment income was driven by both an increase of our weighted average earning investments of $15.1 million and an increase in our weighted average investment spread of 20 basis points. Net increase in net assets resulting from operations for the quarter ended September 30, 2011 was $3.0 million, or $0.14 per share, as compared to $6.5 million, or $0.31 per share, for the quarter ended June 30, 2011. The decrease in earnings for the quarter ended September 30, 2011 was primarily a result of the following: Unrealized losses on investments of $1.8 million, or $0.08 per share, caused partly by market yield adjustments and partly by credit impairment related to two non-earning investments. Unrealized losses of $1.7 million, or $0.08 per share, caused by mark-to-market adjustments on the broadly syndicated loans referenced in our total return swap (“TRS”). The unrealized loss on the TRS was temporary, and from September 30, 2011 to November 30, 2011, the appreciation on the TRS has been roughly $1.4 million.
1
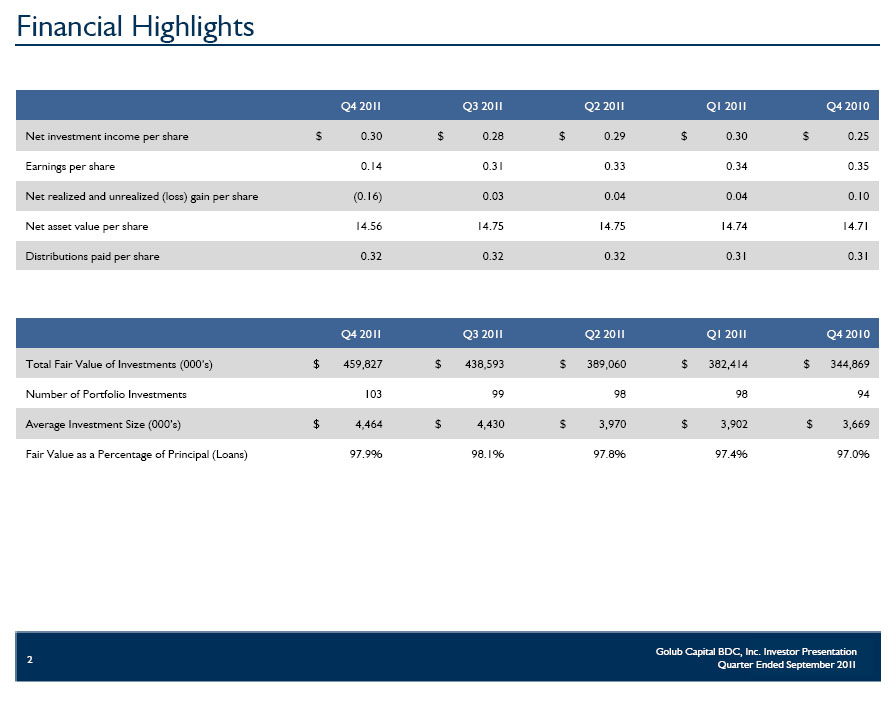
Financial Highlights Q4 2011 Q3 2011 Q2 2011 Q1 2011 Q4 2010 Net investment income per share$ 0.30$ 0.28$ 0.29$ 0.30$ 0.25 Earnings per share0.140.310.330.340.35 Net realized and unrealized (loss) gain per share(0.16)0.030.040.040.10 Net asset value per share14.5614.7514.7514.7414.71 Distributions paid per share0.320.320.320.310.31 Q4 2011Q3 2011Q2 2011Q1 2011Q4 2010 Total Fair Value of Investments (000’s)$ 459,827$ 438,593$ 389,060$ 382,414$ 344,869 Number of Portfolio Investments10399989894 Average Investment Size (000’s)$ 4,464$ 4,430$ 3,970$ 3,902$ 3,669 Fair Value as a Percentage of Principal (Loans)97.9%98.1%97.8%97.4%97.0%
2
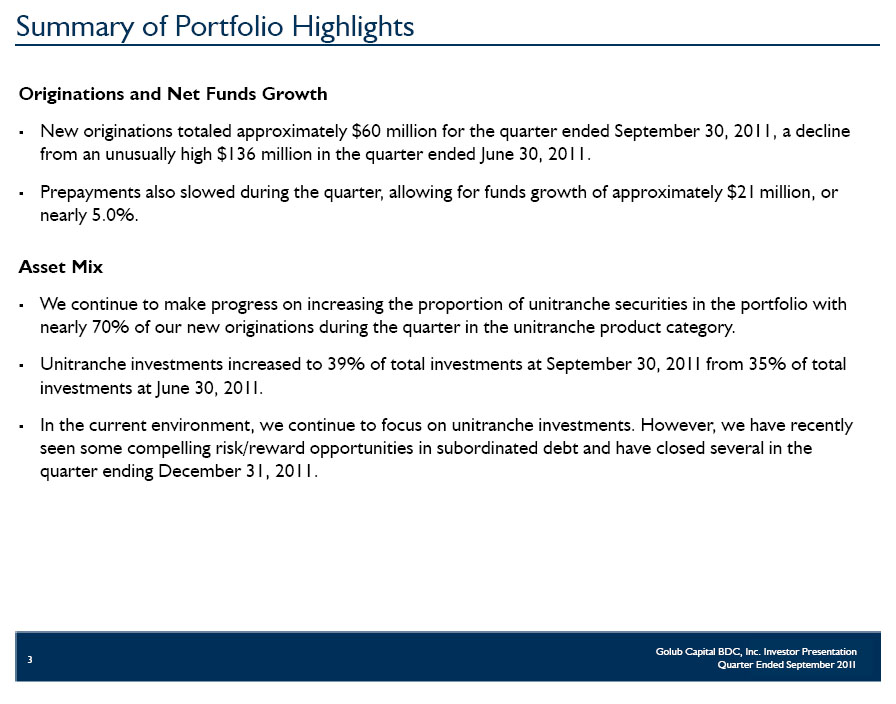
Summary of Portfolio Highlights Originations and Net Funds Growth New originations totaled approximately $60 million for the quarter ended September 30, 2011, a decline from an unusually high $136 million in the quarter ended June 30, 2011. Prepayments also slowed during the quarter, allowing for funds growth of approximately $21 million, or nearly 5.0%. Asset Mix We continue to make progress on increasing the proportion of unitranche securities in the portfolio with nearly 70% of our new originations during the quarter in the unitranche product category. Unitranche investments increased to 39% of total investments at September 30, 2011 from 35% of total investments at June 30, 2011. In the current environment, we continue to focus on unitranche investments. However, for the first time in several quarters, we have recently seen some compelling risk/reward opportunities in subordinated debt and have closed several in the quarter ending December 31, 2011.
3

Portfolio Highlights Select Portfolio Funds Roll Data (in millions) Q4 2011 Q3 2011Q2 2011Q1 2011Q4 2010 New Investment Commitments1$ 59.8$ 135.8$ 54.6 $ 113.7$ 83.7 Exits (includes full & partial payoffs) of Investments228.979.646.064.113.5 Net Funds Growth321.049.56.637.567.3 Asset MixQ4 2011Q3 2011Q2 2011Q1 2011Q4 2010 Senior Secured44%47%56%59%66% Unitranche39%35%29%26%26% Second Lien5%5%7%7%3% Subordinated Debt10%11%6%6%4% Equity2%2%2%2%1% 1 For the quarter ended June 30, 2011, new investment commitments include new investments in middle-market loans and equity securities of $113.8 million and new investments in broadly syndicated loans of $22.0 million. 2 For the quarter ended June 30, 2011, exits of investments includes the sale of $46.2 million of lower yielding broadly syndicated loans. 3 Net funds growth includes the impact of new investments and exits of investments as noted in the table above, as well as other variables such as net fundings on revolvers, net change in unamortized fees, net change in unrealized gains (losses), etc.
4
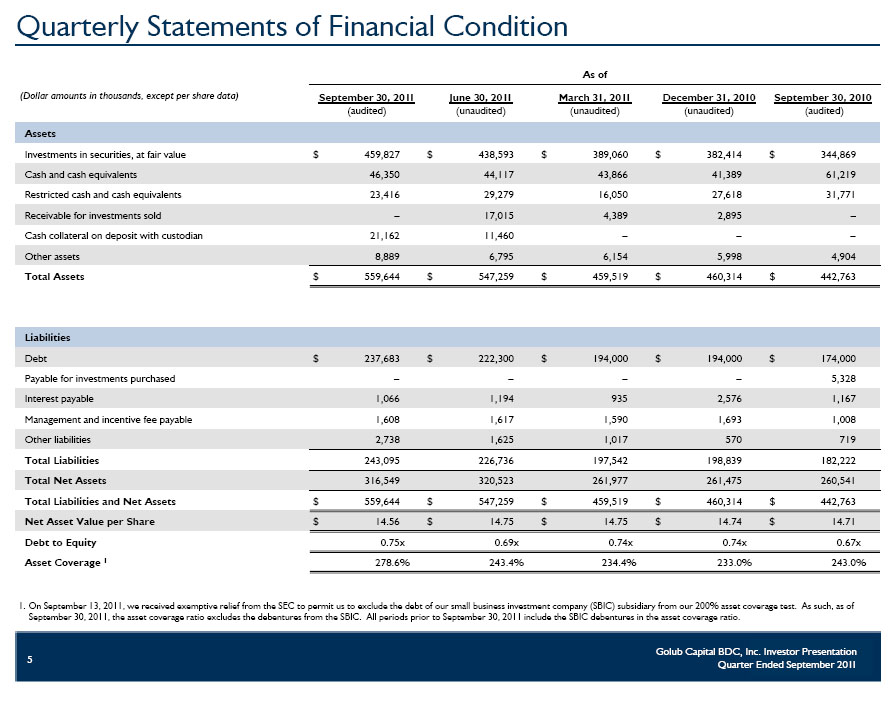
Quarterly Statements of Financial Condition As of (Dollar amounts in thousands, except per share data)September 30, 2011 (audited)June 30, 2011 (unaudited)March 31, 2011 (unaudited)December 31, 2010 (unaudited)September 30, 2010 (audited) Assets Investments in securities, at fair value $ 459,827 $ 438,593 $ 389,060 $ 382,414 $ 344,869 Cash and cash equivalents 46,350 44,117 43,866 41,389 61,219 Restricted cash and cash equivalents 23,416 29,279 16,050 27,618 31,771 Receivable for investments sold – 17,015 4,389 2,895 – Cash collateral on deposit with custodian 21,162 11,460 – – – Other assets 8,889 6,795 6,154 5,998 4,904 Total Assets $ 559,644 $ 547,259 $ 459,519 $ 460,314 $ 442,763 Liabilities Debt $ 237,683 $ 222,300 $ 194,000 $ 194,000 $ 174,000 Payable for investments purchased – – – – 5,328 Interest payable 1,066 1,194 935 2,576 1,167 Management and incentive fee payable 1,608 1,617 1,590 1,693 1,008 Other liabilities 2,738 1,625 1,017 570 719 Total Liabilities 243,095 226,736 197,542 198,839 182,222 Total Net Assets 316,549 320,523 261,977 261,475 260,541 Total Liabilities and Net Assets $ 559,644 $ 547,259 $ 459,519 $ 460,314 $ 442,763 Net Asset Value per Share $ 14.56 $ 14.75 $ 14.75 $ 14.74 $ 14.71 Debt to Equity 0.75x 0.69x 0.74x 0.74x 0.67x Asset Coverage 1 278.6% 243.4% 234.4% 233.0% 243.0% 1 On September 13, 2011, we received exemptive relief from the SEC to permit us to exclude the debt of our small business investment company (SBIC) subsidiary from our 200% asset coverage test. As such, as of September 30, 2011, the asset coverage ratio excludes the debentures from the SBIC. All periods prior to September 30, 2011 include the SBIC debentures in the asset coverage ratio.
5
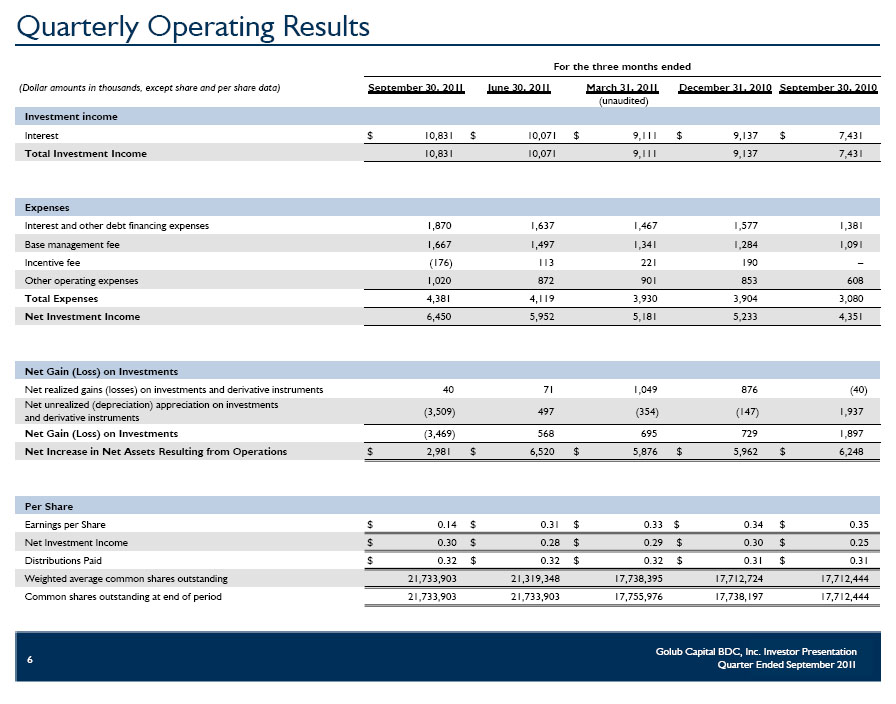
Quarterly Operating Results For the three months ended (Dollar amounts in thousands, except share and per share data)September 30, 2011June 30, 2011March 31, 2011
(unaudited) December 31, 2010 September 30, 2010 Investment income Interest $ 10,831 $ 10,071 $ 9,111 $ 9,137 $ 7,431 Total Investment Income 10,831 10,071 9,111 9,137 7,431 Expenses Interest and other debt financing expenses 1,870 1,637 1,467 1,577 1,381 Base management fee 1,667 1,497 1,341 1,284 1,091 Incentive fee (176) 113 221 190 – Other operating expenses 1,020 872 901 853 608 Total Expenses 4,381 4,119 3,930 3,904 3,080 Net Investment Income 6,450 5,952 5,181 5,233 4,351 Net Gain (Loss) on Investments Net realized gains (losses) on investments and derivative instruments 40 71 1,049 876 (40) Net unrealized (depreciation) appreciation on investments
and derivative instruments (3,509) 497 (354) (147) 1,937 Net Gain (Loss) on Investments (3,469) 568 695 729 1,897 Net Increase in Net Assets Resulting from Operations $ 2,981 $ 6,520 $ 5,876 $ 5,962 $ 6,248 Per Share Earnings per Share $ 0.14 $ 0.31 $ 0.33 $ 0.34 $ 0.35 Net Investment Income $ 0.30 $ 0.28 $ 0.29 $ 0.30 $ 0.25 Distributions Paid $ 0.32 $ 0.32 $ 0.32 $ 0.31 $ 0.31 Weighted average common shares outstanding 21,733,903 21,319,348 17,738,395 17,712,724 17,712,444 Common shares outstanding at end of period 21,733,903 21,733,903 17,755,976 17,738,197 17,712,444
6
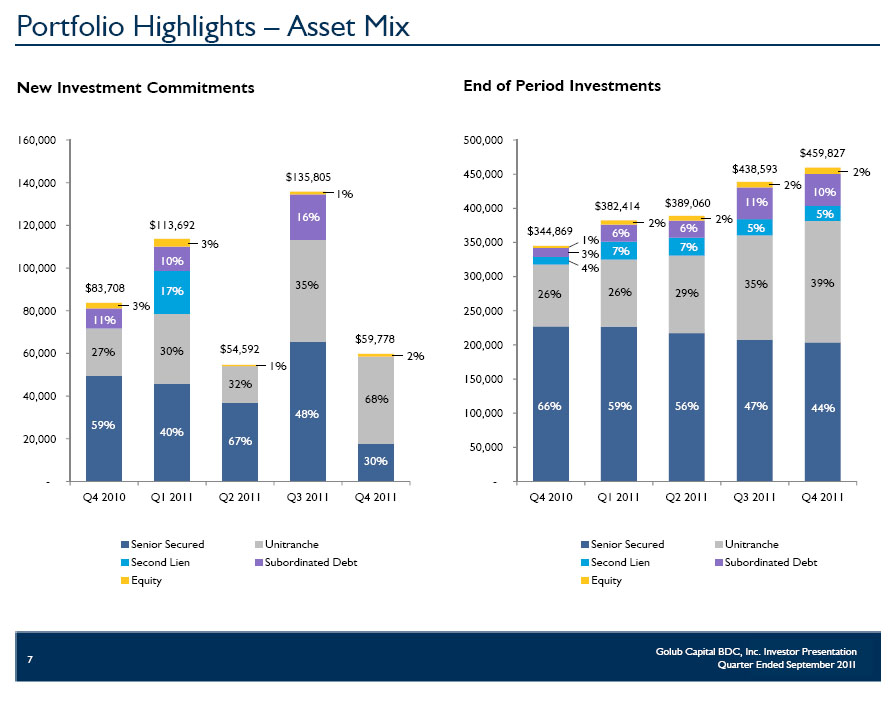
Portfolio Highlights – Asset Mix New Investment Commitments End of Period Investments
7
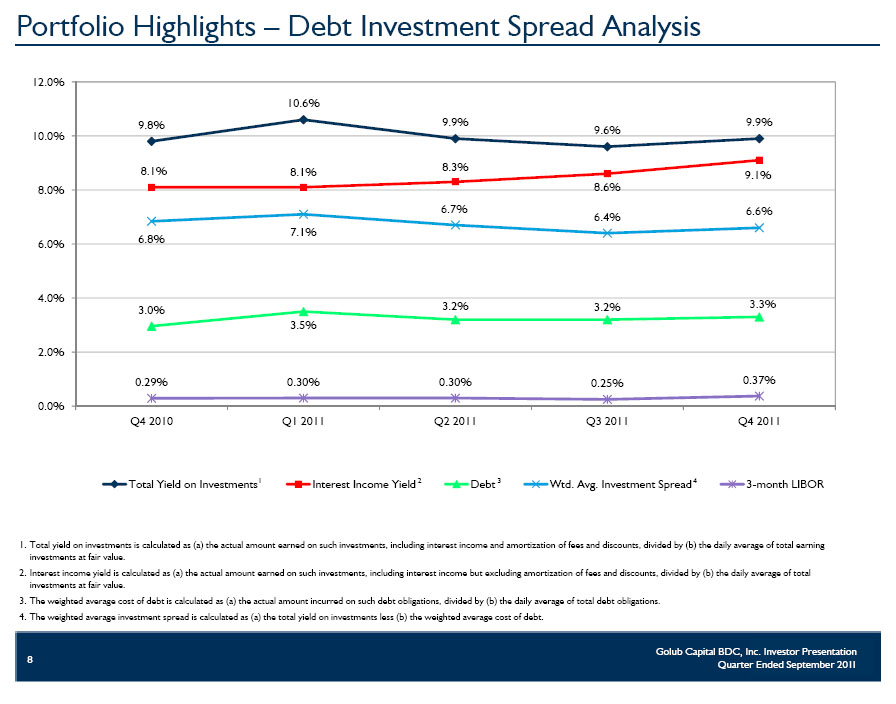
Portfolio Highlights – Debt Investment Spread Analysis Total yield on investments is calculated as (a) the actual amount earned on such investments, including interest income and amortization of fees and discounts, divided by (b) the daily average of total earning investments at fair value. Interest income yield is calculated as (a) the actual amount earned on such investments, including interest income but excluding amortization of fees and discounts, divided by (b) the daily average of total investments at fair value. The weighted average cost of debt is calculated as (a) the actual amount incurred on such debt obligations, divided by (b) the daily average of total debt obligations. The weighted average investment spread is calculated as (a) the total yield on investments less (b) the weighted average cost of debt.
8
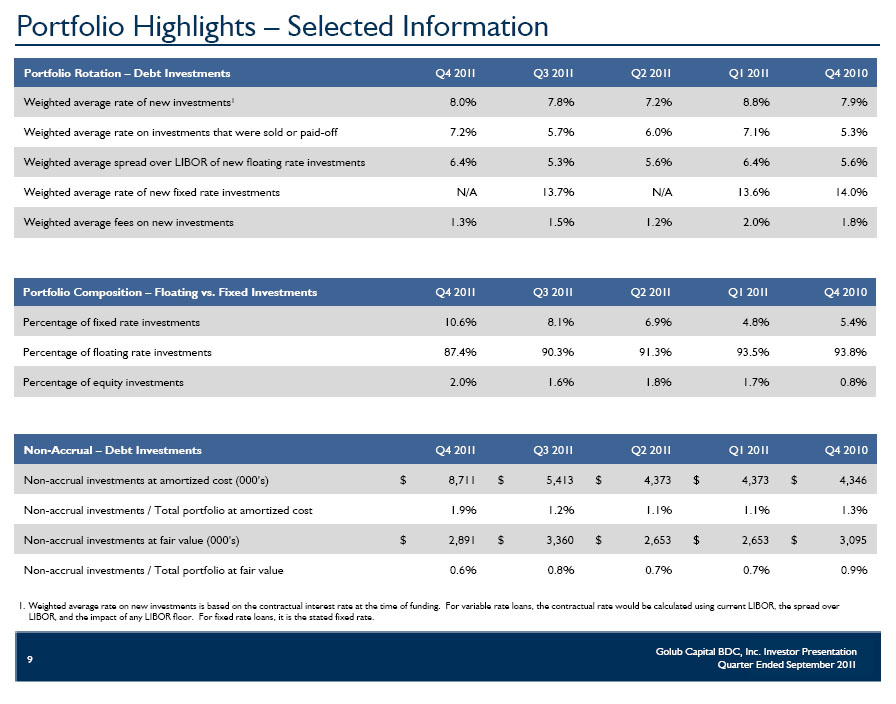
Portfolio Highlights – Selected Information Portfolio Rotation – Debt Investments Q4 2011Q3 2011Q2 2011Q1 2011Q4 2010 Weighted average rate of new investments18.0%7.8%7.2%8.8%7.9% Weighted average rate on investments that were sold or paid-off7.2%5.7%6.0%7.1%5.3% Weighted average spread over LIBOR of new floating rate investments6.4%5.3%5.6%6.4%5.6% Weighted average rate of new fixed rate investmentsN/A13.7%N/A13.6%14.0% Weighted average fees on new investments1.3%1.5%1.2%2.0%1.8% Portfolio Composition – Floating vs. Fixed InvestmentsQ4 2011Q3 2011Q2 2011Q1 2011Q4 2010 Percentage of fixed rate investments10.6%8.1%6.9%4.8%5.4% Percentage of floating rate investments87.4%90.3%91.3%93.5%93.8% Percentage of equity investments 2.0% 1.6%1.8%1.7%0.8% Non-Accrual – Debt InvestmentsQ4 2011Q3 2011Q2 2011Q1 2011Q4 2010 Non-accrual investments at amortized cost (000’s)$8,711$5,413$4,373$4,373$4,346 Non-accrual investments / Total portfolio at amortized cost1.9%1.2%1.1%1.1%1.3% Non-accrual investments at fair value (000’s)$2,891$3,360$2,653$2,653$3,095 Non-accrual investments / Total portfolio at fair value0.6%0.8%0.7%0.7%0.9% Weighted average rate on new investments is based on the contractual interest rate at the time of funding. For variable rate loans, the contractual rate would be calculated using current LIBOR, the spread over LIBOR, and the impact of any LIBOR floor. For fixed rate loans, it is the stated fixed rate.
9
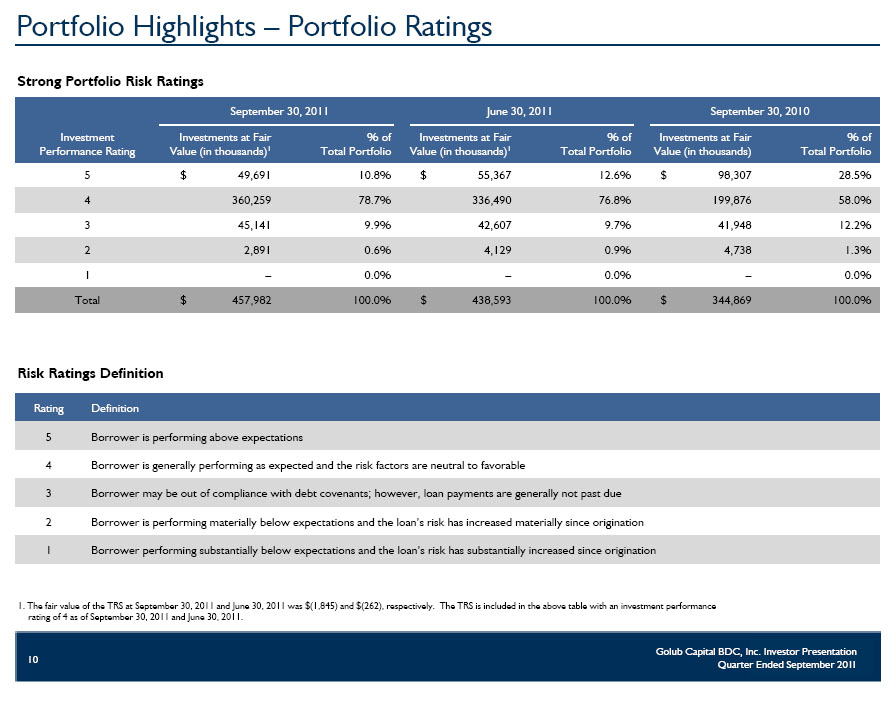
Portfolio Highlights – Portfolio Ratings Strong Portfolio Risk Ratings September 30, 2011June 30, 2011September 30, 2010 Investment
Performance Rating Investments at Fair Value (in thousands)1 % of
Total Portfolio Investments at Fair Value (in thousands)1 % of
Total Portfolio Investments at Fair Value (in thousands) % of
Total Portfolio 5 $ 49,691 10.8% $ 55,367 12.6% $ 98,30728.5% 4360,25978.7%336,49076.8%199,87658.0% 345,1419.9%42,6079.7%41,94812.2% 22,8910.6%4,1290.9%4,7381.3% 1–0.0%–0.0%–0.0% Total $457,982100.0% $438,593100.0% $344,869100.0% Risk Ratings Definition RatingDefinition 5Borrower is performing above expectations 4Borrower is generally performing as expected and the risk factors are neutral to favorable 3Borrower may be out of compliance with debt covenants; however, loan payments are generally not past due 2Borrower is performing materially below expectations and the loan’s risk has increased materially since origination 1Borrower performing substantially below expectations and the loan’s risk has substantially increased since origination 1. The fair value of the TRS at September 30, 2011 and June 30, 2011 was $(1,845) and $(262), respectively. The TRS is included in the above table with an investment performance rating of 4 as of September 30, 2011 and June 30, 2011.
10
Credit Quality Credit Quality – Investment Portfolio Fundamental credit quality remains strong, but continued weaknesses in two non-earning investments negatively impacted our quarterly financial results. Non-earning assets represent 0.6% of our loan portfolio at fair value as of September 30, 2011 89.5% of the loans in our investment portfolio at fair value have an investment performance rating of 4 or higher, which is a slight increase from June 30, 2011 and September 30, 2010 Credit Quality – Derivatives Unrealized losses of $1.7 million were primarily caused by mark-to-market adjustments on the broadly syndicated loans referenced in the TRS We view the mark-to-market adjustments on the broadly syndicated loans as temporary as the marks were driven by market yield adjustments and were not due to credit issues. Due to the post September 30, 2011 market rally in the broadly syndicated loan market as well as an increase in the net interest accrued on the TRS, the fair value of the TRS was $(0.5) million as of November 30, 2011, which is a $1.4 million increase from the fair value at September 30, 2011
11
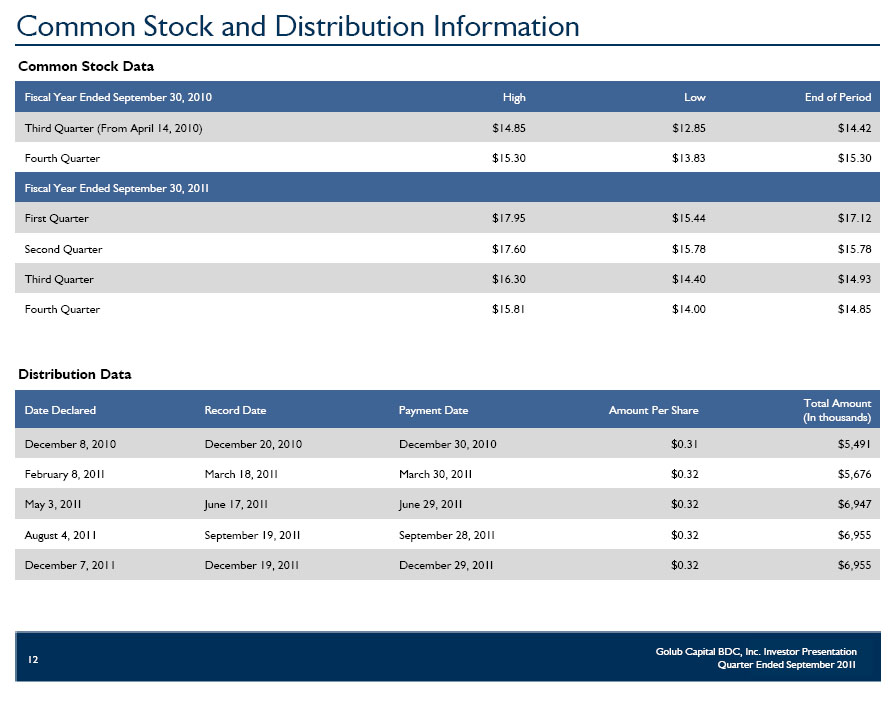
Common Stock and Distribution Information Common Stock Data Fiscal Year Ended September 30, 2010HighLowEnd of Period Third Quarter (From April 14, 2010)$14.85$12.85$14.42 Fourth Quarter$15.30$13.83$15.30 Fiscal Year Ended September 30, 2011 First Quarter$17.95$15.44$17.12 Second Quarter$17.60$15.78$15.78 Third Quarter$16.30$14.40$14.93 Fourth Quarter$15.81$14.00$14.85 Distribution Data Date DeclaredRecord DatePayment DateAmount Per ShareTotal Amount (In thousands) December 8, 2010December 20, 2010December 30, 2010$0.31$5,491 February 8, 2011March 18, 2011March 30, 2011$0.32$5,676 May 3, 2011June 17, 2011June 29, 2011$0.32$6,947 August 4, 2011September 19, 2011September 28, 2011$0.32$6,955 December 7, 2011December 19, 2011December 29, 2011$0.32$6,955
12
Liquidity and Investment Capacity Cash and Cash Equivalents Unrestricted cash totaled $46.4 million as of September 30, 2011. Restricted cash totaled $23.4 million as of September 30, 2011. Restricted cash as of September 30, 2011 was primarily held in our securitization vehicle and is available for new investments that qualify for this entity. SBIC Financing As of September 30, 2011, we had $61.3 million in debentures outstanding and $38.7 million in available SBIC debenture commitments. On September 13, 2011, we received exemptive relief from the SEC allowing us to modify the asset coverage requirement to exclude our SBA debentures from this calculation. Senior Secured Revolving Credit Facility As of September 30, 2011, subject to leverage and borrowing base restrictions, we had approximately $72.6 million available for additional borrowings on our revolving credit facility.
13
Liquidity and Investment Capacity New Investment Activity From October 1, 2011 to November 30, 2011 We made $102.5 million of new investment commitments. 33% were in senior secured debt, 18% were in unitranche investments, 22% were second lien loans, 24% were in junior debt and 3% were in equity securities. Weighted average rate on new debt and income producing securities of 10.7%. We received principal paydowns and payoffs on investments of $33.4 million. Hedging Instrument In September 2011, we entered into ten-year U.S. Treasury futures contracts reflecting a yield of 2.08% to mitigate our exposure to adverse fluctuation in interest rates with a total notional amount of $25 million. The interest rate on our SBA-guaranteed debentures is fixed semi-annually (the “pooling date”) and is based on the ten-year U.S. Treasury rate plus a market spread. The transaction insulates us against adverse changes in the ten-year U.S. Treasury rate for debentures that we have drawn, but for which the rate will not be fixed until the next pooling date.
14