Attached files
| file | filename |
|---|---|
| 8-K - Silicon Graphics International Corp | barclayconference8-k.htm |

Barclays Global Tech Conference NASDAQ: SGI December 7, 2011

©2011 SGI Legal Notice Safe Harbor Cautionary Statement This presentation contains forward-looking statements, including statements regarding management’s expectations about the markets, business, products, operating plans and financial performance of Silicon Graphics International Corp. (“SGI”) as of December 7, 2011. Statements containing words such as "will," "expect," "believe," and "intend," and other statements in the future tense, are forward-looking statements. Any statements contained in this presentation that are not statements of historical fact may be deemed forward-looking statements. Actual outcomes and results may differ materially from the expectations expressed or implied in these statements due to a number of risks and uncertainties, including, but not limited to: SGI operates in a very competitive market which may cause pricing pressure and impair our market penetration; SGI has extensive international business activities which create risks from complex international operations, foreign currency exposure and changing legal, regulatory, political or economic conditions, including SGI’s operations in Japan, which may be negatively affected by earthquakes and other natural disasters, as well as ongoing power supply disruptions following the March 2011 earthquake and tsunami; a significant portion of the Company's revenues has come from a limited number of customers and such customer concentration increases the risk of quarterly fluctuations in our revenues and operating results and the loss or reduction of business from one or a combination of our significant customers could materially affect our revenues, financial condition and results of operations; SGI is unable to control the supply of components, and, as a result, is experiencing and may experience in the future component shortages and delivery delays that can cause components to not be available at all and the price of components to increase and can result in component quality issues; SGI is unable to control component pricing, such as what our suppliers charge for central processing units, and, as has happened in the past, component pricing can rise unexpectedly, negatively impacting SGI’s gross margins as well as other financial measures; uncertainty arising from SGI’s increased dependence on business with U.S. Government entities; failure of our customers to accept new products; and economic conditions impacting the purchasing decisions of SGI’s customers. Detailed information about these and other risks and uncertainties that could affect SGI’s business, financial condition and results of operations is se t forth in SGI’s Annual Report on Form 10-K under the caption “Risks Factors,” which was filed with the Securities and Exchange Commission on August 29, 2011, as updated by the subsequent filings with the SEC made by SGI, all of which are available at www.sec.gov. Accordingly, you are cautioned not to place undue reliance on forward-looking statements. This presentation is as of December 7, 2011, and the continued posting or availability of this presentation does not imply that forward-looking statements continue to be true as of any later date. We expressly disclaim any obligation to update or alter our forward-looking statements, whether, as a result of new information, future events or otherwise, except where required by law. The SGI logos and SGI product names used or referenced herein are either registered trademarks or trademarks of Silicon Graphics International Corp. or one of its subsidiaries. All other trademarks, trade names, service marks and logos referenced herein belong to their respective holders. Any and all copyright or other proprietary notices that appear herein, together with this Legal Notice, must be retained on this presentation. Non-GAAP Reconciliation All non-GAAP financial measures contained in this presentation are reconciled to GAAP on slide 24 of this presentation. 2

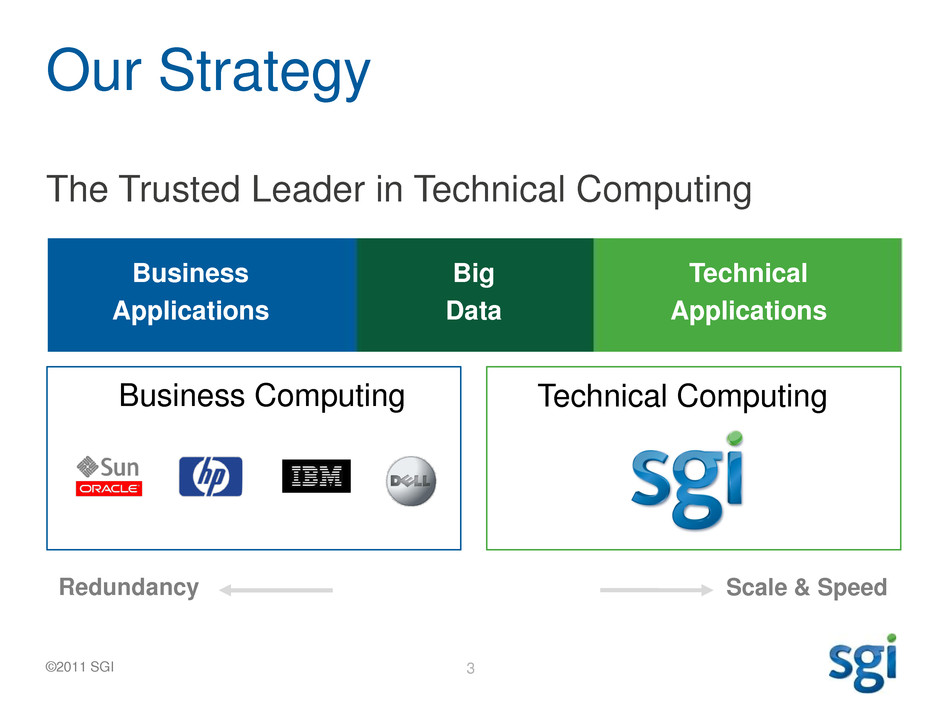
©2011 SGI Our Strategy The Trusted Leader in Technical Computing Business Computing Business Applications Technical Computing Workload Optimized Big Data Technical Applications Redundancy Scale & Speed 3

©2011 SGI The Opportunity HPC Commercial Scientific Modeling & Simulation Cloud Public Private Government Big Data Hadoop In-memory Analytics Archive Providing Customers with Trusted Technical Computing Solutions 4

Building Business Momentum • Largest Independent Provider of Technical Computing • Product Cycles Getting Stronger • Distribution in 50 countries • 1,500+ employees • Net Assets: $523M3 • Cash & Investments: $116M3 • Debt Free3 $780M $630M $404M $247M FY 08 2 FY 10 FY 11 FY 12 1 1 Revenue Guidance Range of $740m to $780m 2 Rackable acquired substantially all the assets of Silicon Graphics, Inc., changed name to SGI in May 2009, filed a 6-month stub year-end on 6-26-09 3 As of September 30, 2011 $740M 5

©2011 SGI Total Revenue 2004-2011 by quarter 0 25000 50000 75000 100000 125000 150000 175000 200000 In T hous a nd s HPC Internet * Rackable acquired substantially all the assets of Silicon Graphics, Inc., changed name to SGI in May 2009, filed a 6-month stub year-end on 6-26-09. Trends Driving Revenue Big Data 2004 2005 2006 2007 2008 2009 2010 2011 6

©2011 SGI Four Solution Pillars Compute Storage Software Services Designed to work together. Designed to scale. • SGI® ICE • SGI® UV • SGI® Rackable™ • Big Data Solutions • Project xRay • InfiniteStorage • ArcFiniti™ • OpenFOAM® • Management Center • Performance Center • DMF / XFS • Consulting Services • Managed Services • Customer Support Services 7

©2011 SGI Customers Trust SGI Mission, operations and exploration KEGG: World’s largest DNA Database Power allocation to 1 Billion People Maintaining nuclear warheads Protecting the warfighter Powering the cloud Discovering the next 100 years of energy Forecasting 8

©2011 SGI Q1 FY12 Life Sciences momentum Institute for Chemical Research at Kyoto University Planned HPC system to advance genomics research is expected to consist of SGI UV 1000 systems operating at 32.6 teraflops and delivering up to 6.6x performance increase over the previous system. Others: • Bayer BioScience N.V. • BIOGEMMA • IRB Barcelona • St. Jude Children's Hospital 9

©2011 SGI Upcoming Romley Cycle Significant update cycle across all product lines • SGI Rackable with up to 2x price/performance • Entering the large-scale cluster market (scale-out) with SGI ICE X • Mainstreaming shared memory with SGI UV (scale-up) • Expect revenue contribution in second half of FY12 From Teraflop to Petaflop computing NEW: SGI ICE X – Introduced at SC11 Highlights 10

Financial Overview 11

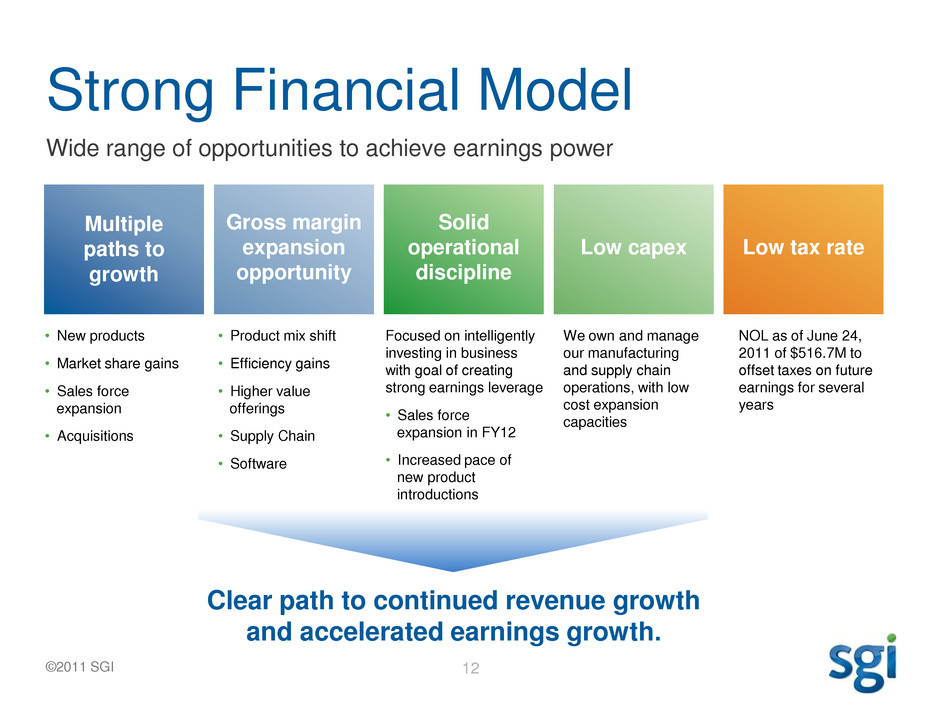
©2011 SGI Gross margin expansion opportunity Solid operational discipline Low capex Low tax rate Strong Financial Model Wide range of opportunities to achieve earnings power Clear path to continued revenue growth and accelerated earnings growth. • New products • Market share gains • Sales force expansion • Acquisitions • Product mix shift • Efficiency gains • Higher value offerings • Supply Chain • Software Focused on intelligently investing in business with goal of creating strong earnings leverage • Sales force expansion in FY12 • Increased pace of new product introductions We own and manage our manufacturing and supply chain operations, with low cost expansion capacities NOL as of June 24, 2011 of $516.7M to offset taxes on future earnings for several years Multiple paths to growth 12

©2011 SGI Q1 FY12 Results 13 * Sequential Growth = Q1 FY12 over Q4 FY11 Q1 FY12 Sequential Growth Year/Year Growth REVENUE $178.9M -8% 58% GROSS MARGIN 29.4% up 590 bps up 197 bps GAAP EPS (LOSS) ($0.08) up 31 cents up 29 cents NON-GAAP EPS (LOSS) $0.07 down 5 cents up 13 cents

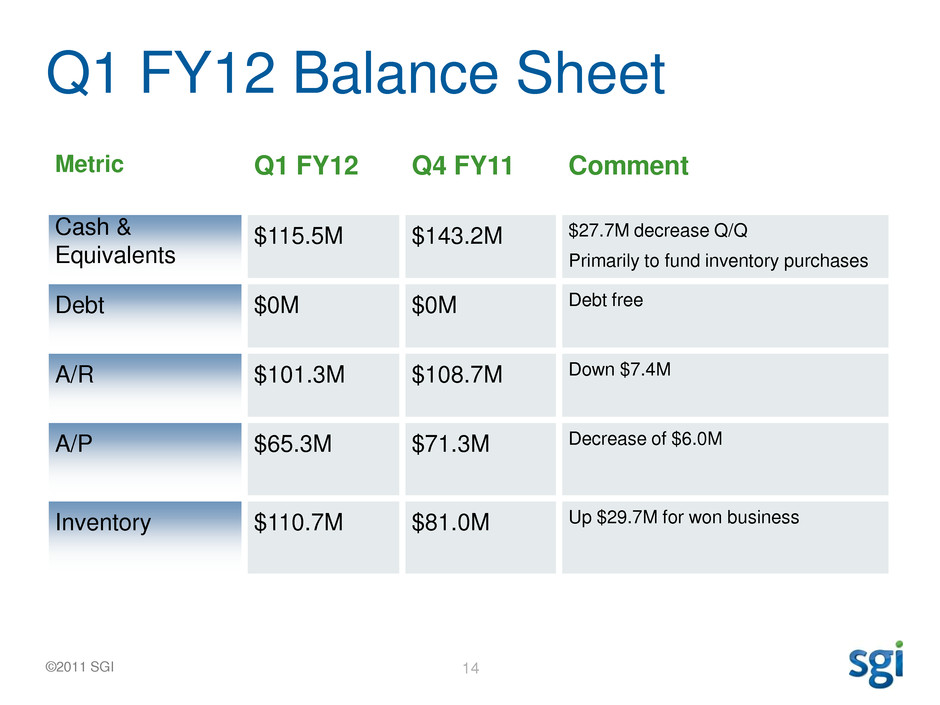
©2011 SGI Q1 FY12 Balance Sheet 14 Metric Q1 FY12 Q4 FY11 Comment Cash & Equivalents $115.5M $143.2M $27.7M decrease Q/Q Primarily to fund inventory purchases Debt $0M $0M Debt free A/R $101.3M $108.7M Down $7.4M A/P $65.3M $71.3M Decrease of $6.0M Inventory $110.7M $81.0M Up $29.7M for won business

©2011 SGI Q1 FY12 Results Q1 FY12 Q4 FY11 Q1 FY11 Research & Development $16.2M $13.6M $13.8M Sales & Marketing $21.8M $26.2M $14.9M General & Administrative $16.9M $15.6M $12.8M Restructuring $0.1M $3.4M $0.6M Acquisition-related $0M $0.2M $0M Total OPEX $55.0M $59.0M $42.1M 15

©2011 SGI Q1 FY12 Revenue Breakdown 16 PUBLIC SECTOR, 44% CLOUD, 25% MFG, 16% OTHERS, 15% , 0 Sales by Vertical Market Sales by Geographical Market Sales by Business Segment DOMESTIC, 59% INT'L, 41% PRODUCTS, 72% SERVICES, 28% , 0

©2011 SGI How we think about acquisitions • Balancing organic and acquisitive growth • We look for value • Accretive • Affinity: Storage, Services and Software The SGI Approach 17

©2011 SGI SGI Japan 18 * FY11 actuals as disclosed in 10-K, FY11 and FY12 estimates based on Q1FY12 earnings call FY11 Actual FY12 Guidance Year/Year Growth TOTAL SGI REVENUE $630M $740M - $780M 18 – 24% BUSINESS EXCLUDING JAPAN* FY11 Actual FY12 Guidance Year/Year Growth REVENUE $562M $640M - $680M 14 – 21%

©2011 SGI Scale and Flexibility • Filed Universal Shelf Registration Statement to sell up to $100M of stock – Provides us the flexibility to sell shares as and when required to pursue acquisitions and achieve our strategic objectives – No immediate plans to sell stock or issue debt but we may do so in the future opportunistically to minimize dilution of current shareholders • Secured an Asset-Backed Credit Facility of up to $50M – Allows us to fund working capital for larger orders and grow the company 19

©2011 SGI Re-affirming FY12 Guidance 20 FY12 Guidance Year/Year Comments REVENUE $740M to $780M 18% to 24% growth GROSS MARGIN 28% to 30% 100 to 300 bps growth EPS $0.15 to $0.30 $0.84 to $0.99 improvement Non-GAAP EPS $0.60 to $0.80 5% to 40% growth

Appendix 21

©2011 SGI Trended Financial Data SILICON GRAPHICS INTERNATIONAL CORP. AND SUBSIDIARIES TRENDED FINANCIAL DATA CONSOLIDATED STATEMENT OF OPERATIONS (In thousands, except per share amounts. Unaudited) Q1 FY'11 Q2 FY'11 Q3 FY'11 Q4 FY'11 Q1 FY'12 Revenue Product 62,357$ 114,719$ 88,205$ 127,380$ 108,568$ Service 33,719 32,959 34,143 47,130 48,615 Combined product and service 16,818 29,846 21,316 20,976 21,712 Total revenue 112,894 177,524 143,664 195,486 178,895 Cost of revenue Product 49,182 85,989 68,482 103,611 86,225 Service 19,179 18,392 19,883 33,649 25,785 Combined product and service 13,536 20,814 14,797 12,242 14,247 Total cost of revenue 81,897 125,195 103,162 149,502 126,257 Gross profit 30,997 52,329 40,502 45,984 52,638 Operating expenses: Research and development 13,753 13,415 13,305 13,594 16,190 Sales and marketing 14,938 18,021 16,607 26,247 21,798 General and administrative 12,754 11,770 12,428 15,626 16,885 Restructuring 635 166 915 3,356 133 Acquisition-related - - 1,094 177 - Total operating expenses 42,080 43,372 44,349 59,000 55,006 Loss from operations (11,083) 8,957 (3,847) (13,016) (2,368) Total other income (expense), net: Interest income (expense), net 130 96 10 (141) (98) Other income (expense), net 415 (4,595) 2,880 203 (858) Total other income (expense), net 545 (4,499) 2,890 62 (956) Loss before income taxes (10,538) 4,458 (957) (12,954) (3,324) Income tax provision (benefit) 649 734 715 (856) (667) Net income (loss) (11,187) 3,724 (1,672) (12,098) (2,657) Basic net income (loss) per share (0.37)$ 0.12$ (0.05)$ (0.40)$ (0.08)$ Diluted net income (loss) per share (0.37)$ 0.12$ (0.05)$ (0.40)$ (0.08)$ Shares used in computing net income (loss) per share Basic 30,536 30,321 30,577 30,608 31,303 Diluted 30,536 30,836 30,577 30,608 31,303 Non-GAAP net income (loss) per share (0.06)$ 0.44$ 0.07$ 0.12$ 0.07$ 22

©2011 SGI Trended Financial Data 23 SILICON GRAPHICS INTERNATIONAL CORP. AND SUBSIDIARIES TRENDED FINANCIAL DATA CONSOLIDATED BALANCE SHEETS (In thousands, except per share amounts. Unaudited) Q1 FY'11 Q2 FY'11 Q3 FY'11 Q4 FY'11 Q1 FY'12 ASSETS Current Assets: Cash and cash equivalents 88,207$ 100,941$ 128,727$ 139,868$ 112,490$ Current portion of restricted cash and cash equivalents 167 1,144 1,730 948 998 Accounts receivable, net 96,320 103,538 101,648 108,675 101,296 Inventories 105,358 79,074 82,722 80,965 110,726 Deferred cost of revenue 57,262 57,637 57,439 59,306 58,290 Prepaid Expenses and other current assets 15,625 19,574 15,527 17,937 16,021 Total current assets 362,939 361,908 387,793 407,699 399,821 Non-current portion of restricted cash and cash equivalents 3,102 3,241 3,351 2,390 2,025 Long-term investments 7,386 6,207 - - - Property and equipment, net 26,470 26,204 29,160 29,573 29,687 Intangible assets, net 15,203 12,608 18,068 13,289 12,296 Non-current portion of deferred cost of revenue 51,580 56,885 52,825 45,219 38,132 Other Assets 32,659 29,400 33,621 39,839 40,604 TOTAL ASSETS 499,339$ 496,453$ 524,818$ 538,009$ 522,565$ LIABILITIES AND STOCKHOLDERS’ EQUITY Current Liabilities: Accounts payable 47,974$ 41,452$ 44,065$ 71,299$ 65,250$ Accrued compensation 18,660 21,017 24,856 29,477 24,047 Current portion of notes payable - - 8,157 - - Current portion of deferred revenue 152,846 138,019 138,957 132,986 134,691 Other current liabilities 26,653 33,630 33,216 39,967 42,518 Total current liabilities 246,133 234,118 249,251 273,729 266,506 Notes payable, net of current portion - - 1,483 - - Non-current portion of deferred revenue 92,471 98,346 96,077 93,146 84,085 Long-term income taxes payable 22,333 23,400 24,285 24,104 21,886 Retirement benefit obligations (1) - - - 15,569 15,247 Other non-current liabilities 12,550 12,390 21,081 8,175 8,315 Total liabilities 373,487 368,254 392,177 414,723 396,039 Stockholder's equity 125,852 128,199 132,641 123,286 126,526 TOTAL LIABILITIES AND STOCKHOLDER'S EQUITY 499,339$ 496,453$ 524,818$ 538,009$ 522,565$ (1) Prior to June 24, 2011, this amount was presented as part of the "Other non-current liabilities".

©2011 SGI GAAP to Non-GAAP EPS Reconciliation SILICON GRAPHICS INTERNATIONAL CORP. AND SUBSIDIARIES TRENDED FINANCIAL DATA RECONCILIATION OF SELECTED GAAP MEASURES TO NON-GAAP MEASURES (In thousands, except per share amounts. Unaudited) Q1 FY'11 Q2 FY'11 Q3 FY'11 Q4 FY'11 Q1 FY'12 GAAP Net Income (Loss) (11,187)$ 3,724$ (1,672)$ (12,098)$ (2,657)$ Share-based Compensation (1) 1,192 1,261 1,495 1,950 2,069 Amortization of Intangibles (1) 1,020 2,595 1,398 3,283 1,648 Restructuring Charges (2) 635 166 915 3,356 133 Transaction Related (2) - - 1,094 177 - Revenue Recognition Related (2) 5,288 787 (612) 3,760 - Other (3) 1,214 5,103 (341) 3,486 1,000 Non-GAAP Net Income (Loss) (1,838) 13,636 2,277 3,914 2,193 Shares used in computing net income (loss) per share Basic 30,536 30,321 30,577 30,608 31,303 Diluted 30,536 30,836 30,577 30,608 31,303 GAAP Basic and diluted net loss per share (0.37)$ 0.12$ (0.05)$ (0.40)$ (0.08)$ Non-GAAP Basic net income/(loss) per share (0.06)$ 0.45$ 0.07$ 0.13$ 0.07$ Non-GAAP Dilutive net income/(loss) per share (0.06)$ 0.44$ 0.07$ 0.13$ 0.07$ (1) Adjustments to exclude certain non-cash expenses such as share-based compensation and amortization of intangible assets. Restructuring Charges — Restructuring charges consist primarily of severance expense , facility closure and relocation costs. Revenue Recognition Related - The Company added back gross margin impacts from revenue arrangements deferred under Software Revenue Recognition rules (ASC 985-605) and fair value allocation rules (ASC 605-25) in fiscal year 2011. These add backs are no longer presented for fiscal year 2012. (2) Adjustments to exclude the items discussed below because such items are either operating expenses which would not otherwise have been incurred by the company in the normal course of the company's business operations or are not reflective of the company's core results over time. These items may include recurring as well as non-recurring items. Transaction-Related Costs — The Company excludes certain expense items resulting from actual or potential transactions such as business combinations, mergers, acquisitions, and financing transactions, including expenses for advisors and representatives such as investment bankers, consultants, attorneys, and accounting firms. NOTE: This presentation includes certain financial measures not in conformity with Generally Accepted Accounting Principles in the United States (non-GAAP measures). Our non-GAAP measures are not meant to be considered in isolation or as a substitute for comparable GAAP measures, and should be read only in conjunction with our consolidated financial statements prepared in accordance with GAAP. (3) Adjustments to exclude certain non-cash expenses and/or certain items which are either operating expenses which would not otherwise have been incurred by the company in the normal course of the company's business operations or are not reflective of the company's core results over time. These items may include recurring as well as non-recurring items such as: (i) realized gains/losses on the Company's auction rate securities, (ii) other-than-temporary impairment of an equity investment, (iii) litigation or dispute settlement charges or gains, (iv) inventory step-up from acquisitions, and (v) incremental excess and obsolete long-term service inventory charges. 24

©2011 SGI 25
