Attached files
| file | filename |
|---|---|
| 8-K - FORM 8-K - TIDEWATER INC | d262909d8k.htm |
| EX-99.2 - DAHLMAN ROSE & CO. ULTIMATE OIL SERVICES & DRILLING CONFERENCE TRANSCRIPT - TIDEWATER INC | d262909dex992.htm |
 DAHLMAN ROSE & CO. ULTIMATE
OIL SERVICES & DRILLING CONFERENCE
OIL SERVICES & DRILLING CONFERENCE
Nov. 29, 2011
Nov. 29, 2011
DEAN E. TAYLOR
DEAN E. TAYLOR
Chairman, President and CEO
Chairman, President and CEO
JOSEPH M. BENNETT
JOSEPH M. BENNETT
Executive VP and Chief
Executive VP and Chief
Investor Relations Officer
Investor Relations Officer
Exhibit 99.1 |
 2
In accordance with the safe harbor provisions of the Private Securities Litigation
Reform Act of 1995, the Company notes that certain statements set forth in this
presentation provide other than historical information and are forward looking. The
actual achievement of any forecasted results, or the unfolding of future economic or
business developments in a way anticipated or projected by the Company, involve
numerous risks and uncertainties that may cause the Company’s actual performance
to be materially different from that stated or implied in the forward-looking
statement. Among those risks and uncertainties, many of which are beyond the
control of the Company, include, without limitation, volatility in worldwide energy
demand and oil and gas prices; fleet additions by competitors and industry
overcapacity; changes in capital spending by customers in the energy industry for
offshore
exploration,
field
development
and
production;
changing
customer
demands
for vessel specifications, which may make some of our older vessels technologically
obsolete for certain customer projects or in certain markets; uncertainty of global
financial market conditions and difficulty in accessing credit or capital; acts of
terrorism and piracy; significant weather conditions; unsettled political conditions,
war, civil unrest and governmental actions, such as expropriation, especially in higher
risk countries where we operate; foreign currency fluctuations; labor influences
proposed by international conventions; increased regulatory burdens and oversight
following
the
Deepwater
Horizon
incident;
and
enforcement
of
laws
related
to
the
environment,
labor
and
foreign
corrupt
practices.
Readers
should
consider
all
of
these
risk factors as well as other information contained in this report.
Phone:
504.568.1010
Fax:
504.566.4580
Web:
www.tdw.com
Email:
connect@tdw.com
FORWARD-LOOKING STATEMENTS
FORWARD-LOOKING STATEMENTS |
 3
KEY TAKEAWAYS
KEY TAKEAWAYS
•
Culture of safety & operating excellence
•
Macro picture improving with increased working rigs
•
History of earnings growth and solid returns
•
Unmatched scale and scope of operations
•
World’s largest and newest fleet provides basis for
continued earnings growth
•
Strong balance sheet allows us to act upon available
opportunities |
 SAFETY REMAINS A TOP PRIORITY
SM
4
Operating safely offshore is
like holding a snake by its head.
It’s a task that can’t be turned
loose not for a microsecond or an
accident will strike without pity. |
 5
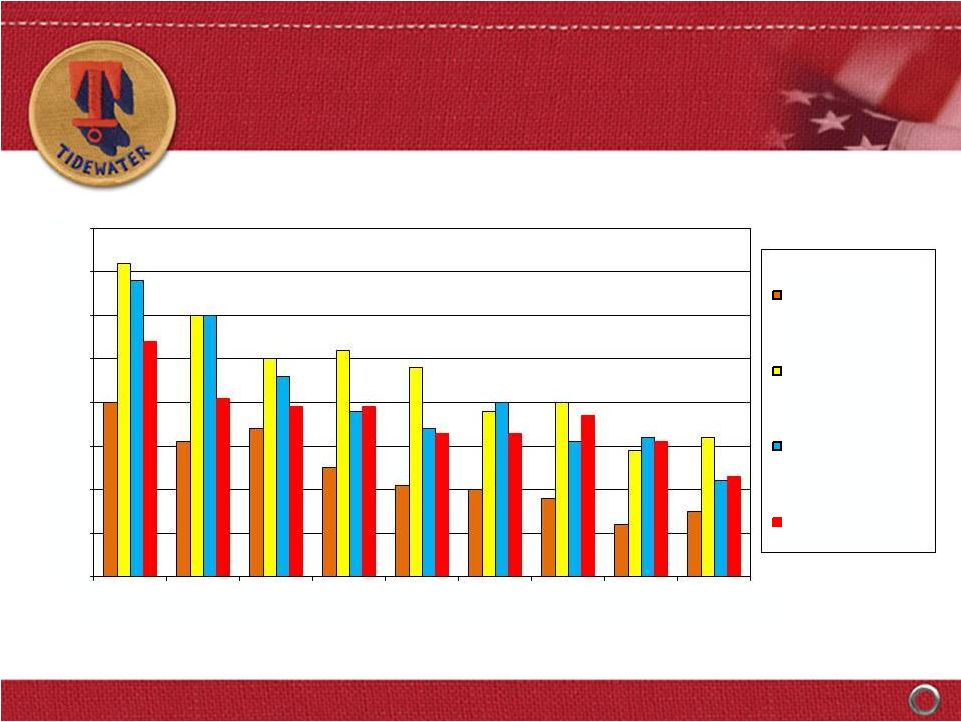
SAFETY RECORD RIVALS
LEADING COMPANIES
0.00
0.10
0.20
0.30
0.40
0.50
0.60
0.70
0.80
2002
2003
2004
2005
2006
2007
2008
2009
2010
CALENDAR YEARS
TOTAL RECORDABLE INCIDENT RATES
TIDEWATER
DOW CHEMICAL
CHEVRON
EXXON/MOBIL |
 6
Source: ODS-Petrodata and Tidewater
GOM
accounts
for
31
of
the
36
working
jackup
count
variance
from
June
2008
(Peak) to November 2011 (post-Horizon)
GOM Semi & Drillship count drops by 3 units (from 31 to 28) between April 2010
and
November
2011;
offset
by
an
increase
of
30
units
in
the
rest
of
world
Jackups
Semis
Drillships
Total
June 2008
(Peak)
379
145
30
554
Late-April 2010
(pre-Horizon)
323
150
46
519
Nov. 2011
(post-Horizon)
343
169
54
566
WORKING RIG COUNTS
WORKING RIG COUNTS
“Peak to Present”
“Peak to Present” |
 7
0
50
100
150
200
250
300
1965
1970
1975
1980
1985
1990
1995
2000
2005
2010
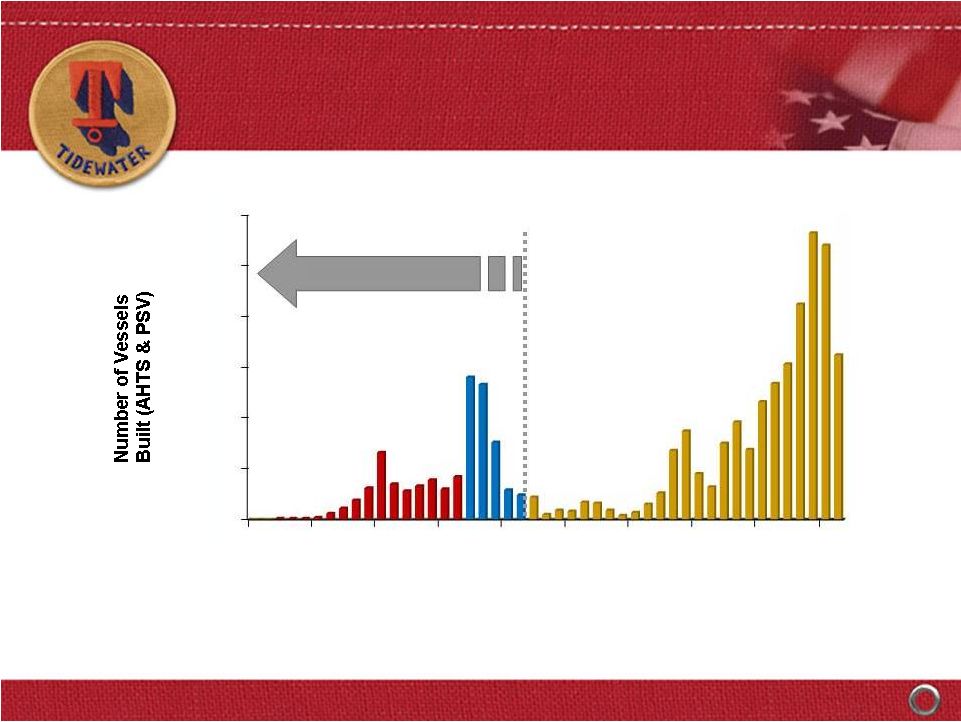
Source: ODS-Petrodata and Tidewater
As of early-November 2011, there are approximately 447 additional AHTS
and PSV’s (~17% of the global fleet) under construction.
Global
fleet
estimated
at
2,686
vessels,
including
345
vessels
that
are
30+
yrs
old
(13%),
and
another
402
vessels
that
are
25-29
yrs
old
(15%)
THE WORLDWIDE OSV FLEET –
RETIREMENTS
EXPECTED TO EXCEED NEW DELIVERIES
(Includes AHTS and PSV’s only) Estimated as of November 2011
Vessels > 25 years old today |
 8
**
EPS in Fiscal 2004 is exclusive of the $.30 per share after tax impairment charge.
EPS in Fiscal 2006 is exclusive of the $.74 per share after tax gain from the
sale of six KMAR vessels. EPS in Fiscal 2007 is exclusive of $.37 per share of
after tax gains from the sale of 14 offshore tugs. EPS in Fiscal 2010 is
exclusive of $.66 per share Venezuelan provision, a $.70 per share tax benefit
related to favorable resolution of tax litigation and a $0.22 per share charge
for the proposed settlement with the SEC of the company’s FCPA matter. EPS in Fiscal 2011 is exclusive of total $0.21 per share charges for
settlements with DOJ and Government of Nigeria for FCPA matters,
a $0.08 per share charge related to participation in a multi-company
U.K.-based pension plan and a $0.06 per share impairment charge related to
certain vessels. Adjusted Return
On Avg. Equity
4.3% 7.2%
12.4%
18.5% 18.3%
19.5%
11.4% 4.0%
Adjusted EPS**
Adjusted EPS**
HISTORY OF EARNINGS GROWTH
HISTORY OF EARNINGS GROWTH
AND SOLID THROUGH-CYCLE RETURNS
AND SOLID THROUGH-CYCLE RETURNS
$2.40
$5.20
$7.89
$1.03
$1.78
$3.33
$5.94
$6.39
$0.00
$2.00
$4.00
$6.00
$8.00
Fiscal
2004
Fiscal
2005
Fiscal
2006
Fiscal
2007
Fiscal
2008
Fiscal
2009
Fiscal
2010
Fiscal
2011 |
 9
Unique global footprint
50+ years of Int’l experience
International (non U.S.) markets generally
characterized by:
•
More growth
•
Longer contracts
•
Better utilization
•
Higher dayrates
Solid customer base of NOC’s and IOC’s
INTERNATIONAL STRENGTH
INTERNATIONAL STRENGTH |
 10
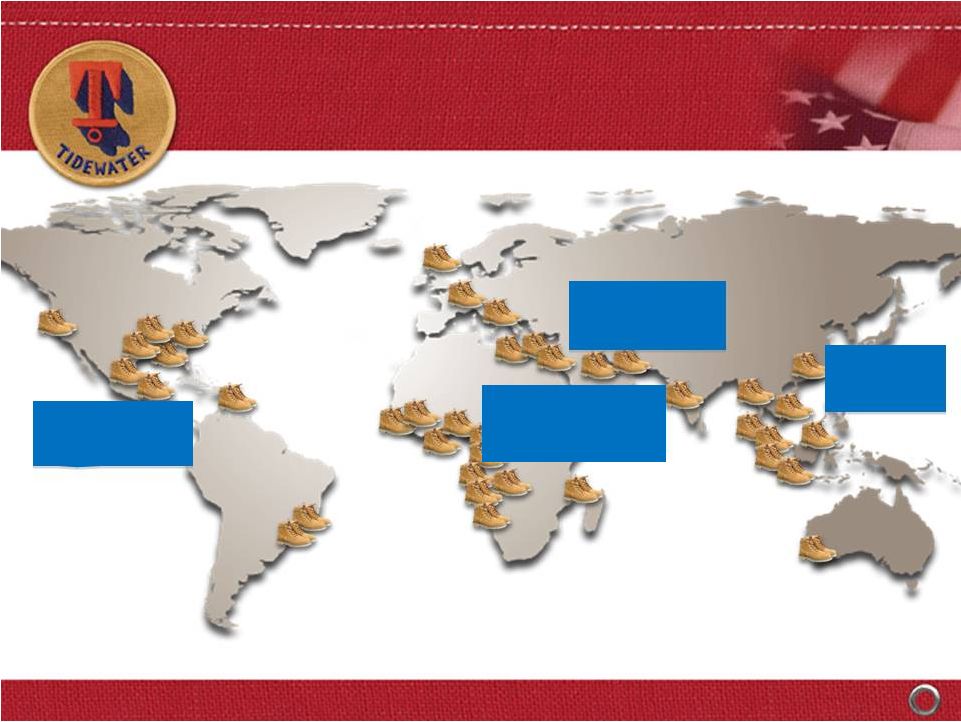
OUR GLOBAL FOOTPRINT
OUR GLOBAL FOOTPRINT
Vessel Distribution by Region
Vessel Distribution by Region
(excludes
(excludes
stacked
stacked
vessels
vessels
–
–
as
as
of
of
9/30/11)
9/30/11)
In
2Q
FY
2012,
<5%
of
vessels/revenue
was
generated
in
U.S.
GOM;
however,
39
total
U.S.-flagged vessels provide good optionality to a recovery in the U.S.
GOM. 10
Americas
66
(25%)
SS Africa/Europe
125
(48%)
MENA
37
(14%)
Asia/Pac
32
(12%) |
 11
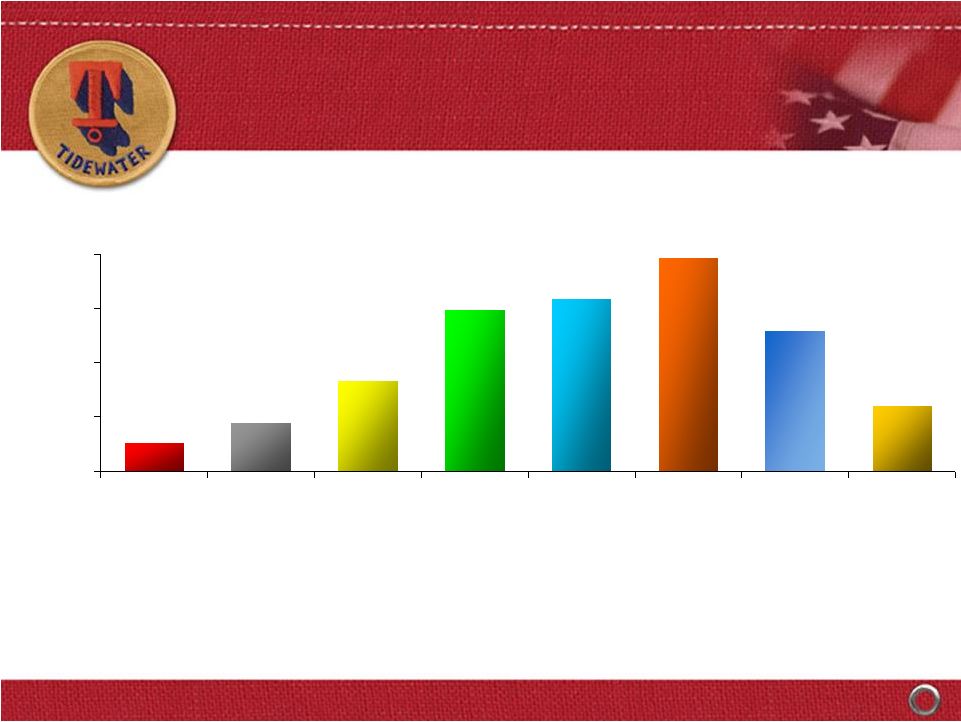
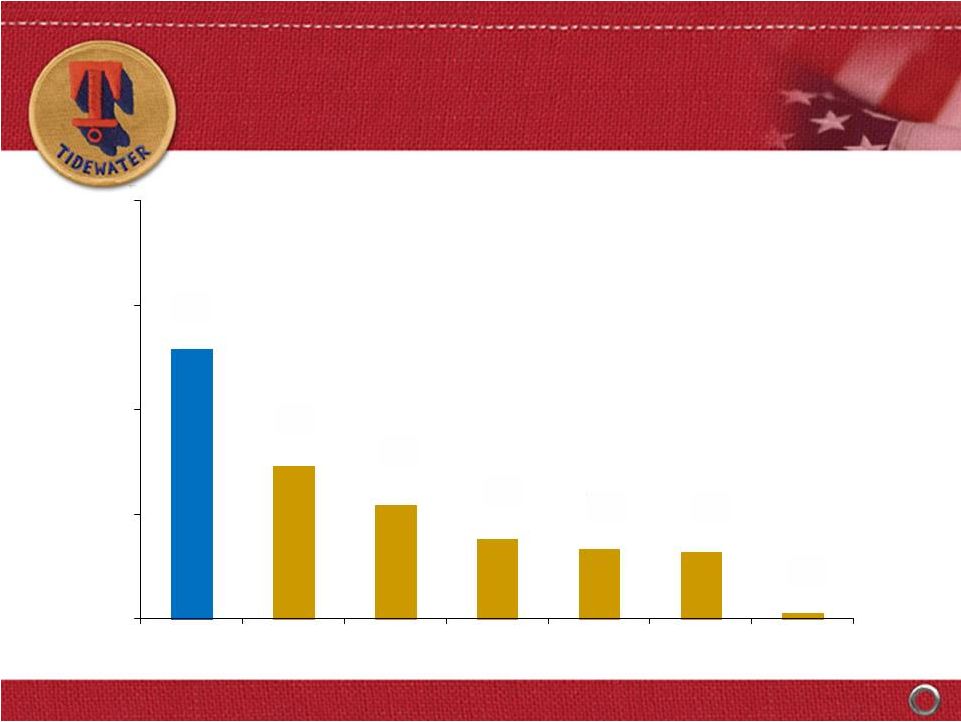
Source: ODS-Petrodata and Tidewater
Tidewater
Competitor #2
Competitor #3
Competitor #4
Competitor # 5
Competitor #1
Avg.
All Others (1,966 total
vessels for
350+ owners)
258
146
109
76
67
64
5
0
100
200
300
400
Tidewater
AHTS
and
PSV
fleet
includes
147
vessel
additions
since
2000
(AHTS and PSV’s only) –
Estimated as of November 2011
VESSEL POPULATION BY OWNER |
 12
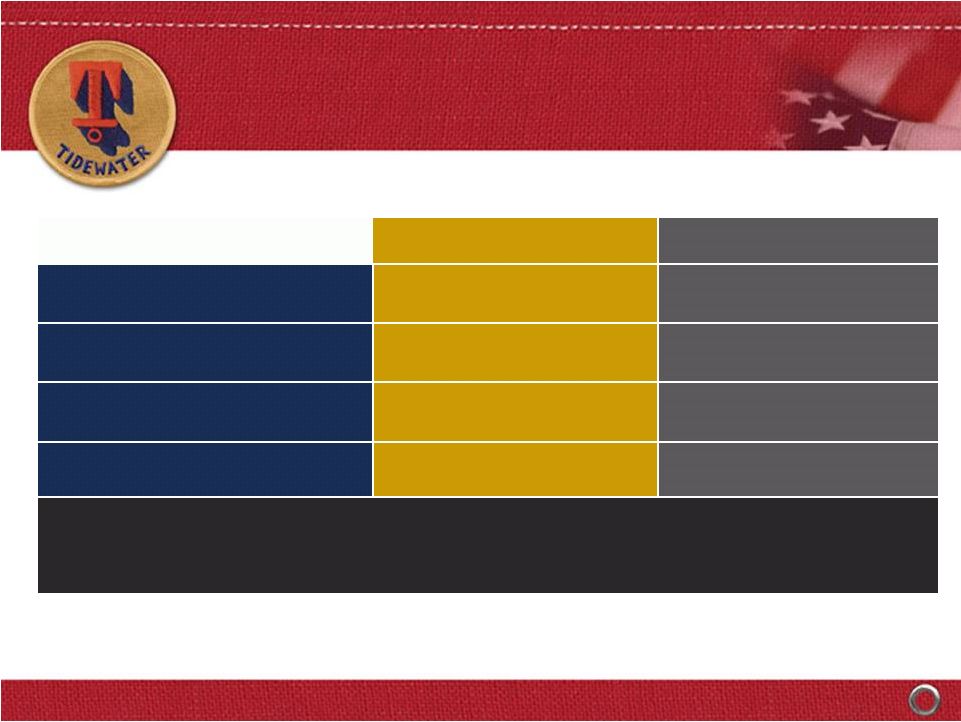
At 9/30/11, 201 new vessels were in our fleet with ~5.2 year average age
Vessel Commitments
Jan. ’00 –
September ‘11
(1)
$3,446m (87%) funded through 9/30/11
THE LARGEST MODERN OSV FLEET
THE LARGEST MODERN OSV FLEET
IN THE INDUSTRY….
IN THE INDUSTRY….
AHTS
PSV’s
Crewboats & Tugs
TOTALS:
Vessel Count
88
103
71
262
Estimated Cost
$1,805m
$1,842m
$301m
$3,948m
(1) |
 13
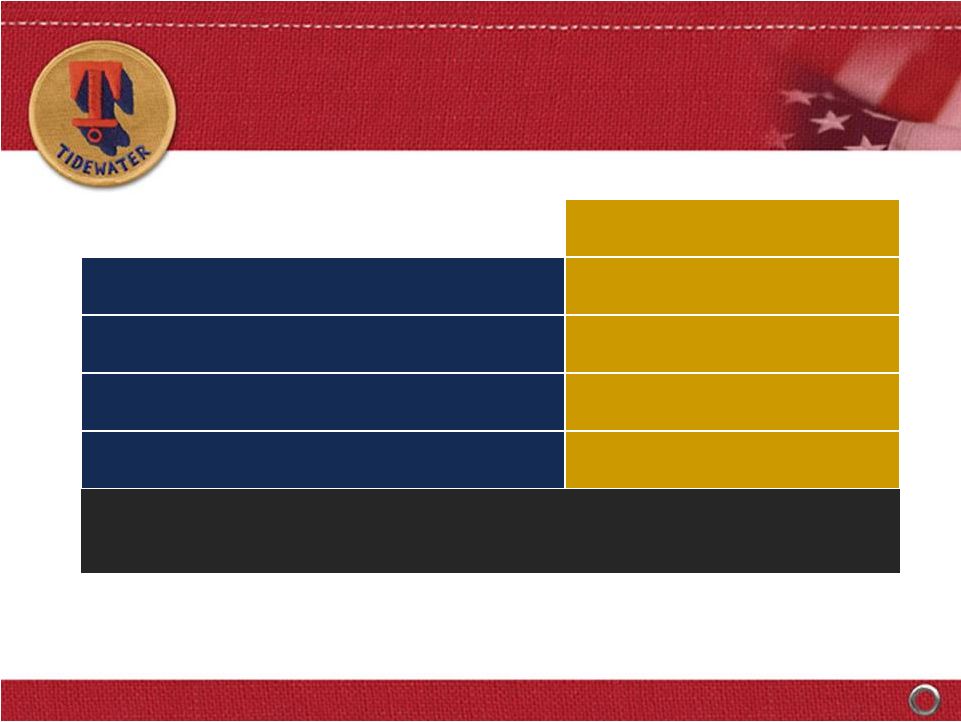
Count
AHTS
16
PSV
19
Crew and Tug
5
Total
40
Vessels Under Construction*
As of September 30, 2011
* Includes 12 new vessel purchase commitments at 9/30/11
Estimated delivery schedule –
20 in FY ‘12, 13 in FY ‘13 and 7 thereafter.
CAPX of $306m in remainder of FY ‘12, $164m in FY ‘13 and $32m in FY
’14. …
…
AND MORE TO COME
AND MORE TO COME |
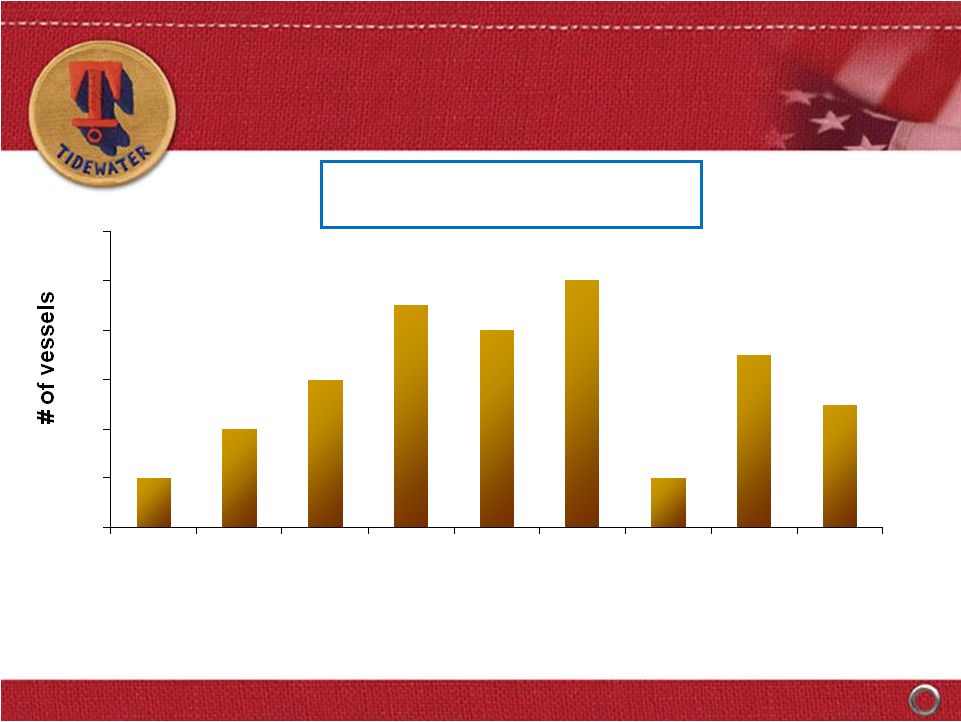
 14
Fiscal Year
Actual vessel deliveries through 9/30/11; estimated vessel deliveries based on
commitments to build or acquire as of 9/30/11
Through 9/30/11, vessel
commitments include 262 vessels
with a capital cost of $3.948 billion
THROUGH-CYCLE, EVA-BASED INVESTMENT;
BALANCE BETWEEN “BUY”
and “BUILD”
0
5
10
15
20
25
30
35
2001
2002
2003
2004
2005
2006
2007
2008
2009
2010
2011
2012
2013
2014
Built
Acquired |
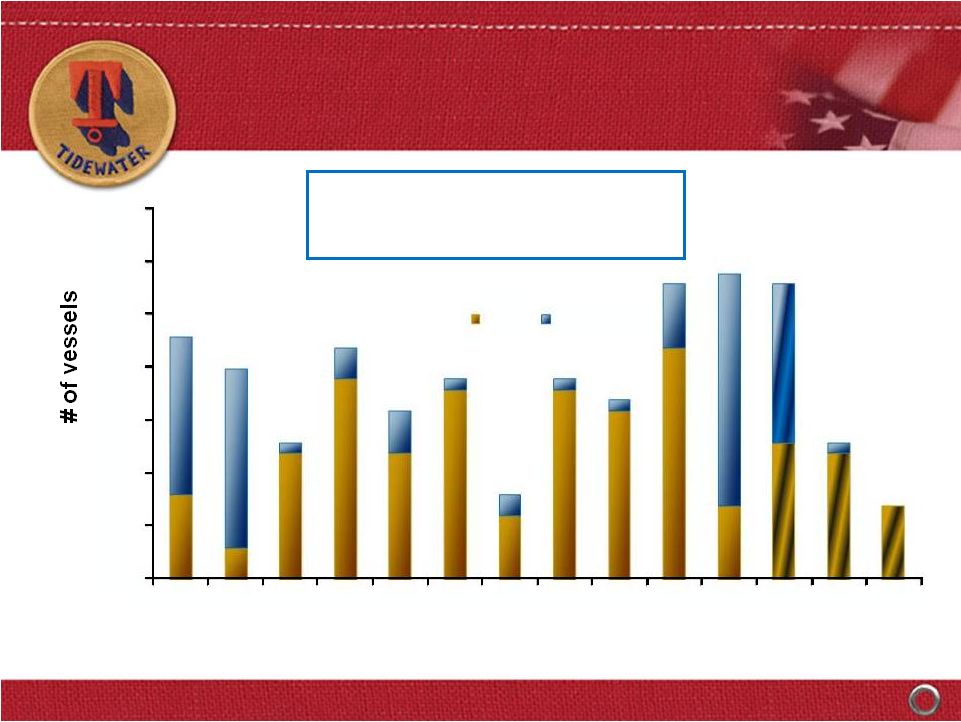
 15
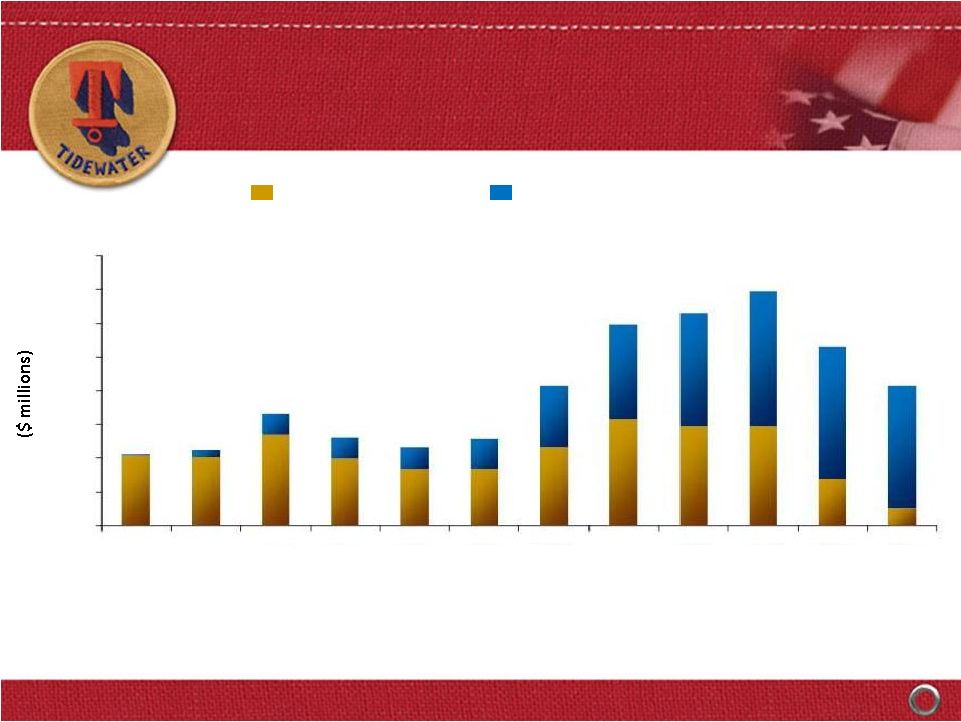
RECENT VESSEL COMMITMENTS
RECENT VESSEL COMMITMENTS
0
2
4
6
8
10
12
9/30/09
Qtr
12/31/09
Qtr
3/31/10
Qtr
6/30/10
Qtr
9/30/10
Qtr
12/31/10
Qtr
3/31/11
Qtr
6/30/11
Qtr
9/30/11
Qtr
Amounts
depict
vessel
count
and
total
cost
in
quarter
commitment
was
made
to
acquire
(not
when
delivery
or
payments
were
made)
$96M
$55M
$72M
$179M
1 MPSV
1 PSV
4 AHTS
6 AHTS
6 AHTS
3 PSV’s
53 vessels over last 2+ years with
a total capital cost of $982 million
$177M
4 PSV’s
4 AHTS
1 PSV
9 AHTS
$139M
$101M
2 PSV’s
4 PSV
3 AHTS
$139M
$24M
1 AHTS
4 CREW |
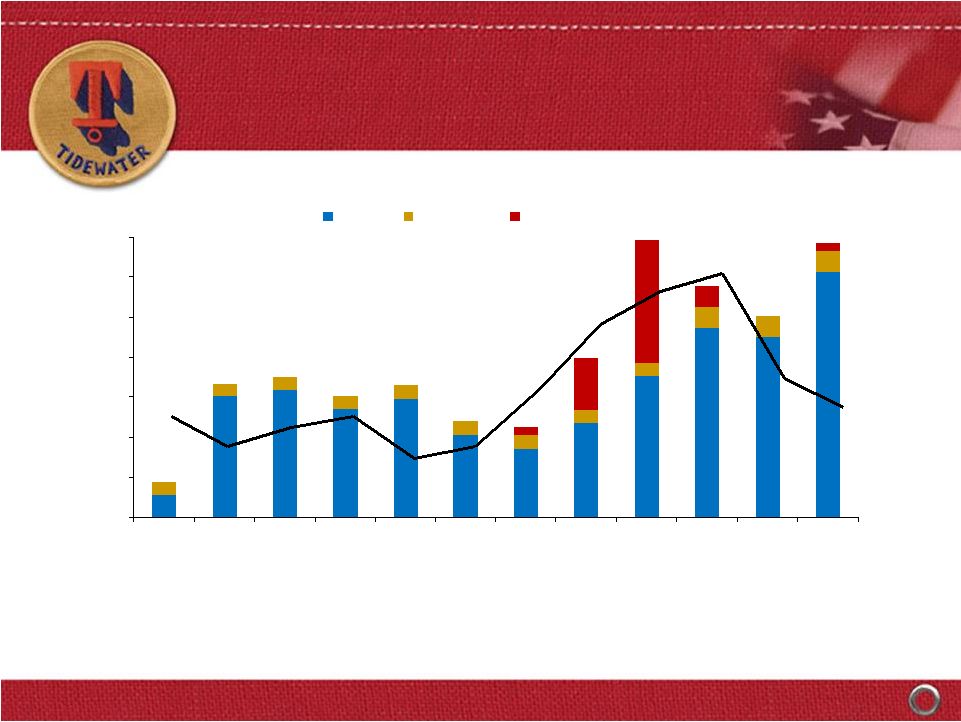 16
Over
a
12-year
period,
Tidewater
has
invested
$3.8
billion
in
CapEx
($3.3
billion
in
the
“new”
fleet),
and paid out $995 million through dividends and share repurchases. Over the
same period, CFFO and proceeds from dispositions were $3.4 billion and $690
million, respectively $0
$100
$200
$300
$400
$500
$600
$700
2000
2001
2002
2003
2004
2005
2006
2007
2008
2009
2010
2011
CAPX
Dividend
Share Repurchase
$ in millions
CFFO
Fiscal Year
FLEET RENEWAL & EXPANSION
FUNDED BY CFFO THROUGH FISCAL 2011 |
 17
Senior Unsecured Notes
$590 million
Average Life to Maturity (as of 9/30/11)
~ 8.5 years
Weighted Average Coupon
4.30%
Term Loan
$125 million
Revolving Line of Credit
$450 million
Remaining Term
~ 4½
years
Interest Rate
LIBOR plus 1.5% to
2.25%, based on leverage
Private Placement Financings:
Private Placement Financings:
New Credit Facilities:
New Credit Facilities:
~ $40 million in senior notes maturities in Fiscal 2012 (July)
RECENT FINANCINGS WILL FUND GROWTH
RECENT FINANCINGS WILL FUND GROWTH
AT AN ATTRACTIVE RELATIVE COST
AT AN ATTRACTIVE RELATIVE COST |
 18
As of September 30, 2011
Cash & Cash Equivalents
$302 million
Total Debt
$825 million
Shareholders Equity
$2,513 million
Net Debt / Net Capitalization
17%
Total Debt / Capitalization
25%
~$900
million
of
liquidity
as
of
9/30/11,
including
$575
million
available
under
bank
credit facilities.
STRONG
STRONG
FINANCIAL POSITION
FINANCIAL POSITION
PROVIDES
PROVIDES
STRATEGIC OPTIONALITY
STRATEGIC OPTIONALITY |
 19
FLEET CASH OPERATING MARGINS
FLEET CASH OPERATING MARGINS
Traditional Vessels
New Vessels
Cash Oper Margin
38.6% 37.6% 46.5%
41.9%
36.9% 38.7% 49.1%
54.6%
51.9% 51.3% 46.8%
39.3%
Note:
Cash
operating
margins
are
defined
as
vessel
revenue
less
vessel
operating
expenses
Fiscal Years
$0
$100
$200
$300
$400
$500
$600
$700
$800
2000
2001
2002
2003
2004
2005
2006
2007
2008
2009
2010
2011 |
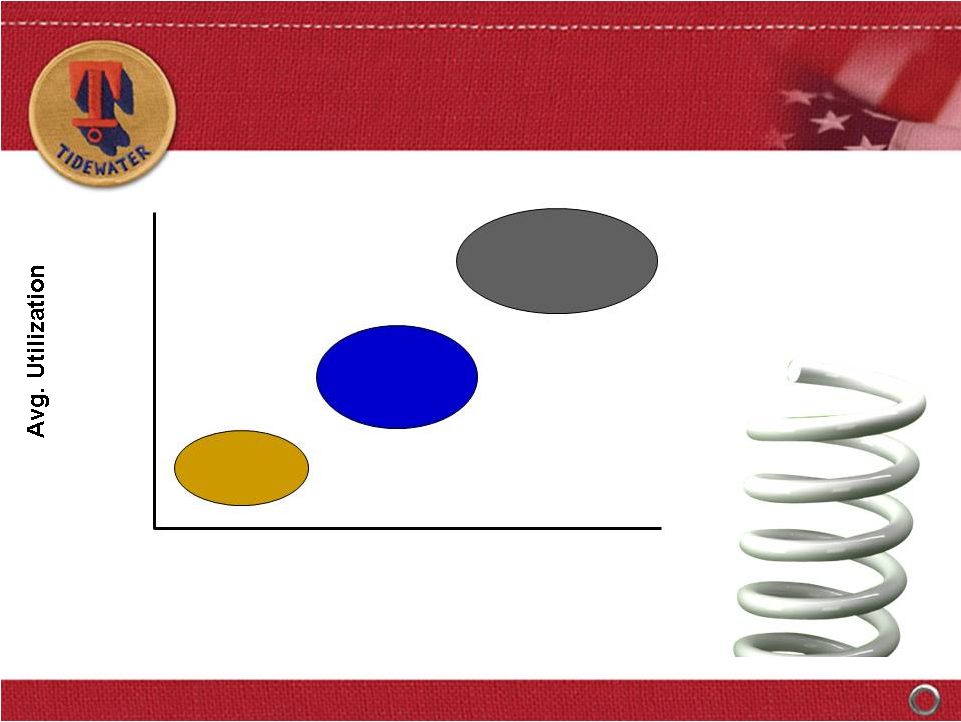 20
Avg. Dayrates
$14,190*
$15,609
(+ 10%)
$17,170
(+ 10%)
82.4%*
85.0%
90.0%
~$3.00
EPS
~$5.15
EPS
~$8.70
EPS
271 vessel assumption (201 current new vessels + 40 under construction + ~ 20
additional new vessels per year for two years).
* 9/30/11 YTD actual stats
This info is not meant to be a
prediction of future earnings
performance, but simply an
indication of earning sensitivities
resulting from future fleet
additions and reductions and
varying operating assumptions
~$375M+
EBITDA
~$500M
EBITDA
~$700M
EBITDA
WHERE COULD
WHERE COULD
FISCAL 2014 FIND US?
FISCAL 2014 FIND US?
Potential
Potential
for Earnings Acceleration
for Earnings Acceleration |
 21
FINANCIAL STRATEGY FOCUSED
FINANCIAL STRATEGY FOCUSED
ON CREATING LONG-TERM
ON CREATING LONG-TERM
SHAREHOLDER VALUE
SHAREHOLDER VALUE
Maintain
Maintain
Financial Strength
Financial Strength
EVA-Based Investments
EVA-Based Investments
On Through-cycle Basis
On Through-cycle Basis
Deliver Results
Deliver Results |
 DAHLMAN ROSE & CO. ULTIMATE
OIL SERVICES & DRILLING CONFERENCE
OIL SERVICES & DRILLING CONFERENCE
Nov. 29, 2011
. 29, 2011
, 2011
DEAN E. TAYLOR
DEAN E. TAYLOR
Chairman, President and CEO
Chairman, President and CEO
JOSEPH M. BENNETT
JOSEPH M. BENNETT
Executive VP and Chief
Executive VP and Chief
Investor Relations Officer
Investor Relations Officer |
 23
APPENDIX
APPENDIX |
 24
Six Months Ended
9/30/11
9/30/10
Revenues
$506
$530
Net Earnings*
$42
$59
EPS*
$0.81
$1.15
Net Cash from Operations
$87
$153
Capital Expenditures
$155
$391
* Excludes $22.1 million, or $0.43 per share, goodwill impairment charge in
September 2011 $ in Millions, Except Per Share Data
RECENT FINANCIAL RESULTS
RECENT FINANCIAL RESULTS
REFLECT
REFLECT
CYCLICAL DOWNTURN
CYCLICAL DOWNTURN |
 25
Other Operators
Top 10 Customers
Tidewater’s top 10 customers contract ~24% of the working worldwide
jackup fleet and ~50% of the working worldwide floater fleet
Jackups
(343 Working Rigs)
Floater Rigs
(223 Working Rigs)
81
262
110
Source: ODS-Petrodata and Tidewater
Other Operators
Top 10 customers
113
RIGS CONTRACTED BY OUR
RIGS CONTRACTED BY OUR
TOP 10 CUSTOMERS
TOP 10 CUSTOMERS
(Estimated as of November 2011) |
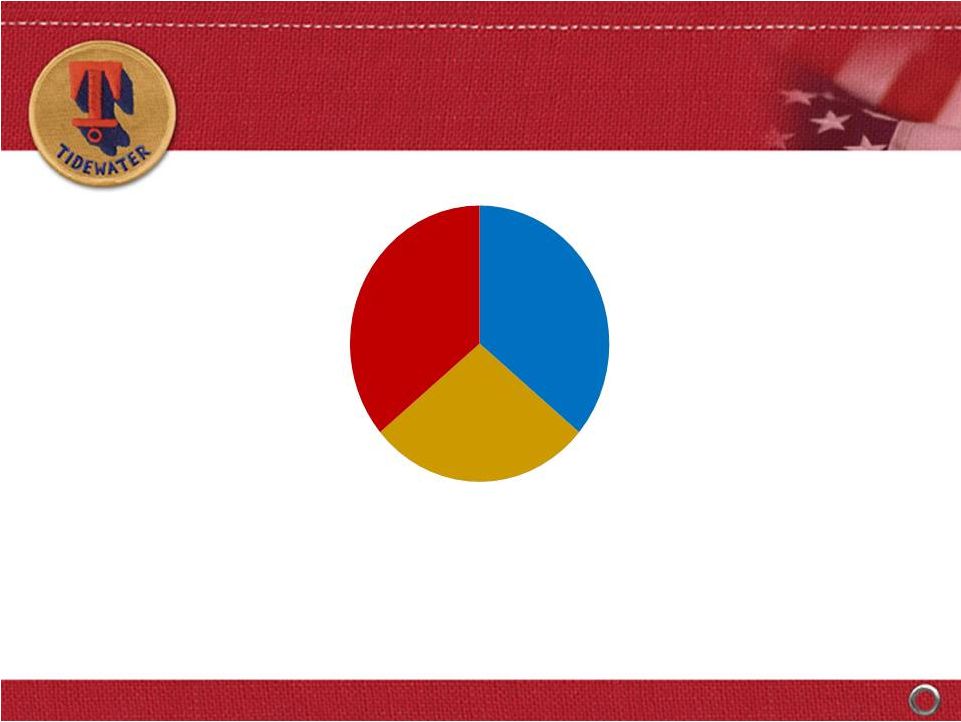 26
Our top 10 customers in Fiscal 2011 (5 Super Majors,
3 NOC’s and 2 large independents) accounted for 63% of our revenue
Super Majors
36%
NOC's
28%
Others
36%
CURRENT REVENUE MIX
CURRENT REVENUE MIX
Quality of Customer Base
Quality of Customer Base |
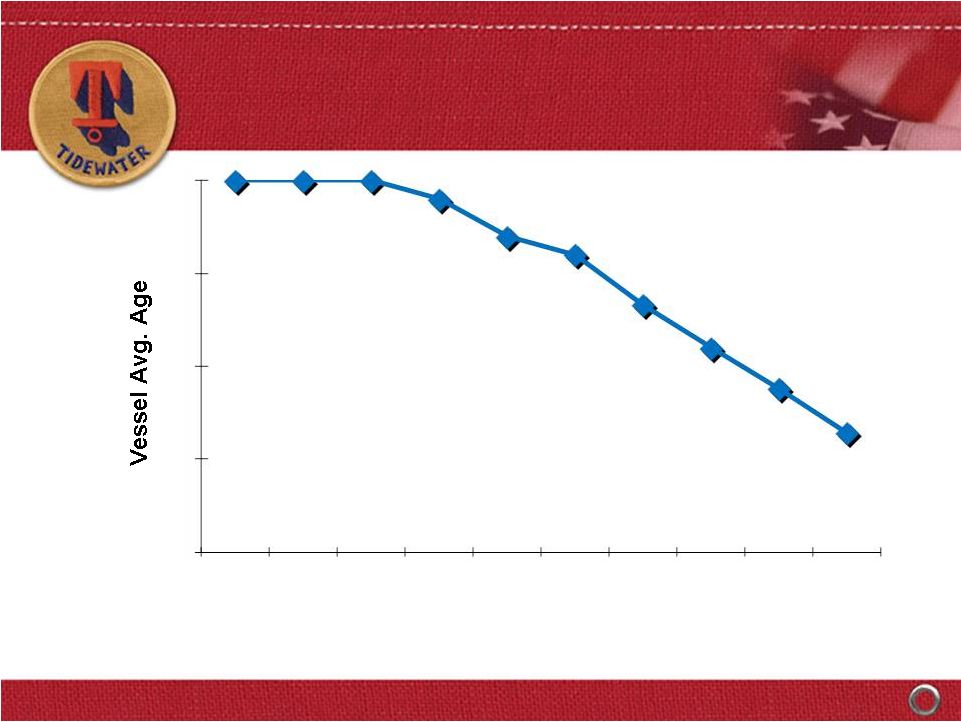 27
Assumptions:
1)
Average 45 vessel disposals per year in future (versus an average of 52 vessel
dispositions per year over last 3 years). 2)
Includes 40 vessels under construction, including 12 vessel purchase commitments
(based on current estimated delivery schedule), plus additional
newbuilds/acquisitions of ~20 vessels per year (approximately $500 million in
new capital commitments per year). Tidewater is not committed to spending
$500 million annually, but we use this assumption in estimating average fleet
age in the future. 20
16
6
0
5
10
15
20
3/31/06
3/31/07
3/31/08
12/31/08
12/31/09
12/31/10
12/31/11
12/31/12
12/31/13
12/31/14
SIGNIFICANT AVERAGE
SIGNIFICANT AVERAGE
AGE IMPROVEMENT
AGE IMPROVEMENT |
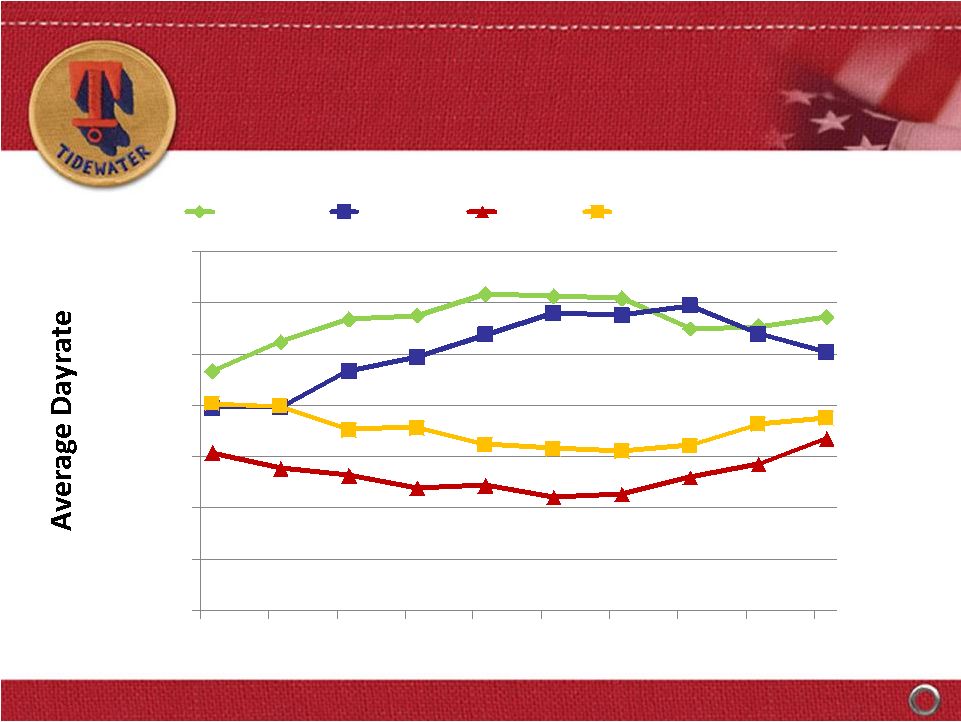 28
$4,000
$6,000
$8,000
$10,000
$12,000
$14,000
$16,000
$18,000
6/09
9/09
12/09
3/10
6/10
9/10
12/10
3/11
6/11
9/11
Americas
Asia/Pac
MENA
Sub Sah Africa
VESSEL DAYRATES BY SEGMENT
VESSEL DAYRATES BY SEGMENT |
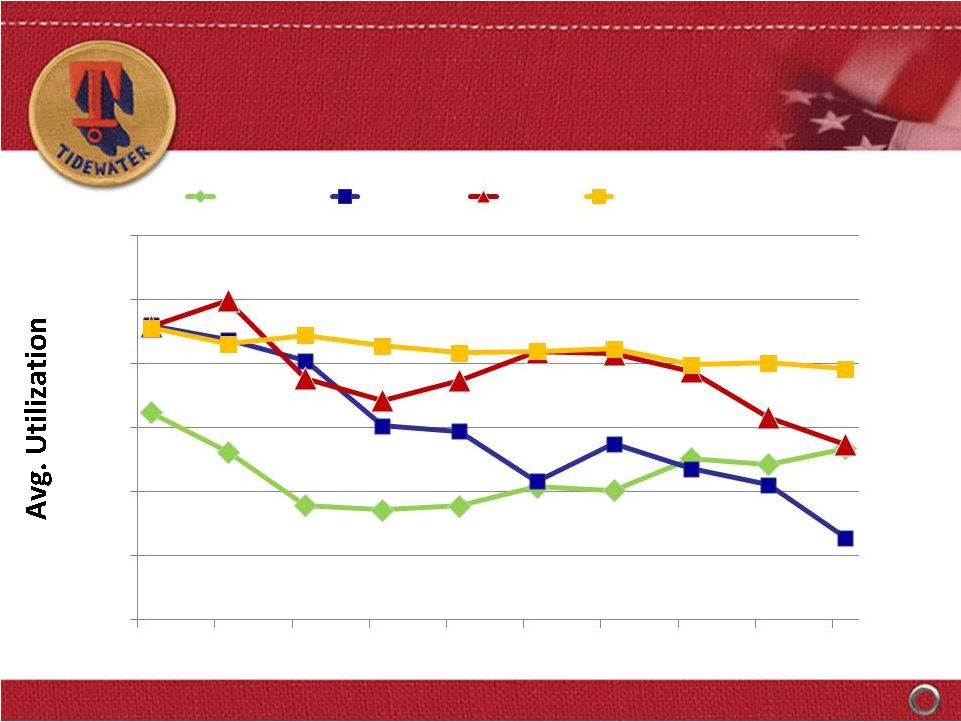 29
30%
40%
50%
60%
70%
80%
90%
6/09
9/09
12/09
3/10
6/10
9/10
12/10
3/11
6/11
9/11
Americas
Asia/Pac
MENA
Sub Sah Africa
VESSEL UTILIZATION BY SEGMENT
VESSEL UTILIZATION BY SEGMENT |
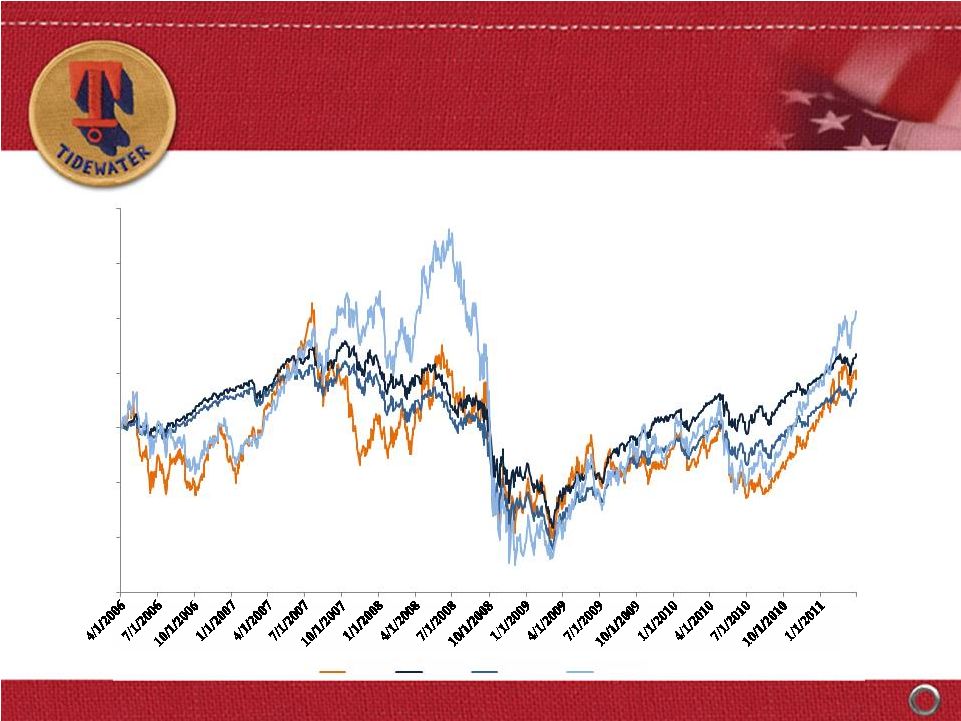 30
OSX 42%
S&P 500 14%
DJIA 27%
TDW 18%
-60.0%
-40.0%
-20.0%
0.0%
20.0%
40.0%
60.0%
80.0%
TDW
DJIA
S&P 500
OSX
RETURNS vs the MARKET
RETURNS vs the MARKET
FIVE YEAR STOCKHOLDER RETURN
FIVE YEAR STOCKHOLDER RETURN |