Attached files
| file | filename |
|---|---|
| EX-21 - EXHIBIT 21 - WINNER MEDICAL GROUP INC | v239545_ex21.htm |
| EX-31.1 - EXHIBIT 31.1 - WINNER MEDICAL GROUP INC | v239545_ex31-1.htm |
| EX-32.1 - EXHIBIT 32.1 - WINNER MEDICAL GROUP INC | v239545_ex32-1.htm |
| EX-31.2 - EXHIBIT 31.2 - WINNER MEDICAL GROUP INC | v239545_ex31-2.htm |
| EX-23.1 - EXHIBIT 23.1 - WINNER MEDICAL GROUP INC | v239545_ex23-1.htm |
| EX-32.2 - EXHIBIT 32.2 - WINNER MEDICAL GROUP INC | v239545_ex32-2.htm |
UNITED STATES
SECURITIES AND EXCHANGE COMMISSION
WASHINGTON, D.C. 20549
FORM 10-K
(Mark One)
|
|
x
|
ANNUAL REPORT PURSUANT TO SECTION 13 OR 15(d) OF THE SECURITIES EXCHANGE ACT OF 1934
|
For the fiscal year ended September 30, 2011
Or
|
|
¨
|
TRANSITION REPORT PURSUANT TO SECTION 13 OR 15(d) OF THE SECURITIES EXCHANGE ACT OF 1934
|
For the transition period from to
Commission file number: 001-34484
WINNER MEDICAL GROUP INC.
(Exact Name of Registrant as Specified in Its Charter)
|
Nevada
|
33-0215298
|
|
|
(State or other jurisdiction of incorporation or organization)
|
(I.R.S. Employer Identification No.)
|
Winner Industrial Park, Bulong Road
Longhua, Shenzhen City, 518109
People’s Republic of China
(Address of principal executive offices)
Registrant’s telephone number, including area code: (86) 755-28138888
Securities registered pursuant to Section 12(b) of the Act:
|
Title of each class
|
Name of each exchange on which registered
|
|
|
Common Stock, $.001 par value
|
Nasdaq Global Market
|
Securities registered pursuant to Section 12(g) of the Act:
|
None
|
||
|
(Title of class)
|
Indicate by check mark if the registrant is a well-known seasoned issuer, as defined in Rule 405 of the Securities Act. ¨ Yes x No
Indicate by check mark if the registrant is not required to file reports pursuant to Section 13 or Section 15(d) of the Act. ¨ Yes x No
Indicate by check mark whether the registrant (1) has filed all reports required to be filed by Section 13 or 15(d) of the Securities Exchange Act of 1934 during the preceding 12 months (or for such shorter period that the registrant was required to file such reports), and (2) has been subject to such filing requirements for the past 90 days. x Yes ¨ No
Indicate by check mark whether the registrant has submitted electronically and posted on its corporate Web site, if any, every Interactive Data File required to be submitted and posted pursuant to Rule 405 of Regulation S-T (§232.405 of this chapter) during the preceding 12 months (or for such shorter period that the registrant was required to submit and post such files). x Yes ¨ No
Indicate by check mark if disclosure of delinquent filers pursuant to Item 405 of Regulation S-K is not contained herein, and will not be contained, to the best of registrant’s knowledge, in definitive proxy or information statements incorporated by reference in Part III of this Form 10-K or any amendment to this Form 10-K. x
Indicate by check mark whether the registrant is a large accelerated filer, an accelerated filer, or a non-accelerated filer or a smaller reporting company. See the definitions of “large accelerated filer,” “accelerated filer” and “smaller reporting company” in Rule 12b-2 of the Exchange Act.
|
Large accelerated filer ¨
|
Accelerated filer ¨
|
Non-accelerated filer ¨
|
Smaller reporting company x
|
Indicate by check mark whether the registrant is a shell company (as defined in Rule 12b-2 of the Act). Yes ¨ No x
At March 31, 2011, the aggregate market value of the registrant’s common stock held by non-affiliates of the registrant was approximately $28,371,201, based on the last sale price of the registrant’s common stock.
The aggregate market value of the voting and non-voting common equity held by non-affiliates computed by reference to the price of $3.17 per share of common stock at which the common equity was last sold on September 30, 2011, the last day of our most recently completed fourth fiscal quarter was $19,408,271.
As of November 30, 2011, there were 24,371,872 shares of the registrant’s common stock outstanding.
DOCUMENTS INCORPORATED BY REFERENCE.
None.
WINNER MEDICAL GROUP INC.
FORM 10-K
For the Fiscal Year Ended September 30, 2011
|
Number
|
Page
|
|||
|
PART I
|
||||
|
Business.
|
4 | |||
|
Risk Factors.
|
15 | |||
|
Unresolved Staff Comments.
|
23 | |||
|
Item 2.
|
Properties.
|
23 | ||
|
Legal Proceedings.
|
24 | |||
|
(Removed and Reserved).
|
24 | |||
|
PART II
|
||||
|
Market for Registrant’s Common Equity, Related Stockholder Matters and Issuer Purchases of Equity Securities.
|
25 | |||
|
Item 6.
|
Selected Financial Data.
|
26 | ||
|
Item 7.
|
Management’s Discussion and Analysis of Financial Condition and Results of Operations.
|
27 | ||
|
Item 7A.
|
Quantitative and Qualitative Disclosures about Market Risk.
|
37 | ||
|
Item 8.
|
Financial Statements and Supplementary Data.
|
38 | ||
|
Item 9.
|
Changes in and Disagreements with Accountants on Accounting and Financial Disclosure..
|
38 | ||
|
Item 9A.
|
Controls and Procedures.
|
38 | ||
|
Item 9B.
|
Other Information.
|
39 | ||
|
PART III
|
||||
|
Item 10.
|
Directors, Executive Officers and Corporate Governance.
|
40 | ||
|
Item 11.
|
Executive Compensation.
|
42 | ||
|
Item 12.
|
Security Ownership of Certain Beneficial Owners and Management and Related Stockholder Matters.
|
48 | ||
|
Item 13.
|
Certain Relationships and Related Transactions, and Director Independence.
|
49 | ||
|
Item 14.
|
Principal Accountant Fees and Services.
|
49 | ||
|
PART IV
|
||||
|
Item 15.
|
|
Exhibits, Financial Statement Schedules.
|
|
51 |
2
Use of Terms
Except as otherwise indicated by the context, references in this Report to “Winner Medical,” the “Company,” “we,” “us” or “our” are references to the combined business of Winner Medical Group Inc. and its wholly-owned subsidiary, Winner Group Limited, along with Winner Group Limited’s wholly-owned subsidiaries which include Winner Industries (Shenzhen) Co., Ltd., Winner Medical & Textile Ltd. Jingmen, Hubei Winner Textiles Co. Ltd., Winner Medical & Textile Ltd. Yichang, Winner Medical & Textile Ltd. Jiayu, Winner Medical & Textile Ltd. Chongyang, Shanghai Winner Medical Apparatus Co., Ltd., Winner Medical (Huanggang) Co., Ltd., Winner (Huanggang) Cotton Processing Co. Ltd., Shenzhen PurCotton Technology Co., Ltd., Beijing PurCotton Co., Ltd., Shanghai PurCotton Co., Ltd., Guanzhou PurCotton Co., Ltd. and HK PurCotton Co. Ltd. and Winner Group Limited’s majority owned subsidiaries, Winner Medical (Hong Kong) Co., Limited and Shenzhen PurCotton E-Commerce Co., Ltd. References to “Winner Group Limited” or “Winner Group” are references to Winner Group Limited and its subsidiaries listed above. References to “China” and the “PRC” are references to the People’s Republic of China. References to “U.S.” are references to the United States of America. References to “RMB” are to Renminbi, the legal currency of China, and all references to “$” are to the legal currency of the United States.
Forward-Looking Statements
Statements contained in this Annual Report on Form 10-K include “forward-looking statements” within the meaning of Section 27A of the Securities Act of 1933 and Section 21E of the Securities Exchange Act of 1934. Forward-looking statements involve known and unknown risks, uncertainties and other factors which could cause actual financial or operating results, performances or achievements expressed or implied by such forward-looking statements not to occur or be realized. Forward-looking statements may be identified by the use of forward-looking terminology such as “may,” “will,” “could,” “should,” “project,” “expect,” “believe,” “estimate,” “anticipate,” “intend,” “continue,” “potential,” “opportunity” or similar terms, variations of those terms or the negative of those terms or other variations of those terms or comparable words or expressions. Potential risks and uncertainties include, among other things, such factors as:
|
|
·
|
the effect of inflation in China;
|
|
|
·
|
losses from cotton futures trading;
|
|
|
·
|
international trade restrictions;
|
|
|
·
|
the Company’s dependence upon international customers;
|
|
|
·
|
Improper management of the expansion of the Company’s business models;
|
|
|
·
|
developments in the healthcare industry;
|
|
|
·
|
the Company’s dependence on patent and trade secret laws;
|
|
|
·
|
a high percentage of the Company’s revenues is from a few key customers;
|
|
|
·
|
uncertainties with respect to the PRC legal and regulatory environments;
|
|
|
·
|
the Company’s ability to adequately finance the significant costs associated with the development of new medical products;
|
|
|
·
|
potential product liability claims for which the Company does not have insurance coverage;
|
|
|
·
|
the effects of the global economic situation;
|
|
|
·
|
escalating pricing pressures from the Company’s customers;
|
|
|
·
|
the Company’s ability to employ and retain qualified employees;
|
|
|
·
|
competition and competitive factors in the markets in which the Company competes;
|
|
|
·
|
general economic and business conditions in China and in the local economies in which the Company regularly conducts business, which can affect demand for the Company’s products and services;
|
|
|
·
|
changes in laws, rules and regulations governing the business community in China in general, and the healthcare industry in particular;
|
|
|
·
|
other risks identified in this Report and the Company’s other filings with the SEC; and
|
|
|
·
|
the risks identified in Item 1A. “Risk Factors” included herein.
|
Readers are urged to carefully review and consider the various disclosures made by the Company in this Annual Report on Form 10-K and the Company’s other filings with the SEC. These reports attempt to advise interested parties of the risks and factors that may affect the Company’s business, financial condition and results of operations and prospects. The forward-looking statements made in this Form 10-K speak only as of the date hereof and the Company disclaims any obligation to provide updates, revisions or amendments to any forward-looking statements to reflect changes in the Company’s expectations or future events.
3
PART I
|
Item 1.
|
Business.
|
History
The Company was originally incorporated under another corporate name in the state of Nevada in August 1986. Winner Group Limited (which is now a wholly-owned subsidiary of the Company) began its operations as Winner Medical & Textile Ltd. Zhuhai, which was incorporated in China in February 1991 by the Company’s chief executive officer, president and director, Mr. Jianquan Li, and was deregistered in fiscal year 2009. Winner Group Limited was incorporated as a limited liability exempted company in the Cayman Islands in April 2003, and is the holding company of all of the Company’s business operations. On February 13, 2006, the Company amended its Articles of Incorporation to change its name from Las Vegas Resorts Corporation to Winner Medical Group Inc. to reflect its new business and to accord with the names of its subsidiary companies.
On October 6, 2009, the Company effected a reverse stock split in which 1 new share of common stock was issued for 2 old shares of common stock, thus exchanging 42,280,840 old shares for 21,140,420 new shares. This reverse stock split was reflected in the Company’s financial statements as of October 6, 2009. Upon effectiveness of the reverse stock split, the outstanding and issued shares were approximately 22,363,740 shares, after rounding up fractional shares.
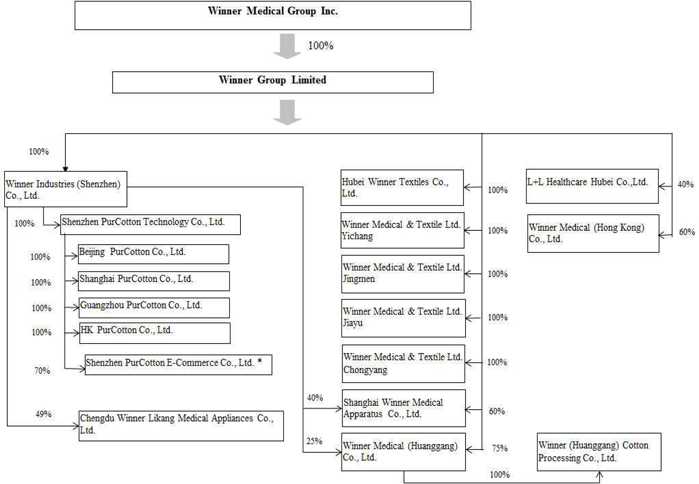
Below is the Company’s holding company structure as of the date of this Report.
|
|
*
|
Winner Medical holds 70% of Shenzhen PurCotton E-Commerce Co., Ltd. The other 30% is owned by two non-affiliated individuals who are experts in e-commerce.
|
Business
Winner Medical’s business operations consist of manufacturing, marketing, researching and developing cotton-base medical dressings and medical disposables and consumer products. The Company generates revenue through international and domestic (China) sales of a variety of medical dressings and medical disposables, including medical and wound care products, such as gauze, wound dressings, disposable drapes, surgical gowns, face masks and cotton balls, and PurCotton® jumbo rolls and consumer products, which are 100% natural cotton non-woven fabric made products such as dry and wet tissues, facial puffs, baby wears and cleansing wipes.
4
The Company has integrated manufacturing lines that provide its customers with the ability to procure certain products from a single supplier. The Company has fourteen wholly-owned manufacturing and sales subsidiaries and four joint ventures, all located in the PRC and Hong Kong. In the developed countries where it sells its products, mainly Europe, the United States and Japan, the Company provides customers with its specialized design, manufacturing and packaging services. By working with Winner Medical in this fashion, customers are able to select the design, size, type and scale of the products the Company manufactures for them. The Company sells its own “Winner” medical brand products in developing countries and regions, including the PRC, Hong Kong, the Middle East, South America and Southeast Asia, with distribution channels consisting of local distributors, chain drugstores and direct sales to a few hospitals (mostly in China). The Company sells its PurCotton® jumbo rolls in both China and abroad, and promotes its PurCotton® retail products via its own marketing and sales efforts in the China marketplace through chain stores, distributors (such as hypermarkets, supermarkets, department stores, convenience stores, etc.) and online sales.
Business Strategy
The Company’s primary business strategy is to achieve annual growth in revenue by building its brand and reputation. The Company seeks to implement its business strategy by focusing on:
Marketing Strategy
|
Ÿ
|
Marketing Its Own “Winner” Medical Branded Products in China. The surgical dressings and medical disposables market in China is quickly expanding. The Company believes that the demand for medical dressing and disposable products in China will experience rapid growth in the future as the Chinese government reforms the medical care system and the average age of Chinese continues to grow older. The Company believes that these factors will create opportunities for companies, such as Winner Medical, that already follow strict conduct and quality control regulations. During fiscal year 2011, approximately 10.98% of the Company’s medical sales revenue was generated in China, up from 10.59% in fiscal year 2010 (representing a 35.11% increase). The Company believes that the percentage of its business generated in China will increase in the future. The Company’s medical sales channels in China include local distributors, chain drugstores and hospitals. The Company expects that this business will be a driving force in its future business model.
|
|
Ÿ
|
Marketing and Expanding “PurCotton” Consumer Products. The Company believes that PurCotton, spunlace, cotton nonwoven products have advantages over woven cotton or synthetic nonwoven fabric products, as they are natural, safe, strong, durable, healthy, eco-friendly and of high quality. The Company believes that PurCotton products are particularly geared to target preferred customers, such as younger women and new mothers. The Company launched its retail business in December 2009, and has grown from medical products to consumer products, which are produced in a quality controlled, medical manufacturing environment. The Company’s retail distribution channel includes chain stores, distributors (such as hypermarkets, supermarkets, department stores, convenience stores, etc.) and online sales. Going forward, the Company believes it can continue to nurture distributors and online sales in order to produce sales growth, while selectively selling in chain stores to build brand awareness and expose potential customers to the Company’s products. At present, the Company is sustaining a net loss on its PurCotton retail business, due to necessary expenses related to start-up businesses. However, the Company expects this business model to generate positive cash flow and build sustainable growth in the long run. During fiscal year 2011, sales revenue from the Company’s PurCotton® retail sales in China reached approximately $5.0 million, or 3.34% of total sales revenue, which is up from $0.9 million, or 0.75% of total sales revenue, in fiscal year 2010 (representing a 474.78% increase).
|
Product Strategy
|
Ÿ
|
Focus on higher margin products. The Company is executing a long-term, systematic plan for marketing and selling higher margin products in terms of PurCotton® consumer products and higher value-added medical dressing products, such as surgical kits, advanced gowns and wet dressings. The Company’s research and development efforts are aimed at discovering new products, improving existing products and reducing production costs.
|
|
Ÿ
|
Providing High Quality Products. The Company’s goal is to manufacture and sell products that are of high quality and in accordance with established industry standards. The Company maintains strict and comprehensive quality assurance and quality control systems, and has already established ISO9001:2000, ISO13485:2003 and 21CFR Part 820 compliant quality management systems. Currently, the Company’s products have obtained European Union CE Certificates, U.S. Food and Drug Administration, “FDA,” certification, Russia health care certification and Japan’s Accreditation Certificate for Foreign Medical Device Manufacturers, which are awarded to individual factories that meet certain manufacturing standards. These certificates have been granted to Winner Medical’s Shenzhen, Jiayu, Chongyang and Jingmen factories. The Company intends to continue pursuing more certifications for its products or factories from developed and developing countries in order to promote its sales targets.
|
Manufacturing Strategy
|
Ÿ
|
Implement lean production and equipment technical improvements. The Company implements lean production management and equipment technical improvements among all subsidiaries to eliminate waste during production and increase efficiency. Through improving production techniques, the Company can reduce labor costs and increase efficiency by automation.
|
5
|
Providing Customers with a Complete Product Line—One Stop Procurement Services. The Company provides customers with specialized medical dressing products that are intended to address a number of customer issues and needs. The Company’s products are designed to meet a wide variety of its customers’ product configuration demands. The Company uses manufacturing equipment, including gauze sponge bleaching equipment, sterile packaging machines, auto-gauze sponges folding machines, nonwoven sponge folding machines and steam sterilization and ethylene oxide, “ETO,” for sterilization processing, which it believes allow the Company to produce its products in a cost efficient manner.
|
Management Strategy
|
Ÿ
|
Managing Business Effectively Through a Strong Management Team. To manage the medical and retail businesses, the Company assigns two management teams, due to the diverse customers and different marketing operation of these businesses. The Company retains senior management who has an average of ten years of work experience in the medical dressing industry. Under this team’s leadership, the Company has a demonstrated record of rapid and orderly growth. The Company employs a separate marketing and sales team for purposes of PurCotton retail sales, brand building and e-commerce.
|
|
Ÿ
|
Implementing Advanced Information Technology Systems and Logistical Capabilities. The Company has implemented the SAP Enterprise Resources Planning, “SAP ERP” system, which integrates all of the core business operations of each of its subsidiaries, such as purchasing, manufacturing, selling, expenses, financing, human resources and retailing, and records them on one system. The Company’s goal is to build a platform on which it can share information with its customers, including raw material preparation, production status, inventory and transportation. Development and expansion of the Company’s logistical capabilities are an important aspect of the Company’s strategy. The Company believes it is important to have warehouses in large transportation ports and near central cities. The Company’s use of modern logistics management methods is designed to enhance its service levels, including its ability to deliver products to customers in a timely fashion. Further, the Company strives to handle customer service inquiries quickly and accurately. Information on purchase order confirmation, production, order status and shipping advice is readily available. The Company also offers its customers a variety of payment terms to facilitate international purchases.
|
Products
The Company’s operations are mainly conducted through two operating business segments, which are the medical dressings and medical disposables segment and the spunlace 100% PurCotton® nonwoven consumer products segment. The Company’s operating decisions, on-site management, internal reporting and performance assessments are conducted within each of these two identified segments:
Medical dressings and medical disposables business segment
Medical dressings and medical disposals have two sub-categories, being typed according to function.
Medical care products – Include operating room products, procedural packs, protective products and gauze.
|
Surgical Drape
|
Gown
|
|
Face Mask
|
Surgical Dressing Pack
|
|
Sponge (including gauze and lap sponges)
|
Sterilization Pouch
|
|
Gauze Ball
|
Fluff Roll
|
|
Gauze Roll
|
Swab
|
Wound care products – Include dressing pads, cotton products, retention products and dental products.
|
First Aid
|
Tape
|
|
Adhesive Wound Dressing
|
Cotton Ball
|
|
Bandages (including elastic, gauze and cohesive flexible)
|
Q-tips
|
PurCotton consumer products business segment
PurCotton is a type of cotton product that is made of 100% natural cotton using spunlace nonwoven technology. The Company’s PurCotton products include jumbo rolls, as raw material supplies, and consumer products. The Company’s consumer products can be grouped into four categories (mother and baby care, feminine care, home care and medical care) and include:
|
Cotton Wet Wipes
|
|
|
Cosmetic Puff
|
Sanitary Napkin
|
|
Gauze Baby Wear
|
Gauze Baby Towel
|
|
Baby Reusable Diaper
|
Baby Handkerchiefs
|
|
Q-tips
|
Face Mask
|
|
Sport Bandage
|
Pajama
|
|
Bed Sheets
|
Gauze Bedclothes
|
Sales, Marketing and Customers
The Company’s medical dressing and disposable products are sold internationally through a network of distributors, wholesalers and manufacturers’ representatives as original equipment manufacturer, “OEM,” products. The Company’s major target markets are Japan, Europe and North and South America. While maintaining its traditional export-oriented business model, the Company has expanded into domestic sales in China through the use of local distributors into hospitals and chain drug stores and direct sales to hospitals under its own brand name, “Winner.” The Company plans to continue selling its PurCotton® consumer products in the China market through self-operated chain stores and Business-to-Customer (B2C) online platforms and distributors under its “PurCotton” brand name the Company defines PurCotton as its English product, patent application, trademark and chain store names.
6
Since there are different demands for different products in different geographic markets, the Company has adopted marketing strategies that are market-specific. For developed markets such as the United States, Japan and Europe, the Company offers OEM products under private label programs to supply medical suppliers. This approach enables the Company to capitalize on its customers’ branding strengths and established market channels. In order to gain more market share, the Company attempts to leverage its customers’ strong brand names, efficient distribution networks and market presence. The Company believes it is a better strategy to team up with large, well-known companies than to compete directly with them in developed markets. Most of the Company’s sales in developed countries are conducted by direct marketing. In addition, the Company also conducts sales through third-party manufacturers’ representatives, who are compensated through payment of sales commissions.
In China and other developing countries, the Company sells its medical dressing and disposable products under the “Winner” brand name. As the economies of China and other developing countries grow, the Company expects that there will be a significant increase in demand for medical products, including demand for the Company’s medical dressings and other medical disposable products. The Company believes its products are generally price-competitive with products from the United States, Japan and the European countries. Competition can also come from local producers in the developing countries, but the Company attempts to compete with those local manufacturers based on the quality of its products. The Company employs manufacturers’ representatives and actively participates in formal bid contracts organized by local organizations and hospitals. The Company is developing a distribution network to capture opportunities in China, mainly through local distributors, drugstore chains and direct sales to a few hospitals. In order to better develop its market, the Company’s officers are put in charge of communicating with local distributors in some major cities, such as Guangzhou, Fuzhou, Chengdu, Chongqing, Wuhan, Shanghai, Beijing and Shenyang. The Company also directly sells to hospitals in Hong Kong.
The Company believes that its material and manufacturing processes produce PurCotton® products that are healthy, soft, comfortable and environmentally-friendly. In August 2009, the Company started selling its jumbo rolls to manufacturers in China and Japan who produce consumer products. The Company believes that, as living standards improve and environmental protection awareness grows in China, people will desire products that are healthy, trusted, soft, comfortable and have less carbon emission. In order to launch its PurCotton® products and promote the “PurCotton” brand, the Company opened its first chain store in Shenzhen, China, on December 31, 2009. As of November 30, 2011, the Company has 44 chain stores in first and second-tier cities in China, which are mainly located in shopping malls. In order to broaden its customer base and increase sales, in July 2010, the Company opened a B2C website at Taobao.com http://purcotton.mall.taobao.com/, and launched its own B2C website www.purcotton.com in September 2010. Due to the operational differences between online and offline sales, the Company established Shenzhen PurCotton E-Commerce Co., Ltd. with two non-affiliated individuals who are experts in e-commerce (the Company owns 70% of the equity interest in this operating company, with the other 30% owned by the two individuals). However, the retail distribution channels require higher levels of capital expenditures for inventory, rent, deposits and salary for the sales forces than the Company’s medical business. As such, the Company’s net margins may be impacted in the short term, as this is a new business model and requires a significant level of start-up cost.
The Company has customers in approximately 80 countries throughout the world, including Japan, Germany, the United States, Italy, the Netherlands, the United Kingdom, Australia, France and China, as well as in South America, Africa and the Middle East. For its medical dressings and medical disposables business, some of the Company’s customers are large-scale producers and distributors with well-known brand names, while others are import and export firms or wholesalers with trade expertise and established sales channels. For its consumer products business, it targets female consumers with high income levels who are 25-45 years old and families who prefer to buy skin soft and healthy products.
Sakai Shoten Co., Ltd. accounted for approximately 11.54% and 12.16% of the Company’s revenue in fiscal years 2011 and 2010, respectively. Sakai Shoten Co., Ltd. acts as a purchasing agent for a large number of ultimate consumers of the Company’s products in Japan. Tyco Healthcare Co., Ltd accounted for 9.73% and 10.09% of the Company’s revenue in fiscal years 2011 and 2010, respectively. If the Company loses these customers without replacing them with other customers that purchase a similar amount of its products, the Company’s revenues and net income may decline considerably.
Raw Materials and Manufacturing
The Company depends on external suppliers to supply raw materials to produce its products. The principal raw materials used for the Company’s products are cotton, non-woven cloth and packaging materials, each of which it purchases from a limited number of suppliers. In the past, the Company has not experienced a problem in securing raw materials. Its principal cotton raw material for medical products is produced mainly in China, and for PurCotton products it is imported from the United States. The Company’s major suppliers of packaging materials and cotton are Safe Secure Packing (Shenzhen) Co., Ltd and China National Cotton Reserves Corporation. The Company’s raw material purchases from any individual supplier did not exceed 5% of its total raw material purchases in fiscal year 2011. The Company believes it is not over reliant on any of these suppliers.
7
Cotton is the Company’s primary raw material used in its manufacturing process. As a result of rising global demand, cotton prices have been rapidly increasing and fluctuating in the last few years. Under this rising cost environment, the Company cannot secure stable price quotes from cotton suppliers, resulting in inconsistency in the prices quoted to the Company’s customers. Therefore, the Company, through its wholly-owned subsidiary Winner Industries (Shenzhen) Co., Ltd., “Winner Shenzhen,” has entered into cotton futures transactions in order to limit the volatility of cotton prices on production. In order to reduce risk from trading, the Company has hired a professional and experienced team to conduct cotton futures and spot markets transactions in order to firmly tie the transaction to the sales plan and built up stringent operational policies and process controls for futures and spot trading.
During the second fiscal quarter ended March 31, 2011, Winner Shenzhen’s transactions in cotton futures resulted in a net loss of approximately $1,577,000, which was charged to “realized loss on commodity financial instruments.” The loss was a result of significant increases and fluctuation in cotton prices since January 2011. During this period, based on management’s expectation that cotton prices would experience a downward correction, Winner Shenzhen acquired a short position to hedge against price corrections. However, contrary to management’s expectation, the price increase continued. In order to minimize further losses, management closed its short position, generating a loss for the period.
In order to shift risk away from the Company during the initial period of cotton futures trading and better protect the interests of the Company’s stockholders, the chief executive officer of the Company, Mr. Jianquan Li, signed agreements with Winner Shenzhen effective January 1, 2011 that expired on September 30, 2011. Under these agreements, Mr. Li agreed that, on September 30, 2011, he will assume all net losses, if any, incurred by Winner Shenzhen from cotton futures trading from January 1, 2011 to September 30, 2011. If, however, there were a net gain from trading activities, it would have been retained by Winner Shenzhen. More details regarding this undertaking by Mr. Jianquan Li were disclosed in the “Recent Developments” section of the Company’s Quarterly Report on Form 10-Q for the three-month period ended March 31, 2011 as filed with the Securities and Exchange Commission.
On September 30, 2011, the net losses incurred by Winner Shenzhen from cotton futures trading from January 1, 2011 to September 30, 2011 were $1,718,031 (or RMB10,925,415). Accordingly, Mr. Jianquan Li deposited an equivalent amount in cash into Winner Shenzhen’s accounts. This deposit resulted in an increase to the Company’s Cash and an increase in the Company’s Stockholders’ equity, and the cash received was credited as a contribution to Additional Paid-in Capital when it was received. The agreements between Winner Shenzhen and Mr. Jianquan Li expired on September 30, 2011 after this reimbursement for losses realized from cotton futures trading was received.
With the objective of managing the Company’s risk from cotton futures trading, the Company established new department, a Commodity Trading Center, “CTC,” on July 1, 2011, with the goal of monitoring futures and spot trading and integrating cotton futures trading into the Company’s sales plan. Management has made on-going assessments of the CTC’s trading performance and has established stringent trading procedures and policies for entering into cotton futures transactions, along with consultation with the board of directors on these efforts.
Given the importance of key raw materials to the Company’s business, the Company manages its purchasing efforts and has established policies on the procurement of raw materials.
|
|
Ÿ
|
Supplier Management System. The Company has established a strict supplier management system to comprehensively assess suppliers on the basis of quality, price, purchasing terms, management systems delivery cycles. Suppliers are formally evaluated twice a year. The quality of the suppliers determines how much business they receive from the Company in subsequent months. The Company also hosts an annual suppliers’ conference, during which it communicates directly with its suppliers to discuss its needs and service level demands. The Company undertakes an open and transparent purchasing practice.
|
|
|
Ÿ
|
Purchasing Procedures. Purchasing transactions are conducted in accordance with a procedure termed inquiry-comparison-negotiation. Potential suppliers make initial offers that are compared objectively according to relevant guidelines. After validation of the various suppliers’ service and quality capabilities, the Company acquires the needed materials from the supplier offering the highest quality product at a reasonable cost. The Company’s finance department establishes an oversight process by appointing individuals to conduct independent market research of key price points. The research findings are announced periodically. The Company’s internal audit department and quality assurance department also provide oversight to assure that it strictly adheres to all purchasing procedures.
|
The Company’s production is vertically integrated, from raw material processing to semi finished products to finished products, which is able to control the entire manufacturing processes to maintain product quality. The Company has nine wholly owned manufacturing subsidiaries which are primarily located in Hubei province (and to a lesser extent in other parts of China). These manufacturing subsidiaries are as follows:
|
|
Ÿ
|
Winner Industries (Shenzhen) Co., Ltd. is a final procedure packaging center, sterilize center and a logistics center of the Company, and is located at Winner Industrial Park, Bulong Road, Longhua, Shenzhen City, China.
|
|
|
Ÿ
|
Winner Medical (Huanggang) Co., Ltd. produces PurCotton jumbo roll and PurCotton related products, and is located at Pearl Avenue, Huanggang High-Tech Park, Huanggang City, Hubei Province, China.
|
|
|
Ÿ
|
Winner (Huanggang) Cotton Processing Co., Ltd. processes seed cotton into billet cotton as raw materials to support the Company’s manufacture and is located at Pearl Avenue, Huanggang High-Tech Park, Huanggang City, Hubei Province, China.
|
|
|
Ÿ
|
Hubei Winner Textile Co., Ltd. produces gauze, swabs and cotton filled sponges, etc., and is located at No. 47 South Road of Jianshe, Yuekou Town of Tianmen City, Hubei Province.
|
|
|
Ÿ
|
Winner Medical & Textile Ltd. Jiayu is in charge of producing cast padding, cotton swab, cotton ball, ABD pad, dental roll, zig-zag cotton and cotton pound roll, etc., and is located at No. 172 Phoenix Avenue, Yuyue Town, Jiayu County, Hubei Province.
|
8
|
|
Ÿ
|
Winner Medical & Textile Ltd. Jingmen mainly manufactures lap sponges, gauze bandage, fluff roll and baby wear, and is located at Te 1 Hangkong Road, Pailou Town, Jingmen City, Hubei Province.
|
|
|
Ÿ
|
Winner Medical & Textile Ltd. Yichang weaves gauze and supplies gauze to the Companies other factories, and is located at No. 20 Jiangxia Avenue, Jiangkou Town, Zhijiang City, Hubei Province.
|
|
|
Ÿ
|
Winner Medical & Textile Ltd. Chongyang weaves and produces gauze sponge, gauze roll and gauze ball, and is located at Qingshan Park, Chongyang County, Hubei Province.
|
|
|
Shanghai Winner Medical Apparatus Co., Ltd. produces self-adhesive and adhesive bandages, and is located at 98 Jiechen Road, Songjiang District, Shanghai.
|
To execute its PurCotton business, the Company entered into an agreement in 2005 with the local government agency of Huanggang to acquire 564,742 square meters of land (approximately 140 acres) that will mostly be dedicated to the construction of production facilities for 100% cotton spunlace nonwoven fabric in the Company’s subsidiary Winner Medical (Huanggang) Co., Ltd., “Winner Huanggang”. Land use right certificates were issued to the Company in November 2005 and July 2007. As of September 30, 2011, the Company has four PurCotton manufacturing lines which are producing at almost 100% capacity, with a total production capacity of 430 tons per month. The Company purchased one sanitary napkin manufacturing line, which produces PurCotton top layer sanitary napkins. This line started trial production at the end of October 2011. The Company estimates that sanitary napkins will be mainly sold through distributors to hypermarkets, supermarkets, convenience stores and mother and baby stores. In January 2011, the Company established Winner (Huanggang) Cotton Processing, Co. Ltd. to process seed cotton into billet cotton as raw material to support the Company’s production, which the Company expects will provide it with more stringent quality control and reduce raw material production costs. This cotton processing line is currently meeting approximately 30% of the Company’s total annual cotton demand.
Competition
The Company is subject to intense competition. Some of the Company’s competitors have greater financial resources, better marketing approaches and more established market recognition than the Company does in international and Chinese domestic markets. Increased competition in the medical dressings and disposables could put pressure on the price at which the Company sells its products, resulting in reduced profitability for the Company. In the Company’s industry, the Company competes based on manufacturing capacity, product quality, customer service, product cost, ability to produce a diverse range of products and logistics capabilities.
For the international sales of medical dressings and medical disposables competitors, the Company views the below companies as its most significant competitors in the major markets in which it sells its products:
|
|
Ÿ
|
Competitors based in China. For overseas market, the Company’s competitors based in China primarily include: Shenzhen Aumei, Zhejiang Zhende Medical Dressing Co., Ltd., Jiangsu Province Jianerkang Medical Dressing Co., Ltd. and Qingdao Hartmann Medical Dressing Co., Ltd. These competitors tend to have lower labor costs. However, the Company believes that their products are of lower quality and they often lack product diversity, and that these competitors are not as strong in brand building and management.
|
|
|
Ÿ
|
Competitors based in Asia (Outside of China). Competitors based in this area mainly come from India and countries in Southeast Asia, such as Premier Enterprise and Sri Ram Products, whose main business is weaving. These competitors lack interconnected businesses and suppliers within the local industry and tend to be understaffed and have a lower quality of management, as well as a lower product quality.
|
|
|
Ÿ
|
Competitors based in Europe. Competitors based in Europe include: Bastos Viegas, S.A. (Portugal), Intergaz, S.R.O. (Czech Republic), and TZMO S.A. (Poland). The Company’s competitors from Europe may have a geographic advantage in the European market, but the Company believes they have less product diversity and higher production costs.
|
For China domestic medical sales, the Company’s core competitor is Henan Piao’an Group Co., Ltd., which tends to maintain stronger relationship with hospitals since its operation is larger and more established in the Chinese market. However, the Company’s believes that its quality control system and sterilization technology tend to be better accepted by Chinese hospitals.
For the PurCotton business, the Company believes that its material and manufacturing processes produce products that are healthy, soft, comfortable and environmentally-friendly. The Company targets mid- to high-end female consumers and families with babies who are concerned about their skin and health and would prefer to buy premium products. However, the PurCotton retail business is relatively new to the market, and the Company has to spend a significant amount of time and effort cultivating its customers. Furthermore, the Company believes PurCotton raw material could replace medical gauze and medical synthetic nonwoven products. However, due to the need for clinical examinations and certificate approvals, the Company projects that it will take more time to secure product acceptance from hospitals.
The Company’s customers in the medical industry employ high quality standards, since product quality and safety are their primary consideration. They perform strict factory and production system verification and product quality testing on their target suppliers. Once a supplier passes these tests, it is costly to switch to another. Compared with its competitors, the Company’s competitive advantages include the following:
9
|
|
Ÿ
|
Sound quality management system and certificates obtained. The Company has already established three quality management systems: ISO9001:2000 quality management system, ISO13485:2003 medical devices quality control system and 21CFR Part 820, Medical Device Quality System Regulation. Japanese certificates, which are awarded to individual factories, have been granted to Winner Medical’s Shenzhen, Jiayu, Chongyang and Jingmen factories, all of which are qualified and entitled to export products directly to Japan. The Company’s products imported into the United States are registered with the U.S. Food and Drug Administration, “FDA.” The Company has 45 types of products listed with the FDA, and it is proud to have FDA clearance to import sterilized products into the United States. Among those products are sterilization pouches and face masks, for which 510(k) premarket notifications were filed and which have received orders of substantial equivalence from the FDA. Currently, most of the Company’s products have obtained European Union CE Certificates. The Company’s other products are not required to obtain European Union CE certificates because these products are either non-medical related products or sold only in China. As of September 30, 2011, the Company has 61 products registered under the Russian Federal Service of Health Care and Social Development Control.
|
|
|
Ÿ
|
Quality control on vertically integrated production capacities. The Company has shaped its integrated manufacturing lines to meet customer preferences for procuring a range of products from a single trusted supplier. The Company’s services range from raw material processing, spinning, bleaching, folding, packaging and sterilization to finished product delivery. The Company maintains stringent quality control throughout each stage. The Company has factories in Hubei, Shenzhen and Shanghai. The production plants in Hubei province are primarily focused on upstream manufacturing, while the facilities in Shenzhen are focused on higher value-added processing to finished products. The Company’s Shanghai facilities are mainly concentrated on manufacturing and marketing self-adhesive bandages.
|
|
|
Ÿ
|
Innovation. The Company is dedicated to investing in research and development to drive innovation. The Company concentrates on innovation in value-added features for its medical dressings and medical disposables as well as PurCotton consumer products. It also focuses on the PurCotton manufacturing process to improve product quality and enhance efficiency, and continues to expand its PurCotton production line through line extensions and value-added features. The Company utilizes its patented, spunlace manufacturing process, which forms raw cotton into nonwoven cotton fabric to produce PurCotton® products at a lower cost than woven cotton products. The Company believes that this spunlace process provides a significant advantage. Patents covering the invention of the spunlace method of forming raw cotton into nonwoven process have been granted in more than 42 countries and regions (including China, the United States, Russia, Singapore, South Africa, Mexico, Nigeria, Canada, Egypt, Vietnam, the Philippines and member states of the European Patent Office).
|
The Company currently has 50 issued patents. Below are brief descriptions of these patents.
|
Description of Patent
|
Patent No.
|
Type
|
||
|
Manufacturing method for the spunlace non-woven cloth with X-ray detectable element thereby produced
|
ZL 200510033576.9 (China)
|
Invention
|
||
|
Manufacture method of the 100% cotton non-woven medical dressings
|
ZL 200510033147.1 (China)
|
Invention
|
||
|
Colored non-woven cloth with special coat
|
ZL 200620013847.4 (China)
|
Utility Model
|
||
|
Colored 100% cotton gauze
|
ZL 200620132922.9 (China)
|
Utility Model
|
||
|
100% cotton gauze with protective function
|
ZL 200620132920.X (China)
|
Utility Model
|
||
|
A medical dressing resists penetration and adhesion
|
ZL 200620132921.4 (China)
|
Utility Model
|
||
|
Description of Patent
|
Patent No.
|
Type
|
||
|
An ancillary fight code machine
|
ZL 200620017009.4 (China)
|
Utility Model
|
||
|
A safety medical gauze with detective device
|
ZL 200620014971.2 (China)
|
Utility Model
|
||
|
Wipes box
|
ZL 200630060318.5 (China)
|
Appearance design
|
||
|
Spunlace non-woven cloth with special coat and protective function
|
ZL 200620013845.5 (China)
|
Utility Model
|
||
|
A testing equipment for cloth
|
ZL 200820091990.4 (China)
|
Utility Model
|
||
|
Wound dressing
|
ZL 200820092733.2 (China)
|
Utility Model
|
||
|
Petrolatum dressing
|
ZL 200820105164.0 (China)
|
Utility Model
|
||
|
ZL 200820093952.2 (China)
|
Utility Model
|
|||
|
Packing device for medical dressing products
|
ZL 200820094531.1 (China)
|
Utility Model
|
||
|
Draw out wipes box
|
ZL 200520035670.3 (China)
|
Utility Model
|
||
|
Medical product box
|
ZL 200820207244.7 (China)
|
Utility Model
|
||
|
Embossed non-woven cloth
|
ZL 200820139753.0 (China)
|
Utility Model
|
||
|
A care package
|
ZL 200820235800.1 (China)
|
Utility Model
|
||
|
A bondage
|
ZL 200920129524.5 (China)
|
Utility Model
|
||
|
A protective facemask
|
ZL 200920135220.X (China)
|
Utility Model
|
10
|
A spunlace non-woven and its devices
|
ZL 200920131414.2 (China)
|
Utility Model
|
||
|
A kind of medical dressing
|
ZL 200920132228.0 (China)
|
Utility Model
|
||
|
A multi-material lab sponge and operating sheet
|
ZL 200920134448.7 (China)
|
Utility Model
|
||
|
Sanitary napkin #326
|
ZL 201030227804.8 (China)
|
Appearance design
|
||
|
A medical and hygiene device with pure cotton spunlace surface
|
ZL 200920260990.7 (China)
|
Utility Model
|
||
|
A breathable pure cotton medical protective cloth
|
ZL 201020153332.0 (China)
|
Utility Model
|
||
|
Pure cotton layer sanitary napkin and pure cotton layer disposable underpants
|
ZL 201020186577.3 (China)
|
Utility Model
|
||
|
A safety X-ray detectable medical dressing
|
ZL 200510033022.9 (China)
|
Invention
|
||
|
A safety medical operating gauze
|
ZL 200610062853.3 (China)
|
Invention
|
||
|
A medical dressing with surface X-ray development detectable element thereby produced
|
200810065677.8 (China)
|
Invention
|
||
|
Manufacture method for a single-side moisture transported PurCotton thereby produced
|
200910239652.X (China)
|
Invention
|
||
|
A packaging bag for hygiene products
|
201020508162.3 (China)
|
Utility
|
||
|
A type of baby diaper
|
201020540770.2 (China)
|
Utility
|
||
|
A type of baby diaper
|
201020554574.0 (China)
|
Utility
|
||
|
A type of baby diaper
|
201020579219.9 (China)
|
Utility
|
||
|
A type of medical dressing
|
201020686693.1 (China)
|
Utility
|
||
|
A safety dressing for surgical operation and its recognition system
|
201020695829.5 (China)
|
Utility
|
||
|
A type of medical dressing
|
201120026272 (China)
|
Utility
|
||
|
A type of medical alginic acid dressing
|
201120033668.8 (China)
|
Utility
|
||
|
A type of hygiene product
|
201120122161.X (China)
|
Utility
|
||
|
A type of non-woven medical dressing
|
201120190406.2 (China)
|
Utility
|
||
|
Method for producing spunlace non-woven cloth, method for producing spunlace non-woven cloth with X-ray detectable element, spunlace non-woven cloth with X-ray detectable element produced thereby
|
1688522 (E.U.)
|
Invention
|
||
|
Method for producing spunlace non-woven cloth, method for producing spunlace non-woven cloth with X-ray detectable element, spunlace non-woven cloth with X-ray detectable element produced thereby
|
1-2007-501648 (the Philippines)
|
Invention
|
||
|
Method for producing spunlace non-woven cloth, method for producing spunlace non-woven cloth with X-ray detectable element, spunlace non-woven cloth with X-ray detectable element produced thereby
|
270370 (Mexico)
|
Invention
|
11
|
Description of Patent
|
Patent No.
|
Type
|
||
|
Method for producing spunlace non-woven cloth, method for producing spunlace non-woven cloth with X-ray detectable element, spunlace non-woven cloth with X-ray detectable element produced thereby
|
2007/7583 (South Africa)
|
Invention
|
||
|
Method for producing spunlace non-woven cloth, method for producing spunlace non-woven cloth with X-ray detectable element, spunlace non-woven cloth with X-ray detectable element produced thereby
|
NG/C/2007/774 (Nigeria)
|
Invention
|
||
|
Method for producing spunlace non-woven cloth, method for producing spunlace non-woven cloth with X-ray detectable element, spunlace non-woven cloth with X-ray detectable element produced thereby
|
2, 510, 995 (Canada)
|
Invention
|
||
|
Method for producing spunlace non-woven cloth, method for producing spunlace non-woven cloth with X-ray detectable element, spunlace non-woven cloth with X-ray detectable element produced thereby
|
24725 (Egypt)
|
Invention
|
||
|
Method for producing spunlace non-woven cloth, method for producing spunlace non-woven cloth with X-ray detectable element, spunlace non-woven cloth with X-ray detectable element produced thereby
|
1-2007-01745 (Vietnam)
|
Invention
|
The Company has licensed from Jianquan Li, the Company’s CEO, President and Director, his rights to four patent and related technologies grants for nonwoven fabric manufacturing on a perpetual, worldwide royalty-free basis. The Company is not contractually required to pay a license fee to Mr. Li to use these patents. Below are the brief descriptions of these patents:
|
Description of Patents Licensed from Jianquan Li
|
Patent No.
|
Type
|
||
|
Method for producing spunlace non-woven cloth, method for producing spunlace non-woven cloth with X-ray detectable element, spunlace non-woven cloth with X-ray detectable element produced thereby
|
US 7049753 B2 (U.S.)
|
Invention
|
||
|
Method for producing spunlace non-woven cloth, method for producing spunlace non-woven cloth with X-ray detectable element, spunlace non-woven cloth with X-ray detectable element produced thereby
|
RU2326191C2 (Russia)
|
Invention
|
||
|
Method for producing spunlace non-woven cloth, method for producing spunlace non-woven cloth with X-ray detectable element, spunlace non-woven cloth with X-ray detectable element produced thereby
|
125160 (Singapore)
|
Invention
|
||
|
Spunlace non-woven cloth with X-ray detectable element
|
ZL 200520055659.3 (China)
|
Utility Model
|
The Company also has registered the trademark for the word “Winner” in China, the United States, Canada, Singapore, Libya, Jordan, the United Arab Emirates, Saudi Arabia, Thailand, Yemen, Chile, Cambodia and Hong Kong, and this trademark has passed the registration application in China, Hong Kong, Canada, Singapore, the United States and in the member countries of the Madrid Agreement such as Germany, France, Italy, Russia, Switzerland and Australia. The trademark of “PurCotton” has also been registered, or application for registration has been made, in China, Hong Kong, the United States, Europe, Japan, Australia, Brazil, South Africa, the Philippines, Russia, India, Turkey and Venezuela. Other trademarks, including “Winwin,” “Winband” in English and Chinese, “Nice Series” including “Nice”, “Nice Queen”, “Nice Princess”, ”Nice Prince”, ”Nice Life” etc., in Chinese, “SoftTouch” and “COTTONEA” have also been registered by the Company.
In addition, the Company has registered seventy-nine domain names both in English and Chinese, including www.winnermedical.com, www.purecotton.cn, www.purecotton.net.cn, www.purecotton.hk, www.softtouch.hk, www.winner-industries.com, www.winner-beijing.com, www.winner-shanghai.com, www.winner-shenzhen.com, www.purcotton.com, www.purcotton.cn, www.purcotton.hk, www.purcotton.asia, www.purcotton.net.cn, www.purcotton.com.cn, www.winnermedical.name, www.winnermedical.info, www.winnermedical.hk, www.winnermedical.net.cn, www.winnermedical.cn, www.winnermedical.net, www.winnermedical.org and www.winnermedical.mobi, www.purcottononline.com, www.purcottononline.cn, www.purcottonoline.com.cn, www.purcottononline.net, www.purcotton.net.cn, www.purcottononline.hk, www.purcotton-online.com, www.purcotton-online.cn, www.purcotton-online.com.cn, www.purcotton-online.net, www.purcotton-online.net.cn and www.purcotton-online.hk.
Where appropriate for the Company’s business strategy, the Company will continue to take steps to protect its intellectual property rights.
Research and Development Efforts
The Company spent approximately $1,988,000 and $1,767,000 on research and development in fiscal years 2011 and 2010, respectively.
12
The Company’s research and development in 2011 was mainly focused on developing new PurCotton® products for consumer use to broaden and diversify its product types to support its chain store sale and online sale, and researching value-added features for its medical dressings and medical disposables.
The Company’s research and development activities adhere to strict procedures and utilize standardized processes. The Company is focused on further improving its core manufacturing technologies so that it can reduce waste and overall costs. In addition, the Company uses advanced automatic equipment as part of its processing system, including folding machines, plastic absorbing machines and sterilization systems. These improvements not only reduce production costs, but also enable the Company to further diversify its product lines.
The Company is subject to complex and stringent governmental laws and regulations relating to the manufacture and sale of medical dressings and medical disposables in China and in many other countries in which it sells its products. These laws and regulations in the major markets in which it competes are discussed further below. All of the regulatory laws and regulations may be revised or reinterpreted, or new laws and regulations may become applicable, which could have a negative effect on the Company’s business and results of operations. See “Risk Factors —Risks Related to the Company’s Business.” The Company’s failure to comply with ongoing governmental regulations could impair its operations and reduce its market share.”
|
|
Ÿ
|
China . In China, medical materials and dressings, including medical gauzes, absorbent cottons, bandages and disposable surgical suits, are regulated as medical devices and are administered by the State Food and Drug Administration of China. The technology and specifications of these products must be consistent with the Regulations for the Supervision and Administration of Medical Devices and relevant laws and standards. PurCotton® consumer products are administered by the General Administration of Quality Supervision, Inspection and Quarantine of China. The specifications and manufacturing of such products are subject to stringent laws and regulations in relation to sterilization, chemical residual and heavy metal residual.
|
The Company’s business is regulated by a number of provincial authorities that license the production and registration of products such as those the Company manufactures. All of the Company’s wholly-owned manufacturing subsidiaries, which require licenses from these authorities, operate under current licenses.
|
|
Ÿ
|
Other Countries . Since the Company sells its products in international markets, its products are subject to regulations imposed by various governmental agencies in the markets where the Company’s products are sold.
|
All of the Company’s products exported to European countries must have a CE certificate, CE-certification or CE Marking, which is a conformity marking consisting of the letters “CE.” The CE Marking applies to products regulated by certain European health, safety and environmental protection legislation. The CE Marking is obligatory for products it applies to and the manufacturer affixes the marking in order to be allowed to sell its products in the European market.
In Japan, the Company needs a Certificate of Foreign Manufacture from the Pharmaceuticals and Medical Devices Agency of the Ministry of Health, Labor and Welfare of Japan in order to sell its products in the Japanese market. The Company has met applicable standards and obtained the required certificates in Europe and Japan.
In the United States, some of the Company’s products are considered medical devices. The FDA regulates the design, manufacture, distribution, quality standards and marketing of medical devices. Accordingly, the Company’s product development, testing, labeling, manufacturing processes and promotional activities for certain products that are considered medical devices are regulated extensively by the FDA. The FDA has given the Company clearance to market such products within the United States.
Under the U.S. Federal Food, Drug, and Cosmetic Act (“FDCA”), medical devices are classified into one of three classifications, each of which is subject to different levels of regulatory control, with Class I being the least stringent and Class III being subject to the tightest control. Class III devices, which are life supporting or life sustaining, or which are of substantial importance in preventing harm to human health, are generally subject to a clinical evaluation program before receiving pre-market approval, PMA, from the FDA for commercial distribution. Class II devices do not require clinical evaluation and pre-market approval by the FDA. Instead, it requires a pre-market notification to the FDA and in most cases its requirement is substantially equivalent to an existing product under Section 510(k) of the FDCA. Class I devices are subject only to general controls, such as labeling and record-keeping regulations, and are generally exempt from pre-market notification or approval under Section 510(k) of the FFDCA, although they are required to be listed with the FDA. The Company’s medical device products are generally considered Class I devices, and are therefore exempt from pre-market notification or approval requirements. The Company has listed all of its relevant products with the FDA pursuant to the FDAC.
If a 510(k) pre-market notification is required for a medical device, the device cannot be commercially distributed in the US until the FDA issues a letter to permit the sale of the product. Certain of the Company’s surgical face masks and sterilization pouches are subject to the 510(k) pre-market notification requirements. The Company has already received the necessary clearance from the FDA for such products.
The Company’s medical device products are also subject to the general labeling requirements under the FDA medical device labeling regulations. As of the date of this Report, the Company has labeled all of its medical device products and has not been the subject of any enforcement action initiated by the FDA.
13
In addition, manufacturers of medical devices distributed in the United States are subject to various other regulations, which include establishment registration, medical device listing, quality system regulation (“QSR”) and medical device reporting. Under the FDCA, any foreign establishment that manufactures, prepares, propagates, compounds or processes a medical device that is imported, or offered for import, into the United States is required to register its establishment with the FDA. In addition, any foreign establishment that engages in the manufacturing, preparation, assembly or processing of a medical device intended for commercial distribution in the United States is required to list its devices with the FDA. The Company’s subsidiary Winner Shenzhen, which exports all of its products, has registered its establishment with the FDA and has listed 45 medical and dental devices.
The Company’s manufacturing processes are required to comply with the applicable portions of the QSR, which cover the methods and documentation of the design, testing, production, processes, controls, quality assurance, labeling, packaging and shipping of its medical device products. The QSR, among other things, requires maintenance of a device master record, device history record and complaint files. As of the date of this Report, the Company does not have any enforcement actions initiated by the FDA.
The Company is also required to report to the FDA if its products cause or contribute to a death or serious injury or malfunction in a way that would likely cause death or serious injury. The FDA can require companies to recall products which have material defects or deficiencies in design or manufacturing. The FDA can withdraw or limit the Company’s product clearances in the event of serious, unanticipated health or safety concerns. The Company may also be required to submit reports to the FDA of corrections and removals. As of the date of this Report, the Company had not received any complaints that any of its products had caused death or serious injury.
The FDA has broad regulatory and enforcement powers. If the FDA determines that the Company has failed to comply with applicable regulatory requirements, it can impose a variety of enforcement actions ranging from public warning letters, fines, injunctions, consent decrees and civil penalties to suspension or delayed issuance of approvals, seizures or recall of the Company’s products, total or partial shutdown of production, withdrawal of approvals or clearances already granted and criminal prosecution. The FDA can also require the Company to repair, replace or refund the cost of devices that it manufactured or distributed. The Company’s failure to meet any of these requirements may cause the FDA to detain its products automatically when they are presented for entry into the United States. If any of these events occur, it could result in a material adverse impact on the Company. As of the date of this Report, the Company was not the subject of any enforcement actions initiated by the FDA.
Environmental Compliance
The Company is subject to the requirements of U.S. federal, state, local and non-U.S., including China’s, environmental and occupational safety and health laws and regulations. As the Company has no operations in the United States, U.S. environmental and occupational safety and health laws and regulations did not have any impact on the Company during this reporting period. In China, applicable environmental and occupational safety and health laws include laws regulating air emissions, water discharge and waste management. The Company has an environmental management structure designed to facilitate and support its compliance with these requirements. Although it is the Company’s intent to comply with all such requirements and regulations, it cannot provide assurance that it is at all times in compliance. The Company has made and will continue to make capital and other expenditures to comply with environmental requirements, although such expenditures were not material during the past two years. Environmental requirements are complex, frequently change and tend to become more stringent over time. Accordingly, the Company cannot assure investors that environmental requirements will not change or become more stringent over time or that potential environmental cost and liabilities will not be material.
During fiscal year 2011, the Company did not make any material capital expenditures relating to environmental compliance.
Employees
As of September 30, 2011, the Company employed approximately 4,581 full-time employees. The Company believes that it maintains a satisfactory working relationship with its employees and it has no significant labor disputes or any difficulty in recruiting staff for its operations.
As required by applicable Chinese law, the Company has entered into employment contracts with all of its officers, managers and employees. The Company’s employees in China participate in a state social insurance scheme organized by the Chinese municipal and provincial governments. The Company is required to contribute to the scheme at rates ranging from 8% to 29% of the average monthly salary. The expenses related to this scheme were $1,461,000 and $1,223,000 for fiscal years 2011 and 2010, respectively.
Available information
The Company’s Annual Reports on Form 10-K, Quarterly Reports on Form 10-Q and Current Reports on Form 8-K and other information are available free for charge from the Securities and Exchange Commission (the “SEC”) website. These materials can be inspected and copied at the SEC’s Public Reference Room at 100 F Street, NE, Washington, DC 20549. Information also can be obtained by mail at prescribed rates from the SEC’s Public Reference Room by calling the SEC at 1-800-SEC-0330. The SEC also maintains an Internet site that contains reports, proxy and information statements, and other information regarding issuers that file electronically with the SEC. The address of the SEC’s Internet site is http://www. sec.gov.
14
The Company’s Internet website, http:// winnermedical.investorroom.com , provides information relating to its corporate governance, which includes Corporate Governance Guidelines, Code of Business Conduct and Ethics and Winner Medical’s executive officers, directors and Board committees, including committee charters. The website also includes the Company’s Annual Reports, most recent Quarterly Reports, Current Reports, any Proxy Statements filed and any amendments to such reports as soon as reasonably practicable following the electronic filing of such reports with the SEC. In addition, the Company provides electronic or paper copies of its filings free of charge upon request.
|
Item 1A.
|
Risk Factors
|
An investment in the Company’s common stock involves a high degree of risk. In addition to the following risk factors, you should carefully consider the risks, uncertainties and assumptions discussed herein, and in other documents that the Company subsequently files with the SEC that update, supplement or supersede such information for which documents are incorporated by reference into this Report. Additional risks not presently known to the Company, or which the Company considers immaterial based on information currently available, may also materially adversely affect the Company’s business. If any of the events anticipated by the risks described herein occur, the Company’s business, cash flow, results of operations and financial condition could be adversely affected, which could result in a decline in the market price of the Company’s common stock, causing you to lose all or part of your investment.
Risk Related to the Company’s Business
|
|
Ÿ
|
The Company may be adversely affected by inflation in China.
|
China’s economic growth in the past few years has been fueled, in substantial part, by the issuance of debt. Large issuances of debt can lead to growth in the money supply, which can cause inflation. If prices for the Company’s products rise at a rate that is insufficient to compensate for the rise in the cost of supplies and personnel, it may harm the Company’s profitability.
In order to control inflation, the Chinese government has imposed controls on bank credit, limits on loans and restrictions on state bank lending. Such policies have lead to a slowing of economic growth in China. Further controls on lending, or interest rate increases by the central bank, may further slow economic activity in China, which could, in turn, materially increase the Company’s costs while, at the same time, reduce demand for the Company’s products.
In addition, the markets in which the Company sells its products are extremely competitive. The Company competes based upon a variety of factors, including cost of production and cost of raw materials. As all of the Company’s manufacturing is done in China, interest rate increases and labor and raw material inflation in that market can adversely affect the Company’s ability to provide quality products at a competitive price. It is possible that Company’s competitors, either in China or in other countries, have lowered or will soon lower their cost of production due to relative price decreases in their home markets, and have engaged or will engage in price competition through aggressive pricing policies to secure a greater market share. The Company’s business may be adversely affected by this competition, and the Company may not be able to maintain its profitability if the inflationary environment in China worsens.
|
|
Ÿ
|
The Company may suffer losses through its cotton futures trading.
|
Cotton is the Company’s primary raw material used in its manufacturing process. In order to mitigate against inflation and price fluctuations in the cost of this core raw material, the Company has engaged in cotton futures trading through its wholly-owned subsidiary Winner Industries (Shenzhen) Co., Ltd., “Winner Shenzhen.”
Cotton futures trading has a high risk that it may result in losses to the Company despite management’s efforts to limit such risk. While the Company has made on-going assessments of its trading performance and implemented operational policies and process controls for the futures trading, these efforts may prove insufficient in limiting the downside risk inherently present in this type of trading activity. If the Company’s exposure to cotton futures trading results in significant losses, stockholders’ equity and/or the Company’s profitability may be adversely impacted.
|
|
Ÿ
|
The Company engages in international sales, which expose it to trade restrictions.
|
The Company is a China-based manufacturer that exports products to various geographic regions. As such, the Company may be subject to risks associated with customs duties, export quotas and other trade restrictions that could have a significant impact on its revenue and profitability. While the Company has not encountered significant difficulties in connection with the sales of its products in international markets, the future imposition of, or significant increases in the level of, custom duties, export quotas or other trade restrictions could have an adverse effect on the Company. Further, the Company cannot assure that the laws of foreign jurisdictions where it sells and seeks to sell its products afford similar or any protection of its intellectual property rights as may be available under U.S. laws. The Company is directly impacted by the political, economic, military and other conditions in the countries where it sells or seeks to sell its products.
15
|
|
Ÿ
|
The Company’s dependence upon international customers may impede its ability to supply products.
|
During the fiscal year ended September 30, 2011, approximately 76.27% of the Company’s products were exported from its China-based manufacturing facilities to other countries. As a result, the Company is subject to risks associated with shipping products across borders, including shipping delays. If the Company cannot deliver its products on a competitive and timely basis, its relationships with international customers may be damaged and its financial condition could be harmed.
|
|
Ÿ
|
Expansion of the Company’s business may put additional pressure on its management, financial resources and operational infrastructure, impeding the Company’s ability to meet any increased demand for its products and possibly impairing its operating results.
|
The Company’s business plan is to significantly grow its operations to meet anticipated growth in demand for existing products and by the introduction of new product offerings. The Company’s planned growth includes the construction of several new production lines to be put into operation over the next five years, including the growth of its PurCotton retail business. Growth in the Company’s business may place a significant strain on its personnel, management, financial systems and other resources. In addition, the PurCotton retail business is different from the Company’s traditional business base, thus increasing the demands on the management. The Company may be unable to successfully and rapidly expand its sales to potential customers in response to potentially increasing demand or control costs associated with its growth.
To accommodate any such growth and compete effectively, the Company may need to obtain additional funding to improve information systems, procedures and controls and expand, train, motivate and manage its employees, and such funding may not be available in sufficient amount. Also, as the Company is self-operating PurCotton retail stores, there is a high capital expenditure for such start-up costs as inventory, rent, deposits and salary. As such, the Company may lose money during this expansion phase for its new business line. If the Company is not able to manage these activities and implement these expansion strategies successfully and to meet any increased product demand, the Company’s operating results could suffer.
|
|
Ÿ
|
The Company is expanding into retail operations, and may not be successful in implementing this new business model.
|
The Company has embarked on a plan to build retail sales under its “PurCotton” brand of products. This plan includes selling PurCotton brand products through the Company’s self-operated stores, retail sales points for PurCotton® products in supermarkets and other chain stores and selling the Company’s PurCotton® products through online platforms. Implementation of this plan has required the Company to invest a significant amount of financial and other forms of capital into building sales channels and hiring personnel.
This new business model is different than the Company’s traditional model of business-to-business sales and OEM manufacturing. The Company’s management team may not be able to build positive brand image, provide good returns on invested capital or properly manage both businesses so that neither the new nor the traditional business model inhibits the operation of the other. Failure by the Company’s management to properly grow and manage this new business model could negatively impact stockholders’ equity and the Company’s operations.
|
|
Ÿ
|
In order to grow at the pace expected by management, the Company will require additional capital to support its long-term business plan. If the Company is unable to obtain additional capital in future years, it may be unable to proceed with its long-term business plan and the Company may be forced to curtail or cease its operations.
|
The Company will require additional working capital to support its long-term business plan, which includes identifying suitable targets for horizontal or vertical mergers or acquisitions, so as to enhance the overall productivity and benefit from economies of scale. The Company’s working capital requirements and the cash flow provided by future operating activities, if any, will vary greatly from quarter to quarter, depending on the sales volume during the period and payment terms with its customers. The Company may not be able to obtain adequate levels of additional financing, whether through equity financing, debt financing or other sources. Additional financings could result in significant dilution to the Company’s earnings per share or the issuance of securities with rights superior to the Company’s current outstanding securities. In addition, the Company may grant registration rights to investors to purchase its equity or debt securities in the future. If the Company is unable to raise additional financing, it may be unable to implement its long-term business plan, develop or enhance its products and services, take advantage of future opportunities or respond to competitive pressures on a timely basis, if at all. In addition, a lack of additional financing could force the Company to substantially curtail or cease operations.
The validity and breadth of claims in medical technology patents involve complex legal and factual questions. Therefore, the extent of their enforceability and protection is highly uncertain. Issued patents or patents based on pending patent applications or any future patent applications may not exclude competitors or may not provide a competitive advantage to the Company. In addition, patents issued or licensed to the Company may not be held valid if subsequently challenged and others may claim rights in or ownership of such patents. Furthermore, the Company cannot ensure that its competitors have not developed or will not develop similar products, will not duplicate the Company’s products, or will not design around any patents issued to or licensed by the Company.
16
|
|
Ÿ
|
The Company depends on key personnel, and turnover of key employees and senior management could harm its business.
|
The Company’s future business and results of operations depend to a significant part on the continued contributions of its key technical and senior management personnel, including Jianquan Li, Xiuyuan Fang and Nianfu Huo, who hold the titles of CEO, President and Chairman, CFO and Vice President and Senior Vice President and Chairman of Supervisory Board, respectively. They also depend to a significant part on the Company’s ability to attract and retain additional qualified management, technical, marketing and sales and support personnel for its operations. For example, with its PurCotton retail business, the Company hired three experienced (in terms of retailing, e-commerce and brand building) directors for its three distribution channels. If the Company loses any of its key employees, or if any key employee fails to perform in his or her current position, or if the Company is unable to attract and retain skilled employees, the Company’s business could be suffered. Significant turnover of the Company’s senior management could significantly deplete the Company’s institutional knowledge held by its existing senior management team. The Company depends on the skills and abilities of these key employees in managing the manufacturing, technical, marketing and sales aspects of its business, any part of which could be harmed by staff turnover.
|
|
Ÿ
|
The Company has limited product liability insurance coverage and is subject to potential product liability claims for which it does not have insurance coverage.
|
Defects in the Company’s products could subject the Company to potential product liability claims arising from physical injury or property damage. The Company has limited product liability insurance covering the PRC, U.S. and Canadian markets, and does not have product liability insurance for other markets. Any successful claim brought against the Company in the markets not covered by any product liability insurance could adversely harm the Company’s reputation, business and financial condition.
|
|
Ÿ
|
The Company may not be able to adequately finance the significant costs associated with the development of new medical products.
|
The medical products in the medical dressings and medical disposables market change dramatically with new technological advancements. The Company is currently conducting research and development on a number of new products, which require a substantial outlay of capital. To remain competitive, the Company must continue to incur significant costs in product development, equipment, facilities and invest in research and development of new products. These costs may increase, resulting in higher fixed costs and operating expenses.
In addition to research and development costs, the Company could be required to expend substantial funds for and commit significant resources to the following:
|
|
·
|
additional engineering and other technical personnel;
|
|
|
·
|
advanced design, production and test equipment;
|
|
|
·
|
manufacturing adjustment that meet changing customer needs;
|
|
|
·
|
manufacturing capacity.
|
The Company’s future operating results will depend, to a significant extent, on its ability to continue to provide new products that compare favorably on the basis of cost and performance with the design and manufacturing capabilities of competitive third-party suppliers and technologies. The Company will need to increase its net sales to sufficiently offset these increased costs, the failure of which would negatively affect the Company’s operating results.
|
|
Ÿ
|
The Company may be exposed to potential risks relating to its internal controls over financial reporting and its ability to have those controls attested to by its independent auditors.
|
As directed by Section 404 of the Sarbanes-Oxley Act of 2002 or SOX 404, the Securities and Exchange Commission adopted rules requiring public companies to include a report of management on the companies’ internal controls over financial reporting in their annual reports, including Form 10-K. Management’s report on internal control over financial reporting is set out in Item 9A “Controls and Procedures” of the 2011 Form 10-K. As a smaller reporting company, the Company is not required to have auditor’s attestation reports at this time. However, should the Company be so required in the future, it can provide no assurance that the Company will be able to receive a positive attestation from its independent auditors. If significant deficiencies or material weaknesses in the Company’s internal controls are identified, the Company may not be able to remediate in a timely manner. In such case, investors and others may lose confidence in the reliability of the Company’s financial statements.
|
|
The Company’s holding company structure and Chinese accounting standards and regulations may limit the payment of dividends.
|
The Company has no direct business operations other than ownership of its subsidiaries. While the Company has no current intention of paying dividends, should it decide in the future to do so, as a holding company, its ability to pay dividends and meet other obligations depends upon the receipt of dividends or other payments from its operating subsidiaries and other holdings and investments. In addition, the Company’s operating subsidiaries, from time to time, may be subject to restrictions on their ability to make distributions to the Company, including restrictions on the conversion of local currency into U.S. dollars or other hard currency and other regulatory restrictions as discussed below. If future dividends are paid in Renminbi, fluctuations in the exchange rate for the conversion of Renminbi into U.S. dollars may reduce the amount received by U.S. stockholders upon conversion of the dividend payment into U.S. dollars.
17
Chinese regulations currently permit the payment of dividends only out of retained profits as determined in accordance with Chinese accounting standards and regulations. The Company’s subsidiaries in China are required to set aside a portion of their after tax profits according to Chinese accounting standards and regulations to fund certain reserve funds. Currently, the Company’s subsidiaries in China are the only sources of revenues or investment holdings for the payment of dividends. If they do not accumulate sufficient profits under Chinese accounting standards and regulations to first fund certain reserve funds as required by Chinese accounting standards, the Company will be unable to pay any dividends.
|
|
Ÿ
|
The Company may be subject to fines and legal sanctions imposed by the State Administration of Foreign Exchange (SAFE) or other Chinese government authorities if it or its Chinese directors or employees fail to comply with Chinese regulations relating to employee share options or shares granted by offshore listed companies to Chinese domestic individuals.
|
On December 25, 2006, the People’s Bank of China, or PBOC, issued the Administration Measures on Individual Foreign Exchange Control, and the corresponding Implementation Rules were issued by SAFE on January 5, 2007. Both of these regulations became effective on February 1, 2007. According to these regulations, all foreign exchange matters relating to employee stock holding plans, share option plans or similar plans with Chinese domestic individuals’ participation require approval from the SAFE or its authorized branch. On March 28, 2007, the SAFE issued the Application Procedure of Foreign Exchange Administration for Domestic Individuals Participating in Employee Stock Holding Plan or Stock Option Plan of Overseas-Listed Company, or the Stock Option Rule. Under the Stock Option Rule, Chinese domestic individuals who are granted share options or shares by an offshore listed company are required, through a Chinese agent or Chinese subsidiary of the offshore listed company, to register with the SAFE and complete certain other procedures. As the Company is an offshore listed company, its Chinese domestic directors and employees who may be granted share options or shares shall become subject to the Stock Option Rule. Under the Stock Option Rule, employees stock holding plans, share option plans or similar plans of offshore listed companies with Chinese domestic individuals’ participation must be filed with the SAFE. After the Chinese domestic directors or employees exercise their options, they must apply for the amendment to the registration with the SAFE. The Company is reviewing the procedures for such SAFE registration. If the Company or its Chinese domestic directors or employees fail to comply with these regulations, the Company or its Chinese domestic directors or employees may be subject to fines or other legal sanctions imposed by the SAFE or other Chinese government authorities.
|
|
Ÿ
|
The Company only has a royalty-free license to use certain patents and technologies in its business.
|
The Company and its subsidiaries have licensed the right to use four patents and related technologies for nonwoven fabric manufacturing from its CEO, President and Director, Jianquan Li, on a royalty-free basis and the license of some of the patents and related technologies is provided under certain license agreements entered into between the Company and Jianquan Li in 2005 and 2007. If the licensor, Jianquan Li, unilaterally terminates or repudiates the license agreements, the Company’s business may be adversely affected as the Company may have to litigate or arbitrate to retain such license rights. Further, if any of such licensed patents and related technologies is challenged or infringed or any claim is made against it, the Company cannot defend or dispute such challenge or claim or take action to defend against such infringement directly and will need to rely on the licensor to do so.
|
|
Ÿ
|
The Company’s business could be subject to environmental liabilities.
|
The Company uses certain hazardous substances in its operations. Currently it does not anticipate any material adverse effect on its business, revenues or results of operations as a result of compliance with Chinese environmental laws and regulations. However, the risk of environmental liability and charges associated with maintaining compliance with environmental laws is inherent in the nature of the Company’s business, and there is no assurance that material environmental liabilities and compliance charges will not arise in the future.
|
|
Ÿ
|
If the ultimate consumers of products assert product liability claims against the Company due to defects in such products, the Company operating results may suffer and its reputation may be harmed.
|
Defects may be found in existing or new products manufactured or sold by the Company. Significant property damage and personal injuries can result from defective products. In addition, such defects could cause the Company to incur significant return and exchange costs, re-engineering costs, divert the attention of the Company’s engineering personnel from product development efforts, and cause significant customer relations and business reputation problems. If the Company’s products are not properly packaged or assembled or used in the manufacturing process of other products, and if property damage and personal injuries result from products of which the Company’s products are components or the assembling parts, the Company could be subject to claims for damages and its reputation will be damaged, regardless of whether such claims are successful. In addition, the Company could be forced to undertake a product recall program for products sold to consumers, which could cause it to incur significant expenses and harm its reputation and that of its products. If the Company delivers defective products, its credibility and the market acceptance and sales of its products could be harmed.
18
Risks Related to the Company’s Industry
|
|
Ÿ
|
The Company may not be able to maintain or improve its competitive position because of strong competition in the medical dressing and medical disposable industry, and the Company expects this competition to continue to intensify.
|
The medical dressing and medical disposable industry is highly competitive. The Company faces competition from medical dressing and medical disposable manufacturers around the world. Some of the Company’s international competitors are larger than the Company and possess greater name recognition, assets, personnel, sales and financial resources. These entities may be able to respond more quickly to changing market conditions by developing new products and services that meet customer requirements or are otherwise superior to the Company’s products and services and may be able to market their products more effectively than the Company can because they have significantly greater financial, technical and marketing resources than the Company does. They may also be able to devote greater resources than the Company to develop, promote and sell their products. Increased competition may force the Company to reduce its prices, resulting in fewer customer orders, and loss of market share. The Company cannot assure that it will be able to distinguish itself in a competitive market. To the extent that the Company is unable to compete against existing and future competitors successfully, the Company’s business, operating results and financial condition would face material adverse effects.
|
|
Ÿ
|
Cost containment measures that are prevalent in the healthcare industry may result in lower margins.
|
The health care market was typified in recent years by strict cost containment measures imposed by governmental agencies, private insurers and other “third party” payers of medical costs. In response to these economic pressures, virtually all segments of the health care market have become extremely cost sensitive and in many cases hospitals and other health care providers have become affiliated with purchasing consortiums that obtain large quantities of needed products and thus can sell at much lower cost. These factors in combination have hindered suppliers and manufacturers like the Company who may not be able to supply the large quantities sought by the purchasing consortiums or who are unable to respond to the need for lower product pricing.
|
|
Ÿ
|
The Company’s failure to comply with governmental regulations could impair its operations and reduce its market share.
|
In China, medical sanitary materials and dressings, including medical gauzes, absorbent cottons, bandages and disposable surgical suits, are supervised as medical devices and are administered by the Department of Medical Device of State Drug Administration of China. The technology and specifications of these types of products must conform to and comply with Regulations for the Supervision and Administration of Medical Devices of China and the relevant Chinese laws and standards. In addition, since the Company sells its products in the international markets, its products are subject to regulations imposed by various governmental agencies in the markets where its products are sold. For example, the Company’s products exported to the United States must be listed with the FDA. Certain of the Company’s products exported to the U.S. require 510(k) clearance. All the Company’s products exported to European countries must have the CE certificate. The Company also needs a Certificate of Foreign Manufacture for the Japanese market. These layers of regulation cause delays in the distribution of the Company’s products and may require the Company to incur operating costs resulting from the need to obtain approvals and clearances from regulators. Although the Company believes that it has reached the applicable standards and obtained the required certificates in the markets mentioned above, however, the Company may not be able to fully comply with all the licensing/certification requirements in these markets in the future.
|
|
Ÿ
|
The Company’s margins are reduced when it sells its products to customers through a buying group.
|
The Company believes that the use of buying groups by customers is becoming a trend in its industry. These buying groups aggregate the demand of several different customers and then buy products in bulk at lower prices than any of the customers would be able to obtain individually. The Company has only limited production capacity. This makes it difficult for the Company to meet the large demand from those buying groups which represent overseas customers in developed countries. A single order of one kind of product from a top 500 multinational buyer could require the full manufacturing capacity of one of the Company’s plants. Although the Company has expanded its manufacturing capacity, its capacity is still not large enough to meet the demands of these customers. As a result, the Company may lose business to competitors who have more manufacturing capacity than does the Company.
Risks Related to Doing Business in China
|
|
Ÿ
|
The Chinese government’s macroeconomic policies could have a negative effect on the Company’s business and results of operations.
|
The Chinese government has implemented various measures to control the rate of economic growth in the PRC. Some of these measures may have a negative effect on the Company over the short or long term. Recently, to cope with high inflation and financial imbalances, the Chinese government has sharply tightened monetary policy. In addition, in order to attempt to alleviate some of the effects of unbalanced growth and social discontent, the Chinese government has enacted a series of social programs and anti-inflationary measures. These measures have, in conjunction, increased the costs on the financial and manufacturing sectors, destabilized the real estate sector and significantly slowed down the rate of economic growth in China. The Chinese government may be forced to engage in further macroeconomic policy shifts in order to limit instability and/or damage to certain business models or markets. The Chinese government’s continued attempts at managing the Chinese economy through a variety of macroeconomic policies, even if effected properly, may further slow China’s economy growth and/or cause great social unrest, all of which would have a negative effect on the Company’s business and results of operations.
|
|
Ÿ
|
Financial conditions in the China domestic and international markets may have a negative impact on the Company’s business and financial position, especially on the market acceptance of the Company’s new PurCotton® products.
|
The current worldwide economic condition, including risks inside of China, has created significant reductions in available capital and liquidity from banks and other providers of credit, which may adversely affect the Company’s customers’ ability to buy the Company’s new PurCotton® products. Additionally, many of the effects and consequences of the current financial conditions of the China domestic and international markets, including credit and economic downturn risks, are currently unknown. If these risks were to grow or the downturn in the economy, both inside and outside of China, were to get any worse, such a situation could potentially have a material adverse effect on the Company’s customers ability to purchase products or the Company’s own liquidity and capital resources, all of which could negatively impact the Company’s business and financial results.
19
|
|
Ÿ
|
Changes in China’s political or economic situation could harm the Company and its operational results.
|
In the past, economic reforms adopted by the Chinese government had a positive effect on the economic development of the country. However, present and future efforts by the Chinese government to grow and manage the Chinese economy may not be successful. In response to changing economic and social problems in China, the Chinese government could, at any time, reverse previously granted economic and legal reforms. This creates uncertainty in the Company’s operations and profitability. Some examples are:
|
|
·
|
level of government involvement in the economy;
|
|
|
·
|
control of foreign exchange;
|
|
|
·
|
methods of allocating resources;
|
|
|
·
|
balance of payments position;
|
|
|
·
|
international trade restrictions; and
|
|
|
·
|
international conflict.
|
The Chinese economy differs from the economies of most countries belonging to the Organization for Economic Cooperation and Development, or OECD, in many ways. As a result of these differences, the Company may not develop in the same way or at the same rate as might be expected if the Chinese economy were similar to those of the OECD member countries.
|
|
Ÿ
|
The Company’s business is largely subject to the uncertain legal environment in China and your ability to legally protect your investment could be limited.
|
The Chinese legal system is a civil law system based on written statutes. Unlike common law systems, it is a system in which precedents set in earlier legal cases are not generally used. The overall effect of legislation enacted over the past 20 years has been to enhance the protections afforded to foreign invested enterprises in China. However, these laws, regulations and legal requirements are relatively recent and are evolving rapidly, therefore their interpretation and enforcement involve uncertainties. These uncertainties could limit the legal protections available to foreign investors, such as the rights of foreign invested enterprises to hold licenses and permission such as requisite business licenses. In addition, all of the Company’s executive officers and its directors are residents of China and not of the United States, so all the assets of these persons are substantially located outside the United States. As a result, it could be difficult if not impossible, for investors to effect service of process in the United States, or to enforce a judgment obtained in the United States against the Company or any of these persons.
|
|
Ÿ
|
The Chinese government exerts substantial influence over the manner in which the Company must conduct its business activities.
|
China has recently only permitted provincial and local economic autonomy and private economic activities. The Chinese government has exercised and continues to exercise substantial control over virtually every sector of the Chinese economy through regulation and state ownership. The Company’s ability to operate in China may be harmed by changes in its economic policies and regulations, including those relating to taxation, import and export tariffs, environmental regulations, land use rights, property and other matters. The Company believes that its operations in China are in material compliance with all applicable legal and regulatory requirements. However, the central or local governments of these jurisdictions may impose new, stricter regulations or interpretations of existing regulations that would require additional expenditures and efforts on the Company’s part to ensure compliance with such regulations or interpretations.
Accordingly, government actions in the future, including any decision not to continue to support recent economic reforms and to return to a more centrally planned economy or regional or local variations in the implementation of economic policies, could have a significant effect on economic conditions in China or particular regions thereof, and could require the Company to divest itself of any interest the Company then holds in Chinese properties or joint ventures.
|
|
Ÿ
|
Restrictions on currency exchange may limit the Company’s ability to receive and use its revenues effectively.
|
The majority of the Company’s revenues are settled in Renminbi and U.S. dollars, and any future restrictions on currency exchanges may limit the Company’s ability to use revenue generated in Renminbi to fund any future business activities outside China or to make dividend or other payments in U.S. dollars. Although the Chinese government introduced regulations in 1996 to allow greater convertibility of the Renminbi for current account transactions, significant restrictions still remain, including primarily the restriction that foreign-invested enterprises may only buy, sell or remit foreign currencies after providing valid commercial documents, at those banks in China authorized to conduct foreign exchange business. In addition, conversion of Renminbi for capital account items, including direct investment and loans, is subject to governmental approval in China, and companies are required to open and maintain separate foreign exchange accounts for capital account items. The Company cannot be certain that the Chinese regulatory authorities will not impose more stringent restrictions on the convertibility of the Renminbi in the future.
20
|
|
Ÿ
|
The value of the Company’s securities will be affected by the foreign exchange rate between other currencies and Renminbi.
|
The value of the Company’s common stock will be affected by the foreign exchange rate between U.S. dollars and Renminbi, and other currencies that the Company’s sales may be denominated, such as Euro, British pound, Australian dollars, and etc. For example, to the extent that the Company needs to convert U.S. dollars into Renminbi for its operational needs and should the Renminbi appreciate against the U.S. dollar at that time, the Company’s financial position, the business of the Company, and the price of the Company’s common stock may be harmed. Conversely, if the Company decides to convert its Renminbi into U.S. dollars for the purpose of declaring dividends on its common stock or for other business purposes and the U.S. dollar appreciates against the Renminbi, the Company’s retained earnings which are denominated in Renminbi would be reduced.
|
|
Ÿ
|
Chinese regulations relating to the establishment of offshore special purpose companies by Chinese residents and registration requirements for China resident stockholders owning shares in offshore companies may subject the Company’s China resident stockholders to personal liability and limit the Company’s ability to acquire Chinese companies or to inject capital into its operating subsidiaries in China, limit its subsidiaries’ ability to distribute profits to the Company or otherwise materially and adversely affect the Company.
|
State Administration of Foreign Exchange, SAFE, issued a public notice in October 2005, “Circular 75,” requiring PRC residents, including both legal persons and natural persons, to register with the competent local SAFE branch before establishing or controlling any company outside of China, referred to as an “offshore special purpose company,” for the purpose of acquiring any assets of or equity interest in PRC companies and raising funds from overseas. In addition, any PRC resident who is the stockholder of an offshore special purpose company is required to amend his or her SAFE registration with the local SAFE branch, with respect to that offshore special purpose company in connection with any increase or decrease of capital, transfer of shares, merger, division, equity investment or creation of any security interest over any assets located in China. To further clarify the implementation of Circular 75, the SAFE issued Circular 124 and Circular 106 on November 24, 2005 and May 29, 2007, respectively. Under Circular 106, PRC subsidiaries of an offshore special purpose company are required to coordinate and supervise the filing of SAFE registrations by the offshore holding company’s stockholders who are PRC residents in a timely manner. If these stockholders fail to comply, the PRC subsidiaries are required to report to the local SAFE authorities. If the PRC subsidiaries of the offshore parent company do not report to the local SAFE authorities, they may be prohibited from distributing their profits and proceeds from any reduction in capital, share transfer or liquidation to their offshore parent company and the offshore parent company may be restricted in its ability to contribute additional capital into its PRC subsidiaries. Moreover, failure to comply with the above SAFE registration requirements could result in liabilities under PRC laws for evasion of foreign exchange restrictions. The Company’s PRC resident beneficial owners may not have registered with the local SAFE branch as required under SAFE regulations. The failure or inability of these PRC resident beneficial owners to comply with the applicable SAFE registration requirements may subject these beneficial owners or the Company to fines, legal sanctions and restrictions described above.
|
|
Ÿ
|
Certain tax treatment that the Company presently enjoys in China is scheduled to expire over the next several years.
|
Some of the Company’s subsidiaries are entitled to certain preferential tax treatment which will expire in fiscal year 2012 or 2013, as applicable. When such preferential tax treatment expires, the Company’s income tax expenses will increase, reducing its net income below what it would be if it continued to enjoy such preferential tax treatment.
Risks Related to the Market for the Company’s Stock
|
·
|
Techniques employed by short sellers may drive down the market price of the Company’s common stock.
|
Short selling is the practice of selling securities that the seller does not own but rather has borrowed from a third party with the intention of buying identical securities back at a later date to return to the lender. The short seller hopes to profit from a decline in the value of the securities between the sale of the borrowed securities and the purchase of the replacement shares, as the short seller expects to pay less in that purchase than it received in the sale. As it is therefore in the short seller’s best interests for the price of the stock to decline, many short sellers publish, or arrange for the publication of, negative opinions regarding the relevant issuer and its business prospects in order to create negative market momentum and generate profits for themselves after selling a stock short. These short attacks have, in the past, led to selling of shares in the market.
Recently, public companies that have substantially all of their operations in China have been the subject of short selling. Much of the scrutiny and negative publicity has centered around allegations of a lack of effective internal control over financial reporting resulting in financial and accounting irregularities and mistakes, inadequate corporate governance policies or a lack of adherence thereto and, in many cases, allegations of fraud. As a result, many of these companies are now conducting internal and external investigations into the allegations and, in the interim, are subject to shareholder lawsuits and/or SEC enforcement actions.
It is not clear what effect such negative publicity would have on the Company, if any. If the Company were to become the subject of any unfavorable allegations (whether such allegations are proven to be true or untrue), the Company could have to expend a significant amount resources to investigate such allegations and/or defend itself. While the Company would strongly defend against any such short seller attacks, the Company may be constrained in the manner in which it can proceed against the relevant short seller by principles of freedom of speech, applicable state law or issues of commercial confidentiality. Such a situation could be costly and time-consuming, and could distract the Company’s management from growing the Company. Even if such allegations are ultimately proven to be groundless, allegations against the Company could severely impact its business operations and stockholders equity, and any investment in the Company’s stock could be greatly reduced or rendered worthless.
21
|
|
Ÿ
|
The Company is subject to penny stock regulations and restrictions.
|
The SEC has adopted regulations which generally define so-called “penny stocks” as an equity security that has a market price less than $5.00 per share or an exercise price of less than $5.00 per share, subject to certain exemptions. As of November 29, 2011, the closing price for the Company’s common stock was $3.00. If the Company’s stock is a “penny stock,” it may become subject to Rule 15g-9 under the Securities Exchange Act of 1934, or the “Penny Stock Rule.” This rule imposes additional sales practice requirements on broker-dealers that sell such securities to persons other than established customers and “accredited investors,” generally, individuals with a net worth in excess of $1,000,000 or annual incomes exceeding $200,000, or $300,000 together with their spouses. For transactions covered by Rule 15g-9, a broker-dealer must make a special suitability determination for the purchaser and have received the purchaser’s written consent to the transaction prior to sale. As a result, this rule may affect the ability of broker-dealers to sell the Company’s securities and may affect the ability of purchasers to sell any of the Company’s securities in the secondary market.
For any transaction involving a penny stock, unless exempt, the rules require delivery, prior to any transaction in a penny stock, of a disclosure schedule prepared by the SEC relating to the penny stock market. Disclosure also is required to be made about sales commissions payable to both the broker-dealer and the registered representative and current quotations for the securities. Finally, monthly statements are required to be sent disclosing recent price information for the penny stock held in the account and information on the limited market in penny stock.
There can be no assurance that the Company’s common stock will qualify for exemption from the Penny Stock Rule. In any event, even if the Company’s common stock were exempt from the Penny Stock Rule, the Company would remain subject to Section 15(b)(6) of the Exchange Act, which gives the SEC the authority to restrict any person from participating in a distribution of penny stock, if the SEC finds that such a restriction would be in the public interest.
|
|
Ÿ
|
The market price for the Company’s common stock has been and may be volatile.
|
The trading price of the Company’s common stock has and may continue to fluctuate widely in response to various factors, some of which are beyond the Company’s control. These factors include, in addition to the risk factors set forth in this Report and the risk factors incorporated by reference herein, the Company’s quarterly operating results or the operating results of other companies in the Company’s industry, announcements by the Company or its competitors of acquisitions, new products, product improvements, commercial relationships, intellectual property, legal, regulatory or other business developments and changes in financial estimates or recommendations by stock market analysts regarding the Company or its competitors. In addition, the stock market in general, and the market for companies based in China in particular, has experienced extreme price and volume fluctuations. This volatility has had a significant effect on the market prices of securities issued by many companies for reasons unrelated or disproportionate to their operating performance. These broad market fluctuations may materially affect the Company’s stock price, regardless of its operating results.
Further, the market for the Company’s common stock is limited and the Company cannot assure you that a larger market will ever be developed or maintained. The Company cannot predict what effect this limited market will have on the volume or trading price of its common stock. Market fluctuations and volatility, as well as general economic, market and political conditions, could reduce the Company’s market price due to the low volume of trading, which may in turn lower the volume of trading even more. As a result, these factors may make it more difficult or impossible for you to sell the Company’s common stock for a positive return on your investment.
|
|
Ÿ
|
Certain of the Company’s stockholders hold a significant percentage of the Company’s outstanding voting securities.
|
Mr. Jianquan Li and his wife Ping Tse own approximately 74.64% of the Company’s outstanding voting securities as of November 30, 2011. As a result, they possess significant influence, giving them the ability, among other things, to elect a majority of the Company’s Board of Directors and to authorize or prevent proposed significant corporate transactions. Their ownership and control may also have the effect of delaying or preventing a future change in control, impeding a merger, consolidation, takeover or other business combination or discourage a potential acquirer from making a tender offer.
|
|
Ÿ
|
Certain provisions of the Company’s Articles of Incorporation may make it more difficult for a third party to effect a change in control.
|
The Company’s Articles of Incorporation authorizes the Board of Directors to issue up to 2,500,000 shares of preferred stock. The preferred stock may be issued in one or more series, the terms of which may be determined at the time of issuance by the Board of Directors without further action by the stockholders. These terms may include voting rights including the right to vote as a series on particular matters, preferences as to dividends and liquidation, conversion rights, redemption rights and sinking fund provisions. The issuance of any preferred stock could diminish the rights of holders of the Company’s common stock, and therefore could reduce the value of such common stock. In addition, specific rights granted to future holders of preferred stock could be used to restrict the Company’s ability to merge with, or sell assets to, a third party. The ability of the Board of Directors to issue preferred stock could make it more difficult, delay, discourage, prevent or make it more costly to acquire or effect a change-in-control, which in turn could prevent the Company’s stockholders from recognizing a gain in the event that a favorable offer is extended and could materially and negatively affect the market price of the Company’s common stock.
22
|
Item 1B.
|
Unresolved Staff Comments.
|
Not applicable.
|
Item 2.
|
Properties.
|
All land in China is owned by the government. Individuals and companies are permitted to acquire rights to use land or land use rights for specific purposes. In the case of land used for industrial purposes, the land use rights are granted for a period of 50 years. This period may be renewed at the expiration of the initial and any subsequent terms. Granted land use rights are transferable and may be used as security for borrowings and other obligations. The Company currently has land use rights of approximately 888,938 square meters in various parts of China, with total book value of approximately $4,970,346. All fees for acquiring such land use rights have been paid off as of September 30, 2011. The Company also has approximately 264,961 squares meters of structures in China, with total book value of approximately $26,898,250. Approximately 36,397 square meters of the structures are subject to mortgages.
The following table summarizes main land the Company owned as of September 30, 2011.
|
Winner Medical Subsidiaries
|
Location
|
Land Size
(Square Meters)
|
Net Book Value
(in US $)
|
|||||||
|
Winner Medical & Textile Ltd. Jingmen
|
Te 1 Hangkong Road, Pailou Town, Jingmen City, Hubei Province , China
|
40,542
|
41,389
|
|||||||
|
Winner Medical (Huanggang) Co., Ltd.
|
Te 1, Chibi Avenue, Huanggang City, Hubei Province, China
|
564,742
|
|
2,554,435
|
|
|||||
|
Winner Medical & Textile Ltd. Yichang
|
No. 20 Jiangxia Avenue, Jiangkou Town, Zhijiang City, Hubei Province, China
|
24,448
|
|
108,305
|
|
|||||
|
Winner Medical & Textile Ltd. Chongyang
|
Qingshan Park, Chongyang County, Hubei Province, China
|
73,268
|
|
6,655
|
|
|||||
|
Winner Medical & Textile Ltd. Jiayu
|
No. 172 Phoenix Avenue, Yuyue Town, Jiayu County, Hubei Province, China
|
34,167
|
|
10,316
|
|
|||||
|
Winner Industries (Shenzhen) Co., Ltd.
|
Winner Industrial Park, Bulong Road, Longhua, Shenzhen City, Guangdong Province, China
|
29,064
|
|
1,074,771
|
|
|||||
|
Hubei Winner Textiles Co., Ltd.
|
No. 47 South Road of Jianshe, Yuekou Town, Tianmen City, Hubei Province. China
|
122,707
|
|
1,174,475
|
|
|||||
|
Total
|
888,938
|
|
4,970,346
|
|
||||||
The following table summarizes the Company’s main structures it owned as of September 30, 2011.
|
Winner Medical Subsidiaries
|
Location
|
Structure Size
(Square Meters)
|
Net Book Value
(in US $)
|
|||||||
|
Winner Medical & Textile Ltd. Jingmen
|
Te 1 Hangkong Road, Pailou Town, Jingmen City, Hubei Province , China
|
|
|
20,129
|
|
|
|
2,100,954
|
|
|
|
Winner Medical (Huanggang) Co., Ltd.
|
Te 1, Chibi Avenue, Huanggang City, Hubei Province, China
|
|
|
74,869
|
|
|
|
12,208,182
|
|
|
|
Winner Medical & Textile Ltd. Yichang
|
No. 20 Jiangxia Avenue, Jiangkou Town, Zhijiang City, Hubei Province, China
|
|
|
15,154
|
|
|
|
696,493
|
|
|
|
Winner Medical & Textile Ltd. Chongyang
|
Qingshan Park, Chongyang County, Hubei Province, China
|
|
|
44,586
|
|
|
|
3,072,618
|
|
|
|
Winner Medical & Textile Ltd. Jiayu
|
No. 172 Phoenix Avenue, Yuyue Town, Jiayu County, Hubei Province, China
|
|
|
20,700
|
|
|
|
1,101,305
|
|
|
|
Winner Industries (Shenzhen) Co., Ltd.
|
Winner Industrial Park, Bulong Road, Longhua, Shenzhen City, Guangdong Province, China
|
|
|
36,626
|
|
|
|
4,893,539
|
|
|
|
Hubei Winner Textiles Co., Ltd.
|
No. 47 South Road of Jianshe, Yuekou Town, Tianmen City, Hubei Province. China
|
|
|
52,897
|
|
|
|
2,825,159
|
|
|
|
Total
|
|
|
264,961
|
|
|
|
26,898,250
|
|
||
23
The following table summarizes the Company’s properties that are subject to mortgages as of September 30, 2011.
|
Mortgagor/Borrower
|
Location
|
Mortgagee/Lender Bank
|
Structure Subject
to Mortgage
(Square Meters)
|
|||||
|
Winner Industries
(Shenzhen) Co., Ltd.
|
Winner Industrial Park, Bulong Road, Longhua, Shenzhen City, Guangdong Province, China
|
China Merchants Bank, Shenzhen Branch
|
|
|
18,808
|
|
||
|
Winner Industries (Shenzhen) Co., Ltd.
|
Winner Industrial Park, Bulong Road, Longhua, Shenzhen City, Guangdong Province, China
|
Shenzhen Industrial and Commercial Bank of China
|
|
|
17,589
|
|
||
|
Total
|
|
|
36,397
|
|
||||
The Company entered into an agreement in 2005 with the local government agency of Huanggang to acquire 564,742 square meters, approximately 140 acres, of land which it plans to dedicate primarily to the construction of 100% cotton spunlace nonwoven fabric production facilities. The land use right certificate for 295,188 square meters, approximately 73 acres, of this land was issued to the Company in November 2005. The land use right certificate for 269,554 square meters, approximately 63 acres, of this land was issued to the Company in July 2007. As of September 30, 2011, the net book value of assets invested for this project is approximately $32.40 million, which includes $2.55 million in land, $12.21 million in facilities, $17.06 million in equipment and $0.57 million in other aspects of the project. Funds for this project were raised in the equity market and through bank loans.
The Company believes that all its land and structures have been adequately maintained, are generally in good condition, and are suitable and adequate for its business. The Company believes that the new facility under construction and the expected land use rights to additional land will be sufficient for its expansion efforts.
Some of the Company’s properties are leased from third parties. In most cases, the leased properties are dormitories or small operating spaces. In the remaining cases, the leased properties include manufacturing facilities and the use the Company is making of the land is in compliance with the relevant government authority’s land use planning. In a few cases, the lessers were unable to provide copies of documentation evidencing their rights to use the property leased to the Company. In the event of any future dispute over the ownership of the leased properties, the Company believes it could easily and quickly find replacement premises and dormitories so that the operations would not be affected.
|
Item 3.
|
Legal Proceedings.
|
From time to time, the Company may become involved in various lawsuits and legal proceedings that arise in the ordinary course of business. However, litigation is subject to inherent uncertainties, and an adverse result in these or other matters may arise from time to time that may harm the Company’s business.
The Company is currently not aware of any such legal proceedings or claims that it believes it will have a material adverse affect on its business, financial condition or operating results.
To the Company’s knowledge, no director, officer or affiliate of the Company, and no owner of record or beneficial owner of more than five percent, 5%, of the Company’s securities, or any associate of any such director, officer or security holder is a party adverse to the Company or has a material interest adverse to the Company in reference to pending litigation.
|
Item 4.
|
(Removed and Reserved).
|
24
PART II
|
Market for Registrant’s Common Equity, Related Stockholder Matters and Issuer Purchases of Equity Securities.
|
The Company’s common stock is quoted under the symbol “WWIN” on the Nasdaq Global Market. The CUSIP number is 97476P204. Effective October 8, 2009, the Company migrated from the OTC Bulletin Board or OTCBB to the New York Stock Exchange AMEX, changing its symbol from “WMDG.OB” to “WWIN” Effective April 6, 2010, the Company migrated from the New York Stock Exchange AMEX to the NASDAQ Global Market, under the same symbol of “WWIN.”
On October 6, 2009, the Company effected a reverse stock split in which 1 new share of common stock was issued for 2 old shares of common stock, thus exchanging 42,280,840 old shares for 21,140,420 new shares. This reverse stock split was reflected in the Company’s financial statements as of October 6, 2009. Upon effectiveness of the reverse stock split, the outstanding and issued shares were approximately 22,363,740 shares, after rounding up fractional shares. On April 30 and May 19, 2010, the Company completed a public offering of 1,587,000 shares of common stock at a price of $6.10 per share. Following this public offering, the total outstanding and issued shares were approximately 23,950,740 shares. On October 7, 2010 and 2011, under the 2008-2009 Restricted Stock Unit Incentive Plan, the Company vested 179,507 units and 231,625 units of restricted stock to eligible participants, respectively. Following the issuance of the restricted stock, the total outstanding and issued shares were 24,361,872 shares. In July 2011, the Company vested 10,000 restricted stock units to an investor relations consultant firm pursuant to a one-year consultant agreement. As of November 30, 2011, the Company’s total outstanding and issued shares were 24,371,872 shares.
Stock Price Comparisons (NASDAQ composite transactions)
The following table sets forth, for the periods indicated, the high and low close prices for the Company’s common stock. These prices reflect inter-dealer prices, without retail mark-up, mark-down or commission, and may not represent actual transactions. The Company’s fiscal year ended is on September 30.
|
(Per share amounts in US Dollars)
|
First Quarter
|
Second Quarter
|
Third Quarter
|
Fourth Quarter
|
||||||||||||
|
2011 High
|
6.19 | 6.05 | 5.23 | 4.89 | ||||||||||||
|
2011 Low
|
4.5 | 4.48 | 4.47 | 3.17 | ||||||||||||
|
2010 High
|
7.4 | 7.6 | 7.3 | 6.4 | ||||||||||||
|
2010 Low
|
4.2 | 5.8 | 5.3 | 4.4 | ||||||||||||
|
|
*
|
One-for-two reverse stock split became effective on October 6, 2009, which automatically converted two shares of the Company's common stock into one share of common stock. The share prices are adjusted on post-split basis.
|
Reports to Stockholders
The Company plans to furnish its stockholders with an annual report for each fiscal year ending September 30 containing financial statements audited by its independent certified public accountants. Additionally, the Company may, in its sole discretion, issue unaudited quarterly or other interim reports to its stockholders when it deems appropriate. The Company intends to maintain compliance with the periodic reporting requirements of the Securities Exchange Act of 1934.
Approximate Number of Holders of the Company’s Common Stock
On September 30, 2011, there were approximately 1,570 stockholders of record of the Company’s common stock.
Dividend Policy
Other than the dividends declared or paid by the Company’s subsidiary Winner Group Limited and the reverse stock split effected before the reverse acquisition transaction, the Company has never declared dividends or paid cash dividends. The Company’s board of directors will make any decisions regarding dividends. The Company currently intends to retain and use any future earnings for the development and expansion of its business and does not anticipate paying any cash dividends in the foreseeable future.
Securities Authorized for Issuance Under Equity Compensation Plans
The following table sets forth information as of September 30, 2011, with respect to the Company’s equity compensation plans previously approved by stockholders and equity compensation plans not previously approved by stockholders.
|
Equity Compensation Plan Information
|
||||||||||
|
Plan Category
|
Number of securities to be issued
upon exercise of outstanding
options, warrants and rights
|
Weighted average exercise price
of outstanding options, warrants
and rights
|
Number of securities remaining available
for future issuance under equity
compensation plans
(excluding securities reflected in column (a))
|
|||||||
|
(a)
|
(b)
|
(c)
|
||||||||
|
Equity compensation plans approved by stockholders
|
0 | $ | 0.00 | 2,310,493 | [1] | |||||
|
Equity compensation plans not approved by stockholders
|
0 | $ | 0.00 | 0 | ||||||
|
Total
|
0 | $ | 0.00 | 2,310,493 | ||||||
25
|
|
[1]
|
On October 7, 2007 the Company adopted the 2006 Amended and Restated Restricted Stock Unit Incentive Plan, whereby the Board was authorized to issue up to 2,500,000 shares of common stock including incentive stock options, which reflected 1-for-2 reverse stock split, to certain employees, officers, directors, consultants, independent contractors and advisors of the Company or any parent, subsidiary or affiliate of the Company. As of September 30, 2011, 597,187 nonvested stock units have been granted under the plan, 179,507 stock units had vested on October 7, 2010 and 10,000 stock units had been issued on July 14, 2011. The weighted average grant date fair value for these nonvested stock units as of September 30, 2011 was $4.07. On October 7, 2011, under the 2008-2009 Restricted Stock Unit Incentive Plan, a sub-plan of the 2006 Amended and Restated Restricted Stock Unit Incentive Plan, the Company vested 231,625 units of restricted stock, which reflected 1-for-2 reverse stock split, to its 83 eligible participants who were employees of the Company and the Company’s senior management and key employees as designated by the Company’s Chief Executive Officer under authority of the Company’s Board of Directors.
|
Recent Sales of Unregistered Securities
The Company has not sold any equity securities during the fiscal year ended September 30, 2011 that were not previously disclosed in a quarterly report on Form 10-Q or a current report on Form 8-K.
|
Item 6.
|
Selected Financial Data.
|
The selected consolidated statements of income and comprehensive income data and selected consolidated statements of cash flows data for the years ended September 30, 2011 and 2010 and the selected consolidated balance sheets data as of September 30, 2011 and 2010 are derived from the Company’s audited consolidated financial statements included elsewhere in this Report. The selected consolidated financial data for the year ended September 30, 2009, 2008 and 2007 are derived from the Company’s audited consolidated financial statements not included in this Report.
The following selected historical financial information should be read in conjunction with the Company’s consolidated financial statements and related notes and the information contained in “Management’s Discussion and Analysis of Financial Condition and Results of Operations.”
|
|
|
Year Ended September 30,
|
|
|||||||||||||
|
|
|
2007
|
|
2008
|
|
2009
|
|
2010
|
|
2011
|
|
|||||
|
Statement of operations data:
|
|
|
|
|
|
|
|
|
|
|
|
|||||
|
Net sales
|
|
$
|
70,280,960
|
|
$
|
85,505,762
|
|
$
|
98,385,603
|
|
$
|
115,030,651
|
|
$
|
149,896,424
|
|
|
|
|
|
|
|
|
|
|
|
|
|
|
|
|
|
|
|
|
Cost of sales
|
|
|
52,869,597
|
|
|
64,086,581
|
|
|
70,444,383
|
|
|
80,473,292
|
|
|
109,046,284
|
|
|
|
|
|
|
|
|
|
|
|
|
|
|
|
|
|
|
|
|
Gross profit
|
|
|
17,411,363
|
|
|
21,419,181
|
|
|
27,941,220
|
|
|
34,557,359
|
|
|
40,850,140
|
|
|
Selling, general and administrative expenses
|
|
|
11,959,184
|
|
|
14,437,539
|
|
|
16,874,131
|
|
|
20,370,950
|
|
|
26,525,378
|
|
|
|
|
|
|
|
|
|
|
|
|
|
|
|
|
|
|
|
|
Income before income taxes
|
|
|
5,662,391
|
|
|
5,563,166
|
|
|
11,421,176
|
|
|
14,664,295
|
|
|
13,545,977
|
|
|
Income taxes
|
|
|
(15,015)
|
|
|
591,118
|
|
|
2,358,093
|
|
|
1,666,933
|
|
|
1,970,314
|
|
|
|
|
|
|
|
|
|
|
|
|
|
|
|
|
|
|
|
|
Net income attributable to Winner Medical Group Inc.
|
|
|
5,624,854
|
|
|
5,066,295
|
|
|
9,128,574
|
|
|
13,090,498
|
|
|
11,535,891
|
|
|
|
|
|
|
|
|
|
|
|
|
|
|
|
|
|
|
|
|
Net income attributable to Winner Medical Group Inc. per share
|
|
|
||||||||||||||
|
— basic
|
|
$
|
0.25
|
|
$
|
0.23
|
|
$
|
0.41
|
|
$
|
0.57
|
|
$
|
0.48
|
|
|
— diluted
|
|
$
|
0.25
|
|
$
|
0.23
|
|
$
|
0.41
|
|
$
|
0.56
|
|
$
|
0.47
|
|
|
|
|
|
|
|
|
|
|
|
|
|
|
|
|
|
|
|
|
Weighted average number of shares outstanding
|
|
|
|
|||||||||||||
|
— basic
|
|
|
22,338,675
|
|
|
22,363,675
|
|
|
22,363,675
|
|
|
23,014,065
|
|
|
24,128,868
|
|
|
— diluted
|
|
|
22,338,675
|
|
|
22,510,962
|
|
|
22,403,237
|
|
|
23,383,532
|
|
|
24,549,361
|
|
|
Cash dividend declared per common share
|
|
|
-
|
|
|
-
|
|
|
-
|
|
|
-
|
|
|
-
|
|
|
|
|
|
|
|
|
|
|
|
|
|
|
|
|
|
|
|
|
Cash flows data:
|
|
|
|
|
|
|
|
|
|
|
|
|
|
|
|
|
|
Net cash provided by operating activities
|
|
$
|
7,662,424
|
|
$
|
9,644,401
|
|
$
|
14,688,351
|
|
$
|
12,653,828
|
|
$
|
4,982,289
|
|
|
Net cash used in investing activities
|
|
|
(12,246,855
|
)
|
|
(11,084,844
|
)
|
|
(3,281,369
|
)
|
|
(9,401,100
|
)
|
|
(6,911,311
|
)
|
|
Net cash provided by/(used in) financing activities
|
|
|
6,295,377
|
|
|
958,553
|
|
|
(8,426,513
|
)
|
|
1,962,602
|
|
|
7,957,864
|
|
|
|
|
September 30,
|
|
|||||||||||||
|
|
|
2007
|
|
2008
|
|
2009
|
|
2010
|
|
2011
|
|
|||||
|
Balance sheet data:
|
|
|
|
|
|
|
|
|
|
|
|
|||||
|
Cash and cash equivalents
|
|
$
|
6,377,488
|
|
$
|
6,462,505
|
|
$
|
9,493,026
|
|
$
|
14,818,179
|
|
$
|
21,945,105
|
|
|
Total assets
|
|
|
85,121,335
|
|
|
101,918,091
|
|
|
100,936,009
|
|
|
118,975,995
|
|
|
149,918,687
|
|
|
|
|
|
|
|
|
|
|
|
|
|
|
|
|
|
|
|
|
Total current liabilities
|
|
|
24,085,690
|
|
|
28,966,069
|
|
|
18,679,691
|
|
|
13,036,125
|
|
|
24,197,178
|
|
|
Total long term liabilities
|
|
|
22,857
|
|
|
41,965
|
|
|
41,899
|
|
|
42,699
|
|
|
45,025
|
|
|
Total liabilities
|
|
|
24,108,547
|
|
|
29,008,034
|
|
|
18,721,590
|
|
|
13,078,824
|
|
|
24,242,203
|
|
|
|
|
|
|
|
|
|
|
|
|
|
|
|
|
|
|
|
|
Total Winner Medical Group Inc. stockholders’ equity
|
|
|
60,821,657
|
|
|
72,761,751
|
|
|
82,131,604
|
|
|
105,796,972
|
|
|
125,535,766
|
|
|
|
|
|
|
|
|
|
|
|
|
|
|
|
|
|
||
|
Noncontrolling interests
|
|
|
191,131
|
|
|
148,306
|
|
|
82,815
|
|
|
100,199
|
|
|
140,718
|
|
26
|
Item 7.
|
Management’s Discussion and Analysis of Financial Condition and Results of Operations.
|
The following management’s discussion and analysis should be read in conjunction with the Company’s financial statements and the notes thereto and the other financial information appearing elsewhere in this Report. In addition to historical information, the following discussion contains certain forward-looking information. See “Special Note Regarding Forward Looking Statements” above for certain information concerning those forward looking statements. The Company’s financial statements are prepared in U.S. dollars and in accordance with U.S. GAAP.
Overview
Winner Medical’s business operations consist of the manufacturing, marketing, researching and developing of cotton-based medical dressings and disposables and consumer products. The Company has fourteen wholly-owned manufacturing and sales subsidiaries and four joint venture companies, all located in the PRC and Hong Kong. The Company has established several integrated manufacturing and processing lines for its core products. The Company’s product offerings include medical dressings and medical disposables, which consist of medical care and wound care, as well as PurCotton® products. The Company manufactures its products in China and sells its medical dressings and medical disposables both in China and abroad, with Europe, the United States and Japan serving as the top four markets. The Company also sells its PurCotton® jumbo rolls in both China and abroad, and PurCotton® consumer products mainly in China.
Industry Wide Trends that are Relevant to the Company’s Business
The medical dressings and medical disposables manufacturing markets are continually evolving due to technological advances and new demands in the healthcare industry. The Company believes trends in the industry towards improving medical care and higher quality patient conditions, changes in patient treatment approaches and technological advances will impact favorably on the demand for its products. The Company anticipates that these factors will result in a growth in sales of medical dressings and medical disposables and increase revenue for the Company.
The medical dressings and medical disposables market is subject to consumption patterns and trends. One such trend or consumption pattern relates to the age demographics of the end users of the Company’s products. On average, the worldwide population is aging and life spans are generally increasing. As the general population begins to include a larger percentage of older people, the Company anticipates that more medical care will be required, and that will result in increased sales of the Company’s products.
Another industry trend or consumption pattern in the Company’s industry is that hospitals are increasingly looking to reduce their costs. Hospitals reduce costs by seeking alternative products that increase efficiency or reduce labor costs. For example, disposable catheters reduce the need for frequent changes of diapers and bed sheets. Other popular disposables used by hospitals to reduce operating costs include Eustachian tubes and needles, disposable clothing and accessories. The Company believes the demand for cost-effective products and healthcare solutions and an increasing emphasis on health worldwide will bring an increase in the demand for medical instruments, medical dressings and medical disposables.
For global medical dressings, the Company believes that there is a geographical shift in product manufacturing from countries with high labor and manufacturing costs to countries where labor and manufacturing costs are generally lower. As a result of the relatively low cost structure and rapid development of the China economy, some foreign multinational companies are entering into the China market to seek suppliers to produce their goods. The Company believes that having more large multinational healthcare companies seeking suppliers to produce their products in China will benefit the Company. In addition, the Company is negotiating with several large healthcare companies in developed countries which intend to outsource some of their production lines.
The Company believes that China’s local market demand for medical dressings and medical disposables will continue to grow along with corresponding increases in per capita income as more affluent people demand higher-quality medical services and products. This presents a significant opportunity for the Company, since the Company believes that it provides relatively higher-quality products than its peers. However, the Company’s competitors compete with reduced prices and significant relationship with hospitals, as the Company’s entrance into the Chinese medical dressings market has been more recent than its competitors’. In order to increase market share, the Company is developing a distribution network to capture opportunities in China, mainly through local distributors, over-the-counter drugstore chains and direct sales to hospitals in Hong Kong and hospitals in parts of Guangdong province. Specifically, certain employees have been placed in charge of communicating with local distributors in some major cities, such as Guangzhou, Fuzhou, Chengdu, Chongqing, Wuhan, Shanghai, Beijing and Shenyang.
Also affecting the Company’s industry is the growing sensitivity towards protecting the environment and increased health concerns, as consumers are becoming increasingly concerned about the environmental impact of the products they buy. Nonwoven medical dressings, medical instruments and medical disposables usually contain materials like rubber and polyester, which may result in restrictions on the purchase of these products under environmental protection regulations. At the same time, such materials are not biodegradable and are composed of petroleum, a non-renewable energy resource. In recent years, cases of melamine-tainted milk, recycled edible oil and contaminated vegetables have significantly raised consumers’ awareness about the environment they live in, the food they eat, and the products they use. The Company believes this trend will strengthen one of its competitive advantages because its new PurCotton® products are primarily made of natural cotton and manufactured in an environmentally-friendly fashion. The Company believes its PurCotton® products will be a medium to long-term growth contributor to its revenue, because they can be applied to consumer products as well as to the medical industry.
27
At the same time, competition among retail brands for women and baby care products is intense in China. Many larger foreign and domestic brands have increased their market shares by their product portfolios through various market channels. The Company may not attract a large amount of new customers from its competitors in the near future, while it has to expend start-up costs in building sales channels and raising brand awareness among consumers. Customer membership for the PurCotton retail business can be obtained by filling out an application form online or offline with a payment of RMB30 (or approximately $4.70), members to enjoy an 8% discount from retail prices when purchasing products. The number of customer membership has rapidly increased to approximately 27,000 in November, 2011, from approximately 19,000 in August, 2011. The Company believes that this increase reflects brand recognition by customers visiting its retail stores and online platforms.
|
Ÿ
|
Chinese Medical Reform. In 2010, the Chinese government announced that it intended to spend RMB 850 billion on health care in the following three years in order to improve accessibility to and desire for medical care in China. The Chinese government’s increased spending in the medical devices sector is expected to be a driving force of the Company’s future development.
|
|
Ÿ
|
Increased Government Subsidies. The Chinese government continues to subsidize private enterprises to stimulate innovation, research and development, brand promotion and management improvement. The Company has already received and expects to receive some of these government subsidies.
|
|
Ÿ
|
VAT Tax Reform. The Chinese government reformed its policy on value added taxes (“VAT”) for purchased machinery. Starting on January 1, 2009, the 17% input VAT for machinery is eligible for reimbursement. This policy reduces the Company’s cost on technical improvements to and purchase of equipment.
|
|
Ÿ
|
Tax Rebate Policy. The Chinese State Ministry of Finance and State Ministry of Taxation announced that as of June 1, 2009, the tax rebate rate for exports of medical dressing and related products would be increased by two percent. Effective from June 1, 2009, the tax rebate rate for exports of all the Company’s medical dressing products, and also some types of medical equipment will increase from 13% to 15%; and the tax rebate rate for exports of the Company’s plastic and glass products will increase from 11% to 13%.
|
Results of Operations
Comparison for the Year Ended September 30, 2011 and 2010
The following sets forth certain of the Company’s consolidated statements of income information for the years ended September 30, 2011 and 2010.
(All amounts, other than percentages, in thousands of U.S. dollars)
|
YEAR ENDED 9/30/11
|
YEAR ENDED 9/30/10
|
|||||||||||||||||||||||
|
Item
|
In
Thousands
|
As a
Percentage
|
In Thousands
|
As a
Percentage
|
Amount
Change,
In Thousands
|
%
Change
|
||||||||||||||||||
|
Net sales
|
$ | 149,896 | 100.00 | % | $ | 115,031 | 100.00 | % | $ | 34,865 | 30.31 | % | ||||||||||||
|
Cost of sales
|
$ | 109,046 | 72.75 | % | $ | 80,473 | 69.96 | % | $ | 28,573 | 35.51 | % | ||||||||||||
|
Gross profit
|
$ | 40,850 | 27.25 | % | $ | 34,557 | 30.04 | % | $ | 6,293 | 18.21 | % | ||||||||||||
|
Other operating income, net
|
$ | 4 | 0.00 | % | $ | 557 | 0.48 | % | $ | (553 | ) | (99.28 | ) % | |||||||||||
|
Government subsidies
|
$ | 1,594 | 1.06 | % | $ | 209 | 0.18 | % | 1,385 | 662.68 | % | |||||||||||||
|
Realized loss on commodity financial instruments
|
$ | 1,860 | 1.24 | % | $ | - | - | 1,860 | - | |||||||||||||||
|
Foreign exchange losses, net
|
$ | 1,051 | 0.70 | % | $ | 493 | 0.43 | % | $ | 558 | 113.18 | % | ||||||||||||
|
Selling, general and administrative expenses
|
$ | 26,525 | 17.70 | % | $ | 20,371 | 17.71 | % | $ | 6,154 | 30.21 | % | ||||||||||||
|
Interest expense
|
$ | 93 | 0.06 | % | $ | 129 | 0.11 | % | $ | (36 | ) | (27.91 | ) % | |||||||||||
|
Interest income
|
$ | 165 | 0.11 | % | $ | 98 | 0.09 | % | $ | 67 | 68.37 | % | ||||||||||||
|
Investment yields
|
$ | 462 | 0.31 | % | $ | 236 | 0.21 | % | $ | 226 | 95.76 | % | ||||||||||||
|
Income tax
|
$ | 1,970 | 1.31 | % | $ | 1,667 | 1.45 | % | $ | 303 | 18.18 | % | ||||||||||||
|
Net (income)/loss attributable to non-controlling interests
|
$ | (40 | ) | (0.03 | )% | $ | 93 | 0.08 | % | $ | 133 | 143.01 | % | |||||||||||
|
Net income attributable to Winner Medical Group Inc.
|
$ | 11,536 | 7.70 | % | $ | 13,090 | 11.38 | % | $ | (1,554 | ) | (11.87 | ) % | |||||||||||
28
Product Information
Winner Medical is a diversified manufacturer and marketer of cotton-base medical dressings and medical disposables, as well as PurCotton® products. In fiscal year ended September 30, 2011, the Company’s operations were conducted in two operating business segments by products. The Company’s operating decisions, on-site management, internal reporting and performance assessments are conducted within each of the following two identified product segments:
|
|
Ÿ
|
Medical Products (Medical Care and Wound Care)
|
|
|
Ÿ
|
PurCotton® products (Consumer Products and Jumbo Roll Supplies)
|
The following table illustrates the operating results for each product type for the years ended September 30, 2011 and 2010.
(All amounts, other than percentages, in thousands of U.S. dollars)
|
Medical Products
|
PurCotton® Products
|
Consolidated
|
||||||||||||||||||||||
|
Item
|
2011
|
2010
|
2011
|
2010
|
2011
|
2010
|
||||||||||||||||||
|
Net sales
|
$ | 130,798 | 104,903 | $ | 19,098 | 10,128 | $ | 149,896 | 115,031 | |||||||||||||||
|
Gross profit
|
$ | 34,820 | 31,146 | $ | 6,030 | 3,411 | $ | 40,850 | 34,557 | |||||||||||||||
|
Gross margin
|
26.62 | % | 29.69 | % | 31.57 | % | 33.68 | % | 27.25 | % | 30.04 | % | ||||||||||||
|
Income (loss) from operations before taxes
|
16,873 | 14,081 | (3,327 | ) | 583 | 13,546 | 14,664 | |||||||||||||||||
|
Net income attributable to Winner Medical Group Inc.
|
14,025 | 12,291 | (2,489 | ) | 799 | 11,536 | 13,090 | |||||||||||||||||
|
Profit margin
|
10.72 | % | 11.72 | % | (13.03 | ) % | 7.89 | % | 7.70 | % | 11.38 | % | ||||||||||||
Sales by Region
The following table illustrates the sales revenues by regions from major geographic areas for the years ended September 30, 2011 and 2010. The table also provides the percentage of total net sales represented by each listed region.
Comparison of Sales by Regions for the years ended September 30, 2011 and 2010
(All amounts, other than percentages, in thousands of U.S. dollars)
|
Year Ended
on 9/30/11
in Thousands
|
As a
Percentage of
Total Net Sales
|
Year Ended
9/30/10
in Thousands
|
As a
Percentage of
Total Net Sales
|
Amount
Change
in Thousands
|
As a
Percentage
Change
|
|||||||||||||||||||
|
Europe
|
52,100 | 34.76 | % | 42,278 | 36.75 | % | 9,822 | 23.23 | % | |||||||||||||||
|
Britain
|
13,451 | 8.97 | % | 11,531 | 10.02 | % | 1,920 | 16.65 | % | |||||||||||||||
|
Sweden
|
9,230 | 6.16 | % | 7,392 | 6.43 | % | 1,838 | 24.86 | % | |||||||||||||||
|
Others
|
29,419 | 19.63 | % | 23,355 | 20.30 | % | 6,064 | 25.96 | % | |||||||||||||||
|
North and South America
|
33,643 | 22.44 | % | 24,480 | 21.28 | % | 9,163 | 37.43 | % | |||||||||||||||
|
U.S.A.
|
23,964 | 15.99 | % | 20,084 | 17.46 | % | 3,880 | 19.32 | % | |||||||||||||||
|
Brazil
|
7,747 | 5.17 | % | 2,667 | 2.32 | % | 5,080 | 190.48 | % | |||||||||||||||
|
Others
|
1,932 | 1.29 | % | 1,729 | 1.50 | % | 203 | 11.74 | % | |||||||||||||||
|
China*
|
35,555 | 23.72 | % | 22,308 | 19.39 | % | 13,247 | 59.38 | % | |||||||||||||||
|
Japan
|
21,402 | 14.28 | % | 18,226 | 15.84 | % | 3,176 | 17.43 | % | |||||||||||||||
|
Others
|
7,196 | 4.80 | % | 7,739 | 6.73 | % | (543 | ) | (7.02 | ) % | ||||||||||||||
|
Total
|
149,896 | 100.00 | % | 115,031 | 100.00 | % | 34,865 | 30.31 | % | |||||||||||||||
|
|
*
|
Sales to the China market include disposable medical dressings sales to hospitals and chain drug stores, as well as PurCotton® jumbo roll supplies and consumer products.
|
Net Sales
Net sales increased by approximately $34,865,000, or 30.31%, to approximately $149,896,000 for the fiscal year ended September 30, 2011 from approximately $115,031,000 for the fiscal year ended September 30, 2010. This increase was mainly attributable to the growing sales from North and South American customers, and stable increased sales in European countries and Japan, as well as increased sales of medical products and PurCotton® products in China.
Net sales to customers in North and South America were approximately $33,643,000 for the year ended September 30, 2011, an increase of 37.43%, compared to approximately $24,480,000 during the same period of 2010. As a percentage of net sales, sales to North and South America were 22.44% in fiscal year 2011, as compared to 21.28% in the same period of last year. Winner Medical has captured additional sales through supplying products directly to developed countries, which want to reduce their production costs by outsourcing labor-intensive and low-value production, and to developing countries. The sales increase is particularly strong in Brazil, an emerging market that is increasing its reliance on imported products due to the Brazilian currency’s appreciation and cheaper import costs as compared to higher domestic production costs caused by increasing labor costs and strict labor protection. The Company will continue to maintain close cooperation with its existing customers, most of which are large and well-known companies, while exploring further opportunities in North and South America.
29
Net sales to Europe grew approximately $9,822,000, or 23.23%, to $52,100,000 for the year ended September 30, 2011, from $42,278,000 for the year ended September 30, 2011. As a percentage of net sales, sales to Europe decreased to 34.76% in fiscal year 2011, as compared to 36.75% in the same period of last year. Orders in Europe increased despite Europe facing debt crisis distress and tightened budgets. Under distressed economic conditions in Europe, the Company believes that producers of medical products prefer to purchase from quality manufacturers in developing countries, such as China, to manage the pressure of high production costs. The Company captured this opportunity to expand its business in the area. Therefore, the Company maintained steady revenue growth from Europe and expects this will continue in the first fiscal quarter of 2012.
Net sales generated from the Japanese market increased 17.43% during the year ended September 30, 2011, to $21,402,000 from $18,226,000 during the year ended September 30, 2010. As a percentage of net sales, sales to Japan were 14.28% in fiscal year 2011, as compared to 15.84% in the same period of last year. In this reporting period, the increase in net sales to Japan was mainly driven by higher selling prices due to the increase in raw material cost and customers increasing their inventory of medical products for demand, especially during and after the earthquake that occurred in mid-March of this year. Modest future growth in the Japanese market is projected to be driven by new customers.
Net sales from the domestic market in China for medical products and PurCotton® products increased by approximately $13,247,000, or 59.38%, to approximately $35,555,000 for the year ended September 30, 2011 from approximately $22,308,000 for the year ended September 30, 2010. As a percentage of net sales, sales in China increased to 23.72% in fiscal year 2011, as compared to 19.39% in the same period last year. This increase is primarily composed of:
|
|
(1)
|
net sales from medical products to the China market having reached $16,457,000, from $12,180,000, for the year ended September 30, 2011, an increase of approximately $4,277,000, or 35.11%, due to the Company’s continuous efforts to broaden and expand its sales channels, including increasing the number of local distributors covering more hospitals and penetrating deeper into existing hospitals, chain drug stores and other channels. As a percentage of net sales, sales of medical products in China were 10.98% in fiscal year 2011, as compared to 10.59% in the same period last year. The Company plans to further enhance its partnership with existing distributors and expand new distributors and chain drug stores;
|
|
|
(2)
|
net sales attributable to the PurCotton® jumbo roll-supply business increasing to $14,119,000 for the year ended September 30, 2011 from $9,261,000 in the same period last year, an increase of $4,858,000, or 52.45%. As a percentage of net sales, sales PurCotton jumbo roll-supply increased to 9.42% in fiscal year 2011, as compared to 8.05% in the same period last year. This significant increase was due to increased demand from China customers who used it as a material in hygiene products and the versatility of jumbo-rolls in areas such as home care and disposable products. With increasing demand from these customers, PurCotton® jumbo roll sales have been steadily growing; and
|
|
|
(3)
|
net sales attributable to the PurCotton® retail business, which is based on online (mainly consisting of online stores in Taobao.com and PurCotton® official website and offline mainly consisting of PurCotton® self-operated chain stores sales channels), increased approximately $4,113,000 to $4,979,000 in this reporting fiscal year, compared to $866,000 in fiscal year 2010. As a percentage of net sales, sales to PurCotton retail business were 3.32% in fiscal year 2011, as compared to 0.75% in the same period of last year. Since the Company opened the first PurCotton® store on December 31, 2009 and initiated online sales channel as of July 2010, these sales channels have been expanding and contributing sales revenue. The Company has been accumulated experience through running its online business and operating more than 40 chain stores located in mid- to high-end shopping malls. At the same time, the PurCotton® consumer products have been receiving positive feedback and gaining brand recognition, as evidenced by an increase in customer membership and the building of broader distribution channels, which is encouraging the Company to broaden its consumer products and expand its distribution channels.
|
Cost of Sales
The Company’s cost of sales increased by $28,573,000, to $109,046,000, for the year ended September 30, 2011, from $80,473,000 for the year ended September 30, 2010. The costs of sales as a percentage of net sales were 72.75% and 69.96% for the years ended September 30, 2011 and 2010, respectively. This increase in the cost of sales as a percentage of net sales was mainly attributable to the increase of average purchase price of cotton for the Company in fiscal year 2011, which is further explained below under the Gross Profit section.
Gross Profit
The Company’s gross profit increased by $6,293,000 to $40,850,000 for the year ended September 30, 2011, from $34,557,000 for the year ended September 30, 2010. Gross profit as a percentage of net revenues was 27.25% for the year ended September 30, 2011, which has decreased compared with 30.04% for the year ended September 30, 2010.
|
|
(1)
|
The decrease in gross margin was mainly due to the higher average purchasing price of cotton, the Company’s primary raw material, during this fiscal year compared with the last fiscal year. Its average after-tax purchasing price increased to approximately RMB23,000 per ton during fiscal year 2011, from RMB14,000 per ton during fiscal year 2010, an increase of approximately 64.28%.
|
30
|
|
(2)
|
The Company has been adjusting its business portfolio by developing and marketing advanced medical products as well as PurCotton® jumbo rolls and consumer products, which are higher gross margin products than traditional medical products, while offering traditional medical products to its international and domestic customers. By doing so, the Company can lower its heavy reliance on traditional medical business and maintain a stable combined gross margin. The Company believes that the PurCotton retail business has been well-received by its target customers. Although the retail business accounts for only a very small portion of the Company’s net sales, it has a much higher margin than that of the medical products portfolio. The Company expects that the PurCotton retail business will play an important role in contributing gross margin in the mid to long run.
|
Other Operating Income, Net
The Company’s other operating income, net, for the year ended September 30, 2011, decreased $553,000 to a net income of $4,000, from a net income of $557,000 for the year ended September 30, 2010. Other operating income, net mainly consists of sales of leftover materials, loss/gain of disposal on property, plant and equipment and the change on fair value of foreign currency contracts. The decrease was mainly due to the loss of disposal on property, plant and equipment.
Government Subsidies
The Company’s government subsidies increased $1,386,000 to $1,594,000 for the year ended September 30, 2011, from $209,000 for the year ended September 30, 2010. The increase was mainly driven by the receipt of greater amounts of financial incentives from PRC government authorities. The Company believes that PRC government authorities, intending to transform certain industries from low-value products to high-tech based production methods, will continue to grant financial incentives to domestic companies and the Company anticipates being qualified for future government subsidies and able to maintain such income going forward.
Realized Loss on Commodity Financial Instruments
Realized loss on commodity financial instruments for the year ended September 30, 2011 was a net loss of approximately $1,860,000 on cotton futures trading, compared to $Nil for the year ended September 30, 2010. This loss mainly stemmed from a net loss of approximately $1,577,000 incurred in the second fiscal quarter ended March 31, 2011.
Cotton is the Company’s primary raw material used in its manufacturing process. As a result of rising demand caused by the global economic recovery and supply shortages due to bad weather, cotton prices have been rapidly increasing and fluctuating since January 2011. Under this rising cost environment, the Company cannot secure stable price quotes from cotton suppliers, resulting in inconsistency in the prices quoted to the Company’s customers. Therefore, the Company, through its wholly-owned subsidiary Winner Industries (Shenzhen) Co., Ltd., “Winner Shenzhen,” has decided to enter into cotton future transactions in order to manage the impact of volatility in cotton prices on production.
During the second fiscal quarter ended March 31, 2011, Winner Shenzhen’s transactions in cotton futures resulted in a net loss of approximately $1,577,000, which was charged to “realized loss on commodity financial instruments” in the condensed consolidated statements of income for the period. The loss was a result of significant increases and fluctuation in cotton prices since January 2011. During this period, based on management’s expectation that cotton prices would experience a downward correction, Winner Shenzhen acquired a short position to hedge against price corrections. However, contrary to management’s expectation, the price increase continued. In order to minimize further losses, management closed its short position, incurring a loss for the period.
In order to shift risk away from the Company during the initial period of cotton futures trading and better protect the interests of the Company’s stockholders, the chief executive officer of the Company, Mr. Jianquan Li, signed agreements with Winner Shenzhen effective January 1, 2011 that expired on September 30, 2011. Under these agreements, Mr. Li agreed that, on September 30, 2011, he will assume all net losses, if any, incurred by Winner Shenzhen from cotton futures trading from January 1, 2011 to September 30, 2011. If, however, there had been a net gain from trading activities, it would have been retained by Winner Shenzhen. More details regarding this undertaking by Mr. Jianquan Li were disclosed in the “Recent Developments” section of the Company’s Quarterly Report on Form 10-Q for the three-month period ended March 31, 2011 as filed with the Securities and Exchange Commission.
On September 30, 2011, the net losses incurred by Winner Shenzhen from cotton futures trading from January 1, 2011 to September 30, 2011 were $1,718,031 (or RMB10,917,915). Accordingly, Mr. Jianquan Li deposited an equivalent amount in cash into Winner Shenzhen’s accounts. This deposit resulted in an increase to the Company’s Cash and an increase in the Company’s Stockholders’ equity, and the cash received was credited as a contribution to Additional Paid-in Capital when it was received. The agreements between Winner Shenzhen and Mr. Jianquan Li expired on September 30, 2011 after this reimbursement for losses realized from cotton futures trading was received.
Foreign Exchange Losses, Net
The Company’s foreign exchange losses, net, for the year ended September 30, 2011, increased $558,000 to a loss of $1,051,000, from a loss of $493,000 for the year ended September 30, 2010. The increase in loss was mainly due to the fact that the Company’s net sales are mainly composed of sales to international customers, the majority of which were settled in U.S. dollars and that the RMB, Chinese currency, has been appreciating against the U.S. dollars in the reporting fiscal year. The closing exchange rates of RMB against U.S. dollar were 6.3549 and 6.7011 for the years ended September 30, 2011 and 2010, respectively, indicating a 5.17% appreciation of the RMB against the U.S. dollar.
31
In order to minimize the currency exchange rate risk, the Company is (1) reinforcing and expanding its businesses in the China market, and (2) inserting clauses in contracts agreeing that the selling price is subject to the fluctuation of currency.
Selling, General and Administrative Expenses
The Company’s selling, general and administrative expenses increased $6,154,000 to $26,525,000 for the year ended September 30, 2011 from $20,371,000 for the year ended September 30, 2010. As a percentage of net revenues, the Company’s selling, general and administrative expenses slightly decreased to 17.70% for the year ended September 30, 2011 from 17.71% for the year ended September 30, 2010. The increase in selling, general and administrative expenses was primarily due to the increase of salary and welfare, leasing expense, advertising and promotion expense, research and development expenses and business operational consultant fees in fiscal year 2011.
|
(1)
|
Salary and welfare increased approximately $3,056,000, or 59.34%, during the year ended September 30, 2011, as compared to the same period last fiscal year. The increase was primarily due to salaries and welfare for sales representatives in the newly opened PurCotton® chain stores and operational and administrative staff responsible for PurCotton® retail business. First, in order for the expansion of retail business, the Company employed many new staff with retail industry experience 339 and 225 for the year ended September 30, 2011 and 2010, respectively; in addition, the average salary and welfare of these staff is much higher than that of ordinary production workforce.
|
|
(2)
|
Leasing expense increased approximately $1,615,000, or 309.20% during the year ended September 30, 2011, as compared with the same period last year. The increase was mainly attributable to the rent paid for existing and newly-established PurCotton® self-operated chain stores. The Company owns 41 PurCotton® self-operated stores on September 30, 2011, compared to 22 on September 30, 2010; and the majority of these stores were established in mid- to high-end shopping mall in first-tier cities in China, bringing to customers the Company’s quality products and services and conveying the philosophy of living a healthy life.
|
|
(3)
|
Advertising and promotion expense increased approximately $294,000, or 144.91%, during the year ended September 30, 2011, as compared with the same period last year. As PurCotton® retail business expanded in fiscal year 2011, due to building brand awareness and online platform promotions, which the Company believes is an essential strategy to maintain existing customers and attract new customers.
|
|
(4)
|
R&D expense increased approximately $221,000, or 12.50%, during the year ended September 30, 2011, as compared with the same period last year. This increase was the result of the Company’s investment in research and development for advanced and sophisticated medical products and PurCotton® retail product lines, which represent the Company’s long term strategy to capitalize on the increasing need for advanced medical dressings and consumer products.
|
|
(5)
|
For the fiscal year ended September 30, 2011, business operational consultant fees and other third party consultant expenses for compliance with SEC electronic filing requirements increased approximately $197,000, as compared to no such expenses for the same period last year.
|
Interest Expenses
Interest expenses decreased to approximately $93,000, 0.06% of net sales, for the year ended September 30, 2011, as compared to approximately $129,000, 0.11% of total revenue, for the same period of 2010, a decrease of approximately $36,000, or 27.91%. The Company capitalized approximately $243,000 of interest expense to property, plant and equipment in fiscal year 2011, while an insignificant amount of interest was capitalized last year. Considering the effect of capitalized interest under interest expenses in fiscal year 2011, interest expense increased, which was mainly due to an increase in the Company’s high average outstanding balance of bank loans during fiscal year 2011 as compared to the previous fiscal year.
Income taxes
The Company’s income tax provision for fiscal year ended September 30, 2011 was $1,970,000 as compared to $1,667,000 for the year ended September 30, 2010 which is an increase of $303,000. Income tax as a percentage of income before income taxes was 14.55% for year ended September 30, 2011, compared with 11.37% for the same period of last year. The comparatively higher income tax as a percentage of income before income taxes in fiscal year 2011 is mainly due to expiration of preferential tax treatment for a subsidiary, Winner Medical & Textile Ltd. Chongyang, on December 31, 2010, at which time that subsidiary’s applicable tax rate increased to 25% from 12.5%.
Effective January 1, 2008, the PRC Enterprise Income Tax Law, EIT Law and Implementing Rules impose a unified enterprise income tax rate of 25% on all domestic-invested enterprises and foreign investment enterprises in China, unless they qualify under certain limited exceptions. The EIT Law gives existing foreign investment enterprises a five-year grandfather period, during which they can continue to enjoy their existing preferential tax treatment. For foreign investment enterprises that currently enjoy full exemption from PRC enterprise income tax for two years starting from the first profit-making year, which is followed by a 50% tax exemption for the next three years, the tax holidays are still valid.
32
The tax rates applicable to the Company’s PRC wholly-owned subsidiaries are as follows:
|
Calendar Year Ending December 31,
|
||||||||||||||||||||
|
2011
|
2012
|
2013
|
2014
|
2015
|
||||||||||||||||
|
Winner Medical & Textile Ltd., Jingmen
|
25 | % | 25 | % | 25 | % | 25 | % | 25 | % | ||||||||||
|
Winner Medical & Textile Ltd. Jiayu
|
25 | % | 25 | % | 25 | % | 25 | % | 25 | % | ||||||||||
|
Winner Medical & Textile Ltd. Yichang
|
25 | % | 25 | % | 25 | % | 25 | % | 25 | % | ||||||||||
|
Winner Medical (Huanggang) Co., Ltd.
|
12.5 | % | 12.5 | % | 25 | % | 25 | % | 25 | % | ||||||||||
|
Winner Medical & Textile Ltd. Chongyang
|
25 | % | 25 | % | 25 | % | 25 | % | 25 | % | ||||||||||
|
Hubei Winner Textile Co., Ltd.
|
25 | % | 25 | % | 25 | % | 25 | % | 25 | % | ||||||||||
|
Shanghai Winner Medical Apparatus Co., Ltd.
|
12.5 | % | 25 | % | 25 | % | 25 | % | 25 | % | ||||||||||
|
Winner Industries (Shenzhen) Co., Ltd.*
|
15 | % | 25 | % | 25 | % | 25 | % | 25 | % | ||||||||||
|
Shenzhen PurCotton Technology Co., Ltd.
|
25 | % | 25 | % | 25 | % | 25 | % | 25 | % | ||||||||||
|
Huanggang Winner Cotton Co., Ltd.
|
25 | % | 25 | % | 25 | % | 25 | % | 25 | % | ||||||||||
|
Beijing PurCotton Co., Ltd.
|
25 | % | 25 | % | 25 | % | 25 | % | 25 | % | ||||||||||
|
Guangzhou PurCotton Co., Ltd.
|
25 | % | 25 | % | 25 | % | 25 | % | 25 | % | ||||||||||
|
Shanghai PurCotton Co., Ltd.
|
25 | % | 25 | % | 25 | % | 25 | % | 25 | % | ||||||||||
|
Winner (Huanggang) Cotton Processing Co., Ltd.
|
25 | % | 25 | % | 25 | % | 25 | % | 25 | % | ||||||||||
|
|
*
|
For years 2012, 2013, 2014 and 2015, the preferential tax rate of 15% will be subject to whether Winner Industries (Shenzhen) Co., Ltd. can successfully renew the High and New Technology Enterprise Certificate which was awarded in 2009.
|
HK PurCotton Co. Ltd, Shenzhen PurCotton’s wholly-owned subsidiary, was incorporated in January 2011, and its applicable statutory tax rate for the year ended September 30, 2011 was 16.5%.
Winner Medical (Hong Kong) Limited was incorporated in January 2008, and its applicable statutory tax rate for each of the years ended September 30, 2011 and 2010 was 16.5%.
No provision for U.S. tax was made as the Company had no assessable income in the U.S. for the years ended September 30, 2011 and 2010. The enterprise income tax rate in the U.S. was 34%.
On November 9, 2011, a 70% owned subsidiary, Shenzhen PurCotton E-Commerce Co., Ltd. (“Shenzhen E-Commerce”) was established. The applicable income tax rate for Shenzhen E-Commerce is 25% for the calendar year ending December 31, 2011.
Non-controlling interests
The Company’s financial statements reflect an adjustment to its consolidated net income equal to net income attributable to non-controlling interests of $40,000 and loss of $93,000 in the fiscal years 2011 and 2010, respectively. In fiscal year 2011, the non-controlling interests reflect third party non-controlling interests of 40% in Winner Medical (Hong Kong) Limited, and in fiscal year 2010, it reflects third party non-controlling interests of 40% in Winner Medical (Hong Kong) Limited for the whole fiscal year and 40% in Shanghai Winner Medical Apparatus Co., Ltd until September 13, 2010, when that interest was purchased by the Company’s wholly-owned subsidiary, Winner Industries (Shenzhen) Co., Ltd.
Net income attributable to Winner Medical Group Inc.
The net income attributable to Winner Medical Group Inc. decreased to approximately $11,536,000 for the year ended September 30, 2011, as compared to approximately $13,090,000 for the same period of 2010, a decrease of approximately $1,554,000 or approximately 11.87%. Net income as a percentage of sales revenue was 7.70% for the year ended September 30, 2011, compared with 11.38% for the same period of last year. The decreased net income and net margin were due to the net loss on the PurCotton® retail business and the realized loss on cotton futures trading during fiscal year 2011.
The after-tax net loss on the PurCotton® retail business reached to $2,518,000 for the year ended September 30, 2011, compared with $594,000 for the year ended September 30, 2010. The increased net loss was due to the start-up costs in the PurCotton® retail segment for expanding distribution channel and raising brand awareness in the initial development of the Company’s retail business. The Company regards such investment to the retail segment as necessary and it is paving the way for a long-term growth. The Company intends to emphasize on establishing PurCotton® self-operated stores to provide its customers with quality products and services, introducing products via distributors and improving online shopping experience, so that the PurCotton® brand will gain in recognition, leading to improved net profits.
The realized loss on commodity financial instruments in fiscal year 2011 was $1,860,000, of which $1,577,000 was generated in the second fiscal quarter ended March 31, 2011.
Foreign Currency Translation Adjustments
The foreign currency translation adjustments were $5,867,000 and $1,584,000 in the years ended September 30, 2011 and 2010, respectively. The Company implemented different exchange rates in translating RMB into U.S. dollar in its financial statements for the years ended September 30, 2011 and 2010. The exchange rates between the RMB and the U.S. dollar and used for the years ended September 30, 2011 and 2010 were RMB6.3549 and RMB6.7011, respectively. The exchange rates between the Hong Kong dollar and the U.S. dollar used for the years ended September 30, 2011 and 2010 were HK$7.7937 and HK$7.7605, respectively. Translation adjustments arising from the use of different exchange rates from period to period are included as a component of stockholders’ equity as “Accumulated other comprehensive income.” Gain and losses resulting from foreign currency translations are included in other comprehensive income.
33
Inventory Turnover
The Company’s inventory increased to approximately $25,409,000 as of September 30, 2011, as compared with approximately $15,945,000 as of September 30, 2010, an increase of approximately $9,464,000, or 59.35%. Raw materials, work-in-progress and finished goods accounted for 42.71 %, 27.89 % and 29.40% of inventory in fiscal year 2011, and 31.40 %, 31.13 % and 37.47% in fiscal year 2010, respectively. The Company’s inventory turnover was 4.72 and 5.06 times for the year ended September 30, 2011 and 2010, respectively.
The increased inventory with a lower turnover in fiscal year 2011 was mainly attributable to: (1) the Company expanded its integrated upstream supply chain to reach cotton processing and broadening its downstream distribution channels to retail compared to the last fiscal year; (2) the Company decided to increase raw material inventory of relatively high quality cotton (at a higher average purchasing price than in the last fiscal year) to hedge against potential future price inflation and continue to meet customers’ demands; and (3) an increase in the consumption of raw materials due to growing customer demand, which requires the Company to maintain a higher level of inventory to meet orders.
Accounts Receivable Collection Period
Accounts and notes receivable increased to approximately $20,982,000 as of September 30, 2011, compared to approximately $15,672,000 as of September 30, 2010, an increase of approximately $5,310,000, or 33.88%. The Company’s average accounts receivable collection period was 44.10 days and 44.23 days for the year ended September 30, 2011 and 2010, respectively. This increase in the balance of accounts and notes receivable was largely due to the higher net sales toward year end of fiscal year 2011 than fiscal year 2010.
The Company has implemented SAP system for improving business efficiency, with which the Company can have in-depth evaluation and assessment of accounts receivable. Based on such evaluation and assessment, the Company can determine an effective and efficient way to collect its balance of accounts receivable. Furthermore, the Company’s net sales consists mainly of international sales, which were settled with Letters of Credit (L/C) secured by intermediary banks. The 98% of accounts receivable as of September 30, 2011 was aged less than or equal to three months.
In addition, in order to reduce losses on bad debts, the Company entered into an insurance policy with China Export & Credit Insurance Corporation effective on January 1, 2011. This insurance policy will expire on December 31, 2011 and is automatically renewed subject to a one month written notice given by either party. The maximum insurance coverage from China Export & Credit Insurance Corporation is $2 million.
The accounts and notes receivable collection age as of September 30, 2011 and 2010 is illustrated as follows:
(All amounts, other than percentages, in thousands of $)
|
Periods
|
Amount
in Thousands
September 30,
2011
|
As a
Percentage
September 30,
2011
|
Amount
In Thousands
September
30, 2010
|
As a
Percentage
September
30, 2010
|
||||||||||||
|
Less than or equal to 3 months
|
$ | 20,698 | 98.65 | % | $ | 15,496 | 98.98 | % | ||||||||
|
|
||||||||||||||||
|
3 to 6 months
|
$ | 227 | 1.09 | % | $ | 130 | 0.83 | % | ||||||||
|
|
||||||||||||||||
|
6 to 12 months
|
$ | 44 | 0.21 | % | $ | 23 | 0.15 | % | ||||||||
|
|
||||||||||||||||
|
1 to 3 years
|
$ | 13 | 0.06 | % | $ | 23 | 0.15 | % | ||||||||
|
|
||||||||||||||||
|
Total
|
$ | 20,982 | 100.00 | % | $ | 15,672 | 100.00 | % | ||||||||
Liquidity and Capital Resources
As of September 30, 2011, the Company had cash and cash equivalents of approximately $21,945,000.
34
Cash Flow
(in Thousands of $)
|
Years Ended
September 30,
|
||||||||
|
2011
|
2010
|
|||||||
|
|
|
|
|
|
|
|
||
|
Net cash provided by operating activities
|
$
|
4,982
|
|
$
|
12,654
|
|
||
|
Net cash used in investing activities
|
|
|
(6,911
|
)
|
|
|
(9,401
|
)
|
|
Net cash provided by financing activities
|
|
|
7,958
|
|
|
1,963
|
||
|
Effect of exchange rate changes
|
|
|
1,098
|
|
|
110
|
|
|
|
Net increase in cash and cash equivalents
|
|
|
7,127
|
|
|
5,325
|
|
|
|
Cash and cash equivalents at the beginning of year
|
|
|
14,818
|
|
|
9,493
|
|
|
|
Cash and cash equivalents at the end of year
|
|
|
21,945
|
|
|
14,818
|
|
|
Operating Activities
Net cash provided by operating activities was $4,982,000 for the year ended September 30, 2011, a decrease of $7,672,000 from the $12,654,000 net cash provided by operating activities for the same period in 2010. Overall, this decrease was mainly due to the following:
|
|
·
|
The cash flow used by inventories, which was approximately $8,595,000 for the year ended September 30, 2011, compared to $727,000 for the year ended September 30, 2010, indicating an increase of $7,868,000. Specifically, the larger amount of inventories in fiscal year 2011 compared with fiscal year 2010 was mainly caused by an increased need for quality cotton due to increased sales. In addition, the price of this quality cotton was much higher due to shortage in fiscal year 2011 compared with fiscal year 2010, raising the Company’s average purchase price of cotton and leading to a rapid increase in the cost of cotton.
|
|
|
·
|
The operating cash flow used by accounts and notes receivable increased approximately $2,183,000 during the fiscal year ended September 30, 2011, to $4,456,000 from $2,273,000 during fiscal year 2010. This increase was due to the fact that the Company experienced a 33.58% increase in accounts and notes receivable during fiscal year 2011 driven by robust sales, to $20,982,000, from approximately $15,672,000 as of September 30, 2010.
|
|
|
·
|
On the other hand, operating cash flow used to settle accounts payable decreased $1,340,000 to $1,766,000 in fiscal year 2011, from $426,000 in fiscal year 2010. This increase in accounts payable was mainly due to the increase of inventory purchased by credits. In addition, the operating cash used by prepaid expenses and other receivables decreased $1,719,000 to $1,133,000 in fiscal year 2011, compared with an increase of $2,852,000 in fiscal year 2010, resulting in comparatively less cash used in operating activities.
|
Investing Activities
Net cash used in investing activities for the year ended September 30, 2011 was $6,911,000, a decrease of $2,490,000 from net cash used in investing activities of $9,401,000 in the same period of 2010. This decrease was mainly due to the net proceeds of $1,631,000 from disposal of held-to-maturity investments in fiscal 2011, compared with the net purchase of $1,455,000 for the held-to-maturity investments in fiscal 2010. The Company’s held-to-maturity investment securities were money management, products all of which had matured by the year ended September 30, 2011. In addition, the Company acquired equipment for Winner (Huanggang) Cotton Processing Co., Ltd and Winner Medical (Huanggang) Co., Ltd in order to improve their production facilities. The cash flows used in purchasing of property, plant and equipment in fiscal years 2011 and 2010 were $6,796,000 and $6,344,000, respectively.
Financing Activities
Net cash provided by financing activities for the year ended September 30, 2011 totaled $7,958,000, an increase of $5,995,000 from net cash used in financing activities of $1,963,000 in the same period of 2010. Such an increase was due to the proceeds from short-term bank borrowings. The balance of short-term bank borrowings were $6,294,000 and $Nil as of September 30, 2011 and 2010, respectively. The Company’s short-term bank borrowings are primarily used as a supplement to working capital for daily operations and capital expenditures. On September 30, 2011, Mr. Juanquan Li, the chief executive officer of Winner Medical, reimbursed the net losses of $1,718,000 incurred by Winner Shenzhen’s transactions in cotton futures trading activities from January 1, 2011 to September 30, 2011.
The Company believes that it currently maintains a good business relationship with each of the banks with whom it has loans. As of September 30, 2011, the Company had approximately $3,148,000 of outstanding bank loans with China Merchants Bank and $3,147,000 with Industrial and Commercial Bank of China. The usage of these bank loans is not limited by any means, and the Company usually uses these loans to supplement working capital for daily operations.
The weighted average balance during fiscal year ended September 30, 2011 was RMB37,322,000 (or $5,725,000), compared with RMB18,611,000(or $2,855,000) during the last fiscal year. The weighted average interest rate on short-term borrowings for the fiscal year ended September 30, 2011 and 2010 were 5.38% and 4.28% per annum, respectively. The Company prefers bank funding for its capital needs due to the comparatively higher cost of raising funds from the equity markets.
The Company repays short-term bank borrowing with interest when due, establishing strong credit records with banks. The Company’s debt to asset ratio was approximately 16.17% as of September 30, 2011. The Company plans to maintain a debt to asset ratio of less than 40% in order to provide adequate space for new bank loans if needed. The interest coverage, the ratio between earnings before interest and tax and interest expense, is 146x and 115x for fiscal years 2011 and 2010, respectively.
The Company’s subsidiary in Shenzhen has credit lines with the Shenzhen Branch of China Merchants Bank and the Shenzhen Branch of the Industrial and Commercial Bank of China, representing trade acceptances, letter of credit, loans and overdrafts.
35
|
Balance as of
September 30, 2011
|
||||||||
|
Item
|
Bank
|
Loan period
|
US$
|
|||||
|
A
|
Shenzhen Branch of Industrial and Commercial Bank of China
|
04-01-2010 to
03-02-2012
|
3,147,000 | |||||
|
B
|
Shenzhen Branch of China Merchants Bank
|
09-13-2011 to
03-13-2012
|
1,574,000 | |||||
|
C
|
Shenzhen Branch of China Merchants Bank
|
09-13-2011 to
09-13-2012
|
1,574,000 | |||||
|
Total
|
6,295,000 | |||||||
As of September 30, 2011, the Company had approximately $25.18 million bank credit facilities available from two commercial banks. After utilizing bank loans of $6.29 million, there are $18.89 million unused bank credit facilities, consisting of approximately $9.44 million from Shenzhen Branch of China Merchants Bank and approximately $9.44 million from Shenzhen Branch of the Industrial and Commercial Bank of China. These loan facilities are all secured by the Company’s buildings. These revolving lines of credit allow the Company to renew short-term loans when due, and the banks re-evaluate the Company’s credit line annually. These bank credits enable the Company to utilize the short-term loans and enjoy a lower interest expense compared with long-term loans.
The Company believes that its currently available working capital, after taking into account the credit facilities referred to above, short-term loans and future cash provided by operating activities, will be sufficient to meet operational needs and capital expenditure needs over the next twelve months. The Company’s future capital requirements will depend on many factors, including its organic sales growth rate and the timing and extent of its business expansion, including marketing, research and development, products and services introduction.
The preparation of financial statements in conformity with the generally accepted accounting principles of the United States requires the Company’s management to make assumptions, estimates and judgments that affect the amounts reported in the financial statements, including the notes thereto, and related disclosures of commitments and contingencies, if any. The Company considers its critical accounting policies to be those that require the more significant judgments and estimates in the preparation of financial statements, including the following:
|
|
¨
|
Revenue Recognition –The Company derives its revenue primarily from the sales of medical dressings and disposals and PurCotton® products. Sales of goods are recognized when title of goods sold has passed to the purchaser, usually when goods are shipped, the price is fixed or determinable as stated on the sales contract, and its collectability is reasonably assured. Customers do not have a general right of return on products shipped. Products returns to the Company were insignificant during past years.
|
|
|
¨
|
Inventories –Inventories are stated at the lower of cost or market, determined by the weighted average method. Work-in-progress and finished goods consist of raw materials, direct labor and overhead associated with the manufacturing process.
|
|
|
¨
|
Trade accounts receivable –Trade accounts receivable are stated at the amount management expects to collect from balances outstanding at year-end. Based on management’s assessment of the credit history with customers having outstanding balances and current relationships with them, it has concluded that realization losses on balances outstanding at year-end will be immaterial. Allowances for doubtful accounts receivable balances are recorded when circumstances indicate that collection is doubtful for particular accounts receivable. Management estimates such allowances based on historical evidence such as amounts that are subject to risk. Accounts receivable are written off if reasonable collection efforts are not successful.
|
|
|
¨
|
Property, plant and equipment –Property, plant and equipment are stated at cost including the cost of improvements. Maintenance and repairs are charged to expense as incurred. Depreciable amounts are net of expected residual value of assets. Depreciation and amortization are provided on the straight-line method based on the estimated useful lives of the assets as follows:
|
|
Over the lease term
|
|||
|
Buildings
|
10 - 30 years
|
||
|
Plant and machinery
|
10 - 12 years
|
||
|
Furniture, fixtures and equipment
|
5 - 8 years
|
||
|
Motor vehicles
|
5 - 8 years
|
||
|
Leasehold improvements
|
Over the lease term
|
|
|
¨
|
Valuation of long-lived assets –The Company periodically evaluates the carrying value of long-lived assets to be held and used, including intangible assets subject to amortization, when events and circumstances warrant such a review. The carrying value of a long-lived asset is considered impaired when the anticipated undiscounted cash flow from such asset is separately identifiable and is less than its carrying value. In that event, a loss is recognized based on the amount by which the carrying value exceeds the fair market value of the long-lived asset. Fair market value is determined primarily using the anticipated cash flows discounted at a rate commensurate with the risk involved. Losses on long-lived assets to be disposed of are determined in a similar manner, except that fair market values are reduced for the cost to dispose.
|
36
|
|
¨
|
Derivatives – The Company does not use derivative for speculative purpose, nor does it hold or issue leveraged derivative. However, the Company’s operations are exposed to market risk primarily due to changes in currency exchange rates. In order to manage such risks so as to reduce volatility on earnings and cash flows, the Company enters into several foreign exchange forward contracts with a commercial bank to hedge for future trade receipts in U.S. dollars against RMB. The Company’s foreign exchange forward contracts are classified as Level 2 in the fair value hierarchy under ASC 820 since the quote prices of these foreign exchange forward contracts can be obtained directly from commercial bank. The Company uses commodity financial instruments to manage the risk of cotton purchase cost. Although the commodity financial instruments are economic hedges of specified risks, the Company has not designated or accounted for them as hedging instruments. The Company’s commodity financial instruments are classified as Level 1 in the fair value hierarchy under ASC 820 since the quoted unadjusted prices of these commodity financial instruments are available in active markets.
|
|
|
¨
|
Income taxes –Income taxes are provided on an asset and liability approach for financial accounting and reporting of income taxes. Any tax paid by subsidiaries during the year is recorded. Current tax is based on the profit or loss from ordinary activities adjusted for items that are non-assessable or disallowable for income tax purpose and is calculated using tax rates that have been enacted or substantively enacted at the balance sheet date. Deferred income tax liabilities or assets are recorded to reflect the tax consequences in future years of differences between the tax basis of assets and liabilities and the financial reporting amounts at each year-end. A valuation allowance is recognized if it is more likely than not that some portion, or all, of a deferred tax asset will not be realized.
|
In January 2010, the FASB issued ASU No. 2010-06, Fair Value Measurements and Disclosures (ASC 820) Improving Disclosures about Fair Value Measurements (“ASU No. 2010-06”). This pronouncement is an authoritative guidance to improve disclosures about fair value measurements. This guidance amends previous guidance on fair value measurements to add new requirements for disclosures about transfers into and out of Levels 1 and 2 and separate disclosures about purchases, sales, issuances, and settlements relating to Level 3 measurement on a gross basis rather than on a net basis as currently required. This guidance also clarifies existing fair value disclosures about the level of disaggregation and about inputs and valuation techniques used to measure fair value. ASU No. 2010-06 is effective for interim and annual reporting periods beginning after December 15, 2009, except for the disclosures about purchases, sales, issuances, and settlements in the roll forward of activity in Level 3 fair value measurements. Those disclosures are effective for fiscal years beginning after December 15, 2010, and for interim periods within those fiscal years. The Company has not completed its assessment of the impact, if any, that the disclosures of activity within Level 3 fair value measurements will have on its financial statements.
In May 2011, the FASB issued ASU No. 2011-04, Fair Value Measurement (ASC 820) Amendments to Achieve Common Fair Value Measurement and Disclosure Requirements in U.S. GAAP and IFRSs. This pronouncement is an authoritative guidance to amend certain measurement and disclosure requirements related to fair value measurements to improve consistency with international reporting standards. This guidance is effective prospectively for public entities for interim and annual reporting periods beginning after December 15, 2011, with early adoption by public entities prohibited, and is applicable to the Company’s fiscal year beginning October 1, 2012. The Company is currently evaluating this guidance, but does not expect its adoption will have a material effect on its consolidated financial statements.
In June 2011, the FASB issued ASU No. 2011-05, Comprehensive Income (ASC 220) Presentation of Comprehensive Income (“ASU No. 2011-05”). This pronouncement is an authoritative guidance on the presentation of comprehensive income that will require a company to present components of net income and other comprehensive income in one continuous statement or in two separate, but consecutive statements. There are no changes to the components that are recognized in net income or other comprehensive income under current GAAP. This guidance is effective for fiscal years, and interim periods within those fiscal years, beginning after December 15, 2011, with early adoption permitted. The Company has adopted of ASU No. 2011-05.
Off-Balance Sheet Arrangements
The Company has no off-balance sheet arrangements.
Seasonality
The Company’s operating results and operating cash flows historically have not been subject to seasonal variations. This pattern may change, however, as a result of new market opportunities or new product introductions.
Item 7A. Quantitative and Qualitative Disclosures about Market Risk.
Not applicable.
37
Item 8. Financial Statements and Supplementary Data.
|
(a)
|
The financial statements required by this item begin on page F-1 hereof.
|
|
(b)
|
Selected quarterly financial data for the past two fiscal years appears in the following table:
|
|
Quarterly Results of Operations (Unaudited)
|
|||||||||||||||||||||||||
|
Quarter Ended
|
|||||||||||||||||||||||||
|
12/31/2010
|
12/31/2009
|
3/31/2011
|
3/31/2010
|
6/30/2011
|
6/30/2010
|
9/30/2011
|
9/30/2010
|
||||||||||||||||||
|
Net sales
|
$ | 33,706,318 | $ | 29,786,805 | $ | 33,218,003 | $ | 26,074,927 | $ | 41,536,465 | $ | 30,926,912 | $ | 41,435,638 | $ | 28,242,007 | |||||||||
|
Gross profit
|
9,481,011 | 9,431,847 | 9,352,208 | 7,356,185 | 11,308,609 | 8,932,961 | 10,708,312 | 8,836,366 | |||||||||||||||||
|
Income from operations
|
3,643,945 | 4,524,211 | 2,539,937 | 3,209,081 | 3,896,532 | 3,648,042 | 2,931,551 | 3,077,925 | |||||||||||||||||
|
Net income attributable to Winner Medical Group Inc.
|
3,328,244 | 3,920,712 | 2,235,937 | 2,676,538 | 3,424,525 | 3,373,937 | 2,547,185 | 3,119,311 | |||||||||||||||||
|
Earnings per share –basic
|
$ | 0.14 | $ | 0.18 | $ | 0.09 | $ | 0.12 | $ | 0.14 | $ | 0.14 | $ | 0.11 | $ | 0.13 | |||||||||
|
- diluted
|
$ | 0.14 | $ | 0.17 | $ | 0.09 | $ | 0.12 | $ | 0.14 | $ | 0.14 | $ | 0.10 | $ | 0.13 | |||||||||
None.
Item 9A. Controls and Procedures.
(A) Disclosure Controls and Procedures
As required by Rule 13a-15(e) and 15d-15(e) under the Securities Exchange Act, the Company’s management has carried out an evaluation, with the participation and under the supervision of its Chief Executive Officer and Chief Financial Officer, of the effectiveness of the design and operation of its disclosure controls and procedures as of September 30, 2011. Disclosure controls and procedures refer to controls and other procedures designed to ensure that information required to be disclosed in the reports the Company files or submits under the Securities Exchange Act is recorded, processed, summarized and reported within the time periods specified in the rules and forms of the SEC and that such information is accumulated and communicated to the Company’s management, including its chief executive officer and chief financial officer, as appropriate, to allow timely decisions regarding required disclosure. In designing and evaluating the Company’s disclosure controls and procedures, management recognizes that any controls and procedures, no matter how well designed and operated, can provide only reasonable assurance of achieving the desired control objectives, and management is required to apply its judgment in evaluating and implementing possible controls and procedures.
The Company’s disclosure controls and procedures are designed to provide reasonable, not absolute, assurance that the objectives of its disclosure control system are met. Because of inherent limitations in all control systems, no evaluation of controls can provide absolute assurance that all control issues, if any, within a company have been detected.
Management conducted its evaluation of disclosure controls and procedures under the supervision of its Chief Executive Officer and the Company’s Chief Financial Officer. Based upon, and as of the date of, this evaluation, the Company’s Chief Executive Officer and Chief Financial Officer concluded that the Company’s disclosure controls and procedures were effective.
(B) Management's Report on Internal Control over Financial Reporting
The Company’s management is responsible for establishing and maintaining adequate internal control over financial reporting as defined in Rules 13a-15(f) and 15d-15(f) under the Securities Exchange Act.
The Company’s management has assessed the effectiveness of its internal control over financial reporting as of September 30, 2011. In making its assessment, management used the criteria described in Internal Control - Integrated Framework, issued by the Committee of Sponsoring Organizations of the Treadway Commission, or COSO. The Company’s management assessment is that, as of September 30, 2011, the Company’s internal control over financial reporting was effective.
Because of its inherent limitations, internal control over financial reporting may not prevent or detect misstatements. Also, projections of any evaluation of effectiveness to future periods are subject to the risk that controls may become inadequate because of changes in conditions, or that the degree of compliance with the policies and procedures may deteriorate.
This annual report on Form 10-K does not include an attestation report of the Company’s independent registered public accounting firm regarding management's assessment of the Company’s internal control over financial reporting. Management's report was not subject to audit by its independent registered public accounting firm pursuant to rules of the Securities and Exchange Commission that permit the Company to provide only management’s report in this annual report.
(C) Changes in Internal Control over Financial Reporting
There have been no changes in the Company’s internal control over financial reporting during the fourth quarter of the fiscal year ended September 30, 2011 that have materially affected, or are reasonably likely to materially affect, its internal control over financial reporting.
38
Item 9B. Other Information.
None.
39
PART III
Item 10. Directors, Executive Officers and Corporate Governance.
The following sets forth the name and position of each of the Company’s current executive officers and directors.
|
Name
|
Age
|
Position
|
||
|
Jianquan Li
|
56
|
Chief Executive Officer and President, and Chairman of the Board of Directors
|
||
|
Xiuyuan Fang
|
43
|
Chief Financial Officer, Vice President, Treasurer and Director
|
||
|
Larry Goldman
|
55
|
Director
|
||
|
Lawrence Xiaoxia Pan
|
50
|
Director
|
||
|
Dr. Horngjon Shieh*
|
51
|
Director
|
||
|
Xuedong Wu
|
46
|
Director
|
||
|
Nianfu Huo
|
59
|
Senior Vice President and Chairman of Supervisory Board of Winner Group Limited
|
*Notes: On May 20, 2011, the Board of the Company received a resignation letter from Dr. Horngjon Shieh, who was a member of the Audit Committee and the Governance and Nominating Committee and Chairman of the Compensation Committee of the Company. On the same day, the Board appointed Mr. Xuedong Wu as a director of the Company to replace Dr. Horngjon Shieh, serving a member of the Audit Committee and the Governance and Nominating Committee of the Company and Chairman of the Compensation Committee.
The following is a summary of the biographical information of our directors and officers.
JIANQUAN LI. Mr. Li has served as the Company’s Chief Executive Officer, President and director since December 16, 2005. Mr. Li is the founder of Winner Group Limited, a Cayman Island registered company without substantial business operations and has served as its Chairman and CEO since its subsidiary companies’ formation in 1991. Mr. Li has more than 30 years experience in medical dressing industry. Mr. Li is a graduate of the Hubei Foreign Trade University with a major in International Trade.
As Chairman and CEO, Mr. Li oversees the implementation of the business plan of Winner Medical. The Board of Directors believes Mr. Li’s vision, leadership and extensive knowledge of the Company is essential to the development of its strategic vision.
XIUYUAN FANG. Mr. Fang has been the Company’s Chief Financial Officer, Vice President and Treasurer since December 16, 2005 and its director since January 7, 2006. Mr. Fang has been employed by Winner Group Limited since 1999. Mr. Fang has served as Winner Group Limited’s director since 1999 and as a Vice President since 2001. Mr. Fang is a certified public accountant and has extensive experience in financial management, capital management and tax planning. He was responsible for Winner Group Limited’s financial management and capital management programs. He graduated from Zhongnan University of Economics and Law. Mr. Fang is a CPA licensed through the Chinese Institute of Certified Public Accountants and has over 20 years of financial management, internal control and accounting management experience.
LARRY GOLDMAN . Mr. Larry Goldman became a member of the Board of Directors on May 8, 2006. Mr. Goldman is a Certified Public Accountant, with over 30 years of auditing, consulting and technical SEC reporting experience. Mr. Goldman served from May 2006 to October 2007, as Acting CFO, and currently as a financial consultant, for Lightbridge Corporation (Nasdaq: LTBR), a nuclear fuels development company. Prior to joining Lightbridge Corporation, Mr. Goldman served as the CFO and VP of Finance for WinWin Gaming, Inc. (OTCBB: WNWN), a multi-media developer and publisher of sports, lottery and other games. Prior to joining WinWin in October 2004, Mr. Goldman was a partner at Livingston Wachtell & Co., LLP and had been with that firm for the previous 19 years. Mr. Goldman is also an independent director of Wonder Auto Tech, Inc. (PK: WATG), a manufacturer of automotive parts, suspension products and engine accessories in China. Mr. Goldman has extensive experience in both auditing and consulting with Chinese public companies, working in the Asian marketplace since 2000, and he frequently travels to China. He currently provides various CFO consulting and SEC reporting support to a number of other Chinese companies listed in the United States. Mr. Goldman holds a Bachelor of Science degree in Accounting from the State University of New York at Oswego and a Master of Science degree in Taxation from Pace University.
LAWRENCE XIAOXIA PAN. Mr. Lawrence Xiaoxia Pan serves as the Company’s director since January 14, 2010. Mr. Pan is the Founding Partner of China SageWater Capital Partners. Mr. Pan has invested in and advised Chinese companies specializing in traditional industries of mass consumption, retail, healthcare, high-end manufacturing and mining. He is also the former China Chief Representative and Director of Asia Pacific Region of NASDAQ from 2004 until 2007. Mr. Pan has previously held senior positions in corporate finance and asset management at Morgan Stanley, providing advice to a variety of Chinese companies and banks seeking to access the US capital markets. Mr. Pan has a B.S. and M.S. in Materials Science from Beijing Institute of Science an EMBA in International Business from University of London and a Certificate in Financial Analysis from New York University. The Board believes Mr. Pan’s strong experience in operations and U.S. capital market experience is important to the Company’s business operations, risk assessment and capital market decisions.
40
XUEDONG WU. Mr. Wu is the Vice President of BMI Funds Management Ltd., a financial advisory company based in Hong Kong, and was the chief consultant to FLYKE International Holdings Ltd. (HK Ticker: 1998) prior to joining the Company. Previously, Mr. Wu served as an executive director for Shenzhen Corppal Consultants Co., Ltd., which specialized in advising companies on overseas listings and mergers and acquisitions. Mr. Wu also has experience in the e-commerce and retail space, has served with an internet educational resource provider and with Shenzhen Space Financial Tech Co., Ltd. and CATIC Computer Co., Ltd., both software development companies.
NIANFU HUO. Mr. Huo has been Senior Vice President of Winner Group Limited, a Cayman Island registered company without substantial operations since April 8, 2003 and has served as Chairman of the Supervisory Board of Winner Group Limited since April, 2008. He is responsible for the strategic planning as well as formulating and monitoring policies and operating objectives of the Company. Mr. Huo also is involved in the decision making process of establishing all of the Company’s subsidiaries in Hubei, Shanghai, Shenzhen and Zhuhai. Mr. Huo joined Winner Zhuhai in 1991. He graduated from Beijing International Studies University.
There are no agreements or understandings for any of the Company’s executive officers or directors to resign at the request of another person and no officer or director is acting on behalf of nor will any of them act at the direction of any other person.
Directors are elected until their successors are duly elected and qualified.
Board Composition and Committees
The board of directors is currently composed of five members, Jianquan Li, Xiuyuan Fang, Larry Goldman, Lawrence Xiaoxia Pan and Xuedong Wu. All Board action requires the approval of a majority of the directors in attendance at a meeting at which a quorum is present.
Committees of the Company’s Board of Directors
Audit Committee. On May 9, 2006, the Company’s board of directors formed an audit committee, which is chaired by Mr. Goldman, who is determined to be an independent board member and qualifies as the audit committee financial expert. Mr. Pan and Mr. Wu (Mr. Wu having replaced Dr. Shieh since May 20, 2011) also serve on the audit committee. The audit committee reviews and monitors the Company’s internal controls, financial reports and accounting practices, as well as the scope and extent of the audits performed by both the independent and internal auditors, reviews the nature and scope of the Company’s internal audit program and the results of internal audits, and meets with the independent auditors.
Compensation Committee. On May 9, 2006, the Company’s board of directors formed a compensation committee, which is chaired by Mr. Wu. Mr. Wu has replaced Dr. Shieh since May 20, 2011. Mr. Goldman and Mr. Pan also serve on the compensation committee. The compensation committee oversees the Company’s compensation and employee benefit plans and practices and produces a report on executive compensation. The Board has determined that all members of the compensation committee are independent directors under the rules of the Nasdaq Stock Market, as applicable. The compensation committee administers the Company’s benefit plans, reviews and administers all compensation arrangements for executive officers, and establishes and reviews general policies relating to the compensation and benefits of our officers and employees. The compensation committee operates under a written charter that is made available on the Company’s website, www.winnermedical.com.
Governance and Nominating Committee. On May 9, 2006, the Company’s board of directors formed a governance and nominating committee, which is chaired by Mr. Pan, Mr. Goldman and Mr. Wu, who has replaced Dr. Shieh since May 20, 2011,also serve on the governance and nominating committee. The primary purpose of governance and nominating committee is to identify and to recommend to the board individuals qualified to serve as directors of the Company and on committees of the board, advise the board with respect to the board composition, procedures and committees, develop and recommend to the board a set of corporate governance principles and guidelines applicable to the Company; and oversee the evaluation of the board and the Company’s management.
Other Committees. The Company’s board of directors may on occasion establish other committees, as it deems necessary or advisable.
Compensation Committee Interlocks and Insider Participation
No executive officer of the Company served as a member of the compensation committee, or the equivalent, of another entity during fiscal year 2009, 2010 or 2011. No executive officer of the Company served as a director of another entity, other than affiliates of the Company, during fiscal year 2009, 2010 and 2011.
Independent Directors
The Company’s board of directors has determined that each of Messrs. Goldman, Pan and Wu qualify as an “independent director” within the meaning of that term under the rules and regulations of the NASDAQ Global Market.
Family Relationships
There are no family relationships among the Company’s directors or officers.
41
Code of Ethics
On May 9, 2006, the Company’s board of directors adopted a new Code of Ethics that applies to all of its directors, officers and employees, including its principal executive officer, principal financial officer and principal accounting officer. The new code replaces the Company’s prior code of ethics that applied only to its principal executive officer, principal financial officer, principal accounting officer or controller and any person who performed similar functions, and addresses, among other things, honesty and ethical conduct, conflicts of interest, compliance with laws, regulations and policies, including disclosure requirements under the federal securities laws, confidentiality, trading on inside information, and reporting of violations of the code. A copy of the Code of Ethics has been filed as Exhibit 14.1 to the Company’s current report on Form 8-K filed on May 11, 2006. The Code of Ethics will also be posted on the corporate governance page of the Company’s website at www.winnermedical.com as soon as practicable. The Company intends to post any amendments and any waivers to its code of conduct on its website in accordance with Item 5.05 of Form 8-K and Item 406 of Regulation S-K.
|
Item 11.
|
Executive Compensation.
|
Compensation Discussion and Analysis
On May 8, 2006, the Board of Directors established a compensation committee consisting only of independent Board members, which is responsible for setting the Company’s policies regarding compensation and benefits and administering the Company’s benefit plans. At the end of fiscal year 2011, the compensation committee consisted of Xuedong Wu (Chairman, Mr. Wu having replaced Dr. Horngjon Shieh since June 1, 2011), Larry Goldman and Lawrence Xiaoxia Pan. The members of the compensation committee approved the amount and form of compensation paid to executive officers of the Company and set the Company’s compensation policies and procedures during these periods.
The primary goals of the Company’s Board compensation committee with respect to executive compensation are to attract and retain highly talented and dedicated executives and to align executives’ incentives with stockholder value creation. The compensation committee evaluates individual executive’s work experience, time and involvement in the Company, position and personal performance, all with a goal to setting compensation levels that are comparable with executives at companies that are of the same size and stage of development and operate in the same area and industry.
The compensation committee will conduct an annual review of the aggregate level of the Company’s executive compensation, as well as the mix of elements used to compensate the Company’s executive officers. The Company compares compensation levels with amounts currently being paid to executives at similar companies in the same area and the same industry. Most importantly, the Company compares compensation levels with local practices in China. The Company believes that its compensation levels are competitive with local conditions.
Elements of compensation
The Company’s executive compensation consists of the following elements:
Base Salary. Base salaries for the Company’s executives are established to be amounts of compensation that are similar to those paid by other companies to executives in similar positions and with similar responsibilities. Base salaries are adjusted from time to time to realign salaries with market levels after taking into account individual responsibilities, performance and experience. The compensation committee established a salary structure to determine base salaries and is responsible for initially setting executive officer compensation in employment arrangements with each individual. The base salary amounts are intended to reflect the Company’s philosophy that the base salary should attract experienced individuals who will contribute to the success of the Company’s business goals and represent cash compensation that is commensurate with the compensation of individuals at similarly situated companies. The Company’s structure includes a basic annual salary amount for each category of directors and officers. Individuals then receive a salary enhancement in connection with their position. Finally, the initial base salary is increased by a “household subsidy” which represents a living allowance.
Discretionary Annual Bonus. The compensation committee has the authority to award discretionary annual bonuses to the Company’s executive officers. Bonuses are intended to compensate officers for achieving financial and operational goals, and for achieving individual annual performance objectives. These objectives vary depending on the individual executive, but relate generally to strategic factors such as the accomplishment of the planned target of the sales revenue, the net profit, and the asset turnover rate. In addition, except CEO, other executive officers’ annual bonuses are also dependent upon the performance measurement score of the departments that he/she is charge of. The bonus targets are set in a reasonable level, and the Compensation Committee believes that a majority of the executive officers could achieve these targets. The actual amount of discretionary bonus is determined following a review of each executive’s individual performance and contribution to the Company’s strategic goals conducted during the first quarter of the next fiscal year following the year subject to review. For example, in fiscal year 2011, the Company’s CEO, Mr. Jianquan Li, was awarded a bonus of $27,080 (RMB176,535), and the Company’s CFO, Mr. Xiuyuan Fang, was awarded a bonus of $7,582 (RMB49,425).
42
Equity Incentive Plan. The Company’s 2006 Equity Incentive Plan, the “2006 Plan”, was initially adopted by the Company’s Board of Directors in April 2006 and approved by the Company’s stockholders in April 2006. The 2006 Plan provides for the grant to the Company’s employees, directors, consultants and advisors of stock options, stock appreciation rights and stock awards, including restricted stock, performance grants, stock bonuses and other similar types of awards, including other awards under which recipients are not required to pay any purchase or exercise price, such as phantom stock rights. All equity awards granted under the Plan will be granted with respect to shares of the Company’s common stock.
On October 7, 2007, the Company’s Board of Directors approved certain amendments to the 2006 Plan. Among other things, the 2006 Plan was amended to:
|
|
·
|
Clarify that, in the event the Company experiences a change of control of the Company, the Board or a committee of the Board may (i) provide for the assumption or substitution of or adjustment to each outstanding award, (ii) accelerate the vesting of options and terminate any restrictions on stock awards, and/or (iii) provide for termination of awards as a result of the change in control on such terms as it deems appropriate, including providing for the cancellation of awards for a cash or other payment to the participant.
|
|
|
·
|
Clarify that, in the event of a proposed dissolution or liquidation of the Company, unless otherwise determined by the administrator, all outstanding awards will terminate immediately prior to such transaction.
|
|
|
·
|
Provide that the administrator may permit participants under the 2006 Plan to defer compensation payable under the terms of a written award agreement, so long as each such deferral arrangement complies with Section 409A of the U.S. Internal Revenue Code.
|
On October 7, 2007, the Company’s Board of Directors also approved the 2008-2009 Restricted Stock Unit Incentive Plan, the “2008-2009 Plan”, an equity incentive compensation program for fiscal years 2008 and 2009 that is a sub-plan of the Company’s 2006 Plan.
Eligible participants under the 2008-2009 Plan are directors who are employees of the Company, and the Company’s senior management and key employees as designated by the Company’s Chief Executive Officer or the Company’s Board of Directors. All equity awards to participants in the 2008-2009 Plan will be restricted stock unit awards, where a participant will be eligible to receive one share of the Company’s common stock for each restricted stock unit that vests upon the achievement of corporate and individual objectives and such participant’s continued employment as of the applicable vesting date.
The material terms of the 2008-2009 Plan include the following:
|
|
·
|
The maximum number of restricted stock units available for issuance under the 2008-2009 Plan was 1,200,000 units. The 1,200,000 units became 600,000 units as a result of 1-for-2 reverse stock split in October 2009. The shares of the Company’s common stock issuable upon vesting of the restricted stock units would be issued from the Company’s 2006 Plan.
|
|
|
·
|
The Company’s Board of Directors has established the target corporate net income and annual sales objectives for each of fiscal years 2008 and 2009, and each participant’s individual performance objectives have been set by the Company’s Chief Executive Officer. The Company’s Board of Directors or the Compensation Committee of the Company’s Board will certify the satisfaction of each target.
|
|
|
·
|
On each of October 7, 2010 and October 7, 2011, a participant is eligible to vest in up to 50% of the total number of restricted stock units underlying an award. 25% of the potential vesting at each vesting date is tied to satisfaction of each of the target corporate net income and annual sales objectives, respectively, and 50% of the potential vesting is tied to achievement of a participant’s individual performance objectives. On each of October 7, 2010 and 2011, under the 2008-2009 Restricted Stock Unit Incentive Plan, the Company vested its 179,507 and 231,625 units of restricted stock, which reflected 1-for-2 reverse stock split, to 85 and 83 eligible participants who were employees of the Company and the Company’s senior management and key employees, as designated by the Company’s Chief Executive Officer under authority of the Company’s Board of Directors, respectively.
|
The Company’s Board of Directors also approved the following restricted stock unit awards which reflected 1-for-2 reverse stock split to certain executives on October 7, 2007 and October 15, 2008:
|
Name and Principal Position
|
Restricted Stock
Unit Award in 2007
(shares)
|
Restricted Stock
Unit Award in
2007
($)1
|
Restricted Stock
Unit Award in
2008
(shares)
|
Restricted Stock
Unit Award in
2008
($)2
|
||||||||||||
|
Jianquan Li, President, Chief Executive Officer and Director
|
20,000 | $ | 72,000 | 0 | 0 | |||||||||||
|
Xiuyuan Fang, Chief Financial Officer, Vice President, Director and Treasurer
|
20,000 | $ | 72,000 | 5,000 | $ | 2,500 | ||||||||||
|
Nianfu Huo, Senior Vice President, Director and Chairman of Supervisory Board of Winner Group Limited
|
20,000 | $ | 72,000 | 0 | 0 | |||||||||||
|
|
1
|
Estimated value of award as of grant date is based on the last sale price of the Company’s common stock as quoted on the NASDAQ.com as of October 5, 2007, which was $3.60 per share, and assumes that the individual achieves 100% of the applicable corporate and individual objectives set forth in the award.
|
43
|
|
2
|
Estimated value of award as of grant date is based on the last sale price of the Company’s common stock as quoted on the NASDAQ.com as of October 15, 2008 which was $0.50 per share, and assumes that the individual achieves 100% of the applicable corporate and individual objectives set forth in the award.
|
On September 8, 2009, the Company’s Board of Directors also approved the 2010-2011 Restricted Stock Unit Incentive Plan, the “2010-2011 Plan”, an equity incentive compensation program for fiscal years 2010 and 2011 that is a sub-plan of the Company’s 2006 Plan.
Eligible participants under the 2010-2011 Plan are directors who are employees of the Company, and the Company’s senior management and key employees as designated by the Company’s Chief Executive Officer or the Company’s Board of Directors. All equity awards to participants in the 2010-2011 Plan will be restricted stock unit awards, where a participant will be eligible to receive one share of the Company’s common stock for each restricted stock unit that vests upon the achievement of corporate and individual objectives and such participant’s continued employment as of the applicable vesting date.
The material terms of the 2010-2011 Plan include the following:
|
|
·
|
The maximum number of restricted stock units that will be available for issuance under the 2010-2011 Plan is 600,000 units. The 600,000 units became 300,000 units after the reverse stock split. The shares of the Company’s common stock issuable upon vesting of the restricted stock units will be issued from the Company’s 2006 Plan.
|
|
|
·
|
The Company’s Board of Directors has established the target corporate net income and annual sales objectives for each of fiscal years 2010 and 2011, and each participant’s individual performance objectives have been set by the Company’s Chief Executive Officer. The Company’s Board of Directors or the Compensation Committee of the Company’s Board will certify the satisfaction of each target.
|
|
|
·
|
On each of September 8, 2012 and September 8, 2013, a participant is eligible to vest in up to 50% of the total number of restricted stock units underlying an award. 25% of the potential vesting at each vesting date is tied to satisfaction of each of the target corporate net income and annual sales objectives, respectively, and 50% of the potential vesting is tied to achievement of a participant’s individual performance objectives.
|
The Company’s Board of Directors also approved the following restricted stock unit awards which reflected 1-for-2 reverse stock split to certain executives on September 8, 2009 and September 28, 2010.
|
Name and Principal Position
|
Restricted Stock
Unit Award in
2009
(shares)
|
Restricted Stock
Unit Award in
2009
($)1
|
Restricted Stock
Unit Award in 2010
(shares)
|
Restricted Stock
Unit Award in
2010
($)2
|
||||||||||||
|
Jianquan Li, President, Chief Executive Officer and Director
|
10,000 | 44,000 | 0 | 0 | ||||||||||||
|
Xiuyuan Fang, Chief Financial Officer, Vice President, Director and Treasurer
|
10,000 | 44,000 | 0 | 0 | ||||||||||||
|
Nianfu Huo, Senior Vice President, Director and Chairman of the Supervisory Board of Winner Group Limited
|
2,500 | 11,000 | 1,000 | $ | 4,560 | |||||||||||
|
|
1
|
Estimated value of award as of grant date is based on the last sale price of the Company’s common stock as quoted on the NASDAQ.com as of September 8, 2009, which was $4.40 per share, and assumes that the individual achieves 100% of the applicable corporate and individual objectives set forth in the award.
|
|
|
2
|
Estimated value of award as of grant date is based on the last sale price of the Company’s common stock as quoted on the NASDAQ.com as of September 28, 2010, which was $4.56 per share, and assumes that the individual achieves 100% of the applicable corporate and individual objectives set forth in the award.
|
On October 6, 2010, the Company’s Board of Directors also approved the 2011-2013 Restricted Stock Unit Incentive Plan, the “2011-2013 Plan”, an equity incentive compensation program for fiscal years 2011, 2012 and 2013 that is a sub-plan of the Company’s 2006 Plan.
Eligible participants under the 2011-2013 Plan are directors who are employees to core management in Shenzhen PurCotton Technology Co., Ltd. and the Company’s senior management and key employees as designated by the Company’s Chief Executive Officer or the Company’s Board of Directors. No stocks were granted to Mr. Jianquan Li, Mr. Xiuyuan Fang and Mr. Nianfu Huo under the 2011-2013 Plan. All equity awards to participants in the 2011-2013 Plan will be restricted stock unit awards, where a participant will be eligible to receive one share of the Company’s common stock for each restricted stock unit that vests upon the achievement of corporate and individual objectives and such participant’s continued employment as of the applicable vesting date.
The material terms of the 2011-2013 Plan include the following.
44
|
|
·
|
The maximum number of restricted stock units that will be available for issuance under the 2011-13 Plan is 500,000 units, which reflected 1-for-2 reverse stock split. On the date of approval of the 2011-2013 Plan, the Board granted 300,000 units to certain participants in the plan. The remaining 200,000 units are reserved for grants to new key employees or to existing employees of the Company who have made significant contributions. The shares of the Company’s common stock issuable upon vesting of the restricted stock units will be issued from our 2006 Plan.
|
|
|
·
|
The Company’s Board of Directors has established the target corporate net income and annual sales objectives for each of fiscal years 2011, 2012 and 2013, and each participant’s individual performance objectives have been set by the Company’s Chief Executive Officer. The Company’s Board of Directors or the Compensation Committee of the Company’s Board will certify the satisfaction of each target.
|
|
|
·
|
No award to a participant under the 2011-2013 Plan may exceed 1% of the Company’s outstanding capital stock as of the date of grant.
|
|
|
·
|
The 2011-2013 Plan expires the earlier of four years of the date of approval or the effective date of termination of the 2006 Plan.
|
|
|
·
|
The Board has established target corporate net income and annual sales objectives for Shenzhen PurCotton for the fiscal years 2011, 2012 and 2013. In addition, each participant will be given a personal performance target as set by the Company’s Chief Executive Officer.
|
|
|
·
|
On each of October 6, 2012, October 6, 2013 and October 6, 2014, a participant will be eligible to vest up to 1/3 of the total number of restricted stock units underlying an award. The percentage of such vesting is individually predetermined and tied to satisfaction of the target corporate net income and annual sales objectives, as well as attainment of each participant’s personal performance targets. The Board or the Compensation Committee of the Board will certify the satisfaction of each target.
|
On November 3, 2011, the Company’s board or directors approved the 2012-13 Equity Incentive Plan (the “2012-13 Plan”), an incentive compensation program for fiscal years 2012 and 2013 that is a sub-plan of the Company’s 2006 Plan.
Eligible participants under the 2012-13 Plan are employee directors, senior management and other key employees of the Company. All awards to participants in the 2012-13 Plan will be “restricted stock unit awards,” consisting of a stock unit as provided in the 2006 Plan, and/or “option awards,” consisting of a nonqualified stock option as provided in the 2006 Plan. The 2012-13 Plan expires the earlier of four years of the date of approval or the effective date of termination of the 2006 Plan. Other material terms of the 2012-13 Plan include the following.
|
Restricted Stock Units
|
|
|
·
|
The maximum number of units from restricted stock units that will be available for issuance under the 2012-13 Plan is 530,000 units. Each participant will be eligible to receive one share of the Company’s common stock, which will be issued from the Company’s 2006 Plan, for each restricted stock unit that vests upon the achievement of corporate and individual objectives and such participant’s continued employment as of the applicable vesting date.
|
|
·
|
On each of November 3, 2014 and November 3, 2015, a participant will be eligible to vest up to 1/2 of the total number of restricted stock units underlying an award. The percentage of such vesting is individually predetermined and tied to satisfaction of the target corporate net income and annual sales objectives, as well as attainment of each participant’s personal performance targets.
|
|
Options
|
|
|
·
|
Each participant will be eligible to purchase one share of the Company’s common stock, and the maximum number of shares from options that will be available for issuance will be 1,700,000.
|
|
·
|
On each of November 3, 2012, November 3, 2013, November 3, 2014 and November 3, 2015, a participant will be eligible to vest up to 1/4 of the total number of option awards. The percentage of such vesting is individually predetermined and tied to satisfaction of the target corporate net income and annual sales objectives, as well as attainment of each participant’s personal performance targets.
|
|
·
|
Each option award that is vested will expire two (2) years after its vesting date.
|
|
·
|
The per share exercise price of an option award will be determined by the administrator of the plan when the option award is granted, and shall in no event be less than 100% of the per share fair market value of the shares subject to such option on the date of grant of such option award.
|
45
|
Name and Principal Position
|
Restricted Stock
Unit Award in
2011
(shares)
|
Restricted Stock
Unit Award in
2011
($)1
|
Stock Options
Award in 2011
(shares)
|
Exercise Price of
Stock Options
2011
($)2
|
||||||||||||
|
Jianquan Li, President, Chief Executive Officer and Director
|
0 | 0 | 350,000 | 1,183,000 | ||||||||||||
|
Xiuyuan Fang, Chief Financial Officer, Vice President, Director and Treasurer
|
6,000 | 18, 180 | 200,000 | 616,000 | ||||||||||||
|
Nianfu Huo, Senior Vice President, Director and Chairman of the Supervisory Board of Winner Group Limited
|
10,000 | $ | 30,500 | 0 | 0 | |||||||||||
|
|
1
|
The estimated value of award as of grant date is based on the last sale price of the Company’s common stock as quoted on the NASDAQ.com as of November 3, 2011, which was $3.03 per share, and assumes that the individual achieves 100% of the applicable corporate and individual objectives set forth in the award.
|
|
|
2
|
The exercise price of stock options as of grant date may not be less than 100% of the per share Fair Market Value of the shares subject to such option on the date of grant of such option; the exercise price for a ten percent stockholder will not be less than 110% of per share Fair Market Value of the shares on the date of such grant. The grant date of stock options was November 3, 2011 and the close price of the Company’s common stock on November 3, 2011 was $3.03. The exercise price for Mr. Jianquan Li stock options is $3.38. For all other participants, the exercise price is $3.08.
|
Other Compensation.
Other than the annual salary for the Company’s executive officers, the bonus that may be awarded to executive officers at the discretion of the Compensation Committee and arrangements with executive officers for the use of a Company car, and the household subsidies referred to above, the Company does not have any other benefits and perquisites for its executive officers. However, the Compensation Committee in its discretion may provide benefits and perquisites to these executive officers if it deems it advisable.
Employment contracts and termination of employment
All of the Company’s executive officers have executed standard employment agreements with the Company, which are governed under Chinese law. Other than the amount of compensation, the terms and conditions of the employment agreements with the executive officers are substantially the same as those of the Company’s standard employment agreements with non-executive employees. The Company’s standard employment agreements are for a fixed period of three years and may be renewed upon notice from the employee and consent of the Company. The Company may terminate an employment agreement upon thirty days’ notice if an employee is not suitable for the job due to medical or other reasons. An employee may terminate his or her employment agreement without cause upon one month’s notice.
Jianquan Li, the Company’s CEO and President’s employment agreement became effective as of January 1, 2011. The agreement is for a term of three years. Mr. Li is receiving an annual salary of approximately $135,000 under the agreement during the fiscal year ended September 30, 2011.
Xiuyuan Fang, the Company’s CFO, Vice President and Treasurer’s employment agreement became effective as of January 1, 2011. The agreement is for a term of three years. Mr. Fang is receiving an annual salary of approximately $84,000 under the agreement during the fiscal year ended September 30, 2011.
Nianfu Huo, the Company’s Senior Vice President’s employment agreement became effective as of January 1, 2011. The agreement is for a term of three years. Mr. Huo is receiving an annual salary of approximately $31,000 under the agreement (RMB200,000) during the fiscal year ended September 30, 2011.
The compensation stated in the agreement is the basic salary, and it is subject to adjustment on an annual basis.
Accounting and tax treatment
Given the Company’s current levels of compensation, the accounting and tax considerations have not significantly impacted the Company’s forms of compensation. The board considers as one factor the impact of accounting and tax treatment on compensation in the Company’s compensation programs.
Director Compensation
On May 8, 2006, the Company entered into separate Independent Directors’ Contracts and Indemnification Agreements with each of the independent directors. Starting from June 1, 2011, Mr. Xuedong Wu was appointed by the Board of Directors to replace Dr. Hornjon Shieh as the Company’s new independent director and Chairman of Compensation Committee. Mr. Goldman, Mr. Pan and Mr. Xuedong Wu are entitled to $50,000 individually as cash compensation for the services to be provided by them as the Company’s independent directors, and as chairpersons of various board committees, as applicable.
46
The following table summarizes director compensation during the fiscal year 2011.
|
Name
|
Audit
Committee
|
Fees Earned
or
Paid in
Cash
Nomination
Committee
|
Compensation
Committee
|
Stock
Awards
|
Option
Awards (1)
|
Non-Equity
Incentive Plan
Compensation
|
Change in Pension
Value and Nonqualified
Deferred Compensation
Earnings
|
All Other
Compensation
|
Total
|
|||||||||||||||||||||||||||
|
Jianquan Li,
|
||||||||||||||||||||||||||||||||||||
|
Xiuyuan Fang
|
||||||||||||||||||||||||||||||||||||
|
Larry Goldman
|
$ | 40,000 | * | $ | 5,000 | $ | 5,000 | 0 | 0 | 0 | 0 | 0 | $ | 50,000 | ||||||||||||||||||||||
|
Lawrence Xiaoxia Pan
|
$ | 5,000 | $ | 40,000 | * | $ | 5,000 | 0 | 0 | 0 | 0 | 0 | $ | 50,000 | ||||||||||||||||||||||
|
Horngjon Shieh**
|
$ | 3,333 | $ | 3,333 | $ | 3,333 | * | 0 | 0 | 0 | 0 | 0 | $ | 10,000 | ||||||||||||||||||||||
|
Xuedong Wu
|
$ | 1,667 | $ | 1,667 | $ | 13,333 | * | 0 | 0 | 0 | 0 | 0 | $ | 16,667 | ||||||||||||||||||||||
|
*
|
Indicates chairman of that respective committee.
|
|
**
|
Dr. Shieh resigned on May 20, 2011.
|
Under the terms of the Indemnification Agreements, the Company agreed to indemnify the independent directors against expenses, judgments, fines, penalties or other amounts actually and reasonably incurred by the independent directors in connection with any proceeding if the independent director acted in good faith and in the best interests of the Company. The Independent Directors’ Contracts and Indemnification Agreements were filed as Exhibits 10.1 through 10.6 to the Company’s current report on Form 8-K filed on May 11, 2006.
None of the employee directors receives additional compensation solely as a result of his position as a director.
Compensation Committee Report
The Compensation Committee of the Board of Directors of Winner Medical Group Inc. has reviewed and discussed the Compensation Discussion and Analysis contained in this annual report on Form 10-K with management. Based on the Company’s Compensation Committee’s review of and the discussions with management with respect to the Compensation Discussion and Analysis, the Company’s Compensation Committee recommended to the Board of Directors that the Compensation Discussion and Analysis be included in this annual report on Form 10-K for filing with the SEC.
The foregoing report is provided by the following directors, who constitute the Compensation Committee: Xuedong Wu, Larry Goldman and Lawrence Xiaoxia Pan.
Summary Compensation Table
The following table sets forth information regarding compensation for the fiscal year ended September 30, 2011 received by the individual who served as the Company’s Chief Executive Officer as well as one individual who served as the Company’s Chief Financial Officer, “Named Executive Officers.” The total compensation of other executive officers did not exceed $100,000 per year.
|
Name And
Principal
Posit ion
|
Year
|
Salary1
|
Bonus1
|
Stock
Awards3
|
Option
Awards
|
Nonequity
Incentive Plan
Compensation
|
Change in
Pension Value
& Nonqualified
Deferred
Compensation
|
All Other
Compensation2
|
Total1
|
|||||||||||||||||||||||||
|
Jianquan Li,
|
2011
|
$ | 134,592 | $ | 27,080 | 27,000 | 0 | 0 | 0 | 0 | $ | 188,672 | ||||||||||||||||||||||
|
CEO, President
|
2010
|
$ | 130,239 | $ | 27,824 | 0 | 0 | 0 | 0 | 0 | $ | 158,063 | ||||||||||||||||||||||
|
and Director
|
2009
|
$ | 113,547 | $ | 46,477 | 0 | 0 | 0 | 0 | 0 | $ | 160,024 | ||||||||||||||||||||||
|
Xiuyuan Fang,
|
||||||||||||||||||||||||||||||||||
|
CFO, Vice
|
2011
|
$ | 83,668 | $ | 7,582 | 27,938 | 0 | 0 | 0 | 0 | $ | 119,188 | ||||||||||||||||||||||
|
President, Director,
|
2010
|
$ | 74,396 | $ | 7,376 | 0 | 0 | 0 | 0 | 0 | $ | 81,772 | ||||||||||||||||||||||
|
and Treasurer
|
2009
|
$ | 63,017 | $ | 16,301 | 0 | 0 | 0 | 0 | 0 | $ | 79,318 | ||||||||||||||||||||||
|
|
1
|
Salary and bonus amounts and total compensation are reported in U.S. dollars.
|
|
|
2
|
During fiscal year 2011, the executive officers of the Company were not granted any perquisites or other personal benefits.
|
|
|
3
|
Stock awards amounts represented stock units vested during the year which were computed by the grant date fair value (which was $27,000 for Mr. Jianquan Li and 27,938 for Mr. Xiuyuan Fang) in accordance with FASB ASC 718.
|
47
Option Exercises and Stock Vested.
On October 7, 2010, under 2008-2009 Plan, the Company issued 7,500 and 9,375 shares of the Company’s common stock to Jianquan Li and Xiuyuan Fang, representing vesting of the first 50% of the total number of restricted stock awarded. None of the Company’s executive officers exercised any options under that plan during the fiscal year 2011 and 2010. Mr. Jianquan Li, the Company’s CEO sold his 2,000 restricted stocks on August 29, 2011. Following the sales, Mr. Jianquan Li’s beneficial share number is 18,017,764 on September 30, 2011.
Outstanding equity awards at fiscal year-end.
The following table provides information for each of our Named Executive Officers regarding outstanding stock options and unvested stock awards held by the officers as of September 30, 2011. Market values are presented as of September 30, 2011 (based on the closing price of the Company’s stock on that date of $3.17 on September 30, 2011) for outstanding stock awards, which include fiscal year 2011 grants and prior-year grants. The accumulated equity holdings reflect our long-term incentive structure.
|
Stock Awards
|
||||||||
|
Equity Incentive Plan Awards
|
||||||||
|
Name
|
Number of unearned shares, units or other
rights that have not vested (#)
|
Market or payout value of unearned shares, units
or other rights that have not vested ($)
|
||||||
|
Jianquan LiCEO, president and director
|
18,750 | (1) | 59,438 | |||||
|
Xiuyuan FangCFO, vice president, director and treasurer
|
21,250 | (2) | 67,363 | |||||
|
|
(1)
|
Includes 10,000 RSUs that vested on October 8, 2011, 5,000 RSUs that will vest on September 8, 2012 and 3,750 RSUs that will vest on September 8, 2013.
|
|
|
(2)
|
Includes 12,500 RSUs that vested on October 8, 2011, 5,000 RSUs that will vest on September 8, 2012 and 3,750 RSUs that will vest on September 8, 2013.
|
|
Item 12.
|
Security Ownership of Certain Beneficial Owners and Management and Related Stockholder Matters.
|
The following table sets forth information regarding beneficial ownership of the Company’s common stock as of September 30, 2011: (i) by each person who is known by the Company to beneficially own more than 5% of the Company’s common stock; (ii) by each of the Company’s officers and directors; and (iii) by all of the Company’s officers and directors as a group.
|
Name & Address of
Beneficial Owner
|
Office, If Any
|
Amount & Nature of
Beneficial Ownership1
|
Percent of Class2
|
|||||||
|
Jianquan Li3
Ping Tse3
6-15D, Donghai Garden, Futian District, Shenzhen, China
|
CEO, President and Director
|
18,017,764 | 74.64 | % | ||||||
|
Xiuyuan Fang
Room 5B Building 2 Jun’an Garden, Futian District, Shenzhen City, Guangdong Province, China
|
CFO, Vice President, Treasurer and Director
|
241,631 | 1.00 | % | ||||||
|
Larry Goldman
5 Victory Road,
Suffern, NY 10901
|
Director
|
0 | * | |||||||
|
Lawrence Xiaoxia Pan
19 Bristol Road,
North Brunswick, NJ08902
|
Director
|
0 | * | |||||||
|
Dr. Horngjon Shieh
Flat 37B, Tower 3
The Victoria Towers
188 Canton Road, TST
Kowloon, Hong Kong
|
Director
|
0 | * | |||||||
|
Xuedong Wu
Flat 18-B, Building 7
Xiangsimeishuyuan Garden Futian District, Shenzhen City, Guangdong Province, China
|
Director
|
0 | * | |||||||
|
Nianfu Huo
Hai Yi Wan Pan, No. 333 Jin Tang Road, Tang Jia Wan
Zhuhai, China 519000
|
Senior Vice President and Chairman of Supervisory Board of Winner Group Limited
|
87,262 | 0.39 | % | ||||||
|
All officers and directors as a group
|
18,161,752 | 74.74 | % | |||||||
48
|
|
*
|
Less than 1%
|
|
|
1
|
Beneficial Ownership is determined in accordance with the rules of the Securities and Exchange Commission and generally includes voting or investment power with respect to securities. Each of the beneficial owners listed above has direct ownership of and sole voting power and investment power with respect to the shares of the Company’s common stock.
|
|
|
2
|
A total of 24,140,247 shares of the Company’s Common Stock are considered to be outstanding pursuant to SEC Rule 13d-3(d)(1) as of September 30, 2011. For each Beneficial Owner above, any options exercisable within 60 days have been included in the denominator.
|
|
|
3
|
Mr. Jianquan Li and his wife, Ping Tse, hold a total of 18,017,764 shares of the Company’s Common Stock. Mr. Jianquan Li disclaims the power to vote and dispose of the 4,510,565 shares of the Company’s Common Stock to Ping Tse. As such, Mr. Jianquan owns 13,507,199 shares of the Company’s Common Stock.
|
|
Item 13.
|
Certain Relationships and Related Transactions, and Director Independence.
|
During the years ended September 30, 2011 and 2010, the Company sold goods to L+L Healthcare Hubei Co., Ltd., “L+L,” for $257,835, and $676, respectively. During the years ended September 30, 2011 and 2010, the Company purchased goods from L+L for US$142,444 and US$76,675, respectively and received dividends from L+L for $200,000 and $Nil, respectively. As of September 30, 2011 and 2010, amounts due to L+L were $Nil and $20,363 respectively. As of September 30, 2011 and 2010, amounts due from L+L were $119,368 and $248, respectively.
During the year ended September 30, 2011 and 2010, the Company sold goods to Chengdu Winner Likang Medical Appliance Co., Ltd. (“Winner Chengdu”), an equity investee, for $87,439 and $28,848, and purchased goods from it for $90,296 and $94,271, respectively. As of September 30, 2011 and 2010, amounts due to Winner Chengdu were $Nil and $37,975, respectively; and amounts due from Winner Chengdu were $38,411 and $751, respectively.
The amounts due from/to the above affiliated companies are unsecured, interest free and payable according to the trading credit terms.
Mr. Jianquan Li, the Chief Executive Officer of the Company, entered into agreements with the Company in relation to commodity derivatives trading activities. The shortfall of the restricted broker margin account balances maintained for the commodity derivatives trading activities between January 1, 2011 and September 30, 2011was US$1,718,031 (or RMB 10,917,915). This shortfall had been fully compensated by way of cash payment from Mr. Jianquan Li to the Company accounts as recorded on September 30, 2011. Further details can be found in the section “Business–Raw Materials and Manufacturing” in this Form 10-K.
The Company’s independent directors approve the related party transactions based on their fiduciary duties under Nevada state law and based on the best interest of the company.
|
Item 14.
|
Principal Accountant Fees and Services.
|
Audit Fees
The fees in 2011 and 2010 for performing the audit of the Company’s financial statements included in the Company’s Annual Reports on Form 10-K during the fiscal years ended September 30, 2011 and 2010 were approximately $126,000 and $180,000, respectively. The fees relating to the review of the Company’s financial statements included in the Company’s Quarterly Reports on Form 10-Q during the fiscal years ended September 30, 2011 and 2010 were approximately $111,000 and $99,000, respectively. The fee in conjunction with the Registration Statement and issuance of a related “comfort letter” during 2010 was $38,000.
The fees in 2011 and 2010 for audit-related services for the fiscal years ended September 30, 2011 and 2010 were approximately $Nil and $Nil, respectively.
Tax Fees
Tax fees in the fiscal years ended September 30, 2011 and 2010 for tax services were $Nil and $Nil respectively.
All Other Fees
The Company’s independent auditor did not provide any services other than as described above under the headings “Audit Fees,” “Audit-Related Fees” and “Tax Fees” during the fiscal year ended September 30, 2011 and 2010.
49
Policy on Pre-Approval of Services
The Company’s Board of Directors pre-approved all auditing services and non-audit services to be performed by the independent auditors during the fiscal year ended September 30, 2011.
50
PART IV
|
ITEM 15.
|
EXHIBITS, FINANCIAL STATEMENTS SCHEDULES.
|
|
(a)
|
The following documents are filed as part of this report:
|
|
|
(1)
|
Financial Statements
|
The consolidated financial statements filed as part of this Form 10-K are located as set forth in the index on page F-1 of this report.
|
|
(2)
|
Financial Statement Schedules
|
Not applicable.
|
|
(3)
|
Exhibits
|
The list of exhibits included in the attached Exhibit Index is hereby incorporated herein by reference.
51
SIGNATURES
Pursuant to the requirements of Section 13 or 15(d) of the Securities Exchange Act of 1934, the registrant has duly caused this report to be signed on its behalf by the undersigned, thereunto duly authorized.
Date: November 30, 2011
|
WINNER MEDICAL GROUP INC.
|
||
|
By:
|
/s/ Jianquan Li
|
|
|
Jianquan Li
|
||
|
Chief Executive Officer
|
||
|
By:
|
/s/ Xiuyuan Fang
|
|
|
Xiuyuan Fang
|
||
|
Chief Financial Officer
|
||
POWER OF ATTORNEY
KNOW ALL PERSONS BY THESE PRESENTS, that each person whose signature appears below constitutes and appoints Jianquan Li and Xiuyuan Fang, and each of them, their attorneys-in-fact and agents, each with the power of substitution, for them in any and all capacities, to sign any and all amendments to this Report on Form 10-K, and to file the same, with exhibits thereto and other documents in connection therewith, with the Securities and Exchange Commission, hereby ratifying and confirming all that said attorneys-in-fact, or substitutes, may do or cause to be done by virtue hereof.
Pursuant to the requirements of the Securities Exchange Act of 1934, this report has been signed below by the following persons on behalf of the registrants and in the capacities and on the dates indicated.
|
By:
|
/s/ Jianquan Li
|
|
|
Jianquan Li
|
||
|
Chief Executive Officer, President and Chairman of the Board of the Directors
|
||
|
(Principal Executive Officer)
|
||
|
Dated: November 30, 2011
|
||
|
By:
|
/s/ Xiuyuan Fang
|
|
|
Xiuyuan Fang
|
||
|
Chief Financial Officer, Vice President, Treasurer and Director
|
||
|
(Principal Accounting and Financial Officer)
|
||
|
Dated: November 30, 2011
|
||
|
By:
|
/s/ Larry Goldman
|
|
|
Larry Goldman
|
||
|
Director
|
||
|
Dated: November 30, 2011
|
||
|
By:
|
/s/ Lawrence Xiaoxia Pan
|
|
|
Lawrence Xiaoxia Pan
|
||
|
Director
|
||
|
Dated: November 30, 2011
|
||
|
By:
|
/s/ Xuedong Wu
|
|
|
Xuedong Wu
|
||
|
Director
|
||
|
Dated: November 30, 2011
|
52
Board of Directors and Stockholders
Winner Medical Group Inc.
We have audited the accompanying consolidated balance sheets of Winner Medical Group Inc. and its subsidiaries (the “Company”) as of September 30, 2011 and 2010, and the related consolidated statements of income and comprehensive income, stockholders’ equity and cash flows for each of the two years in the period ended September 30, 2011. These financial statements are the responsibility of the Company’s management. Our responsibility is to express an opinion on these financial statements based on our audits.
We conducted our audits in accordance with the standards of the Public Company Accounting Oversight Board (United States). Those standards require that we plan and perform the audit to obtain reasonable assurance about whether the financial statements are free of material misstatement. The Company is not required to have, nor were we engaged to perform, an audit of its internal control over financial reporting. Our audits included consideration of internal control over financial reporting as a basis for designing audit procedures that are appropriate in the circumstances, but not for the purpose of expressing an opinion on the effectiveness of the Company’s internal control over financial reporting. Accordingly, we express no such opinion. An audit also includes examining, on a test basis, evidence supporting the amounts and disclosures in the financial statements, assessing the accounting principles used and significant estimates made by management, as well as evaluating the overall financial statement presentation. We believe that our audits provide a reasonable basis for our opinion.
In our opinion, the consolidated financial statements referred to above present fairly, in all material respects, the financial position of Winner Medical Group Inc. and its subsidiaries at September 30, 2011 and 2010, and the results of their operations and their cash flows for each of the two years in the period ended September 30, 2011, in conformity with accounting principles generally accepted in the United States of America.
|
/s/ BDO Limited
|
||
|
BDO Limited
|
Hong Kong, November 30, 2011
53
|
WINNER MEDICAL GROUP INC.
Consolidated Financial Statements
For the years ended September 30, 2011 and 2010
|
WINNER MEDICAL GROUP INC.
INDEX TO CONSOLIDATED FINANCIAL STATEMENTS
|
Page
|
|
|
Consolidated Balance Sheets
|
F-2
|
|
Consolidated Statements of Income and Comprehensive Income
|
F-3
|
|
Consolidated Statements of Stockholders’ Equity
|
F-4
|
|
Consolidated Statements of Cash Flows
|
F-5
|
|
Notes to Consolidated Financial Statements
|
F-6 – F-23
|
F-1
WINNER MEDICAL GROUP INC.
CONSOLIDATED BALANCE SHEETS
|
September 30,
|
||||||||
|
2011
|
2010 | |||||||
|
US$
|
US$
|
|||||||
|
ASSETS
|
||||||||
|
Current assets:
|
||||||||
|
Cash and cash equivalents
|
21,945,105 | 14,818,179 | ||||||
|
Restricted bank deposits
|
1,836,491 | 285,119 | ||||||
|
Held-to-maturity investments
|
0 | 1,497,607 | ||||||
|
Accounts and notes receivable, less allowances for doubtful accounts of US$159,485 and US$230,200 at September 30, 2011 and 2010, respectively
|
20,982,263 | 15,672,446 | ||||||
|
Amounts due from affiliated companies
|
157,779 | 999 | ||||||
|
Inventories
|
25,408,700 | 15,945,101 | ||||||
|
Prepaid expenses and other current assets
|
8,334,504 | 6,929,066 | ||||||
|
Income taxes recoverable
|
146,408 | 33,974 | ||||||
|
Deferred tax assets
|
376,411 | 428,741 | ||||||
|
Total current assets
|
79,187,661 | 55,611,232 | ||||||
|
Property, plant and equipment, net
|
65,461,750 | 60,110,367 | ||||||
|
Investment in equity investees
|
2,421,915 | 2,159,784 | ||||||
|
Intangible assets, net
|
126,918 | 125,079 | ||||||
|
Prepaid expenses and other receivables
|
1,596,354 | 637,748 | ||||||
|
Deferred tax assets
|
1,124,089 | 331,785 | ||||||
|
Total assets
|
149,918,687 | 118,975,995 | ||||||
LIABILITIES AND STOCKHOLDERS’ EQUITY
|
Current liabilities:
|
||||||||
|
Short-term bank loans
|
6,294,356 | 0 | ||||||
|
Accounts payable
|
7,420,580 | 5,362,155 | ||||||
|
Accrued payroll and employee benefits
|
3,141,756 | 2,393,700 | ||||||
|
Customer deposits
|
1,115,887 | 687,275 | ||||||
|
Accrued and other liabilities
|
4,253,889 | 3,057,445 | ||||||
|
Amounts due to affiliated companies
|
0 | 58,338 | ||||||
|
Income taxes payable
|
1,970,710 | 1,477,212 | ||||||
|
Total current liabilities
|
24,197,178 | 13,036,125 | ||||||
|
Deferred tax liabilities
|
45,025 | 42,699 | ||||||
|
Total liabilities
|
24,242,203 | 13,078,824 | ||||||
|
|
||||||||
|
Commitments and contingencies
|
||||||||
|
Stockholders’ equity:
|
||||||||
|
Common stock, par value $0.001 per share; authorized 247,500,000 shares, issued and outstanding September 30, 2011– 24,140,247 shares; September 30, 2010 –23,950,740 shares
|
24,141 | 23,951 | ||||||
|
Additional paid-in capital
|
42,490,464 | 40,154,494 | ||||||
|
Retained earnings
|
58,984,686 | 48,730,034 | ||||||
|
Statutory reserves
|
5,866,970 | 4,585,731 | ||||||
|
Accumulated other comprehensive income
|
18,169,505 | 12,302,762 | ||||||
|
Total Winner Medical Group Inc.
|
||||||||
|
stockholders’ equity
|
125,535,766 | 105,796,972 | ||||||
|
Noncontrolling interests
|
140,718 | 100,199 | ||||||
|
Total equity
|
125,676,484 | 105,897,171 | ||||||
|
Total liabilities and equity
|
149,918,687 | 118,975,995 | ||||||
See accompanying notes to consolidated financial statements.
F-2
WINNER MEDICAL GROUP INC.
CONSOLIDATED STATEMENTS OF INCOME AND COMPREHENSIVE INCOME
|
Year ended September 30,
|
||||||||
|
2011
|
2010
|
|||||||
|
US$
|
US$
|
|||||||
|
Net sales
|
149,896,424 | 115,030,651 | ||||||
|
Cost of sales
|
(109,046,284 | ) | (80,473,292 | ) | ||||
|
Gross profit
|
40,850,140 | 34,557,359 | ||||||
|
Other operating income, net
|
4,083 | 557,402 | ||||||
|
Government subsidies
|
1,594,315 | 208,719 | ||||||
|
Realized loss on commodity financial instruments
|
(1,859,945 | ) | 0 | |||||
|
Foreign currency exchange losses, net
|
(1,051,250 | ) | (493,271 | ) | ||||
|
Selling, general and administrative expenses
|
(26,525,378 | ) | (20,370,950 | ) | ||||
|
|
|
|||||||
|
Income from operations
|
13,011,965 | 14,459,259 | ||||||
|
Interest income
|
165,195 | 98,024 | ||||||
|
Interest expense
|
(93,314 | ) | (128,816 | ) | ||||
|
Equity in earnings of 50 percent or less owned persons
|
462,131 | 235,828 | ||||||
|
Income before income taxes
|
13,545,977 | 14,664,295 | ||||||
|
Income taxes
|
(1,970,314 | ) | (1,666,933 | ) | ||||
|
Net income
|
11,575,663 | 12,997,362 | ||||||
|
Net (income)/loss attributable to noncontrolling interests
|
(39,772 | ) | 93,136 | |||||
|
Net income attributable to Winner Medical Group Inc.
|
11,535,891 | 13,090,498 | ||||||
|
Comprehensive income:
|
||||||||
|
Net income
|
11,575,663 | 12,997,362 | ||||||
|
Foreign currency translation adjustments
|
5,867,490 | 1,584,165 | ||||||
|
Comprehensive (income)/loss attributable to noncontrolling interests
|
(40,519 | ) | 93,883 | |||||
|
Comprehensive income attributable to Winner Medical Group Inc.
|
17,402,634 | 14,675,410 | ||||||
|
Net income attributable to Winner Medical Group Inc. per share
|
||||||||
|
- basic
|
0.48 | 0.57 | ||||||
|
- diluted
|
0.47 | 0.56 | ||||||
|
Weighted average common stock outstanding
|
||||||||
|
- basic
|
24,128,868 | 23,014,065 | ||||||
|
- diluted
|
24,549,361 | 23,383,532 | ||||||
See accompanying notes to consolidated financial statements.
F-3
WINNER MEDICAL GROUP INC.
CONSOLIDATED STATEMENTS OF STOCKHOLDERS’ EQUITY
|
|
|
|||||||||||||||||||||||||||||||
|
Common stock
|
Additional
paid-in
|
|
|
Accumulated other
comprehensive
|
||||||||||||||||||||||||||||
|
Stock
|
|
Retained
|
Statutory
|
Non- controlling
|
Total
|
|||||||||||||||||||||||||||
|
outstanding
|
Amount
|
capital
|
earnings
|
reserves
|
income
|
interests
|
equity
|
|||||||||||||||||||||||||
|
US$
|
US$
|
US$
|
US$
|
US$
|
US$
|
US$
|
||||||||||||||||||||||||||
|
Balance at September 30, 2009
|
22,363,740 | 22,364 | 31,166,123 | 36,797,172 | 3,428,095 | 10,717,850 | 82,815 | 82,214,419 | ||||||||||||||||||||||||
|
Issuance of common stock – net of offering costs
|
1,587,000 | 1,587 | 8,791,876 | 0 | 0 | 0 | 0 | 8,793,463 | ||||||||||||||||||||||||
|
Restricted stock units granted
|
0 | 0 | 695,758 | 0 | 0 | 0 | 0 | 695,758 | ||||||||||||||||||||||||
|
Net income/(loss)
|
0 | 0 | 0 | 13,090,498 | 0 | 0 | (93,136 | ) | 12,997,362 | |||||||||||||||||||||||
|
Foreign currency translation adjustments
|
0 | 0 | 0 | 0 | 0 | 1,584,912 | (747 | ) | 1,584,165 | |||||||||||||||||||||||
|
Transfer to statutory reserves
|
0 | 0 | 0 | (1,157,636 | ) | 1,157,636 | 0 | 0 | 0 | |||||||||||||||||||||||
|
Purchase of noncontrolling interests
|
0 | 0 | (499,263 | ) | 0 | 0 | 0 | 111,267 | (387,996 | ) | ||||||||||||||||||||||
|
Balance at September 30, 2010
|
23,950,740 | 23,951 | 40,154,494 | 48,730,034 | 4,585,731 | 12,302,762 | 100,199 | 105,897,171 | ||||||||||||||||||||||||
|
Restricted stock units granted
|
0 | 0 | 618,129 | 0 | 0 | 0 | 0 | 618,129 | ||||||||||||||||||||||||
|
Stockholder’s contribution
|
0 | 0 | 1,718,031 | 0 | 0 | 0 | 0 | 1,718,031 | ||||||||||||||||||||||||
|
Issuance of restricted stock units
|
189,507 | 190 | (190 | ) | 0 | 0 | 0 | 0 | 0 | |||||||||||||||||||||||
|
Net income
|
0 | 0 | 0 | 11,535,891 | 0 | 0 | 39,772 | 11,575,663 | ||||||||||||||||||||||||
|
Foreign currency translation adjustments
|
0 | 0 | 0 | 0 | 0 | 5,866,743 | 747 | 5,867,490 | ||||||||||||||||||||||||
|
Transfer to statutory reserves
|
0 | 0 | 0 | (1,281,239 | ) | 1,281,239 | 0 | 0 | 0 | |||||||||||||||||||||||
|
Balance at September 30, 2011
|
24,140,247 | 24,141 | 42,490,464 | 58,984,686 | 5,866,970 | 18,169,505 | 140,718 | 125,676,484 | ||||||||||||||||||||||||
See accompanying notes to consolidated financial statements.
F-4
WINNER MEDICAL GROUP INC.
CONSOLIDATED STATEMENTS OF CASH FLOWS
|
Year ended September 30,
|
||||||||
|
2011
|
2010
|
|||||||
|
US$
|
US$
|
|||||||
|
Cash flows from operating activities
|
||||||||
|
Net income
|
11,575,663 | 12,997,362 | ||||||
|
Adjustments to reconcile net income to net cash from operating activities:
|
||||||||
|
Depreciation of property, plant and equipment
|
5,455,587 | 5,094,969 | ||||||
|
Change in fair value of financial instruments, net
|
(33,787 | ) | (212,890 | ) | ||||
|
Amortization of intangible assets
|
28,967 | 26,098 | ||||||
|
Deferred tax
|
(698,542 | ) | (137,517 | ) | ||||
|
Loss on disposal of property, plant and equipment
|
281,770 | 82,206 | ||||||
|
Equity in earnings of 50 percent or less owned persons
|
(462,131 | ) | (235,828 | ) | ||||
|
Investment income from held-to-maturity investments
|
(91,149 | ) | (23,519 | ) | ||||
|
Stock-based compensation expense
|
618,129 | 695,758 | ||||||
|
Dividends received from an equity investee
|
200,000 | 0 | ||||||
|
Changes in operating assets and liabilities:
|
||||||||
|
Restricted bank deposits
|
(1,349,764 | ) | (124,780 | ) | ||||
|
Accounts and notes receivable
|
(4,456,019 | ) | (2,273,027 | ) | ||||
|
Amounts due from affiliated companies
|
(156,725 | ) | (999 | ) | ||||
|
Inventories
|
(8,594,947 | ) | (727,349 | ) | ||||
|
Prepaid expenses and other receivables
|
(1,133,137 | ) | (2,852,453 | ) | ||||
|
Income taxes recoverable
|
(110,583 | ) | (2,474 | ) | ||||
|
Accounts payable
|
1,766,308 | 426,306 | ||||||
|
Accrued payroll and employee benefits
|
617,653 | 281,245 | ||||||
|
Customer deposits
|
391,172 | 71,926 | ||||||
|
Accrued and other liabilities
|
756,497 | 50,185 | ||||||
|
Amounts due to affiliated companies
|
(61,516 | ) | 914 | |||||
|
Income taxes payable
|
438,843 | (482,305 | ) | |||||
|
Net cash provided by operating activities
|
4,982,289 | 12,653,828 | ||||||
|
Cash flows from investing activities
|
||||||||
|
Purchase of property, plant and equipment
|
(6,796,396 | ) | (6,344,347 | ) | ||||
|
Purchase of intangible assets
|
(24,118 | ) | (1,596 | ) | ||||
|
Deposits paid for property, plant and equipment
|
(1,808,254 | ) | (1,626,850 | ) | ||||
|
Proceeds from disposal of property, plant and equipment
|
86,867 | 26,348 | ||||||
|
Proceeds from disposal of held-to-maturity investments
|
43,047,985 | 14,509,632 | ||||||
|
Purchase of held-to-maturity investments
|
(41,417,395 | ) | (15,964,287 | ) | ||||
|
Net cash used in investing activities
|
(6,911,311 | ) | (9,401,100 | ) | ||||
|
Cash flows from financing activities
|
||||||||
|
Proceeds from bank borrowings
|
15,934,314 | 0 | ||||||
|
Repayment of bank borrowings
|
(9,798,403 | ) | (6,651,786 | ) | ||||
|
Stockholder’s contribution
|
1,718,031 | 0 | ||||||
|
Proceeds from issuance of common stock-net of offering costs
|
0 | 8,793,463 | ||||||
|
Advance from investors
|
472,077 | 0 | ||||||
|
Purchase of noncontrolling interests
|
(214,757 | ) | (179,075 | ) | ||||
|
Increase in restricted bank deposits
|
(153,398 | ) | 0 | |||||
|
Net cash provided by financing activities
|
7,957,864 | 1,962,602 | ||||||
|
Effect of exchange rate changes
|
1,098,084 | 109,823 | ||||||
|
Net increase in cash and cash equivalents
|
7,126,926 | 5,325,153 | ||||||
|
Cash and cash equivalents, beginning of year
|
14,818,179 | 9,493,026 | ||||||
|
Cash and cash equivalents, end of year
|
21,945,105 | 14,818,179 | ||||||
|
Supplemental disclosures of cash flows information:
|
||||||||
|
Cash paid for interest, net of capitalized interest of US$243,334 and US$4,501 during the years ended September 30, 2011 and 2010, respectively
|
93,314 | 128,816 | ||||||
|
Cash paid for income taxes
|
2,334,317 | 2,411,456 | ||||||
See accompanying notes to consolidated financial statements.
F-5
WINNER MEDICAL GROUP INC.
NOTES TO CONSOLIDATED FINANCIAL STATEMENTS
FOR THE YEARS ENDED SEPTEMBER 30, 2011 AND 2010
|
1.
|
Organization and Background
|
Winner Medical Group Inc. (“Winner Medical” or the “Company”) was originally incorporated under another corporate name in the state of Nevada in August 1986. On February 13, 2006, the Company amended its Articles of Incorporation to change its name from Las Vegas Resorts Corporation to Winner Medical Group Inc. to reflect its new business and to accord with the names of its subsidiary companies.
Winner Medical’s business operations consist of manufacturing and marketing, researching and developing cotton-based medical dressings and medical disposables, as well as consumer products. The Company has one subsidiary registered in the Cayman Islands, fourteen wholly-owned operating subsidiaries registered in the People’s Republic of China (the “PRC”), two subsidiaries registered in Hong Kong, and two joint venture companies registered in the PRC.
On October 6, 2009, the Company’s Board of Directors approved and authorized the Company to complete a one-for-two reverse split of the Company’s common stock, decreasing the Company’s authorized capital to 247,500,000 shares of common stock and 2,500,000 shares of preferred stock, par value $0.001 per share. Pursuant to the Nevada Revised Statues, shareholder approval of this action was not required. The authorized shares, the par value per share, earning per share, common stock outstanding and weighted average common stock outstanding as referred to in these consolidated financial statements have been restated where applicable to give retroactive effect to the reverse stock split.
On September 13, 2010, a subsidiary of the Company, Winner Industries (Shenzhen) Co., Ltd., or "Winner Shenzhen", entered into the Sale and Purchase Agreement with a noncontrolling shareholder of Shanghai Winner Medical Apparatus Co., Ltd., or “Winner Shanghai”, pursuant to which Winner Shenzhen has agreed to purchase 40% equity interest representing the total interest held by the noncontrolling shareholder. Upon the completion of the transaction, Winner Shanghai became a wholly owned subsidiary of the Company. As this additional ownership interest in Winner Shanghai under generally accepted accounting principles in the United States of America is classified as an equity transaction, the Company adjusted the carrying amount of the noncontrolling interest amounted to US$111,267 to reflect the change in its ownership interest in Winner Shanghai. The difference between the cash consideration US$387,996 (equivalent to RMB2,600,000) and the carrying amount of the noncontrolling interest was recognized in additional paid-in capital of the Company, which amounted to US$499,263.
|
2.
|
Summary of Significant Accounting Policies
|
The principal activities of the Company and its subsidiaries consist of research and development, manufacturing and trading of medical dressings, medical disposables and PurCotton® products. Activities of the Company are principally conducted by its subsidiaries operating in the PRC.
Principles of consolidation- The consolidated financial statements, prepared in accordance with generally accepted accounting principles in the United States of America, include the assets, liabilities, revenues, expenses and cash flows of the Company and all its subsidiaries. All significant inter-company accounts, transactions and cash flows are eliminated on consolidation.
Equity investments, in which the Company exercises significant influence but does not control and is not the primary beneficiary, are accounted for using the equity method. The Company regularly reviews its investments to determine whether a decline in fair value below the cost basis is other than temporary.
Use of estimates- The preparation of financial statements in conformity with generally accepted accounting principles requires management to make estimates and assumptions that affect the reported amounts of assets and liabilities and disclosures of contingent assets and liabilities at the date of the financial statements and the reported amounts of revenues and expenses during the reporting period. The most significant estimates relate to allowance for uncollectible accounts receivable, inventory obsolescence, asset impairment, useful lives of property, plant and equipment and intangible assets, stock-based compensation, taxes and contingencies. These estimates may be adjusted as more current information becomes available and any adjustment could be significant. Actual results could differ from those estimates.
Intangible assets- Trademarks are measured initially at cost and amortized on a straight-line basis over their estimated useful lives, which is on average ten years.
Cash and cash equivalents- Cash and cash equivalents include cash on hand, cash accounts, interest bearing savings accounts and time certificates of deposit with a maturity of three months or less when purchased.
Restricted bank deposits- Restricted bank deposits represent the amount held by banks that is not available for use in the operations. The restriction on bank deposits is expected to be released within the next twelve months.
Held-to-maturity investments- Held-to-maturity investments represent those securities that the Company has both the intent and ability to hold to maturity and are carried at amortized cost. Interest on these investments is included in interest income. Investments classified as current have maturity dates of less than one year from the balance sheet date. Investments classified as noncurrent have maturity dates greater than one year from the balance sheet date.
F-6
WINNER MEDICAL GROUP INC.
NOTES TO CONSOLIDATED FINANCIAL STATEMENTS
FOR THE YEARS ENDED SEPTEMBER 30, 2011 AND 2010
|
2.
|
Summary of Significant Accounting Policies- Continued
|
Inventories- Inventories are stated at the lower of cost or market, determined by the weighted average method. Work-in-progress and finished goods consist of raw materials, direct labor and overhead associated with the manufacturing process.
Derivatives- Derivatives are carried at fair value and are reported as other current assets when the Company has a contractual right to receive cash from the counterparty that are potentially favorable to the Company and as other liabilities where the Company has a contractual obligation to deliver cash to a counterparty that are potentially unfavorable to the Company. The changes in fair value during the period are recorded in the consolidated statement of income and comprehensive income.
Trade accounts receivable- Trade accounts receivable are stated at the amount management expects to collect from balances outstanding at year-end. Based on management’s assessment of the credit history of customers having outstanding balances and current relationships with those customers, it has concluded that realization losses on balances outstanding at year-end will be immaterial.
Allowances for doubtful accounts receivable balances are recorded when circumstances indicate that collection is doubtful for particular accounts receivable. Management estimates such allowances based on historical evidence such as amounts that are subject to risk. Accounts receivable are written off if reasonable collection efforts are not successful.
Property, plant and equipment- Property, plant and equipment are stated at cost including the cost of improvements. Maintenance and repairs are charged to expense as incurred. Depreciable amounts are net of expected residual value of assets. Depreciation and amortization are provided on the straight-line method based on the estimated useful lives of the assets as follows:
|
Leasehold land
|
Over the lease term
|
|
Buildings
|
10 – 30 years
|
|
Plant and machinery
|
10 – 12 years
|
|
Furniture, fixtures and equipment
|
5 – 8 years
|
|
Motor vehicles
|
5 – 8 years
|
|
Leasehold improvements
|
Over the lease term
|
Construction in progress- Assets under construction are stated at cost, which includes all direct costs relating to acquisition or construction cost, including interest charges on borrowings, are capitalized as construction in progress. No depreciation is provided until the construction is completed and the assets are ready for their intended use.
Valuation of long-lived assets- The Company periodically evaluates the carrying value of long-lived assets to be held and used, including intangible assets subject to amortization, when events and circumstances warrant such a review. The carrying value of a long-lived asset is considered impaired when the anticipated undiscounted cash flow from such asset is separately identifiable and is less than its carrying value. In that event, a loss is recognized based on the amount by which the carrying value exceeds the fair market value of the long-lived asset. Fair market value is determined primarily using the anticipated cash flows discounted at a rate commensurate with the risk involved. Losses on long-lived assets to be disposed of are determined in a similar manner, except that fair market values are reduced for the cost to dispose. No impairment was recognized during the years ended September 30, 2011 and 2010.
Revenue recognition- The Company derives its revenue primarily from the sales of medical dressings and disposals and PurCotton® products. Sales of goods are recognized when title of goods sold has passed to the purchaser, usually when goods are shipped, the price is fixed or determinable as stated on the sales contract, and its collectability is reasonably assured. Customers do not have a general right of return on products shipped. Products returns to the Company were insignificant during past years.
Comprehensive income- Accumulated other comprehensive income represents foreign currency translation adjustments and is included in the consolidated statement of income and comprehensive income.
Shipping and handling costs- Shipping and handling costs related to delivery of finished goods are included in selling expenses. During the years ended September 30, 2011 and 2010, shipping and handling costs expensed to selling expenses were US$3,917,048 and US$4,497,123, respectively.
Research and development costs- Research and development costs are charged to expense when incurred and are included in operating expenses. During the years ended September 30, 2011 and 2010, research and development costs expensed to operating expenses were approximately US$1,988,139 and US$1,767,185, respectively.
Advertising and promotion costs- Advertising and promotion costs are charged to expense when incurred and are included in selling expenses. During the years ended September 30, 2011 and 2010, advertising and promotion costs expensed to selling expenses were US$411,341 and US$114,053, respectively.
F-7
WINNER MEDICAL GROUP INC.
NOTES TO CONSOLIDATED FINANCIAL STATEMENTS
FOR THE YEARS ENDED SEPTEMBER 30, 2011 AND 2010
|
2.
|
Summary of Significant Accounting Policies- Continued
|
Income taxes- Income taxes are provided on an asset and liability approach for financial accounting and reporting of income taxes. Any tax paid by subsidiaries during the year is recorded. Current tax is based on the profit or loss from ordinary activities adjusted for items that are non-assessable or disallowable for income tax purpose and is calculated using tax rates that have been enacted or substantively enacted at the balance sheet date. Deferred income tax liabilities or assets are recorded to reflect the tax consequences in future years of differences between the tax basis of assets and liabilities and the financial reporting amounts at each year-end. A valuation allowance is recognized if it is more likely than not that some portion, or all, of a deferred tax asset will not be realized.
The Company adopted Financial Accounting Standards Board (“FASB”) Accounting Standards Codification (“ASC”) 740 “Income Taxes”. ASC 740 provides guidance for recognizing and measuring uncertain tax positions, it prescribes a threshold condition that a tax position must meet for any of the benefits of the uncertain tax position to be recognized in the financial statements. ASC 740 also provides accounting guidance on derecognizing, classification and disclosure of these uncertain tax positions. The Company’s policy classifies all interest and penalties related to unrecognized tax benefits, if any, as a component of income tax provisions.
Foreign currency translation- The consolidated financial statements of the Company are presented in United States Dollars (“US$”). Transactions in foreign currencies during the year are translated into US$ at the exchange rates prevailing at the transaction dates. Monetary assets and liabilities denominated in foreign currencies at the balance sheet date are translated into US$ at the exchange rates prevailing at that date. All translation gains or losses are recorded in the consolidated statements of income statement and comprehensive income.
The subsidiaries in the PRC have their local currency, Renminbi (“RMB”), as their functional currency. The subsidiaries in Hong Kong has its local currency, Hong Kong Dollar (“HK$”), as their functional currency. On consolidation, the financial statements of the subsidiaries in the PRC and in Hong Kong are translated from RMB and HK$ into US$ in accordance with ASC 830 “Foreign Currency Translation”. Accordingly, all assets and liabilities are translated at the exchange rates prevailing at the balance sheet dates and all income and expenditure items are translated at the average rates for each of the years. The exchange rates between the RMB and the US$ used for the years ended September 30, 2011 and 2010 were RMB6.5190 and RMB6.7651, respectively. The exchange rates between the HK$ and the US$ used for the years ended September 30, 2011 and 2010 were HK$7.7749 and HK$7.7645, respectively. Translation adjustments arising from the use of different exchange rate from period to period are included as a component of stockholders’ equity as “Accumulated other comprehensive income”. Gain and losses resulting from foreign currency translations are included in other comprehensive income.
Fair Value Measurements- The Company has adopted ASC 820 “Fair Value Measurements and Disclosures”, which defines fair value, establishes a framework for measuring fair value in general accepted accounting principles, and expands disclosures about fair value measurements. It does not require any new fair value measurements, but provides guidance on how to measure fair value by providing a fair value hierarchy used to classify the source of the information.
It establishes a three-level valuation hierarchy of valuation techniques based on observable and unobservable inputs, which may be used to measure fair value and include the following:
Level 1 – Quoted unadjusted prices for identical instruments in active markets.
Level 2 – Quoted prices for similar instruments in active markets, quoted prices for identical or similar instruments in market that are not active, and model-derived valuations in which all observable inputs and significant value drivers are observable in active markets.
Level 3 – Model-derived valuations in which one or more significant inputs or significant value drivers are unobservable, including assumptions developed by the Company.
Classification within the hierarchy is determined based on the lowest level of input that is significant to the fair value measurement.
Post-retirement and post-employment benefits- The Company’s subsidiaries contribute to a state pension scheme in respect of their PRC employees and a mandatory provident fund scheme in respect of its Hong Kong employees. Other than the above, neither the Company nor its subsidiaries provide any other post-retirement or post-employment benefits.
F-8
WINNER MEDICAL GROUP INC.
NOTES TO CONSOLIDATED FINANCIAL STATEMENTS
FOR THE YEARS ENDED SEPTEMBER 30, 2011 AND 2010
|
2.
|
Summary of Significant Accounting Policies- Continued
|
Net income per share- Basic net income per share is computed by dividing net income available to common stockholders by the weighted average number of common stock outstanding during the period. Diluted net income per share gives effect to all dilutive potential ordinary stock outstanding during the year. The weighted average number of common stock outstanding is adjusted to include the number of additional common stock that would have been outstanding if the dilutive potential common stock had been issued. In computing the dilutive effect of potential common stock, the average stock price for the period is used in determining the number of treasury shares assumed to be purchased with the proceeds from the exercise options.
As of September 30, 2011 and 2010, basic and diluted net income per share calculated in accordance with ASC 260 “Earnings Per Share” are reconciled as follows:
|
Year ended September 30,
|
||||||||
|
2011
|
2010
|
|||||||
|
US$
|
US$
|
|||||||
|
Basic income per share
|
||||||||
|
Net Income attributable to Winner Medical Group Inc. for the year – numerator
|
11,535,891 | 13,090,498 | ||||||
|
Weighted average common stock outstanding – denominator
|
24,128,868 | 23,014,065 | ||||||
|
Net income attributable to Winner Medical Group Inc. per share
|
0.48 | 0.57 | ||||||
|
Diluted income per share
|
||||||||
|
Net Income attributable to Winner Medical Group Inc. for the year – numerator
|
11,535,891 | 13,090,498 | ||||||
|
Weighted average common stock outstanding – denominator
|
24,128,868 | 23,014,065 | ||||||
|
Effect of dilution
|
||||||||
|
Restricted stock units
|
420,493 | 369,467 | ||||||
|
Weighted average common stock outstanding – denominator
|
24,549,361 | 23,383,532 | ||||||
|
Net income attributable to Winner Medical Group Inc. per share
|
0.47 | 0.56 | ||||||
As of September 30, 2011 and 2010, there were no potential dilutive common shares relating to options in the Company.
Government subsidies- Certain subsidiaries of the Company located in the PRC received government subsidies from local PRC government agencies. In general, the Company records the government subsidies received as part of other income unless the subsidies received was earmarked for capital and operating expenditures or to compensate certain expense, which has been accounted for in offsetting the respective expenses.
Value added tax- All the PRC subsidiaries of the Company are subject to value added tax (“VAT”) imposed by the PRC government on its purchase and sales of goods. The output VAT is charged to customers who purchase goods from the Company and the input VAT is paid when it purchases goods from its vendors. The applicable VAT rate is 17% in general, depending on the types of products purchased and sold. The input VAT can be offset against the output VAT. The debit balance of VAT payable represents a credit against future collection of output VAT instead of a receivable.
Recent changes in accounting standards- In January 2010, the FASB issued ASU No. 2010-06, Fair Value Measurements and Disclosures (ASC 820) Improving Disclosures about Fair Value Measurements (“ASU No. 2010-06”). This pronouncement is an authoritative guidance to improve disclosures about fair value measurements. This guidance amends previous guidance on fair value measurements to add new requirements for disclosures about transfers into and out of Levels 1 and 2 and separate disclosures about purchases, sales, issuances, and settlements relating to Level 3 measurement on a gross basis rather than on a net basis as currently required. This guidance also clarifies existing fair value disclosures about the level of disaggregation and about inputs and valuation techniques used to measure fair value. ASU No. 2010-06 is effective for interim and annual reporting periods beginning after December 15, 2009, except for the disclosures about purchases, sales, issuances, and settlements in the roll forward of activity in Level 3 fair value measurements. Those disclosures are effective for fiscal years beginning after December 15, 2010, and for interim periods within those fiscal years. The Company has not completed its assessment of the impact, if any, that the disclosures of activity within Level 3 fair value measurements will have on its financial statements.
F-9
WINNER MEDICAL GROUP INC.
NOTES TO CONSOLIDATED FINANCIAL STATEMENTS
FOR THE YEARS ENDED SEPTEMBER 30, 2011 AND 2010
|
2.
|
Summary of Significant Accounting Policies- Continued
|
In May 2011, the FASB issued ASU No. 2011-04, Fair Value Measurement (ASC 820) Amendments to Achieve Common Fair Value Measurement and Disclosure Requirements in U.S. GAAP and IFRSs. This pronouncement is an authoritative guidance to amend certain measurement and disclosure requirements related to fair value measurements to improve consistency with international reporting standards. This guidance is effective prospectively for public entities for interim and annual reporting periods beginning after December 15, 2011, with early adoption by public entities prohibited, and is applicable to the Company’s fiscal year beginning October 1, 2012. The Company is currently evaluating this guidance, but does not expect its adoption will have a material effect on its consolidated financial statements.
In June 2011, the FASB issued ASU No. 2011-05, Comprehensive Income (ASC 220) Presentation of Comprehensive Income (“ASU No. 2011-05”). This pronouncement is an authoritative guidance on the presentation of comprehensive income that will require a company to present components of net income and other comprehensive income in one continuous statement or in two separate, but consecutive statements. There are no changes to the components that are recognized in net income or other comprehensive income under current GAAP. This guidance is effective for fiscal years, and interim periods within those fiscal years, beginning after December 15, 2011, with early adoption permitted. The Company took early adoption of ASU No. 2011-05.
|
3.
|
Restricted bank deposits
|
As of September 30, 2011 and 2010, the Company had total restricted bank deposits of US$1,836,491 and US$285,119, respectively. Of this, US$105,543 and US$285,119 were deposits that serve as a contract execution and product delivery guarantee, US$157,359 and US$Nil were security deposits associated with approved bank borrowing that is effective after year end, and US$1,573,589 and US$Nil were set aside capital contribution for a subsidiary to be setup subsequent to the year ended as of September 30, 2011 and 2010, respectively.
|
4.
|
Held-to-maturity investments
|
As of September 30, 2011, there are no held-to-maturity investments and as of September 30, 2010, the Company’s held-to-maturity investment securities portfolio consisted of one product purchased from Industrial and Commercial Bank of China. During the year, the Company invested in held-to-maturity investments which were money management products and all of them had matured by the year ended September 30, 2011. The carrying value of the investment security, approximate to the fair value, was US$Nil and US$1,497,607 as of September 30, 2011 and 2010, respectively. Interest on these investments was included in interest income by US$91,149 and US$23,519 during the years ended September 30, 2011 and 2010, respectively.
|
5.
|
Inventories
|
Inventories by major categories are summarized as follows:
|
September 30,
|
||||||||
|
2011
|
2010
|
|||||||
|
US$
|
US$
|
|||||||
|
Raw materials
|
10,851,917 | 5,006,853 | ||||||
|
Work-in-progress
|
7,086,688 | 4,964,070 | ||||||
|
Finished goods
|
7,470,095 | 5,974,178 | ||||||
| 25,408,700 | 15,945,101 | |||||||
|
6.
|
Property, Plant and Equipment
|
Property, plant and equipment consist of the following:
|
September 30,
|
||||||||
|
2011
|
2010
|
|||||||
|
US$
|
US$
|
|||||||
|
At cost:
|
||||||||
|
Leasehold land and buildings
|
41,562,386 | 37,319,089 | ||||||
|
Plant and machinery
|
38,381,040 | 33,064,595 | ||||||
|
Furniture, fixtures and equipment
|
4,737,124 | 3,999,971 | ||||||
|
Motor vehicles
|
1,428,265 | 1,293,408 | ||||||
|
Leasehold improvements
|
5,384,625 | 4,449,425 | ||||||
|
Total
|
91,493,440 | 80,126,488 | ||||||
|
Less: accumulated depreciation and amortization
|
(31,815,336 | ) | (25,531,331 | ) | ||||
|
Construction in progress
|
5,783,646 | 5,515,210 | ||||||
|
Net book value
|
65,461,750 | 60,110,367 | ||||||
F-10
WINNER MEDICAL GROUP INC.
NOTES TO CONSOLIDATED FINANCIAL STATEMENTS
FOR THE YEARS ENDED SEPTEMBER 30, 2011 AND 2010
|
6.
|
Property, Plant and Equipment-Continued
|
All the land in the PRC is owned by the PRC government. The government, according to PRC law, may grant to entities the right to use of land for a specified period of time (the period of the land used for ordinary industrial activities is 50 years). Thus, all of the Company’s land purchased in the PRC is considered to be leasehold land and amortized on a straight-line basis over the respective term of the right to use the land. Construction in progress mainly comprises capital expenditure for machinery not yet put to use by the Company either under installation or quality inspection stages.
Interest charges on borrowings capitalized in construction in progress were US$243,334 and US$4,501 during the years ended September 30, 2011 and 2010, respectively. Depreciation of property, plant and equipment were US$5,455,587 and US$5,094,969 during the years ended September 30, 2011 and 2010, respectively.
|
7.
|
Credit Facilities and Pledged Assets
|
The Company’s subsidiary in Shenzhen has credit lines with China Merchants Bank and Shenzhen Branch of the Industrial and Commercial Bank of China, representing trade acceptances, letter of credit, loans and overdrafts.
As of September 30, 2011, the Company had approximately $25.18 million in short-term bank credit facilities from two commercial banks. After utilizing bank loans of US$6,294,356, there are approximately US$18.89 million bank credit facilities as of September 30, 2011. The weighted average interest rates on short-term borrowings for the years ended September 30, 2011 and 2010 were 5.38% and 4.89% per annum, respectively. There are no significant covenants or other financial restrictions relating to the Company’s facilities except that at September 30, 2011, buildings with net book values of US$3,857,373 and at September 30, 2010, leasehold land and buildings with net book values of US$6,288,904, have been pledged as collateral for the above facilities. During the year ended September 30, 2011, the Company obtained charge release from the bank on its previously pledged leasehold land.
The Company has the following short-term bank loans:
|
September 30,
|
||||||||
|
2011
|
2010
|
|||||||
|
US$
|
US$
|
|||||||
|
Bank loans repayable within one year
|
6,294,356 | 0 | ||||||
|
Original currency in Renminbi
|
40,000,000 | 0 | ||||||
Bank loans as of September 30, 2011 consist of the following:
|
2011
|
|||||||
|
Loan
|
Loan period
|
US$
|
|||||
| A |
April 01, 2011 to March 02, 2012
|
3,147,178 | |||||
| B |
September 13, 2011 to March 13, 2012
|
1,573,589 | |||||
| C |
September 13, 2011 to March 13, 2012
|
1,573,589 | |||||
| 6,294,356 | |||||||
|
8.
|
Prepaid Expenses and Other Current Assets
|
Prepaid expenses and other current assets consist of the following:
|
September 30,
|
||||||||
|
2011
|
2010
|
|||||||
|
US$
|
US$
|
|||||||
|
Value added tax receivable
|
4,717,557 | 3,533,190 | ||||||
|
Advance to suppliers
|
1,626,030 | 2,054,529 | ||||||
|
Rental deposits
|
684,424 | 227,802 | ||||||
|
Other deposits
|
826,325 | 116,329 | ||||||
|
Deferred expenditure
|
130,666 | 212,823 | ||||||
|
Fair value of financial instruments
|
51,141 | 387,351 | ||||||
|
Others
|
298,361 | 397,042 | ||||||
| 8,334,504 | 6,929,066 | |||||||
F-11
WINNER MEDICAL GROUP INC.
NOTES TO CONSOLIDATED FINANCIAL STATEMENTS
FOR THE YEARS ENDED SEPTEMBER 30, 2011 AND 2010
|
9.
|
Investment in Equity Investees
|
|
September 30,
|
||||||||
|
2011
|
2010
|
|||||||
|
US$
|
US$
|
|||||||
|
Investment in L+L Healthcare Hubei Co. Ltd.
|
2,021,852 | 1,794,072 | ||||||
|
Investment in Chengdu Winner Likang Medical Appliance Co. Ltd
|
400,063 | 365,712 | ||||||
| 2,421,915 | 2,159,784 | |||||||
As of September 30, 2011, the Company held a 40% equity interest in L+L Healthcare Hubei Co., Ltd. (“L+L) in the PRC, and 49% equity interest in Chengdu Winner Likang Medical Appliance Co., Ltd. in the PRC.
The share of equity in earnings of 50 percent or less owned persons during the years ended September 30, 2011 and 2010 were US$462,131 and US$235,828, respectively.
During the year ended September 30, 2011, L+L declared and received dividends of US$200,000 to the Company which was accounted for as a reduction in investment in equity investees.
|
10.
|
Intangible Assets
|
|
September 30,
|
||||||||
|
2011
|
2010
|
|||||||
|
US$
|
US$
|
|||||||
|
Patent, cost
|
58,110 | 54,241 | ||||||
|
Trademark, cost
|
190,105 | 157,688 | ||||||
|
Less: accumulated amortization
|
(121,297 | ) | (86,850 | ) | ||||
|
Net book value
|
126,918 | 125,079 | ||||||
Amortization of intangible assets was US$28,967 and US$26,098 during the years ended September 30, 2011 and 2010, respectively.
|
11.
|
Accrued and other Liabilities
|
Accrued and other liabilities consist of the following:
|
September 30,
|
||||||||
|
2011
|
2010
|
|||||||
|
US$
|
US$
|
|||||||
|
Other taxes payable
|
1,371,974 | 521,045 | ||||||
|
Payable to vendors
|
722,862 | 440,591 | ||||||
|
Advance from investors
|
472,077 | 0 | ||||||
|
Value added tax payable
|
415,116 | 180,342 | ||||||
|
Government subsidy receipt in advance
|
399,567 | 407,756 | ||||||
|
Commission expenses
|
282,365 | 299,723 | ||||||
|
Deposit received
|
182,135 | 363,641 | ||||||
|
Accrued expenses
|
170,670 | 143,184 | ||||||
|
Transportation costs
|
157,861 | 200,370 | ||||||
|
Advance from staff
|
30,533 | 76,409 | ||||||
|
Fair value of financial instruments
|
16,482 | 174,462 | ||||||
|
Payable to noncontrolling interests
|
0 | 208,921 | ||||||
|
Others
|
32,247 | 41,001 | ||||||
| 4,253,889 | 3,057,445 | |||||||
F-12
WINNER MEDICAL GROUP INC.
NOTES TO CONSOLIDATED FINANCIAL STATEMENTS
FOR THE YEARS ENDED SEPTEMBER 30, 2011 AND 2010
|
12.
|
Income Taxes
|
United States
The Company is incorporated in the United States of America and is subject to U.S. of federal taxes. No provisions for income taxes have been made as the Company has no taxable income for the years. The applicable income tax rate for the Company for each of the years ended September 30, 2011 and 2010 was 34%.
Cayman Islands
Winner Group Limited, a wholly owned subsidiary of the Company, is incorporated in the Cayman Islands and, under the current laws of the Cayman Islands, is not subject to income taxes.
Hong Kong
Winner Medical (Hong Kong) Limited or “Winner HK”, a 60% owned subsidiary of the Company, is incorporated in Hong Kong. Winner HK is subject to Hong Kong taxation on its activities conducted in Hong Kong and income arising in or derived from Hong Kong. The applicable statutory tax rate for Winner HK for each of the years ended September 30, 2011 and 2010 was 16.5%.
On January 25, 2011, a wholly-owned subsidiary HK PurCotton Co., Ltd. or “HK PurCotton” was established. The applicable statutory tax rate for HK PurCotton was 16.5% for the year ended September 30, 2011.
PRC
Effective on January 1, 2008, the PRC Enterprise Income Tax Law, EIT Law, and Implementing Rules impose an unified enterprise income tax rate of 25% on all domestic-invested enterprises and foreign investment enterprises in the PRC, unless they qualify under certain limited exceptions.
The EIT Law gives existing foreign investment enterprises a five-year grandfather period, during which they can continue to enjoy their existing preferential tax treatments. For foreign investment enterprises that currently enjoy full exemption from PRC enterprise income tax for two years starting from the first profit-making year, followed by a 50% tax exemption for the next three years, the tax holidays are still valid.
Winner Medical (Huanggang) Co., Ltd. enjoyed its full tax exemption from January 1, 2008 and its 50% tax exemption from January 1, 2010 to the calendar year ending of 2012. Winner Medical & Textile Ltd., Chongyang enjoyed its 50% tax exemption from January 1, 2008 and was subject to an enterprise income tax rate of 25% from January 1, 2011. Shanghai Winner Medical Apparatus Co., Ltd. enjoyed its 50% tax exemption from January 1, 2009 and will be subject to an enterprise income tax of 25% from January 1, 2012. Hubei Winner Textiles Co., Ltd. was subject to an enterprise income tax rate of 25% from January 1, 2010.
On September 11, 2009, Winner Industries (Shenzhen) Co., Ltd., or "Winner Shenzhen", obtained the High and New Technology Enterprise Certificate granted by the Ministry of Science and Technology of China, the Ministry of Finance and the State Administration of Taxation. Winner Shenzhen enjoyed an applicable preferential income tax rate of 15% from January 1, 2009 to the calendar year ending of 2011.
F-13
WINNER MEDICAL GROUP INC.
NOTES TO CONSOLIDATED FINANCIAL STATEMENTS
FOR THE YEARS ENDED SEPTEMBER 30, 2011 AND 2010
|
12.
|
Income Taxes- Continued
|
The Company classifies all interest and penalties related to unrecognized tax benefits, if any, as a component of income tax provisions. The Company performed self-assessment and the Company’s liability for income taxes includes the liability for unrecognized tax benefits, interest and penalties which relate to tax years still subject to review by taxing authorities. Audit periods remain open for review until the statute of limitations has passed. The completion of review or the expiration of the statute of limitations for a given audit period could result in an adjustment to the Company’s liability for income taxes. Any such adjustment could be material to the Company’s results of operations for any given quarterly or annual period based, in part, upon the results of operations for the given period. At September 30, 2011, the management considered that the Company had no uncertain tax positions affecting its consolidated financial position and results of operations or cash flows, and will continue to evaluate for uncertain positions in the future. There are no estimated interest costs and penalties provided in the Company’s consolidated financial statements for the year ended September 30, 2011 and 2010, respectively. The Company’s uncertain tax positions related to open tax years are subject to examination by the relevant tax authorities, the major one being the China Tax Authority. The open tax years for examination in the PRC is 5 years.
The provision for income taxes consists of the following:
|
Year ended September 30,
|
||||||||
|
2011
|
2010
|
|||||||
|
US$
|
US$
|
|||||||
|
Current tax
|
||||||||
|
- PRC
|
2,608,849 | 1,907,694 | ||||||
|
- Other jurisdictions
|
60,007 | (104,510 | ) | |||||
|
Deferred tax
|
(698,542 | ) | (136,251 | ) | ||||
| 1,970,314 | 1,666,933 | |||||||
A reconciliation between the provision for income taxes computed by applying the statutory tax rate in the PRC to income before income taxes and the actual provision for income taxes is as follows:
|
Year ended September 30,
|
||||||||
|
2011
|
2010
|
|||||||
|
US$
|
US$
|
|||||||
|
Tax calculated at PRC statutory tax rate (2011: 25%; 2010: 25%)
|
3,386,494 | 3,666,074 | ||||||
|
Effect of different tax rates in various jurisdictions
|
89,806 | 100,360 | ||||||
|
Effect on opening deferred tax balances resulting from change in applicable tax rate
|
(43,762 | ) | 0 | |||||
|
Tax effect of preferential tax treatment
|
(1,554,957 | ) | (1,866,960 | ) | ||||
|
Tax effect of expenses not deductible for tax purpose
|
35,797 | 69,307 | ||||||
|
Tax effect of government subsidies not subject to tax
|
(118,086 | ) | (235,510 | ) | ||||
|
Tax effect of withholding tax on distributed profits from an equity investee
|
20,000 | 0 | ||||||
|
Change in valuation allowance
|
179,146 | 50,196 | ||||||
|
Over provision in previous years
|
(42,276 | ) | (124,399 | ) | ||||
|
Others
|
18,152 | 7,865 | ||||||
| 1,970,314 | 1,666,933 | |||||||
Had all the above tax holidays and concessions not been available, the tax charge would have been higher by US$1,554,957 and US$1,866,960 and the basic net income per share would have been lower by US$0.06 and US$0.08 for the years ended September 30, 2011 and 2010, respectively. The diluted net income per share would have been lower by US$0.06 and US$0.08 for the years ended September 30, 2011 and 2010, respectively. No income tax arose in the United States in any period covered herein.
F-14
WINNER MEDICAL GROUP INC.
NOTES TO CONSOLIDATED FINANCIAL STATEMENTS
FOR THE YEARS ENDED SEPTEMBER 30, 2011 AND 2010
|
12.
|
Income Taxes- Continued
|
The component of deferred tax assets recognized is as follows:
|
September 30,
|
||||||||
|
2011
|
2010
|
|||||||
|
Deferred tax assets
|
US$
|
US$
|
||||||
|
Current: -
|
||||||||
|
Future benefit of tax losses
|
105,481 | 130,746 | ||||||
|
Temporary differences in accrued liabilities
|
70,666 | 28,127 | ||||||
|
Temporary differences in inventories
|
156,260 | 225,475 | ||||||
|
Temporary difference in bad debt
|
44,004 | 44,393 | ||||||
| 376,411 | 428,741 | |||||||
|
Noncurrent: -
|
||||||||
|
Future benefit of tax losses
|
1,229,123 | 298,869 | ||||||
|
Temporary differences in property, plant and equipment
|
184,496 | 127,470 | ||||||
|
Valuation allowance
|
(289,530 | ) | (94,554 | ) | ||||
| 1,124,089 | 331,785 | |||||||
The component of deferred tax liabilities recognized is as follows:
|
September 30,
|
||||||||
|
2011
|
2010
|
|||||||
|
US$
|
US$
|
|||||||
|
Noncurrent: -
|
||||||||
|
Temporary differences in property, plant and equipment
|
45,025 | 42,699 | ||||||
The net operating loss attributable to those PRC subsidiaries can only be carried forward for a maximum period of five years. The unused tax losses, amounted to US$59,244, US$865,461, US$164,951, US$1,837,468 and US$2,842,810, will be expired in calendar year ending 2012, 2013, 2014, 2015 and 2016, respectively. Tax losses of a Hong Kong subsidiary can be carried forward indefinitely and the unused tax losses amounted to US$289,633.
|
13.
|
Related Party Transactions
|
During the years ended September 30, 2011 and 2010, the Company sold goods to L+L Healthcare Hubei Co., Ltd. or “L+L”, for US$257,835 and US$676, respectively. During the years ended September 30, 2011 and 2010, the Company purchased goods from L+L for US$142,444 and US$76,675, respectively and received dividends from L+L for US$200,000 and US$Nil, respectively. As of September 30, 2011 and 2010, the amount due to L+L was US$Nil and US$20,363, respectively. As of September 30, 2011 and 2010, the amount due from L+L was US$119,368 and US$248, respectively.
During the years ended September 30, 2011 and 2010, the Company sold goods to Chengdu Winner Likang Medical Appliance Co., Ltd. or “Winner Chengdu”, for US$87,439 and US$28,848, respectively, and purchased goods from it for US$90,296 and US$94,271, respectively. As of September 30, 2011 and 2010, the amount due to Winner Chengdu were US$Nil and US$37,975, respectively, and the amount due from Winner Chengdu were US$38,411 and US$751, respectively.
The amounts due from/to the above affiliated companies are unsecured, interest free and payable according to the trading credit terms.
Mr. Jianquan Li, the Chief Executive Officer of the Company, entered into agreements with the Company in relation to commodity derivatives trading activities. Under these agreements, as of September 30, 2011, the shortfall between the restricted broker margin account balance maintained for the commodity derivatives trading activities and the balance in that account on January 1, 2011 was US$1,718,031. This shortfall had been fully compensated by way of cash payment from Mr. Jianquan Li to the Company as of September 30, 2011. The Company accounts for this transaction between the Company and Mr. Jianquan Li in accordance with the Staff Accounting Bulletin Topic 5.T “Miscellaneous Accounting- Accounting for Expenses or Liabilities Paid by Principal Stockholder(s)” (ASC 225-10-S99-4), under which, the payment from Mr. Jianquan Li for the shortfall had been recognized to additional paid-in capital on September 30, 2011.
F-15
WINNER MEDICAL GROUP INC.
NOTES TO CONSOLIDATED FINANCIAL STATEMENTS
FOR THE YEARS ENDED SEPTEMBER 30, 2011 AND 2010
|
14.
|
Stock-Based Compensation
|
Stock-Based Compensation- The Company has adopted ASC 718 “Compensation—Stock Compensation”, which requires that stock-based payment transactions with employees, such as share options, be measured based on the grant-date fair value of the equity instrument issued and recognized as compensation expense over the requisite service period, with a corresponding addition to equity. Under this method, compensation cost related to employee share options or similar equity instruments is measured at the grant date based on the fair value of the award and is recognized over the period during which an employee is required to provide service in exchange for the award, which is generally the vesting period. Compensation expense is recognized for those awards that are expected to vest, which we estimate based upon historical forfeitures.
In a contract signed on May 8, 2006, the Company agreed to grant to two of its independent directors each year non-qualified options for purchasing up to 10,000 shares of the common stock of the Company, which options shall be exercisable within three years from the grant date and have an exercise price equal to the fair market value on the grant date. On May 8, 2006, a total of 4,167 non-qualified options was granted and expired on May 7, 2009. On February 6, 2007, a total of 10,000 non-qualified options was granted. On October 1, 2007, the Company and two of its independent directors agreed to increase the cash compensation to each of them by US$5,000 each in order to substitute the option compensation terms agreed in the previous contracts. The options granted on February 6, 2007 according to the previous contracts were still valid until their expiry date on February 5, 2010.
The Company uses the Black-Scholes option-pricing model, which was developed for use in estimating the fair value of traded options that have no restrictions, are fully transferable and negotiable in a free trading market, to value its options under the independent director’s contract at the grant date. Use of an option valuation model, as required by ASC 718, includes highly subjective assumptions based on long-term prediction, including the expected stock price volatility and average life of each option grant.
On February 5, 2010, 10,000 non-qualified options were expired. There was no stock-based compensation expense recorded for the year ended September 30, 2011 and 2010, respectively. Instead, the total cash compensation costs for independent directors for the years ended September 30, 2011 and 2010 were US$126,667 and US$105,000, respectively.
On October 7, 2007, the Board of Directors approved the 2008-09 Restricted Stock Unit Incentive Plan, the “2008-2009 Plan”, a stock incentive compensation program for fiscal years 2008 and 2009. The 2008-2009 Plan allows the Company to offer a variety of restricted stock unit awards to directors, senior management and key employees, where a participant will be eligible to receive one share of the Company’s common stock for each restricted stock unit that vests upon the achievement of corporate and individual objectives and such participant’s continued employment as of the applicable vesting date.
Under the 2008-2009 Plan, the Company granted 500,000 units out of the total 600,000 authorized restricted stock units on October 7, 2007. Entitled employees are eligible to vest the first 50% of the total number of restricted stock awarded on October 7, 2010 and the second 50% on October 7, 2011 if the target of corporate net income attributable to Winner Medical Group Inc. and annual sales objectives, and the participant’s individual performance objectives are fulfilled. The estimated value of award as of the grant date is based on the market price of the common stock as quoted on the NASDAQ.com as of October 7, 2007, which was $3.60 per share, and assumes that the individual achieves the applicable corporate and individual objectives set forth in the award.
On October 15, 2008, the Board of Directors approved the granting of the remaining 100,000 units out of the total 600,000 authorized restricted stock units under the 2008-2009 Plan. Entitled employees are eligible to vest the first 50% of the total number of restricted stock awarded on October 7, 2010 and the second 50% on October 7, 2011 if the target of corporate net income attributable to Winner Medical Group Inc. and annual sales objectives, and the participant’s individual performance objectives are fulfilled. The estimated value of award as of grant date is based on the market price of the common stock as quoted on the NASDAQ.com as of October 15, 2008, which was US$0.50 per share, and assumes that the individual achieves of the applicable corporate and individual objectives set forth in the award.
On September 8, 2009, the Board of Directors approved the 2010-11 Restricted Stock Unit Incentive Plan, the “2010-2011 Plan”, a stock incentive compensation program for fiscal years 2010 and 2011. The 2010-2011 Plan allows the Company to offer a variety of restricted stock unit awards to directors, senior management and key employees, where a participant will be eligible to receive one share of the Company’s common stock for each restricted stock unit that vests upon the achievement of corporate and individual objectives and such participant’s continued employment as of the applicable vesting date.
F-16
WINNER MEDICAL GROUP INC.
NOTES TO CONSOLIDATED FINANCIAL STATEMENTS
FOR THE YEARS ENDED SEPTEMBER 30, 2011 AND 2010
14. Stock-Based Compensation-Continued
Under the 2010-2011 Plan, the Company granted 250,000 units out of the total 300,000 authorized restricted stock units on September 8, 2009. Entitled employees are eligible to vest the first 50% of the total number of restricted stock awarded on September 8, 2012 and the second 50% on September 8, 2013 if the target of corporate net income attributable to Winner Medical Group Inc. and annual sales objectives, and the participant’s individual performance objectives are fulfilled. The estimated value of award as of grant date is based on the market price of the common stock as quoted on the NASDAQ.com as of September 8, 2009, which was $4.40 per share, and assumes that the individual achieves the applicable corporate and individual objectives set forth in the award.
On September 28, 2010, the Board of Directors approved the granting of the remaining 50,000 units out of the total 300,000 authorized restricted stock units under the 2010-2011 Plan. Entitled employees are eligible to vest the first 50% of the total number of restricted stock awarded on September 8, 2012 and the second 50% on September 8, 2013 if the target of corporate net income attributable to Winner Medical Group Inc. and annual sales objectives, and the participant’s individual performance objectives are fulfilled. The estimated value of award as of grant date is based on the market price of the common stock as quoted on the NASDAQ.com as of September 28, 2010, which was US$4.56 per share, and assumes that the individual achieves the applicable corporate and individual objectives set forth in the award.
On July 27, 2009, the Company’s subsidiary in Shenzhen entered into a 5-year consulting agreement with a consulting firm for receiving consulting services related to developing strategies for rolling out the Company’s own branded consumer products in China. Pursuant to the agreement, the Company granted 500,000 restricted stock units from the Company’s 2006 Equity Incentive Plan to the consulting firm as compensation for the services. As of September 18, 2010, both parties decided to terminate the co-operation relationship and mutually waived the share-based compensation terms agreed in previous agreement.
On October 6, 2010, the Board of Directors approved the 2011-2013 Restricted Stock Unit Incentive Plan, the "2011-2013 Plan", a stock incentive compensation program for fiscal years 2011 to 2013. The 2011-2013 Plan allows the Company to offer a variety of restricted stock unit awards to directors, senior management and key employees of the Company’s wholly-owned subsidiary, Shenzhen PurCotton Technology Co., Ltd. The participant will be eligible to receive one share of the Company’s common stock for each restricted stock unit that vests upon the achievement of corporate and individual objectives and such participant’s continued employment as of the applicable vesting date.
Under the 2011-2013 Plan, the Company granted 300,000 units out of the total 500,000 authorized restricted stock units on October 6, 2010. On each of October 6, 2012, October 6, 2013 and October 6, 2014, a participant will be eligible to vest up to 1/3 of the total number of restricted stock units underlying an award if the target of corporate net income attributable to Winner Medical Group Inc. and annual sales objectives, and the participant’s individual performance objectives are fulfilled. The estimated value of award as of grant date is based on the market price of the common stock as quoted on the NASDAQ.com as of October 6, 2010, which was $5.31 per share, and assumes that the individual achieves the applicable corporate and individual objectives set forth in the award.
On October 7, 2010, under the 2008-2009 Plan, the Company issued 179,507 shares of the Company’s common stock to those entitled employees, representing vesting of the first 50% of the total number of restricted stock awarded.
Pursuant to the one-year investor relations consulting agreement signed between the Company and an investor relations consultant firm, 10,000 restricted stock units were granted to the consultant firm on the agreement signature date, which was May 1, 2010. After evaluating and assessing the accomplishments were achieved by the consultant firm, 10,000 restricted stock units were vested on May 2, 2011. The estimated value of the restricted stock units is based on the market price of the common stock as quoted on the NASDAQ.com as of May 2, 2011, which was US$4.99.
The Company recorded stock-based compensation expense in operating expenses of US$618,129 and US$695,758 for the years ended September 30, 2011 and 2010, respectively.
Management considered that the fair value of outstanding restricted stock unit is approximate to the market value of the Company’s common stock. As at September 30, 2011, the market value of the Company’s common stock was US$3.17.
As of September 30, 2011, a cumulative of 923,306 nonvested restricted stock units have been cancelled and 179,507 restricted stock units were vested. The total fair value of restricted stock units vested during the years ended September 30, 2011 and 2010 was US$536,726 and US$Nil, respectively.
F-17
WINNER MEDICAL GROUP INC.
NOTES TO CONSOLIDATED FINANCIAL STATEMENTS
FOR THE YEARS ENDED SEPTEMBER 30, 2011 AND 2010
14. Stock-Based Compensation-Continued
A summary of the restricted stock units activity is as follows:
|
Incentive plan on marketing service
|
2008-09 plan
|
2010-11 plan
|
2011-13 plan
|
Total
|
Weighted average grant date fair value
|
|||||||||||||||||||
|
Nonvested units outstanding at September 30, 2009
|
0 | 524,500 | 250,000 | 0 | 774,500 | 3.46 | ||||||||||||||||||
|
Granted
|
500,000 | 0 | 50,000 | 0 | 550,000 | 2.87 | ||||||||||||||||||
|
Cancelled
|
(500,000 | ) | (45,750 | ) | (12,750 | ) | 0 | (558,500 | ) | 2.78 | ||||||||||||||
|
Nonvested units outstanding at September 30, 2010
|
0 | 478,750 | 287,250 | 0 | 766,000 | 3.53 | ||||||||||||||||||
|
Granted
|
0 | 0 | 0 | 300,000 | 300,000 | 5.31 | ||||||||||||||||||
|
Cancelled
|
0 | (67,618 | ) | (49,688 | ) | (172,000 | ) | (289,306 | ) | 4.60 | ||||||||||||||
|
Vested
|
0 | (179,507 | ) | 0 | 0 | (179,507 | ) | 2.99 | ||||||||||||||||
|
Nonvested units outstanding at September 30, 2011
|
0 | 231,625 | 237,562 | 128,000 | 597,187 | 4.07 | ||||||||||||||||||
As of September 30, 2011, the unrecognized stock-based compensation expense, net of expected forfeitures, for 2008-2009 Plan, 2010-2011 Plan and 2011-2013 Plan was US$Nil, US$411,305 and US$447,731, respectively (for a total of US$859,036), and are expected to be amortized over the weighted average period of 1.07 years.
|
15.
|
Commitments and Contingencies
|
Operating leases- The Company was obligated under operating leases requiring minimum rentals as follows:
|
Year ending September 30,
|
US$
|
|||
|
2012
|
2,532,887 | |||
|
2013
|
1,315,451 | |||
|
2014
|
447,749 | |||
|
2015
|
98,349 | |||
|
On and after 2016
|
0 | |||
|
Total minimum lease payments
|
4,394,436 | |||
Rental expenses under operating leases included in the consolidated statements of income and comprehensive income were US$2,469,587 and US$811,673 for the years ended September 30, 2011 and 2010, respectively.
Purchase obligations- The Company has signed agreements with suppliers and other parties to purchase plant and machinery, and complete the construction in progress with estimated non-cancelable obligations of US$4,233,939 and US$2,610,641 as of September 30, 2011 and 2010, respectively.
F-18
WINNER MEDICAL GROUP INC.
NOTES TO CONSOLIDATED FINANCIAL STATEMENTS
FOR THE YEARS ENDED SEPTEMBER 30, 2011 AND 2010
|
16.
|
Financial Instruments and Derivatives
|
The Company uses financial instruments to manage its exposures to movements in foreign exchange rates and commodity prices. The use of these financial instruments modifies the Company’s exposure to these risks with the goal of reducing the risk of cost to the Company. The Company does not use derivative financial instruments for speculative or trading purposes, nor does it hold or issue leveraged derivative financial instruments.
The following table summarizes the Company’s fair value of derivatives:
|
Consolidated
|
September 30,
|
||||||||
|
Balance Sheet Presentation
|
2011
|
2010
|
|||||||
|
US$
|
US$
|
||||||||
|
Derivatives not designated as hedging instruments
|
|||||||||
|
Fair value of foreign exchange forward contracts
|
Other current assets
|
51,141 | 387,351 | ||||||
|
Fair value of foreign exchange forward contracts
|
Other liabilities
|
16,482 | 174,462 | ||||||
Foreign exchange derivatives - The Company’s operations are exposed to market risk primarily due to changes in currency exchange rates. In order to manage such risks so as to reduce volatility on earnings and cash flows, the Company enters into several foreign exchange forward contracts with a commercial bank to hedge for future trade receipts in U.S. dollars against RMB. The total outstanding foreign exchange forward contracts amounted to US$4,000,000 (representing US$2,000,000 selling of U.S. dollars and US$2,000,000 buying of U.S. dollars) as of September 30, 2011. The Company’s foreign exchange forward contracts are classified as Level 2 in the fair value hierarchy under ASC 820 since the quoted prices of these foreign exchange forward contracts can be obtained directly from commercial bank.
The impact on earnings from derivatives activity, including changes in the fair value of derivatives for the years ended September 30, 2011 and 2010 are as follows:
|
Presentation of gain or loss
|
Year ended
September 30,
|
||||||||
|
recognized on derivatives
|
2011
|
2010
|
|||||||
|
|
US$
|
US$
|
|||||||
|
Derivatives not designated as hedging instruments
|
|||||||||
|
Foreign currency forward contracts
|
Unrealized exchange gain
|
49,854 | 387,351 | ||||||
|
Unrealized exchange loss
|
(16,067 | ) | (174,462 | ) | |||||
|
Other operating income, net
|
33,787 | 212,889 | |||||||
The realized gain on derivatives included in other operating income, net was US$180,349 and US$32,835 during the years ended September 30, 2011 and 2010, respectively.
Commodity derivatives - Cotton is the primary raw material used to manufacture many of the Company’s products and is purchased at market prices. Starting from October 2010, the Company uses commodity financial instruments to manage the risk of cotton purchase cost. Although the commodity financial instruments are economic hedges of specified risks, they are not designated or accounted for as hedging instruments. The commodity financial instruments are valued at fair value. The commodity derivatives require collateral, referred to as margin, in the form of cash. As of September 30, 2011, there was no outstanding commodity financial instruments and the Company’s restricted broker margin account was US$Nil. The Company’s commodity financial instruments are classified as Level 1 in the fair value hierarchy under ASC 820 since the quoted unadjusted prices of these commodity financial instruments are available in active markets.
The realized loss from commodity financial instruments were US$1,859,945 and US$Nil during the years ended September 30, 2011 and 2010, respectively.
F-19
WINNER MEDICAL GROUP INC.
NOTES TO CONSOLIDATED FINANCIAL STATEMENTS
FOR THE YEARS ENDED SEPTEMBER 30, 2011 AND 2010
|
17.
|
Stockholders’ Equity
|
Common Stock
On April 27, 2010, the Company entered into a purchase agreement with Roth Capital Partners, LLC, relating to the public offering of 1,380,000 shares of the Company’s common stock, par value $0.001 per share at a price of $6.10 per share. The Company also granted the investors a 30-day option to purchase up to an additional 207,000 shares of the Company’s common stock for over-allotments, if any. Including the additional shares issued on May 19, 2010 due to over-allotments, the Company issued 1,587,000 shares of common stock in total and raised a total of US$9,680,700 in gross proceeds, which left the Company with US$8,793,463 in net proceeds after the deduction of offering expenses for US$887,237, including the placement agent fee for US$532,439.
On October 7, 2010, under the 2008-2009 Plan, the Company issued 179,507 shares of the Company’s common stock to those entitled employees, representing vesting of the first 50% of the total number of restricted stock awarded.
On July 14, 2011, the Company issued 10,000 shares of the Company’s common stock to an investor relations consultant firm under a one-year investor relations consulting agreement.
|
18.
|
Employee Retirement Benefits
|
The Company contributes to a state pension scheme organized by municipal and provincial governments with respect to its employees in the PRC. The expenses related to this scheme are included in operating expenses, which are calculated at a range of 8%-29% of the average monthly salary, were US$1,461,170 and US$1,222,516 during the years ended September 30, 2011 and 2010, respectively.
According to the Mandatory Provident Fund ("MPF") legislation regulated by the Mandatory Provident Fund Schemes Authority in Hong Kong, the Company is required to participate in a MPF scheme operated by approved trustees in Hong Kong and to make contribution for its eligible employees. The contributions borne by the Company are included in operating expenses, which are calculated at 5% of the salaries and wages (monthly contribution is limited to 5% of HK$20,000 for each eligible employee) as calculated under the MPF legislation. The expenses related to the MPF were US$32,396 and US$19,905 during the years ended September 30, 2011 and 2010, respectively.
|
19.
|
Operating Risk
|
Concentrations of credit risk and major customers- A substantial percentage of the Company’s sales are made to two customers (Sakai Shoten Co., Ltd and Tyco Healthcare Co., Ltd.), and are typically sold on an open account basis. The sales to Sakai Shoten Co., Ltd. accounted for both 12% of the total net sales for the years ended September 30, 2011 and 2010. The sales to Tyco Healthcare Co., Ltd accounted for both 10% of the total net sales for the years ended September 30, 2011 and 2010. Sales to the above customers are attributed to medical products segment.
A substantial percentage of the Company’s accounts receivable are made of four customers with balances that represented the following percentages of total accounts receivable at September 30, 2011 and 2010; Molnlycke Health Care AB, 15.14% and 14.11%; Tyco Healthcare Co., Ltd., 10.05% and 14.38%; Richardson Healthcare Ltd., 5.00% and 10.98%; and Sakai Shoten Co., Ltd., 7.47% and 10.34%; respectively. The Company has not experienced any significant difficulty in collecting its accounts receivable in the past and is not aware of any financial difficulties being experienced by its major customers. There was bad debt recovery of US$81,159 and US$17,948 during the years ended September 30, 2011 and 2010, respectively.
Interest rate risk-The interest rates of bank and other borrowings ranged from 6.36% to 7.87%. Other financial assets and liabilities do not have material interest rate risk.
Credit risk- In order to reduce the risk of inability to collect accounts receivable, the Company entered into an insurance policy with China Export & Credit Insurance Corporation effective on January 1, 2011. This insurance policy will expire on December 31, 2011 and is automatically renewable subject to a one month written notice given by either party. The maximum insurance coverage from China Export & Credit Insurance Corporation is US$2 million.
Foreign currency risk- The value of the Renminbi, the main currency used in the PRC, fluctuates and is affected by, among other things, changes in China's political and economic conditions. In addition, RMB is not readily convertible into US$ or other foreign currencies. All foreign exchange transactions continue to take place either through the Bank of China or other banks authorized to buy and sell foreign currencies at the exchange rate quoted by the People’s Bank of China. The conversion of RMB into foreign currencies such as the US$ has been generally based on rates set by the People's Bank of China, which are set daily based on the previous day's interbank foreign exchange market rates and current exchange rates on the world financial markets. On September 30, 2011 and 2010, the exchange rates of RMB against US$ were 6.3549 and 6.7011, respectively; the appreciation of RMB against US$ was 5.17%. On September 30, 2011 and 2010, the exchange rates of RMB against Euro were 8.6328 and 9.1329, respectively. This floating exchange rate, and any appreciation of the RMB that may result from such rate, could have various adverse effects on the Company’s business.
The Company’s currency exchange rate risks come primarily from the sales of products to international customers. If the RMB appreciates against foreign currencies, it will make the Company’s sale prices more expensive, thus its sales may decline.
F-20
WINNER MEDICAL GROUP INC.
NOTES TO CONSOLIDATED FINANCIAL STATEMENTS
FOR THE YEARS ENDED SEPTEMBER 30, 2011 AND 2010
|
20.
|
Statutory reserves
|
According to the laws and regulations in the PRC, the Company is required to provide for certain statutory funds, namely, a reserve fund, by an appropriation from net profit after taxation but before dividend distribution based on the local statutory financial statements of the PRC subsidiaries prepared in accordance with the accounting principles and relevant financial regulations.
The Company’s wholly owned subsidiaries in the PRC are required to allocate at least 10% of its net profit to the reserve fund until the balance of such fund has reached 50% of its registered capital. Appropriations of enterprise expansion fund are determined at the discretion of its directors.
The reserve fund can only be used, upon approval by the relevant authority, to offset accumulated losses or increase capital. The enterprise expansion fund can only be used to increase capital upon approval by the relevant authority.
|
21.
|
Geographical Information
|
The business of the Company is manufacturing and trading of medical dressings and medical disposables. All of the Company’s sales are from the Company’s operation within the PRC, and a majority of the Company’s long-lived assets are located in the PRC. The Company’s sales to customers by geographic destination are analyzed as follows:
|
Year ended September 30,
|
||||||||
|
2011
|
2010
|
|||||||
|
US$
|
US$
|
|||||||
|
Europe
|
52,099,557 | 42,277,885 | ||||||
|
PRC
|
35,555,145 | 22,307,819 | ||||||
|
America
|
33,643,498 | 24,480,386 | ||||||
|
Japan
|
21,402,023 | 18,225,952 | ||||||
|
Others
|
7,196,201 | 7,738,609 | ||||||
|
Total net sales
|
149,896,424 | 115,030,651 | ||||||
Sales to countries in excess of 10% of total net sales for the years ended September 30, 2011 and 2010 are as follows:
|
Year ended September 30,
|
||||||||
|
2011
|
2010
|
|||||||
|
US$
|
US$
|
|||||||
|
PRC
|
35,555,145 | 22,307,819 | ||||||
|
United States of America
|
23,963,784 | 20,083,799 | ||||||
|
Japan
|
21,402,023 | 18,225,952 | ||||||
F-21
WINNER MEDICAL GROUP INC.
NOTES TO CONSOLIDATED FINANCIAL STATEMENTS
FOR THE YEARS ENDED SEPTEMBER 30, 2011 AND 2010
|
22.
|
Segment information
|
The Company has two reportable segments: medical products (medical care, wound care) and PurCotton® products. The Company’s reportable segments are strategic business units that offer different products and services. They are managed separately because each business requires different technology and marketing strategies.
Contributions of the major activities, profitability information and asset information of the Company’s reportable segments for the years ended September 30, 2011 and 2010 are as follows:
|
Year ended September 30,
|
||||||||
|
2011
|
2010
|
|||||||
|
Net Sales:
|
US$
|
US$
|
||||||
|
Segment:
|
|
|||||||
|
Medical products
|
130,798,078 | 104,902,922 | ||||||
|
PurCotton® products
|
19,098,346 | 10,127,729 | ||||||
|
Consolidated total
|
149,896,424 | 115,030,651 | ||||||
|
Gross Profits:
|
||||||||
|
Segment:
|
||||||||
|
Medical products
|
34,820,008 | 31,146,204 | ||||||
|
PurCotton® products
|
6,030,132 | 3,411,155 | ||||||
|
Consolidated total
|
40,850,140 | 34,557,359 | ||||||
|
Income from operations before taxes:
|
||||||||
|
Segment:
|
||||||||
|
Medical products
|
16,873,381 | 14,080,869 | ||||||
|
PurCotton® products
|
(3,327,404 | ) | 583,426 | |||||
|
Consolidated total
|
13,545,977 | 14,664,295 | ||||||
|
Net Income attributable to Winner Medical Group Inc.:
|
||||||||
|
Segment:
|
||||||||
|
Medical products
|
14,024,765 | 12,291,568 | ||||||
|
PurCotton® products
|
(2,488,874 | ) | 798,930 | |||||
|
Consolidated total
|
11,535,891 | 13,090,498 | ||||||
|
Depreciation and Amortization:
|
||||||||
|
Segment:
|
||||||||
|
Medical products
|
3,314,284 | 3,350,691 | ||||||
|
PurCotton® products
|
2,170,270 | 1,770,376 | ||||||
|
Consolidated total
|
5,484,554 | 5,121,067 | ||||||
|
September 30,
|
||||||||
|
2011
|
2010
|
|||||||
|
Total Assets:
|
US$
|
US$
|
||||||
|
Segment:
|
|
|
||||||
|
Medical products
|
109,317,729 | 80,906,150 | ||||||
|
PurCotton® products
|
45,578,410 | 38,069,845 | ||||||
|
Segment total
|
154,896,139 | 118,975,995 | ||||||
|
Reconciliation to consolidated totals:
|
||||||||
|
Elimination of other receivable from inter-segments
|
(4,977,452 | ) | 0 | |||||
|
Consolidated total
|
149,918,687 | 118,975,995 | ||||||
F-22
WINNER MEDICAL GROUP INC.
NOTES TO CONSOLIDATED FINANCIAL STATEMENTS
FOR THE YEARS ENDED SEPTEMBER 30, 2011 AND 2010
|
23.
|
Subsequent events
|
On October 7, 2011, under the 2008−2009 Plan, the Company issued 231,625 shares of the Company’s common stock to those entitled employees, representing their eligibility to vest the second 50% of the total number of restricted stock units awarded.
On November 3, 2011, the Company’s Board of Directors approved the 2012−13 Restricted Stock Unit Incentive Plan, the "2012−2013 Plan", a stock incentive compensation program for fiscal years 2012 and 2013. This 2012−2013 Plan allows the Company to offer a variety of restricted stock unit awards and options to directors, senior management and key employees of the Company. The participant will be eligible to receive one share of the Company’s common stock for each restricted stock unit and/or purchase one share of the Company’s common stock for each option that vests upon the achievement of corporate and individual objectives and such participant’s continued employment as of the applicable vesting date.
F-23
EXHIBIT INDEX
|
Exhibit No.
|
Description
|
|
|
2.1
|
Share Exchange Agreement, dated December 16, 2005, among the registrant, Winner Group Limited and its stockholders [incorporated by reference to Exhibit 2.1 to the registrant’s current report on Form 8-K filed on December 16, 2005 in commission file number 33-10513-LA]
|
|
|
3.1
|
Articles of Incorporation of the registrant as filed with the Secretary of State of the State of Nevada on August 7, 1986, as amended to date. [incorporated by reference to Exhibit 3.1 to the registrant’s current report on Form 8-K filed on December 16, 2005 in commission file number 33-10513-LA]
|
|
|
3.2
|
Amended and Restated Bylaws of the registrant adopted on December 16, 2005. [incorporated by reference to Exhibit 3.2 to the registrant’s current report on Form 8-K filed on December 16, 2005 in commission file number 33-10513-LA]
|
|
|
10.1
|
English translation of Licensing Agreement between Winner Group Limited and Jianquan Li, dated December 1, 2005 [incorporated by reference to Exhibit 10.1 to the registrant’s current report on Form 8-K filed on December 16, 2005 in commission file number 33-10513-LA]
|
|
|
10.2
|
English translation of Licensing Agreement between Winner Medical & Textile Ltd. Zhuhai and Nianfu Huo, dated August 5, 2005 [incorporated by reference to Exhibit 10.2 to the registrant’s current report on Form 8-K filed on December 16, 2005 in commission file number 33-10513-LA]
|
|
|
10.3
|
English translation of Equipment Purchase Contract between Winner Medical (Huanggang) Co., Ltd. and Zhengzhou Textile Machinery Co., Ltd, dated July 12, 2005 [incorporated by reference to Exhibit 10.3 to the registrant’s current report on Form 8-K filed on December 16, 2005 in commission file number 33-10513-LA]
|
|
|
10.4
|
English translation of Water Supply Agreement between Winner Medical & Textile Ltd. Tianmen and Hubei Winner Textiles Co., Ltd., dated August 2, 2004 [Incorporated by reference to Exhibit 10.4 to the registrant’s current report on Form 8-K filed on December 16, 2005 in commission file number 33-10513-LA]
|
|
|
10.5
|
2006 Incentive Equity Plan [incorporated by reference to Exhibit 10 to the registrant’s registration statement on Form S-8 filed on April 19, 2006]
|
|
|
10.6
|
Independent Director’s Contract, dated as of May 8, 2006, by and between Winner Medical Group Inc. and Larry Goldman, CPA [incorporated by reference to Exhibit 10.1 to the registrant’s current report on Form 8-K filed on May 11, 2006]
|
|
|
10.7
|
Independent Director’s Contract, dated as of January 14, 2010, by and between Winner Medical Group Inc. and Lawrence Xiaoxia Pan. [incorporated by reference to Exhibit 10.5 to the registrant’s current report on Form 8-K filed on January 15, 2010]
|
|
|
10.8
|
Independent Director’s Contract, dated as of May 8, 2006, by and between Winner Medical Group Inc. Dr. Horngjon Shieh [incorporated by reference to Exhibit 10.3 to the registrant’s current report on Form 8-K filed on May 11, 2006]
|
|
|
10.9
|
Indemnification Agreement, dated as of May 8, 2006, by and between Winner Medical Group Inc. and Larry Goldman, CPA [Incorporated by reference to Exhibit 10.4 to the registrant’s current report on Form 8-K filed on May 11, 2006]
|
|
|
Indemnification Agreement, dated as of January 14, 2010, by and between Winner Medical Group Inc. and Lawrence Xiaoxia Pan, Esq. [incorporated by reference to Exhibit 10.5 to the registrant’s current report on Form 8-K filed on January 15, 2010]
|
||
|
10.11
|
Indemnification Agreement, dated as of May 8, 2006, by and between Winner Medical Group Inc. and Dr. Horngjon Shieh [incorporated by reference to Exhibit 10.6 to the registrant’s current report on Form 8-K filed on May 11, 2006]
|
|
|
10.12
|
English translation of Employment Agreement, dated January 1, 2008, by and between Winner Industries (Shenzhen) Co., Ltd. and Jianquan Li. [incorporated by reference to Exhibit 10.12 to the registrant’s current report on Form 10-K filed on December 9, 2008]
|
|
|
English translation of Employment Agreement, dated January 1, 2008, by and between Winner Industries (Shenzhen) Co., Ltd. and Xiuyuan Fang. [incorporated by reference to Exhibit 10.13 to the registrant’s current report on Form 10-K filed on December 9, 2008]
|
||
|
10.15
|
English translation of Employment Agreement, dated January 1, 2008, by and between Winner Industries (Shenzhen) Co., Ltd. and Nianfu Huo. [incorporated by reference to Exhibit 10.15 to the registrant’s current report on Form 10-K filed on December 9, 2008]
|
|
|
10.16
|
Registrant’s 2006 Equity Incentive Plan (as amended October 7, 2007) [incorporated by reference to Exhibit 10.1 to the registrant’s current report on Form 8-K filed on October 11, 2006]
|
|
|
10.17
|
Registrant’s 2008-2009 Restricted Stock Unit Incentive Plan (as adopted October 7, 2007) [incorporated by reference to Exhibit 10.2 to the registrant’s current report on Form 8-K filed on October 11, 2006]
|
|
|
Registrant’s 2010-2011 Restricted Stock Unit Incentive Plan (as adopted October 7, 2010) [incorporated by reference to Exhibit 10.2 to the registrant’s current report on Form 8-K filed on October 11, 2006]
|
||
|
10.18
|
Registrant’s 2011-2013 Restricted Stock Unit Incentive Plan (as adopted October 7, 2007) [incorporated by reference to Exhibit 10.18 to the registrant’s current report on Form 8-K filed on October 12, 2010]
|
54
|
14
|
Code of ethics, dated May 9, 2006. [incorporated by reference to Exhibit 14 to the registrant’s current report on Form 8-K filed on May 11, 2006]
|
|
|
21
|
List of subsidiaries of the registrant*
|
|
|
23.1
|
Consent of BDO Limited*
|
|
|
31.1
|
Certification of the Chief Executive Officer pursuant to Rules 13a-14(a) and 15d-14(a), as adopted pursuant to Section 302 of the Sarbanes-Oxley Act of 2002*
|
|
|
31.2
|
Certification of the Chief Financial Officer pursuant to Rules 13a-14(a) and 15d-14(a), as adopted pursuant to Section 302 of the Sarbanes-Oxley Act of 2002.*
|
|
|
32.1
|
Certification of the Chief Executive Officer pursuant to 18 U.S.C Section 1350, as adopted pursuant to Section 906 of the Sarbanes-Oxley Act of 2002.*
|
|
|
32.2
|
Certification of the Chief Financial Officer pursuant to 18 U.S.C Section 1350, as adopted pursuant to Section 906 of the Sarbanes-Oxley Act of 2002.*
|
|
|
*
|
filed herewith
|
55