Attached files
| file | filename |
|---|---|
| EX-21 - WINNER MEDICAL GROUP INC | v168276_ex21.htm |
| EX-32.2 - WINNER MEDICAL GROUP INC | v168276_ex32-2.htm |
| EX-31.2 - WINNER MEDICAL GROUP INC | v168276_ex31-2.htm |
| EX-32.1 - WINNER MEDICAL GROUP INC | v168276_ex32-1.htm |
| EX-23.1 - WINNER MEDICAL GROUP INC | v168276_ex23-1.htm |
| EX-31.1 - WINNER MEDICAL GROUP INC | v168276_ex31-1.htm |
UNITED
STATES
SECURITIES
AND EXCHANGE COMMISSION
WASHINGTON,
D.C. 20549
FORM
10-K
ANNUAL
REPORT
PURSUANT
TO SECTION 13 OR 15(d)
OF
THE SECURITIES EXCHANGE ACT OF 1934
(Mark
One)
|
x
|
ANNUAL REPORT PURSUANT TO
SECTION 13 OR
15(d) OF THE SECURITIES EXCHANGE ACT OF
1934
|
For
the fiscal year ended September 30, 2009
Or
| o |
¨
|
TRANSITION REPORT PURSUANT TO
SECTION 13 OR 15(d) OF THE SECURITIES EXCHANGE ACT OF
1934
|
For
the transition period
from to
Commission
file number: 000-16547
WINNER
MEDICAL GROUP INC.
(Exact
Name of Registrant as Specified in Its Charter)
|
Nevada
|
33-0215298
|
|
(State
or other jurisdiction of incorporation or
|
(I.R.S.
Employer
|
|
organization)
|
Identification
No.)
|
Winner
Industrial Park, Bulong Road
Longhua,
Shenzhen City, 518109
People’s
Republic of China
(Address
of principal executive offices)
Registrant’s
telephone number, including area code: (86) 755-28138888
Securities
registered pursuant to Section 12(b) of the Act:
None
Securities
registered pursuant to Section 12(g) of the Act:
Common
stock, $.001 par value
Indicate
by check mark if the registrant is a well-known seasoned issuer, as defined in
Rule 405 of the Securities Act.
Yes o No x
Indicate
by check mark if the registrant is not required to file reports pursuant to
Section 13 or Section 15(d) of the Act. Yes o
No x
Indicate
by check mark whether the registrant (1) has filed all reports required to be
filed by Section 13 or 15(d) of the Securities Exchange Act of 1934 during the
preceding 12 months (or for such shorter period that the registrant was required
to file such reports), and (2) has been subject to such filing requirements for
the past 90 days.
Yes x No o
Indicate
by check mark if disclosure of delinquent filers pursuant to Item 405 of
Regulation S-K is not contained herein, and will not be contained, to the best
of registrant’s knowledge, in definitive proxy or information statements
incorporated by reference in Part III of this Form 10-K or any amendment to this
Form 10-K. x
Indicate
by check mark whether the registrant is a large accelerated filer, an
accelerated filer, or a non-accelerated filer or a small reporting company. See
definition of “large accelerated filer”, “accelerated filer” and “small
reporting company” in Rule 12b-2 of the Securities Exchange Act of
1934.
|
Large
accelerated filer
o
|
Accelerated
filer
o
|
Non-accelerated
filer
o
|
Small
reporting company
x
|
Indicate
by check mark whether the registrant is a shell company (as defined in Rule
12b-2 of the Securities Exchange Act). Yes o
No x
As of
December 7, 2009, there were 22,363,675 shares of the Registrant’s common stock
outstanding.
WINNER
MEDICAL GROUP INC.
FORM
10-K
For
the Fiscal Year Ended September 30, 2009
|
Number
|
Page
|
||
|
PART I
|
|||
|
Item 1.
|
Description
of Business
|
4
|
|
|
Item 1A.
|
Risk
Factors
|
13
|
|
|
Item 1B.
|
Unresolved
Staff Comments
|
19
|
|
|
Item 2.
|
Properties
|
19
|
|
|
Item 3.
|
Legal
Proceedings
|
21
|
|
|
Item 4.
|
Submission
of Matters to a Vote of Security Holders
|
21
|
|
|
PART II
|
|||
|
Item 5.
|
Market
for Registrant’s Common Equity, Related Stockholder Matters and
Issuer Purchases of Equity Securities
|
22
|
|
|
Item 6.
|
Selected
Financial Data
|
22
|
|
|
Item 7.
|
Management’s
Discussion and Analysis of Financial Condition and Results of
Operations
|
24
|
|
|
Item 7A.
|
Quantitative
and Qualitative Disclosures about Market Risk
|
36
|
|
|
Item 8.
|
Financial
Statements and Supplementary Data
|
36
|
|
|
Item 9.
|
Changes
in and Disagreements with Accountants on Accounting and Financial
Disclosure
|
37
|
|
|
Item 9A.
|
Controls
and Procedures
|
37
|
|
|
Item 9B.
|
Other
Information
|
38
|
|
|
PART III
|
|||
|
Item 10.
|
Directors
and Executive Officers of the Registrant
|
38
|
|
|
Item 11.
|
Executive
Compensation
|
40
|
|
|
Item 12.
|
Security
Ownership of Certain Beneficial Owners and Management
|
45
|
|
|
Item 13.
|
Certain
Relationships and Related Transactions
|
46
|
|
|
Item 14.
|
Principal
Accountant Fees and Services
|
46
|
|
|
PART IV
|
|||
|
Item 15.
|
Exhibits
and Financial Statement Schedules
|
48
|
2
Use
of Terms
Except as
otherwise indicated by the context, references in this report to “Winner
Medical”, the “Company” “we”, “us”, or “our”, are references to the combined
business of Winner Medical Group Inc. and its wholly-owned subsidiary, Winner
Group Limited, along with Winner Group Limited’s wholly-owned subsidiaries which
include Winner Industries (Shenzhen) Co., Ltd., Winner Medical & Textile
Ltd. Zhuhai, Winner Medical & Textile Ltd. Jingmen, Hubei Winner Textiles
Co. Ltd., Winner Medical & Textile Ltd. Yichang, Winner Medical &
Textile Ltd. Jiayu, Winner Medical & Textile Ltd. Chongyang and Winner
Medical (Huanggang) Co., Ltd. and Winner Group Limited’s majority owned
subsidiary Shanghai Winner Medical Apparatus Co., Ltd. and Winner Medical (Hong
Kong) Limited. References to “Winner Group Limited” or “Winner Group”
are references to Winner Group Limited and its subsidiaries listed above.
References to “China” and the “PRC” are references to the “People’s Republic of
China.” References to “U.S.” are references to the United States of America.
References to “RMB” are to Renminbi, the legal currency of China, and all
references to “$” are to the legal currency of the United States.
Forward-Looking
Statement
Statements
contained in this Annual Report on Form 10-K include “forward-looking
statements” within the meaning of Section 27A of the Securities Act of 1933 and
Section 21E of the Securities Exchange Act of 1934. Forward-looking statements
involve known and unknown risks, uncertainties and other factors which could
cause actual financial or operating results, performances or achievements
expressed or implied by such forward-looking statements not to occur or be
realized. Forward-looking statements may be identified by the use of
forward-looking terminology such as “may”, “will”, “could”, “should”, “project”,
“expect”, “believe”, “estimate”, “anticipate”, “intend”, “continue”,
“potential”, “opportunity” or similar terms, variations of those terms or the
negative of those terms or other variations of those terms or comparable words
or expressions. Potential risks and uncertainties include, among other things,
such factors as:
|
|
·
|
the Company’s dependence upon international
customers;
|
|
|
·
|
international trade
restrictions;
|
|
|
·
|
foreign currency
fluctuation;
|
|
|
·
|
developments in the healthcare
industry;
|
|
|
·
|
the Company’s dependence on patent and trade
secret laws;
|
|
|
·
|
the Company’s revenues are highly concentrated
in a single customer;
|
|
|
·
|
uncertainties with respect to the
PRC legal and regulatory
environment;
|
|
|
·
|
the Company’s ability to adequately finance
the significant costs associated with the development of new medical
products;
|
|
|
·
|
potential product liability
claims for which the
Company does not
have insurance coverage; and
|
|
|
·
|
other risks identified in this
Report and the
Company other
filings with the SEC.
|
Readers
are urged to carefully review and consider the various disclosures made by the
Company in this Annual Report on Form 10-K and the Company’s other filings with
the SEC. These reports attempt to advise interested parties of the risks and
factors that may affect the Company’s business, financial condition and results
of operations and prospects. The forward-looking statements made in this Form
10-K speak only as of the date hereof and the Company disclaims any obligation
to provide updates, revisions or amendments to any forward-looking statements to
reflect changes in the Company’s expectations or future events.
3
PART
I
Item
1. Description of
Business
Recent
Events
On
October 6, 2009, the Company’s Board of Directors approved and authorized the
Company to complete a one-for-two reverse split of the Company’s common stock,
decreasing the Company’s authorized capital to 247,500,000 shares of common
stock and 2,500,000 shares of preferred stock, par value $0.001 per share.
Pursuant to the Nevada Revised Statues, shareholder approval of this action was
not required.
Background
The
Company was originally incorporated under the name Birch Enterprises, Inc. in
the state of Nevada in August 1986. On
September 14, 1987, the Company consummated a business combination transaction
with Las Vegas Resort Investments whereby Las Vegas Resort Investments became
the Company’s wholly-owned subsidiary. Concurrent with this transaction, the
Company changed its corporate name to Las Vegas Resorts Corporation. During
September 1992 all of the Company’s operations ceased. The Company had no active
operations from then until December 16, 2005, when it completed a reverse
acquisition transaction, discussed below under “—Acquisition of Winner Group
Limited,” with Winner Group Limited, a Cayman Islands corporation, whose
subsidiary companies originally commenced business in February
1991.
Winner is
a technology-driven medical dressings and medical disposables manufacturer based
in China. Winner became the Company’s wholly-owned subsidiary in connection with
the reverse acquisition transaction and is the holding company for all of the
Company’s commercial operations.
On
February 13, 2006, the Company amended its Articles of Incorporation to change
its name from Las Vegas Resorts Corporation to Winner Medical Group
Inc. The Company changed its name to reflect its new business and the
names of its subsidiary companies.
Acquisition
of Winner Group Limited
On
December 16, 2005, the Company completed a reverse acquisition transaction with
Winner Group Limited whereby the Company issued to the stockholders of Winner
Group Limited 42,280,840 shares of its common stock in exchange for all of the
issued and outstanding capital stock of Winner Group Limited. These 42,280,840
shares had been restated to 21,140,420 shares in the Company’s financial
statements to reflect a reverse stock split of 1 new share of common stock for 2
old shares of common stock on October 6, 2009. Winner Group Limited thereby
became the Company’s wholly-owned subsidiary and the former stockholders of
Winner Group Limited became the Company’s controlling stockholders.
For
accounting purposes, the share exchange transaction was treated as a reverse
acquisition with Winner Group Limited as the acquirer and Winner Medical Group
Inc. as the acquired party. When the Company refers in this prospectus to
business and financial information for periods prior to the consummation of the
reverse acquisition, the Company is referring to the business and financial
information of Winner Group Limited on a consolidated basis unless the context
suggests otherwise.
Winner
Group Limited’s operations began with Winner Medical & Textile Ltd. Zhuhai,
which was incorporated in China in February 1991 by the Company’s CEO, President
and director Mr. Jianquan Li. Winner Group Limited was incorporated as a Limited
Liability Exempted Company in the Cayman Islands in April 2003 and is the
holding company of all of the Company’s business operations. Below is the
Company’s holding company structure.
4
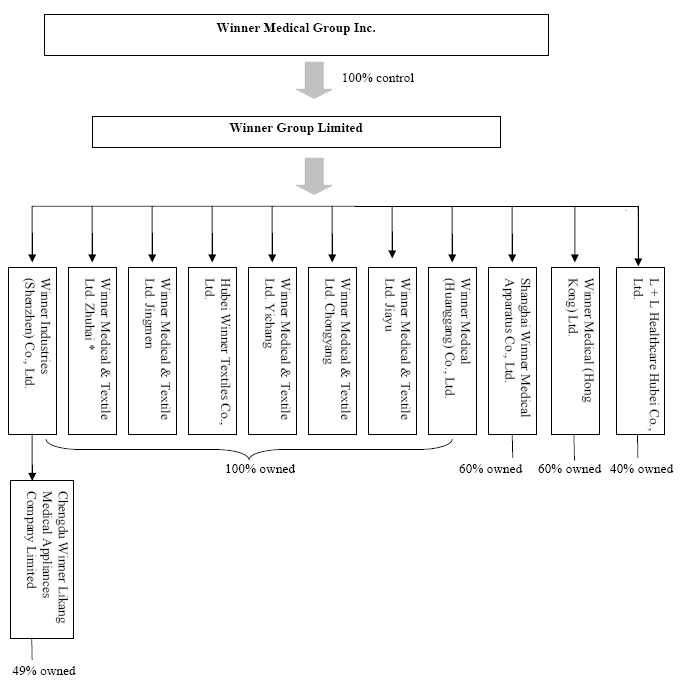
* On
February 1, 2008, the Company stopped all the business operations of Winner
Medical & Textile Ltd. Zhuhai, “Winner Zhuhai”, and filed for the
deregistration of Winner Zhuhai with various government authorities in the PRC.
As of June 30, 2009, Winner Zhuhai received approvals from various government
authorities in the PRC regarding its application for deregistration, except the
relevant tax bureau clearance is still on-going.
The
Company’s Business
Through
its subsidiary Winner Group Limited, the Company’s business consists of research
and development, manufacturing and marketing of medical dressings and medical
disposables. The Company has seven wholly-owned operating subsidiaries and four
joint venture companies, and it established several integrated manufacturing and
processing lines for its core products. The Company’s product offerings include
medical care products, wound care products, home care products and PurCotton
products, a new product of nonwoven fabric made from 100% natural
cotton.
The
Company is one of the leading manufacturers of medical dressings and medical
disposables in China. The products are sold worldwide, with Europe, the United
States and Japan serving as the top three markets. Certain of the Company’s
medical device products are registered and listed with the U.S. Food and Drug
Administration or FDA, giving the Company the approval to export those
sterilized products directly to the United States.
5
The
Company’s Strategy
The
Company’s primary business strategy is to achieve annual growth in revenue by
building its brand and reputation. The Company seeks to implement its business
strategy by focusing on:
Marketing
Own Brand Product in China
The
surgical dressing and medical disposables market in China is expanding quickly.
According to Research and Markets http://www.researchandmarkets.com/,
certain marketing researches showed that the demand for disposable medical
products has experienced rapid growth. In the future, the medical
market in China will become increasingly regulated due to the Chinese
government’s efforts to reform its medical care system. These factors create
opportunities for companies, such as Winner Medical, that had already followed
such strict conduct and quality control regulations.
During
fiscal year 2009, approximately 16.87% of the Company’s sales revenue was
generated domestically in China, and this percentage is expected to increase.
The Company’s sales channel in China includes: hospitals, local distributors,
and Over-The-Counter, or OTC, drugstore chains.
PurCotton
Products
The
PurCotton product, new spunlace cotton nonwoven products, combines the
superior characteristics of both natural cotton and materials made using
nonwoven technology. It is expected to have advantages over woven cotton or
synthetic nonwoven fabric, such as it is natural, safe, strong, durable,
healthy, environmentally friendly, and of higher quality. The Company intends to
utilize its patented manufacture process to enable it to produce PurCotton at a
lower cost than woven cotton products, so it believes the launch of the cotton
nonwoven spunlace products will provide a significant advantage to the Company.
Patent applications covering the invention of spunlace cotton nonwoven process
have been made in more than 50 countries. Patents have been granted in China,
the United States, Russia, Singapore, South Africa, Mexico, Nigeria,
Philippines, and member states of the European Patent Office.
To
execute its strategy, the Company entered into an agreement in 2005 with the
local government agency of Huanggang to acquire 564,742 square meters,
approximately 140 acre, of land that will mostly be dedicated to the
construction of 100% cotton spunlaced nonwoven fabric production facilities in
the Company’s subsidiary Winner Medical (Huanggang) Co., Ltd., “Winner
Huanggang”. Land use right certificates of this land were issued to the Company
in November 2005 and July 2007. As of September 30, 2009, the first two
PurCotton manufacturing lines are producing in full capacity; compared to the
third quarter, the third manufacturing line has completed testing and started
production, and its production is expected to increase. In August 2009, the
Company entered into a contract with a machine producer in China to purchase new
machineries for the fourth production line, these machineries are expected to
start production in the second quarter of 2010. The Company started selling
PurCotton products to customers in China, the United States, Europe and Japan
for both consumer and medical use. During fiscal year 2009 and 2008, gross
profit from these products reached approximately $1,452,000 and $95,000
respectively.
Providing
High Quality Products
The
Company’s goal is to manufacture and sell products that are of the highest
quality in the industry and in accordance with established industry standards.
The Company’s quality management system is certified by the International
Organization for Standardization and is registered under ISO 9001 ISO
13485:2003. Currently, over 90% of the Company’s products have obtained EU CE
Certificates. The Company has 30 types of products registered and listed with
the FDA in the U.S., where it is proud to be authorized by the FDA to export
sterilized products directly. Among those products are sterilization pouches and
face masks, which have 510(k) FDA certificates. Japanese certificates,
which are awarded to individual factories, have been granted to Winner Medical’s
Shenzhen factory, Jiayu Factory, and Chongyang Factory, which are all qualified
and entitled to export products to Japan directly.
Providing
Customers with a Complete Product Line – One Stop Procurement
Services
The
Company provides to customers all over the world specialized medical dressing
products that are intended to address a number of customer issues and needs. The
Company’s products are designed to meet a wide variety of its client’s product
configuration demands. The Company employs manufacturing equipment, including
gauze sponge bleaching equipment, sterile packaging machines, auto-gauze sponges
folding machines, nonwoven sponge folding machines, and steam sterilization and
ethylene oxide, or ETO, sterilization processing which it believes allow the
Company to produce its products in a cost efficient manner.
Developing
Products Through Research and Development
The
Company’s research and development efforts are aimed at finding new varieties of
products, improving existing products, improving product quality and reducing
production costs.
The
Company intends to focus significant efforts on opening new opportunities for
its new products. The Company believes the following products will contribute to
its growth.
6
Implementing
Advanced Information Technology System
The
Company has implemented the Enterprise Resources Planning, “ERP”, software
provided by a Systems Applications and Products company, “SAP”, or SAP ERP
system, which integrates all of the core business operations of each of its
subsidiaries-from production, supply, and sales to financial records-into one
system. Looking forward, the Company’s goal is to build a platform on which
the Company can share information with its customers, including raw material
preparation, production status, inventory, and transportation.
Managing
Business Effectively Through Strong Management Team
Each
member of the Company’s management team has an average of ten years of
experience in the industry. Under their leadership, the Company has a
demonstrated record of rapid and orderly growth. The Company intends
to capitalize on the acumen and industry experience of several members
of its management team to grow its business.
Building
a Broad Customer Base
The
Company has many customers in all major regions throughout the world. The
Company’s customers are located in China, Japan, Germany, North America, Italy,
Australia, France, the United Kingdom, the Netherlands, South America, Africa,
the Middle East and other places around the globe. Its largest markets are
currently Japan, the Europe and the United States. The Company intends to
broaden its customer base by diversifying its sales and marketing
efforts.
Developing and Expanding the
Company’s Logistics
Capabilities
Logistics
capability is an important aspect of the Company’s strategy. The Company
believes it is important to have warehouses in large transportation ports and
near central cities. The Company’s use of modern logistics management methods is
designed to enhance its service levels, including its ability to deliver
products to customers in a timely fashion, and the Company strives to handle
customer service inquiries quickly and accurately. Information on purchase order
confirmation, production or order status and shipping advice is readily
available. The Company also offers its customers a variety of payment terms to
facilitate international purchases.
The Company’s Products
The
Company’s products can be divided into the following four categories
according to their functions:
Medical
care products
Include
operating room products, procedural packs, protective products and
gauze.
Wound
care products
Include
dressing pads, cotton products, retention products and dental
products.
Home
care products
Include
cosmetic products, handkerchiefs, sweat pads and bathing sets.
PurCotton
products
New
spunlace 100% cotton nonwoven products. Include jumbo rolls as consumer raw
materials, operating room towels, lap sponges, swabs and surgical gowns, as well
as finished consumer products such as wipes and cosmetic cotton
products.
The
Company continuously focuses on the development and launch of high value added
products, and on increasing its sales volume of innovative new products, which
have a higher profit rate.
The
Company plans to continue to penetrate the medical and health care market for
medical disposable products, particularly in Japan, Europe and the U.S., which
are the main markets for medical disposable products. It has established trade
relationships with Sakai Shorten of Japan, which was its largest clients in
fiscal year 2009, with total sales of approximately $14.54 million. The Company
sells its products through Molnlycke Healthcare in Sweden, Covidien in the US,
Artsana in Italy, Richardson in the UK, BSN Medical in Germany, and Medeco in
Netherlands. In order to adapt the demand of increasing international orders,
the Company has also established production systems designed to address
international product demands, which include a one hundred thousand grade
purification room and modern manufacturing equipment.
The
Company also focuses on quality control. Its products have met the requirements
of major international medical product quality tests, and it continuously seeks
to improve its production systems and processes.
The Company’s Intellectual
Property
The
Company currently has twenty five issued patents. Below are the brief
descriptions of these patents:
7
|
Description of Patent
|
Patent No.
|
Type
|
Status
|
|||
|
Manufacture
Method of the Spunlace Non-Woven Cloth With X-Ray Detectable Element
Produced Thereby
|
ZL 200510033576.9 (China)
|
Invention
|
Granted
|
|||
|
Manufacture
method of the 100% cotton non-woven medical dressings
|
ZL 200510033147.1 (China)
|
Invention
|
Granted
|
|||
|
Colored
non-woven cloth with special coat
|
ZL 200620013847.4 (China)
|
Utility Model
|
Granted
|
|||
|
Colored
100% cotton gauze
|
ZL 200620132922.9 (China)
|
Utility Model
|
Granted
|
|||
|
100%
cotton gauze with protective function
|
ZL 200620132920.X (China)
|
Utility Model
|
Granted
|
|||
|
A
medical dressing resists penetration and adhesion
|
ZL 200620132921.4 (China)
|
Utility Model
|
Granted
|
|||
|
An
ancillary fight code machine
|
ZL 200620017009.4 (China)
|
Utility Model
|
Granted
|
|||
|
A
safety medical gauze with detective device
|
ZL 200620014971.2 (China)
|
Utility Model
|
Granted
|
|||
|
Wipes
box
|
ZL 200630060318.5 (China)
|
Appearance design
|
Granted
|
|||
|
Spunlace
non-woven cloth with special coat and protective function
|
ZL 200620013845.5 (China)
|
Utility Model
|
Granted
|
|||
|
A
testing equipment for cloth
|
ZL 200820091990.4 (China)
|
Utility Model
|
Granted
|
|||
|
Wound
dressing
|
ZL 200820092733.2 (China)
|
Utility Model
|
Granted
|
|||
|
Petrolatum
dressing
|
ZL 200820105164.0 (China)
|
Utility Model
|
Granted
|
|||
|
Product
of and Method for hydrophobic 100% cotton non-woven cloth
|
ZL 200820093952.2 (China)
|
Utility Model
|
Granted
|
|||
|
Packing
device for medical dressing products
|
ZL 200820094531.1 (China)
|
Utility Model
|
Granted
|
|||
|
Draw
out wipes box
|
ZL 200520035670.3 (China)
|
Utility Model
|
Granted
|
|||
|
Medical
product box
|
ZL 200820207244.7 (China)
|
Utility Model
|
Granted
|
|||
|
Embossed
non-woven cloth
|
ZL 2008201397530 (China)
|
Utility Model
|
Granted
|
|||
|
A
care package
|
ZL 200820235800.1 (China)
|
Utility Model
|
Granted
|
|||
|
A
bondage
|
ZL 200920129524.5 (China)
|
Utility Model
|
Granted
|
|||
|
A
protective facemask
|
ZL 200920135220.X (China)
|
Utility Model
|
Granted
|
|||
|
Disposable
medical compound eye-protective face mask
|
ZL 03273570.7 (China)
|
Utility Model
|
Granted
|
|||
|
Method
For Producing Spunlace Non-Woven Cloth, Method For Producing Spunlace
Non-Woven Cloth With X-Ray Detectable Element, Spunlace Non-Woven Cloth
With X-Ray Detectable Element Produced Thereby
|
1-2007-501648 (Philippine)
|
Invention
|
Granted
|
|||
|
Method
For Producing Spunlace Non-Woven Cloth, Method For Producing Spunlace
Non-Woven Cloth With X-Ray Detectable Element, Spunlace Non-Woven Cloth
With X-Ray Detectable Element Produced Thereby
|
2007/7583 (South Africa)
|
Invention
|
Granted
|
|||
|
Method
For Producing Spunlace Non-Woven Cloth, Method For Producing Spunlace
Non-Woven Cloth With X-Ray Detectable Element, Spunlace Non-Woven Cloth
With X-Ray Detectable Element Produced Thereby
|
NG/C/2007/774 (Nigeria)
|
Invention
|
Granted
|
8
The
Company has licensed from Jianquan Li, the Company’s CEO, President and
Director, his rights under six patent and related technologies for nonwoven
fabric manufacturing on a perpetual, worldwide royalty-free
basis. Below are the brief descriptions of these patent and patent
applications:
|
Description of Patent licensed from Jianquan Li
|
Patent No.
|
Type
|
Status
|
|||
|
Method
For Producing Spunlace Non-Woven Cloth, Method For Producing Spunlace
Non-Woven Cloth With X-Ray Detectable Element, Spunlace Non-Woven Cloth
With X-Ray Detectable Element Produced Thereby
|
US 7049753 B2 (U.S.)
|
Invention
|
Granted
|
|||
|
Method
For Producing Spunlace Non-Woven Cloth, Method For Producing Spunlace
Non-Woven Cloth With X-Ray Detectable Element, Spunlace Non-Woven Cloth
With X-Ray Detectable Element Produced Thereby
|
05013515.1 (E.U.)
|
Invention
|
Granted
|
|||
|
Method
For Producing Spunlace Non-Woven Cloth, Method For Producing Spunlace
Non-Woven Cloth With X-Ray Detectable Element, Spunlace Non-Woven Cloth
With X-Ray Detectable Element Produced Thereby
|
2005118845 (Russia)
|
Invention
|
Granted
|
|||
|
Method
For Producing Spunlace Non-Woven Cloth, Method For Producing Spunlace
Non-Woven Cloth With X-Ray Detectable Element, Spunlace Non-Woven Cloth
With X-Ray Detectable Element Produced Thereby
|
200503941-7 (Singapore)
|
Invention
|
Granted
|
|||
|
Method
For Producing Spunlace Non-Woven Cloth, Method For Producing Spunlace
Non-Woven Cloth With X-Ray Detectable Element, Spunlace Non-Woven Cloth
With X-Ray Detectable Element Produced Thereby
|
PA/a/2005/009218 (Mexico)
|
Invention
|
Granted
|
|||
|
Spunlace
Non-Woven Cloth With X-Ray Detectable Element Produced
Thereby. The Company added X-Ray detectable elements into the
spunlace non-woven cloth so that it can be easily detected by X-ray,
thereby avoiding leaving medical dressings in patient’s
body
|
ZL 200520055659.3 (China)
|
Utility Model
|
Granted
|
The
Company also has registered the trademark for the word “Winner” in China, the
United States, Canada, Singapore, Libya, Jordan, the United Arab Emirates, Saudi
Arabia, Thailand, Yemen, Chile, Cambodia and Hong Kong, and this trademark has
passed the registration application in the member countries of the Madrid
Agreement such as Germany, France, Italy, Russia, Switzerland, Australia, and
etc. The trademark of “PurCotton” has also passed the registration in China,
Hong Kong, the United States, European Union, Japan, Australia, Barisal, South
Africa, Philippine, Russia, Egypt, and etc. Other trademarks, including
“Winwin”, “Winband” in English and Chinese, and “SoftTouch”, have also been
registered by the Company.
9
In
addition, the Company has registered thirty six domain names, including
www.winnermedical.com (currently in use), www.purcotton.com.cn,
www.winnersofttouch.com, www.winner-industries.com, www.winner-shenzhen.com,
www.winner-shanghai.com, and www.winner-beijing.com, and etc.
Where
appropriate for the Company’s business strategy, the Company will continue to
take steps to protect its intellectual property rights.
The
Company’s Research and Development Efforts
The
Company spent approximately $1,663,000, $1,802,000, and $2,050,000 on research
and development in fiscal years 2009, 2008 and 2007, respectively.
The
Company’s research and development in 2009 was mainly focused on developing new
finished PurCotton products for consumer use, and researching new coating
technology for PurCotton products. Such coating technology will be applied on
the production of PurCotton products to reduce the production cost and improve
product quality.
PurCotton
is a type of cotton products that is made of 100% cotton using nonwoven
technology. As a natural product, it is environmentally friendly, reproducible,
comfortable, non-allergenic and static-free.
With this
new technology, the Company can produce environmentally friendly 100% cotton
nonwoven at a lower cost. The Company’s new technology modifies the conventional
manufacturing method of nonwoven cloth. The Company refined the production
equipment and reduced the number of steps in making nonwoven cloth. As a result,
the new technology allows the Company to minimize raw material waste, save
production costs, and improve production efficiency.
The
Company’s research and development activities adhere to strict procedures and
utilize standardized processes. The Company is focused on further improving its
core manufacturing technologies so that it can reduce waste and overall
costs.
In
addition, the Company uses advanced automatic equipment as part of its
processing system, including folding machines, plastic absorbing machines and
sterilization systems. These improvements not only reduce production costs, but
also enable the Company to further diversify its product lines.
The
Company’s Marketing
Efforts
The
Company’s products are sold in all major regions internally through a network of
distributors, wholesalers, manufactures, whereby it provides each of its
customers with a customized product that is then sold by such customer under its
brand name, and manufacturers’ representatives. The Company’s major target
markets are China, Japan, Europe and North and South America. In light of its
existing production capacity constraints, the Company plans to meet the demands
from international markets, and at the same time expand its sales to the Chinese
market.
Since
there are different requirements in different geographic markets, the Company
has adopted marketing strategies that are market specific. For developed markets
such as the U.S., Japan and the EU, the Company acts as supplier for its
clients, providing each of them with a customized products in which the design,
size, type and scale of the products is decided by its customers. This approach
enables the Company to capitalize on its customers’ branding strengths and
established market channels. In order to gain market share, the Company attempts
to leverage its customers’ strong brand names, efficient distribution networks
and market presence. The Company believes it is a better strategy for it to team
up with large, well-known companies than to compete directly with them. Most of
the Company’s sales in developed countries are conducted by direct marketing. In
addition, the Company also conducts sales through third-party manufacturers’
representatives, who are compensated through payment of sales
commissions.
In China
and other developing countries, the Company sells its products under the
“Winner” brand name. As the economies of China and other developing countries
grow, the Company expected that there will be a significant increase in demand
for medical products, including demand for the Company’s medical dressings and
other medical disposable products. The Company believes its products are
generally price-competitive with products from the U.S., Japan and the European
countries. Competition can also come from local producers in the developing
countries, but the Company attempts to compete with local manufacturers based on
the quality of its products. Under these circumstances, the Company
believes it has successfully established a reputation for its own brand
based on low prices and high quality. The Company employs manufacturers’
representatives and actively participate in formal bid contracts organized by
local governments and organizations. The Company believes it has built its
brand reputation and market share in these markets and “Winner” has become a
recognized brand in local hospitals, the home health care sector and retail
markets in many developing countries.
10
Raw
Materials
The
Company depends on external suppliers for all of the raw materials it uses to
produce its products. The principal raw materials used for the Company’s
products are cotton, non-woven cloth and packaging materials, each of which it
purchases from a limited number of suppliers. The Company’s major supplier of
cotton, non-woven cloth and packaging materials are Louis Dreyfus Beijing
Trading Co. Ltd. (China) and Sino Protection (HeFei) Sanitary Material Co.,
Ltd. (China). The Company’s purchases from individual suppliers were less
than 5% of its total purchase amount in fiscal year 2009. The Company believes
it is not over-reliant on any of these suppliers.
Given the
importance of key raw materials to the Company’s business, the Company carefully
manages its purchasing efforts and has established company policies involving
raw material procurement. The cost of raw materials, excluding the
semi-process materials purchased, amounts to almost 55% of the Company’s total
production cost.
Supplier
Management System
The
Company has established a strict supplier management system to comprehensively
assess suppliers on the basis of quality and improvement, purchasing cycles,
management systems, price and delivery cycles. Suppliers are formally evaluated
twice a year. The quality of the suppliers determines how much business they
receive from the Company in subsequent months. The Company also hosts an annual
suppliers’ conference, during which it communicates directly with its suppliers
its needs and service level demands. The Company undertakes an open and
transparent purchasing practice, which is well received by most
suppliers.
Purchasing
Procedures
Purchasing
transactions are conducted in accordance with a procedure termed
“inquiry-comparison-negotiation.” Potential suppliers make initial offers that
are compared objectively according to relevant guidelines. After validation of
the various suppliers’ service and quality capabilities, the Company acquires
the needed materials from the supplier offering the highest quality product at a
reasonable cost. The Company’s financial department establishes an oversight
process by appointing individuals to conduct independent market research of key
price points. The research findings are announced periodically. The Company’s
auditing department and quality assurance department also provide oversight to
assure that it strictly adheres to all purchasing procedures.
The
Company’s Major Customers
The
Company has customers in approximately 80 countries throughout the world,
including Japan, Germany, the United States, Italy, the Netherlands, the United
Kingdom, Australia, France, China, as well as countries in South America, Africa
and the Middle East. Some of the Company’s customers are large-scale
producers and distributors with well known brand names, while others are import
and export firms or wholesalers with trade expertise and established sales
channels. The Company has long-term relationships with most of its
customers.
No
customer, other than Sakai Shoten Co., Ltd. accounted for more than 10% of
the Company’s revenues in fiscal year 2009. Sakai Shoten Co., Ltd. accounted for
approximately 14.78% and 15.66% of the Company’s revenue in fiscal years 2009
and 2008, respectively. Sakai Shoten Co., Ltd. acts as a purchasing agent for a
large number of ultimate consumers of the Company’s products in Japan. If the
Company loses this customer and is unable to replace this customer with other
customers that purchase a similar amount of its products, the Company’s revenues
and net income may decline considerably.
The
Company’s Competition
The
Company is subject to intense competition. Some of the Company’s competitors
have greater financial resources, larger staff and more established market
recognition than the Company does in the domestic Chinese market and
international markets. Increased competition in the medical disposable product
market could put pressure on the price at which the Company sells its
products, resulting in reduced profitability for the Company.
In the
Company’s industry, the Company competes based on manufacturing capacity,
product quality, product cost, ability to produce a diverse range of products
and logistics capabilities.
The
Company’s competitors include medical dressing and other medical disposable
product manufacturers around the world. Below is a list by geographic area of
the companies that the Company views as its most significant competitors in the
major markets in which it sells its products.
Competitors
based in China
The
Company’s competitors based in China primarily include: Shenzhen Aumei, Zhejiang
Zhende Medical Dressing Co., Ltd., Jiangsu Province Jianerkang Medical Dressing
Co., Ltd., and Qingdao Hartmann Medical Dressing Co., Ltd.
The
Company’s China-based competitors tend to have lower labor costs, and the
Company believes that their products are of lower quality and often lack
diversity, and they are weak in brand building and management.
Competitors
based in Asia (Outside of China)
Competitors
based in this area mainly come from India and countries in Southeast Asia, such
as Premier Enterprise and Sri Ram Products, whose main business is
weaving.
11
These
competitors lack of interconnected businesses, suppliers within the local
industry; and they tend to have lower employee and management quality, as
well as lower product quality.
Competitors
based in Europe and North America
Competitors
based in Europe and North America include: Bastos Viegas, S.A. (Portugal),
Intergaz, S.R.O. (Czech Republic), and TZMO S.A. (Poland).
The
Company’s competitors from Europe may have a geographic advantage in the EU
market, but the Company believes they have less product diversity and higher
production costs.
Regulation
The
Company is subject to complex and stringent governmental laws and regulations
relating to the manufacture and sale of medical dressings and medical
disposables in China and in many other countries in which it sells its products.
These laws and regulations in the major markets in which it competes are
discussed further below. All of the regulatory laws and regulations may be
revised or reinterpreted, or new laws and regulations may become applicable that
could have a negative effect on the Company’s business and results of
operations. See Item 1A. “Risk Factors — Risks Related to the Company’s Industry
— the Company’s failure to comply with ongoing governmental regulations could
impair its operations and reduce its market share.”
China
In China,
medical sanitary materials and dressings, including medical gauzes, absorbent
cottons, bandages and disposable surgical suits, are regulated as medical
devices and are administered by the Department of Medical Devices of the State
Drug Administration of China. The technology and specifications of these
products must be consistent with the Regulations for the Supervision and
Administration of Medical Devices and relevant laws and standards.
The
Company’s business is regulated by a number of provincial authorities that
license the production of, and register, products such as those the Company
manufactures. Eight of the Company’s wholly-owned subsidiaries, which require
licenses from these authorities, operate under current licenses.
Other
Countries
In
addition, since the Company sells its products in the international markets, its
products are subject to regulations imposed by various governmental agencies in
the markets where the Company’s products are sold. All of the Company’s products
exported to European countries must have a CE certificate, CE-certification or
CE Marking, which is a conformity marking consisting of the letters “CE”. The CE
Marking applies to products regulated by certain European health, safety and
environmental protection legislation. The CE Marking is obligatory for products
it applies to and the manufacturer affixes the marking in order to be allowed to
sell his products in the European market.
In Japan,
the Company needs a Certificate of Foreign Manufacture from the Pharmaceuticals
and Medical Devices Agency of Ministry of Health, Labor and Welfare of Japan in
order to sell its products in the Japanese market. The Company has reached the
applicable standards and obtained the required certificates in the Europe and
Japan.
In the
U.S., some of the Company’s products are considered medical devices. The FDA
regulates the design, manufacture, distribution, quality standards and marketing
of medical devices. Accordingly, the Company’s product development, testing,
labeling, manufacturing processes and promotional activities for certain
products that are considered medical devices are regulated extensively in the
U.S. by the FDA. The FDA has given the Company clearance to market such products
within the U.S.
Under the
U.S. Federal Food, Drug, and Cosmetic Act, or “FFDCA”, medical devices are
classified into one of three classifications, each of which is subject to
different levels of regulatory control, with Class I being the least stringent
and Class III being subject to most control. Class III devices, which are life
supporting or life sustaining, or which are of substantial importance in
preventing impairment of human health, are generally subject to a clinical
evaluation program before receiving pre-market approval, or PMA, from the FDA
for commercial distribution. Class II devices are subject in some cases to
performance standards that are typically developed through the joint efforts of
the FDA and manufacturers, but do not require clinical evaluation and pre-market
approval by the FDA. Instead, these products require a pre-market notification
to the FDA and in most cases a showing of substantial equivalence to an existing
product under Section 510(k) of the FFDCA. Class I devices are subject only to
general controls, such as labeling and record-keeping regulations, and are
generally exempt from pre-market notification or approval under Section 510(k)
of the FFDCA, although they are required to be listed with the FDA. The
Company’s medical device products are generally considered Class I devices;
therefore, they are exempt from pre-market notification or approval
requirements. The Company has listed all of its relevant products with the FDA
pursuant to the FFDAC.
If a
510(k) pre-market notification is required for a medical device, then such
device cannot be commercially distributed until the FDA issues a letter of
substantial equivalence, approving the sale of the product. Certain of the
Company’s surgical face masks and sterilization pouches are subject to the
510(k) pre-market notification requirements. The Company has already received
the necessary approvals from the FDA for such products.
12
The
Company’s medical device products are also subject to the general labeling
requirements under the FDA medical device labeling regulations. As of September
30, 2009, the Company has labeled all of its medical device products
and was not subject of any enforcement action initiated by the
FDA.
In
addition, manufacturers of medical devices distributed in the U.S. are subject
to various regulations, which include establishment registration, medical device
listing, quality system regulation (QSR) and medical device reporting. Under
FFDAC, any foreign establishment that manufactures, prepares, propagates,
compounds or processes a medical device that is imported, or offered for import,
into the U.S. is required to register its establishment with the FDA. In
addition, any foreign establishment that engages in manufacturing, preparation,
compounding, assembly or processing of a medical device intended for commercial
distribution in the U.S. is required to list its devices with the FDA. The
Company’s subsidiary Winner Shenzhen, which exports all its products, has
registered its establishment with the FDA and has listed 31 medical and dental
devices.
The
Company’s manufacturing processes are required to comply with the applicable
portions of the QSR, which covers the methods and documentation of the design,
testing, production, processes, controls, quality assurance, labeling, packaging
and shipping of its medical device products. The QSR, among other things,
requires maintenance of a device master record, device history record and
complaint files. As of September 30, 2009, the Company was not the subject of
any enforcement actions initiated by the FDA.
The
Company is also required to report to the FDA if its products cause or
contribute to a death or serious injury or malfunction in a way that would
likely cause or contribute to death or serious injury were the malfunction to
recur. The FDA can require the recall of products in the event of material
defects or deficiencies in design or manufacturing. The FDA can withdraw or
limit the Company’s product approvals or clearances in the event of serious,
unanticipated health or safety concerns. The Company may also be required
to submit reports to the FDA of corrections and removals. As of September 30,
2009, the Company had not received any complaints that any of its products had
contributed to a death or serious injury, or that they suffered any such
malfunctions or defects.
The FDA
has broad regulatory and enforcement powers. If the FDA determines that the
Company has failed to comply with applicable regulatory requirements, it can
impose a variety of enforcement actions ranging from public warning letters,
fines, injunctions, consent decrees and civil penalties to suspension or delayed
issuance of approvals, seizure or recall of the Company’s products, total or
partial shutdown of production, withdrawal of approvals or clearances already
granted and criminal prosecution. The FDA can also require the Company to
repair, replace or refund the cost of devices that it manufactured or
distributed. The Company’s failure to meet any of these requirements may cause
the FDA to detain its products automatically when they are presented for entry
into the U.S. If any of these events occur, it could create a material adverse
impact on the Company. As of September 30, 2009, the Company was not the subject
of any enforcement actions initiated by FDA.
The
Company’s Employees
As of
September 30, 2009, the Company employed approximately 4,459 full-time
employees. The Company believes that it maintains a satisfactory working
relationship with its employees and it has no significant labor disputes or any
difficulty in recruiting staff for its operations.
As
required by applicable Chinese law, the Company has entered into employment
contracts with all of its officers, managers and employees.
The
Company’s employees in China participate in a state pension scheme organized by
the Chinese municipal and provincial governments. The Company is required to
contribute to the scheme at rates ranging from 8% to 29% of the average monthly
salary. The expenses related to this scheme were $626,606, $515,232, and
$356,113 for fiscal years 2009, 2008 and 2007 respectively.
Item
1A. Risk
Factors
You
should carefully consider the following risks, as well as the other information
contained in this annual report, before investing in the Company’s securities.
If any of the following risks actually occurs, the Company’s business could be
harmed. You should refer to the other information set forth or referred to in
the Company’s annual report, including its consolidated financial statements and
the related notes incorporated by reference herein.
RISKS
RELATED TO THE COMPANY’S BUSINESS
The
Company’s dependence upon international customers may impede its ability to
supply products
During
fiscal year 2009, approximately 83% of the Company’s products were sold
internationally. As a result, the Company is subject to risks
associated with shipping products across borders, including shipping
delay. If the Company cannot deliver its products on a competitive
and timely basis, its relationships with international customers may be damaged
and its financial condition could be harmed.
13
The
Company engages in international sales, which expose it to trade
restrictions
As a
result of the Company’s product sales in various geographic regions, the Company
may be subject to the risks associated with customs duties, export quotas and
other trade restrictions that could have a significant impact on its revenue and
profitability. While the Company has not encountered significant
difficulties in connection with the sales of its products in international
markets, the future imposition of, or significant increases in the level of,
custom duties, export quotas or other trade restrictions could have an adverse
effect on the Company. Further, the Company cannot assure that the
laws of foreign jurisdictions where it sells and seeks to sell its products
afford similar or any protection of its intellectual property rights as may be
available under U.S. laws. The Company is directly impacted by the
political, economic, military and other conditions in the countries where it
sells or seeks to sell its products.
Expansion
of the Company’s business may put added pressure on its management, financial
resources and operational infrastructure, impeding the Company’s ability to meet
any increased demand for its medical products and possibly impairing its
operating results
The
Company’s business plan is to significantly grow its operations to meet
anticipated growth in demand for existing products, and by the introduction of
new product offerings. The Company’s planned growth includes the
construction of several new production lines to be put into operation over the
next five years. Growth in the Company’s business may place a
significant strain on its personnel, management, financial systems and other
resources. The Company may be unable to successfully and rapidly
expand sales to potential customers in response to potentially increasing demand
or control costs associated with its growth.
To
accommodate any such growth and compete effectively, the Company may need to
obtain additional funding to improve information systems, procedures and
controls and expand, train, motivate and manage its employees, and such funding
may not be available in sufficient quantities. If the Company is not
able to manage these activities and implement these strategies successfully
to expand to meet any increased demand, the Company’s operating results could
suffer.
The
Company relies on patent and trade secret laws that are complex and difficult to
enforce
The
validity and breadth of claims in medical technology patents involve complex
legal and factual questions and, therefore, the extent of their enforceability
and protection is highly uncertain. Issued patents or patents based
on pending patent applications or any future patent applications may not exclude
competitors or may not provide a competitive advantage to the
Company. In addition, patents issued or licensed to the Company may
not be held valid if subsequently challenged and others may claim rights in or
ownership of such patents. Furthermore, the Company cannot assure
that its competitors have not developed or will not develop similar products,
will not duplicate the Company’s products, or will not design around any patents
issued to or licensed by the Company.
The
Company depends on key personnel, and turnover of key employees and senior
management could harm its business
The
Company’s future business and results of operations depend in significant part
upon the continued contributions of its key technical and senior management
personnel, including Jianquan Li, Xiuyuan Fang, Jiagan Chen and Nianfu Huo, who
hold the titles of CEO, President and Chairman, CFO and Vice President, Vice
President of Project Management and Senior Vice President and Chairman of
Supervisory Board, respectively. They also depend in significant part
upon the Company’s ability to attract and retain additional qualified
management, technical, marketing and sales and support personnel for its
operations. If the Company loses a key employee or if a key employee
fails to perform in his or her current position, or if the Company is unable to
attract and retain skilled employees as needed, the Company’s business could
suffer. Significant turnover in the Company’s senior management could
significantly deplete the Company’s institutional knowledge held by its existing
senior management team. The Company depends on the skills and
abilities of these key employees in managing the manufacturing, technical,
marketing and sales aspects of its business, any part of which could be harmed
by further turnover.
The
Company’s revenues are highly concentrated in a single customer and the
Company’s business will be harmed if this customer reduces its orders from the
Company
In fiscal
year 2009, almost 14.78% of the Company’s business comes from just one customer,
Sakai Shoten Co., Ltd, which acts as a purchasing agent for a large number of
ultimate consumers of the Company’s products in Japan. If the Company
loses this customer and is unable to replace this customer with other customers
that purchase a similar amount of the Company’s products, the Company’s revenues
and net income would decline considerably.
The
Company is subject to potential product liability claims for which it does not
have insurance coverage
Defects
in the Company’s products could subject to potential product liability claims
that its products are ineffective or cause some harm to the human
body. The Company does not have product liability
insurance. Plaintiffs may advance claims that the Company’s products
or actions resulted in some harm. A successful claim brought against
the Company could significantly harm its business and financial
condition.
14
The
Company may not be able to adequately finance the significant costs associated
with the development of new medical products
The
medical products in the medical dressings and medical disposables market change
dramatically with new technological advancements. The Company is
currently conducting research and development on a number of new products, which
require a substantial outlay of capital. To remain competitive, the
Company must continue to incur significant costs in product development,
equipment, facilities and invest in research and development of new
products. These costs may increase, resulting in greater fixed costs
and operating expenses.
In
addition to research and development costs, the Company could be required to
expend substantial funds for and commit significant resources to the
following:
|
|
·
|
additional engineering and other
technical personnel;
|
|
|
·
|
advanced design, production and
test equipment;
|
|
|
·
|
manufacturing services that meet
changing customer needs;
|
|
|
·
|
technological changes in
manufacturing processes; and
|
|
|
·
|
manufacturing
capacity.
|
The
Company’s future operating results will depend to a significant extent on its
ability to continue to provide new products that compare favorably on the basis
of cost and performance with the design and manufacturing capabilities of
competitive third-party suppliers and technologies. The Company will
need to sufficiently increase its net sales to offset these increased costs, the
failure of which would negatively affect the Company’s operating
results.
The
current global financial crisis may have a negative impact on the Company’s
business and financial condition, especially on the market acceptance of the
Company’s new PurCotton products
The
current worldwide economic crisis has created significant reductions in
available capital and liquidity from banks and other providers of credit, which
may adversely affect the Company’s customers’ ability to buy the Company’s new
PurCotton products and fulfill their obligations to the
Company. Additionally, many of the effects and consequences of the
current global financial crisis and a broader global economic downturn are
currently unknown; any one or all of them could potentially have a material
adverse effect on the Company’s customers' or the Company’s own liquidity and
capital resources, or otherwise negatively impact the Company’s business and
financial results.
The
Company’s PurCotton products may be adversely affected by price reductions of
raw materials of the Company’s competitive products
Markets
for all of the Company’s products, especially the Company’s PurCotton products,
are extremely competitive. The Company competes based upon a variety of factors,
including cost of production and raw materials. It is possible that the
Company’s competitors have lowered their cost of production due to price
decrease in rayon and polyester and engage in price competition through
aggressive pricing policies to secure a greater market share to the Company’s
detriment. The Company’s PurCotton business may be adversely affected by
competition, and the Company may not be able to maintain its profitability if
the competitive environment worsens.
In
order to grow at the pace expected by management, the Company will require
additional capital to support its long-term business plan. If the Company is
unable to obtain additional capital in future years, it may be unable to proceed
with its long-term business plan and the Company may be forced to curtail or
cease its operations
The
Company will require additional working capital to support its long-term
business plan, which includes identifying suitable targets for horizontal or
vertical mergers or acquisitions, so as to enhance the overall productivity and
benefit from economies of scale. The Company’s working capital requirements and
the cash flow provided by future operating activities, if any, will vary greatly
from quarter to quarter, depending on the volume of business during the period
and payment terms with its customers. The Company may not be able to obtain
adequate levels of additional financing, whether through equity financing,
debt financing or other sources. Additional financings could result in
significant dilution to the Company’s earnings per share or the issuance of
securities with rights superior to the Company’s current outstanding securities.
In addition, the Company may grant registration rights to investors
purchasing its equity or debt securities in the future. If the Company is unable
to raise additional financing, it may be unable to implement its long-term
business plan, develop or enhance its products and services, take advantage of
future opportunities or respond to competitive pressures on a timely basis, if
at all. In addition, a lack of additional financing could force the Company to
substantially curtail or cease operations.
The
Company may be exposed to potential risks relating to its internal controls over
financial reporting and its ability to have those controls attested to by its
independent auditors
As
directed by Section 404 of the Sarbanes-Oxley Act of 2002 or SOX 404, the
Securities and Exchange Commission adopted rules requiring public companies to
include a report of management on the companies’ internal controls over
financial reporting in their annual reports, including Form
10-K. These requirements first applied to the Company in connection
with the Report for the fiscal year ended September 30, 2009. Management’s
report on internal control over financial reporting is set out in Item 9A
“Controls and Procedures.” of the 2009 Form 10-K. In addition, the independent
registered public accounting firm auditing a company’s financial statements must
also attest to and report on management’s assessment of the effectiveness of the
company’s internal controls over financial reporting as well as the operating
effectiveness of the company’s internal controls. The Company can provide no
assurance that it will be able to comply with all of the requirements imposed
thereby. The requirement for the auditor’s attestation in connection
with the Report will be effected to the Company for the fiscal year ended
September 30, 2010. There can be no assurance that the Company will receive
a positive attestation from its independent auditors. If significant
deficiencies or material weaknesses in the Company’s internal controls are
identified, the Company may not be able to remediate in a timely manner. In such
case, investors and others may lose confidence in the reliability of the
Company’s financial statements.
15
The
Company’s holding company structure and Chinese accounting standards and
regulations may limit the payment of dividends
The
Company has no direct business operations other than ownership of its
subsidiaries. While the Company has no current intention of paying
dividends, should it decide in the future to do so, as a holding company, its
ability to pay dividends and meet other obligations depends upon the receipt of
dividends or other payments from its operating subsidiaries and other holdings
and investments. In addition, the Company’s operating subsidiaries,
from time to time, may be subject to restrictions on their ability to make
distributions to the Company, including as a result of restrictive covenants in
loan agreements, restrictions on the conversion of local currency into U.S.
dollars or other hard currency and other regulatory restrictions as discussed
below. If future dividends are paid in Renminbi, fluctuations in the
exchange rate for the conversion of Renminbi into U.S. dollars may reduce the
amount received by U.S. stockholders upon conversion of the dividend payment
into U.S. dollars.
Chinese
regulations currently permit the payment of dividends only out of accumulated
profits as determined in accordance with Chinese accounting standards and
regulations. The Company’s subsidiaries in China are required to set
aside a portion of their after tax profits according to Chinese accounting
standards and regulations to fund certain reserve funds. Currently,
the Company’s subsidiaries in China are the only sources of revenues or
investment holdings for the payment of dividends. If they do not
accumulate sufficient profits under Chinese accounting standards and regulations
to first fund certain reserve funds as required by Chinese accounting standards,
the Company will be unable to pay any dividends.
The
Company may be subject to fines and legal sanctions imposed by State
Administration of Foreign Exchange(SAFE) or other Chinese government authorities
if it or its Chinese directors or employees fail to comply with recent Chinese
regulations relating to employee share options or shares granted by offshore
listed companies to Chinese domestic individuals
On
December 25, 2006, the People’s Bank of China, or PBOC, issued the
Administration Measures on Individual Foreign Exchange Control, and the
corresponding Implementation Rules were issued by SAFE on January 5, 2007.
Both of these regulations became effective on February 1, 2007. According
to these regulations, all foreign exchange matters relating to employee stock
holding plans, share option plans or similar plans with Chinese domestic
individuals’ participation require approval from the SAFE or its authorized
branch. On March 28, 2007, the SAFE issued the Application Procedure of
Foreign Exchange Administration for Domestic Individuals Participating in
Employee Stock Holding Plan or Stock Option Plan of Overseas-Listed Company, or
the Stock Option Rule. Under the Stock Option Rule, Chinese domestic individuals
who are granted share options or shares by an offshore listed company are
required, through a Chinese agent or Chinese subsidiary of the offshore listed
company, to register with the SAFE and complete certain other procedures. As the
Company is an offshore listed company, its Chinese domestic directors and
employees who may be granted share options or shares shall become subject to the
Stock Option Rule. Under the Stock Option Rule, employees stock holding plans,
share option plans or similar plans of offshore listed companies with Chinese
domestic individuals’ participation must be filed with the SAFE. After the
Chinese domestic directors or employees exercise their options, they must apply
for the amendment to the registration with the SAFE. The Company is reviewing
the procedures for such SAFE registration. If the Company or its Chinese
domestic directors or employees fail to comply with these regulations, the
Company or its Chinese domestic directors or employees may be subject to fines
or other legal sanctions imposed by the SAFE or other Chinese government
authorities.
RISKS
RELATED TO THE COMPANY’S INDUSTRY
The
Company may not be able to maintain or improve its competitive position because
of strong competition in the medical dressing and medical disposable industry,
and the Company expects this competition to continue to intensify
The
medical dressing and medical disposable industry is highly
competitive. The Company faces competition from medical dressing and
medical disposable manufacturers around the world. Some of the
Company’s international competitors are larger than the Company and possess
greater name recognition, assets, personnel, sales and financial
resources. These entities may be able to respond more quickly to
changing market conditions by developing new products and services that meet
customer requirements or are otherwise superior to the Company’s products
and services and may be able to more effectively market their products than
the Company can because they have significantly greater financial, technical and
marketing resources than the Company does. They may also be able to
devote greater resources than the Company can to the development, promotion
and sale of their products. Increased competition could require the
Company to reduce its prices, resulting in fewer customer orders, and loss of
market share. The Company cannot assure that it will be able to
distinguish itself in a competitive market. To the extent that the
Company is unable to successfully compete against existing and future
competitors, the Company’s business, operating results and financial condition
would face material adverse effects.
16
Cost
containment measures that are prevalent in the healthcare industry may result in
lower margins
The
health care market accounts for most of the demand for medical disposables
products. The health care market was typified in recent years by
strict cost containment measures imposed by governmental agencies, private
insurers and other “third party” payers of medical costs. In response
to these economic pressures, virtually all segments of the health care market
have become extremely cost sensitive and in many cases hospitals and other
health care providers have become affiliated with purchasing consortiums that
obtain large quantities of needed products and thus can sell at much lower
cost. These factors in combination have hindered suppliers and
manufacturers like the Company who may not be able to supply the large
quantities sought by the purchasing consortiums or who are unable to respond to
the need for lower product pricing.
The
Company’s failure to comply with ongoing governmental regulations could impair
its operations and reduce its market share
In China,
medical sanitary materials and dressings, including medical gauzes, absorbent
cottons, bandages and disposable surgical suits, are supervised as medical
devices and are administered by the Department of Medical Device of State Drug
Administration of China. The technology and specifications of these
types of products must conform to and comply with Regulations for the
Supervision and Administration of Medical Devices of China and the relevant
Chinese laws and standards. In addition, since the Company sells its
products in the international markets, its products are subject to regulations
imposed by various governmental agencies in the markets where its products are
sold. For example, certain of the Company’s products exported to
the U.S. must be listed with FDA. All the Company’s products exported
to EU countries must have the CE certificate. The Company also needs
a Certificate of Foreign Manufacture for the Japanese market. These
layers of regulation cause delays in the distribution of the Company’s products
and may require the Company to incur operating costs resulting from the need to
obtain approvals and clearances from regulators. As to date, the
Company has reached the applicable standards and obtained the required
certificates in the markets mentioned above.
The
Company’s margins are reduced when it sells its products to customers through a
buying group
A trend
in the Company’s industry is the use of buying groups by
customers. These buying groups aggregate the demand of several
different customers and then buy products in bulk at lower prices than any of
the customers would be able to obtain individually. The Company has
only limited production capacity. This makes it difficult for the
Company to meet the often large demand for its products from buying groups that
represent overseas customers in developed countries. A single order
of one kind of product from a top 500 multinational buyer could require the full
manufacturing capacity of one of the Company’s plants. Although the
Company has expanded its manufacturing capacity, its capacity is still not large
enough to meet the demands of these clients. As a result, the Company
may lose business to other manufacturers of its products who have more
manufacturing capacity than the Company does.
RISKS
RELATED TO DOING BUSINESS IN CHINA
Changes
in China’s political or economic situation could harm the Company and its
operational results
Economic
reforms adopted by the Chinese government have had a positive effect on the
economic development of the country, but the Chinese government could change
these economic reforms or any of the legal systems at any time. This
has an unknown effect on the Company’s operations and
profitability. Some of the things that could have this effect
are:
|
|
•
|
Level
of government involvement in the
economy;
|
|
|
•
|
Control
of foreign exchange;
|
|
|
•
|
Methods
of allocating resources;
|
|
|
•
|
Balance
of payments position;
|
|
|
•
|
International
trade restrictions; and
|
|
|
•
|
International
conflict.
|
The
Chinese economy differs from the economies of most countries belonging to the
Organization for Economic Cooperation and Development, or OECD, in many
ways. As a result of these differences, the Company may not develop
in the same way or at the same rate as might be expected if the Chinese economy
were similar to those of the OECD member countries.
17
The
Company’s business is largely subject to the uncertain legal environment in
China and your ability to legally protect your investment could be
limited
The
Chinese legal system is a civil law system based on written
statutes. Unlike common law systems, it is a system in which
precedents set in earlier legal cases are not generally used. The
overall effect of legislation enacted over the past 20 years has been to enhance
the protections afforded to foreign invested enterprises in
China. However, these laws, regulations and legal requirements are
relatively recent and are evolving rapidly, and their interpretation and
enforcement involve uncertainties. These uncertainties could limit
the legal protections available to foreign investors, such as the right of
foreign invested enterprises to hold licenses and permits such as requisite
business licenses. In addition, all of the Company’s executive
officers and its directors are residents of China and not of the U.S., and
substantially all the assets of these persons are located outside the
U.S. As a result, it could be difficult for investors to effect
service of process in the U.S., or to enforce a judgment obtained in the U.S.
against the Company or any of these persons.
The Chinese
government exerts substantial influence over the manner in which the
Company must conduct its
business activities
China has
only recently permitted provincial and local economic autonomy and private
economic activities. The Chinese government has exercised and
continues to exercise substantial control over virtually every sector of the
Chinese economy through regulation and state ownership. The Company’s
ability to operate in China may be harmed by changes in its economic policies
and regulations, including those relating to taxation, import and export
tariffs, environmental regulations, land use rights, property and other
matters. The Company believes that its operations in China are in
material compliance with all applicable legal and regulatory
requirements. However, the central or local governments of these
jurisdictions may impose new, stricter regulations or interpretations of
existing regulations that would require additional expenditures and efforts on
the Company’s part to ensure compliance with such regulations or
interpretations.
Accordingly,
government actions in the future, including any decision not to continue to
support recent economic reforms and to return to a more centrally planned
economy or regional or local variations in the implementation of economic
policies, could have a significant effect on economic conditions in China or
particular regions thereof, and could require the Company to divest itself of
any interest the Company then holds in Chinese properties or joint
ventures.
Future
inflation in China may inhibit the Company’s activity to conduct business in
China
In recent
years, the Chinese economy has experienced periods of rapid expansion and widely
fluctuating rates of inflation. These factors have led to the
adoption by Chinese government, from time to time, of various austerity measures
designed to restrict the availability of credit or regulate growth and contain
inflation. High inflation may in the future cause the Chinese
government to impose controls on credit and/or prices, or to take other action,
which could inhibit economic activity in China, and thereby harm the market for
the Company’s products.
Restrictions
on currency exchange may limit the Company’s ability to receive and use its
revenues effectively
The
majority of the Company’s revenues will be settled in Renminbi, U.S. dollars,
and Euro, and any future restrictions on currency exchanges may limit the
Company’s ability to use revenue generated in Renminbi to fund any future
business activities outside China or to make dividend or other payments in U.S.
dollars. Although the Chinese government introduced regulations in
1996 to allow greater convertibility of the Renminbi for current account
transactions, significant restrictions still remain, including primarily the
restriction that foreign-invested enterprises may only buy, sell or remit
foreign currencies after providing valid commercial documents, at those banks in
China authorized to conduct foreign exchange business. In addition,
conversion of Renminbi for capital account items, including direct investment
and loans, is subject to governmental approval in China, and companies are
required to open and maintain separate foreign exchange accounts for
capital account items. The Company cannot be certain that the Chinese
regulatory authorities will not impose more stringent restrictions on the
convertibility of the Renminbi.
The value
of the
Company’s securities
will
be affected by the foreign exchange rate between other
currencies and Renminbi
The value
of the Company’s common stock will be affected by the foreign exchange rate
between U.S. dollars and Renminbi, and between those currencies and other
currencies in which the Company’s sales may be denominated, such as Euro,
British pound, Australian dollars, and etc. For example, to the
extent that the Company needs to convert U.S. dollars into Renminbi for its
operational needs and should the Renminbi appreciate against the U.S. dollar at
that time, the Company’s financial position, the business of the Company, and
the price of the Company’s common stock may be harmed. Conversely, if
the Company decides to convert its Renminbi into U.S. dollars for the purpose of
declaring dividends on its common stock or for other business purposes and the
U.S. dollar appreciates against the Renminbi, the U.S. dollar equivalent of the
Company’s earnings from its subsidiaries in China would be reduced.
RISKS
RELATED TO THE MARKET FOR THE COMPANY’S STOCK
The
Company’s common stock is quoted on The New York Stock Exchange AMEX, which may
have an unfavorable impact on the Company’s stock price and
liquidity
The
Company’s common stock is quoted on The New York Stock Exchange AMEX under the
symbol “WWIN”. The New York Stock Exchange AMEX is a more limited
market than the New York Stock Exchange or NASDAQ Stock Market. The
quotation of the Company’s shares on The New York Stock Exchange AMEX may result
in a less liquid market available for existing and potential stockholders to
trade shares of the Company’s common stock, could depress the trading price of
the Company’s common stock and could have a long-term adverse impact on the
Company’s ability to raise capital in the future.
18
The
Company is subject to penny stock regulations and restrictions
The SEC
has adopted regulations which generally define so-called “penny stocks” as an
equity security that has a market price less than $5.00 per share or an exercise
price of less than $5.00 per share, subject to certain exemptions. As
of November 23, 2009, the closing price for the Company’s common stock was $5.05
but it has fluctuated around $5.00. It the Company’s stock is a
“penny stock”, it may become subject to Rule 15g-9 under the Exchange Act of
1934, or the “Penny Stock Rule.” This rule imposes additional sales
practice requirements on broker-dealers that sell such securities to persons
other than established customers and “accredited investors”, generally,
individuals with a net worth in excess of $1,000,000 or annual incomes
exceeding $200,000, or $300,000 together with their spouses. For
transactions covered by Rule 15g-9, a broker-dealer must make a special
suitability determination for the purchaser and have received the purchaser’s
written consent to the transaction prior to sale. As a result, this
rule may affect the ability of broker-dealers to sell the Company’s securities
and may affect the ability of purchasers to sell any of the Company’s securities
in the secondary market.
For any
transaction involving a penny stock, unless exempt, the rules require delivery,
prior to any transaction in a penny stock, of a disclosure schedule prepared by
the SEC relating to the penny stock market. Disclosure also is
required to be made about sales commissions payable to both the broker-dealer
and the registered representative and current quotations for the
securities. Finally, monthly statements are required to be sent
disclosing recent price information for the penny stock held in the account and
information on the limited market in penny stock.
There can
be no assurance that the Company’s common stock will qualify for exemption from
the Penny Stock Rule. In any event, even if the Company’s common
stock were exempt from the Penny Stock Rule, the Company would remain subject to
Section 15(b)(6) of the Exchange Act, which gives the SEC the authority to
restrict any person from participating in a distribution of penny stock, if the
SEC finds that such a restriction would be in the public interest.
Certain
of the Company’s stockholders hold a significant percentage of the Company’s
outstanding voting securities
Mr.
Jianquan Li and his wife Ping Tse own 80.68% of the Company’s outstanding voting
securities. As a result, they possess significant influence, giving
them the ability, among other things, to elect a majority of the Company’s Board
of Directors and to authorize or prevent proposed significant corporate
transactions. Their ownership and control may also have the effect of
delaying or preventing a future change in control, impeding a merger,
consolidation, takeover or other business combination or discourage a potential
acquirer from making a tender offer.
Certain
provisions of the
Company’s Articles of
Incorporation may make it more difficult
for a third party to effect a
change- in-control
The
Company’s Articles of Incorporation authorizes the Board of Directors to issue
up to 2,500,000 shares of preferred stock. The preferred stock may be
issued in one or more series, the terms of which may be determined at the time
of issuance by the Board of Directors without further action by the
stockholders. These terms may include voting rights including the
right to vote as a series on particular matters, preferences as to
dividends and liquidation, conversion rights, redemption rights and sinking
fund provisions. The issuance of any preferred stock could diminish
the rights of holders of the Company’s common stock, and therefore could reduce
the value of such common stock. In addition, specific rights granted
to future holders of preferred stock could be used to restrict the Company’s
ability to merge with, or sell assets to, a third party. The ability
of the Board of Directors to issue preferred stock could make it more difficult,
delay, discourage, prevent or make it more costly to acquire or effect a
change-in-control, which in turn could prevent the Company’s stockholders from
recognizing a gain in the event that a favorable offer is extended and could
materially and negatively affect the market price of the Company’s common
stock.
Item
1B. Unresolved Staff
Comments
Not
applicable.
Item
2.
Properties
All land
in China is owned by the government. Individuals and companies are permitted to
acquire rights to use land or land use rights for specific purposes. In the case
of land used for industrial purposes, the land use rights are granted for a
period of 50 years. This period may be renewed at the expiration of the initial
and any subsequent terms. Granted land use rights are transferable and may be
used as security for borrowings and other obligations. The Company currently has
land use rights to approximately 888,938 square meters in various parts of
China, with total book value of approximately $4,835,796. All fees for acquiring
such land use rights have been paid off as of September 30, 2009. The Company
also has approximately 330,064 squares meters of structure in China, with total
book value of approximately $23,813,258. Approximately 295,188 square meters of
the Company’s lands and 36,397 square meters of structure are subject to
mortgages.
The
following table summarizes main land the Company owned as of September 30,
2009.
19
|
Winner Medical
Subsidiaries
|
Location
|
Land Size
(Square
Meters)
|
Net Book Value
(in US $)
|
|||||||
|
Winner
Medical & Textile Ltd. Jingmen
|
Te
1 Hangkong Road, Pailou Town, Jingmen City, Hubei Province ,
China
|
40,542 | 41,469 | |||||||
|
Winner
Medical (Huanggang) Co., Ltd.
|
Te
1, Chibi Avenue, Huanggang City, Hubei Province, China
|
564,742 | 2,480,634 | |||||||
|
Winner
Medical & Textile Ltd. Yichang
|
No.
20 Jiangxia Avenue, Jiangkou Town, Zhijiang City, Hubei Province,
China
|
24,448 | 105,916 | |||||||
|
Winner
Medical & Textile Ltd. Chongyang
|
Qingshan
Park, Chongyang County, Hubei Province, China
|
73,268 | 8,671 | |||||||
|
Winner
Medical & Textile Ltd. Jiayu
|
No.
172 Phoenix Avenue, Yuyue Town, Jiayu County, Hubei Province,
China
|
34,167 | 13,505 | |||||||
|
Winner
Industries (Shenzhen) Co., Ltd.
|
Winner
Industrial Park, Bulong Road, Longhua, Shenzhen City, Guangdong Province,
China.
|
29,064 | 1,037,432 | |||||||
|
Hubei
Winner Textiles Co., Ltd.
|
No.
47 South Road of Jianshe, Yuekou Town, Tianmen City, Hubei Province.
China
|
122,707 | 1,148,169 | |||||||
|
Total
|
888,938 | 4,835,796 | ||||||||
The
following table summarizes the Company’s main structures it owned as of
September 30, 2009.
|
Winner Medical
Subsidiaries
|
Location
|
Structure Size
(Square
Meters)
|
Net Book Value
(in US $)
|
|||||||
|
Winner
Medical & Textile Ltd. Jingmen
|
Te
1 Hangkong Road, Pailou Town, Jingmen City, Hubei Province ,
China
|
19,897 | 2,216,164 | |||||||
|
Winner
Medical (Huanggang) Co., Ltd.
|
Te
1, Chibi Avenue, Huanggang City, Hubei Province, China
|
67,400 | 9,117,837 | |||||||
|
Winner
Medical & Textile Ltd. Yichang
|
No.
20 Jiangxia Avenue, Jiangkou Town, Zhijiang City, Hubei Province,
China
|
15,154 | 685,037 | |||||||
|
Winner
Medical & Textile Ltd. Chongyang
|
Qingshan
Park, Chongyang County, Hubei Province, China
|
74,097 | 3,212,983 | |||||||
|
Winner
Medical & Textile Ltd. Jiayu
|
No.
172 Phoenix Avenue, Yuyue Town, Jiayu County, Hubei Province,
China
|
20,700 | 1,162,012 | |||||||
|
Winner
Industries (Shenzhen) Co., Ltd.
|
Winner
Industrial Park, Bulong Road, Longhua, Shenzhen City, Guangdong Province,
China.
|
36,397 | 4,752,263 | |||||||
|
Hubei
Winner Textiles Co., Ltd.
|
No.
47 South Road of Jianshe, Yuekou Town, Tianmen City, Hubei Province.
China
|
96,419 | 2,666,962 | |||||||
|
Total
|
330,064 | 23,813,258 | ||||||||
The
following table summarizes the Company’s properties that are subject to
mortgages as of September 30, 2009.
|
Mortgagor/Borrower
|
Location
|
Mortgagee/Lender
Bank
|
Land Subject
to Mortgage
(sq. m)
|
Structure Subject
to Mortgage
(sq. m)
|
||||||||
|
Winner
Industries (Shenzhen) Co., Ltd.
|
Winner
Industrial Park, Bulong Road, Longhua, Shenzhen City, Guangdong Province,
China.
|
China
Merchants Bank, Shenzhen Branch
|
- | 18,808 | ||||||||
|
Winner
Industries (Shenzhen) Co., Ltd.
|
Winner
Industrial Park, Bulong Road, Longhua, Shenzhen City, Guangdong Province,
China.
|
Shenzhen
Industrial and Commercial Bank of China
|
- | 17,589 | ||||||||
|
Winner
Medical (Huanggang) Co., Ltd.
|
Te
1, Chibi Avenue, Huanggang City, Hubei Province, China
|
Huanggang
Industrial and Commercial Bank of China
|
295,188 | - | ||||||||
|
Total
|
295,188 | 36,397 | ||||||||||
20
The
Company entered into an agreement in 2005 with the local government agency of
Huanggang to acquire 564,742 square meters, approximately 140 acres, of land
which it plans to dedicate primarily to the construction of 100% cotton spunlace
nonwoven fabric production facilities. The land use right certificate for
295,188 square meters, approximately 73 acres, of this land was issued to the
Company in November 2005. The land use right certificate for 269,554 square
meters, approximately 63 acres, of this land was issued to the Company in July
2007. As of September 30, 2009, the total investment for this project is
approximately $26.43 million, which includes $2.48 million in land, $9.12
million in facilities and $14.09 million in equipment, $0.74 million in other
aspects. Funds for this project were raised in the equity market and through
bank loans.
The
Company believes that all its land and structures have been adequately
maintained, are generally in good condition, and are suitable and adequate for
its business. The Company believes that the new facility under construction and
the expected land use rights to additional land will be sufficient for its
expansion efforts.
Some of
the Company’s properties are leased from third parties. In most cases, the
leased properties are dormitories or small operating spaces. In the remaining
cases, the leased properties include manufacturing facilities and the use the
Company is making of the land is in compliance with the relevant government
authority’s land use planning. In a few cases, the lessers were unable to
provide copies of documentation evidencing their rights to use the property
leased to the Company. In the event of any future dispute over the ownership of
the leased properties, the Company believes it could easily and quickly find
replacement premises and dormitories so that the operations would not be
affected.
Item
3. Legal
Proceedings
From time
to time, the Company may become involved in various lawsuits and legal
proceedings that arise in the ordinary course of business. However, litigation
is subject to inherent uncertainties, and an adverse result in these or other
matters may arise from time to time that may harm the Company’s
business.
The
Company is currently not aware of any such legal proceedings or claims that it
believes it will have a material adverse affect on its business, financial
condition or operating results.
To the
Company’s knowledge, no director, officer or affiliate of the Company, and no
owner of record or beneficial owner of more than five percent, 5%, of the
Company’s securities, or any associate of any such director, officer or security
holder is a party adverse to the Company or has a material interest adverse to
the Company in reference to pending litigation.
Item
4. Submission of
Matters to a Vote of
Security Holders
No matters were submitted to a vote of
the Company’s security holders during the fourth quarter of fiscal
2009.
21
PART
II
Item
5. Market for Registrant’s Common Equity, Related Stockholder
Matters and Issuer
Purchases of Equity Securities
The
Company’s common stock is quoted under the symbol “WWIN” on the New York Stock
Exchange AMEX since October 8, 2009. The CUSIP number is 97476P204.
During
2005, the Company filed a request with NASD Regulation Inc. for clearance of
quotations on the OTC Bulletin Board or OTCBB under Subsection (a)(5) of Rule
15c2-11 of the Securities Exchange Act of 1934. A clearance letter was issued to
the Company on April 27, 2005 and the Company was issued a trading symbol
“LVRC.OB.” As a result of a 1:1,500 reverse split of the Company’s common stock
that became effective on October 26, 2005, the Company’s trading symbol on the
OTC Bulletin Board was changed from “LVRC.OB” to “LVGC.OB.” On March 6, 2006, in
connection with the Company’s name change from Las Vegas Resorts Corporation to
Winner Medical Group Inc., the Company’s trading symbol was changed from
“LVGC.OB” to “WMDG.OB.” As a result of a 1:2 reverse split of the Company’s
common stock that became effective on October 6, 2009, the Company’s trading
symbol changed from “WMDG.OB” to “WWIN.OB”. Effective on October 8, 2009, the
Company’s trading symbol changed from “WWIN.OB” to “WWIN” as a result of its
common stocks having been traded on New York Stock Exchange AMEX. The following
table sets forth, for the periods indicated, the high and low close prices for
the Company’s common stock. These prices reflect inter-dealer prices, without
retail mark-up, mark-down or commission, and may not represent actual
transactions.
|
High
|
Low
|
|||||||
|
Fiscal
2008 – First quarter (10/1/07 to 12/31/07) *
|
$ | 4.6 | $ | 2.8 | ||||
|
Fiscal
2008 – Second quarter (1/1/08 to 3/31/08) *
|
$ | 3.9 | $ | 2.4 | ||||
|
Fiscal
2008 – Third quarter (4/1/08 to 6/30/08) *
|
$ | 3.4 | $ | 2.1 | ||||
|
Fiscal
2008 – Fourth quarter (7/1/08 to 9/30/08) *
|
$ | 2.2 | $ | 1.02 | ||||
|
Fiscal
2009 – First quarter (10/1/08 to 12/31/08) *
|
$ | 2.0 | $ | 0.4 | ||||
|
Fiscal
2009 – Second quarter (1/1/09 to 3/31/09) *
|
$ | 2.0 | $ | 0.8 | ||||
|
Fiscal
2009 – Third quarter (4/1/09 to 6/30/09) *
|
$ | 2.8 | $ | 1.4 | ||||
|
Fiscal
2009 – Fourth quarter (7/1/09 to 9/30/09) *
|
$ | 4.9 | $ | 2.4 | ||||
*
One-for-two reverse stock split became effective on October 6, 2009, which
automatically converted two shares of the Company's common stock into one share
of common stock. The share prices are adjusted on post split basis.
Reports
to Stockholders
The
Company plans to furnish its stockholders with an annual report for each fiscal
year ending September 30 containing financial statements audited by its
independent certified public accountants. Additionally, the Company may, in its
sole discretion, issue unaudited quarterly or other interim reports to its
stockholders when it deems appropriate. The Company intends to maintain
compliance with the periodic reporting requirements of the Securities Exchange
Act of 1934.
Approximate
Number of Holders of the Company’s Common Stock
On
September 30, 2009, there were approximately 1,446 stockholders of record of the
Company’s common stock.
Dividend
Policy
Other
than the dividends declared or paid by the Company’s subsidiary Winner Group
Limited and the reverse stock split effected before the reverse acquisition
transaction, the Company has never declared dividends or paid cash
dividends. The Company’s board of directors will make any decisions
regarding dividends. The Company currently intends to retain and use
any future earnings for the development and expansion of its business and does
not anticipate paying any cash dividends in the foreseeable future.
Recent
Sales of Unregistered Securities
None.
Item
6. Selected Financial Data
The
selected consolidated statement of income and comprehensive income data for the
years ended September 30, 2009, 2008 and 2007 and the selected balance sheet
data as of September 30, 2009, and 2008 are derived from the Company’s audited
consolidated financial statements included elsewhere in this report. The
selected consolidated financial data for the year ended September 30, 2006 and
2005 are derived from the Company’s audited consolidated financial statements
not included in this report, and the selected balance sheet data as of September
30, 2007, 2006 and 2005 is derived from the Company’s audited consolidated
financial statements not included in this report.
22
The following selected
historical financial information should be read in conjunction with the
Company’s consolidated financial statements and related notes and the
information contained in “Management’s Discussion and Analysis of Financial
Condition and Results of Operations.”
|
Year Ended September 30,
|
||||||||||||||||||||
|
2005
|
2006
|
2007
|
2008
|
2009
|
||||||||||||||||
|
Statement
of operations data:
|
||||||||||||||||||||
|
Sales
Revenues:
|
$
|
58,357,129
|
$
|
63,873,058
|
$
|
70,280,960
|
$
|
85,505,762
|
$
|
98,385,603
|
||||||||||
|
Cost
of Sales
|
42,059,663
|
46,335,354
|
52,869,597
|
64,086,581
|
70,444,383
|
|||||||||||||||
|
Gross
profit
|
16,297,466
|
17,537,704
|
17,411,363
|
21,419,181
|
27,941,220
|
|||||||||||||||
|
Expenses:
|
|
|||||||||||||||||||
|
Administrative
expenses
|
3,536,218
|
5,645,380
|
5,535,369
|
8,138,438
|
10,721,020
|
|||||||||||||||
|
Amortization
and depreciation
|
448,787
|
726,816
|
663,095
|
1,106,572
|
1,774,893
|
|||||||||||||||
|
Other
operating expenses
|
3,085,624
|
4,866,985
|
4,858,607
|
6,945,890
|
8,715,421
|
|||||||||||||||
|
Provision
for doubtful debt
|
1,807
|
25,789
|
13,667
|
85,976
|
230,706
|
|||||||||||||||
|
Selling
expenses
|
5,294,557
|
5,689,627
|
6,423,815
|
6,299,101
|
6,153,111
|
|||||||||||||||
|
Total
expenses
|
8,830,775
|
11,335,006
|
11,959,184
|
14,437,539
|
16,874,131
|
|||||||||||||||
|
Income
before taxes
|
8,362,388
|
6,326,690
|
5,662,391
|
5,563,166
|
11,421,176
|
|||||||||||||||
|
Income
taxes
|
446,146
|
516,635
|
-15,015
|
591,118
|
2,358,093
|
|||||||||||||||
|
Net
income
|
7,892,670
|
5,829,294
|
5,624,854
|
5,066,295
|
9,128,574
|
|||||||||||||||
|
Pre
- tax Income per common share
|
$
|
0.43
|
$
|
0.27
|
$
|
0.25
|
$
|
0.23
|
$
|
0.41
|
||||||||||
|
Earnings
per share — basic and diluted
|
$
|
0.43
|
$
|
0.27
|
$
|
0.25
|
$
|
0.23
|
$
|
0.41
|
||||||||||
|
Weighted
average number of shares outstanding — basic
|
18,495,642
|
21,526,695
|
22,338,675
|
22,363,675
|
22,363,675
|
|||||||||||||||
|
—diluted
|
18,495,642
|
21,530,862
|
22,338,675
|
22,510,962
|
22,403,237
|
|||||||||||||||
|
Cash
dividend declared per common share
|
0.05
|
-
|
-
|
-
|
-
|
|||||||||||||||
|
Cash
flows data:
|
||||||||||||||||||||
|
Net
cash flows provided by/used in operating activities
|
$
|
4,340,346
|
$
|
10,272,612
|
$
|
7,662,424
|
$
|
9,644,401
|
$
|
14,688,351
|
||||||||||
|
Net
cash flows provided by/used in investing activities
|
-3,089,900
|
-13,676,919
|
-12,246,855
|
-11,084,844
|
-3,281,369
|
|||||||||||||||
|
Net
cash flows provided by/used in financing activities
|
-268,782
|
5,046,022
|
6,295,377
|
958,553
|
-8,426,513
|
|||||||||||||||
|
September 30,
|
||||||||||||||||||||
|
2005
|
2006
|
2007
|
2008
|
2009
|
||||||||||||||||
|
Balance
sheet data:
|
||||||||||||||||||||
|
Cash
and cash equivalents
|
$
|
2,650,867
|
$
|
4,319,579
|
$
|
6,377,488
|
$
|
6,462,505
|
$
|
9,493,026
|
||||||||||
|
Working
capital
|
7,160,711
|
15,285,070
|
12,379,247
|
12,370,246
|
23,023,033
|
|||||||||||||||
|
Total
assets
|
54,223,425
|
67,171,711
|
85,121,335
|
101,918,091
|
100,936,009
|
|||||||||||||||
|
Total
current liabilities
|
18,667,138
|
14,735,036
|
24,085,690
|
28,966,069
|
18,679,691
|
|||||||||||||||
|
Total
long term liabilities
|
37,271
|
21,707
|
22,857
|
41,965
|
41,899
|
|||||||||||||||
|
Total
liabilities
|
18,704,409
|
14,756,743
|
24,108,547
|
29,008,034
|
18,721,590
|
|||||||||||||||
|
Total
stockholders’ equity
|
34,354,830
|
52,265,472
|
60,821,657
|
72,761,751
|
82,131,604
|
|||||||||||||||
23
Item
7. Management’s
Discussion and Analysis of Financial Condition and Results of
Operations
Overview
Winner
Medical’s business operations consist of the manufacturing and marketing,
research and development of medical dressings and medical disposable products.
The Company has seven wholly-owned operating subsidiaries and four joint venture
companies. The Company has established several integrated manufacturing and
processing lines for its core products. The Company’s product offerings include
medical care, wound care, home care products and PurCotton products, a nonwoven
fabric made from 100% natural cotton. The Company manufactures its products in
China and sells them both in China and abroad in other countries and areas such
as Japan, Germany, Italy, the Netherlands, the United Kingdom, Australia,
France, South America, Africa, the Middle East and the United
States.
The
following analysis discusses changes in the financial condition and results of
operations at and for the year September 30, 2009 and 2008, and should be read
in conjunction with the Company’s audited consolidated financial statements and
the notes thereto included elsewhere in this Report.
The
Company’s History
Winner
Medical Group Inc., formerly known as Birch Enterprises, Inc., HDH Industries,
Inc. and Las Vegas Resorts Corporation, was originally incorporated in the State
of Nevada in August 1986. From July 1993 until late 2005, the Company’s
immediate predecessor, Las Vegas Resorts Corporation, and its predecessors had
no meaningful business operations.
On
December 16, 2005, Winner Medical Group Inc. and Winner Group Limited entered
into a share exchange agreement pursuant to which the stockholders of Winner
Group Limited were issued 42,280,840 shares of Winner Medical Group Inc. common
stock in exchange for all 1,143,000 shares of Winner Group Limited that were
issued and outstanding as of December 16, 2005. In connection with the
acquisition transaction, Winner Group Limited became the Company’s wholly-owned
subsidiary. Even though, from a legal perspective, Winner Medical Group Inc. was
the acquirer in this transaction, Winner Group Limited is treated the acquirer
from an accounting perspective. On October 6, 2009, the Company’s board of
directors has approved a 1-for -2 reverse stock split of its issued and
outstanding common shares and authorized shares. 42,280,840 shares
had been restated to 21,140,420 shares in the Company’s financial statements.
Upon effectiveness of the reverses stock split, the outstanding and issued
shares were approximately 22,363,675 shares, before rounding up of
fractional shares.
Winner
Medical Group Inc. presently conducts its business operations through its
operating subsidiaries located in China and elsewhere.
The
Company’s Business Operations
Winner
Medical’s present business operations commenced February 1991 and involve the
manufacture and marketing of its products primarily out of its facilities in
China. The Company generates revenue through domestic (China) and foreign sales
of a variety of medical dressings and medical disposables products, such as
medical care, wound care, home care products and PurCotton products, a nonwoven
fabric made from 100% natural cotton.
The
Company has integrated manufacturing lines that provide its clients with the
ability to procure certain products from a single supplier. The Company sells
its own brand products in the developing countries including China, the Middle
East, South America, Africa, and Southeast Asia. In the developed countries
where it sells its products, the Company provides its customers with its
specialized design, manufacturing and packaging services. When the Company works
on this basis, its clients are able to select the design, size, type and scale
of the products the Company manufactures for them.
The
Company’s board of directors decided it was in its best interest to transfer all
the business operations of the Company’s subsidiary Winner Medical & Textile
Ltd. Zhuhai, “Winner Zhuhai”, to Winner Industrial (Shenzhen) Co. Ltd. and
Winner Medical & Textile Ltd. Jingmen. On February 1, 2008, the Company
stopped all the business operations of Winner Zhuhai and filed for the
deregistration of Winner Zhuhai with various government authorities in the PRC.
As of September 30, 2009, Winner Zhuhai received approvals from various
government authorities in the PRC regarding its application for deregistration,
except the relevant tax bureau clearance is still on-going.
In October 2008, in order to execute a
change of the Company’s marketing strategy in the Middle East Countries, the
board of directors of Winner Medical Jordan Ltd., “Winner Jordan”, decided to
deregister Winner Jordan. Instead, the Company appointed marketing agents in
Jordan for its business in Middle East. The total investment previously put into
Winner Jordan was $185,000, representing a 35% ownership of Winner Jordan. There
was no operation in Winner Jordan since its establishment in May 2007. The total
loss from Winner Jordan, mainly representing the setting-up expense, since its
date of incorporation attributable to the Company is approximately
US$43,000.
24
In April
2009, the board of directors of Winner Industries (Shenzhen) Co., Ltd., a
wholly-owned subsidiary of the Company, decided to establish a joint venture
with Chengdu Likang Industries Co., Ltd. The new joint venture company, Chengdu
Winner Likang Medical Appliances Company Limited, has a registered capital of
RMB 5 million, or approximately $0.73 million; the total investment from Winner
Industries (Shenzhen) Co., Ltd. is RMB 2.45 million, or approximately $0.36
million. Chengdu Winner Likang Medical Appliances Company Limited is 51%
owned by Chengdu Likang Industries Co., Ltd., and 49% by Winner Industries
(Shenzhen) Co., Ltd. Chengdu Winner Likang Medical Appliances Company
Limited will be engaged in the business of manufacturing and sales of “Winner”
brand products to hospitals in Western China, and is expected to begin its
operation in the near future.
Industry
Wide Trends that are Relevant to the Company’s Business
The
medical dressings and medical disposables manufacturing market are continually
evolving due to technological advances and new demands in the healthcare
industry. The Company believes the trends in the industry towards improving
medical care and patient conditions, changes in patient treatment approaches and
technological advances will impact favorably on the demand for its products. The
Company anticipates that these factors will result in growth in sales of medical
dressings and medical disposables products and increased revenue for the
Company.
The
export of medical dressings and medical disposables products from China has
grown rapidly over the last few years. The Company believes that its sales over
the next five years will grow in correlation to the growth of medical dressings
and medical disposables export volume from China.
The
medical dressings and medical disposables market is subject to consumption
patterns and trends. One such trend or consumption pattern relates to the age
demographics of the end users of the Company’s products. On average, the
worldwide population is aging and life spans are generally increasing. As the
general population begins to include a larger percentage of older people, the
Company anticipates that more medical care will be required, and that will
result in increased sales of the Company’s products.
Another
trend or consumption pattern in the Company’s industry is that hospitals are
increasingly seeking to reduce their costs. One method hospitals employ to
reduce costs is to seek alternative products that increase efficiency or reduce
labor costs. For example, disposable catheters may reduce the need for frequent
changes of diapers and bed sheets. Other popular disposable products used by
hospitals to reduce operating costs include Eustachian tubes and needles,
disposable clothing and accessories. The Company believes the demand for
cost-effective products and healthcare solutions and an increasing emphasis on
health in the U.S. and European Union will bring an increase in the demand for
medical instruments, medical dressings and medical disposables
products.
Also
affecting the Company’s industry is the growing trend towards protecting the
environment. Consumers are becoming increasingly concerned about the
environmental impact of the products they buy. Nonwoven medical dressings,
medical instruments and medical disposables products usually contain materials
like rubber and polyester, which may result in restrictions on these products
under environmental protection regulations which may negatively affect sales of
these products. Moreover, such materials are non-biodegradable and exploit
petroleum, a non-renewable energy resource. The Company believes this trend will
benefit the Company in competing with its competitors because its new PurCotton
products are primarily made of natural cotton, which is an environmentally
friendly raw material, and the Company’s new nonwoven fabric manufacturing
capabilities enables it to make new products with natural cotton at lower costs.
The Company believes PurCotton products are a medium- to long-term growth
contributor to its revenue, because they can be applied to the medical industry
as well as to other consumer products.
The
Company believes that there is a trend in its industry that is resulting in the
geographical shift in product manufacturing from countries with high labor and
manufacturing costs to countries, such as China, where labor and manufacturing
costs are generally lower. As a result of the lower cost structure and rapid
development of the Chinese economy, more foreign multinational companies are
entering the Chinese market to produce their goods as China emerges as part of
the global production and supply chain. The Company anticipates that this trend
of large multinational companies seeking to produce their products in China will
benefit the Company. In addition, the Company is negotiating with several large
companies in the industry in developed countries which intend to outsource some
of their production lines.
Finally,
the Company estimates that China’s local market demand for medical dressings and
medical disposables products will continue to grow. This presents a significant
opportunity for the Company. The Company is developing distribution network to
capture opportunities in China, mainly through local distributors,
over-the-counter drugstore chains, and direct sales to hospitals.
Competition
The
Company competes based upon manufacturing capacity, product quality, product
cost, ability to produce a diverse range of products and logistical
capabilities.
25
The
Company encounters significant competition within China and throughout the
world. Some of the Company’s competitors have greater financial resources,
additional human resources, and more established market recognition in both
domestic and international markets than the Company does. However, the Company
believes that its China-based competitors have lower labor costs, but their
products often lack diversity. With respect to the Company’s competitors located
outside China, it believes competitors in India generally utilize older
equipment to manufacture their products, resulting in lower product quality. The
Company’s competition in Europe and North and South America may have a
geographic advantage in the European Union and U.S. markets, but the Company
believes they are generally manufacturing on a smaller scale, have less product
diversity and higher production costs.
The
Company’s competitive advantages
Customers
in the medical field employ high quality standards, since product quality and
safety are their primary consideration. They will undergo strict
factory and production system verification and product quality testing on their
target suppliers. Once a supplier passed their test, it is costly for the
customers to switch to others. Compared with the Company’s
competitors, its competitive advantages include the following:
- Sound quality management system
and certificates obtained. The Company has already established three
quality management systems, ISO9001:2000 quality management system,
ISO13485:2003 medical devices quality control system, and 21CFR Part 820 U.S.
FDA (United States Food and Drug Administration) Medical Device Quality System
Regulation. Also, the Company is proud to be one of the few to receive FDA
approval to export sterilized products to the US directly. Currently, over 90%
of the Company’s products have obtained European Union CE certificates. There
are also 30 types of products registered and listed with the FDA in the US,
among those are the sterilization pouches and face masks that have got 510K (US
FDA) certificates. The Japanese certificates, which are awarded to individual
factories, have been granted to the Company’s Shenzhen factory, Jiayu factory,
and Chongyang factory, which are factories qualified and entitled to export
products to Japan.
- Quality control on vertically
integrated production capacities. The Company has shaped its integrated
manufacturing lines to meet client preferences of procuring a range of products
from a single trusted supplier. The Company’s services range from raw material
processing, bleaching, folding, packaging and sterilization to finished product
delivery. They are adamant about maintaining stringent quality control
throughout each stage. The Company has factories in Hubei, Shenzhen and
Shanghai, production plants in Hubei province are primarily focused on upstream
manufacturing, and the facilities in Shenzhen are focused on higher value-added
processing to finished products.
- Innovation. The Company is
dedicated to invest in research and development to drive innovation. The focus
is on the PurCotton manufacturing process to improve product quality and enhance
efficiency, and also continuing to expand PurCotton line through line extensions
and value-added features. The Company has already obtained invention patent in
China, the U.S., Russia, Singapore, South Africa, and 34 member states of the
European Patent Office for the invention of spunlace cotton nonwoven manufacture
process.
The
Company’s strategy against current economic crisis
Due to
the current economic crisis, the prices of all raw materials such as petroleum
and cotton decreased; as a result, some of the Company’s customers requested the
Company to decrease the prices for most of its product lines. Following is the
Company’s strategy to address this challenge:
- Focus on higher margin
products. As its long term plan, the Company is executing a systematic
plan for the marketing and sales of PurCotton products, which have a higher
margin than its traditional products. Even though it experienced low margins
during the initial stage of the PurCotton product launch, the Company believes
it will generate a higher margin than its traditional products once PurCotton
products commence mass production. At the same time, the Company is working on
equipment technical improvements at Winner Huanggang to increase production
efficiency.
- Implement lean production and
equipment technical improvements. The Company implements lean production
management and equipment technical improvements among all subsidiaries to
eliminate waste during production and increase efficiency.
- Purchase price decreases across
the raw materials from the Company’s suppliers. The Company tries its
best efforts to maintain good relationships with its major suppliers and obtain
as much lower prices as possible.
- Control administrative
expense. The Company will continue to optimize the Enterprise Resources
Planning, “ERP”, software provided by Systems Applications and Products Company,
“SAP”, which enables the Company to reduce its administrative staff, and thus
lower its administrative expenses.
- Optimize resource
allocation. The Company aims to reduce production costs and
administrative and transportation expenses and optimize resource allocation. For
instance, due to the limited production and operational area, the Company’s
wholly-owned subsidiary, Winner Medical & Textile Ltd. Zhuhai, “Winner
Zhuhai”, is not cost effective to further expand its production of certain types
of gauze products. To solve this inefficiency of resource utilization, the
Company transferred production to Winner Industrial (Shenzhen) Co. Ltd., “Winner
Shenzhen,” and Winner Medical & Textile Ltd. Jingmen, “Winner Jingmen”.
Zhuhai is now in the final stage of deregistration and there was no production
at all during the year.
26
- Reduce labor input. Through
improving production techniques, the Company can reduce labor costs and increase
efficiency by automation.
Chinese
government actions in favor of the Company
- Chinese Medical Reform. The
Chinese government’s announced RMB 850 billion healthcare spending in the
following three years to reform the healthcare system will greatly improve the
accessibility to and desire for medical care. The Chinese government’s increased
spending in the medical devices sector is a driving force of the Company’s
future development.
- Increased Government
Subsidies. During the economic crisis, the Chinese government increased
the subsidies to private enterprises to stimulate innovation, research and
development, brand promotion and management improvement. The Company has already
received and expects to receive some of these government subsidies.
- VAT Tax Reform. The Chinese
government reformed its policy on Value Added Taxes, VAT, for purchased
machinery. Starting January 1, 2009, the 17% input VAT for machinery is eligible
for a reimbursement. This new policy will reduce the Company’s cost on equipment
technical improvements and purchase of machineries.
- Tax Rebate Policy. The
Chinese State Ministry of Finance and State Ministry of Taxation announced that
as of June 1, 2009, the tax rebate rate for exports of medical dressing and
related products would be increased by two percent. Effective from June 1, 2009,
the tax rebate rate for exports of all the Company’s medical dressing products,
and also some types of medical equipment will increase from 13% to 15%; the tax
rebate rate for exports of the Company’s plastic and glass products will
increase from 11% to 13%.
Results
of Operations
Comparison for the Year
Ended September 30, 2009 and 2008
The
following sets forth certain of the Company’s income statement information for
the years ended September 30, 2009 and 2008.
(All
amounts, other than percentages, in thousand of U.S. dollars)
|
YEAR ENDED 9/30/09
|
YEAR ENDED 9/30/08
|
|||||||||||||||||
|
Item
|
In
Thousand
|
As a
Percentage
|
In Thousand
|
As a
Percentage
|
Amount
Change
|
% Change
|
||||||||||||
|
Sales
Revenue
|
$
|
98,386
|
100.00
|
%
|
$
|
85,506
|
100.00
|
%
|
$
|
12,880
|
15.06
|
%
|
||||||
|
Costs
of Goods Sold
|
$
|
70,444
|
71.60
|
%
|
$
|
64,087
|
74.95
|
%
|
$
|
6,357
|
9.92
|
%
|
||||||
|
Gross
profit
|
27,941
|
28.40
|
%
|
21,419
|
25.05
|
%
|
6,522
|
30.45
|
%
|
|||||||||
|
Other
Operating Income, Net (1)
|
$
|
1,411
|
1.43
|
%
|
$
|
416
|
0.48
|
%
|
$
|
995
|
239.18
|
%
|
||||||
|
Exchange
Difference, Net
|
$
|
-1,055
|
-1.07
|
%
|
$
|
-1,378
|
-1.61
|
%
|
$
|
323
|
-23.44
|
%
|
||||||
|
Selling,
general and administrative expenses
|
$
|
16,874
|
17.15
|
%
|
$
|
14,438
|
16.88
|
%
|
$
|
2,436
|
16.87
|
%
|
||||||
|
Interest
Expense
|
$
|
459
|
0.47
|
%
|
$
|
591
|
0.69
|
%
|
$
|
-132
|
-22.34
|
%
|
||||||
|
Interest
Income
|
$
|
69
|
0.07
|
%
|
$
|
41
|
0.05
|
%
|
$
|
28
|
68.29
|
%
|
||||||
|
Investment
yields
|
$
|
388
|
0.39
|
%
|
$
|
93
|
0.11
|
%
|
$
|
295
|
317.20
|
%
|
||||||
|
Income
tax
|
$
|
2,358
|
2.39
|
%
|
$
|
591
|
0.69
|
%
|
$
|
1,767
|
298.98
|
%
|
||||||
|
Minority
interest
|
$
|
65
|
0.07
|
%
|
$
|
94
|
0.11
|
%
|
$
|
-29
|
-30.85
|
%
|
||||||
|
Net
income
|
$
|
9,129
|
9.28
|
%
|
$
|
5,066
|
5.93
|
%
|
$
|
4,063
|
80.20
|
%
|
||||||
(1) Other
operating income, net are mainly consists of incomes from the sales of unused
raw materials, sales of leftover materials, and the government
subsidies.
Segment
Information
In fiscal
2009, the Company’s operations were conducted in two operating segments. The
Company’s operating decisions, on-site management, internal reporting and
performance assessments are conducted within each of the following two
identified segments:
|
·
|
Traditional
Products (Medical Care, Wound Care, Home Care)
|
|
·
|
PurCotton
Products
|
27
The
following table summarizes the operating results for fiscal years 2009 and 2008
by segment.
(All
amounts, other than percentages, in thousand of U.S. dollars)
|
Traditional Products
(Medical Care, Wound
Care, Home Care)
|
PurCotton Products
|
Consolidated
|
||||||||||||||||
|
Item
|
2009
|
2008
|
2009
|
2008
|
2009
|
2008
|
||||||||||||
|
Revenue
|
92,917
|
84,147
|
5,468
|
1,359
|
98,386
|
85,506
|
||||||||||||
|
Gross
Profit
|
26,490
|
21,324
|
1,452
|
95
|
27,941
|
21,419
|
||||||||||||
|
Income
from Operations Before Taxes
|
11,486
|
6,760
|
(65
|
)
|
(1,197
|
)
|
11,421
|
5,563
|
||||||||||
|
Net
(loss) income
|
8,931
|
6,263
|
198
|
(1,197
|
)
|
9,129
|
5,066
|
|||||||||||
The
following table illustrates the sales revenues from the Company’s business
segments for the years ended September 30, 2009 and 2008. The table also
provides the percentage of total revenues represented by each listed product
type.
(All
amounts, other than percentages, in thousand of U.S. dollars)
|
Year Ended
on 9/30/09
in Thousand
|
As a
Percentage of
Total Revenues
|
Year Ended
on 9/30/08
in Thousand
|
As a
Percentage of
Total Revenues
|
Amount
Change
in Thousand
|
As a
Percentage
Change
|
|||||||||||||
|
Traditional
Products (Medical care, Wound care, and Home Care)
|
$
|
92,917
|
94.44
|
%
|
$
|
84,147
|
98.41
|
% |
|
$
|
8,770
|
10.42
|
%
|
|||||
|
PurCotton
Products
|
$
|
5,468
|
5.56
|
%
|
1,359
|
1.59
|
%
|
|
$
|
4,109
|
302.35
|
%
|
||||||
|
Total
|
$
|
98,386
|
100.00
|
%
|
$
|
85,506
|
100.00
|
%
|
|
$
|
12,880
|
15.06
|
%
|
|||||
Traditional
Products Business Segment
Sales
revenue from traditional products increased $8,770,000 or 10.42%, to $92,917,000
for the year ended September 30, 2009 from $84,147,000 for the year ended
September 30, 2008. This increase was mainly attributable to an increased volume
of large sales orders from North and South American customers. The Company has
been gradually shifting its resources and services to larger clients. As a
result, the Company expects revenue from these significant customers will
increase in the future.
PurCotton
Products Business Segment
During
fiscal year 2009, revenue from PurCotton products increased $4,109,000, or
302.35%, to an amount of $5,468,000 for the year ended September 30, 2009 from
$1,359,000 for the year ended on September 30, 2008. Such sales were mainly from
the selling of PurCotton jumbo rolls to customers in China, the U.S., Europe and
Japan who produce consumer products, including sanitary and incontinence
products. The Company is also processing orders of PurCotton finished medical
products, such as operation room towel and sponges, with customers in North
America and Europe. As of September 30, 2009, the first two PurCotton
manufacturing lines are producing in full capacity. Compared to the third
quarter, the third manufacturing line has completed testing and started
production. In August 2009, the Company entered into a contract with a machine
producer in China to purchase new machineries for the fourth production line,
these machineries are expected to start production in the second quarter of
2010.
Looking
forward, the Company is marketing its own branded PurCotton consumer products
such as sanitary products and home care products in China. The Company is
confident in its mid to long-term growth potential and believes steady progress
has been made to expand the net sales.
28
Sales
by Region
The
following table illustrates the sales revenues from the major geographic areas
in which the Company sells its products for the years ended September 30, 2009
and 2008. The table also provides the percentage of total revenues represented
by each listed region.
(All
amounts, other than percentages, in thousand of U.S. dollars)
|
Year Ended
on 9/30/09
in Thousand
|
As a
Percentage of
Total Revenues
|
Year Ended
on 9/30/08
in Thousand
|
As a
Percentage of
Total Revenues
|
Amount
Change
in Thousand
|
As a
Percentage
Change
|
||||||||||||
|
Europe
|
39,599
|
40.25
|
%
|
40,582
|
47.46
|
%
|
-983
|
-2.42
|
%
|
||||||||
|
Japan
|
17,607
|
17.90
|
%
|
16,340
|
19.11
|
%
|
1,267
|
7.75
|
%
|
||||||||
|
North
and South America
|
18,824
|
19.13
|
%
|
12,403
|
14.51
|
%
|
6,421
|
51.77
|
%
|
||||||||
|
China
|
16,602
|
16.87
|
%
|
10,963
|
12.82
|
%
|
5,639
|
51.44
|
%
|
||||||||
|
Other
|
5,753
|
5.85
|
%
|
5,217
|
6.10
|
%
|
536
|
10.27
|
%
|
||||||||
|
Total
|
98,386
|
100.00
|
%
|
85,506
|
100.00
|
%
|
12,880
|
15.06
|
%
|
||||||||
Sales
Revenue
Sales
revenue increased $12,880,000, or 15.06%, to $98,386,000 for the year ended
September 30, 2009 from $85,506,000 for the year ended on September 30, 2008.
This increase was mainly attributable to an increased volume of large sales
orders from North and South American customers, Chinese customers, as well as
increased sales of PurCotton products. The Company has been gradually shifting
its resources and services to larger clients. As a result, the Company expects
revenue from these significant customers will increase in the future. The sales
revenue to North and South America customers was $18,824,000 for the year ended
September 30, 2009, an increase of 51.77% compared to the same period last
year.
The net
sales to customers in China were $16,602,000 for the years ended September 30,
2009, an increase of 51.44% compared to the same period last year. The Company’s
own branded products in China are distributed through hospitals, distributors,
and drugstore chains. The Company put great effort in its brand building in
China, and its brand is well accepted by its clients and end customers. In April
2009, “Winner” was recognized by the Trademark Office of the Chinese State
Administration for Industry and Commerce as a Well-known trademark. The increase
of sales in China is also due to the increased demand for face mask and
protective gown as a result of swine flu in China.
Other
Operating Income, Net
The
Company’s other operating income, net, for the year ended September 30, 2009,
increased $995,000 to $1,411,000, from $416,000 for the year ended September 30,
2008. Other operating income, net mainly consists of income from unused raw
materials, sales of leftover materials, and government subsidies, which are
incentives awarded by the PRC local government to the Company. The increase was
mainly attributable to the increased sales of leftover materials and government
subsidies.
29
Exchange
Difference, Net
The
Company’s exchange difference, net, for the year ended September 30, 2009,
decreased by $323,000 to a loss of $1,055,000, from a loss of $1,378,000 for the
year ended September 30, 2008. The decrease of exchange losses is mainly due to
the decreased foreign currency exchange losses recognized from October to
December 2008 compared with the same period last year. After its customers
placed orders with the Company at an agreed selling price in Euro and US Dollar,
the Renminbi (RMB) appreciated against the Euro and US Dollar; as a result, the
Company suffered a foreign currency exchange loss on the actual payment date. On
December 31, 2008 and 2007, the exchange rates of RMB against Euro were 9.6590
and 10.6669 respectively; the appreciation of RMB against Euro was 10.43%. The
exchange rates of RMB against US dollar were 6.8346 and 7.3046 respectively; the
appreciation of RMB against US dollar was 6.88% From January to September 2009,
the Renminbi (RMB) was relatively stable against foreign currency exchange rate
compared with the same period last year.
Cost
of Goods Sold
The
Company’s cost of goods sold increased $6,357,000 to $70,444,000 for the year
ended September 30, 2009 from $64,087,000 for the year ended September 30, 2008.
As a percentage of net revenues, the cost of goods sold decreased 3.35% to
71.60% for the year ended September 30, 2009 from 74.95% for the year ended
September 30, 2008. The decrease as percentage of revenue was mainly
attributable to the unit product cost decrease as a result of the improvement of
the Company’s cost control and lean production management that increased
production efficiency and reduced production waste.
Gross
Profits
The
Company’s gross profit increased $6,522,000 to $27,941,000 for the year ended
September 30, 2009 from $21,419,000 for the year ended September 30, 2008. Gross
profit as a percentage of net revenues was 28.40% for the year ended September
30, 2009, as compared to 25.05% for the year ended September 30, 2008. The
increase in gross profit as a percentage of net revenue was mainly due to (1)
the improvement of the Company’s cost control, equipment technical improvements
and lean production management that increased production efficiency and reduced
production waste, (2) the tax rebate rate for exports increased by two percent,
and (3) the PurCotton products start making profit during the month of June 2009
compared to losses from these products during the same period last
year.
The
following table illustrates the gross profits from each product types for the
years ended September 30, 2009 and 2008. The table also provides the percentage
of total gross profits represented by each product type.
(All
amounts, other than percentages, in thousand of U.S. dollars)
|
Year Ended
on 9/30/09
in Thousand
|
Gross Margin
|
Year Ended
on 9/30/08
in Thousand
|
Gross Margin
|
Amount
Change
in Thousand
|
As a
Percentage
Change
|
||||||||||||
|
Traditional
Products (Medical care, Wound care, and Home Care)
|
$
|
26,489
|
28.51
|
%
|
$
|
21,324
|
25.34
|
%
|
$
|
5,165
|
24.22
|
%
|
|||||
|
PurCotton
Products
|
$
|
1,452
|
26.55
|
%
|
95
|
6.99
|
%
|
$
|
1,357
|
1428.42
|
%
|
||||||
|
|
|
|
|
|
|
||||||||||||
|
Consolidated
Total
|
$
|
27,
941
|
28.40
|
%
|
$
|
21,419
|
25.05
|
%
|
$
|
6,522
|
30.45
|
%
|
|||||
The gross
profit margin for PurCotton Products is 26.55% during the year ended September
30, 2009, mainly attributable to (1) the increase of sales, mainly from the
sales of PurCotton jumbo rolls; and (2) the increase of production which results
in a decrease of unit cost of good sales.
Selling
Expenses
The
Company’s selling expenses decreased $146,000 to $6,153,000 for the year ended
September 30, 2009 from $6,299,000 for the year ended September 30, 2008. As a
percentage of net revenues, the Company’s selling expenses decreased to 6.25%
for the year ended September 30, 2009 from 7.37% for the year ended September
30, 2008. The decrease as percentage of revenue was primarily attributable to
the decrease of approximately $1,453,000 in transportation expense for export
sales compared with the same period last year.
The
Company’s transportation expenses for domestic sales, i.e., transportation costs
within China, were $1,051,000, 1.07% of total sales, and $862,000, 1.01% of
total sales, in fiscal years 2009 and 2008, respectively. The Company’s
transportation expenses for export sales were $2,101,000, 2.14% of total sales,
and $3,553,000, 4.16% of total sales, in fiscal years 2009 and 2008,
respectively. The Company’s transportation fees for export sales decreased by
approximately $1,453,000 from fiscal year 2008 to fiscal year 2009 or
approximately 40.88%. This decrease in the transportation expenses for export
sales was mainly due to the fierce competition of shipping
companies.
30
Administrative
Expenses
The
Company’s administrative expenses increased $2,583,000, or 31.73%, to
$10,721,000 for the year ended September 30, 2009 from $8,138,000 for the year
ended September 30, 2008. As a percentage of net revenues, administrative
expenses increased to 10.90% for the year ended September 30, 2009 from 9.52%
for the year ended September 30, 2008. This increase was primarily attributable
to increase in salary for the management and administrative staff compared with
the same period last year, and an increase of approximately $260,000
related to implementation of Sarbanes-Oxley 404 compliance project expenses and
consulting expenses for brand building projects.
Interest
Expenses
Interest
expenses decreased to approximately $459,000, 0.47% of the total revenue, for
the year ended September 30, 2009 as compared to approximately $591,000, 0.69% of total revenue,
for the same period of 2008, a decrease of approximately $132,000, or 22.34%. The Company’s
interest expense relates to bank loans which are primarily used to maintain
daily operation. The percentage decrease of interest expense was mainly due to
(1) a decrease in the Company’s comparatively low average outstanding balance of
bank loans of approximately $6,589,000 as of September 30, 2009, compared with
approximately $15,033,000 as of September 30, 2008, and (2) decreased interest
rates of bank loans.
Income
taxes
Effective
on January 1, 2008, the PRC Enterprise Income Tax Law, or EIT Law, and
Implementing Rules impose a unified enterprise income tax rate of 25% on all
domestic-invested enterprises and foreign investment enterprises in China,
unless they qualify under certain limited exceptions. As such, starting from
January 1, 2008, three of the Company’s subsidiaries in China, including Winner
Medical & Textile Ltd., Jingmen, Winner Medical & Textile Ltd. Jiayu,
and Winner Medical & Textile Ltd. Yichang, are subject to an enterprise
income tax rate of 25%.
The EIT
Law gives existing foreign investment enterprises a five-year grandfather
period, during which they can continue to enjoy their existing preferential tax
treatments. For foreign investment enterprises that currently enjoy full
exemption from PRC enterprise income tax for two years starting from the first
profit-making year, followed by a 50% tax exemption for the next three years,
the tax holidays are still valid. Four of the Company’s PRC subsidiaries, Winner
Medical (Huanggang) Co., Ltd., Winner Medical & Textile Ltd. Chongyang,
Hubei Winner Textiles Co., Ltd., and Shanghai Winner Medical Apparatus Co., Ltd.
are each entitled to a two-year exemption from enterprise income tax and a
reduced enterprise income tax rate for the three years following its second
profitable year. The following table sets forth the tax rates applicable to the
Company’s PRC subsidiaries that enjoy existing preferential tax
treatments.
|
Calendar year end December 31
|
||||||||||||||||||||
|
2009
|
2010
|
2011
|
2012
|
2013
|
||||||||||||||||
|
Winner
Medical (Huanggang) Co., Ltd.
|
0 | % | 12.5 | % | 12.5 | % | 12.5 | % | 25 | % | ||||||||||
|
Winner
Medical & Textile Ltd. Chongyang
|
12.5 | % | 12.5 | % | 25 | % | 25 | % | 25 | % | ||||||||||
|
Hubei
Winner Textiles Co., Ltd.
|
12.5%
to 25
|
% | 25 | % | 25 | % | 25 | % | 25 | % | ||||||||||
|
Shanghai
Winner Medical Apparatus Co., Ltd.
|
12.5 | % | 12.5 | % | 12.5 | % | 25 | % | 25 | % | ||||||||||
In
October 2006, for the purpose of improving operation efficiency, Hubei Winner
Textiles Co., Ltd., “Winner Hubei”, merged with Winner Medical & Textile
Ltd. Tianmen, “Winner Tianmen”. Income from Winner Hubei and Winner Tianmen was
separately reported to the local tax office to reflect the different tax
incentive status enjoyed by each entity. The applicable income tax rate for
Winner Hubei and Winner Tianmen was 12.5% and 25% for calendar year 2009. The
preferential tax incentives will expire at the end of 2009.
On June
27, 2009, Winner Shenzhen obtained the High and New Technology Enterprise
Certificate which will be evaluated by the government authorities every 3 years.
As a result of this new status, Winner Shenzhen can enjoy a 15% income tax rate
in 2009, 2010 and 2011. For year 2012 and 2013, the tax rate will be subject to
whether Winner Shenzhen can obtain the High and New Technology Enterprise
Certificate status.
Winner
Medical (Hong Kong) Limited was incorporated in January 2008 and the applicable
statutory tax rate is 16.5%.
31
No
provision for US tax is made as the Company has no assessable income in the US
for the year ended September 30, 2009 and 2008. The enterprise income tax of US
is 34%.
The
Company’s income tax provision for fiscal year ended September 30, 2009 was $2,358,000 as
compared to $591,000 for the year ended September 30, 2008. The increase of
income tax is mainly due to (1) a change in the tax rate on the Company’s
subsidiaries in China, and (2) the cancellation of tax return policy for
purchasing domestic machinery.
Minority
interest
The
Company’s financial statements reflect an adjustment to its consolidated group
net income equal to $65,000 and $94,000 in the fiscal years 2009 and 2008,
respectively, reflecting third party minority interests in two of the Company’s
subsidiaries, 40% in Shanghai Winner Medical Apparatus Co., Ltd., and 40% in
Winner Medical (Hong Kong) Limited.
Net
income (profit after taxes)
Net
profit increased to approximately $9,129,000 for the year ended
September 30, 2009 as compared to approximately $5,066,000 for the same period of
2008, an increase of approximately $4,063,000, or approximately 80.20%.
Such increase is mainly attributable to (1) the PurCotton products start
making profit from June, 2009 compared to losses from these products for the
same period of 2008, (2) the Company’s improved production management to reduce
manufacture unit cost and improved production efficiency and (3) relatively
stable RMB against foreign currency exchange rate since calendar year
2009.
(All
amounts, other than percentages, in thousand of U.S. dollars)
|
Year Ended
on 9/30/09
in Thousand
|
Net Profit
Margin
|
Year Ended
on 9/30/08
in Thousand
|
Net Profit
Margin
|
Amount
Change
in Thousand
|
As a
Percentage
Change
|
||||||||||||
|
Traditional
Products (Medical care, Wound care, and Home Care)
|
$
|
8,931
|
9.08
|
%
|
6,263
|
7.32
|
%
|
$
|
2,668
|
42.60
|
%
|
||||||
|
PurCotton Products
|
$
|
198
|
0.20
|
%
|
-1,197
|
-1.40
|
%
|
$
|
1,395
|
-116.54
|
%
|
||||||
|
Consolidated
Total
|
$
|
9,129
|
9.28
|
%
|
5,066
|
5.92
|
%
|
$
|
4,063
|
80.20
|
%
|
||||||
Foreign
Currency Translation Difference
The
Company incurred a loss in foreign currency translation, equal to a loss of
$59,000 and a gain
of $6,291,000 in
the years ended September 30, 2009 and 2008, respectively. On July 21, 2005,
China reformed its foreign currency exchange policy to adopt floating RMB
exchange rates. On September 30, 2009 and 2008, the exchange rates of RMB
against US dollar were 6.8290 and 6.8183 respectively; the RMB appreciation was
0.16%. As a result, the Company implemented different exchange rates in
translating RMB into U.S. dollar in its financial statements for the years ended
September 30, 2009 and 2008. In the year ended September 30, 2009, the exchange
rates of 6.8290, 8.277 and 6.8237 were implemented in calculating the total
assets/liabilities, shareholders’ equity and profit and loss, as compared to the
exchange rates of 6.8183, 8.277 and 7.1643 in the year ended September 30, 2008,
respectively. In addition, the Company also implemented different exchange rates
in translating Hong Kong dollar into U.S. dollar in its financial statements for
the year ended September 30, 2009. In the year ended September 30, 2009, the
exchange rates of 7.7502, 7.7787 and 7.7645 were implemented in calculating the
total assets/liabilities, shareholders’ equity and profit and loss,
respectively.
Inventory
turnover
The
Company’s inventory decreased to approximately $14,933,000 for the year ended
September 30, 2009 as compared to approximately $15,840,000 for the same period of
2008, a decrease of approximately $907,000, or 5.73%. The Company’s
inventory turnover was 4.52 and 4.69 in fiscal years 2009 and 2008,
respectively. The decrease of inventory is mainly attributable to the decrease
of raw materials and semi-finished products as a result of the Company’s lean
production and risk control on inventory in order to improve its free cash
flow.
Accounts
receivable collection period
Accounts
receivable decreased to approximately $13,148,000 for the year ended
September 30, 2009 as compared to approximately $13,517,000 for the same period of
2008, a decrease of approximately $369,000, or 2.73%. The Company’s
average accounts receivable collection period was 44.97 days and 49.47 days in
fiscal years 2009 and 2008, respectively. In order to reduce the risk of
inability to collect the accounts receivables, the Company entered into a
one-year insurance policy with China Export & Credit Insurance Corporation
effective on April 25, 2009 and will be automatically renewable subject to a one
month written notice given by either party. The maximum insurance coverage from
China Export & Credit Insurance Corporation is US$4 million. Also the
Company is using SAP ERP system to evaluate and monitor accounts receivables
risks of each individual customer.
32
Liquidity
and Capital Resources
As of
September 30, 2009, the Company had cash and cash equivalents of approximately
$9,493,000.
Cash
Flow
(in
Thousand US$)
|
Years Ended
September 30,
|
|||||
|
2009
|
2008
|
||||
|
|
|||||
|
Net
cash provided by operating activities
|
14,688
|
9,644
|
|||
|
Net
cash used in investing activities
|
(3,281)
|
(11,085)
|
|||
|
Net
cash (used in) provided by financing activities
|
(8,427)
|
959
|
|||
|
Effect
of exchange rate changes on cash balance
|
50
|
567
|
|||
|
Net
increase in cash and cash equivalents
|
3,031
|
85
|
|||
|
Cash
and cash equivalents at the beginning of year
|
6,463
|
6,377
|
|||
|
Cash
and cash equivalents at the end of year
|
9,493
|
6,463
|
|||
Operating
Activities:
Net cash
provided by operating activities was $14,688,000 for the year ended September
30, 2009 which is an increase of $5,044,000 from the $9,644,000 net cash
provided by operating activities for the same period in 2008. The increase was
mainly due to the increase in net income in fiscal year 2009 compared to the
same period last year and a decrease in the Company’s inventory. This increase
was partially offset by a decrease in the Company’s accounts
payable.
Investing
Activities:
The
Company’s main uses of cash for investing activities are payments to the
acquisition of property, plant and equipment.
Net cash
used in investing activities for the year ended September 30, 2009 was
$3,281,000, which decreased in the amount of $7,803,000 from net cash used in
investing activities of $11,085,000 in the same period of 2008. This was due to
the decrease of investment in property, plant, and equipment. The Company has
reduced and delayed its investment in fixed assets during fiscal year 2009 to
achieve a better utilization of cash.
Financing
Activities:
Net cash
used in financing activities for the year ended September 30, 2009 totaled
$8,427,000 as compared to $959,000 provided by financing activities in the same
period of 2008. Such decrease of cash provided by financing activities was
mainly attributable to the increase in repayments of bank borrowings and a
reduction in bank borrowing.
The
Company’s loan to asset ratio was approximately 18.51% as of September 30, 2009.
The Company plans to maintain its debt to asset ratio below 40%. The Company
believes that it currently maintains a good business relationship with each of
the banks with whom it has loans, as identified in the table below.
As of
September 30, 2009, the Company has loans with Chinese banks totaling
approximately $6,590,000. These loans have annual interest rates ranging from
4.78%-5.31%.
33
The
Company’s subsidiaries in Shenzhen, Tianmen and Huang Gang have credit lines
with Shenzhen Commercial Bank, Shenzhen Branch of the Industrial and Commercial
Bank of China, Tianmen Branch of the Industrial and Commercial Bank of China,
Huanggang Branch of the Industrial and Commercial Bank of China, representing
trade acceptances, loans and overdrafts.
Bank
loans as of September 30, 2009
|
Loan
|
Bank
|
Loan period
|
Interest
rate
|
Secured by
|
Balance as of
September 30,
2009
US$
|
|||||
|
A
|
China
Merchants Bank, Shenzhen Branch
|
2009.06.08-2010.06.08
|
4.78%
|
Land
use rights & buildings
|
1,464,343
|
|||||
|
B
|
China
Merchants Bank, Shenzhen Branch
|
2009.06.10-2010.06.10
|
4.78%
|
Land
use rights & buildings
|
1,464,343
|
|||||
|
C
|
China
Merchants Bank, Shenzhen Branch
|
2009.06.30-2010.06.30
|
4.78%
|
Land
use rights & buildings
|
1,464,343
|
|||||
|
D
|
Shenzhen
Industrial and Commercial Bank of China
|
2009.09.20-2010.09.20
|
5.31%
|
Land
use rights & buildings
|
732,173
|
|||||
|
E
|
Huanggang
Industrial and Commercial Bank of China
|
2009.02.27-2010.02.26
|
5.31%
|
Land
use rights & buildings
|
1,464,343
|
|||||
|
Total
|
6,589,545
|
As of
September 30, 2009, the Company had approximately $25.82 million bank credit
facilities available from four commercial banks, and excluding the $6.59
million banks loans as of September 30, 2009, there are $19.23 million unused
bank credit facilities, consisting of approximately $4.39 million from Shenzhen
Branch of China Merchants Bank, approximately $10.98 million from Shenzhen
Branch of the Industrial and Commercial Bank of China, approximately $0.44
million form Tianmen Branch of the Industrial and Commercial Bank of
China, and approximately $3.42 million from Huanggang Branch of the
Industrial and Commercial Bank of China. These loan facilities are all secured
by the Company’s real estate and other assets. These revolving lines of credit
allow the Company to make short-term loans repeatedly, and the banks re-evaluate
the Company’s credit line annually. These bank credits enable the Company to
utilize the short-term loans and enjoy a lower interest expense compared with
long-term loans.
The
Company believes that its currently available working capital, after taking into
account the credit facilities referred to above, short-term loans and future
cash provided by operating activities will be sufficient to meet its operations
at its current level and working capital and capital expenditure needs over the
next twelve months. The Company’s future capital requirements will depend on
many factors, including its rate of revenue growth, the expansion of its
marketing and sales activities, the timing and extent of spending to support
product development efforts and expansion into new territories, the timing of
new products or services introductions, the timing of enhancements to existing
products and services and the timing of capital expenditures. Also, the Company
may make investments in, or acquisitions of, complementary businesses, services
or technologies which could also require it to seek additional equity or debt
financing. To the extent that available funds are insufficient to fund its
future activities, the Company may need to raise additional funds through public
or private equity or debt financing. Additional funds may not be available on
terms favorable to the Company or at all.
Contractual
Obligations
As of
September 30, 2009, the Company’s contractual obligations are as
follows:
|
Payment due by period
|
||||||||||||||||||||
|
Contractual Obligations
|
Total
|
Less than 1
year
|
1 - 3 years
|
3 - 5 years
|
More than 5
years
|
|||||||||||||||
|
Short-Term
Debt Obligations
|
$ | 6,589,545 | $ | 6,589,545 | - | - | - | |||||||||||||
|
Long-Term
Debt Obligations
|
- | - | - | - | - | |||||||||||||||
|
Capital
Lease Obligations
|
- | - | - | - | - | |||||||||||||||
|
Operating
Lease Obligations
|
$ | 295,039 | $ | 179,673 | $ | 115,366 | - | - | ||||||||||||
|
Purchase
Obligations
|
$ | 2,840,864 | $ | 2,840,864 | - | - | - | |||||||||||||
|
Other
Long Term Liabilities Reflected on the Registrant’s Balance Sheet under
GAAP
|
- | - | - | - | - | |||||||||||||||
|
Total
|
$ | 9,725,448 | $ | 9,610,082 | $ | 115,366 | - | - | ||||||||||||
34
Critical
Accounting Policies
The
preparation of financial statements in conformity with accounting principles
generally accepted in the United States requires the Company’s management to
make assumptions, estimates and judgments that affect the amounts reported in
the financial statements, including the notes thereto, and related disclosures
of commitments and contingencies, if any. The Company considers its
critical accounting policies to be those that require the more significant
judgments and estimates in the preparation of financial statements, including
the following:
|
·
|
Principles of
consolidation –The Company’s consolidated financial statements were
prepared in accordance with generally accepted accounting principles in
the United States of America and include the assets, liabilities,
revenues, expenses and cash flows of the Company and all of its
subsidiaries. All significant intercompany accounts, transactions and cash
flows are eliminated on
consolidation.
|
|
·
|
Revenue Recognition
–The Company derives its revenue primarily from the sales of medical
dressings and disposables and Purcotten
products. Sales of goods are recognized when goods are shipped, title of
goods sold has passed to the purchaser, the price is fixed or determinable
as stated on the sales contract, and its collectibility is reasonably
assured. Customers do not have a general right of return on products
shipped. Products returns to the Company were
insignificant.
|
|
·
|
Inventory –Inventories
are stated at the lower of cost or market, determined by the weighted
average method. Work-in-progress and finished goods inventories consist of
raw material, direct labor and overhead associated with the manufacturing
process.
|
|
·
|
Trade accounts
receivable –Trade accounts receivable are stated at the amount
management expects to collect from balances outstanding at year-end. Based
on management's assessment of the credit history with customers having
outstanding balances and current relationships with them, it has concluded
that realization losses on balances outstanding at year-end will be
immaterial.
|
|
·
|
Property, plant and
equipment –Property, plant and equipment are stated at cost
including the cost of improvements. Maintenance and repairs are charged to
expense as incurred. Assets under construction are not depreciated until
construction is completed and the assets are ready for their intended use.
Depreciation and amortization are provided on the straight-line method
based on the estimated useful lives of the assets as
follows:
|
|
Leasehold
land
|
Over
the lease term
|
|
Buildings
|
10
- 30 years
|
|
Plant
and machinery
|
10
- 12 years
|
|
Furniture,
fixtures and equipment
|
5 -
8 years
|
|
Motor
vehicles
|
5 -
8 years
|
|
Leasehold
improvements
|
Over
the lease term
|
|
·
|
Impairment of long-lived
assets –The Company evaluates all of its long-lived assets for
impairment in accordance with the provisions of ASC 360, “Accounting for
the Impairment or Disposal of Long-Lived Assets”. The Company
assesses the impairment of fixed assets on an annual basis or whenever
events or changes in circumstances indicate that the fair value or future
discounted cash flows of these assets is less than the carrying value.
Should events indicate that any of the Company’s long-lived assets are
impaired; the amount of such impairment will be measured as the difference
between the carrying value and the fair value, or the difference between
the carrying value and future discounted cash flows of the impaired
assets, and recorded in earnings during the period of such
impairment.
|
|
|
·
|
Income taxes –Income
taxes are provided on an asset and liability approach for financial
accounting and reporting of income taxes. Any tax paid by subsidiaries
during the year is recorded. Current tax is based on the profit or loss
from ordinary activities adjusted for items that are non-assessable or
disallowable for income tax purpose and is calculated using tax rates that
have been enacted or substantively enacted at the balance sheet date.
Deferred income tax liabilities or assets are recorded to reflect the tax
consequences in future years of differences between the tax basis of
assets and liabilities and the financial reporting amounts at each year
end. A valuation allowance is recognized if it is more likely than not
that some portion, or all, of a deferred tax asset will not be
realized.
|
New
Accounting Policies
In
December 2007, FASB issued SFAS No. 160 “Non-controlling Interest in
Consolidated Financial Statements”, which is codified as ASC 810. ASC 810 amends
Accounting Research Bulletin No.51, Consolidated Financial Statements, to
establish accounting and reporting standards for the non-controlling interest in
a subsidiary and for the deconsolidation of a subsidiary. ASC 810
defines “a non-controlling interest, sometimes called a minority interest, is
the portion of equity in a subsidiary not attributable, directly or indirectly,
to a parent”. The objective of ASC 810 is to improve the relevance,
comparability, and transparency of the financial information that a reporting
entity provides in its consolidated financial statements. ASC 810 is
effective for fiscal years, and interim periods within those fiscal years,
beginning on or after December 15, 2008 and is required to be adopted by the
Company in the first quarter of fiscal year 2010. The Company is
evaluating the impact, if any, of the adoption of ASC 810. It is not
expected to have material impact on the Company’s consolidated financial
position, results of operations and cash flows.
In March
2008, the FASB issued SFAS No. 161 “Disclosures about Derivative Instruments and
Hedging Activities amendment of FASB Statement No. 133”, which is codified as
ASC 815. This statement changes the disclosure requirements for
derivative instruments and hedging activities. Entities are required
to provide enhanced disclosures stating how and why an entity uses derivative
instruments; how derivatives and related hedged items are accounted for under
SFAS No. 133, “Accounting for Derivative Instruments and Hedging Activities”
(“SFAS 133”) and its related interpretations; and how derivative instruments and
related hedge items affect an entity’s financial position, financial performance
and cash flows. ASC 815 is effective in fiscal years beginning after
November 15, 2008 and is required to be adopted by the Company in the first
quarter of fiscal year 2010. The Company does not expect the adoption
of ASC 815 will have a material impact on the Company’s
disclosures.
In April
2008, the FASB issued FSP 142-3, “Determination of the Useful Life of Intangible
Assets”, which is codified as ASC 350. ASC 350 amends the factors that should be
considered in developing renewal or extension assumptions used to determine the
useful life of a recognized intangible asset. ASC 350 is effective for fiscal
years beginning after December 15, 2008. The Company does not expect the
adoption of ASC 350 will have a material impact on the Company’s consolidated
financial position, results of operations and cash flows.
In June
2008, the FASB ratified EITF Issue No. 08-3, “Accounting for Lessees for
Maintenance Deposits Under Lease Arrangements”, which is codified as ASC 840.
ASC 840 provides guidance for accounting for nonrefundable maintenance deposits.
It also provides revenue recognition accounting guidance for the lessor. ASC 840
is effective for fiscal years beginning after December 15, 2008. The Company is
currently assessing the impact of ASC 840 on its consolidated financial position
and results of operations and is currently not yet in a position to determine
such effects.
In June
2008, the FASB issued FASB Staff Position (“FSP”) EITF 03-6-1 “Determining
Whether Instruments Granted in Share-Based Payment Transactions Are
Participating Securities”, which is codified as ASC 260. ASC 260 addresses
whether instruments granted in share-based payment transactions are
participating securities prior to vesting, and therefore need to be included in
the earnings allocation in computing earnings per share under the two-class
method. Under the guidance of ASC 260, unvested share-based payment awards that
contain nonforfeitable rights to dividends or dividend equivalents (whether paid
or unpaid) are participating securities and shall be included in the computation
of earnings-per-share pursuant to the two-class method. ASC 260 is effective for
financial statements issued for fiscal years beginning after December 15, 2008
and all prior-period earnings per share data presented shall be adjusted
retrospectively. Early application is not permitted. The Company is currently
evaluating the effect of ASC 260 on the earnings per share
calculation.
In
October 2008, the Company adopted SFAS No.157, “Fair Value Measurements”, which
is codified as ASC 820, it defines fair value, establishes a framework for
measuring fair value in generally accepted accounting principles (GAAP), and
expands disclosure about fair value measurements. ASC 820 is effective for
fiscal years beginning after November 15, 2007. The adoption of the provisions
of ASC 820 related to financial assets and liabilities, and other assets and
liabilities that are carried at fair value on a recurring basis do not have a
significant impact on the Company’s consolidated financial position, results of
operations and cash flows. The FASB provided for a one-year deferral of the
provisions of ASC 820 for non-financial assets and liabilities that are
recognized or disclosed at fair value in the consolidated financial statements
on a non-recurring basis. Accordingly, the Company is still evaluating the
impact of the provisions of ASC 820 for non-financial assets and liabilities and
is not yet in a position to determine such effects.
In April
2009, the FASB issued FSP No. FAS 141(R)-1, “Accounting for Assets Acquired and
Liabilities Assumed in a Business Combination That Arise from Contingencies”,
which is codified as ASC 805. ASC 805 amends and clarifies FASB Statement No.
141 (revised 2007), “Business Combinations”, to address application issues
raised by preparers, auditors, and members of the legal profession on initial
recognition and measurement, subsequent measurement and accounting, and
disclosure of assets and liabilities arising from contingencies in a business
combination. ASC 805 shall be effective for assets or liabilities arising from
contingencies in business combinations for which the acquisition date is on or
after the beginning of the first annual reporting period beginning on or after
December 15, 2008. The Company is currently evaluating the effect of ASC 805 on
its consolidated financial statements and results of operation and is currently
not yet in a position to determine such effects.
In June
2009, the FASB issued SFAS No. 166, Accounting for Transfers of Financial
Assets—an amendment of FASB Statement No. 140 (SFAS No. 166”). This standard has
not yet been codified in the FASB Accounting Standards Codification. SFAS No.
166 seeks to improve the relevance, representational faithfulness, and
comparability of the information that a reporting entity provides in its
financial statements about a transfer of financial assets; the effects of a
transfer on its financial position, financial performance, and cash flows; and a
transferor’s continuing involvement, if any, in transferred financial assets.
SFAS No. 166 is applicable for annual periods after November 15, 2009 and
interim periods therein and thereafter. The Company is currently evaluating the
effect of ASC 805 on its consolidated financial statements and results of
operation and is currently not yet in a position to determine such
effects.
In June
2009, the FASB issued SFAS No.167, “Amendments to FASB Interpretation No.46(R)”,
which is codified as ASC 810. ASC 810 amends FASB Interpretation No.46I,
“Variable Interest Entities” for determining whether an entity is a variable
interest entity (“VIE”) and requires an enterprise to perform an analysis to
determine whether the enterprise’s variable interest or interests give it a
controlling financial interest in a VIE. Under ASC 810, an enterprise has a
controlling financial interest when it has a) the power to direct the activities
of a VIE that most significantly impact the entity’s economic performance and b)
the obligation to absorb losses of the entity or the right to receive benefits
from the entity that could potentially be significant to the VIE. ASC 810 also
requires an enterprise to assess whether it has an implicit financial
responsibility to ensure that a VIE operates as designed when determining
whether it has power to direct the activities of the VIE that most significantly
impact the entity’s economic performance. ASC 810 also requires ongoing
assessments of whether an enterprise is the primary beneficiary of a VIE,
requires enhanced disclosures and eliminates the scope exclusion for qualifying
special-purpose entities. ASC 810 shall be effective as of the beginning of each
reporting entity’s first annual reporting period that begins after November 15,
2009, for interim periods within that first annual reporting period, and for
interim and annual reporting periods thereafter. Earlier application is
prohibited. ASC 810 is effective for the Company in the first quarter of fiscal
2011. The Company is currently evaluating the effect of ASC 810 on its
consolidated financial statements and results of operation and is currently not
yet in a position to determine such effects.
In June
2009, the FASB issued SFAS No. 168, “The ‘FASB Accounting Standards
Codification’ and the Hierarchy of Generally Accepted Accounting Principles”,
which is codified as ASC 105. ASC 105 establishes the “FASB Accounting Standards
Codification” (“Codification”), which officially launched July 1, 2009, to
become the source of authoritative U.S. generally accepted accounting principles
(“GAAP”) recognized by the FASB to be applied by nongovernmental entities. Rules
and interpretive releases of the Securities and Exchange Commission (“SEC”)
under authority of federal securities laws are also sources of authoritative
U.S. GAAP for SEC registrants. The subsequent issuances of new standards will be
in the form of Accounting Standards Updates that will be included in the
Codification. Generally, the Codification is not expected to change U.S. GAAP.
All other accounting literature excluded from the Codification will be
considered nonauthoritative. ASC 105 is effective for financial statements
issued for interim and annual periods ending after September 15, 2009. The
Company has adopted ASC 105 for the quarter ending September 30, 2009. The
adoption of this Statement will not impact the results of operations or
financial position, as it only required disclosures.
In August
2009, the FASB issued Accounting Standards Update (“ASU”) No. 2009-05,
“Measuring Liabilities at Fair Value”, which is codified as ASC 820, “Fair Value
Measurements and Disclosures”. This Update provides amendments to ASC 820-10,
Fair Value Measurements and Disclosures –Overall, for the fair value measurement
of liabilities. This Update provides clarification that in circumstances in
which a quoted price in an active market for the identical liability is not
available, a reporting entity is required to measure fair value using a
valuation technique that uses the quoted price of the identical liability when
traded as an asset, quoted prices for similar liabilities or similar liabilities
when traded as assets, or that is consistent with the principles of ASC 820. The
amendments in this Update also clarify that when estimating the fair value of a
liability, a reporting entity is not required to include a separate input or
adjustment to other inputs relating to the existence of a restriction that
prevents transfer of the liability. The amendments in this Update also clarify
that both a quoted price in an active market for the identical liability at the
measurement date and the quoted price for the identical liability when traded as
an asset in an active market when no adjustments to the quoted price of the
assets are required are Level 1 fair value measurements. The guidance provided
in this Update is effective for the first reporting period (including interim
periods) beginning after issuance. The adoption of this Update did not have a
significant impact to the Company’s consolidated financial
statements.
35
Off-Balance
Sheet Arrangements
The
Company has no off-balance sheet arrangements.
Seasonality
The
Company’s operating results and operating cash flows historically have not been
subject to seasonal variations. This pattern may change, however, as a result of
new market opportunities or new product introductions.
Item
7A. Quantitative and
Qualitative Disclosures
about Market Risk
Foreign
Exchange Risk
The
Company’s reporting currency is US dollar and the majority of its revenues will
be settled in RMB and US dollars. All of the Company’s assets are denominated in
RMB except for cash and accounts receivable. As a result, the Company is exposed
to foreign exchange risk as its revenues and results of operations may be
affected by fluctuations in the exchange rate between US dollars and
RMB.
The value
of the Renminbi, the main currency used in the PRC, fluctuates and is affected
by, among other things, changes in China's political and economic conditions. In
addition, the Renminbi is not readily convertible into US dollars or other
foreign currencies. All foreign exchange transactions continue to take place
either through the Bank of China or other banks authorized to buy and sell
foreign currencies at the exchange rate quoted by the People’s Bank of China.
The conversion of Renminbi into foreign currencies such as the US dollar has
been generally based on rates set by the People's Bank of China, which are set
daily based on the previous day's interbank foreign exchange market rates and
current exchange rates on the world financial markets. On September 30, 2009 and
2008, the exchange rates of RMB against Euro were 9.9659 and 9.9997
respectively; the appreciation of RMB against Euro was 3.39%. The exchange rates
of RMB against US dollar were 6.8290 and 6.8183 respectively. This floating
exchange rate, and any appreciation of the Renminbi that may result from such
rate, could have various adverse effects on the Company’s business.
The
Company’s currency exchange rate risks come primarily from the sales of products
to international customers. If the RMB appreciates against foreign currencies,
it will make the Company’s sale prices more expensive, thus its sales may
decline. The Company believes that the exchange rate of RMB against US dollar
will remain relatively stable in the short run.
Interest
Rate Risk
The
Company is exposed to interest rate risk primarily with respect to its
short-term bank loans. Although the interest rates are fixed for the terms of
the loans, the terms are typically three to twelve months and interest rates are
subject to change upon renewal. During calendar years 2007 and 2008 the People’s
Bank of China, the central bank of China, adjusted the interest rate of RMB bank
loans eleven times - on March 18, 2007, May 19, 2007, July 21, 2007, August 22,
2007, September 15, 2007, December 21, 2007, September 16, 2008, October 19,
2008, October 30, 2008, November 27, 2008, and December 23, 2008. Since
December, 2008, the new interest rates are 4.86% and 5.31% for RMB bank loans
with a term less than 6 months and loans with a term of 6-12 months,
respectively, as compared to the respective rates of 5.58% and 6.12%, before
March 18, 2007. A hypothetical 1.0% change in the annual interest rates for all
of the Company’s credit facilities on June 30, 2009 would affect the net income
before provision for income taxes by approximately $0.07 million for the nine
months ended June 30, 2009. Management monitors the banks’ interest rates in
conjunction with the Company’s cash requirements to determine the appropriate
level of debt balances relative to other sources of funds. The Company has not
entered into any hedging transactions in an effort to reduce its exposure to
interest rate risk.
Item
8. Financial Statements and Supplementary
Data
(a) The
financial statements required by this item begin on page F-1
hereof.
(b)
Selected quarterly financial data for the past two fiscal years appears in the
following table:
36
|
Quarterly Results of Operations (Unaudited)
|
|||||||||||||||||||||||||
|
Quarterly Ended
|
|||||||||||||||||||||||||
|
12/31/2007
|
12/31/2008
|
3/31/2008
|
3/31/2009
|
6/30/2008
|
6/30/2009
|
9/30/2008
|
9/30/2009
|
||||||||||||||||||
|
Net
Sales
|
$ | 19,325,599 | $ | 25,730,274 | $ | 17,888,302 | $ | 20,627,146 | $ | 23,073,575 | $ | 24,357,878 | $ | 25,218,286 | $ | 27,670,305 | |||||||||
|
Gross
Profit
|
4,799,581 | 6,603,396 | 3,951,801 | 5,801,884 | 5,979,142 | 7,181,749 | 6,688,657 | 8,354,191 | |||||||||||||||||
|
Income
from operations
|
1,267,312 | 1,744,822 | 459,570 | 2,098,736 | 2,154,253 | 3,724,922 | 2,138,871 | 3,854,796 | |||||||||||||||||
|
Net
Income
|
1,162,076 | 1,474,884 | 570,229 | 1,644,289 | 1,736,853 | 3,063,652 | 1,597,138 | 2,945,749 | |||||||||||||||||
|
Earnings
Per Share -basic and diluted
|
$ | 0.05 | $ | 0.07 | $ | 0.03 | $ | 0.07 | $ | 0.08 | $ | 0.14 | $ | 0.07 | $ | 0.13 | |||||||||
Item
9. Changes in and
Disagreements with
Accountants on Accounting and Financial Disclosure-
None.
Item
9A. Controls and
Procedures
Disclosure
Controls and Procedures
As
required by Rule 13a-15(e) and 15d-15(e) under the Securities Exchange Act, the
Company’s management has carried out an evaluation, with the participation and
under the supervision of its Chief Executive Officer and Chief Financial
Officer, of the effectiveness of the design and operation of its disclosure
controls and procedures as of September 30, 2009. Disclosure controls and
procedures refer to controls and other procedures designed to ensure that
information required to be disclosed in the reports the Company files or submits
under the Securities Exchange Act is recorded, processed, summarized and
reported within the time periods specified in the rules and forms of the SEC and
that such information is accumulated and communicated to the Company’s
management, including its chief executive officer and chief financial officer,
as appropriate, to allow timely decisions regarding required disclosure. In
designing and evaluating the Company’s disclosure controls and procedures,
management recognizes that any controls and procedures, no matter how well
designed and operated, can provide only reasonable assurance of achieving the
desired control objectives, and management is required to apply its judgment in
evaluating and implementing possible controls and procedures.
Management
conducted its evaluation of disclosure controls and procedures under the
supervision of its Chief Executive Officer and the Company’s Chief Financial
Officer. Based upon, and as of the date of this evaluation, the Company’s Chief
Executive Officer and Chief Financial Officer concluded that the Company’s
disclosure controls and procedures were effective.
Management's
Report on Internal Control over Financial Reporting
The
Company’s management is responsible for establishing and maintaining adequate
internal control over financial reporting as defined in Rules 13a-15(f) and
15d-15(f) under the Securities Exchange Act.
Because
of its inherent limitations, internal control over financial reporting may not
prevent or detect misstatements. Also, projections of any evaluation of
effectiveness to future periods are subject to the risk that controls may become
inadequate because of changes in conditions, or that the degree of compliance
with the policies and procedures may deteriorate.
The
Company’s management has assessed the effectiveness of its internal control over
financial reporting as of September 30, 2009. In making its assessment,
management used the criteria described in Internal Control - Integrated
Framework, issued by the Committee of Sponsoring Organizations of the Tread way
Commission, or COSO.
The
Company’s management assessment is that its internal control over financial
reporting has been effective for the fiscal year ended as of September 30,
2009. These internal control procedures ensure the effective recording,
processing, summarizing and reporting, on a timely basis, information
required to be disclosed by it in the reports that it files or submits under the
Exchange Act.
This
annual report on Form 10-K does not include an attestation report of its
registered independent public accounting firm regarding management's assessment
of the Company's internal control over financial reporting. Management's report
was not subject to audit by its registered independent public accounting firm
pursuant to rules of the Securities and Exchange Commission that permit us to
provide only management's report in this annual report.
Beginning
with the year ending September 30, 2010, Section 404 of the Sarbanes-Oxley Act
will require the Company to provide with its annual report on Form 10-K an
attestation report of its independent registered public accounting firm
regarding its internal control over financial reporting.
37
Changes
in Internal Controls over Financial Reporting
There
have been no changes in the Company’s internal controls over financial reporting
during the fourth quarter of fiscal 2009 that have materially affected, or are
reasonably likely to materially affect our internal control over financial
reporting.
Item
9B. Other
Information
None.
PART
III
Item
10. Directors and Executive
Officers of the Registrant
The
following sets forth the name and position of each of the Company’s current
executive officers and directors.
|
Name
|
Age
|
Position
|
||
|
Jianquan
Li
|
54
|
Chief
Executive Officer and President, and Chairman of the Board of
Directors
|
||
|
Xiuyuan
Fang
|
41
|
Chief
Financial Officer, Vice President, Treasurer and
Director
|
||
|
Larry
Goldman
|
53
|
Director
|
||
|
Richard
B. Goodner, Esq.
|
64
|
Director
|
||
|
Dr.
Horngjon Shieh
|
49
|
Director
|
||
|
Jiagan
Chen
|
58
|
Vice
President of Project Management
|
||
|
Nianfu
Huo
|
57
|
Senior
Vice President and Chairman of Supervisory Board of Winner Group
Limited
|
JIANQUAN LI. Mr. Li has served
as the Company’s Chief Executive Officer, President and director since December
16, 2005. Mr. Li is the founder of Winner Group and has served as its Chairman
and CEO since its subsidiary companies’ formation in 1991. As Chairman and CEO,
Mr. Li oversaw the implementation of the business plan of Winner Group and was
key to the development of its strategic vision. Mr. Li is a graduate of the
Hubei Foreign Trade University with a major in International Trade.
XIUYUAN FANG. Mr. Fang has
been the Company’s Chief Financial Officer, Vice President and Treasurer since
December 16, 2005 and its director since January 7, 2006. Mr. Fang has been
employed by Winner Group since 1999. Mr. Fang has served as Winner Group’s
director since 1999 and as a Vice President since 2001. Mr. Fang is a certified
public accountant and has extensive experience in financial management, capital
management and tax planning. He was responsible for Winner
Group’s financial management and capital management programs. He graduated
from Zhongnan University of Economics and Law.
LARRY GOLDMAN, CPA. Mr.
Goldman has been the Company’s director since May 8, 2006. Mr. Goldman is a
certified public accountant with approximately 30 years experience and currently
serves as the consultant of Lightbridge Corporation. (Nasdaq: LTBR), a nuclear
fuel consulting and technology company. Prior to joining Lightbridge
Corporation, Mr. Goldman worked as the Chief Financial Officer, Treasurer and
Vice President of Finance of WinWin Gaming, Inc., a multi-media developer and
publisher of sports, lottery and other games (OTCBB: WNWN). Prior to his
employment with WinWin Gaming, Inc., Mr. Goldman was an audit partner with
Livingston Wachtell & Co., LLP where he acted as an auditor for several
publicly traded companies in a variety of industries, located both in the United
States and China.
RICHARD B. GOODNER, Esq. Mr.
Goodner has been the Company’s director since May 8, 2006. Mr. Goodner has
served as Vice President - Legal Affairs and General Counsel of U.S. Home
Systems, Inc., a NASDAQ listed company that is engaged in the business of home
improvement and consumer finance, since June 2003. From 1997 to June 2003, he
was a partner in the Dallas, Texas law firm of Jackson Walker, L.L.P. He also
serves as a director of China BAK Battery, Inc., a company that is engaged in
the manufacture, commercialization and distribution of a wide variety of
standard and customized lithium ion rechargeable batteries. Mr. Goodner has
practiced in the area of corporate and securities law for over 35 years and has
represented numerous public and private companies in a range of general
corporate and securities matters.
DR. HORNGJON SHIEH. Dr. Shieh
has been the Company’s director since May 8, 2006. Dr. Shieh has served as an
Assistant Professor at the City University of Hong Kong for the past seven
years, where he has teaching experience in Enterprise Resource Planning,
Accounting Information Systems, Accounting Information Systems Security and
Control, Financial Accounting, Managerial Accounting, Financial Management,
Financial Statement Analysis, International Accounting, and International
Financial Statement Analysis and research experience in international
accounting, information content and usefulness of financial statements,
corporate governance, as well as disclosure requirements and capital market
access.
JIAGAN CHEN. Mr. Chen has been
the Company’s Vice President of Project Management since December 16, 2005. Mr.
Chen joined Winner Group as its Vice President of Project Management in 2000.
Mr. Chen is currently in charge of the Huanggang construction project, which is
the facility that will produce 100% of the Company’s new, cotton spunlace
nonwoven products. He is an economic engineer and graduated from Wuhan Institute
of Economic Management. Mr. Chen was responsible for Winner Group’s construction
projects at the Company’s headquarters facility in the Shenzhen Winner
Industrial Park.
38
NIANFU HUO. Mr. Huo has been
Senior Vice President of Winner Group Limited since April 8, 2003 and has served
as Chairman of the Supervisory Board of Winner Group Limited since April, 2008.
He is responsible for the strategic planning as well as formulating and
monitoring policies and operating objectives of the Company. Mr. Huo also is
involved in the decision making process of establishing all of the Company’s
subsidiaries in Hubei, Shanghai, Shenzhen and Zhuhai. Mr. Huo joined Winner
Zhuhai in 1991. He graduated from Beijing International Studies
University.
There are
no agreements or understandings for any of the Company’s executive officers or
directors to resign at the request of another person and no officer or director
is acting on behalf of nor will any of them act at the direction of any other
person.
Directors
are elected until their successors are duly elected and qualified.
Board
Composition and Committees
The board
of directors is currently composed of five members, Jianquan Li, Xiuyuan Fang,
Larry Goldman, Richard B. Goodner and Dr. Horngjon Shieh. All Board action
requires the approval of a majority of the directors in attendance at a meeting
at which a quorum is present.
Committees
of the Company’s Board of Directors
Audit Committee. On May 9,
2006, the Company’s board of directors formed an audit committee, which is
chaired by Mr. Goldman, who is determined to be an independent board member and
qualifies as the audit committee financial expert. Mr. Goodner and Dr. Shieh
also serve on the audit committee. The audit committee reviews and monitors the
Company’s internal controls, financial reports and accounting practices, as well
as the scope and extent of the audits performed by both the independent and
internal auditors, reviews the nature and scope of the Company’s internal audit
program and the results of internal audits, and meets with the independent
auditors.
Compensation Committee. On
May 9, 2006, the Company’s board of directors formed a compensation committee,
which is chaired by Dr. Shieh, Mr. Goldman and Mr. Goodner also serve on the
compensation committee. The compensation committee oversees the Company’s
compensation and employee benefit plans and practices and produces a report on
executive compensation.
Governance and Nominating. On
May 9, 2006, the Company’s board of directors formed a governance and
nominating committee, which is chaired by Mr. Goodner, Mr. Goldman and Dr. Shieh
also serve on the governance and nominating committee. The primary purpose of
governance and nominating committee is to identify and to recommend to the board
individuals qualified to serve as directors of the Company and on committees of
the board, advise the board with respect to the board composition, procedures
and committees, develop and recommend to the board a set of corporate governance
principles and guidelines applicable to the Company; and oversee the evaluation
of the board and the Company’s management.
Other Committees. The
Company’s board of directors may on occasion establish other committees, as it
deems necessary or required.
Compensation
Committee Interlocks and Insider Participation
None of
the Company’s executive officers has served as a member of a compensation
committee, or other committee serving an equivalent function, of any other
entity whose executive officers serve as a director of the Company or member of
the Company’s compensation committee.
Independent
Director
The
Company’s board of directors has determined that each of Messrs. Goldman,
Goodner and Shieh qualify as an “independent director” within the meaning of
that term under the rules and regulations of the NASDAQ National
Market.
Family
Relationships
There are
no family relationships among the Company’s directors or officers.
Code
of Ethics
On May 9,
2006, the Company’s board of directors adopted a new Code of Ethics that applies
to all of its directors, officers and employees, including its principal
executive officer, principal financial officer, and principal accounting
officer. The new code replaces the Company’s prior code of ethics that applied
only to its principal executive officer, principal financial officer, principal
accounting officer or controller and any person who performed similar functions,
and addresses, among other things, honesty and ethical conduct, conflicts of
interest, compliance with laws, regulations and policies, including disclosure
requirements under the federal securities laws, confidentiality, trading on
inside information, and reporting of violations of the code. A copy of the Code
of Ethics has been filed as Exhibit 14.1 to the Company’s current report on
Form 8-K filed on May 11, 2006. The Code of Ethics will also be posted on the
corporate governance page of the Company’s website at www.winnermedical.com as
soon as practicable. The Company intends to post any amendments and any waivers
to its code of conduct on its website in accordance with Item 5.05 of Form 8-K
and Item 406 of Regulation S-K.
39
Item
11. Executive
Compensation
Compensation Discussion and
Analysis
Prior to
May 8, 2006, the Company’s compensation decisions with respect to executive
officers were made by a compensation committee consisting of the persons in the
following positions: two representative of the board of Directors, and the human
resources manager. The committee reviewed and made recommendations with respect
to the salary of executive officers and directors. Final approval of the
committee’s recommendations was made by the CEO, and approval of CEO’s
compensation was made by the Board of Directors.
On May 8,
2006, the Board of Directors established a Compensation Committee consisting
only of independent Board members, which is responsible for setting the
Company’s policies regarding compensation and benefits and administering the
Company’s benefit plans. At the end of fiscal year 2008, the Compensation
Committee consisted of Horngjon Shieh (Chairman), Larry Goldman and Richard B.
Goodner. The members of the Compensation Committee approved the amount and form
of compensation paid to executive officers of the Company and set the Company’s
compensation policies and procedures during these periods.
The
primary goals of the Company’s Board Compensation Committee with respect to
executive compensation are to attract and retain highly talented and dedicated
executives and to align executives’ incentives with stockholder value creation.
The Compensation Committee will evaluate individual executive performance with a
goal of setting compensation at levels the Compensation Committee believes are
comparable with executives at Chinese companies, which are of similar size and
stage of development operating in the same area and same industry.
The
Compensation Committee will conduct an annual review of the aggregate level of
the Company’s executive compensation, as well as the mix of elements used to
compensate the Company’s executive officers. The Company compares compensation
levels with amounts currently being paid to executives at the similar companies
in the same area and the same industry, and most importantly the Company
compares compensation levels with local practices in China. The Company believes
that its compensation levels are competitive with local conditions.
Elements of
compensation
The
Company’s executive compensation consists of the following
elements:
Base
Salary. Base
salaries for the Company’s executives are established to be amounts of
compensation that are similar to those paid by other companies to executives in
similar positions and with similar responsibilities. Base salaries are adjusted
from time to time to realign salaries with market levels after taking into
account individual responsibilities, performance and experience. The
compensation committee established a salary structure to determine base salaries
and is responsible for initially setting executive officer compensation in
employment arrangements with each individual. The base salary amounts are
intended to reflect the Company’s philosophy that the base salary should attract
experienced individuals who will contribute to the success of the Company’s
business goals and represent cash compensation that is commensurate with the
compensation of individuals at similarly situated companies. The Company’s
structure includes a basic annual salary amount for each category of directors
and officers. Individuals then receive a salary enhancement in connection with
their position. Finally, the initial base salary is increased by a “household
subsidy” which represents a living allowance.
Discretionary
Annual Bonus. The compensation committee has the authority to award
discretionary annual bonuses to the Company’s executive officers. Bonuses are
intended to compensate officers for achieving financial and operational goals,
and for achieving individual annual performance objectives. These objectives
vary depending on the individual executive, but relate generally to strategic
factors such as the accomplishment of the planned target of the sales revenue,
the net profit, and the asset turnover rate. In addition, except CEO, other
executive officers’ annual bonuses are also dependent upon the performance
measurement score of the departments that he/she is charge of. The bonus targets
are set in a reasonable level, and the Compensation Committee believes that a
majority of the executive officers could achieve these targets. The actual
amount of discretionary bonus is determined following a review of each
executive’s individual performance and contribution to the Company’s strategic
goals conducted during the first quarter of the next fiscal year following the
year subject to review. For example, in fiscal year 2009 the Company’s CEO,
Mr. Jianquan Li was awarded a bonus of $46,477 (RMB 317,437). The Company’s CFO,
Mr. Xiuyuan Fang was awarded a bonus of $16,301 (RMB 111,338) in fiscal year
2009.
Equity Incentive
Plan. The Company’s 2006 Equity Incentive Plan, the “2006 Plan”, was
initially adopted by the Company’s Board of Directors in April 2006 and approved
by the Company’s stockholders in April 2006. The 2006 Plan provides for the
grant to the Company’s employees, directors, consultants and advisors of stock
options, stock appreciation rights and stock awards, including restricted stock,
performance grants, stock bonuses and other similar types of awards, including
other awards under which recipients are not required to pay any purchase or
exercise price, such as phantom stock rights. All equity awards granted under
the Plan will be granted with respect to shares of the Company’s common
stock.
40
During
the last fiscal year, neither the Company nor its subsidiaries granted any stock
options or stock appreciation rights to any executive officers . In fiscal year
2007, the Company made individual grants of options to purchase shares to
directors, as reported below in the Director Compensation Table.
On
October 7, 2007, the Company’s Board of Directors approved certain amendments to
the 2006 Plan.
Among
other things, the 2006 Plan was amended to:
|
·
|
Clarify
that, in the event the Company experiences a change of control of the
Company, the Board or a committee of the Board may (i) provide for the
assumption or substitution of or adjustment to each outstanding award,
(ii) accelerate the vesting of options and terminate any restrictions on
stock awards, and/or (iii) provide for termination of awards as a result
of the change in control on such terms as it deems appropriate, including
providing for the cancellation of awards for a cash or other payment to
the participant.
|
|
·
|
Clarify
that, in the event of a proposed dissolution or liquidation of the
Company, unless otherwise determined by the administrator, all outstanding
awards will terminate immediately prior to such
transaction.
|
|
·
|
Provide
that the administrator may permit participants under the 2006 Plan to
defer compensation payable under the terms of a written award agreement,
so long as each such deferral arrangement complies with Section 409A of
the U.S. Internal Revenue
Code.
|
On
October 7, 2007, the Company’s Board of Directors also approved the 2008-2009
Restricted Stock Unit Incentive Plan, the “2008-2009 Plan”, an equity incentive
compensation program for fiscal years 2008 and 2009 that is a sub-plan of the
Company’s 2006 Plan.
Eligible
participants under the 2008-2009 Plan are directors who are employees of the
Company, and the Company’s senior management and key employees as designated by
the Company’s Chief Executive Officer or the Company’s Board of Directors. All
equity awards to participants in the 2008-2009 Plan will be restricted stock
unit awards, where a participant will be eligible to receive one share of the
Company’s common stock for each restricted stock unit that vests upon the
achievement of corporate and individual objectives and such participant’s
continued employment as of the applicable vesting date.
The
material terms of the 2008-2009 Plan include the following:
· The maximum number
of restricted stock units that will be available for issuance under the
2008-2009 Plan is 1,200,000 units. The 1,200,000 units became 600,000 units
after the reverse stock split. The shares of the Company’s common stock issuable
upon vesting of the restricted stock units will be issued from the Company’s
2006 Plan.
· The Company’s
Board of Directors has established the target corporate net income and annual
sales objectives for each of fiscal years 2008 and 2009, and each participant’s
individual performance objectives have been set by the Company’s Chief Executive
Officer. The Company’s Board of Directors or the Compensation Committee of the
Company’s Board will certify the satisfaction of each target.
· On each of October
7, 2010 and October 7, 2011, a participant is eligible to vest in up to 50% of
the total number of restricted stock units underlying an award. 25% of the
potential vesting at each vesting date is tied to satisfaction of each of the
target corporate net income and annual sales objectives, respectively, and 50%
of the potential vesting is tied to achievement of a participant’s individual
performance objectives.
41
The
Company’s Board of Directors also approved the following restricted stock unit
awards to certain executives on October 7, 2007 and October 16,
2008:
|
Name and Principal Position
|
Restricted Stock
Unit Award in 2007
(shares)
|
Restricted Stock
Unit Award in
2007
($) (1)
|
Restricted Stock
Unit Award in
2008
(shares)
|
Restricted Stock
Unit Award in
2008
($) (2)
|
|||||||
|
Jianquan
Li, President and Chief Executive Officer
|
20,000
|
$
|
72,000
|
-
|
-
|
||||||
|
Xiuyuan
Fang, Chief Financial Officer, Vice President, and
Treasurer
|
20,000
|
$
|
72,000
|
5,000
|
$
|
2,500
|
|||||
|
Jiagan
Chen, Vice President
|
20,000
|
$
|
72,000
|
5,000
|
$
|
2,500
|
|||||
|
Nianfu
Huo, Senior Vice President and Chairman of Supervisory Board of
Winner Group Limited
|
20,000
|
$
|
72,000
|
-
|
-
|
||||||
(1)
Estimated value of award as of grant date is based on the last sale price of the
Company’s common stock as quoted on the NASDAQ.com as of October 5, 2007, which
was $3.60 per share, and assumes that the individual achieves 100% of the
applicable corporate and individual objectives set forth in the
award.
(2)
Estimated value of award as of grant date is based on the last sale price of the
Company’s common stock as quoted on the NASDAQ.com as of October 15, 2008 which
was $0.50 per share, and assumes that the individual achieves 100% of the
applicable corporate and individual objectives set forth in the
award.
On
September 8, 2009, the Company’s Board of Directors also approved the
2010-2011 Restricted Stock Unit Incentive Plan, the “2010-2011 Plan”, an equity
incentive compensation program for fiscal years 2010 and 2011 that is a sub-plan
of the Company’s 2006 Plan.
Eligible
participants under the 2010-2011 Plan are directors who are employees of the
Company, and the Company’s senior management and key employees as designated by
the Company’s Chief Executive Officer or the Company’s Board of Directors. All
equity awards to participants in the 2010-2011 Plan will be restricted stock
unit awards, where a participant will be eligible to receive one share of the
Company’s common stock for each restricted stock unit that vests upon the
achievement of corporate and individual objectives and such participant’s
continued employment as of the applicable vesting date.
The
material terms of the 2010-2011 Plan include the following:
· The maximum number
of restricted stock units that will be available for issuance under the
2010-2011 Plan is 600,000 units. The 600,000 units became 300,000 units after
the reverse stock split. The shares of the Company’s common stock issuable upon
vesting of the restricted stock units will be issued from the Company’s 2006
Plan.
· The Company’s
Board of Directors has established the target corporate net income and annual
sales objectives for each of fiscal years 2010 and 2011, and each participant’s
individual performance objectives have been set by the Company’s Chief Executive
Officer. The Company’s Board of Directors or the Compensation Committee of the
Company’s Board will certify the satisfaction of each target.
· On each of
September 8, 2012 and September 8, 2013, a participant is eligible to vest in up
to 50% of the total number of restricted stock units underlying an award. 25% of
the potential vesting at each vesting date is tied to satisfaction of each of
the target corporate net income and annual sales objectives, respectively, and
50% of the potential vesting is tied to achievement of a participant’s
individual performance objectives.
The
Company’s Board of Directors also approved the following restricted stock unit
awards to certain executives on September 8, 2009.
|
Name and Principal Position
|
Restricted Stock
Unit Award in 2009
(shares)
|
Restricted Stock
Unit Award in
2009
($) (1)
|
||||
|
Jianquan
Li, President and Chief Executive Officer
|
10,000
|
$
|
44,000
|
|||
|
Xiuyuan
Fang, Chief Financial Officer, Vice President, and
Treasurer
|
10,000
|
$
|
44,000
|
|||
|
Jiagan
Chen, Vice President
|
5,000
|
$
|
22,000
|
|||
|
Nianfu
Huo, Senior Vice President and Chairman of Supervisory Board of
Winner Group Limited
|
2,500
|
$
|
11,000
|
|||
42
(1)
Estimated value of award as of grant date is based on the last sale price of the
Company’s common stock as quoted on the NASDAQ.com as of September 8, 2009,
which was $4.40 per share, and assumes that the individual achieves 100% of the
applicable corporate and individual objectives set forth in the
award.
Other
Compensation. Other than the annual salary for the Company’s executive
officers, the bonus that may be awarded to executive officers at the discretion
of the Compensation Committee and arrangements with executive officers for the
use of a Company car, and the household subsidies referred to above, the Company
does not have any other benefits and perquisites for its executive officers.
However, the Compensation Committee in its discretion may provide benefits and
perquisites to these executive officers if it deems it advisable.
Employment
contracts and termination of employment
All of
the Company’s executive officers have executed standard employment agreements
with the Company, which are governed under Chinese law. Other than the amount of
compensation, the terms and conditions of the employment agreements with the
executive officers are substantially the same as those of the Company’s standard
employment agreements with non-executive employees. The Company’s standard
employment agreements are for a fixed period of three years and may be renewed
upon notice from the employee and consent of the Company. The Company may
terminate an employment agreement upon thirty days’ notice if an employee is not
suitable for the job due to medical or other reasons. An employee may terminate
his or her employment agreement without cause upon one month’s
notice.
Jianquan
Li, the Company’s CEO and President’s employment agreement became effective as
of January 1, 2008. The agreement is for a term of three years. Mr. Li is
receiving an annual salary of approximately $140,000 under the agreement (RMB
1,000,000).
Xiuyuan
Fang, the Company’s CFO, Vice President and Treasurer’s employment agreement
became effective as of January 1, 2008. The agreement is for a term of three
years. Mr. Fang is receiving an annual salary of approximately $56,000 under the
agreement (RMB 400,000).
Jiagan
Chen, the Company’s Vice President of Project Management’s employment agreement
became effective as of January 1, 2008. The agreement is for a term of three
years. Mr. Chen is receiving an annual salary of approximately $42,000 under the
agreement (RMB 300,000).
Nianfu
Huo, the Company’s Senior Vice President’s employment agreement became effective
as of January 1, 2008. The agreement is for a term of three years. Mr. Huo is
receiving an annual salary of approximately $28,000 under the agreement (RMB
200,000).
The
compensation stated in the agreement is the basic salary, and it is subject to
adjustment on an annual basis.
Accounting and tax
treatment
Given the
Company’s current levels of compensation, the accounting and tax considerations
have not significantly impacted the Company’s forms of compensation. The board
considers as one factor the impact of accounting and tax treatment on
compensation in the Company’s compensation programs.
Director
Compensation
On May 8,
2006, the Company entered into separate Independent Directors’ Contracts and
Indemnification Agreements with each of the independent directors. Under the
terms of the Independent Directors’ Contracts, Mr. Goldman is entitled to
$35,000, Mr. Goodner is entitled to $25,000 and Dr. Shieh is entitled to $15,000
as compensation for the services to be provided by them as the
Company’s independent directors, and as chairpersons of various board
committees, as applicable.
The
following table summarizes director compensation during the fiscal year
2009.
43
|
Name
|
Fees Earned
or
Paid in
Cash
|
Stock
Awards
|
Option
Awards
(1)
|
Non-Equity
Incentive Plan
Compensation
|
Change in Pension
Value and
Nonqualified
Deferred
Compensation
Earnings
|
All Other
Compensation
|
Total
|
||||||||||||
|
Jianquan
Li,
|
-
|
-
|
-
|
-
|
-
|
-
|
-
|
||||||||||||
|
Xiuyuan
Fang
|
-
|
-
|
-
|
-
|
-
|
-
|
-
|
||||||||||||
|
Larry
Goldman
|
$
|
35,000
|
-
|
-
|
-
|
-
|
-
|
$
|
35,000
|
||||||||||
|
Richard
Goodner
|
$
|
25,000
|
-
|
-
|
-
|
-
|
-
|
$
|
25,000
|
||||||||||
|
Horngjon
Shieh
|
$
|
15,000
|
-
|
-
|
-
|
-
|
-
|
$
|
15,000
|
||||||||||
Under the
terms of the Indemnification Agreements, the Company agreed to indemnify the
independent directors against expenses, judgments, fines, penalties or other
amounts actually and reasonably incurred by the independent directors in
connection with any proceeding if the independent director acted in good faith
and in the best interests of the Company. The Independent Directors’ Contracts
and Indemnification Agreements were filed as Exhibits 10.1 through 10.6 to the
Company’s current report on Form 8-K filed on May 11, 2006.
None of
the employee directors receives additional compensation solely as a result of
his position as a director.
Compensation Committee
Report
The
Compensation Committee of the Board of Directors of Winner Medical Group Inc.
has reviewed and discussed the Compensation Discussion and Analysis contained in
this annual report on Form 10-K with management. Based on the Company’s
Compensation Committee’s review of and the discussions with management with
respect to the Compensation Discussion and Analysis, the Company’s Compensation
Committee recommended to the Board of Directors that the Compensation Discussion
and Analysis be included in this annual report on Form 10-K for filing with the
SEC.
The
foregoing report is provided by the following directors, who constitute the
Compensation Committee: Horngjon Shieh, Larry Goldman and Richard B.
Goodner.
Summary Compensation
Table
The
following table sets forth information regarding compensation for the fiscal
year ended September 30, 2009 received by the individual who served as the
Company’s Chief Executive Officer as well as one individual who served as the
Company’s Chief Financial Officer, “Named Executive Officers”. The total
compensation of other executive officers did not exceed $100,000 per
year.
|
Name And
Principal
Position
|
Year
|
Salary (1)
(3)
|
Bonus
(1)
|
Stock
Awards
(1)
|
Option
Awards
|
Nonequity
Incentive Plan
Compensation
|
Change in
Pension Value
& Nonqualified
Deferred
Compensation
|
All Other
Compensation
(2)
|
Total (1)
|
|||||||||||||||
|
Jianquan
Li, CEO
and
|
2009
|
113,547
|
46,477
|
-
|
-
|
-
|
-
|
-
|
160,024
|
|||||||||||||||
|
President
|
2008
|
100,280
|
49,820
|
-
|
-
|
-
|
-
|
-
|
150,100
|
|||||||||||||||
|
2007
|
77,823
|
51,882
|
-
|
-
|
-
|
-
|
-
|
129,705
|
||||||||||||||||
|
Xiuyuan
Fang, CFO,
|
2009
|
63,017
|
16,301
|
-
|
-
|
-
|
-
|
-
|
79,318
|
|||||||||||||||
|
Vice
President,
|
2008
|
49,350
|
13,310
|
-
|
-
|
-
|
-
|
-
|
62,660
|
|||||||||||||||
|
and Treasurer
|
2007
|
35,799
|
23,995
|
-
|
-
|
-
|
-
|
-
|
59,794
|
|||||||||||||||
(1)
Salary, bonus amounts, stock awards and total compensation are reported in
United States dollars.
44
(2)
During fiscal year 2008, the executive officers of the Company were not granted
any perquisites or other personal benefits other than an arrangement with Mr. Li
to use a company car. The total value of this perquisite is less than $10,000,
therefore the Company has not disclosed any amount in the Summary Compensation
Table as permitted under Item 402(c)(2)(ix)(A).
(3) On
August 20, 2005, the board of directors of the Company’s subsidiary, Winner
Group Limited, declared a dividend to all shareholders of Winner Group Limited.
As a stockholder, Mr. Li received such dividend in the amount of $1,352,515.72
and $504,315.90 from Winner Group Limited in fiscal year 2006 and fiscal year
2007.
Option
Exercises and Stock
Vested. None of the Company’s executive officers exercised any
options during the last fiscal year, nor did any such officer hold any
restricted stock that vested during the last fiscal year.
Compensation Committee Interlocks
and Insider
Participation
No
executive officer of the Company served as a member of the compensation
committee or the equivalent of another entity during fiscal year 2007, 2008 or
2009. No executive officer of the Company served as a director of another
entity, other than affiliates of the Company, during fiscal year 2007,
2008 and 2009.
Item
12. Security Ownership of
Certain Beneficial
Owners and Management
The
following table sets forth information regarding beneficial ownership of the
Company’s common stock as of December 6, 2009 (i) by each person who is known by
the Company to beneficially own more than 5% of the Company’s common stock; (ii)
by each of the Company’s officers and directors; and (iii) by all of the
Company’s officers and directors as a group.
|
Title of Class
|
Name & Address of
Beneficial Owner
|
Office, If Any
|
Amount & Nature of
Beneficial
Ownership1
|
Percent of
Class2
|
||||||
|
Common
Stock
$0.001
par value
|
Jianquan Li 3
Ping Tse 3
6-15D,
Donghai Garden, Futian District, Shenzhen, China
|
CEO,
President and Director
|
18,042,264
|
80.68
|
%
|
|||||
|
Common
Stock
$0.001
par value
|
Xiuyuan
Fang
Room
5B Building 2 Jun’an Garden, Futian District, Shenzhen City, Guangdong
Province, China
|
CFO,
Vice President, Treasurer and Director
|
232,256
|
1.04
|
%
|
|||||
|
Common
Stock
$0.001
par value
|
Larry
Goldman
5
Victory Road,
Suffern,
NY 10901
|
Director
|
0
|
*
|
||||||
|
Common
Stock
$0.001
par value
|
Richard
B. Goodner, Esq.
6608
Emerald Drive
Colleyville,
Texas 76034
|
Director
|
0
|
*
|
||||||
|
Common
Stock
$0.001
par value
|
Dr.
Horngjon Shieh
Flat
37B, Tower 3
The
Victoria Towers
188
Canton Road, TST
Kowloon,
Hong Kong
|
Director
|
0
|
*
|
||||||
|
Common
Stock
$0.001
par value
|
Jiagan
Chen
No.25
Zhazhu Front Road, Wuchang District, Wuhan City, China
|
Vice
President of Project Management
|
12,395
|
*
|
||||||
|
Common
Stock
$0.001
par value
|
Nianfu
Huo
Hai
Yi Wan Pan, No. 333 Jin Tang Road, Tang Jia Wan
Zhuhai,
China 519000
|
Senior
Vice President and Chairman of Supervisory Board of Winner Group
Limited
|
98,417
|
*
|
||||||
|
Common
Stock
$0.001
par value
|
All
officers and directors as a group (7 persons named above)
|
18,385,332
|
82.21
|
%
|
||||||
|
Common
Stock
$0.001
par value
|
Pinnacle China Fund, L.P.
4
4965
Preston Park Blvd.
Suite
240, Plano, Texas 75093
|
1,745,210
|
7.80
|
%
|
||||||
* Less than
1%
45
1Beneficial Ownership is
determined in accordance with the rules of the Securities and Exchange
Commission and generally includes voting or investment power with respect to
securities. Each of the beneficial owners listed above has direct ownership of
and sole voting power and investment power with respect to the shares of the
Company’s common stock.
2A total of 22,363,675 shares of
the Company’s Common Stock are considered to be outstanding pursuant to SEC Rule
13d-3(d)(1). For each Beneficial Owner above, any options exercisable within 60
days have been included in the denominator.
3 Mr. Jianquan Li and his wife,
Ping Tse, hold a total of 18,042,264 shares of the Company’s Common Stock.
Mr. Jianquan Li disclaims the power to vote and dispose of the
4,510,565 shares of the Company’s Common Stock to Ping Tse. As such,
Mr. Jianquan owns 13,531,699 shares of the Company’s Common Stock.
4 Barry Kitt is the sole officer
of Pinnacle China Advisors, L.P. which is the general partner of Pinnacle China
Fund, L.P.
Item
13. Certain
Relationships and
Related Transactions
Mr.
Jianquan Li, a director with a controlling interest in Safe Secure Packing
(Shenzhen) Co., Ltd. (“Safe Secure”), sold all of his controlling interest in
Safe Secure to a third party as of September 30, 2007. During the years ended
September 30 2007, the Company sold goods to Safe Secure for US$1,740 and
purchased goods from it for US$491,463.
During
the years ended September 30, 2009, 2008 and 2007, the Company sold goods to
Winner Medical & Textile (H.K.) Limited for US$Nil, US$894,560 and
US$809,168 respectively. During the years ended September 30, 2009, 2008 and
2007, the Company purchased goods from Winner Medical & Textile (HK) Limited
for US$5,846, US$Nil and US$Nil respectively. Mr. Jianquan Li, director of the
Company, has a controlling interest in Winner Medical & Textile (H.K.)
Limited. As of September 30, 2009, 2008 and 2007, the outstanding balance due
from Winner Medical &Textile (HK.) Limited were US$Nil, US$183,247
and US$252,999 respectively.
During
the years ended September 30, 2009, 2008 and 2007, the Company purchased goods
from L+L Healthcare Hubei Co., Ltd. for US$67,848, US$716,248, and
US$490,818 respectively. As of September 30, 2009, 2008 and 2007, amount
due from L+L was US$Nil, US$166,112 and US$150,796 respectively. As of September
30, 2009, 2008 and 2007, amount due to L+L was US$56,349, US$24,219 and
US$41,809 respectively.
The
amounts due from/to the above affiliated companies with the exception of L+L
Healthcare Hubei are unsecured, interest free and payable according to the
trading credit terms. The amount due from L+L Healthcare Hubei Co., Ltd. are
unsecured, 5% interest bearing and payable according to the trading credit
terms.
The
Company’s independent directors approve the related party transactions based on
their fiduciary duties under Nevada state law and based on the best interest of
the company.
Item
14. Principal Accountant Fees and
Services
Audit
Fees
The fees
in 2009 and 2008 for performing the audit of the Company’s financial statements
included in the Company’s Annual Reports on Form 10-K during the fiscal years
ended September 30, 2009 and 2008 were approximately $100,000 and $114,000
, respectively. The fees relating to the review of the Company’s financial
statements included in the Company’s Quarterly Reports on Form 10-Q during the
fiscal years ended September 30, 2009 and 2008 were approximately
$90,000 and $127,500, respectively.
Audit-Related
Fees
The fees
in 2009 and 2008 for audit-related services for the fiscal years ended September
30, 2009 and 2008 were approximately $Nil and $Nil, respectively.
Tax
Fees
The fees
in the fiscal years ended September 30, 2009 and 2008 for tax services were
$Nil and $13,883 respectively.
All
Other Fees
The
Company’s independent auditor did not provide any services other than as
described above under the headings “Audit Fees,” “Audit-Related Fees” and “Tax
Fees” during the fiscal year ended September 30, 2009 and 2008.
46
Policy
on Pre-Approval of Services
The
Company’s Board of Directors pre-approved all auditing services and non-audit
services to be performed by the independent auditors during the fiscal year
ended September 30, 2009.
47
PART IV
Item 15. Exhibits
and
Financial Statements Schedules
|
(a)
|
The following documents are filed
as part of this report:
|
|
(1)
|
Financial
Statements
|
The consolidated financial statements
filed as part of this Form 10-K are located as set forth in the index on page F-1 of this
report.
|
(2)
|
Financial Statement
Schedules
|
Not applicable.
|
(3)
|
Exhibits
|
The list of exhibits included in the
attached Exhibit Index is hereby incorporated herein by
reference.
48
SIGNATURES
Pursuant to the requirements of
Section 13 or 15(d) of the
Securities Exchange Act of 1934, the registrant has duly caused this report to
be signed on its behalf by the undersigned, thereunto duly
authorized.
Date: December 7, 2009
|
WINNER MEDICAL GROUP
INC.
|
||
|
By:
|
/s/ Jianquan
Li
|
|
|
Jianquan Li
Chief Executive
Officer
|
||
|
By:
|
/s/ Xiuyuan
Fang
|
|
|
Xiuyuan Fang
Chief Financial
Officer
|
POWER OF ATTORNEY
KNOW ALL PERSONS BY THESE PRESENTS, that
each person whose signature appears below constitutes and appoints Jianquan Li
and Xiuyuan Fang, and each
of them, their attorneys-in-fact and agents, each with the power of
substitution, for them in any and all capacities, to sign any and all amendments
to this Report on Form 10-K, and to file the same, with exhibits thereto and
other documents in connection therewith, with the Securities
and Exchange Commission, hereby ratifying and confirming all that said
attorneys-in-fact, or substitutes, may do or cause to be done by virtue
hereof.
Pursuant to the requirements of the
Securities Exchange Act of 1934, this report has been signed below by
the following persons on behalf of the registrants and in the capacities and on
the dates indicated.
|
By:
|
/s/ Jianquan
Li
|
|
|
Jianquan Li
Chief Executive Officer, President
and Chairman of the Board of the Directors
(Principal Executive
Officer)
Dated: December 7,
2009
|
|
By:
|
/s/ Xiuyuan
Fang
|
|
|
Xiuyuan Fang
Chief Financial Officer, Vice
President, Treasurer and Director
(Principal Accounting and
Financial Officer)
Dated: December 7,
2009
|
|
By:
|
/s/ Larry
Goldman
|
|
|
Larry Goldman
Director
Dated: December 7,
2009
|
|
By:
|
/s/ Richard B.
Goodner
|
|
|
Richard B. Goodner,
Esq.
Director
Dated: December 7,
2009
|
|
By:
|
/s/ Horngjon
Shieh
|
|
|
Dr. Horngjon
Shieh
Director
Dated: December 7,
2009
|
49
|
WINNER
MEDICAL GROUP INC.
|
|
Consolidated
Financial Statements
|
|
For
the years ended September 30, 2009, 2008 and
2007
|
WINNER
MEDICAL GROUP INC.
INDEX
TO CONSOLIDATED FINANCIAL STATEMENTS
|
Page
|
|
|
Report
of Independent Registered Public Accounting Firm
|
F-2
|
|
Consolidated
Balance Sheets
|
F-3
|
|
Consolidated
Statements of Income and Comprehensive Income
|
F-4
|
|
Consolidated
Statements of Stockholder’s Equity
|
F-5
|
|
Consolidated
Statements of Cash Flows
|
F-6
|
|
Notes
to Consolidated Financial Statements
|
F-7
– F-24
|
F-1
|
1
|
REPORT
OF INDEPENDENT REGISTERED PUBLIC ACCOUNTING
FIRM
|
To the
Stockholders and the Board of Directors of
Winner
Medical Group Inc.
We have
audited the accompanying consolidated balance sheets of Winner Medical Group
Inc. and subsidiaries (the “Company”) as of September 30, 2009 and 2008, and the
related consolidated statements of income and comprehensive income,
stockholders’ equity and cash flows for each of the three years in the period
ended September 30, 2009. These financial statements are the
responsibility of the Company’s management. Our responsibility is to
express an opinion on these financial statements based on our
audits.
We
conducted our audits in accordance with the standards of the Public Company
Accounting Oversight Board (United States). Those standards require
that we plan and perform the audit to obtain reasonable assurance about whether
the financial statements are free of material misstatement. The
Company is not required to have, nor were we engaged to perform, an audit of its
internal control over financial reporting. Our audits included
consideration of internal control over financial reporting as a basis for
designing audit procedures that are appropriate in the circumstances, but not
for the purpose of expressing an opinion on the effectiveness of the Company’s
internal control over financial reporting. Accordingly, we express no
such opinion. An audit also includes examining, on a test basis,
evidence supporting the amounts and disclosures in the financial statements,
assessing the accounting principles used and significant estimates made by
management, as well as evaluating the overall financial statement
presentation. We believe that our audits provide a reasonable basis
for our opinion.
In our
opinion, the consolidated financial statements referred to above present fairly,
in all material respects, the financial position of Winner Medical Group Inc.
and subsidiaries at September 30, 2009 and 2008, and the results of their
operations and their cash flows for each of the three years in the period ended
September 30, 2009, in conformity with accounting principles generally accepted
in the United States of America.
/s/ BDO
Limited
Hong
Kong, December 7, 2009
F-2
WINNER
MEDICAL GROUP INC.
CONSOLIDATED
BALANCE SHEETS
|
September
30,
|
||||||||
|
2009
|
2008
|
|||||||
|
US$
|
US$
|
|||||||
|
ASSETS
|
||||||||
|
Current
assets:
|
||||||||
|
Cash
and cash equivalents
|
9,493,026 | 6,462,505 | ||||||
|
Restricted bank deposits
|
123,868 | 126,749 | ||||||
|
Accounts
receivable, less allowances for doubtful accounts of US$244,401 and
US$100,964 at September 30, 2009 and 2008 respectively
|
13,148,462 | 13,516,688 | ||||||
|
Amounts
due from affiliated companies
|
- | 349,359 | ||||||
|
Inventories
|
14,932,740 | 15,839,587 | ||||||
|
Prepaid
expenses and other receivable
|
3,614,567 | 4,734,503 | ||||||
|
Income
taxes recoverable
|
30,910 | 99,126 | ||||||
|
Deferred
tax assets
|
359,151 | 207,798 | ||||||
|
Total
current assets
|
41,702,724 | 41,336,315 | ||||||
|
Property,
plant and equipment, net
|
55,770,870 | 57,937,881 | ||||||
|
Held-for-sale
asset
|
- | 607,423 | ||||||
|
Investment
in equity investees
|
1,923,956 | 1,518,848 | ||||||
|
Intangible
assets, net
|
147,008 | 126,141 | ||||||
|
Non-current
restricted bank deposits
|
34,917 | - | ||||||
|
Prepaid
expenses and other receivable
|
1,104,344 | 233,203 | ||||||
|
Deferred
tax assets
|
252,190 | 158,280 | ||||||
|
Total
assets
|
100,936,009 | 101,918,091 | ||||||
|
LIABILITIES
AND STOCKHOLDERS’ EQUITY
|
||||||||
|
Current
liabilities:
|
||||||||
|
Short-term
bank loans
|
6,589,545 | 15,033,073 | ||||||
|
Accounts
payable
|
4,843,404 | 8,271,926 | ||||||
|
Accrued
payroll and employee benefits
|
2,072,892 | 1,891,410 | ||||||
|
Customer
deposits
|
603,824 | 458,303 | ||||||
|
Other
accrued liabilities
|
2,574,736 | 2,518,326 | ||||||
|
Amounts
due to affiliated companies
|
56,349 | 136,481 | ||||||
|
Income
taxes payable
|
1,938,941 | 656,550 | ||||||
|
Total
current liabilities
|
18,679,691 | 28,966,069 | ||||||
|
Deferred
tax liabilities
|
41,899 | 41,965 | ||||||
|
Total
liabilities
|
18,721,590 | 29,008,034 | ||||||
|
Commitments
and contingencies
|
||||||||
|
Minority
interests
|
82,815 | 148,306 | ||||||
|
Stockholders’
equity:
|
||||||||
|
Common
stock, par value $0.001 per share; authorized 247,500,000 shares; issued
and outstanding September 30, 2009 – 22,363,675 shares; September 30, 2008
– 22,363,675 shares
|
22,364 | 22,364 | ||||||
|
Additional
paid-in capital
|
31,166,123 | 30,865,690 | ||||||
|
Retained
earnings
|
36,797,172 | 28,791,259 | ||||||
|
Statutory
reserves
|
3,428,095 | 2,305,434 | ||||||
|
Accumulated
other comprehensive income
|
10,717,850 | 10,777,004 | ||||||
|
Total
stockholders’ equity
|
82,131,604 | 72,761,751 | ||||||
|
Total
liabilities and stockholders’ equity
|
100,936,009 | 101,918,091 | ||||||
See
accompanying notes to consolidated financial statements.
F-3
WINNER
MEDICAL GROUP INC.
CONSOLIDATED
STATEMENTS OF INCOME AND COMPREHENSIVE INCOME
|
Year
ended September 30,
|
||||||||||||
|
2009
|
2008
|
2007
|
||||||||||
|
US$
|
US$
|
US$
|
||||||||||
|
Net
sales
|
98,385,603 | 85,505,762 | 70,280,960 | |||||||||
|
Cost
of sales
|
(70,444,383 | ) | (64,086,581 | ) | (52,869,597 | ) | ||||||
|
Gross
profit
|
27,941,220 | 21,419,181 | 17,411,363 | |||||||||
|
Other
operating income, net
|
1,411,069 | 416,654 | 789,253 | |||||||||
|
Exchange
difference, net
|
(1,054,882 | ) | (1,378,289 | ) | (422,261 | ) | ||||||
|
Selling,
general and administrative expenses
|
(16,874,131 | ) | (14,437,539 | ) | (11,959,184 | ) | ||||||
|
Income
from operations
|
11,423,276 | 6,020,007 | 5,819,171 | |||||||||
|
Interest
income
|
68,928 | 41,338 | 72,650 | |||||||||
|
Interest
expenses
|
(459,127 | ) | (591,477 | ) | (408,123 | ) | ||||||
|
Equity
in earnings of 50 percent or less owned persons
|
388,099 | 93,298 | 178,693 | |||||||||
|
Income
before income taxes and minority interests
|
11,421,176 | 5,563,166 | 5,662,391 | |||||||||
|
Income
taxes
|
(2,358,093 | ) | (591,118 | ) | 15,015 | |||||||
|
Income
before minority interests
|
9,063,083 | 4,972,048 | 5,677,406 | |||||||||
|
Minority
interests
|
65,491 | 94,247 | (52,552 | ) | ||||||||
|
Net
income
|
9,128,574 | 5,066,295 | 5,624,854 | |||||||||
|
Other
comprehensive income
|
||||||||||||
|
Foreign
currency translation difference
|
(59,154 | ) | 6,290,969 | 2,907,981 | ||||||||
|
Comprehensive
income
|
9,069,420 | 11,357,264 | 8,532,835 | |||||||||
|
Net
income per share
|
||||||||||||
|
-
basic
|
0.41 | 0.23 | 0.25 | |||||||||
|
-
diluted
|
0.41 | 0.23 | 0.25 | |||||||||
|
Weighted
average common stock outstanding
|
||||||||||||
|
-
basic
|
22,363,675 | 22,363,675 | 22,338,675 | |||||||||
|
-
diluted
|
22,403,237 | 22,510,962 | 22,338,675 | |||||||||
See
accompanying notes to consolidated financial statements.
F-4
WINNER
MEDICAL GROUP INC.
CONSOLIDATED
STATEMENTS OF STOCKHOLDERS’ EQUITY
|
Common
stock
|
Accumulated
|
Total
|
||||||||||||||||||||||||||
|
Stock
|
Additional
|
other
|
stock-
|
|||||||||||||||||||||||||
|
outstanding
(Note)
|
Amount
|
paid-in
capital
|
Retained
earnings
|
Statutory
reserves
|
comprehensive
income
|
holders’
equity
|
||||||||||||||||||||||
|
US$
|
US$
|
US$
|
US$
|
US$
|
US$
|
|||||||||||||||||||||||
|
Balance
at September 30, 2006
|
22,338,675 | 22,339 | 30,259,535 | 19,182,866 | 1,222,678 | 1,578,054 | 52,265,472 | |||||||||||||||||||||
|
Stock
options granted
|
- | - | 23,350 | - | - | - | 23,350 | |||||||||||||||||||||
|
Net
income
|
- | - | - | 5,624,854 | - | - | 5,624,854 | |||||||||||||||||||||
|
Foreign
currency translation difference
|
- | - | - | - | - | 2,907,981 | 2,907,981 | |||||||||||||||||||||
|
Transfer
to statutory reserves
|
- | - | - | (691,666 | ) | 691,666 | - | - | ||||||||||||||||||||
|
Balance
at September 30, 2007
|
22,338,675 | 22,339 | 30,282,885 | 24,116,054 | 1,914,344 | 4,486,035 | 60,821,657 | |||||||||||||||||||||
|
Issuance
of common stock
|
25,000 | 25 | 199,975 | - | - | - | 200,000 | |||||||||||||||||||||
|
Restricted
stock units granted
|
- | - | 382,830 | - | - | - | 382,830 | |||||||||||||||||||||
|
Net
income
|
- | - | - | 5,066,295 | - | - | 5,066,295 | |||||||||||||||||||||
|
Foreign
currency translation difference
|
- | - | - | - | - | 6,290,969 | 6,290,969 | |||||||||||||||||||||
|
Transfer
to statutory reserves
|
- | - | - | (391,090 | ) | 391,090 | - | - | ||||||||||||||||||||
|
Balance
at September 30, 2008
|
22,363,675 | 22,364 | 30,865,690 | 28,791,259 | 2,305,434 | 10,777,004 | 72,761,751 | |||||||||||||||||||||
|
Restricted
stock units granted
|
- | - | 300,433 | - | - | - | 300,433 | |||||||||||||||||||||
|
Net
income
|
- | - | - | 9,128,574 | - | - | 9,128,574 | |||||||||||||||||||||
|
Foreign
currency translation difference
|
- | - | - | - | - | (59,154 | ) | (59,154 | ) | |||||||||||||||||||
|
Transfer
to statutory reserves
|
- | - | - | (1,122,661 | ) | 1,122,661 | - | - | ||||||||||||||||||||
|
Balance
at September 30, 2009
|
22,363,675 | 22,364 | 31,166,123 | 36,797,172 | 3,428,095 | 10,717,850 | 82,131,604 | |||||||||||||||||||||
Note: The common stock issued has been
retroactively restated to reflect a reverse stock split of one new share of
common stock for two old shares of common stock, effectively October 6, 2009.
The authorized shares and the par value per share, as referred to in these
financial statements have been restated where applicable to give retroactive
effect of the reverse stock split.
See
accompanying notes to consolidated financial statements.
F-5
WINNER
MEDICAL GROUP INC.
CONSOLIDATED
STATEMENTS OF CASH FLOWS
|
Year
ended September 30,
|
||||||||||||
|
2009
|
2008
|
2007
|
||||||||||
|
US$
|
US$
|
US$
|
||||||||||
|
Cash
flows from operating activities
|
||||||||||||
|
Net
income
|
9,128,574 | 5,066,295 | 5,624,854 | |||||||||
|
Adjustments
to reconcile net income to net cash from operating
activities:
|
||||||||||||
|
Depreciation
of property, plant and equipment
|
4,738,733 | 4,029,453 | 3,105,376 | |||||||||
|
Impairment
of property, plant and equipment
|
524,285 | 209,041 | - | |||||||||
|
Amortization
of intangible assets
|
20,359 | 16,776 | 6,276 | |||||||||
|
Deferred
tax
|
(245,836 | ) | (108,234 | ) | 5,354 | |||||||
|
(Gain)/
Loss on disposal of property, plant and equipment
|
(147,874 | ) | 125,985 | 9,944 | ||||||||
|
Minority
interests
|
(65,491 | ) | (94,247 | ) | 52,552 | |||||||
|
Equity
in earnings of 50 percent or less owned persons
|
(388,099 | ) | (93,298 | ) | (178,693 | ) | ||||||
|
Stock
based compensation expenses
|
300,433 | 382,830 | 57,556 | |||||||||
|
Changes
in operating assets and liabilities:
|
||||||||||||
|
Restricted
bank deposits
|
(38,193 | ) | (126,749 | ) | - | |||||||
|
Accounts
receivable
|
347,047 | (1,091,244 | ) | (3,368,780 | ) | |||||||
|
Amounts
due from affiliated companies
|
86,694 | 191,864 | 108,261 | |||||||||
|
Inventories
|
882,029 | (3,189,830 | ) | 446,283 | ||||||||
|
Prepaid
expenses and other receivable
|
1,301,394 | 2,608,935 | (131,790 | ) | ||||||||
|
Income
taxes recoverable
|
68,061 | 5,189 | (86,766 | ) | ||||||||
|
Accounts
payable
|
(3,415,560 | ) | 224,354 | 2,886,369 | ||||||||
|
Accrued
payroll and employee benefits
|
184,445 | 460,100 | 51,797 | |||||||||
|
Customer
deposits
|
146,239 | 58,546 | 78,633 | |||||||||
|
Other
accrued liabilities
|
60,356 | 525,251 | (549,260 | ) | ||||||||
|
Amounts
due to affiliated companies
|
(79,919 | ) | 90,426 | (172,997 | ) | |||||||
|
Income
taxes payable
|
1,280,674 | 352,958 | (282,545 | ) | ||||||||
|
Net
cash provided by operating activities
|
14,688,351 | 9,644,401 | 7,662,424 | |||||||||
|
|
||||||||||||
|
Cash
flows from investing activities
|
||||||||||||
|
Purchase
of property, plant and equipment
|
(3,630,912 | ) | (11,055,205 | ) | (12,088,215 | ) | ||||||
|
Purchase
of intangible assets
|
(41,441 | ) | - | (96,006 | ) | |||||||
|
Deposits
paid for property, plant and equipment
|
(1,054,419 | ) | - | - | ||||||||
|
Proceeds
from disposal of property, plant and equipment
|
1,200,296 | 64,438 | 129,892 | |||||||||
|
Proceeds
from disposal of an equity investee
|
141,753 | - | - | |||||||||
|
Investment
in an equity investee
|
(358,764 | ) | - | (184,722 | ) | |||||||
|
Dividends
received from an equity investee
|
200,000 | - | - | |||||||||
|
Repayment
received from (advanced to) affiliated companies
|
262,118 | (94,077 | ) | (7,804 | ) | |||||||
|
Net
cash used in investing activities
|
(3,281,369 | ) | (11,084,844 | ) | (12,246,855 | ) | ||||||
|
|
||||||||||||
|
Cash
flows from financing activities
|
|
|||||||||||
|
Proceeds
from bank borrowings
|
17,956,534 | 20,823,780 | 18,809,343 | |||||||||
|
Repayment
of bank borrowings
|
(26,383,047 | ) | (19,916,504 | ) | (11,981,294 | ) | ||||||
|
Amount
due to a shareholder
|
- | - | (1,638 | ) | ||||||||
|
Repayment
of dividend payable
|
- | - | (531,034 | ) | ||||||||
|
Proceeds
from minority interest
|
- | 51,277 | - | |||||||||
|
Net
cash (used in)/ provided by financing activities
|
(8,426,513 | ) | 958,553 | 6,295,377 | ||||||||
|
|
||||||||||||
|
Effect
of exchange rate changes on cash balance
|
50,052 | 566,907 | 346,963 | |||||||||
|
|
||||||||||||
|
Net
increase in cash and cash equivalents
|
3,030,521 | 85,017 | 2,057,909 | |||||||||
|
Cash
and cash equivalents, beginning of year
|
6,462,505 | 6,377,488 | 4,319,579 | |||||||||
|
Cash
and cash equivalents, end of year
|
9,493,026 | 6,462,505 | 6,377,488 | |||||||||
|
|
||||||||||||
|
Supplemental
disclosures of cash flow information:
|
|
|||||||||||
|
Cash
paid during the year for:
|
|
|||||||||||
|
Interest
|
459,127 | 591,477 | 408,123 | |||||||||
|
Income
taxes
|
1,252,093 | 387,795 | 314,470 | |||||||||
See
accompanying notes to consolidated financial statements.
F-6
WINNER
MEDICAL GROUP INC.
NOTES
TO CONSOLIDATED FINANCIAL STATEMENTS
FOR
THE YEARS ENDED SEPTEMBER 30, 2009, 2008 AND 2007
|
1.
|
Organization
and Basis of Preparation of Financial
Statements
|
Winner Medical Group Inc. (formerly
known as Las Vegas Resorts Corporation, HDH Industries, Inc. and Birch
Enterprises, Inc.) (“Winner Medical” or “the Company”) was originally
incorporated under the name Birch Enterprises, Inc. in the state of Nevada in
August 1986. The Company was initially formed as a “blank check” entity for the
purpose of seeking a merger, acquisition or other business combination
transaction with a privately owned entity seeking to become a publicly owned
entity.
On September 14, 1987, the Company
consummated a business combination transaction with Las Vegas Resort Investments
whereby Las Vegas Resort Investments became a wholly owned subsidiary of the
Company. Concurrent with this transaction, the Company changed its corporate
name to Las Vegas Resorts Corporation. During 1989, the Company completed a
public offering of the common stock pursuant to a Registration Statement on Form
S-18 (Registration No. 33-10513-LA).
During September 1992 all of Las Vegas
Resort Corporation’s operations ceased and, by July 31, 1993, Las Vegas Resort
Corporation had dissolved all subsidiaries and business operations. Las Vegas
Resort Corporation had no active operations from then until December 16,
2005.
Winner Group Limited, (subsequently
became a subsidiary of the Company), is a limited liability company registered
under the laws of the Cayman Islands and was incorporated in Cayman Islands on
April 8, 2003. On July 1, 2003, the major shareholder of Winner Group Limited
contributed all of his equity interest in 11 entities to Winner Group Limited.
Winner Group Limited then became the holding company of the reorganized group
with a total of 11 subsidiaries. The transaction was a group reorganization
entered into among entities under common control. The reorganization was treated
similar to the pooling of interest method with carry over basis. In July 2005,
Winner Group Limited entered into a financial advisory agreement with HFG
International, Limited, HFG, pursuant to which HFG agreed to provide financial
advisory and consulting services in facilitating the transaction by which Winner
Group Limited would go public, which, among other things, included locating a
proper shell company. In November 2005, HFG recommended Winner Medical Group
Inc. to the management of Winner Group Limited and Winner Group Limited started
negotiations with Winner Medical Group Inc. on a possible reverse acquisition
transaction. Other than fees paid to HFG International, Limited pursuant to that
certain Financial Advisory Agreement, no finder’s fees or other forms of
consideration were paid by Winner Group Limited or the Company or the Company’s
respective officers, directors or shareholders in connection with the share
exchange.
On December 16, 2005, Winner Medical
Group Inc. and Winner Group Limited entered into a share exchange agreement
pursuant to which the stockholders of Winner Group Limited were issued
21,140,420 shares of Winner Medical Group Inc. common stock, in exchange for all
1,143,000 shares of Winner Group Limited that were issued and outstanding as of
December 16, 2005. In connection with the acquisition transaction, Winner Group
Limited became the wholly owned subsidiary. Even though, from a legal
perspective, Winner Medical Group Inc. was the acquirer in this transaction,
Winner Group Limited is treated as the acquirer from an accounting
perspective.
Winner Group Limited is a
technology-driven medical dressings and medical disposables manufacturer based
in China. It became the wholly owned subsidiary in connection with the reverse
acquisition transaction and is the holding company for all of the commercial
operations.
On
February 13, 2006, the Company amended the Articles of Incorporation to change
the name from Las Vegas Resorts Corporation to Winner Medical Group Inc. Winner
Medical changed the name to reflect the new business and to be similar to the
names of the subsidiary companies.
The financial year end date of the
Company was changed from July 31 to September 30 with effect from February 13,
2006. On February 13, 2006, the Company changed its name to Winner Medical Group
Inc.
A one for two reverse stock split of
all of the Company’s outstanding common stock was effective on October 6, 2009,
The Company also reduced its authorized capital to 247,500,000 shares of common
stock, par value US$0.001 per share at that date accordingly. All share and
weighted average share in the accompanying consolidated financial statements and
notes thereto have been retroactively adjusted for all periods presented to
reflect the one for two reverse stock split.
F-7
WINNER
MEDICAL GROUP INC.
NOTES
TO CONSOLIDATED FINANCIAL STATEMENTS
FOR
THE YEARS ENDED SEPTEMBER 30, 2009, 2008 AND 2007
|
2.
|
Summary
of Significant Accounting Policies
|
The principal activities of the Company
consist of research and development, manufacturing and trading of medical
dressings and medical disposables. All activities of the Company are principally
conducted by subsidiaries operating in the People’s Republic of China
(“PRC”).
Principles of consolidation-
The consolidated financial statements, prepared in accordance with generally
accepted accounting principles in the United States of America, include the
assets, liabilities, revenues, expenses and cash flows of the Company and all
its subsidiaries. All significant inter-company accounts, transactions and cash
flows are eliminated on consolidation.
Equity
investments, in which the Company exercises significant influence but does not
control and is not the primary beneficiary, are accounted for using the equity
method. The Company regularly reviews its investments to determine whether a
decline in fair value below the cost basis is other than temporary.
Use of estimates- The
preparation of financial statements in conformity with generally accepted
accounting principles requires management to make estimates and assumptions that
affect the reported amounts of assets and liabilities and disclosures of
contingent assets and liabilities at the date of the financial statements and
the reported amounts of revenues and expenses during the reporting period. The
most significant estimates relate to allowance for uncollectible accounts
receivable, inventory obsolescence, asset impairment, depreciation and useful
lives, taxes and contingencies. These estimates may be adjusted as more current
information becomes available and any adjustment could be significant. Actual
results could differ from those estimates.
Intangible
assets- Trademarks are measured initially at cost and amortized on a
straight-line basis over their estimated useful lives, which is on average ten
years.
Cash and cash equivalents-
Cash and cash equivalents include cash on hand, cash accounts, interest bearing
savings accounts and time certificates of deposit with a maturity of three
months or less when purchased.
Inventories- Inventories are
stated at the lower of cost or market, determined by the weighted average
method. Work-in-progress and finished goods inventories consist of raw
materials, direct labor and overhead associated with the manufacturing
process.
Trade accounts receivable-
Trade accounts receivable are stated at the amount management expects to collect
from balances outstanding at year-end. Based on management’s assessment of the
credit history with customers having outstanding balances and current
relationships with them, it has concluded that realization losses on balances
outstanding at year-end will be immaterial.
Allowances for doubtful accounts
receivable balances are recorded when circumstances indicate that collection is
doubtful for particular accounts receivable. Management estimates such
allowances based on historical evidence such as amounts that are subject to
risk. Accounts receivable are written off if reasonable collection efforts are
not successful.
Property, plant and
equipment- Property, plant and equipment are stated at cost including the
cost of improvements. Maintenance and repairs are charged to expense as
incurred. Depreciable amounts are net of expected residual value of assets.
Depreciation and amortization are provided on the straight-line method based on
the estimated useful lives of the assets as follows:
|
Leasehold
land
|
Over
the lease term
|
|
Buildings
|
10
- 30 years
|
|
Plant
and machinery
|
10
- 12 years
|
|
Furniture,
fixtures and equipment
|
5 -
8 years
|
|
Motor
vehicles
|
5 -
8 years
|
|
Leasehold
improvements
|
Over
the lease term
|
Construction in progress-
Assets under construction are stated at cost, which includes all direct cost
relating to acquisition or construction cost, including interest charges on
borrowings, are capitalized as construction in progress. No depreciation is
provided until the construction is completed and the assets are ready for their
intended use.
Valuation of long-lived
assets- The Company periodically evaluates the carrying value of
long-lived assets to be held and used, including intangible assets subject to
amortization, when events and circumstances warrant such a review. The carrying
value of a long-lived asset is considered impaired when the anticipated
undiscounted cash flow from such asset is separately identifiable and is less
than its carrying value. In that event, a loss is recognized based on the amount
by which the carrying value exceeds the fair market value of the long-lived
asset. Fair market value is determined primarily using the anticipated cash
flows discounted at a rate commensurate with the risk involved. Losses on
long-lived assets to be disposed of are determined in a similar manner, except
that fair market values are reduced for the cost to
dispose.
F-8
WINNER
MEDICAL GROUP INC.
NOTES
TO CONSOLIDATED FINANCIAL STATEMENTS
FOR
THE YEARS ENDED SEPTEMBER 30, 2009, 2008 AND 2007
|
2.
|
Summary
of Significant Accounting Policies-
Continued
|
Revenue recognition- The
Company derives its revenue primarily from the sales of medical dressings and
disposals and PurCotton products. Sales of goods are recognized when goods are
shipped, title of goods sold has passed to the purchaser, the price is fixed or
determinable as stated on the sales contract, and its collectibility is
reasonably assured. Customers do not have a general right of return on products
shipped. Products returns to the Company were insignificant during past
years.
Comprehensive income-
Accumulated other comprehensive income represents foreign currency translation
adjustments and is included in the consolidated statement of stockholders’
equity.
Shipping and handling cost-
Shipping and handling costs related to delivery of finished goods are included
in selling expenses. During the years ended September 30, 2009, 2008 and 2007,
shipping and handling costs expensed to selling expenses were US$3,152,135,
US$4,415,131 and US$4,891,760 respectively.
Research and development
costs- Research and development costs are charged to expense when
incurred and are included in operating expenses. During the years ended
September 30, 2009, 2008 and 2007, research and development costs expensed to
operating expenses were approximately US$1,662,971, US$1,801,821 and
US$2,050,000 respectively.
Income taxes- Income taxes
are provided on an asset and liability approach for financial accounting and
reporting of income taxes. Any tax paid by subsidiaries during the year is
recorded. Current tax is based on the profit or loss from ordinary activities
adjusted for items that are non-assessable or disallowable for income tax
purpose and is calculated using tax rates that have been enacted or
substantively enacted at the balance sheet date. Deferred income tax liabilities
or assets are recorded to reflect the tax consequences in future years of
differences between the tax basis of assets and liabilities and the financial
reporting amounts at each year end. A valuation allowance is recognized if it is
more likely than not that some portion, or all, of a deferred tax asset will not
be realized.
The Company adopted FASB Interpretation
No. 48 Accounting for Uncertainty in Income Taxes- an interpretation of FASB
Statement No. 109 (FIN48), which is codified as ASC 740. ASC740 provides
guidance for recognizing and measuring uncertain tax positions, it prescribes a
threshold condition that a tax position must meet for any of the benefits of the
uncertain tax position to be recognized in the financial statements. ASC 740
also provides accounting guidance on derecognizing, classification and
disclosure of these uncertain tax positions.
Foreign currency translation-
The consolidated financial statements of the Company are presented in United
States Dollars (“US$”). Transactions in foreign currencies during the year are
translated into US$ at the exchange rates prevailing at the transaction dates.
Monetary assets and liabilities denominated in foreign currencies at the balance
sheet date are translated into US$ at the exchange rates prevailing at that
date. All transaction differences are recorded in the income
statement.
The subsidiaries in the PRC have their
local currency, Renminbi (“RMB”), as their functional currency. The subsidiary
in Hong Kong has its local currency, Hong Kong Dollar (“HK$”), as its functional
currency. On consolidation, the financial statements of the subsidiaries in PRC
and in Hong Kong are translated from RMB and HK$ into US$ in accordance with
SFAS No. 52, “Foreign Currency Translation”, which is codified as ASC 830.
Accordingly, all assets and liabilities are translated at the exchange rates
prevailing at the balance sheet dates and all income and expenditure items are
translated at the average rates for each of the years. The exchange rate between
the RMB and the US$ and used for the years ended September 30, 2009, 2008 and
2007 were RMB6.8290 to US$1, RMB6.8183 to US$1 and RMB7.5108 to US$1,
respectively. The exchange rate between the Hong Kong Dollar and the US$ and
used for the years ended September 30, 2009 and 2008 were HK$7.7502 to US$1 and
HK$7.7787 to US$1, respectively. Translation adjustments arising from the use of
different exchange rate from period to period are included as a component of
stockholders’ equity as “Accumulated other comprehensive income”. Gain and
losses resulting from foreign currency translations are included in other
comprehensive income.
Fair Value of financial
instruments- The carrying amounts of cash and cash equivalents, accounts
receivable, deposits and other receivable and other current assets, bank loans,
accounts payable and other current liabilities are reasonable estimates of their
fair values. All the financial instruments are for trade purposes. Fair value of
the amounts due to or from affiliates cannot be readily determined because of
the nature of the related party transactions.
Post-retirement and post-employment
benefits- The Company’s subsidiaries contribute to a state pension scheme
in respect of their PRC employees and a mandatory provident fund scheme in
respect of its Hong Kong employees. Other than the above, neither the Company
nor its subsidiaries provide any other post-retirement or post-employment
benefits.
Net income per share- Basic
net income per share is computed by dividing net income available to common
stockholders by the weighted average number of common stock outstanding
during the period. Diluted net income per share gives effect to all dilutive
potential ordinary shares outstanding during the year. The weighted average
number of common stock outstanding is adjusted to include the number of
additional common stock that would have been outstanding if the dilutive
potential common stock had been issued. In computing the dilutive effect of
potential common stock, the average stock price for the period is used in
determining the number of treasury shares assumed to be purchased with the
proceeds from the exercise options.
As of September 30, 2009 and 2008,
basic and diluted net income per share calculated in accordance with SFAS No.
128, “Earnings Per Share”, which is codified as ASC 260, are reconciled as
follows:
F-9
WINNER
MEDICAL GROUP INC.
NOTES
TO CONSOLIDATED FINANCIAL STATEMENTS
FOR
THE YEARS ENDED SEPTEMBER 30, 2009, 2008 AND 2007
|
2.
|
Summary
of Significant Accounting Policies-
Continued
|
|
Year
ended
September
30
|
||||||||
|
2009
|
2008
|
|||||||
|
US$
|
US$
|
|||||||
|
Basic
income per share
|
||||||||
|
Net
Income for the year - numerator
|
9,128,574 | 5,066,295 | ||||||
|
Weighted
average common stock outstanding - denominator
|
22,363,675 | 22,363,675 | ||||||
|
Net
income per share
|
0.41 | 0.23 | ||||||
|
Diluted
income per share
|
||||||||
|
Net
Income for the year - numerator
|
9,128,574 | 5,066,295 | ||||||
|
Weighted
average common stock outstanding - denominator
|
22,363,675 | 22,363,675 | ||||||
|
Effect
of dilution
|
||||||||
|
Restricted
stock
|
39,562 | 147,287 | ||||||
|
Options
|
- | - | ||||||
|
Weighted
average common stock outstanding - denominator
|
22,403,237 | 22,510,962 | ||||||
|
Net
income per share
|
0.41 | 0.23 | ||||||
On May 7, 2009, 4,167 potential common
stock expired. As of September 30, 2009, 10,000 potential common stock relating
to options at the exercise price of US$9.50 per share, and representing the
total options granted, were excluded from the computation of diluted income per
share as the exercise price was higher than the average market price for the
year ended September 30, 2009.
Government subsidies- Certain
subsidiaries of the Company located in PRC received government subsidies from
local PRC government agencies. In general, the Company records the government
subsidies received as part of other income unless the subsidies received was
earmarked for capital and operating expenditures or to compensate certain
expense, which has been accounted for in offsetting the respective
expenses.
Value added tax- All the PRC
subsidiaries of the Company are subject to value added tax (“VAT”) imposed by
PRC government on its purchase and sales of goods. The output VAT is charged to
customers who purchase goods from the Company and the input VAT is paid when it
purchases goods from its vendors. VAT rate is 17% in general, depending on the
types of products purchased and sold. The input VAT can be offset against the
output VAT. Debit balance of VAT payable represents a credit against future
collection of output VAT instead of a receivable.
Recent changes in accounting
standards- In December 2007, the FASB amended SFAS No. 141 (revised
2007), “Business Combinations.” SFAS No. 141R, which is codified as ASC 805. It
establishes principles and requirements for how an acquirer recognizes and
measures in its financial statements the identifiable assets acquired, the
liabilities assumed, and any noncontrolling interest in the acquiree. SFAS No.
141R applies prospectively to business combinations for which the acquisition
date is on or after the beginning of the first reporting period for fiscal years
beginning on or after December 15, 2008. Earlier application of SFAS 141R is
prohibited. SFAS No. 141R is effective for the Company’s fiscal year that begins
on April 1, 2009. The Company is evaluating the impact, if any, of the adoption
of SFAS No. 141R. The impact will depend on future
acquisitions. It is not expected to have material impact on the
Company’s consolidated financial position, results of operations and cash
flows.
In December 2007, FASB issued SFAS No.
160 “Non-controlling Interest in Consolidated Financial Statements”, which is
codified as ASC 810. ASC 810 amends Accounting Research Bulletin No.51,
Consolidated Financial Statements, to establish accounting and reporting
standards for the non-controlling interest in a subsidiary and for the
deconsolidation of a subsidiary. ASC 810 defines “a non-controlling
interest, sometimes called a minority interest, is the portion of equity in a
subsidiary not attributable, directly or indirectly, to a
parent”. The objective of ASC 810 is to improve the relevance,
comparability, and transparency of the financial information that a reporting
entity provides in its consolidated financial statements. ASC 810 is
effective for fiscal years, and interim periods within those fiscal years,
beginning on or after December 15, 2008 and is required to be adopted by the
Company in the first quarter of fiscal year 2010. The Company is
evaluating the impact, if any, of the adoption of ASC 810. It is not
expected to have material impact on the Company’s consolidated financial
position, results of operations and cash flows.
F-10
WINNER
MEDICAL GROUP INC.
NOTES
TO CONSOLIDATED FINANCIAL STATEMENTS
FOR
THE YEARS ENDED SEPTEMBER 30, 2009, 2008 AND 2007
|
2.
|
Summary
of Significant Accounting Policies-
Continued
|
In March
2008, the FASB issued SFAS No. 161 “Disclosures about Derivative Instruments and
Hedging Activities amendment of FASB Statement No. 133”, which is codified as
ASC 815. This statement changes the disclosure requirements for
derivative instruments and hedging activities. Entities are required
to provide enhanced disclosures stating how and why an entity uses derivative
instruments; how derivatives and related hedged items are accounted for under
SFAS No. 133, “Accounting for Derivative Instruments and Hedging Activities”
(“SFAS 133”) and its related interpretations; and how derivative instruments and
related hedge items affect an entity’s financial position, financial performance
and cash flows. ASC 815 is effective in fiscal years beginning after
November 15, 2008 and is required to be adopted by the Company in the first
quarter of fiscal year 2010. The Company does not expect the adoption
of ASC 815 will have a material impact on the Company’s
disclosures.
In April
2008, the FASB issued FSP 142-3, “Determination of the Useful Life of Intangible
Assets”, which is codified as ASC 350. ASC 350 amends the factors that should be
considered in developing renewal or extension assumptions used to determine the
useful life of a recognized intangible asset. ASC 350 is effective for fiscal
years beginning after December 15, 2008. The Company does not expect the
adoption of ASC 350 will have a material impact on the Company’s consolidated
financial position, results of operations and cash flows.
In June
2008, the FASB ratified EITF Issue No. 08-3, “Accounting for Lessees for
Maintenance Deposits Under Lease Arrangements”, which is codified as ASC 840.
ASC 840 provides guidance for accounting for nonrefundable maintenance deposits.
It also provides revenue recognition accounting guidance for the lessor. ASC 840
is effective for fiscal years beginning after December 15, 2008. The Company is
currently assessing the impact of ASC 840 on its consolidated financial position
and results of operations and is currently not yet in a position to determine
such effects.
In June
2008, the FASB issued FASB Staff Position (“FSP”) EITF 03-6-1 “Determining
Whether Instruments Granted in Share-Based Payment Transactions Are
Participating Securities”, which is codified as ASC 260. ASC 260 addresses
whether instruments granted in share-based payment transactions are
participating securities prior to vesting, and therefore need to be included in
the earnings allocation in computing earnings per share under the two-class
method. Under the guidance of ASC 260, unvested share-based payment awards that
contain nonforfeitable rights to dividends or dividend equivalents (whether paid
or unpaid) are participating securities and shall be included in the computation
of earnings-per-share pursuant to the two-class method. ASC 260 is effective for
financial statements issued for fiscal years beginning after December 15, 2008
and all prior-period earnings per share data presented shall be adjusted
retrospectively. Early application is not permitted. The Company is currently
evaluating the effect of ASC 260 on the earnings per share
calculation.
In October 2008, the Company adopted
SFAS No.157, “Fair Value Measurements”, which is codified as ASC 820, it defines
fair value, establishes a framework for measuring fair value in generally
accepted accounting principles (GAAP), and expands disclosure about fair value
measurements. ASC 820 is effective for fiscal years beginning after November 15,
2007. The adoption of the provisions of ASC 820 related to financial assets and
liabilities, and other assets and liabilities that are carried at fair value on
a recurring basis do not have a significant impact on the Company’s consolidated
financial position, results of operations and cash flows. The FASB provided for
a one-year deferral of the provisions of ASC 820 for non-financial assets and
liabilities that are recognized or disclosed at fair value in the consolidated
financial statements on a non-recurring basis. Accordingly, the Company is still
evaluating the impact of the provisions of ASC 820 for non-financial assets and
liabilities and is not yet in a position to determine such effects.
In April
2009, the FASB issued FSP No. FAS 141(R)-1, “Accounting for Assets Acquired and
Liabilities Assumed in a Business Combination That Arise from Contingencies”,
which is codified as ASC 805. ASC 805 amends and clarifies FASB Statement No.
141 (revised 2007), “Business Combinations”, to address application issues
raised by preparers, auditors, and members of the legal profession on initial
recognition and measurement, subsequent measurement and accounting, and
disclosure of assets and liabilities arising from contingencies in a business
combination. ASC 805 shall be effective for assets or liabilities arising from
contingencies in business combinations for which the acquisition date is on or
after the beginning of the first annual reporting period beginning on or after
December 15, 2008. The Company is currently evaluating the effect of ASC 805 on
its consolidated financial statements and results of operation and is currently
not yet in a position to determine such effects.
In June 2009, the FASB issued SFAS No.
166, Accounting for Transfers of Financial Assets—an amendment of FASB Statement
No. 140 (SFAS No. 166”). This standard has not yet been codified in the FASB
Accounting Standards Codification. SFAS No. 166 seeks to improve the relevance,
representational faithfulness, and comparability of the information that a
reporting entity provides in its financial statements about a transfer of
financial assets; the effects of a transfer on its financial position, financial
performance, and cash flows; and a transferor’s continuing involvement, if any,
in transferred financial assets. SFAS No. 166 is applicable for annual periods
after November 15, 2009 and interim periods therein and thereafter. The Company
is currently evaluating the effect of ASC 805 on its consolidated financial
statements and results of operation and is currently not yet in a position to
determine such effects.
F-11
WINNER
MEDICAL GROUP INC.
NOTES
TO CONSOLIDATED FINANCIAL STATEMENTS
FOR
THE YEARS ENDED SEPTEMBER 30, 2009, 2008 AND 2007
|
2.
|
Summary
of Significant Accounting Policies-
Continued
|
In June
2009, the FASB issued SFAS No.167, “Amendments to FASB Interpretation No.46(R)”,
which is codified as ASC 810. ASC 810 amends FASB Interpretation No.46(R),
“Variable Interest Entities” for determining whether an entity is a variable
interest entity (“VIE”) and requires an enterprise to perform an analysis to
determine whether the enterprise’s variable interest or interests give it a
controlling financial interest in a VIE. Under ASC 810, an enterprise has a
controlling financial interest when it has a) the power to direct the activities
of a VIE that most significantly impact the entity’s economic performance and b)
the obligation to absorb losses of the entity or the right to receive benefits
from the entity that could potentially be significant to the VIE. ASC 810 also
requires an enterprise to assess whether it has an implicit financial
responsibility to ensure that a VIE operates as designed when determining
whether it has power to direct the activities of the VIE that most significantly
impact the entity’s economic performance. ASC 810 also requires ongoing
assessments of whether an enterprise is the primary beneficiary of a VIE,
requires enhanced disclosures and eliminates the scope exclusion for qualifying
special-purpose entities. ASC 810 shall be effective as of the beginning of each
reporting entity’s first annual reporting period that begins after November 15,
2009, for interim periods within that first annual reporting period, and for
interim and annual reporting periods thereafter. Earlier application is
prohibited. ASC 810 is effective for the Company in the first quarter of fiscal
2011. The Company is currently evaluating the effect of ASC 810 on its
consolidated financial statements and results of operation and is currently not
yet in a position to determine such effects.
In June
2009, the FASB issued SFAS No. 168, “The ‘FASB Accounting Standards
Codification’ and the Hierarchy of Generally Accepted Accounting Principles”,
which is codified as ASC 105. ASC 105 establishes the “FASB Accounting Standards
Codification” (“Codification”), which officially launched July 1, 2009, to
become the source of authoritative U.S. generally accepted accounting principles
(“GAAP”) recognized by the FASB to be applied by nongovernmental entities. Rules
and interpretive releases of the Securities and Exchange Commission (“SEC”)
under authority of federal securities laws are also sources of authoritative
U.S. GAAP for SEC registrants. The subsequent issuances of new standards will be
in the form of Accounting Standards Updates that will be included in the
Codification. Generally, the Codification is not expected to change U.S. GAAP.
All other accounting literature excluded from the Codification will be
considered nonauthoritative. ASC 105 is effective for financial statements
issued for interim and annual periods ending after September 15, 2009. The
Company has adopted ASC 105 for the quarter ending September 30, 2009. The
adoption of this Statement will not impact the results of operations or
financial position, as it only required disclosures.
In August
2009, the FASB issued Accounting Standards Update (“ASU”) No. 2009-05,
“Measuring Liabilities at Fair Value”, which is codified as ASC 820, “Fair Value
Measurements and Disclosures”. This Update provides amendments to ASC 820-10,
Fair Value Measurements and Disclosures –Overall, for the fair value measurement
of liabilities. This Update provides clarification that in circumstances in
which a quoted price in an active market for the identical liability is not
available, a reporting entity is required to measure fair value using a
valuation technique that uses the quoted price of the identical liability when
traded as an asset, quoted prices for similar liabilities or similar liabilities
when traded as assets, or that is consistent with the principles of ASC 820. The
amendments in this Update also clarify that when estimating the fair value of a
liability, a reporting entity is not required to include a separate input or
adjustment to other inputs relating to the existence of a restriction that
prevents transfer of the liability. The amendments in this Update also clarify
that both a quoted price in an active market for the identical liability at the
measurement date and the quoted price for the identical liability when traded as
an asset in an active market when no adjustments to the quoted price of the
assets are required are Level 1 fair value measurements. The guidance provided
in this Update is effective for the first reporting period (including interim
periods) beginning after issuance. The adoption of this Update did not have a
significant impact to the Company’s consolidated financial
statements.
|
3.
|
Inventories
|
Inventories
by major categories are summarized as follows:
|
September
30,
|
||||||||
|
2009
|
2008
|
|||||||
|
US$
|
US$
|
|||||||
|
Raw
materials
|
7,083,409 | 5,400,887 | ||||||
|
Work
in progress
|
3,768,446 | 5,839,042 | ||||||
|
Finished
goods
|
4,080,885 | 4,599,658 | ||||||
| 14,932,740 | 15,839,587 | |||||||
F-12
WINNER
MEDICAL GROUP INC.
NOTES
TO CONSOLIDATED FINANCIAL STATEMENTS
FOR
THE YEARS ENDED SEPTEMBER 30, 2009, 2008 AND 2007
|
4.
|
Property,
Plant and Equipment
|
Property,
plant and equipment consist of the following:
|
September
30,
|
||||||||
|
2009
|
2008
|
|||||||
|
US$
|
US$
|
|||||||
|
At
cost:
|
||||||||
|
Leasehold
land and buildings
|
34,593,816 | 34,331,569 | ||||||
|
Plant
and machinery
|
30,826,963 | 26,905,302 | ||||||
|
Furniture,
fixtures and equipment
|
3,422,188 | 2,380,817 | ||||||
|
Motor
vehicles
|
859,679 | 866,630 | ||||||
|
Leasehold
improvements
|
3,750,692 | 3,514,271 | ||||||
|
Total
|
73,453,338 | 67,998,589 | ||||||
|
Less:
accumulated depreciation and amortization
|
(20,314,803 | ) | (17,023,596 | ) | ||||
|
Construction
in progress
|
2,632,335 | 6,962,888 | ||||||
|
Net
book value
|
55,770,870 | 57,937,881 | ||||||
All the land in the PRC is owned by the
PRC government. The government, according to PRC laws, may grant to entities the
right to use of land for a specified period of time (the period of the land used
for ordinary industry is 50 years). Thus, all of the Company’s land
purchased in the PRC is considered to be leasehold land and amortized on a
straight-line basis over the respective term of the right to use the land. Construction
in progress mainly comprises capital expenditures for machinery not yet put to
use by the Company either under installation or quality inspection
stages.
Included
in the cost of the plant and machinery for the production of the Company’s
traditional products are sets of machineries amounting to US$118,231 and
US$1,969,730 against which total impairment provision of US$33,581 and
US$410,312 was made as of September 30, 2009 and 2008 respectively. Interest
charges on borrowings totaling US$578,943 and US$434,998 have been capitalized
in the cost of property, plant and equipment as of September 30, 2009 and 2008
respectively.
|
5.
|
Held-for-sale
asset
|
On July
17, 2008, board of directors passed a resolution to liquidate a Company’s
subsidiary in Zhuhai, PRC and obtained the approval from the local government in
PRC on July 24, 2008. On September 10, 2008, Board of Directors authorized to
sell out a building held by that subsidiary. On September 18, 2008, a sales
contract has been signed with an independent third party to transfer the
building at a consideration of US$868,333. The Company received the amount of
US$868,333 on December 9, 2008 and the gain of this disposal was US$199,527. The
carrying amount of the held-for-sale asset as of September 30, 2009 and 2008
were US$Nil and US$607,423, respectively.
Held-for-sale asset consist of the
following:
|
September
30,
|
||||||||
|
2009
|
2008
|
|||||||
|
US$
|
US$
|
|||||||
|
At
cost:
|
||||||||
|
Building
|
- | 1,051,320 | ||||||
|
Less:
accumulated depreciation
|
- | (443,897 | ) | |||||
|
Net
book value
|
- | 607,423 | ||||||
F-13
WINNER
MEDICAL GROUP INC.
NOTES
TO CONSOLIDATED FINANCIAL STATEMENTS
FOR
THE YEARS ENDED SEPTEMBER 30, 2009, 2008 AND 2007
|
6.
|
Credit
Facilities and Pledged Assets
|
The subsidiaries in Shenzhen, Tianmen
and Huanggang have credit lines with Shenzhen Commercial Bank, Shenzhen Branch
of the Industrial and Commercial Bank of China, Tianmen Branch of the Industrial
and Commercial Bank of China, Huanggang Branch of the Industrial and Commercial
Bank of China, representing trade acceptances, loans and
overdrafts.
As of
September 30, 2009, the Company had approximately US$25.82 million bank credit
facilities from four commercial banks; and after drawdown of US$6.59 million
banks loans as of September 30, 2009, there are US$19.23 million unused bank
credit facilities. The maturities of these facilities are generally
up to October 2010. For bank loans obtained by other subsidiaries, there were no
unused credit lines. The weighted average interest rates on
short-term borrowings as of September 30, 2009 and 2008 were 5.92% and 7.39% per
annum, respectively. There are no significant covenants or other financial
restrictions relating to the Company’s facilities except that at September 30,
2009 and 2008, leasehold land and buildings, plant and machinery with net book
values of US$6,375,568 and US$6,590,342 respectively, have been pledged as
collateral for the above facilities.
As of September 30, 2009 and 2008,
the Company has the following short-term bank loans:
|
September
30,
|
||||||||
|
2009
|
2008
|
|||||||
|
US$
|
US$
|
|||||||
|
Bank
loans repayable within one year
|
6,589,545 | 15,033,073 | ||||||
|
Original
currency in RMB
|
45,000,000 | 102,500,000 | ||||||
Bank loans as of September 30, 2009
consist of the following:
|
2009
|
|||||||||||||
|
Loan
|
Loan
period
|
Interest
rate
|
Secured
by
|
US$
|
|||||||||
|
A
|
2009.06.08-2010.06.08 | 4.78 | % |
Land
use rights & buildings
|
1,464,343 | ||||||||
|
B
|
2009.06.10-2010.06.10 | 4.78 | % |
Land
use rights & buildings
|
1,464,343 | ||||||||
|
C
|
2009.06.30-2010.06.30 | 4.78 | % |
Land
use rights & buildings
|
1,464,343 | ||||||||
|
D
|
2009.09.20-2010.09.20 | 5.31 | % |
Land
use rights & buildings
|
732,173 | ||||||||
|
E
|
2009.02.27-2010.02.26 | 5.31 | % |
Land
use rights & buildings
|
1,464,343 | ||||||||
| 6,589,545 | |||||||||||||
Bank loans as of September 30, 2008
consist of the following:
|
2008
|
|||||||||||||
|
Loan
|
Loan
period
|
Interest
rate
|
Secured
by
|
US$
|
|||||||||
|
A
|
2008.07.03-2009.06.29 | 8.22 | % |
Land
use rights & buildings
|
1,466,641 | ||||||||
|
B
|
2008.07.21-2009.06.29 | 8.22 | % |
Land
use rights & buildings
|
733,321 | ||||||||
|
C
|
2008.08.22-2009.08.21 | 8.22 | % |
Land
use rights & buildings
|
733,321 | ||||||||
|
D
|
2008.08.29-2009.08.28 | 8.22 | % |
Land
use rights & buildings
|
1,466,641 | ||||||||
|
E
|
2008.09.27-2009.03.24 | 6.21 | % |
Land
use rights & buildings
|
1,466,641 | ||||||||
|
F
|
2008.01.02-2009.01.02 | 7.47 | % |
Land
use rights & buildings
|
1,173,313 | ||||||||
|
G
|
2008.01.02-2009.01.02 | 7.47 | % |
Land
use rights & buildings
|
1,026,649 | ||||||||
|
H
|
2008.05.27-2009.05.27 | 7.47 | % |
Land
use rights & buildings
|
1,173,313 | ||||||||
|
I
|
2008.06.30-2009.04.15 | 6.57 | % |
Land
use rights & buildings
|
1,319,977 | ||||||||
|
J
|
2008.09.22-2009.03.22 | 6.21 | % |
Land
use rights & buildings
|
1,466,641 | ||||||||
|
K
|
2008.01.22-2009.01.20 | 7.47 | % |
Land
use rights & buildings
|
2,126,630 | ||||||||
|
L
|
2008.06.26-2009.06.25 | 7.84 | % |
Land
use rights & buildings
|
879,985 | ||||||||
| 15,033,073 | |||||||||||||
F-14
WINNER
MEDICAL GROUP INC.
NOTES
TO CONSOLIDATED FINANCIAL STATEMENTS
FOR
THE YEARS ENDED SEPTEMBER 30, 2009, 2008 AND 2007
|
7.
|
Prepaid
Expenses and Other Receivable
|
Prepaid expenses and other receivable
consist of the following:
|
September
30,
|
||||||||
|
2009
|
2008
|
|||||||
|
US$
|
US$
|
|||||||
|
Value
added tax receivable
|
1,907,195 | 2,747,965 | ||||||
|
Deferred
expenditure
|
120,849 | 122,779 | ||||||
|
Advance
to suppliers
|
771,565 | 489,472 | ||||||
|
Advance
to plant and machinery vendors
|
- | 628,499 | ||||||
|
Others
|
814,958 | 745,788 | ||||||
| 3,614,567 | 4,734,503 | |||||||
|
8.
|
Investment
in Equity Investees
|
|
September
30,
|
||||||||
|
2009
|
2008
|
|||||||
|
US$
|
US$
|
|||||||
|
Investment
cost of L+L Healthcare Hubei Co. Ltd.
|
1,045,130 | 1,045,130 | ||||||
|
Investment
cost of Winner Medical Jordan Ltd.
|
- | 184,722 | ||||||
|
Investment
cost of Chengdu Winner Likang Medical Appliance Co. Ltd
|
358,763 | - | ||||||
|
Share
of accumulated equity in earnings of 50 percent or less owned
persons
|
520,063 | 288,996 | ||||||
| 1,923,956 | 1,518,848 | |||||||
As of September 30, 2009, the Company
holds a 40% equity interest in L+L Healthcare Hubei Co. Ltd. (“L+L”) in PRC, and
49% equity interest in Chengdu Winner Likang Medical Appliance Co.
Ltd.
In
October 2008, in order to execute a change of the Company’s marketing strategy
in Middle East Countries, the Board of Directors of Winner Medical Jordan Ltd.,
“Winner Jordan”, decided to deregister Winner Jordan. Instead, the Company
appointed marketing agents in Jordan for its business in Middle East. The total
investment previously put into Winner Jordan is US$184,722, representing a 35%
ownership of Winner Jordan. There was no operation in Winner Jordan since its
establishment in May 2007. The total loss from Winner Jordan, mainly
representing the setting-up expense, since its date of incorporation
attributable to the Company, was approximately US$42,967.
In May 2009, Winner Industries
(Shenzhen) Co., Ltd.("Winner Shenzhen"), a wholly owned subsidiary of the
Company, invested an amount of US$358,764 to Chengdu Winner Likang Medical
Appliance Co. Ltd. representing 49% equity interest held.
The share of equity in earnings of
equity investees during the years ended September 30, 2009, 2008 and 2007 were
US$388,099, US$93,298 and US$178,693 respectively.
|
9.
|
Intangible
Assets
|
|
September
30,
|
||||||||
|
2009
|
2008
|
|||||||
|
US$
|
US$
|
|||||||
|
Patent,
cost
|
51,643 | 51,317 | ||||||
|
Trademark,
cost
|
154,734 | 113,911 | ||||||
|
Less:
accumulated amortization
|
(59,369 | ) | (39,087 | ) | ||||
|
Net
book value
|
147,008 | 126,141 | ||||||
F-15
WINNER
MEDICAL GROUP INC.
NOTES
TO CONSOLIDATED FINANCIAL STATEMENTS
FOR
THE YEARS ENDED SEPTEMBER 30, 2009, 2008 AND 2007
|
10.
|
Other
Accrued Liabilities
|
Other accrued liabilities consist of
the following:
|
September
30,
|
||||||||
|
2009
|
2008
|
|||||||
|
US$
|
US$
|
|||||||
|
Transportation
costs
|
272,800 | 470,186 | ||||||
|
Accrued
expenses
|
306,600 | 362,223 | ||||||
|
Deposit
received
|
281,191 | 255,558 | ||||||
|
Advance
from staff
|
105,492 | 110,621 | ||||||
|
Payable
to vendors
|
305,746 | 184,472 | ||||||
|
Government
subsidy receipt in advance
|
419,309 | 428,479 | ||||||
|
Value
added tax payable
|
238,217 | 407,601 | ||||||
|
Other
taxes payable
|
255,948 | 90,822 | ||||||
|
Commission
expenses
|
190,690 | - | ||||||
|
Withholding
tax payable
|
116,582 | 116,582 | ||||||
|
Others
|
82,161 | 91,782 | ||||||
| 2,574,736 | 2,518,326 | |||||||
|
11.
|
Income
Taxes
|
United States
The Company is incorporated in the
United States of America and is subject to United States of federal taxation. No
provisions for income taxes have been made as the Company has no taxable income
for the years. The applicable income tax rate for the Company for each of the
years ended September 30, 2009, 2008 and 2007 is 34%.
Cayman Islands
Winner Group Limited, a wholly owned
subsidiary of the Company, is incorporated in the Cayman Islands and, under the
current laws of the Cayman Islands, is not subject to income taxes.
Hong Kong
Winner Medical (Hong Kong) Limited
(“Winner HK”), a 60% owned subsidiary of the Company, is incorporated in Hong
Kong. Winner HK is subject to Hong Kong taxation on its activities conducted in
Hong Kong and income arising in or derived from Hong Kong. Winner HK was
incorporated in January 2008 and the applicable statutory tax rate for this
subsidiary for each of the years ended September 30, 2009 and 2008 is
16.5%.
PRC
Effective on January 1, 2008, the PRC
Enterprise Income Tax Law, EIT Law, and Implementing Rules impose an unified
enterprise income tax rate of 25% on all domestic-invested enterprises and
foreign investment enterprises in PRC, unless they qualify under certain limited
exceptions. As such, starting from January 1, 2008, three of the Company’s
subsidiaries in PRC, including Winner Medical & Textile Ltd., Jingmen,
Winner Medical & Textile Ltd., Jiayu, and Winner Medical & Textile Ltd.,
Yichang, are subject to an enterprise income tax rate of 25%.
The EIT Law gives existing foreign
investment enterprises a five-year grandfather period, during which they can
continue to enjoy their existing preferential tax treatments. For foreign
investment enterprises that currently enjoy full exemption from PRC enterprise
income tax for two years starting from the first profit-making year, followed by
a 50% tax exemption for the next three years, the tax holidays are still valid.
Four of the Company’s PRC subsidiaries, Winner Medical (Huanggang) Co., Ltd.,
Winner Medical & Textile Ltd., Chongyang, Hubei Winner Textiles Co., Ltd.,
and Shanghai Winner Medical Apparatus Co., Ltd. are each entitled to a two-year
exemption from enterprise income tax and a reduced enterprise income tax rate
for the three years following its second profitable year.
Winner Medical (Huanggang) Co., Ltd.
enjoys its full tax exemption from January 1, 2008, and the 50% tax exemption
from January 1, 2010. The preferential tax incentives will expire on December
31, 2012. Winner Medical & Textile Ltd., Chongyang enjoys the 50% tax
exemption from January 1, 2008, and from January 1, 2011, Winner Medical &
Textile Ltd., Chongyang will be subject to an enterprise income tax rate of 25%.
Shanghai Winner Medical Apparatus Co., Ltd. enjoys the 50% tax exemption from
January 1, 2009 and will be expired on December 31, 2011.
F-16
WINNER
MEDICAL GROUP INC.
NOTES
TO CONSOLIDATED FINANCIAL STATEMENTS
FOR
THE YEARS ENDED SEPTEMBER 30, 2009, 2008 AND 2007
|
11.
|
Income
Taxes- Continued
|
PRC
In October 2006, for the purpose of
improving operation efficiency, Hubei Winner Textiles Co., Ltd., “Winner Hubei”,
merged with Winner Medical & Textile Ltd., Tianmen, “Winner Tianmen”. Income
from Winner Hubei and Winner Tianmen were separately reported to the local tax
office to reflect the different tax incentive status enjoyed by both entities.
The applicable income tax rates for Winner Hubei and Winner Tianmen was 12.5%
and 25% respectively for calendar years 2008 and 2009. The preferential tax
incentives will be expired on December 31, 2009.
On
September 11, 2009, Winner Industries (Shenzhen) Co., Ltd., or "Winner
Shenzhen", obtained the High and New Technology Enterprise Certificate granted
by the Ministry of Science and Technology of China, the Ministry of Finance and
the State Administration of Taxation. Winner Shenzhen enjoyed an applicable
corporate income tax rate of 15% from January 1, 2009 to the year end of 2011.
The applicable corporate income tax rates of Winner Shenzhen were 18% and 20%
for the first 9 months and the last 3 months of 2008 respectively, which was in
accordance to the grandfather period arrangement in Shenzhen PRC under the EIT
Law.
On
October 1, 2007, the Company adopted FASB Interpretation No. 48, Accounting for
Uncertainty in Income Taxes- an interpretation of FASB Statement No. 109, which
is codified as ASC 740. The Company’s policy classifies all interest and
penalties related to unrecognized tax benefits, if any, as a component of income
tax provisions. The Company performed self-assessment and the Company’s
liability for income taxes includes the liability for unrecognized tax benefits,
interest and penalties which relate to tax years still subject to review by
taxing authorities. Audit periods remain open for review until the statute of
limitations has passed. The completion of review or the expiration of the
statute of limitations for a given audit period could result in an adjustment to
the Company’s liability for income taxes. Any such adjustment could be material
to the Company’s results of operations for any given quarterly or annual period
based, in part, upon the results of operations for the given period. Until
September 30, 2009, the management considered that the Company had no uncertain
tax positions affecting its consolidated financial position and results of
operations or cash flows, and will continue to evaluate for the uncertain
position in future. There are no estimated interest costs and penalties provided
in the Company’s consolidated financial statements for the years ended September
30, 2009 and 2008, respectively. The Company’s uncertain tax positions are
related to tax years that remain subject to examination by the relevant tax
authorities and the major one is the China Tax Authority. The open tax year for
examination in PRC is 5 years.
The provision for income taxes consists
of the following:
|
Year
ended September 30,
|
||||||||||||
|
2009
|
2008
|
2007
|
||||||||||
|
US$
|
US$
|
US$
|
||||||||||
|
Current
tax
|
||||||||||||
|
-
PRC
|
1,997,095 | 912,954 | 204,900 | |||||||||
|
-
HK
|
607,012 | (218,829 | ) | (225,130 | ) | |||||||
|
Deferred
tax
|
(246,014 | ) | (103,007 | ) | 5,215 | |||||||
| 2,358,093 | 591,118 | (15,015 | ) | |||||||||
A
reconciliation between the provision for income taxes computed by applying the
statutory tax rate in PRC to income before income taxes and the actual provision
for income taxes is as follows:
|
Year
ended September 30,
|
||||||||||||
|
2009
|
2008
|
2007
|
||||||||||
|
US$
|
US$
|
US$
|
||||||||||
|
Tax
calculated at domestic statutory rate (2009: 25%; 2008: 25%; 2007:
33%)
|
2,855,294 | 1,390,792 | 1,868,875 | |||||||||
|
Effect
of different tax rates in various jurisdictions
|
(19,255 | ) | 52,490 | - | ||||||||
|
Effect
on opening deferred tax balances resulting from change in applicable tax
rate
|
12,847 | (90,436 | ) | - | ||||||||
|
Tax
effect of preferential tax treatment
|
(1,139,766 | ) | (730,373 | ) | (1,365,613 | ) | ||||||
|
Tax
effect of expenses not deductible for tax purpose
|
137,559 | 15,805 | (1,105 | ) | ||||||||
|
Tax
effect of government subsidies not subject to tax
|
(106,256 | ) | (69,418 | ) | (90,650 | ) | ||||||
|
Tax
effect of withholding tax on distributed profits of a PRC
subsidiary
|
601,038 | - | - | |||||||||
|
(Over)/Under
provision in previous year
|
(747 | ) | 22,315 | (400,500 | ) | |||||||
|
Others
|
17,379 | (57 | ) | (26,022 | ) | |||||||
| 2,358,093 | 591,118 | (15,015 | ) | |||||||||
F-17
WINNER
MEDICAL GROUP INC.
NOTES
TO CONSOLIDATED FINANCIAL STATEMENTS
FOR
THE YEARS ENDED SEPTEMBER 30, 2009, 2008 AND 2007
|
11.
|
Income
Taxes- Continued
|
Had the
all above tax holidays and concessions not been available, the tax charge would
have been higher by US$1,139,766, US$730,373 and US$1,365,613 and the
basic and diluted net income per share would have been lower by US$0.05, US$0.03
and US$0.06 for the years.No income tax arose in the United States of America in
any period presents.
The components of deferred tax assets
recognized is as follows:
|
September
30,
|
||||||||
|
2009
|
2008
|
|||||||
|
|
US$
|
US$
|
||||||
|
Deferred tax assets
|
||||||||
|
Current:
-
|
||||||||
|
Future
benefit of tax losses
|
85,349 | 59,368 | ||||||
|
Temporary
differences in accrued liabilities
|
41,744 | 35,380 | ||||||
|
Temporary
differences in inventories
|
173,782 | 87,641 | ||||||
|
Temporary
difference in bad debt
|
58,276 | 25,409 | ||||||
| 359,151 | 207,798 | |||||||
|
Non
current: -
|
||||||||
|
Future
benefit of tax losses
|
153,634 | - | ||||||
|
Temporary
differences in property, plant and equipment
|
98,556 | 158,280 | ||||||
| 252,190 | 158,280 | |||||||
The component of deferred tax
liabilities recognized is as follows:
|
September
30,
|
||||||||
|
2009
|
2008
|
|||||||
|
US$
|
US$
|
|||||||
|
Non
current: -
|
||||||||
|
Temporary
differences in property, plant and equipment
|
41,899 | 41,965 | ||||||
The net
operating loss attributable to those PRC subsidiaries can only be carried
forward for a maximum period of five years. The tax losses will be expired in
fiscal years 2014 and 2015 were US$2,142,665 and US$20,507
respectively.
|
12.
|
Related
Party Transactions
|
Mr.
Jianquan Li, a director with a controlling interest in Safe Secure Packing
(Shenzhen) Co., Ltd (“Safe Secure”), sold all of his controlling interest in
Safe Secure to a third party as of September 30, 2007. During the year ended
September 30 2007, the Company sold goods to Safe Secure for US$1,740, and
purchased goods from it for US$491,463.
During
the years ended September 30, 2009, 2008 and 2007, the Company sold goods to
Winner Medical & Textile (H.K.) Limited for US$Nil, US$894,560 and
US$809,168 respectively. During the years ended September 30, 2009, 2008 and
2007, the Company purchased goods from Winner Medical & Textile (H.K.)
Limited for US$5,846, US$Nil and US$Nil respectively. Mr. Jianquan Li, director
of the Company, has a controlling interest in Winner Medical & Textile
(H.K.) Limited. As of September 30, 2009 and 2008, the outstanding balance due
from Winner Medical &Textile (H.K.) Limited were US$Nil and US$183,247
respectively.
During
the years ended September 30, 2009, 2008 and 2007, the Company purchased goods
from L+L Healthcare Hubei Co., Ltd. (“L+L”) for US$67,848, US$716,248, and
US$490,818 respectively. During the years ended September 30, 2009,
the Company purchased a set of machineries and received dividend from L+L for
US$36,593 and US$200,000, respectively. As of September 30, 2009, 2008 and 2007,
amount due from L+L was US$Nil, US$166,111 and US$150,796 respectively. As of
September 30, 2009 and 2008, amount due to L+L was US$56,349
and US$24,219 respectively.
The
amounts due from/to the above affiliated companies with the exception of L+L are
unsecured, interest free and payable according to the trading credit terms. The
amount due from L+L.is unsecured, 5% interest bearing and payable according to
the trading credit terms.
F-18
WINNER
MEDICAL GROUP INC.
NOTES
TO CONSOLIDATED FINANCIAL STATEMENTS
FOR
THE YEARS ENDED SEPTEMBER 30, 2009, 2008 AND 2007
|
13.
|
Stock-Based
Compensation
|
Stock-Based Compensation- The
Company has adopted Statement of Financial Accounting Standard ("SFAS") No. 123
(revised 2004) ("SFAS No. 123(R)"), which is codified as ASC 718. ASC 718
requires that share-based payment transactions with employees, such as share
options, are measured based on the grant-date fair value of the equity
instrument issued and recognized as compensation expense over the requisite
service period, with a corresponding addition to equity. Under this method,
compensation cost related to employee share options or similar equity
instruments is measured at the grant date based on the fair value of the award
and is recognized over the period during which an employee is required to
provide service in exchange for the award, which is generally the vesting
period. Compensation expense is recognized for those awards that are expected to
vest, which the Company estimates based upon historical
forfeitures.
The Company uses the Black-Scholes
option-pricing model, which was developed for use in estimating the fair value
of traded options that have no restrictions, are fully transferable and
negotiable in a free trading market, to value its options under the independent
director’s contract. Use of an option valuation model, as required by
ASC 718, includes highly subjective assumptions based on long-term prediction,
including the expected stock price volatility and average life of each option
grant.
|
Year
ended September 30,
|
||||
|
2009
|
||||
|
Risk
free interest rate
|
0.38 | % | ||
|
Volatility
|
224.89 | % | ||
|
Expected
life (years)
|
3 | |||
|
Dividends
|
- | |||
|
Weighted
average fair value of options granted during the period
|
US$ | 1.24 | ||
In a contract signed on May 8, 2006,
the Company agreed to grant to two of its independent directors each year
non-qualified options for purchasing up to 10,000 shares of the common stock of
the Company, which options shall be exercisable within three years from the
grant date and have an exercise price equal to the fair market value on the
grant date. On May 8, 2006, a total of 4,167 non-qualified options
was granted and expired on May 7, 2009. On February 6, 2007, a total of 10,000
non-qualified options was granted. On October 1, 2007, the Company and two of
its independent directors agreed to increase the cash compensation to them of
US$5,000 each, and in order to substitute the option compensation terms agreed
in the previous contracts. The options granted on February 6, 2007
according to the previous contracts are still valid. There was no
stock-based compensation cost relating to the non-qualified options recorded for
the years ended September 30, 2009 and 2008, respectively. Instead, the total
cash compensation costs for independent directors for the year ended September
30, 2009 and 2008 are US$75,000 and US$ 75,000, respectively. Instead,
the total cash compensation costs for independent directors for the year ended
September 30, 2009, 2008 and 2007 are US$75,000, US$75,000 and US$62,000,
respectively.
A summary of option activity under the
Plan as of September 30, 2009, and changes during the year ended is presented
below:
|
Options
|
Weighted
Average Exercise Price
|
Weighted Average
Remaining
Contractual Term
|
||||||||||
|
US$
|
Years
|
|||||||||||
|
Outstanding
at September 30, 2007
|
14,167 | 12.15 | 2.12 | |||||||||
|
Granted
(from October 1, 2007 to September 30, 2008)
|
||||||||||||
|
Exercised
(from October 1, 2007 to September 30, 2008)
|
- | - | - | |||||||||
|
Forfeited
or expired
|
- | - | - | |||||||||
|
Outstanding
at September 30, 2008
|
14,167 | 12.15 | 1.13 | |||||||||
|
Granted
(from October 1, 2008 to September 30, 2009)
|
- | - | - | |||||||||
|
Exercised
(from October 1, 2008 to September 30, 2009)
|
- | - | - | |||||||||
|
Forfeited
or expired
|
(4,167 | ) | - | - | ||||||||
|
Outstanding
at September 30, 2009
|
10,000 | 9.50 | 0.35 | |||||||||
On October 7, 2007, the Board of
Directors approved a 2008-09 Restricted Stock Unit Incentive Plan, the
“2008-2009 Plan”, an equity incentive compensation program for fiscal years 2008
and 2009. This 2008-2009 Plan allows the Company to offer a variety
of restricted stock unit awards to directors, senior management and key
employees, where a participant will be eligible to receive one share of the
Company’s
common stock for each restricted stock unit that vests upon the achievement of
corporate and individual objectives and such participant’s continued employment
as of the applicable vesting date.
F-19
WINNER
MEDICAL GROUP INC.
NOTES
TO CONSOLIDATED FINANCIAL STATEMENTS
FOR
THE YEARS ENDED SEPTEMBER 30, 2009, 2008 AND 2007
|
13.
|
Stock-Based
Compensation- Continued
|
Following
this incentive plan, the Company granted 500,000 units out of the total 600,000
authorized restricted stock units on October 7, 2007. Entitled employees are
eligible to vest the first 50% of the total number of restricted stock awarded
on October 7, 2010 and the second 50% on October 7, 2011 if the target of
corporate net income, annual sales objectives, and the participant’s individual
performance objectives are fulfilled. Estimated value of award as of grant date
is based on the market price of the common stock as quoted on the NASDAQ.com as
of October 7, 2007, which was $3.60 per share, and assumes that the individual
achieves the applicable corporate and individual objectives set forth in the
award.
On
October 15, 2008, the Company’s Board of Directors approved to grant the
remaining 100,000 units out of the total 600,000 authorized restricted stock
units. Entitled employees are eligible to vest the first 50% of the total number
of restricted stock awarded on October 7, 2010 and the second 50% on October 7,
2011 if the target of corporate net, income, annual sales objectives, and the
participant’s individual performance objectives are fulfilled. Estimated value
of award as of grant date is based on the market price of the common stock as
quoted on the NASDAQ.com as of October 15, 2008, which was US$0.50 per share,
and assumes that the individual achieves of the applicable corporate and
individual objectives set forth in the award.
On
September 8, 2009, the Board of Directors approved a 2010-11 Restricted Stock
Unit Incentive Plan, the “2010-2011 Plan”, an equity incentive compensation
program for fiscal years 2010 and 2011. This 2010-2011 plan allows the Company
to offer a variety of restricted stock unit awards to directors, senior
management and key employees, where a participant will be eligible to receive
one share of our common stock for each restricted stock unit that vests upon the
achievement of corporate and individual objectives and such participant’s
continued employment as of the applicable vesting date.
Following
this incentive plan, the Company granted 250,000 units out of the total 300,000
authorized restricted stock units on September 8, 2009. Entitled employees are
eligible to vest the first 50% of the total number of restricted stock awarded
on September 7, 2012 and the second 50% on September 7, 2013 if the target of
corporate net income, annual sales objectives, and the participant’s individual
performance objectives are fulfilled. Estimated value of award as of grant date
is based on the market price of the common stock as quoted on the NASDAQ.com as
of September 8, 2009, which was $4.40 per share, and assumes that the individual
achieves the applicable corporate and individual objectives set forth in the
award.
As of September 30, 2009, a total of
75,500 units were cancelled due to the resignation of employees.
A summary of the restricted stock
units activity under the 2008-2009 Plan and 2010 –2011 Plan is as
follows:
|
2008-09 plan
|
2010-11 plan
|
Total
|
||||||||||
|
Number of units
|
Number of units
|
Number of units
|
||||||||||
|
Units
outstanding at October 1, 2007
|
- | - | - | |||||||||
|
Granted
|
500,000 | - | 500,000 | |||||||||
|
Cancelled
|
(44,250 | ) | - | (44,250 | ) | |||||||
|
Units
outstanding at September 30, 2008
|
455,750 | - | 455,750 | |||||||||
|
Granted
|
100,000 | 250,000 | 350,000 | |||||||||
|
Cancelled
|
(31,250 | ) | - | (31,250 | ) | |||||||
|
Units
outstanding at September 30, 2009
|
524,500 | 250,000 | 774,500 | |||||||||
The Company recorded share-based
compensation expense of US$300,433, US$382,830 and US$23,350 for the years ended
September 30, 2009, 2008 and 2007 respectively.
Management
considered that the fair value of outstanding restricted share units is
approximate to the market value of the Company’s common stock, as at September
30, 2009, the market value of the Company’s common stock is
US$4.20.
|
14.
|
Commitments
and Contingencies
|
Operating leases- The Company
was obligated under operating leases requiring minimum rentals as
follows:
|
Year
ending September 30,
|
US$
|
|||
|
2010
|
179,673 | |||
|
2011
|
92,073 | |||
|
2012
|
23,293 | |||
|
Total
minimum lease payments
|
295,039 | |||
Rental
expenses under operating leases included in the income statement were
US$372,479, US$291,431 and US$266,382 for the years ended September 30, 2009,
2008 and 2007 respectively.
Marketing
service agreement-The Company’s subsidiary in Shenzhen entered into a 5-year
consulting agreement with a consulting firm on July 27, 2009 for receiving
services of developing marketing, brand building and promotion planning of the
Company’s own branded consumer products in China. Pursuant to the agreement, the
Company is committed to pay the consulting firm an annual fee of US$146,548 each
year in the following five years with a total of US$732,740. The Company has
also promised to award a maximum of 1 million restricted stock units to the
consulting firm in 5 years upon the achievement of agreed marketing objectives
by the consulting firm, subject to the approval of the
Company.
Purchase obligations-The Company
has signed agreements with suppliers and other parties to purchase plant and
machinery, and computer equipment with estimated non-cancelable obligations of
US$2,840,864 and US$417,466 as of September 30, 2009 and 2008
respectively.
F-20
WINNER
MEDICAL GROUP INC.
NOTES
TO CONSOLIDATED FINANCIAL STATEMENTS
FOR
THE YEARS ENDED SEPTEMBER 30, 2009, 2008 AND 2007
|
15.
|
Stockholders’
Equity
|
Common Stock
In November 2007, the Company issued a
total of 25,000 shares of common stock to Heritage Management Consultants, Inc.
(“Heritage”), representing the share-based compensation to Heritage for the
service obtained from January 25, 2006 to 2007. The total compensation expense
of such consulting service was US$200,000, in which US$34,206 and US$165,794
representing the compensation expense recorded for the period from October 1,
2006 to January 24, 2007 and the period from January 25, 2006 to September 30,
2006, respectively.
On October 6, 2009, the Company’s Board
of Directors approved, authorized and recommended to the Company’s stockholders
to amend and restate the Company’s Restated Certificate of Incorporation to
affect a one-for-two reverse split of each of the outstanding shares of the
Company’s common stock. All share, weighted average share as well as stock
option, non-vested restricted stock units and contingently issuable share
amounts, in the accompanying consolidated financial statements and notes thereto
have been retroactively adjusted for all periods presented to reflect the
one-for-two reverse stock split. The one-for-two reverse stock split did not
affect the par value per share. The Company also reduced its authorized capital
to 247,500,000 shares of common.
|
16.
|
Employee
Retirement Benefits
|
The Company contributes to a state
pension scheme organized by municipal and provincial governments in respect of
its employees in PRC. The compensation expenses related to this plan,
which is calculated at a range of 8%-29% of the average monthly salary, was
US$626,606, US$515,232 and US$356,113 for the years ended September 2009, 2008
and 2007 respectively.
According to the Mandatory Provident
Fund ("MPF") legislation regulated by the Mandatory Provident Fund Schemes
Authority in Hong Kong, with effect from December 1, 2000, the Company is
required to participate in a MPF scheme operated by approved trustees in Hong
Kong and to make contributions for its eligible employees. The
contributions borne by the Company are calculated at 5% of the salaries and
wages (monthly contribution is limited to 5% of HK$20,000 for each eligible
employee) as calculated under the MPF legislation. The expense
related to the MPF in the years ended September 30, 2009, 2008 and 2007 amounted
to US$16,434, US$1,608 and US$Nil respectively.
|
17.
|
Operating
Risk
|
Concentrations of credit risk, major
customers and suppliers-A substantial percentage of the Company’s
sales is made to one customer, Sakai Shoten Co., Ltd. and is typically sold
on an open account basis. The sales to Sakai Shoten Co., Ltd.
accounted for 15%, 16% and 19% of the total net sales for the years ended
September 30, 2009, 2008 and 2007, respectively. Sales to the above customer
relate to traditional product segment.
The
Company has not experienced any significant difficulty in collecting its
accounts receivable in the past and is not aware of any financial difficulties
being experienced by its major customers. There was bad debt expense
US$143,436, US$85,976 and US$13,667 during the years ended September 30, 2009,
2008 and 2007 respectively.
Interest rate risk-The
interest rates and terms of repayment of bank and other borrowings are disclosed
in Note 6. Other financial assets and liabilities do not have
material interest rate risk.
Credit risk- In order to
reduce the risk of inability to collect the accounts receivable, the Company
entered into a one-year insurance policy with China Export & Credit
Insurance Corporation effective on April 25, 2009 and automatically renewable
subject to a one month written notice given by either party. The maximum
insurance coverage from China Export & Credit Insurance Corporation is US$4
million.
Foreign currency risk- The
Company’s reporting currency is US dollar and the majority of its revenues will
be settled in RMB and US dollars. All of the Company’s assets are denominated in
RMB except for cash and accounts receivable. The Company’s subsidiaries used the
functional currency to pay material purchased, labor and other operating costs.
As a result, the Company is exposed to foreign exchange risk as its revenues and
results of operations may be affected by fluctuations in the exchange rate
between US dollars and RMB.
The value
of the RMB, the main currency used in the PRC, fluctuates and is affected by,
among other things, changes in PRC's political and economic conditions. In
addition, the RMB is not readily convertible into US dollars or other foreign
currencies. All foreign exchange transactions continue to take place either
through the Bank of China or other banks authorized to buy and sell foreign
currencies at the exchange rate quoted by the People’s Bank of China. The
conversion of RMB into foreign currencies such as the US dollar has been
generally based on rates set by the People's Bank of China, which are set daily
based on the previous day's interbank foreign exchange market rates and current
exchange rates on the world financial markets.
F-21
WINNER
MEDICAL GROUP INC.
NOTES
TO CONSOLIDATED FINANCIAL STATEMENTS
FOR
THE YEARS ENDED SEPTEMBER 30, 2009, 2008 AND 2007
|
17.
|
Operating
Risk- Continued
|
The Company’s currency exchange rate
risks come primarily from the sales of products to international customers. If
the RMB appreciates against foreign currencies, it will make the Company’s sale
prices more expensive, thus its sales may decline. The Company believes that the
exchange rate of RMB against US dollar will remain relatively stable in the
short run, thus the Company currently required its European and Australian
customers to settle their payments by US dollars instead of Euro, Pound
Sterling, and Australian dollars.
On September 30, 2009 and 2008, the
exchange rates of RMB against US dollar were 6.8290 and 6.8183, respectively;
the appreciation of RMB against US dollar was 0.16%. This floating exchange
rate, and any appreciation of the RMB that may result from such rate, could have
various adverse effects on the Company’s business.
|
18.
|
Statutory
Reserves
|
According to the laws and regulations
in the PRC, the Company is required to provide for certain statutory funds,
namely, reserve fund by an appropriation from net profit after taxation but
before dividend distribution based on the local statutory financial statements
of the PRC subsidiaries prepared in accordance with the accounting principles
and relevant financial regulations.
The Company’s wholly owned subsidiaries
in the PRC is required to allocate at least 10% of its net profit to the reserve
fund until the balance of such fund has reached 50% of its registered
capital. Appropriations of enterprise expansion fund are determined
at the discretion of its directors.
The reserve fund can only be used, upon
approval by the relevant authority, to offset accumulated losses or increase
capital. The enterprise expansion fund can only be used to increase
capital upon approval by the relevant authority.
|
19.
|
Subsequent
Events
|
On October 6, 2009 the Board of
Directors approved a one-for-two reverse stock split of the Company’s authorized
common and a decrease in the Company’s authorized capital from 495,000,000
shares of common stock (par value US$0.001) to 247,500,000 shares of
common stock (par value US$0.001). All share numbers in these financial
statements and footnotes have been retroactively adjusted to account for the
reverse split.
The Company has evaluated transactions,
events and circumstances for consideration of recognition or disclosure through
December 7, 2009, the date of the financial statements were issued, and has
reflected or disclosed those items within the consolidated financial statements
as deemed appropriate.
|
20.
|
Geographical
Information
|
The business of the Company is
manufacturing and trading of medical dressings and medical disposables. All of
the Company’s sales are from the Company’s operation within PRC, and all of the
Company’s long-lived assets are located in PRC. The Company’s sales to customers
by geographic destination are analyzed as follows:
|
Year ended
September 30,
|
||||||||||||
|
2009
|
2008
|
2007
|
||||||||||
|
US$
|
US$
|
US$
|
||||||||||
|
Europe
|
39,599,367 | 40,582,122 | 30,969,642 | |||||||||
|
Japan
|
17,607,093 | 16,340,084 | 15,182,130 | |||||||||
|
America
|
18,824,050 | 12,403,209 | 8,824,161 | |||||||||
|
PRC
|
16,601,617 | 10,963,382 | 8,526,756 | |||||||||
|
Others
|
5,753,476 | 5,216,965 | 6,778,271 | |||||||||
|
Total
net sales
|
98,385,603 | 85,505,762 | 70,280,960 | |||||||||
F-22
WINNER
MEDICAL GROUP INC.
NOTES
TO CONSOLIDATED FINANCIAL STATEMENTS
FOR
THE YEARS ENDED SEPTEMBER 30, 2009, 2008 AND 2007
|
21.
|
Segment
Information
|
The
Company has two reportable segments: traditional products (Medical Care, Wound
Care, and Home Care) and new style PurCotton Products. The Company’s
reportable segments are strategic business units that offer different products
and services. They are managed separately because each business
requires different technology and marketing strategies.
Contributions of the major activities,
profitability information and asset information of the Company’s reportable
segments for the years ended September 2009 and 2008 are as
follows:
|
Year ended September 30,
|
||||||||
|
2009
|
2008
|
|||||||
|
Net
sales:
|
US$
|
US$
|
||||||
|
Segment:
|
||||||||
|
Traditional
products
|
92,917,388 | 84,147,242 | ||||||
|
PurCotton
products
|
5,468,215 | 1,358,520 | ||||||
|
Consolidated
total
|
98,385,603 | 85,505,762 | ||||||
|
Gross
profits:
|
||||||||
|
Segment:
|
||||||||
|
Traditional
products
|
26,489,536 | 21,323,950 | ||||||
|
PurCotton
products
|
1,451,684 | 95,231 | ||||||
|
Consolidated
total
|
27,941,220 | 21,419,181 | ||||||
|
Income
before income taxes and minority interests:
|
||||||||
|
Segment:
|
||||||||
|
Traditional
products
|
11,485,885 | 6,760,503 | ||||||
|
PurCotton
products
|
(64,709 | ) | (1,197,337 | ) | ||||
|
Consolidated
total
|
11,421,176 | 5,563,166 | ||||||
|
Net
income:
|
||||||||
|
Segment:
|
||||||||
|
Traditional
products
|
8,930,653 | 6,263,632 | ||||||
|
PurCotton
products
|
197,921 | (1,197,337 | ) | |||||
|
Consolidated
total
|
9,128,574 | 5,066,295 | ||||||
|
Depreciation
and amortization:
|
||||||||
|
Segment:
|
||||||||
|
Traditional
products
|
3,573,817 | 3,261,966 | ||||||
|
PurCotton
products
|
1,185,275 | 784,263 | ||||||
|
Consolidated
total
|
4,759,092 | 4,046,229 | ||||||
|
September 30,
|
||||||||
|
2009
|
2008
|
|||||||
|
Total
assets:
|
||||||||
|
Segment:
|
||||||||
|
Traditional
products
|
71,599,230 | 75,552,814 | ||||||
|
PurCotton
products
|
32,925,196 | 29,587,955 | ||||||
|
Segment
total
|
104,524,426 | 105,140,769 | ||||||
|
Reconciliation
to consolidated totals:
|
||||||||
|
Elimination
of other receivable from inter-segments
|
(3,588,417 | ) | (3,222,678 | ) | ||||
|
Consolidated
total
|
100,936,009 | 101,918,091 | ||||||
F-23
EXHIBIT
INDEX
|
Exhibit No.
|
Description
|
|
|
2.1
|
Share
Exchange Agreement, dated December 16, 2005, among the registrant, Winner
Group Limited and its stockholders [incorporated by reference to Exhibit
2.1 to the registrant’s current report on Form 8-K filed on December 16,
2005 in commission file number 33-10513-LA]
|
|
|
3.1
|
Articles
of Incorporation of the registrant as filed with the Secretary of State of
the State of Nevada on August 7, 1986, as amended to
date. [incorporated by reference to Exhibit 3.1 to the
registrant’s current report on Form 8-K filed on December 16, 2005 in
commission file number 33-10513-LA]
|
|
|
3.2
|
Amended
and Restated Bylaws of the registrant adopted on December 16,
2005. [incorporated by reference to Exhibit 3.2 to the
registrant’s current report on Form 8-K filed on December 16, 2005 in
commission file number 33-10513-LA]
|
|
|
10.1
|
English
translation of Licensing Agreement between Winner Group Limited and
Jianquan Li, dated December 1, 2005 [incorporated by reference to Exhibit
10.1 to the registrant’s current report on Form 8-K filed on December 16,
2005 in commission file number 33-10513-LA]
|
|
|
10.2
|
English
translation of Licensing Agreement between Winner Medical & Textile
Ltd. Zhuhai and Nianfu Huo, dated August 5, 2005 [incorporated by
reference to Exhibit 10.2 to the registrant’s current report on Form 8-K
filed on December 16, 2005 in commission file number
33-10513-LA]
|
|
|
10.3
|
English
translation of Equipment Purchase Contract between Winner Medical
(Huanggang) Co., Ltd. and Zhengzhou Textile Machinery Co., Ltd, dated July
12, 2005 [incorporated by reference to Exhibit 10.3 to the registrant’s
current report on Form 8-K filed on December 16, 2005 in commission file
number 33-10513-LA]
|
|
|
10.4
|
English
translation of Water Supply Agreement between Winner Medical & Textile
Ltd. Tianmen and Hubei Winner Textiles Co., Ltd., dated August 2, 2004
[Incorporated by reference to Exhibit 10.4 to the registrant’s current
report on Form 8-K filed on December 16, 2005 in commission file number
33-10513-LA]
|
|
|
10.5
|
2006
Incentive Equity Plan [incorporated by reference to Exhibit 10
to the registrant’s registration statement on Form S-8 filed on April 19,
2006]
|
|
|
10.6
|
Independent
Director’s Contract, dated as of May 8, 2006, by and between Winner
Medical Group Inc. and Larry Goldman, CPA [incorporated by reference to
Exhibit 10.1 to the registrant’s current report on Form 8-K filed on May
11, 2006]
|
|
|
10.7
|
Independent
Director’s Contract, dated as of May 8, 2006, by and between Winner
Medical Group Inc. and Richard B. Goodner, Esq. [incorporated by reference
to Exhibit 10.2 to the registrant’s current report on Form 8-K filed on
May 11, 2006]
|
|
|
10.8
|
Independent
Director’s Contract, dated as of May 8, 2006, by and between Winner
Medical Group Inc. Dr. Horngjon Shieh [incorporated by reference to
Exhibit 10.3 to the registrant’s current report on Form 8-K filed on May
11, 2006]
|
|
|
10.9
|
|
Indemnification
Agreement, dated as of May 8, 2006, by and between Winner Medical Group
Inc. and Larry Goldman, CPA [Incorporated by reference to Exhibit 10.4 to
the registrant’s current report on Form 8-K filed on May 11,
2006]
|
50
|
10.10
|
Indemnification
Agreement, dated as of May 8, 2006, by and between Winner Medical Group
Inc. and Richard B. Goodner, Esq. [incorporated by reference to Exhibit
10.5 to the registrant’s current report on Form 8-K filed on May 11,
2006]
|
|
|
10.11
|
Indemnification
Agreement, dated as of May 8, 2006, by and between Winner Medical Group
Inc. and Dr. Horngjon Shieh [incorporated by reference to Exhibit 10.6 to
the registrant’s current report on Form 8-K filed on May 11,
2006]
|
|
|
10.12
|
English
translation of Employment Agreement, dated January 1, 2008, by and between
Winner Industries (Shenzhen) Co., Ltd. and Jianquan Li. [incorporated
by reference to Exhibit 10.12 to the registrant’s current report on Form
10-K filed on December 9, 2008]
|
|
|
10.13
|
English
translation of Employment Agreement, dated January 1, 2008, by and between
Winner Industries (Shenzhen) Co., Ltd. and Xiuyuan Fang. [incorporated
by reference to Exhibit 10.13 to the registrant’s current report on Form
10-K filed on December 9, 2008]
|
|
|
10.14
|
English
translation of Employment Agreement, dated January 1, 2008, by and between
Winner Industries (Shenzhen) Co., Ltd. and Jiagan Chen. [incorporated
by reference to Exhibit 10.14 to the registrant’s current report on Form
10-K filed on December 9, 2008]
|
|
|
10.15
|
English
translation of Employment Agreement, dated January 1, 2008, by and between
Winner Industries (Shenzhen) Co., Ltd. and Nianfu Huo. [incorporated
by reference to Exhibit 10.15 to the registrant’s current report on Form
10-K filed on December 9, 2008]
|
|
|
10.16
|
Registrant’s
2006 Equity Incentive Plan (as amended October 7, 2007) [incorporated by
reference to Exhibit 10.1 to the registrant’s current report on Form 8-K
filed on October 11, 2006]
|
|
|
10.17
|
Registrant’s
2008-2009 Restricted Stock Unit Incentive Plan (as adopted October 7,
2007) [incorporated by reference to Exhibit 10.2 to the registrant’s
current report on Form 8-K filed on October 11, 2006]
|
|
|
14
|
Code
of ethics, dated May 9, 2006. [incorporated by reference to
Exhibit 14 to the registrant’s current report on Form 8-K filed on May 11,
2006]
|
|
|
21
|
List
of subsidiaries of the registrant*
|
|
|
23.1
|
Consent
of BDO Limited*
|
|
|
31.1
|
Certification
of the Chief Executive Officer pursuant to Rules 13a-14(a) and 15d-14(a),
as adopted pursuant to Section 302 of the Sarbanes-Oxley Act of
2002*
|
|
|
31.2
|
Certification
of the Chief Financial Officer pursuant to Rules 13a-14(a) and 15d-14(a),
as adopted pursuant to Section 302 of the Sarbanes-Oxley Act of
2002.*
|
|
|
32.1
|
Certification
of the Chief Executive Officer pursuant to 18 U.S.C Section 1350, as
adopted pursuant to Section 906 of the Sarbanes-Oxley Act of
2002.*
|
|
|
32.2
|
|
Certification
of the Chief Financial Officer pursuant to 18 U.S.C Section 1350, as
adopted pursuant to Section 906 of the Sarbanes-Oxley Act of
2002.*
|
* filed
herewith
51