Attached files
| file | filename |
|---|---|
| 8-K - 8-K - OMNOVA SOLUTIONS INC | d254369d8k.htm |
 Kevin
McMullen Chairman & CEO
November 10, 2011
Sidoti & Company 4th Annual New York Conference
EXHIBIT 99 |
 -
2 -
Cautionary
Cautionary
Forward-Looking Statements
Non-GAAP Financial Measures
This presentation includes EBITDA, Adjusted EBITDA and Net Debt which are
non-GAAP financial measures as defined by the Securities and Exchange
Commission. For a reconciliation to the most directly comparable
GAAP financial measures, refer to the presentation Appendix.
•
This presentation and the accompanying oral remarks include “forward-looking
statements,” as defined by federal securities laws. These statements, as well as any
verbal statements by the Company in connection with this presentation, are intended to qualify for the protections afforded forward-looking
statements under the Private Securities Litigation Reform Act of 1995. Forward-looking
statements reflect management’s current expectation, judgment, belief, assumption, estimate
or forecast about future events, circumstances or results and may address business conditions and prospects, strategy,
capital structure, sales, profits, earnings, markets, products, technology, operations, customers, raw
materials, financial condition, and accounting policies among other matters. Words such
as, but not limited to, “will,” “may,” “should,” “projects,” “forecasts,” “seeks,” “believes,” “expects,”
“anticipates,” “estimates,” “intends,” “plans,”
“targets,” “optimistic,” “likely,” “would,” “could” and similar expressions or phrases
identify
forward-looking statements.
•
All forward-looking statements involve risks and uncertainties. Many risks and uncertainties
are inherent in business generally and the markets in which the Company operates or proposes to
operate. Other risks and uncertainties are more specific to the Company’s businesses, including businesses that
the Company acquires. The occurrence of such risks and uncertainties and the impact of such
occurrence is often not predictable or within the Company’s control. Such impacts
could adversely affect the Company’s results and, in some cases, such effect could be material.
•
All written and verbal forward-looking statements attributable to the Company or any person acting
on the Company’s behalf are expressly qualified in their entirety by the risks,
uncertainties and cautionary statements contained herein. Any forward looking statement speaks only as of the date on which
such statement is made, and the Company undertakes no obligation, and specifically declines any
obligation, other than that imposed by law, to publicly update or revise any
forward-looking statements whether as a result of new information, future events or otherwise.
•
Risks and uncertainties that may cause actual results to differ materially from expected results
include, among others: the Company’s ability to successfully integrate ELIOKEM into
its operations; the Company’s ability to achieve fully the strategic and financial objectives related to the acquisition
of ELIOKEM, including the acquisition becoming accretive to the Company’s earnings; and
unexpected costs or liabilities that may arise from the acquisition, ownership or operation of
ELIOKEM.
•
Additional risk factors include: economic trends affecting the economy in general and/or the
Company’s end-use markets; prices and availability of raw materials including styrene,
butadiene, vinyl acetate monomer, polyvinyl chloride, acrylonitrile, acrylics and textiles; ability to increase pricing to offset
raw material cost increases; product substitution and/or demand destruction due to product technology,
performance or cost disadvantages; loss of a significant customer; customer and/or competitor
consolidation; customer bankruptcy; ability to successfully develop and commercialize new products; a
decrease in demand for domestically manufactured products due to increased foreign competition and
off-shoring of production; ability to successfully implement productivity enhancement and
cost reduction initiatives; unplanned full or partial suspension of plant operations; losses from the Company’s
strategic alliance, joint venture, acquisition and integration activities; loss or damage due to acts
of war or terrorism, natural disasters or accidents, including fires, floods, explosions and
releases of hazardous substances; ability to comply, and cost of compliance with, legislative and regulatory
changes, including changes impacting environmental, health and safety compliance and changes which may
restrict or prohibit certain products and raw materials; rapid inflation in health care costs
and assumptions used in determining health care cost estimates; risks associated with foreign operations
including political unrest and fluctuations in exchange rates of foreign currencies; prolonged work
stoppage resulting from labor disputes with unionized workforce; changes in and compliance with
pension plan funding obligations; stock price volatility; infringement or loss of the Company’s intellectual
property; litigation and claims against the Company related to products, services, contracts,
employment, environmental, safety, intellectual property and other matters;
adverse litigation judgments or settlements; absence of or inadequacy of insurance coverage for litigation judgments, settlements or
other losses; availability of financing at anticipated rates and terms; and loan covenant default
arising from substantial debt and leverage and the inability to service that debt,
including increases in applicable short-term or long-term borrowing rates.
•
For further information on risks and uncertainties, see the Company’s Form 10-K and Form
10-Q filings with the Securities and Exchange Commission. |
 -
3 -
Creating Value Through A Global Enterprise
Creating Value Through A Global Enterprise
OMNOVA Solutions Today Is A Larger, More Diverse Global
Specialty Chemicals And Functional Surfaces Company With
Significant Potential To Create Investor Value
OMNOVA Solutions Today Is A Larger, More Diverse Global
Specialty Chemicals And Functional Surfaces Company With
Significant Potential To Create Investor Value
Technology
Innovation
Global
Capability
Typically
Typically
#1 or #2 in
#1 or #2 in
Consolidating
Consolidating
Niche Markets
Niche Markets
Leading Market
Positions . . .
Improved
Business Model |
 -
4 -
Business Segments At A Glance
Business Segments At A Glance
A Focused Polymer Company With Leadership
Positions In Key Categories
A Focused Polymer Company With Leadership
Positions In Key Categories
* LTM: Last Twelve Months Through August 31, 2011 including ELIOKEM on a Pro Forma
Basis ** See Appendix 1 –
OMNOVA Consolidated
26%
74%
LTM* Sales = $1.2B**
LTM* Adj. EBITDA = $107M**
Adj. EBITDA Margin = 8.7%**
Performance Chemicals
Decorative Products
Value-added emulsion
polymers and specialty
chemicals used in
coatings, adhesives and
binders
Functional &
decorative surfaces |
 -
5 -
3-Part Strategy To Profitably Grow
3-Part Strategy To Profitably Grow
•
Technology-Driven Market Share Gains In Core Markets
•
Enter New, Related Markets / Applications
•
Globalization
•
A Culture of Safety
•
LEAN SixSigma
•
SAP Business System
•
Global Purchasing/Logistics
•
Reducing OMNOVA’s Environmental Footprint
•
Providing Value-Added Environmentally Preferred
Products
Profitable
Growth
Operational
Excellence
Sustainability
Offer Customers A Distinctive Value Proposition, Including
Outstanding Service, To Drive Margin Expansion & Profitable Growth
Offer Customers A Distinctive Value Proposition, Including
Outstanding Service, To Drive Margin Expansion & Profitable Growth
|
 -
6 -
= Added in Last 5 Years
OMNOVA Locations
OMNOVA Locations
8 Global Locations Added In Last Five Years
8 Global Locations Added In Last Five Years
Monroe, NC
Chester, SC
Calhoun, GA
Columbus, MS
Rayong,
Thailand
Kent, U.K.
Fitchburg, MA
Auburn, PA
Jeannette, PA
Green Bay, WI
Fairlawn/Akron, OH (World Headquarters)
Mogadore/Akron, OH
Le Havre, France
Villejust, France
Valia, India
Caojing, China
Ningbo, China
Black Text = Manufacturing / Technology Centers
Shanghai, China |
 -
7 -
ELIOKEM Accelerates OMNOVA’s Global Reach
ELIOKEM Accelerates OMNOVA’s Global Reach
Americas
24%
Asia & Middle
East
40%
Europe &
Africa
36%
Europe &
Africa
17%
Asia &
Middle East
23%
USA
60%
Europe
9%
USA
75%
Asia
16%
LTM* Sales $1.2 Billion**
Growth Through Greater Global Diversification —
With Focus In Higher Growth Emerging Markets
Growth Through Greater Global Diversification —
With Focus In Higher Growth Emerging Markets
Pro Forma Consolidated
•
LTM: Last Twelve Months Through August 31, 2011 including ELIOKEM on a Pro Forma
Basis ** See Appendix 1 –
OMNOVA Consolidated |
 -
8 -
Performance Chemicals
Decorative Products
$35.1
$37.5
$59.7
$74.8
$113.7
$103.0
$23.8
$7.2
$16.9
$9.8
$28.5
$34.6
$35.1
$48.7
$3.4
7.4%
6.4%
10.7%
10.8%
8.7%
8.0%
$0.0
$40.0
$80.0
$120.0
$160.0
$200.0
2007
2008
2009
2010
LTM 8/31/11*
2011 FY Est
0.0%
2.0%
4.0%
6.0%
8.0%
10.0%
12.0%
Pro Forma Historical Annual Financials
Pro Forma Historical Annual Financials
Annual Revenue
Annual Adjusted EBITDA**
* LTM: Last Twelve Months Through August 31, 2011 including ELIOKEM on a Pro
Forma Basis ** Adjusted EBITDA -
see Appendices 1, 2, 3, and 4; Total Adjusted EBITDA includes OMNOVA Corporate
Expense of $8.9M, $5.6M, $12.2M, $10.3M and $10.2M, $10.0M for 2007, 2008,
2009, 2010 and 2011 LTM, 2011 estimate respectively. $475.3
$521.6
$396.8
$527.9
$914.6
$970.0
$364.6
$347.8
$299.6
$318.3
$316.0
$320.0
$289.5
$229.5
$288.4
$228.1
$0
$200
$400
$600
$800
$1,000
$1,200
$1,400
2007
2008
2009
2010
LTM 8/31/11*
2011 FY Est
Performance Chemicals
Decorative Products
ELIOKEM
$1,068.0
$1,158.9
$925.9
$1,134.6
$1,230.6
$1,290
Strong
EBITDA
Performance
Across
Varied
Business
Conditions
Strong
EBITDA
Performance
Across
Varied
Business
Conditions
$78.5
$73.7
$99.5
$123.0
$103.0
$106.9
ELIOKEM
OMN Cons. Est.
EBITDA Margin. |
 -
9 -
Capital Structure
Capital Structure
$250
$198
$11
•
$95 million cash
•
$100 million ABL
–
2015 maturity
–
$2 million L/C lines
–
$98 million unused &
available
•
Total liquidity $193
million
Liquidity
As of August 31, 2011
Foreign Debt
•
Various short-term maturities
•
No financial covenants
•
China, India, Thailand
Term Loan B
•
2017 Maturity
•
L+400; floor 1.75%
•
Net Sr. Secured leverage ratio
covenant
–
3.25 to 1 in 2011 (Actual 1.1x)
•
Stepdown to 2.5 to 1 in 2014
Senior Notes 7.875%
•
2018 Maturity
•
No financial covenants
Debt
$459 Million
All-In Debt Cost < 7% / Significant Liquidity And Covenant Cushion
|
 -
10 -
0.0x
0.5x
1.0x
1.5x
2.0x
2.5x
3.0x
3.5x
4.0x
4.5x
5.0x
2008
2009
2010
LTM
8/31/11 **
$0
$20
$40
$60
$80
2H 2008
2009
2010
YTD
8/31/2011
Net Debt Reduction*
(Net Debt / Adjusted EBITDA)
($ Millions)
* See
Appendix
5
–
Net
Debt
/
Leverage
** LTM: Last Twelve Months Through August 31, 2011, including ELIOKEM on a pro forma
basis (1)
Prior to ELIOKEM Acquisition
(2)
Post-ELIOKEM Acquisition including working capital increase of $27 million and
capital expenditures of $16 million $68
$14
4.4x
0.9x
Leverage*
$37
(1)
1.6x
Significant Deleveraging History
Significant Deleveraging History
3.4x
$9
(2)
Proven Success At Deleveraging Has Enabled Opportunities
Such As The ELIOKEM Acquisition
Proven Success At Deleveraging Has Enabled Opportunities
Such As The ELIOKEM Acquisition |
 -
11 -
Decorative Products |
 -
12 -
Decorative Products –
Segment Overview
Decorative Products –
Segment Overview
* LTM: Last Twelve Months Through August 31, 2011
** See Appendix 2 –
Decorative Products
Coated Fabrics Products
Laminates & Films Products
Commercial Wallcovering Products
End Markets
End Markets
End Markets
•
Vinyl and urethane fabrics
•
Performance fabrics
•
Vinyl, paper and acrylic laminates
•
Performance films
•
Vinyl wallcoverings
•
Customized wall murals
•
Transportation, marine
•
Health care
•
Furniture and furnishings
•
Kitchen and bath cabinets
•
RV / manufactured housing
•
Retail store fixtures
•
Furniture
•
Healthcare
•
Pool Liner & Other
•
Corporate
•
Hospitality
•
Healthcare
•
Retail
LTM* Sales = $316M**
LTM* Adj. EBITDA = $3M**
Adj. EBITDA Margin = 1.1%**
A Broad-Based Functional And Decorative Surfaces Business
A Broad-Based Functional And Decorative Surfaces Business
|
 -
13 -
•
Profitably serve global customers with
strategically located global assets
•
Pricing discipline to offset raw material
inflation and expand margins
•
Leverage scale in a highly fragmented
but consolidating industry
–
Several recent competitor exits
•
Grow at above-market rates as industry
recovers from cyclical decline
–
Leverage new product introductions in
existing and adjacent markets
•
Reduce operating costs
–
Taicang plant closure expected to save
$1.2 million in 2012
Decorative Products –
Segment Overview
(cont.)
Decorative Products –
Segment Overview
(cont.)
* LTM: Last Twelve Months Through August 31, 2011
Decorative Products
Sales Breakdown*
Commercial
Wallcovering
24%
Laminates
and Films
32%
Coated Fabrics
44%
Strategy |
 -
14 -
Sources of Growth
Sources of Growth
Asian Assets & Access
Regional growth expected to be
higher than U.S. and Europe
Differentiated Performance
High performance coatings and
3D edges for superior durability
and cleanability
Material & Design Options
Environmentally preferred
constructions and high
performance, cost effective
alternatives to traditional
materials and systems
Transportation
Seating
Automotive
Interiors
Sport Vehicle
Seating
duraMax
Laminates
TFM/HPL Alternative
Pinnacle
Non-PVC
Performance Fabrics
RECORE
Wallcoverings w/ 30%
Recycled Content
Retail Display
Fixtures
Mass Transit
Seating and Trim
Hospital and Exam
Room Surfaces
™
™
® |
 -
15 -
Performance Chemicals |
 -
16 -
New Performance Chemicals –
Segment Overview
New Performance Chemicals –
Segment Overview
* LTM: Last Twelve Months Through August 31, 2011 including ELIOKEM on a Pro Forma
Basis ** See Appendix 3 –
Performance Chemicals
Paper and Carpet Chemicals (LTM Sales = $373M)
Specialty Chemicals (LTM Sales = $542M)
End Markets
End Markets
•
Specialty coatings
•
Nonwovens –
consumable
and durable
•
Construction
•
Tires and rubber goods
•
Antioxidants
LTM* Sales = $915M**
LTM* Adj. EBITDA = $114M**
Adj. EBITDA Margin = 12.4%**
•
Magazines, brochures
•
Catalogs
•
Packaging, paperboard
ELIOKEM Accelerates Globalization Of Our Specialty Chemical Products
ELIOKEM Accelerates Globalization Of Our Specialty Chemical Products
•
Labels, specialty papers
•
Residential and commercial
carpet backing
•
Tapes and release coatings
•
Oil / gas drilling
•
Elastomeric modification
•
Floor care
•
Specialty Rubber and
Reinforcing |
 -
17 -
Performance Chemicals
Performance Chemicals
Served Markets*
Chemistries*
Paper and
Packaging
30%
Refurb. /
Construction
21%
Tire & Rubber
17%
Nonwovens
8%
Specialty
Architectural
Coatings
8%
Other
Specialty
12%
Oil Field
4%
SB Latex
48%
Acrylics
19%
Vinyl Pyridine
Latex
11%
Nitrile Rubber
10%
Other
Chemicals
4%
Antioxidants
5%
ELIOKEM Provides Diversification
Of Markets And Chemistries
ELIOKEM Provides Diversification
Of Markets And Chemistries
High Styrene
3%
* Sales
for
Last
Twelve
Months
Through
August
31,
2011
including
ELIOKEM on a Pro Forma Basis |
 -
18 -
Examples Of OMNOVA / ELIOKEM Synergy
Examples Of OMNOVA / ELIOKEM Synergy
•
3 continents
•
Flexibility to
manufacture to
quickly respond to
customer demand
and to maximize
OMNOVA margins
Worldwide Production
Leverage
purchasing and
logistics with
increased options
and scale
Oil Field
Specialty Architectural Coatings
Powder Polymers
•
ELIOKEM: Oil/synthetic
based drilling fluids
•
OMNOVA: Water based
applications
New solutions for
advanced applications in
historical ELIOKEM
market
New capability for
easier handling and
new applications
(e.g. oil field)
Global Supply Chain
Product / Technology Cross-Over |
 -
19 -
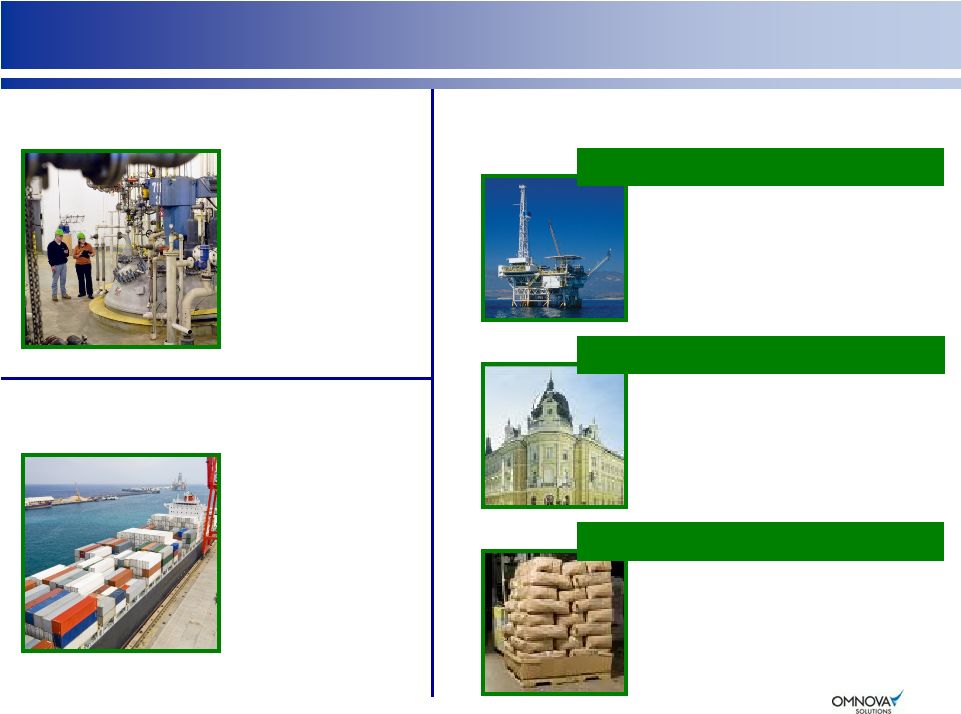
Sources of Growth
Sources of Growth
Oil / Gas Drilling
Specialty Coatings
High Temperature, High
Pressure Applications
Intumescent Paint
(Fire Resistant)
Concrete Sealers
Stabilization of ABS,
Natural Rubber, Latex
Flexibility, Modulus,
Chemical Resistance
High Shine, Low Maintenance,
Polishes / Sealers
Increased Focus on Higher Value-Added Products and Applications Moves
Specialty Chemicals to Approx. 2/3 of Chemical Sales / Profits
Increased Focus on Higher Value-Added Products and Applications Moves
Specialty Chemicals to Approx. 2/3 of Chemical Sales / Profits
Nonwovens
Personal Hygiene
Products
Antioxidants
Elastomeric Modification
Floor Care |
 -
20 -
0
200
400
600
800
1,000
1,200
1,400
2007
2008
2009
2010
LTM
8/31/11*
$0
$20
$40
$60
$80
$100
$120
$140
2007
2008
2009
2010
LTM
8/31/11*
Adjusted
EBITDA
**
($ Millions)
$72
$64
1,180
Volumes Sold
***
$95
Performance Chemicals
Performance Chemicals
$126
Structurally Improved Profitability Since 2008;
Volume Declines Generally Offset By Lower Raw Material Input cost
Structurally Improved Profitability Since 2008;
Volume Declines Generally Offset By Lower Raw Material Input cost
(Lbs Millions)
$114
1,090
980
1,080
1,070
* LTM: Last Twelve Months Through August 31, 2011 including
ELIOKEM on a Pro Forma Basis ** See
Appendix
3
&
4
–
Performance
Chemical
*** Combined Pro Forma PC & ELIOKEM |
 -
21 -
Raw Material Inflation / OMNOVA Pricing Dynamics
Raw Material Inflation / OMNOVA Pricing Dynamics
($ Millions)
Raw Material Inflation
OMNOVA Pricing Realization
OMNOVA Legacy Operations
75.1
(106.8)
96.8
82.1
86.9
89.6
76.1
(68.7)
-$120
-$80
-$40
$0
$40
$80
$120
$160
2008
2009
2010
2011 9 Months
Historical
Long-Term
Success
In
Recovering
Raw
Material
Costs |
 -
22 -
Raw Material Inflation
Raw Material Inflation
LTM Butadiene At All-Time Record High, But Declining –
180 Million Lbs. Annual Purchase
LTM Butadiene At All-Time Record High, But Declining –
180 Million Lbs. Annual Purchase
0.0
0.2
0.4
0.6
0.8
1.0
1.2
1.4
1.6
1.8
2.0
Butadiene –
Fiscal 2011
0.86
0.91
0.99
1.04
1.21
1.42
1.53
1.71
1.78
1.72
1.41
1.15 |
 -
23 -
OMNOVA Butadiene Situation / Strategy
OMNOVA Butadiene Situation / Strategy
OMNOVA’s Strategic Position:
•
Styrene butadiene latex remains a
flexible and differentiated polymer
across diverse, high value
applications
–
OMNOVA SB technology continues
to deliver differentiated value both
in North America and globally
•
Execute multiple supply strategies
to minimize intermediate-term risk:
-
Expand domestic BD supplier base
-
Pursue Asia and European imports
-
Make opportunistic spot buys
-
Partner with other buyers to
leverage volume purchases
Current Situation:
•
BD supply/demand remains
balanced globally but regional
shortfalls remain
•
Additional modest increase to
supply gap expected for North
America over next 3-5 years
•
North America will address short-
term supply through BD/Crude C4
imports and utilization of existing
BD extraction assets
•
Longer-term BD supply will be
increased through “on purpose”
production from butane and other
processes |
 -
24 -
Key Investment Highlights
Key Investment Highlights
Expanded presence in high growth emerging markets
Manufacturing in India and China with second Performance Chemicals plant
commissioned in China
Enhanced worldwide leverage of OMNOVA technology
Growing Global
Footprint
Leading Market
Positions in Niche
Markets
Diverse Business Model
Strong And Stable
Margins
Strong Free Cash Flow
OMNOVA Is Creating Value Through A Global Enterprise
OMNOVA Is Creating Value Through A Global Enterprise
Strong technology and new product pipeline that has driven consistent
above- market growth
Strong North America share in consolidated industry
-
Significant European Consolidation as well
Industry recognized brands, with customer co-branding
OMNOVA has over 1,000 products sold to over 1,500 customers in more than 90
countries
75% of ELIOKEM’s sales to adjacent markets not historically served by
OMNOVA Significantly improved Adjusted EBITDA since 2008
~9% LTM Adjusted EBITDA margins (up from ~6% in 2008)
Ability to pass through raw material changes (indexed contracts,
disciplined industry)
Four years of positive cash generation
Modest capex requirements
NOL’s shield cash taxes for several years |
 -
25 -
Appendix |
 -
26 -
Appendix –
Non-GAAP Financial Measures
Appendix –
Non-GAAP Financial Measures
This presentation includes EBITDA, Adjusted EBITDA and Net Debt which are
Non-GAAP financial measures as defined by the Securities and Exchange
Commission. OMNOVA’s EBITDA is calculated as income (loss) from continuing
operations less interest expense, amortization of deferred financing costs,
income taxes and depreciation and amortization expense. OMNOVA’s Adjusted EBITDA is
calculated as OMNOVA’s EBITDA less restructuring and severance expenses, asset
impairments, non-cash stock compensation and other items. Segment
EBITDA is calculated as segment operating income (loss) less interest expense,
amortization of deferred financing costs, income taxes and depreciation and amortization expense.
Segment Adjusted EBITDA is calculated as Segment EBITDA less restructuring and
severance expenses, asset impairments, non-cash stock compensation and
other items. For purposes of this presentation, Net Debt is calculated
as total debt less cash. ELIOKEM’s EBITDA is calculated as net
income less interest expense, amortization of deferred financing costs, income
taxes and depreciation and amortization expense. ELIOKEM’s Adjusted EBITDA is calculated as ELIOKEM’s
EBITDA less restructuring and severance expenses, asset impairments and other
items. EBITDA, Adjusted EBITDA and Net Debt are not measures of
financial performance under GAAP. EBITDA, Adjusted EBITDA and Net Debt
are not calculated in the same manner by all companies and, accordingly, are
not necessarily comparable to similarly titled measures of other companies and
may not be appropriate measures for comparing performance relative to other
companies. EBITDA, Adjusted EBITDA and Net Debt should not be construed as
indicators of the Company’s operating performance or liquidity and should not be
considered in isolation from or as a substitute for net income (loss), cash
flows from operations or cash flow data, which are all prepared in accordance
with GAAP. EBITDA, Adjusted EBITDA and Net Debt are not intended to represent, and should not be
considered more meaningful than or as an alternative to, measures of operating
performance as determined in accordance with GAAP. Management believes
that presenting this information is useful to investors because these measures
are commonly used as analytical indicators to evaluate performance and by management to allocate
resources. Set forth below are the reconciliations of these non-GAAP
measures to their most directly comparable GAAP financial measure.
|
 -
27 -
Appendix 1 –
OMNOVA Consolidated
Appendix 1 –
OMNOVA Consolidated
($ Millions)
LTM
OMNOVA Solutions Consolidated
2007*
2008
2009
2010
Aug 31, 2011
Income (loss) from continuing operations
$
(4.9)
$
(2.2)
$
26.2
$
107.9
$
89.5
Interest expense
15.7
12.3
7.5
8.0
33.3
Amortization of deferred financing costs
0.8
0.7
0.6
0.7
2.4
Income tax
0.1
0.2
1.7
(89.4)
(81.0)
Depreciation & amortization
23.1
23.9
22.9
20.6
34.2
EBITDA
$
34.8
$
34.9
$
58.9
$
47.8
$
78.4
Restructuring & severance
1.0
0.6
2.1
0.6
1.8
Asset impairments
-
-
1.1
6.2
2.4
Non-cash stock compensation
2.9
2.4
2.8
3.5
3.8
Other
11.3
1.2
(0.5)
16.2
20.5
Adjusted EBITDA
$
50.0
$
39.1
$
64.4
$
74.3
$
106.9
OMNOVA Solutions Adjusted EBITDA
$
50.0
$
39.1
$
64.4
$
74.3
$
106.9
Eliokem International Adjusted EBITDA
28.5
34.6
35.1
48.7
Combined Adjusted EBITDA
$
78.5
$
73.7
$
99.5
$
123.0
$
106.9
Combined Sales
$
1,068.0
$
1,158.9
$
925.9
$
1,134.6
$
1,230.6
Percentage of Adjusted EBITDA to Sales
7.4%
6.4%
10.7%
10.8%
8.7%
LTM: Last Twelve Months through August 31, 2011 including ELIOKEM on a Pro Forma Basis for 2010
* NOTE: 2007 Sales and Adjusted EBITDA have been adjusted by $94.4 million and $4.8
million, respectively. Pro forma 2007 reflects the full year results of the Asian
businesses acquired during December 2007 as if the acquisition took
place December 1, 2006. |
 -
28 -
Appendix 2 –
Decorative Products
Appendix 2 –
Decorative Products
($ Millions)
LTM
Decorative Products Segment
2007*
2008
2009
2010
Aug 31, 2011
Segment Operating Profit
$
10.4
$
(6.7)
$
1.6
$
(18.0)
$
(14.8)
Interest Expense
-
-
-
-
-
Amortization of deferred financing costs
-
-
-
-
-
Income Tax
-
-
-
-
-
Depreciation & amortization
11.7
12.5
12.5
11.0
10.2
EBITDA
$
22.1
$
5.8
$
14.1
$
(7.0)
$
(4.6)
Restructuring & severance
0.7
0.5
1.8
0.1
0.4
Asset Impairments
-
-
0.6
6.2
2.4
Non-cash stock compensation
0.8
0.9
0.4
1.1
1.0
Other
0.2
-
-
9.4
4.2
Adjusted EBITDA
$
23.8
$
7.2
$
16.9
$
9.8
$
3.4
Sales
$
364.6
$
347.8
$
299.6
$
318.3
$
316.0
Percentage of Adjusted EBITDA to Sales
6.5%
2.1%
5.6%
3.1%
1.1%
LTM: Last Twelve Months through August 31, 2011
* NOTE: 2007 Sales and Adjusted EBITDA have been adjusted by $94.4 million and $4.8
million, respectively. Pro forma 2007 reflects the full year results of the Asian
businesses acquired during December 2007 as if the acquisition took
place December 1, 2006. |
 -
29 -
Appendix 3 –
Performance Chemicals
Appendix 3 –
Performance Chemicals
($ Millions)
LTM
Performance Chemicals Segment
2007
2008
2009
2010
Aug 31, 2011
Segment Operating Profit
$
23.7
$
25.2
$
47.9
$
73.3
$
80.5
Interest Expense
-
-
-
-
4.1
Amortization of deferred financing costs
-
-
-
-
0.1
Income Tax
-
-
-
-
2.6
Depreciation & amortization
11.1
11.0
9.9
9.3
23.8
EBITDA
$
34.8
$
36.2
$
57.8
$
82.6
$
111.1
Restructuring & severance
-
0.1
0.2
0.4
1.2
Asset Impairments
-
-
0.7
-
-
Non-cash stock compensation
1.0
1.1
0.8
1.2
1.3
Other
(0.7)
0.1
0.2
(9.4)
0.1
Adjusted EBITDA
$
35.1
$
37.5
$
59.7
$
74.8
$
113.7
Sales
$
475.3
$
521.6
$
396.8
$
527.9
$
914.6
Percentage of Adjusted EBITDA to Sales
7.4%
7.2%
15.0%
14.2%
12.4%
LTM: Last Twelve Months through August 31, 2011 including ELIOKEM on a Pro Forma Basis for 2010
|
 -
30 -
Appendix 4 –
Combined Pro Forma PC & ELIOKEM
Appendix 4 –
Combined Pro Forma PC & ELIOKEM
($ Millions)
ELIOKEM International
2007
2008
2009
2010
Net income
$
5.8
$
(2.5)
$
1.2
$
0.4
Interest expense
15.0
17.5
16.8
16.0
Amortization of deferred financing costs
0.5
0.5
0.5
0.4
Income Tax
2.5
(3.3)
1.3
2.6
Depreciation & amortization
12.5
14.3
13.4
13.2
EBITDA
$
36.3
$
26.5
$
33.2
$
32.6
Restructuring & severance
1.1
1.1
3.9
1.1
Other
(8.9)
7.0
(2.0)
15.0
Adjusted EBITDA
$
28.5
$
34.6
$
35.1
$
48.7
Sales
$
228.1
$
289.5
$
229.5
$
288.4
Percentage of Adjusted EBITDA to Sales
12.5%
12.0%
15.3%
16.9%
Combined Adjusted EBITDA
2007
2008
2009
2010
Performance Chemicals Adjusted EBITDA
$
35.1
$
37.5
$
59.7
$
74.8
Eliokem International Adjusted EBITDA
28.5
34.6
35.1
48.7
Combined Adjusted EBITDA
$
63.6
$
72.1
$
94.8
$
123.5
Combined Sales
Performance Chemicals
$
475.3
$
521.6
$
396.8
$
527.9
Eliokem International
228.1
289.5
229.5
288.4
Combined Sales
$
703.4
$
811.1
$
626.3
$
816.3
Percentage of Adjusted EBITDA to Sales
9.0%
8.9%
15.1%
15.1% |
 -
31 -
Appendix 5 –
Net Debt / Leverage
Appendix 5 –
Net Debt / Leverage
($ Millions)
Post
Post
Asian Acq
Year-End
Year-End
Year-End
ELIOKEM
LTM
OMNOVA Solutions Consolidated
May 31, 2008
2008
2009
2010*
Dec 31, 2010
Aug 31, 2011
Total Debt
$ 197.9
$ 188.3
$ 144.1
$ 394.2
$ 457.6
$ 459.0
Less Cash
(13.1)
(17.4)
(41.5)
(328.7)
(84.7)
(95.1)
Net Debt
184.8
$
170.9
$
102.6
$
65.5
$
372.9
$
363.9
$
Adjusted EBITDA (Appendix 1)
$ 39.1
$ 64.4
$ 74.3
$ 106.9
Net Debt / Adjusted EBITDA
4.4
x
1.6
x
0.9
x
3.4
x
LTM: Last Twelve Months through August 31, 2011 including ELIOKEM on a Pro Forma
Basis for 2010 * 2010 Total Debt includes $250.0M of Senior Notes held in
escrow and 2010 cash includes restricted cash of $253.1M |
 Company Confidential |