Attached files
| file | filename |
|---|---|
| 8-K - NATIONAL PENN BANCSHARES, INC. FORM 8-K - NATIONAL PENN BANCSHARES INC | npbpptik.htm |
| EX-99.1 - EXHIBIT 99.1 - NATIONAL PENN BANCSHARES INC | ex99-1.htm |
EXHIBIT 99.2
Slide Presentation

National Penn Bancshares, Inc.
Clean, Strong, Efficient
Clean, Strong, Efficient
Sandler O’Neill & Partners, L.P.
East Coast Financial Services Conference
November 10, 2011
6

Safe Harbor Regarding Forward Looking Statements
This presentation contains forward-looking information about National Penn Bancshares, Inc. that is intended to be covered by the safe harbor for forward-looking
statements provided by the Private Securities Litigation Reform Act of 1995. Forward-looking statements are statements that are not historical facts. These
statements can be identified by the use of forward-looking terminology such as “believe,” “expect,” “may,” “will,” “should,’’ “project,” ”could,” “plan,’’ “goal,” “potential,”
“pro forma,” “seek,” “intend,’’ or “anticipate’’ or the negative thereof or comparable terminology, and include discussions of strategy, financial projections, guidance
and estimates (including their underlying assumptions), statements regarding plans, objectives, expectations or consequences of announced transactions, and
statements about the future performance, operations, products and services of National Penn and its subsidiaries. National Penn cautions readers not to place undue
reliance on these statements.
National Penn’s business and operations are subject to a variety of risks, uncertainties and other factors. Consequently, actual results and experience may
materially differ from those contained in any forward-looking statements. Such risks, uncertainties and other factors that could cause actual results and experience to
differ from those projected include, but are not limited to, the following: increased capital requirements and other requirements or actions mandated by National
Penn’s regulators, National Penn’s ability to raise capital and maintain capital levels, variations in interest rates, deterioration in the credit quality of loans, the effect
of credit risk exposure, declines in the value of National Penn’s assets and the effect of any resulting impairment charges, recent and ongoing changes to the state
and federal regulatory schemes under which National Penn and other financial services companies operate (including the Dodd-Frank Act and regulations adopted
or to be adopted to implement that Act), competition from other financial institutions, interruptions or breaches of National Penn’s security systems, and the
development and maintenance of National Penn’s information technology. These risks and others are described in greater detail in National Penn’s Annual Report on
Form 10-K for the fiscal year ended December 31, 2010, as well as in National Penn’s Quarterly Reports on Form 10-Q and other documents filed by National Penn
with the SEC after the date thereof. National Penn makes no commitment to revise or update any forward-looking statements in order to reflect events or
circumstances occurring or existing after the date any forward-looking statement is made.
This presentation contains supplemental financial information determined by methods other than in accordance with Accounting Principles Generally Accepted in the
United States of America (“GAAP”). National Penn’s management uses these non-GAAP measures in its analysis of National Penn’s performance. These measures
should not be considered a substitute for GAAP basis measures nor should they be viewed as a substitute for operating results determined in accordance with GAAP.
Management believes the presentation of the following non-GAAP financial measures, which exclude the impact of the specified items, provides useful supplemental
information that is essential to a proper understanding of the financial results of National Penn.
l Tangible common equity excludes goodwill and intangible assets and preferred equity. Banking and financial institution regulators also exclude goodwill
and intangible assets from shareholders’ equity when assessing the capital adequacy of a financial institution. Tangible common equity provides a method
to assess the company’s tangible capital trends.
and intangible assets from shareholders’ equity when assessing the capital adequacy of a financial institution. Tangible common equity provides a method
to assess the company’s tangible capital trends.
l Tangible book value expresses tangible common equity on a per-share basis. Tangible book value provides a method to assess the level of tangible net
assets on a per-share basis.
assets on a per-share basis.
l Adjusted net income excludes the effects of certain gains and losses, adjusted for applicable taxes. Adjusted net income provides a method to assess
earnings performance by excluding items that management believes are not comparable among the periods presented.
earnings performance by excluding items that management believes are not comparable among the periods presented.
l Pre-tax, pre-provision return on assets (ROA) represents pre-tax, pre-provision revenue (net interest income plus core non-interest income minus core
non-interest expense) divided by average assets.
non-interest expense) divided by average assets.
l Efficiency ratio expresses operating expenses as a percentage of fully-taxable equivalent net interest income plus non-interest income. Operating
expenses exclude items from non-interest expense that management believes are not comparable among the periods presented. Non-interest income is
adjusted to also exclude items that management believes are not comparable among the periods presented. Efficiency ratio is used as a method for
management to assess its operating expense level and to compare to financial institutions of varying sizes.
Management believes the use of non-GAAP measures will help readers compare National Penn’s current results to those of prior periods as presented in the
accompanying Financial Highlights and financial data tables.
accompanying Financial Highlights and financial data tables.
Non-GAAP Financial Measures
7

Attractive Franchise in the Heart of the
Mid-Atlantic Region
Mid-Atlantic Region
•$8.6 billion assets
•122 branch offices
•Approx. 1,700 FTE
employees
employees
•$1.2 billion market cap*
•Approx. 780 thousand
share avg. daily volume
(52 week)*
share avg. daily volume
(52 week)*
•$7.50 - 30 day average
share price*
share price*
•TBV Multiple: 128%
* Source: SNL Financial as of
11.3.11
11.3.11
8

Source: SNL Financial / FDIC . Percentage % of National Penn Deposits as of June 30, 2011. *Demographic
data is the most recent data published as of June 30, 2010. (1) Average of individual county data.
data is the most recent data published as of June 30, 2010. (1) Average of individual county data.
Strong Presence in Demographically
Attractive Counties
Attractive Counties
Berks
Lehigh /
Northampton
(Lehigh Valley)
Chester
Montgomery
Bucks
% of National Penn Deposits
22.1%
25.4%(1)
13.2%
8.9%
6.8%
Median Household Income*
($000)
($000)
$58.1
$58.6(1)
$87.1
$80.5
$78.8
Pennsylvania Median HH
Income* ($000)
Income* ($000)
$52.7
Nationwide Median HH Income*
($000)
($000)
$54.4
Projected Income Growth*
’10 - ’15
11.0%
14.2%(1)
17.1%
16.6%
15.8%
Pennsylvania Projected
Income Growth*
Income Growth*
13.3%
Nationwide Projected Income
Growth*
Growth*
12.4%
9

Source: SNL Financial / FDIC - pro-forma data as of June 30, 2011.
Market Disruption Opportunity
Deposit Market Share Analysis—Total PA Market Area (by County)
10

Growth Drivers
11

2011 Quarterly Earnings
Consistent improvement
Consistent improvement
*A non-GAAP measure.
12

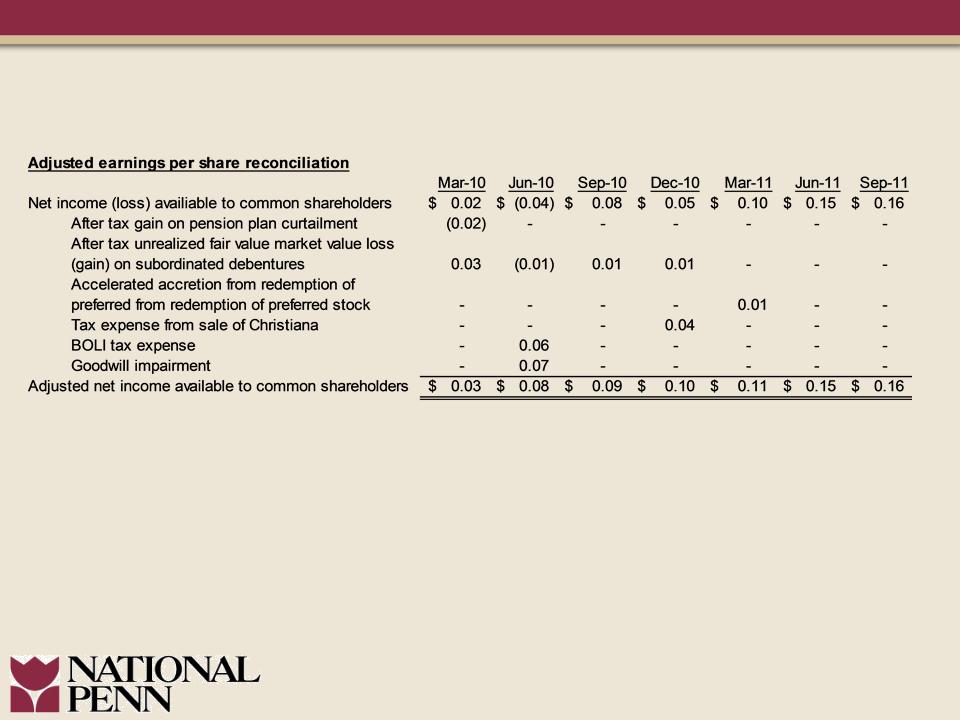
Improving Adjusted Earnings Per Share*
*Refer to Appendix for reconciliation of Non-GAAP measure
13

Pre-Tax Pre-Provision Revenue*
($million)
*Refer to Appendix for explanation of Non-GAAP measure
14

Positive Return on Asset Trend
(A) Excludes charges associated with the divestiture of Christiana
Bank & Trust Company on December 3, 2010
Bank & Trust Company on December 3, 2010
15

Loan Balances Stable
($million)
(a) Christiana Bank & Trust Company divested on December 3, 2010.
16
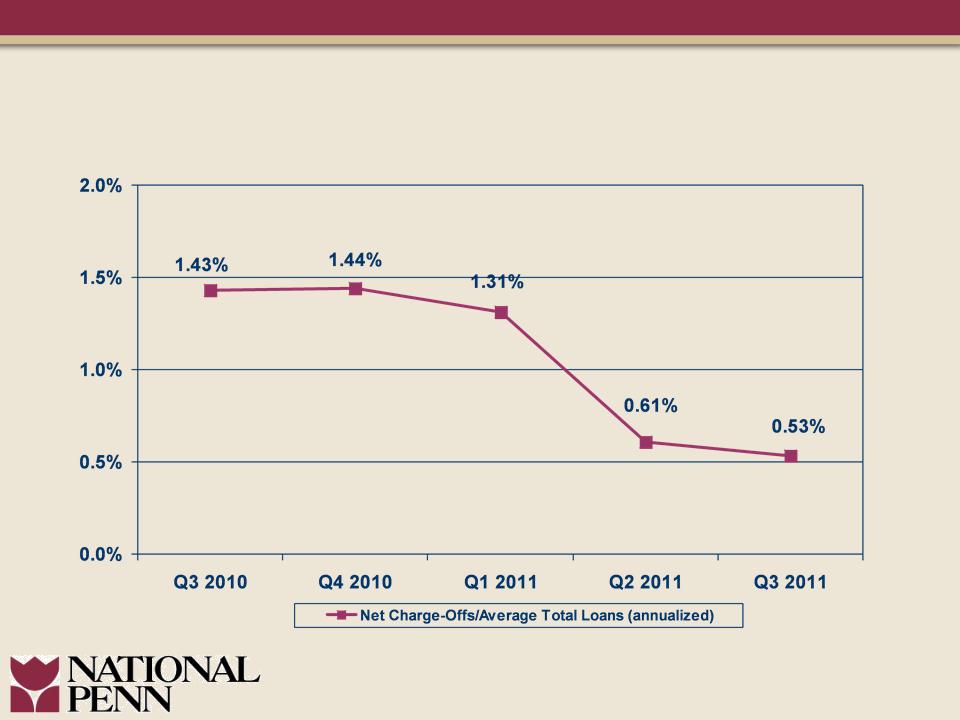
Sustained Asset Quality Improvement
Net Charge-Offs/Average Loans
Net Charge-Offs/Average Loans
17

Sustained Asset Quality Improvement
Classified Loans & Provision Trends
Classified Loans & Provision Trends
($million)
($million)
18

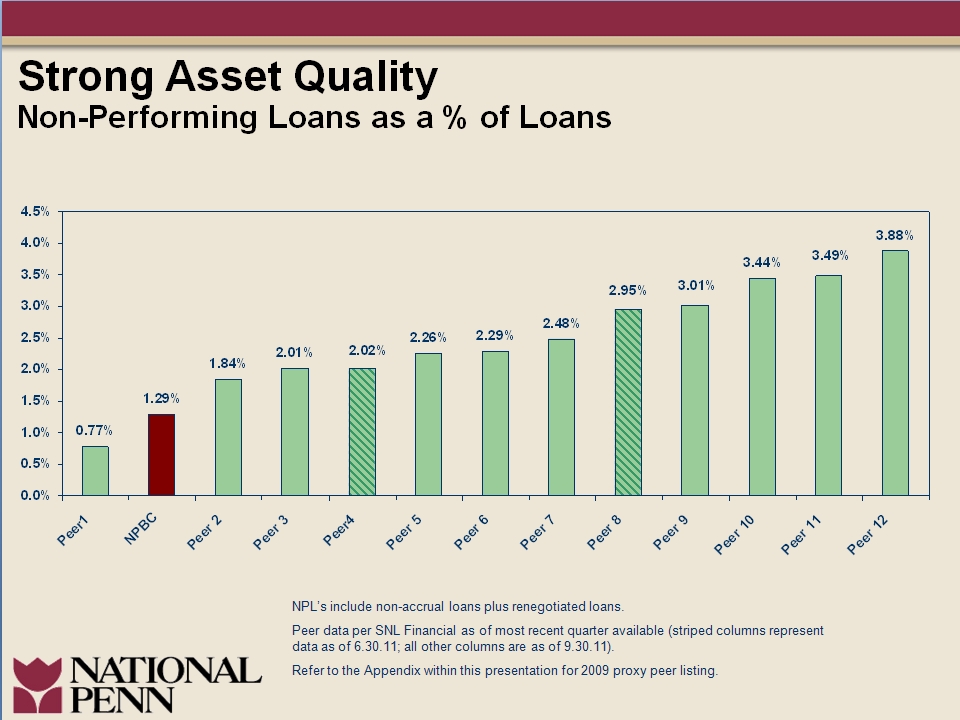
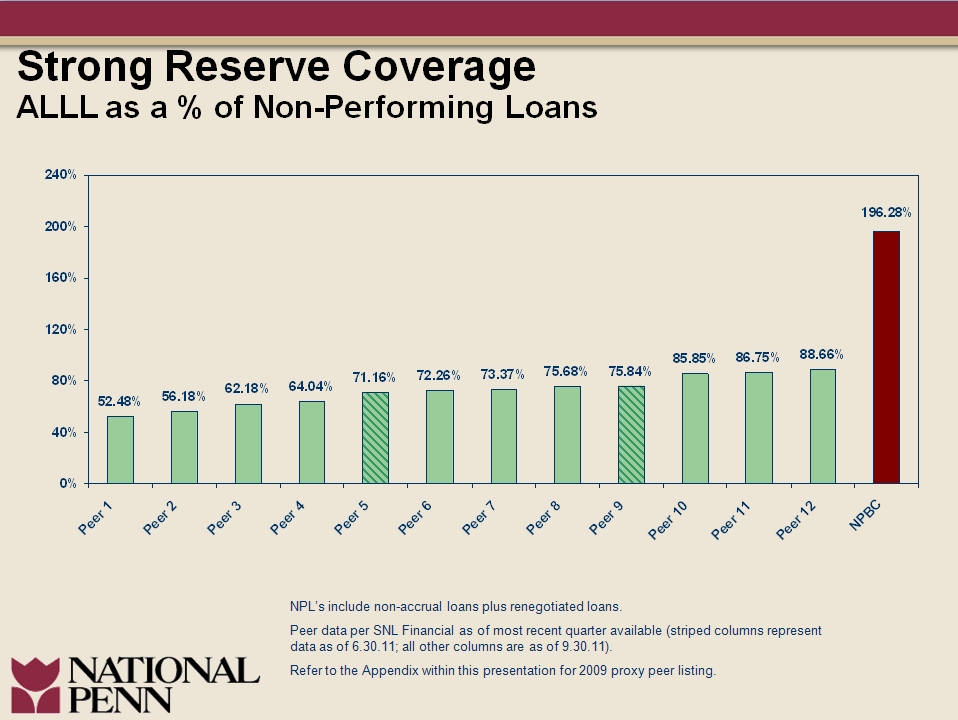
Asset Quality Overview / Peer Comparison
19
20
21
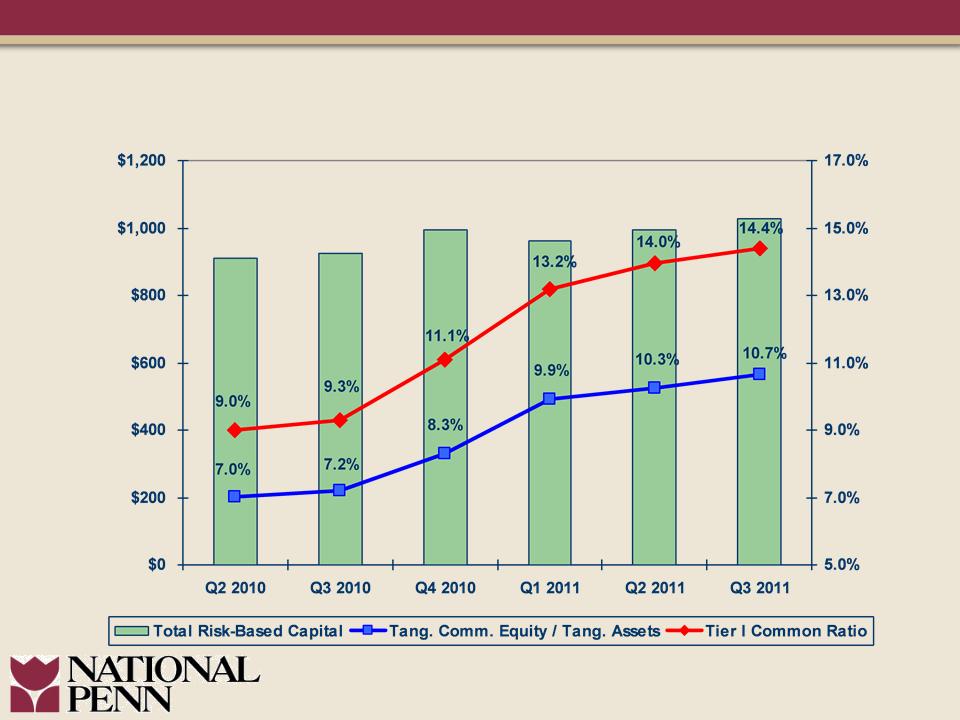
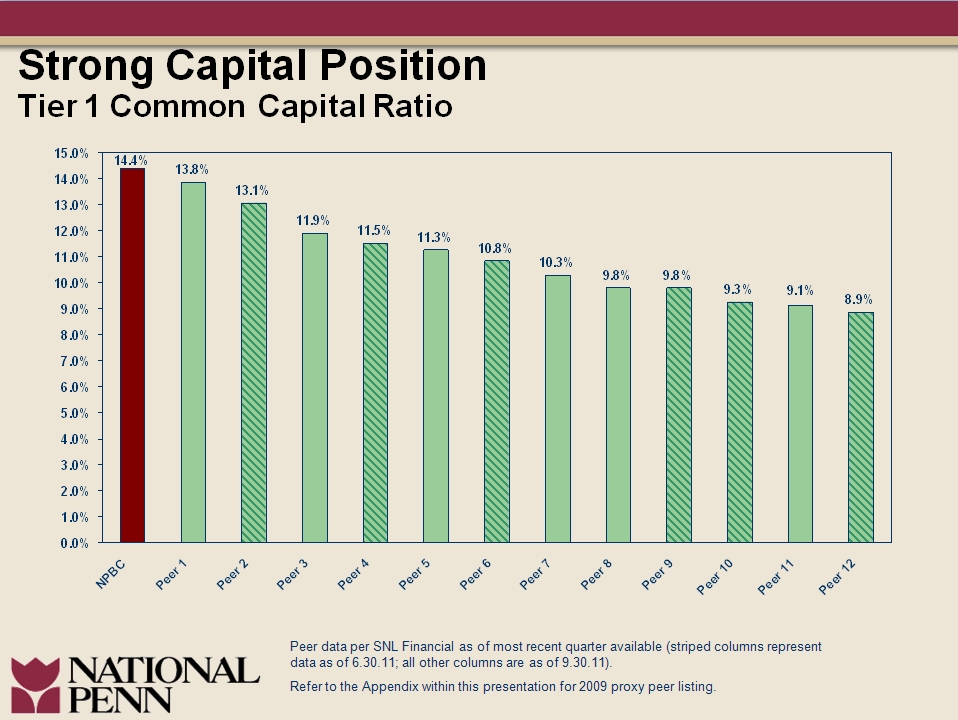
Capital Position Further Enhanced
($million)
22

23
24
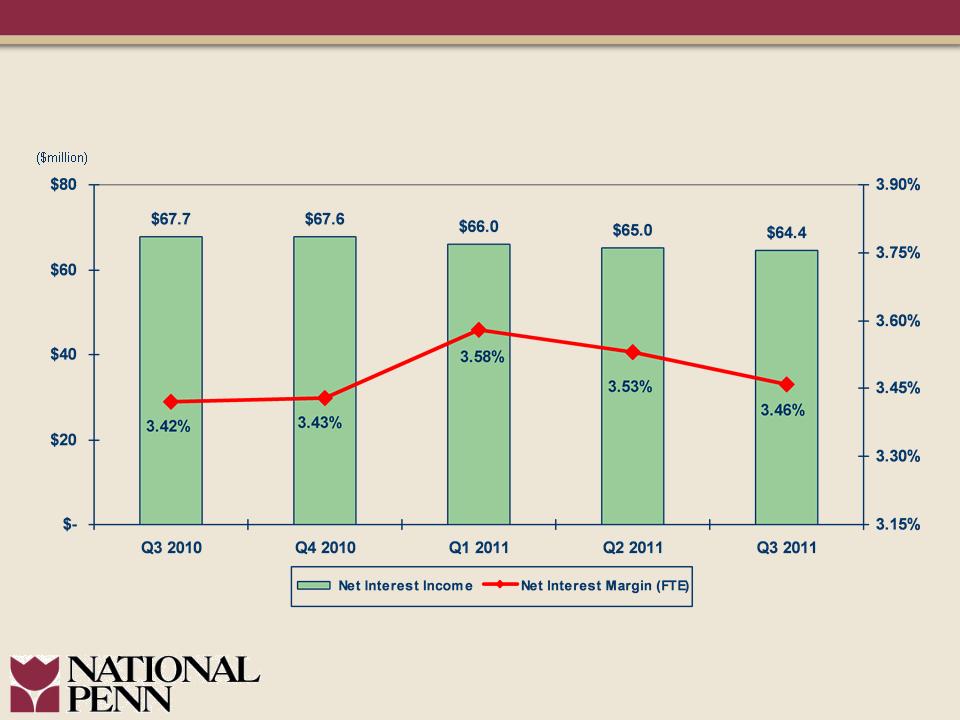
Net Interest Margin
25

• Extension of a portion of “excess” liquidity.
• Modest balance sheet restructuring.
• Continued focus on deposit pricing including transaction
accounts.
accounts.
• Third quarter 2011 loan volumes positively impacting 4th
quarter average loans.
quarter average loans.
3Q 2011 Net Interest Margin Initiatives
26
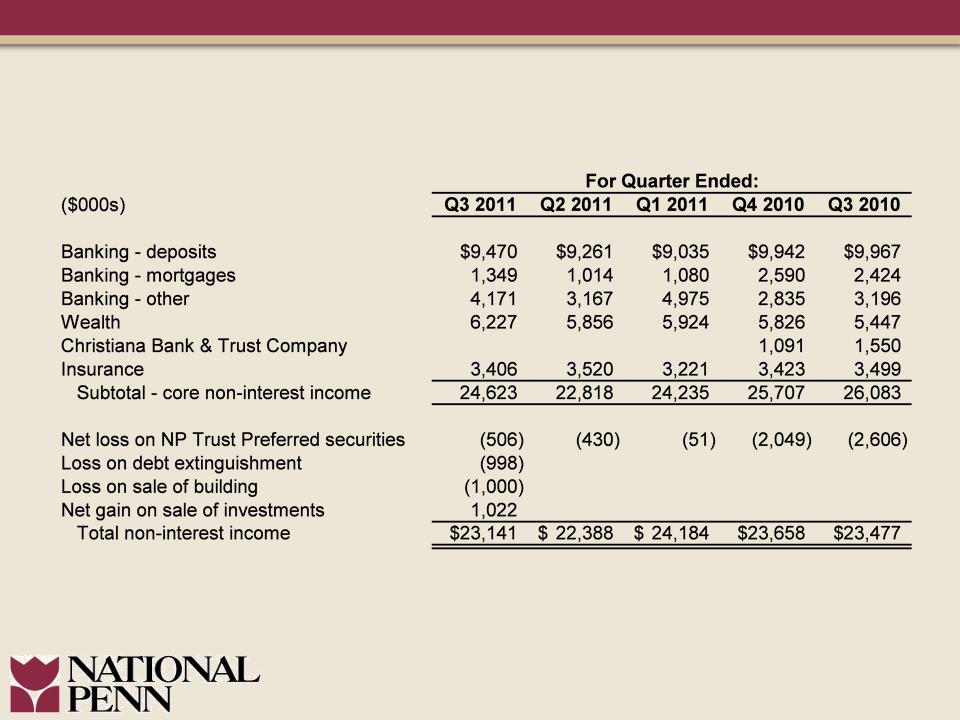
Non-Interest Income
27

Expense Management Maintained
28

Enhance Shareholder Value Through
Capital Management Opportunities
Capital Management Opportunities
29

• Enhance Shareholder Value Through Capital Management
Opportunities
Opportunities
• Leverage Business Model to Win Market Share and
Continue Positive Earnings Growth
Continue Positive Earnings Growth
§ Build upon the Strength of National Penn’s Brand
• Re-Risk the Balance Sheet Prudently to Sustain National
Penn’s:
Penn’s:
§ Solid Asset Quality Metrics
§ Strong Risk Management Culture
Strategic Objectives
Future Growth and Enhanced Shareholder Value
30

31
Appendix
Reconciliation of Non-GAAP Measures
Reconciliation of Non-GAAP Measures
Pre-tax, pre-provision return on assets (ROA) represents pre-tax, pre-provision revenue (net interest income plus
core non-interest income minus core non-interest expense) divided by average assets.
core non-interest income minus core non-interest expense) divided by average assets.
32

Appendix
NPBC Peer Data - 2009 Proxy Statement*
NPBC Peer Data - 2009 Proxy Statement*
|
Peer
|
Ticker
|
Assets as of
6.30.11 (billions) |
|
BancorpSouth, Inc.
|
BXS
|
$13.4
|
|
F.N.B Corporation
|
FNB
|
9.9
|
|
First Midwest Bancorp, Inc.
|
FMBI
|
8.1
|
|
First Niagara Financial Group, Inc.
|
FNFG
|
30.9
|
|
FirstMerit Corporation
|
FMER
|
14.3
|
|
Fulton Financial Corporation
|
FULT
|
16.0
|
|
MB Financial, Inc.
|
MBFI
|
10.0
|
|
Old National Bancorp
|
ONB
|
8.0
|
|
Susquehanna Bancshares, Inc.
|
SUSQ
|
14.2
|
|
Trustmark Corporation
|
TRMK
|
9.7
|
|
Valley National Bancorp
|
VLY
|
14.5
|
|
Wintrust Financial Corporation
|
WTFC
|
14.6
|
*Note: Wilmington Trust (WL) excluded from peer data beginning with data for 1Q 2011 due to
acquisition by M&T. Whitney Holding Company (WTNY) excluded from peer data beginning with
2Q2011 due to acquisition by Hancock Holding Co. (HBHC).
acquisition by M&T. Whitney Holding Company (WTNY) excluded from peer data beginning with
2Q2011 due to acquisition by Hancock Holding Co. (HBHC).
33