Attached files
| file | filename |
|---|---|
| EX-99.1 - PRESS RELEASE - ESSENDANT INC | d246996dex991.htm |
| 8-K - FORM 8-K - ESSENDANT INC | d246996d8k.htm |
 October 24, 2011
1
United Stationers Inc.
Earnings Presentation
Third Quarter 2011
TO BE FILED IN
CONJUNCTION WITH
PRESS RELEASE
Exhibit 99.2 |
 October 24, 2011
2
Forward Looking Statements and
Non-GAAP Measures
This
presentation
contains
forward-looking
statements,
including
references
to
goals,
plans,
strategies,
objectives,
anticipated
future
performance,
results
or
events
and
other
statements
that
are
not
strictly
historical
in
nature.
These
statements
are
based
on
management’s
current
expectations,
forecasts
and
assumptions.
This
means
they
involve
a
number
of
risks
and
uncertainties
that
could
cause
actual
results
to
differ
materially
from
those
expressed
or
implied
here.
These
risks
and
uncertainties
include,
but
are
not
limited
to,
the
following:
Prevailing
economic
conditions
and
changes
affecting
the
business
products
industry
and
the
general
economy;
United’s
ability
to
effectively
manage
its
operations
and
to
implement
growth,
cost-reduction
and
margin-enhancement
initiatives;
United’s
reliance
on
key
customers,
and
the
business,
credit
and
other
risks
inherent
in
continuing
or
increased
customer
concentration;
United’s
reliance
on
key
suppliers
and
the
supplier
allowances
and
promotional
incentives
they
offer;
United’s
reliance
on
independent
resellers
for
a
significant
percentage
of
its
net
sales
and
therefore
the
importance
of
the
continued
independence,
viability
and
success
of
these
resellers;
continuing
or
increasing
competitive
activity
and
pricing
pressures
within
existing
or
expanded
product
categories,
including
competition
from
product
manufacturers
who
sell
directly
to
United’s
customers;
the
impact
of
variability
in
customer
and
end-user
demand
patterns
on
United’s
product
sales
mix
and,
in
turn,
on
profit
margins;
the
impact
of
a
loss
of,
or
substantial
decrease
in,
the
availability
of
products
or
service
from
key
suppliers
at
competitive
prices;
the
availability
of
financing
sources
to
meet
United’s
business
needs;
United’s
ability
to
manage
inventory
in
order
to
maximize
sales
and
supplier
allowances
while
minimizing
excess
and
obsolete
inventory;
United’s
ability
to
maintain
its
existing
information
technology
and
e-commerce
systems
and
to
successfully
procure
and
implement
new
systems
without
business
disruption
or
other
unanticipated
difficulties
or
costs;
United’s
ability
to
effectively
identify,
consummate
and
integrate
acquisitions;
United’s
reliance
on
key
management
personnel,
both
in
day-to-day
operations
and
in
execution
of
new
business
initiatives;
and
the
effects
of
hurricanes,
acts
of
terrorism
and
other
natural
or
man-made
disruptions.
Shareholders,
potential
investors
and
other
readers
are
urged
to
consider
these
risks
and
uncertainties
in
evaluating
forward-looking
statements
and
are
cautioned
not
to
place
undue
reliance
on
the
forward-looking
statements.
For
additional
information
about
risks
and
uncertainties
that
could
materially
affect
United’s
results,
please
see
the
company’s
Securities
and
Exchange
Commission
filings.
The
forward-looking
information
in
this
presentation
is
made
as
of
this
date
only,
and
the
Company
does
not
undertake
to
update
any
forward-
looking
statement.
Investors
are
advised
to
consult
any
further
disclosure
by
United
regarding
the
matters
discussed
in
this
release
in
its
filings
with
the
Securities
and
Exchange
Commission
and
in
other
written
statements
it
makes
from
time
to
time.
It
is
not
possible
to
anticipate
or
foresee
all
risks
and
uncertainties,
and
investors
should
not
consider
any
list
of
risks
and
uncertainties
to
be
exhaustive
or
complete.
*
This
is
non-GAAP
information.
A
reconciliation
of
these
items
to
the
most
comparable
GAAP
measures
is
presented
on
the
company’s
Website
(www.unitedstationers.com)
under
the
Investor
Information
section.
Except
as
noted,
all
references
to
financial
results
within
this
presentation
are
presented
in
accordance
with
U.S.
Generally
Accepted
Accounting
Principles. |
 October 24,
2011 3
Q3 2011 Headlines
Sales increased 3.1% from Q3 2010 to $1.31 billion.
Earnings per diluted share were $0.81, up 13%* from an adjusted Q3 2010
EPS of $0.72*.
Gross margin rate of 15.3% was flat with last year.
Operating expenses in Q3 2011 were $135.1 million, compared to an
adjusted $132.6 million* in the prior-year quarter, and were 10.3% of sales,
down from 10.4%* of sales in the prior-year quarter.
Operating income as a percent of sales was 4.9%, flat with last year’s
adjusted 4.9%*.
Net
income
increased
4%*
to
$35.8
million
from
an
adjusted
$34.4
million*
in Q3 2010.
Net cash provided by operating activities was $26.2 million in Q3 2011.
Debt was up $47.9 million from the prior-year end and from the prior-year
quarter end.
During the quarter, the Company repurchased 2.2 million shares for $67.8
million and paid a cash dividend of $6 million to common shareholders. |
 October 24, 2011
4
Third Quarter 2011 P&L
% to sales change
$
% to Sales
$
% to Sales
$ change
% change
Fav (Unfav)
$ Millions (except EPS)
QTD Q3 2011
QTD Q3 2011
QTD Q3 2010
QTD Q3 2010
Fav (Unfav)
Fav (Unfav)
basis points
Net Sales
1,310.0
$
1,270.7
$
39.3
$
3.1%
Workday Adjusted Sales Growth
3.1%
Gross Margin
199.7
15.25%
194.8
15.33%
4.9
2.5%
(8)
Operating Expense
135.1
10.32%
129.3
10.18%
(5.8)
(4.5%)
(14)
Operating Income
64.6
4.93%
65.5
5.15%
(0.9)
(1.4%)
(22)
Interest & Other
7.0
0.53%
6.6
0.52%
(0.4)
(6.1%)
(1)
Taxes
21.8
1.67%
22.4
1.77%
0.6
2.7%
10
Net Income
35.8
$
2.73%
36.5
$
2.87%
(0.7)
$
(1.9%)
(14)
Diluted Shares (000s)
44,202
47,548
Diluted EPS
0.81
$
0.77
$
0.04
$
5.2%
Effective Tax Rate
37.8%
38.1%
Adjusted to exclude non-operating items *
Adjusted Operating Income
64.6
$
4.93%
62.2
$
4.89%
2.4
$
3.9%
4
Adjusted Net Income
35.8
2.73%
34.4
2.71%
1.4
4.1%
2
Adjusted Diluted EPS
0.81
$
0.72
$
0.09
$
12.5% |
 October 24,
2011 5
YTD September 2011 Headlines
Sales increased 3.8%, workday adjusted, from YTD September 2010 to
$3.80 billion.
Adjusted earnings per diluted share were $1.87*, up 17%* from YTD
September 2010 EPS of $1.60*.
Gross margin rate of 14.9% was up from 14.8% last year.
Adjusted operating expenses in YTD September 2011 were $407.9
million*, up from $395.4 million* in the prior-year period, and were 10.7%*
of sales versus 10.9%* in the prior-year period.
Adjusted operating income as a percent of sales was 4.2%*, up from 4.0%*
in YTD September 2010.
Adjusted net income increased 10%* to $85.4 million* from $77.9 million* in
YTD September 2010.
Net cash provided by operating activities was $99.5 million YTD September
2011 compared to $114.4 million YTD September 2010.
Through YTD September 30, 2011, the Company repurchased 4.3 million
shares
for
$137.7
million,
paid
cash
dividends
of
$12
million
to
common
shareholders, and declared another $0.13 per share dividend. |
 October 24, 2011
6
Year-to-Date 2011 P&L
% to sales change
$ Millions (except EPS)
$
% to Sales
$
% to Sales
$ change
% change
Fav (Unfav)
YTD Q3 2011
YTD Q3 2011
YTD Q3 2010
YTD Q3 2010
Fav (Unfav)
Fav (Unfav)
basis points
Net Sales
3,804.1
$
3,645.8
$
158.3
$
4.3%
Workday Adjusted Sales Growth
3.8%
Gross Margin
566.3
14.89%
541.0
14.84%
25.3
4.7%
5
Operating Expense
413.9
10.88%
389.3
10.68%
(24.6)
(6.3%)
(20)
Operating Income
152.4
4.01%
151.7
4.16%
0.7
0.5%
(15)
Interest & Other
20.4
0.54%
19.3
0.53%
(1.1)
(5.7%)
(1)
Taxes
50.9
1.34%
50.7
1.40%
(0.2)
(0.4%)
6
Net Income
81.1
$
2.13%
81.7
$
2.24%
(0.6)
$
(0.7%)
(11)
Diluted Shares (000s)
45,718
48,624
Diluted EPS
1.77
$
1.68
$
0.09
$
5.4%
Effective Tax Rate
38.6%
38.3%
Adjusted to exclude non-operating items*
Adjusted Operating Income
158.5
$
4.17%
145.6
$
3.99%
12.9
$
8.9%
18
Adjusted Net Income
85.4
2.24%
77.9
2.14%
7.5
9.6%
10
Adjusted Diluted EPS
1.87
$
1.60
$
0.27
$
16.9% |
 October 24, 2011
7
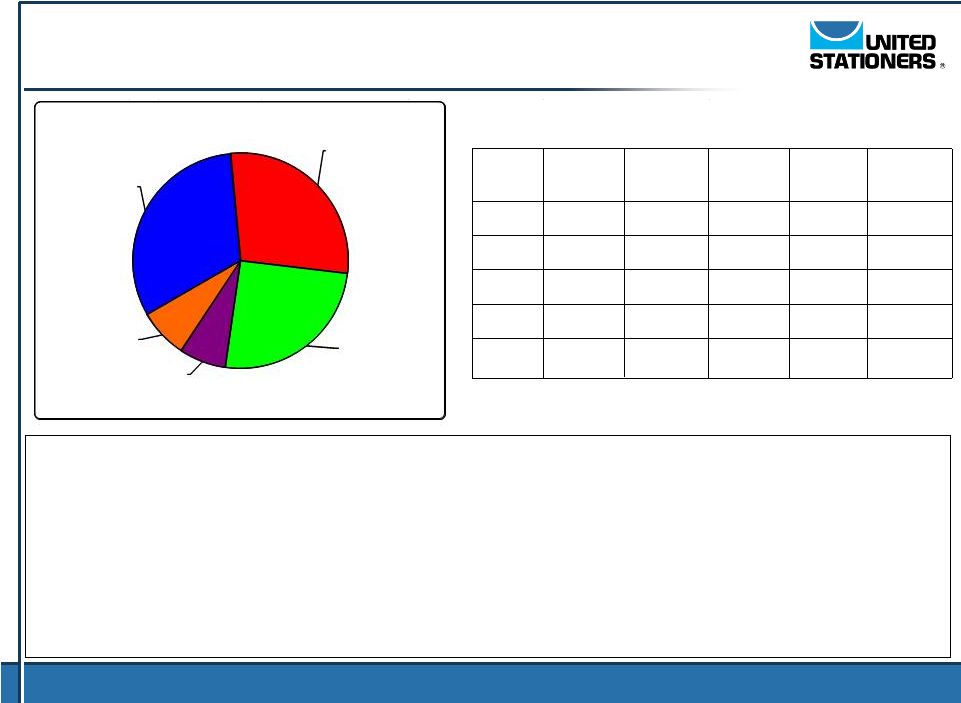
Sales
by Product Category –
Q3 2011
•
Technology sales were relatively flat with lower purchases from National Accounts
being offset by significant growth in New Channels and from other targeted
initiatives. •
Office Products sales remained even with last year with decreases in National
Accounts offset by growth from New Channels.
•
Janitorial/Breakroom growth reflects increases across all channels and is a result
of continued strategic initiatives to build share.
•
Industrial sales growth was due to continued strong demand and strategic
initiatives. •
Furniture sales were negatively impacted by a challenging transactional market and
a sourcing shift in some national account business.
Sales
Sales
Sales
Sales
Sales
growth (decline)
growth (decline)
growth (decline)
growth (decline)
growth (decline)
Q3 2011
Q2 2011
Q1 2011
Q4 2010
Q3 2010
Category
vs Q3 2010
vs Q2 2010
vs Q1 2010
vs Q4 2009
vs Q3 2009
Technology
(0.6%)
(5.8%)
3.6%
(2.8%)
(1.4%)
Office Products
(0.6%)
4.4%
3.4%
0.4%
6.7%
Janitorial/
Breakroom
10.6%
11.5%
7.5%
(1.7%)
(4.4%)
Industrial
23.7%
20.5%
26.1%
25.2%
29.6%
Furniture
(9.8%)
(3.9%)
(0.9%)
0.9%
(0.1%)
Technology
32%
Office Products
28%
Janitorial/
Breakroom
25%
Furniture
7%
Industrial
8%
Q3 2011 |
 October 24, 2011
8
Sales by Channel –
Q3 2011
Sales growth
Sales growth
Sales growth
Sales growth
Sales growth
(decline)
(decline)
(decline)
(decline)
(decline)
Q3 2011
Q2 2011
Q1 2011
Q4 2010
Q3 2010
Channel
vs Q3 2010
vs Q2 2010
vs Q1 2010
vs Q4 2009
vs Q3 2009
Independent
& Other
5.7%
4.4%
6.2%
1.2%
3.7%
Nationals
(12.1%)
(5.6%)
1.8%
(4.3%)
(7.6%)
Independent
& Other
87%
Nationals
13%
Q3 2011
•
Independent/Other channel sales growth was attributable to 24% growth in
Industrial, continued success with growth initiatives and strong
double-digit growth with New Channel customers, including e-tail.
•
National accounts sales decline was mainly due to a shift to more direct purchases
from manufacturers, primarily in furniture and certain technology
products. |
 October 24, 2011
9
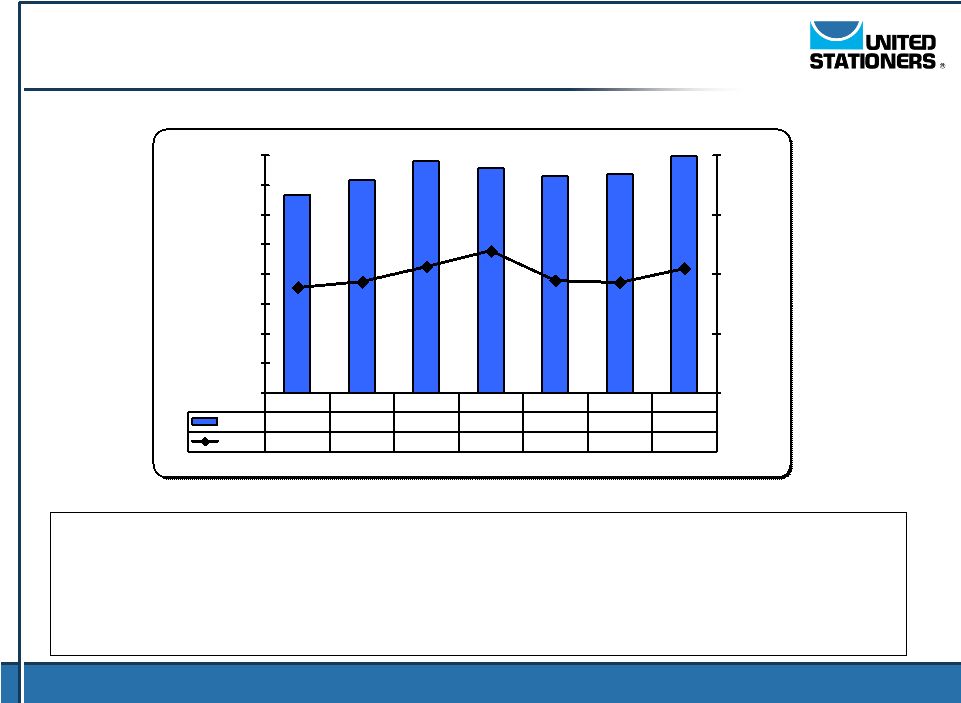
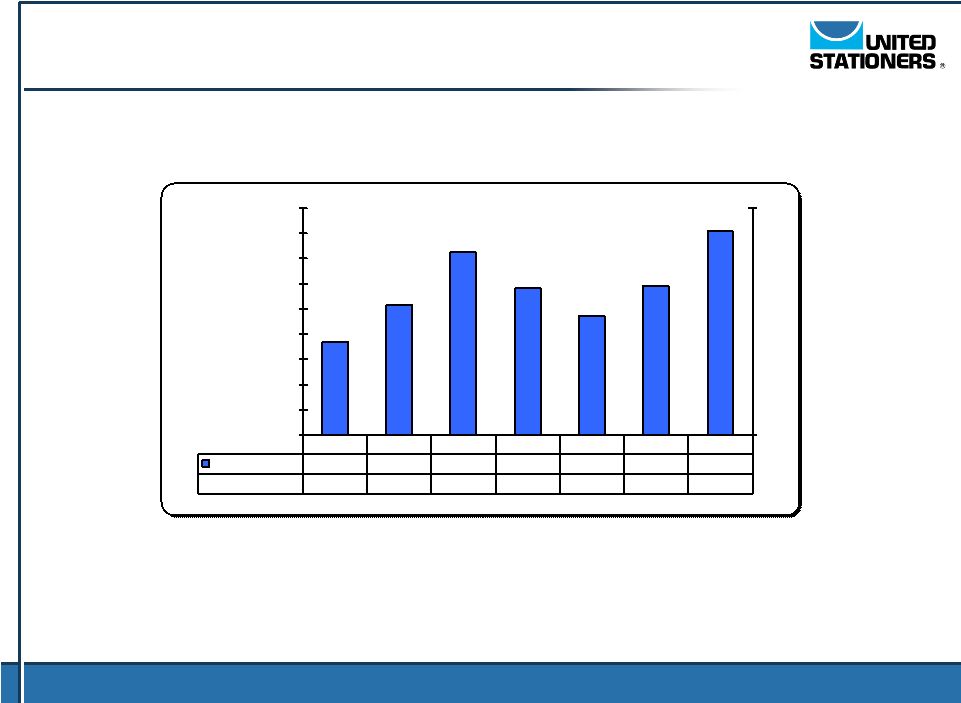
Gross Margin
dollars in millions
Q1 10
Q2 10
Q3 10
Q4 10
Q1 11
Q2 11
Q3 11
Dollars
$166.9
$179.2
$194.8
$189.5
$182.4
$184.2
$199.7
Rate
14.5%
14.7%
15.3%
16.0%
14.7%
14.7%
15.3%
10.0%
12.5%
15.0%
17.5%
20.0%
$-
$25.0
$50.0
$75.0
$100.0
$125.0
$150.0
$175.0
$200.0
•
Margins were flat in Q3 2011 versus Q3 2010 due to lower margin-mix, continued
competitive pricing
pressures,
and
higher
diesel
fuel
costs
offset
by
higher
product
cost
inflation,
higher
inventory purchase-related supplier allowances, other inventory-related
items and “War on Waste”
(WOW) savings. |
 October 24, 2011
10
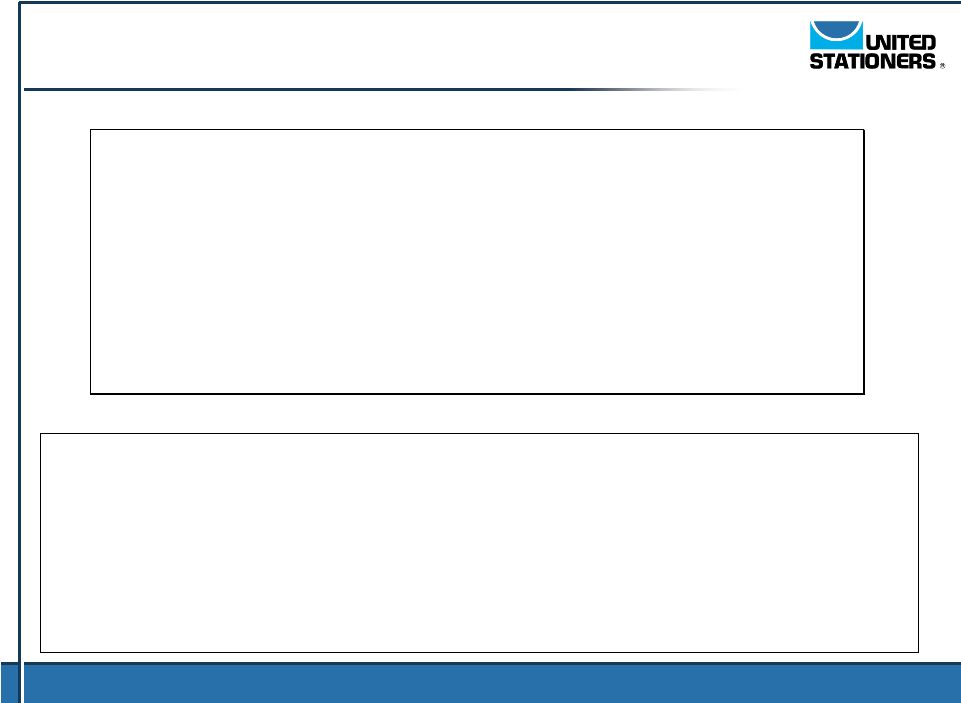
Adjusted Operating Expense*
dollars in millions
Q1 10
Q2 10 *
Q3 10 *
Q4 10 *
Q1 11 *
Q2 11 *
Q3 11
Dollars
$131.1
$131.7
$132.6
$136.9
$140.8
$132.0
$135.1
Rate
11.4%
10.8%
10.4%
11.5%
11.4%
10.5%
10.3%
7.5%
10.0%
12.5%
15.0%
$-
$25.0
$50.0
$75.0
$100.0
$125.0
$150.0
•
Adjusted
operating
expense
dollars
increased
slightly
in
Q3
2011
versus
the
prior-year
quarter
mainly
due
to
sales
growth,
investment
in
strategic
growth
initiatives,
and
higher
bad
debt
costs.
These
increases
were
partially
offset
by
lower
depreciation,
favorable
resolution
of
non-income
based
tax
liabilities, and savings from WOW initiatives.
•
As
a
percent
to
sales,
adjusted
operating
expenses
were
12
basis
points
favorable
versus
the
prior
year. |
 October 24, 2011
11
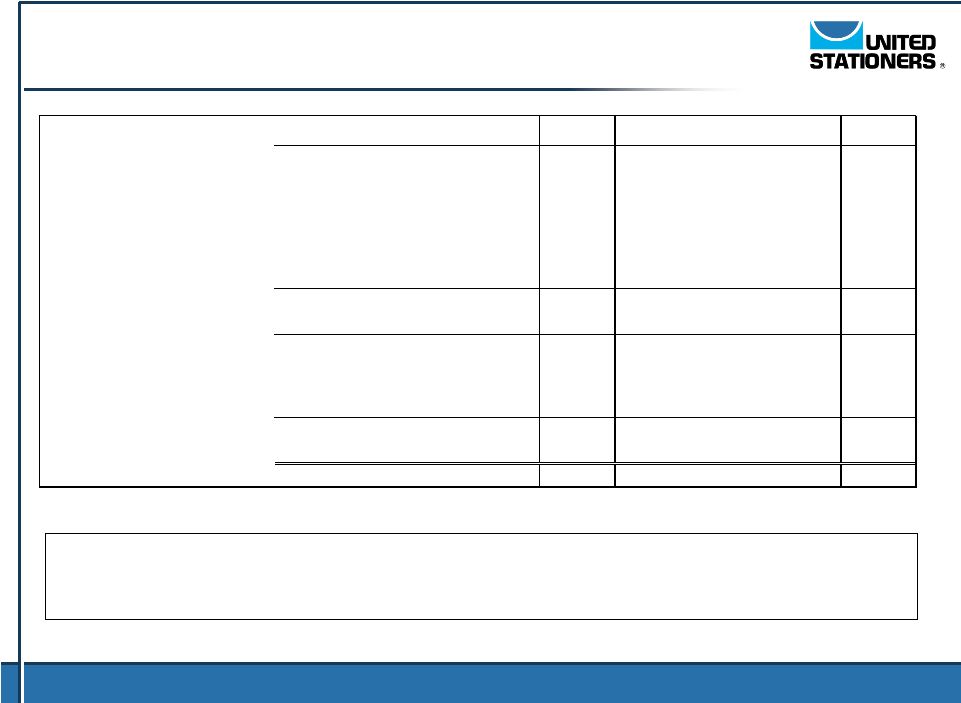
Adjusted Operating Income*
dollars in millions
Q1 10
Q2 10 *
Q3 10 *
Q4 10 *
Q1 11*
Q2 11*
Q3 11
Dollars
$35.8
$47.6
$62.2
$52.6
$41.6
$52.2
$64.6
Rate
3.1%
3.9%
4.9%
4.4%
3.4%
4.2%
4.9%
2.0%
3.0%
4.0%
5.0%
6.0%
$-
$10.0
$20.0
$30.0
$40.0
$50.0
$60.0
$70.0 |
 October 24, 2011
12
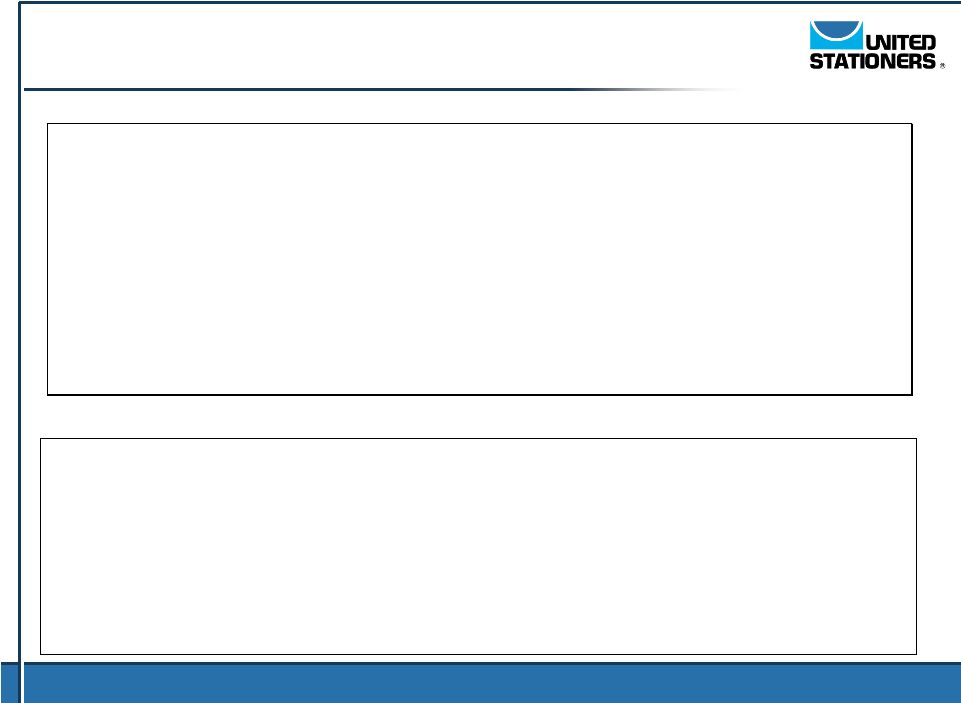
Adjusted Earnings per Share*
shares in millions
Q1 10
Q2 10 *
Q3 10 *
Q4 10 *
Q1 11*
Q2 11*
Q3 11
EPS
$0.37
$0.51
$0.72
$0.58
$0.47
$0.59
$0.81
Diluted Shares
49.640
49.272
47.548
47.456
46.656
46.340
44.202
0.000
1.000
$-
$0.10
$0.20
$0.30
$0.40
$0.50
$0.60
$0.70
$0.80
$0.90 |
 October 24, 2011
13
Working Capital Summary
$ Millions
3/31/2010
6/30/2010
9/30/2010
12/31/2010
3/31/2011
6/30/2011
9/30/2011
Accounts Receivable
606.2
$
642.6
$
655.1
$
628.1
$
648.1
$
669.5
$
699.2
$
Inventories (LIFO)
610.1
639.2
617.4
684.1
636.2
632.1
615.5
Accounts Payable
433.8
443.9
424.9
421.6
422.4
443.5
410.8
Q1 10
Q2 10
Q3 10
Q4 10
Q1 11
Q2 11
Q3 11
Net Trade A/R DSO
43
42
41
41
42
41
42
Inventory Turns
6.6
6.7
6.8
6.1
6.4
6.8
7.1
A/P as % Inventory (LIFO)
71%
69%
69%
62%
66%
70%
67%
A/P as % Inventory (FIFO)
63%
61%
61%
55%
58%
61%
58%
•
Receivables
were
up
7%
versus
the
Q3
2010
and
up
11%
compared
to
Q4
2010.
•
Net trade A/R DSO increased slightly compared to Q3 2010 as the economic
environment remains challenging for certain customers.
•
Inventories
were
down
0.3%
versus
Q3
2010
and
down
10%
versus
Q4
2010
as
the
Company
continues to manage working capital efficiently while maintaining high service
levels. •
Turnover
remained
strong
at
7.1
turns
vs.
6.8
turns
at
this
time
last
year.
•
Payables leverage ratios were down slightly from Q3 2010 but up from Q4 2010 and in
line with typical levels. |
 October 24, 2011
14
Cash Flows
QTD
QTD
QTD
QTD
2010
QTD
QTD
QTD
2011
$ Millions
Q1 10
Q2 10
Q3 10
Q4 10
Total Year
Q1 11
Q2 11
Q3 11
YTD
Net Income
18.2
$
27.0
$
36.5
$
31.1
$
112.8
$
20.4
$
24.9
$
35.8
$
81.1
$
Depreciation & Amortization
9.4
9.4
9.4
9.4
37.6
9.0
8.9
8.7
26.6
Share-based compensation
3.3
3.5
3.7
3.6
14.1
3.7
6.7
2.7
13.1
Writedown on impaired assets
-
-
-
-
-
1.6
-
-
1.6
Change in Accounts Receivable
35.9
(36.7)
(12.3)
27.0
13.9
(19.8)
(21.3)
(30.6)
(71.7)
Change in Inventory
(18.1)
(29.4)
21.9
(66.5)
(92.1)
48.2
4.3
15.2
67.7
Change in Accounts Payable
42.5
9.9
(18.9)
(3.3)
30.2
1.0
21.0
(33.1)
(11.1)
Change in Other Working Capital
(4.1)
1.0
12.8
(6.6)
3.1
(18.7)
(3.3)
21.7
(0.3)
Change in Working Capital
56.2
(55.2)
3.5
(49.4)
(44.9)
10.7
0.7
(26.8)
(15.4)
Other
(4.2)
(12.9)
6.6
5.7
(4.8)
(4.4)
(8.9)
5.8
(7.5)
Adjusted cash provided by (used in)
operating activities
82.9
(28.2)
59.7
0.4
114.8
41.0
32.3
26.2
99.5
Capital Expenditures
(5.7)
(5.0)
(7.3)
(9.3)
(27.3)
(9.8)
(6.4)
(4.6)
(20.8)
Proceeds from disposition of fixed assets
-
-
0.1
-
0.1
-
0.0
0.1
0.1
Net cash used for capital expenditures *
(5.7)
(5.0)
(7.2)
(9.3)
(27.2)
(9.8)
(6.4)
(4.5)
(20.7)
Free Cash Flow *
77.2
$
(33.2)
$
52.5
$
(8.9)
$
87.6
$
31.2
$
25.9
$
21.7
$
78.8
$
•
Cash flow was positively affected by a significant reduction in inventory, offset
by higher accounts receivable and lower accounts payable.
|
 October 24, 2011
15
Debt and Capitalization
$ Millions
3/31/2010
6/30/2010
9/30/2010
12/31/2010
3/31/2011
6/30/2011
9/30/2011
Debt
441.8
$
453.4
$
441.8
$
441.8
$
441.8
$
441.8
$
489.7
$
Equity
730.5
710.6
733.1
759.6
769.7
752.7
721.2
Total capitalization
1,172.3
$
1,164.0
$
1,174.9
$
1,201.4
$
1,211.5
$
1,194.5
$
1,210.9
$
Debt-to-total capitalization
37.7%
39.0%
37.6%
36.8%
36.5%
37.0%
40.4%
•
Operating cash flow generated continues to be used for investments in growth
initiatives, share repurchases, and quarterly dividends.
•
Total debt was up $47.9 million from Q3 2010 and Q4 2010. In September the Company
completed a five-year $700 million Revolving Credit Facility. This
facility replaces the Company’s $425 million revolver and $200 million
term loan. The Revolving Credit Facility will be used for strategic growth
initiatives, working capital needs and other general corporate purposes.
•
Share
repurchases
totaled
4.3
million
shares,
or
$137.7
million,
in
the
year
through
September
2011. |