Attached files
| file | filename |
|---|---|
| EX-23 - EXHIBIT 23 - ESSENDANT INC | a2196670zex-23.htm |
| EX-21 - EXHIBIT 21 - ESSENDANT INC | a2196670zex-21.htm |
| EX-32.1 - EXHIBIT 32.1 - ESSENDANT INC | a2196670zex-32_1.htm |
| EX-31.2 - EXHIBIT 31.2 - ESSENDANT INC | a2196670zex-31_2.htm |
| EX-10.45 - EXHIBIT 10.45 - ESSENDANT INC | a2196670zex-10_45.htm |
| EX-10.26 - EX-10.26 - ESSENDANT INC | a2196670zex-10_26.htm |
| EX-10.43 - EXHIBIT 10.43 - ESSENDANT INC | a2196670zex-10_43.htm |
| EX-10.44 - EXHIBIT 10.44 - ESSENDANT INC | a2196670zex-10_44.htm |
| EX-10.42 - EXHIBIT 10.42 - ESSENDANT INC | a2196670zex-10_42.htm |
| EX-31.1 - EXHIBIT 31.1 - ESSENDANT INC | a2196670zex-31_1.htm |
QuickLinks -- Click here to rapidly navigate through this document
United States Securities and Exchange Commission
Washington, DC 20549
FORM 10-K
| (Mark One) | ||
| ý | ANNUAL REPORT PURSUANT TO SECTION 13 OR 15(d) OF THE SECURITIES EXCHANGE ACT OF 1934 | |
For the fiscal year ended December 31, 2009 |
||
or |
||
o |
TRANSITION REPORT PURSUANT TO SECTION 13 OR 15(d) OF THE SECURITIES EXCHANGE ACT OF 1934 |
|
For the transition period from to |
||
Commission file number: 0-10653
UNITED STATIONERS INC.
(Exact Name of Registrant as Specified in its Charter)
| Delaware | 36-3141189 | |
| (State or Other Jurisdiction of Incorporation or Organization) |
(I.R.S. Employer Identification No.) |
One Parkway North Boulevard
Suite 100
Deerfield, Illinois 60015-2559
(847) 627-7000
(Address, Including Zip Code and Telephone Number, Including Area Code, of Registrant's
Principal Executive Offices)
| Securities registered pursuant to Section 12(b) of the Act: Common Stock, $0.10 par value per share |
Name of Exchange on which registered: NASDAQ Global Select Market |
|
| (Title of Class) |
Securities registered pursuant to Section 12(g) of the Act:
None
Indicate by check mark if the registrant is a well-known seasoned issuer, as defined in Rule 405 of the Securities Act.
Yes ý No o
Indicate by check mark if the registrant is not required to file reports pursuant to Section 13 or Section 15(d) of the Act.
Yes o No ý
Indicate by check mark whether the registrant (1) has filed all reports required to be filed by Section 13 or 15(d) of the Securities Exchange Act of 1934 during the preceding 12 months (or for such shorter period that the registrant was required to file such reports), and (2) has been subject to such filing requirements for the past 90 days.
Yes ý No o
Indicate by check mark whether the registrant has submitted electronically and posted on its corporate Web site, if any, every Interactive Data File required to be submitted and posted pursuant to Rule 405 of Regulation S-T (Section 229.405 of this chapter) during the preceding 12 months (or for such shorter period that the registrant was required to submit and post such files).
Yes o No o
Indicate by check mark if disclosure of delinquent filers pursuant to Item 405 of Regulation S-K (Section 229.405 of this chapter) is not contained herein, and will not be contained, to the best of the registrant's knowledge, in definitive proxy or information statements incorporated by reference in Part III of this Form 10-K or any amendment to this Form 10-K. o
Indicate by check mark whether the registrant is a large accelerated filer, an accelerated filer, or a non-accelerated filer. See the definition of "accelerated filer and large accelerated filer" in Rule 12b-2 of the Exchange Act (Check one):
| Large accelerated filer ý | Accelerated filer o | Non-accelerated filer o (Do not check if a smaller reporting company) |
Smaller reporting company o |
Indicate by check mark whether the registrant is a shell company (as defined in Rule 12b-2 of the Act).
Yes o No ý
The aggregate market value of the common stock of United Stationers Inc. held by non-affiliates as of June 30, 2009 was approximately $827.2 million.
On February 23, 2010, United Stationers Inc. had 24,007,363 shares of common stock outstanding.
Documents Incorporated by Reference:
Certain portions of United Stationers Inc.'s definitive Proxy Statement relating to its 2010 Annual Meeting of Stockholders, to be filed within 120 days after the end of United Stationers Inc.'s fiscal year, are incorporated by reference into Part III.
UNITED STATIONERS INC.
FORM 10-K
For The Year Ended December 31, 2009
TABLE OF CONTENTS
| |
|
Page No.
|
||||
|---|---|---|---|---|---|---|
| Part I | ||||||
Item 1. |
Business |
1 |
||||
| Item 1A. | Risk Factors | 6 | ||||
| Item 1B. | Unresolved Comment Letters | 9 | ||||
| Item 2. | Properties | 9 | ||||
| Item 3. | Legal Proceedings | 10 | ||||
| Item 4. | Submission of Matters to a Vote of Security Holders | 10 | ||||
| Executive Officers of the Registrant | 10 | |||||
Part II |
||||||
Item 5. |
Market for Registrant's Common Equity, Related Stockholder Matters and Issuer Purchases of Equity Securities |
13 |
||||
| Item 6. | Selected Financial Data | 16 | ||||
| Item 7. | Management's Discussion and Analysis of Financial Condition and Results of Operations | 18 | ||||
| Item 7A. | Quantitative and Qualitative Disclosures About Market Risk | 40 | ||||
| Item 8. | Financial Statements and Supplementary Data | 41 | ||||
| Item 9. | Changes in and Disagreements With Accountants on Accounting and Financial Disclosure | 90 | ||||
| Item 9A. | Controls and Procedures | 90 | ||||
Part III |
||||||
Item 10. |
Directors, Executive Officers and Corporate Governance |
91 |
||||
| Item 11. | Executive Compensation | 91 | ||||
| Item 12. | Security Ownership of Certain Beneficial Owners and Management and Related Stockholder Matters | 91 | ||||
| Item 13. | Certain Relationships and Related Transactions, and Director Independence | 92 | ||||
| Item 14. | Principal Accounting Fees and Services | 92 | ||||
Part IV |
||||||
Item 15. |
Exhibits and Financial Statement Schedules |
93 |
||||
Signatures |
98 |
|||||
| Schedule II—Valuation and Qualifying Accounts | 99 | |||||
General
United Stationers Inc. is a leading wholesale distributor of business products, with consolidated net sales of approximately $4.7 billion. United stocks a broad and deep line of approximately 100,000 products, including technology products, traditional office products, office furniture, janitorial and breakroom supplies, and industrial supplies. The Company's network of 64 distribution centers allows it to ship these items to over 25,000 reseller customers, reaching more than 90% of the population of the U.S. and major cities in Mexico on an overnight basis.
Except where otherwise noted, the terms "United" and "the Company" refer to United Stationers Inc. and its consolidated subsidiaries. The parent holding company, United Stationers Inc. (USI), was incorporated in 1981 in Delaware. USI's only direct wholly owned subsidiary—and its principal operating company—is United Stationers Supply Co. (USSC), incorporated in 1922 in Illinois.
Products
United stocks approximately 100,000 stockkeeping units ("SKUs") in these categories:
Technology Products. The Company is a leading wholesale distributor of computer supplies and peripherals in North America. It stocks approximately 10,000 items, including imaging supplies, data storage, digital cameras, computer accessories and computer hardware items such as printers and other peripherals. United provides these products to value-added computer resellers, office products dealers, drug stores, grocery chains and e-commerce merchants. Technology products generated about 35% of the Company's 2009 consolidated net sales.
Traditional Office Products. The Company is one of the largest national wholesale distributors of a broad range of office supplies. It carries about 20,000 brand-name and private label products, such as filing and record storage products, business machines, presentation products, writing instruments, paper products, shipping and mailing supplies, calendars and general office accessories. These products contributed approximately 27% of net sales during the year.
Janitorial and Breakroom Supplies. United is a leading wholesaler of janitorial and breakroom supplies throughout the U.S. The Company holds over 8,000 items in these lines: janitorial and breakroom supplies (cleaners and cleaning accessories), foodservice consumables (such as disposable cups, plates and utensils), safety and security items, and paper and packaging supplies. This product category provided about 24% of the latest year's net sales primarily from Lagasse, Inc. (Lagasse), a wholly owned subsidiary of USSC, and is the fastest growing category of the business.
Office Furniture. United is one of the largest office furniture wholesaler distributors in North America. It stocks approximately 4,500 products from more than 40 of the industry's leading manufacturers including, desks, filing and storage solutions, seating and systems furniture, along with a variety of products for niche markets such as education, government, healthcare and professional services. Innovative marketing programs and related services help drive this business across multiple customer channels. This product category represented approximately 8% of net sales for the year.
Industrial Supplies. USSC acquired ORS Nasco Holding, Inc. (ORS Nasco) in December 2007, and as a result, now stocks over 55,000 items including hand and power tools, safety and security supplies, janitorial equipment and supplies, other various industrial MRO (maintenance, repair and operations) items and oil field and welding supplies. In 2009, this product category accounted for roughly 5% of the Company's net sales.
The remaining 1% of the Company's consolidated net sales came from freight and advertising revenue.
1
United offers private brand products within each of its product categories to help resellers provide quality value-priced items to their customers. These include Innovera® technology products, Universal® office products, Windsoft® paper products, UniSan® janitorial and sanitation products, Alera® office furniture and Anchor Brand® in the welding, industrial, safety and oil field pipeline categories.
During 2009, private brand products accounted for about 14% of United's net sales.
Customers
United serves a diverse group of over 25,000 customers. They include independent office products dealers; contract stationers; office products superstores; computer products resellers; office furniture dealers; mass merchandisers; mail order companies; sanitary supply, paper and foodservice distributors; drug and grocery store chains; healthcare distributors; e-commerce merchants; oil field, welding supply and industrial/MRO distributors; and other independent distributors. The Company had one customer, Staples, that constituted 10.7% of its 2009 consolidated net sales. No other single customer accounted for more than 10% of 2009 consolidated net sales.
Sales to independent resellers—which include our United Stationers Supply, Lagasse and ORS Nasco resellers, as well as new channel customers—contributed approximately 84% of consolidated net sales. The Company provides these customers with value-added services designed to help them market their products and services while improving operating efficiencies and reducing costs. National accounts comprise about 16% of the Company's 2009 consolidated net sales.
Marketing and Customer Support
United's customers can purchase most of the products the Company distributes at similar prices from many other sources. Many reseller customers purchase their products from more than one source, frequently using "first call" and "second call" distributors. A "first call" distributor typically is a reseller's primary wholesaler and has the first opportunity to fill an order. If the "first call" distributor cannot meet the demand, or do so on a timely basis, the reseller will contact its "second call" distributor.
United's marketing and logistic capabilities differentiate the Company from its competitors by providing an unmatched level of value-added services to resellers:
- •
- A broad line of products for one-stop shopping;
- •
- Comprehensive printed product catalogs for easy shopping and reference guides;
- •
- A digital catalog and search capabilities to power e-commerce Web sites;
- •
- Extensive promotional materials and marketing programs to increase sales;
- •
- High levels of products in stock, with an average line fill rate better than 97% in 2009;
- •
- Efficient order processing, resulting in a 99.6% order accuracy rate for the year;
- •
- High-quality customer service from several state-of-the-art customer care
centers;
- •
- National distribution capabilities that enable next- to second-day delivery to the contiguous U.S.
and major cities in Mexico, providing a 98% on-time delivery rate in 2009;
- •
- Training programs designed to help resellers improve their operations;
- •
- End-consumer research to help resellers better understand their markets.
United's marketing programs emphasize two other major strategies. First, the Company produces product content that is used to populate an extensive array of print and electronic catalogs for commercial dealers, contract stationers and retail dealers. The printed catalogs usually are customized with each reseller's name, then sold to the resellers who, in turn, distribute them to their customers. The
2
Company markets its broad product offering primarily through General Line catalogs. These are available in both print and electronic versions and can include various selling prices (rather than the manufacturer's suggested retail price). In addition, the Company typically produces a number of promotional catalogs each quarter. United also develops separate monthly, quarterly and semi-annual flyers covering most of its product categories, including its private brand lines that offer a large selection of popular commodity products. Since catalogs and electronic content provide product exposure to end consumers and generate demand, United tries to maximize their distribution on behalf of its suppliers and customers.
Second, United provides its resellers with a variety of dealer support and marketing services. These programs are designed to help resellers differentiate themselves by making it easier for customers to buy from them, and often allow resellers to reach customers they had not traditionally served.
Resellers can place orders with the Company by phone, fax and e-mail and through a variety of electronic order entry systems. Electronic order entry systems allow resellers to forward their customers' orders directly to United, resulting in the delivery of pre-sold products to the reseller. In 2009, United received approximately 90% of its orders electronically.
Distribution
The Company uses a network of 64 distribution centers to provide about 100,000 items to over 25,000 reseller customers. This network, combined with the Company's depth and breadth of inventory in technology products, traditional office products, office furniture, janitorial and breakroom supplies, and industrial supplies, enables the Company to ship products on an overnight basis to more than 90% of the population of the U.S. and major cities in Mexico. United's domestic operations generated approximately $4.6 billion of its approximately $4.7 billion in 2009 consolidated net sales, with its international operations contributing another $0.1 billion to 2009 net sales.
Regional distribution centers are supplemented with 30 local distribution points across the U.S., which serve as re-distribution points for orders filled at the regional centers. United has a dedicated fleet of approximately 550 trucks, most of which are under contract to the Company. This enables United to make direct deliveries to resellers from regional distribution centers and local distribution points.
United's inventory locator system allows it to provide resellers with timely delivery of the products they order. If a reseller asks for an item that is out of stock at the nearest distribution center, the system has the capability to automatically search for the product at other facilities within the shuttle network. When the item is found, the alternate location coordinates shipping with the primary facility. For most resellers, the result is a single on-time delivery of all items. This system gives United added inventory support while minimizing working capital requirements. As a result, the Company can provide higher service levels to its reseller customers, reduce back orders, and minimize time spent searching for substitute merchandise. These factors contribute to a high order fill rate and efficient levels of inventory. To meet its delivery commitments and to maintain high order fill rates, United carries a significant amount of inventory, which contributes to its overall working capital requirements.
The "Wrap and Label" program is another important service for resellers. It gives resellers the option to receive individually packaged orders ready to be delivered to their end consumers. For example, when a reseller places orders for several individual consumers, United can pick and pack the items separately, placing a label on each package with the consumer's name, ready for delivery to the end consumer by the reseller. Resellers appreciate the "Wrap and Label" program because it eliminates the need to break down bulk shipments and repackage orders before delivering them to consumers.
In addition to providing value-adding programs for resellers, United also remains committed to reducing its operating costs. Its "War on Waste" (WOW2) program, which began in 2007, is meeting the goal of removing $100 million in costs over five years through a combination of new and continuing activities. In
3
addition, WOW2 includes process improvement and work simplification activities that will help increase efficiency throughout the business and improve customer satisfaction.
Purchasing and Merchandising
As a leading wholesale distributor of business products, United leverages its broad product selection as a key merchandising strategy. The Company orders products from over 1,000 manufacturers. This purchasing volume means United receives substantial supplier allowances and can realize significant economies of scale in its logistics and distribution activities. In 2009, United's largest supplier was Hewlett-Packard Company, which represented approximately 20% of its total purchases.
The Company's Merchandising Department is responsible for selecting merchandise and for managing the entire supplier relationship. Product selection is based on three factors: end-consumer acceptance; anticipated demand for the product; and the manufacturer's total service, price and product quality. As part of its effort to create an integrated supplier approach, United introduced the "Preferred Supplier Program." In exchange for working closely with United to reduce overall supply chain costs, participating suppliers' products are treated as preferred brands in the Company's marketing efforts.
Competition
There is only one other nationwide broad line office products wholesale distributor in North America. United and this firm compete on the basis of breadth of product lines, availability of products, speed of delivery to resellers, order fill rates, net pricing to resellers, and the quality of marketing and other value-added services.
The Company also competes with specialty distributors of office products, office furniture, technology products, janitorial and breakroom supplies and industrial supplies. These distributors typically offer more limited product lines and compete nationally, regionally or locally. In most cases, competition is based primarily upon net pricing, minimum order quantity, speed of delivery, and value-added marketing and logistics services.
The Company also competes with manufacturers who often sell their products directly to resellers and may offer lower prices. United believes that it provides an attractive alternative to manufacturer direct purchases by offering a combination of value-added services, including 1) Wrap and Label capabilities, 2) marketing and catalog programs, 3) same- to second-day delivery, 4) a broad line of business products from multiple manufacturers on a "one-stop shop" basis, and 5) lower minimum order quantities.
Seasonality
United's sales generally are relatively steady throughout the year. However, sales also reflect seasonal buying patterns for consumers of office products. In particular, the Company's sales of office products usually are higher than average during January, when many businesses begin operating under new annual budgets and release previously deferred purchase orders. Janitorial and breakroom supplies sales are somewhat higher in the summer months. Industrial supplies sales are somewhat higher in summer months as well.
Employees
As of February 23, 2010, United employed approximately 5,700 people.
Management believes it has good relations with its associates. Approximately 570 of the shipping, warehouse and maintenance associates at certain of the Company's Baltimore, Los Angeles and New Jersey distribution centers are covered by collective bargaining agreements. In 2009, United successfully renegotiated the collective bargaining agreement with associates in the Baltimore
4
distribution center. The bargaining agreements in the Los Angeles and New Jersey distribution centers are scheduled to expire in 2011. The Company has not experienced any work stoppages during the past five years.
Availability of the Company's Reports
The Company's principal Web site address is www.unitedstationers.com. This site provides United's Annual Reports on Form 10-K, Quarterly Reports on Form 10-Q and Current Reports on Form 8-K—as well as amendments and exhibits to those reports filed or furnished under Section 13(a) or 15(d) of the Securities Exchange Act of 1934 (the "Exchange Act") for free as soon as reasonably practicable after they are electronically filed with, or furnished to, the Securities and Exchange Commission (SEC). In addition, copies of these filings (excluding exhibits) may be requested at no cost by contacting the Investor Relations Department:
United
Stationers Inc.
Attn: Investor Relations Department
One Parkway North Boulevard
Suite 100
Deerfield, IL 60015-2559
Telephone: (847) 627-7000
E-mail: IR@ussco.com
5
Any of the risks described below could have a material adverse effect on the Company's business, financial condition or results of operations. These risks are not the only risks facing United; the Company's business operations could also be materially adversely affected by risks and uncertainties that are not presently known to United or that United currently deems immaterial.
United's operating results depend on the strength of the general economy.
The customers that United serves are affected by changes in economic conditions outside the Company's control, including national, regional and local slowdowns in general economic activity and job markets. Demand for the products and services the Company offers, particularly in office products, technology and furniture, is affected by the number of white collar and other workers employed by the businesses United's customers serve. An interruption of growth in these markets or a general economic downturn, together with the negative effect this has on the number of workers employed, may adversely affect United's business, financial condition and results of operations.
United may not achieve its cost-reduction and margin enhancement goals.
United has set goals to improve its profitability over time by reducing expenses and growing sales to existing and new customers. There can be no assurance that United will achieve its enhanced profitability goals. Factors that could have a significant effect on the Company's efforts to achieve these goals include the following:
- •
- Inability to achieve the Company's annual "War on Waste" (WOW2) initiatives to reduce expenses and improve
productivity and quality;
- •
- Impact on gross margin from competitive pricing pressures;
- •
- Failure to maintain or improve the Company's sales mix between lower margin and higher margin products;
- •
- Inability to pass along cost increases from United's suppliers to its customers;
- •
- Failure to increase sales of United's private brand products; and
- •
- Failure of customers to adopt the Company's product pricing and marketing programs.
The loss of a significant customer could significantly reduce United's revenues and profitability.
United's top five customers accounted for approximately 25% of the Company's 2009 net sales. The loss of one or more key customers, changes in the sales mix or sales volume to key customers, a significant downturn in the business or financial condition of any of them or the failure of any of them to timely pay all amounts due United could significantly reduce United's sales and profitability.
United's financial condition and results of operation depend on the availability of financing sources to meet its business needs.
The Company depends on various external financing sources to fund its operating, investing, and financing activities. The Company's financing agreements include covenants by the Company to maintain certain financial ratios and comply with other obligations. If the Company violates a covenant or otherwise defaults on its obligations under a financing agreement, the Company's lenders may refuse to extend additional credit, demand repayment of outstanding indebtedness and terminate the financing agreements. See "Management's Discussion and Analysis of Financial Condition and Results of Operations—Liquidity and Capital Resources—General" included below under Item 7.
6
One of the Company's external financing sources is a receivables securitization program that is dependent on back-up liquidity facilities that must be renewed annually. The Company's other primary external financing sources terminate or mature in two to four years. If the Company defaults on its obligations under a financing agreement or is unable to obtain or renew financing sources on commercially reasonable terms, its business and financial condition could be materially adversely affected.
United's reliance on supplier allowances and promotional incentives could impact profitability.
Supplier allowances and promotional incentives that are often based on volume contribute significantly to United's profitability. If United does not comply with suppliers' terms and conditions, or does not make requisite purchases to achieve certain volume hurdles, United may not earn certain allowances and promotional incentives. In addition, if United's suppliers reduce or otherwise alter their allowances or promotional incentives, United's profit margin for the sale of the products it purchases from those suppliers may be harmed. The loss or diminution of supplier allowances and promotional support could have an adverse effect on the Company's results of operation.
United relies on independent dealers for a significant percentage of its net sales.
Sales to independent office product dealers and janitorial and sanitation distributors account for a significant portion of United's net sales. Independent dealers and distributors compete with national retailers that have substantially greater financial resources and technical and marketing capabilities. Over the years, several of the Company's independent dealer and distributor customers have been acquired by national retailers. If United's customer base of independent dealers and distributors declines, the Company's business and results of operations may be adversely affected.
United operates in a competitive environment.
The Company operates in a competitive environment. Competition is based largely upon service capabilities and price, as the Company's competitors are wholesalers that offer products that are the same as or similar to the products the Company offers to the same customers or potential customers. United also faces competition from some of its own suppliers, which sell their products directly to United's customers. The Company's financial condition and results of operations depend on its ability to compete effectively on price, product selection and availability, marketing support, logistics and other ancillary services.
The loss of key suppliers or supply chain disruptions could decrease United's revenues and profitability.
United believes its ability to offer a combination of well-known brand name products, competitively-priced private brand products, and support services is an important factor in attracting and retaining customers. The Company's ability to offer a wide range of products and services is dependent on obtaining adequate product supply and services from manufacturers or other suppliers. United's agreements with its suppliers are generally terminable by either party on limited notice. The loss of, or a substantial decrease in the availability of products or services from key suppliers at competitive prices could cause the Company's revenues and profitability to decrease. In addition, supply interruptions could arise due to transportation disruptions, labor disputes or other factors beyond United's control. Disruptions in United's supply chain could result in a decrease in revenues and profitability.
7
United must manage inventory effectively in order to maximize supplier allowances while minimizing excess and obsolete inventory.
To maximize supplier allowances and minimize excess and obsolete inventory, United must project end-consumer demand for over 100,000 SKUs in stock. If United underestimates demand for a particular manufacturer's products, the Company will lose sales, reduce customer satisfaction, and earn a lower level of allowances from that manufacturer. If United overestimates demand, it may have to liquidate excess or obsolete inventory at a loss.
United is focusing on increasing its sales of private brand products. These products can present unique inventory challenges. United sources many of its private brand products overseas, resulting in longer order-lead times than for comparable products sourced domestically. These longer lead-times make it more difficult to forecast demand accurately and require larger inventory investments to support high service levels. In addition, United generally does not have the right to return excess inventory of private brand products to the manufacturers.
A significant disruption or failure of the Company's existing information technology systems or in its implementation of new information technology systems could disrupt United's business and result in increased costs and decreased revenues.
The Company relies on information technology in all aspects of its business, including managing and replenishing inventory, filling and shipping customer orders, and coordinating sales and marketing activities. Many of the Company's software applications are legacy systems, including order entry, order processing, pricing, billing, returns and credits, and inventory receiving and control. The Company is building and implementing new applications to replace some of the legacy systems and to provide new services to customers. Interruptions in the proper functioning of the Company's information systems or delays in implementing new systems could disrupt United's business and result in increased costs and decreased revenue. A significant disruption or failure of the Company's existing information technology systems or in the Company's development and implementation of new systems could put it at a competitive disadvantage and could adversely affect its results of operations.
United may not be successful in identifying, consummating and integrating future acquisitions.
Historically, part of United's growth and expansion into new product categories or markets has come from targeted acquisitions. Going forward, United may not be able to identify attractive acquisition candidates or complete the acquisition of any identified candidates at favorable prices and upon advantageous terms and conditions. Furthermore, competition for attractive acquisition candidates may limit the number of acquisition candidates or increase the overall costs of making acquisitions. Acquisitions involve significant risks and uncertainties, including difficulties integrating acquired business systems and personnel with United's business; the potential loss of key employees, customers or suppliers; the assumption of liabilities and exposure to unforeseen liabilities of acquired companies; the difficulties in achieving target synergies; and the diversion of management attention and resources from existing operations. Difficulties in identifying, completing or integrating acquisitions could impede United's revenues, profitability and net worth.
The Company relies heavily on its key executives and the loss of one or more of these individuals could harm the Company's ability to carry out its business strategy.
United's ability to implement its business strategy depends largely on the efforts, skills, abilities and judgment of the Company's executive management team. United's success also depends to a significant degree on its ability to recruit and retain sales and marketing, operations and other senior managers. The Company may not be successful in attracting and retaining these employees, which may in turn have an adverse effect on the Company's results of operations and financial condition.
8
Unexpected events could disrupt normal business operations, which might result in increased costs and decreased revenues.
Unexpected events, such as hurricanes, fire, war, terrorism, and other natural or man-made disruptions, may increase the cost of doing business or otherwise impact United's financial performance. In addition, damage to or loss of use of significant aspects of the Company's infrastructure due to such events could have an adverse affect on the Company's operating results and financial condition.
ITEM 1B. UNRESOLVED COMMENT LETTERS.
None.
The Company considers its properties to be suitable with adequate capacity for their intended uses. The Company evaluates its properties on an ongoing basis to improve efficiency and customer service and leverage potential economies of scale. Substantially all owned facilities are subject to liens under USSC's debt agreements (see the information under the caption "Liquidity and Capital Resources" included below under Item 7). As of December 31, 2009, these properties consisted of the following:
Offices. The Company leases approximately 205,000 square feet for its corporate headquarters in Deerfield, Illinois. Additionally the Company owns 49,000 square feet of office space in Orchard Park, New York and leases 13,000 square feet of office space in Tulsa, Oklahoma and 20,000 square feet in Muskogee, Oklahoma.
Distribution Centers. The Company utilizes 64 distribution centers totaling approximately 12.4 million square feet of warehouse space. Of the 12.4 million square feet of distribution center space, 2.1 million square feet is owned and 10.3 million square feet is leased.
9
The Company is involved in legal proceedings arising in connection with its business. The Company is not involved in any legal proceedings that it believes will result, individually or in the aggregate, in a material adverse effect upon its financial condition or results of operations.
ITEM 4. SUBMISSION OF MATTERS TO A VOTE OF SECURITY HOLDERS.
No matters were submitted to a vote of security holders during the fourth quarter of 2009.
EXECUTIVE OFFICERS OF THE REGISTRANT (as of February 23, 2010)
The executive officers of the Company are as follows:
Name, Age and Position with the Company |
Business Experience | |
|---|---|---|
Richard W. Gochnauer |
Richard W. Gochnauer became the Company's President and Chief Executive Officer in December 2002, after joining the Company as its Chief Operating Officer and as a Director in July 2002. From 1994 until he joined the Company, Mr. Gochnauer held the positions of Vice Chairman and President, International, and President and Chief Operating Officer of Golden State Foods, a privately-held food company that manufactures and distributes food and paper products. Prior to that, he served as Executive Vice President of the Dial Corporation, with responsibility for its household and laundry consumer products businesses. | |
S. David Bent |
S. David Bent was named as the Company's Senior Vice President, e Business Services and Corporate Chief Information officer in July 2009. He joined the Company as its Senior Vice President and Chief Information Officer in May 2003. From August 2000 until such time, Mr. Bent served as the Corporate Vice President and Chief Information Officer of Acterna Corporation, a multi-national telecommunications test equipment and services company, and also served as General Manager of its Software Division from October 2002. Previously, he spent 18 years with the Ford Motor Company. During his Ford tenure, Mr. Bent most recently served during 1999 and 2000 as the Chief Information Officer of Visteon Automotive Systems, a tier one automotive supplier, and from 1998 through 1999 as its Director, Enterprise Processes and Systems. |
|
Eric A. Blanchard |
Eric A. Blanchard has served as the Company's Senior Vice President, General Counsel and Secretary since January 2006. From November 2002 until December 2006 he served as the Vice President, General Counsel and Secretary at Tennant Company. Previously Mr. Blanchard was with Dean Foods Company where he held the positions of Chief Operating Officer, Dairy Division from January 2002 to October 2002, Vice President and President, Dairy Division from 1999 to 2002 and General Counsel and Secretary from 1988 to 1999. |
10
Name, Age and Position with the Company |
Business Experience | |
|---|---|---|
Barbara J. Kennedy |
Barbara J. Kennedy has been United Stationers' Senior Vice President, Human Resources since August 2008. Before she joined the Company, Ms. Kennedy held various human resources management positions, serving most recently as Executive Vice President, Human Resources, Safety, Recruiting and Driver Services for Swift Transportation. Prior to joining Swift, she served as Vice President, Human Resources at Barr-Nunn Transportation. |
|
Kenneth M. Nickel |
Kenneth M. Nickel has been the Company's Vice President, Controller and Chief Accounting Officer since February 2007. Prior to that, Mr. Nickel served as the Company's Vice President and Controller from November 2002 to February 2007, as its Vice President and Field Support Center Controller from November 2001 to October 2002 and as its Vice President and Assistant Controller from April 2001 to October 2001. Mr. Nickel has been with the Company since November 1989 and has held progressively more responsible accounting positions within the Company's Finance department. |
|
P. Cody Phipps |
P. Cody Phipps has served as the Company's President, United Stationers Supply since October 2006. He joined the Company in August 2003 as its Senior Vice President, Operations. Prior to joining the Company, Mr. Phipps was a partner at McKinsey & Company, Inc., a global management consulting firm. During his tenure at McKinsey from and after 1990, he became a leader in the firm's North American Operations Effectiveness Practice and co-founded and led its Service Strategy and Operations Initiative, which focused on driving significant operational improvements in complex service and logistics environments. Prior to joining McKinsey, Mr. Phipps worked as a consultant with The Information Consulting Group, a systems consulting firm, and as an IBM account marketing representative. |
|
Victoria J. Reich |
Victoria J. Reich joined the Company in June 2007 as its Senior Vice President and Chief Financial Officer. Prior to joining the Company, Ms. Reich spent ten years with Brunswick Corporation where she most recently was President of Brunswick European Group from August 2003 until June 2006. She served as Brunswick's Senior Vice President and Chief Financial Officer from 2000 to 2003 and as Vice President and Controller from 1996 until 2000. Before joining Brunswick, Ms. Reich spent 17 years at General Electric Company where she held various financial management positions. |
11
Name, Age and Position with the Company |
Business Experience | |
|---|---|---|
Stephen A. Schultz |
Stephen A. Schultz was appointed to the position of Group President, Lagasse and ORS Nasco in September 2008. Prior to this appointment, he held the position of President, Lagasse, Inc., a wholly owned subsidiary of USSC, from August 2001. In October 2003, he assumed the additional position of Senior Vice President, Category Management-Janitorial/Sanitation, of the Company. Mr. Schultz joined Lagasse in early 1999 as Vice President, Marketing and Business Development, and became a Senior Vice President of Lagasse in late 2000. Before joining Lagasse, he served for nearly 10 years in various executive sales and marketing roles for Hospital Specialty Company, a manufacturer and distributor of hygiene products for the institutional janitorial and sanitation industry. |
Executive officers are elected by the Board of Directors. Except as required by individual employment agreements between executive officers and the Company, there exists no arrangement or understanding between any executive officer and any other person pursuant to which such executive officer was elected. Each executive officer serves until his or her successor is appointed and qualified or until his or her earlier removal or resignation.
12
ITEM 5. MARKET FOR REGISTRANT'S COMMON EQUITY, RELATED STOCKHOLDER MATTERS AND ISSUER PURCHASES OF EQUITY SECURITIES.
Common Stock Information
USI's common stock is quoted through the NASDAQ Global Select Market ("NASDAQ") under the symbol USTR. The following table shows the high and low closing sale prices per share for USI's common stock as reported by NASDAQ:
| |
High | Low | |||||
|---|---|---|---|---|---|---|---|
2009 |
|||||||
First Quarter |
$ | 34.26 | $ | 18.49 | |||
Second Quarter |
39.00 | 28.44 | |||||
Third Quarter |
49.25 | 34.57 | |||||
Fourth Quarter |
58.03 | 45.04 | |||||
2008 |
|||||||
First Quarter |
$ | 57.14 | $ | 43.01 | |||
Second Quarter |
49.91 | 36.56 | |||||
Third Quarter |
52.01 | 34.20 | |||||
Fourth Quarter |
47.42 | 28.39 | |||||
On February 23, 2010, the closing sale price of Company's common stock as reported by NASDAQ was $56.38 per share. On February 23, 2010, there were approximately 737 holders of record of common stock. A greater number of holders of USI common stock are "street name" or beneficial holders, whose shares are held of record by banks, brokers and other financial institutions.
13
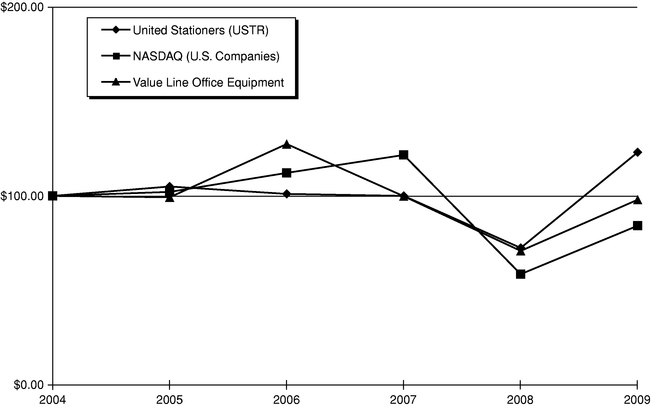
Stock Performance Graph
The following graph compares the performance of the Company's common stock over a five-year period with the cumulative total returns of (1) The NASDAQ Stock Market Index (U.S. companies), and (2) a group of companies included within Value Line's Office Equipment Industry Index. The graph assumes $100 was invested on December 31, 2004 in the Company's common stock and in each of the indices and assumes reinvestment of all dividends (if any) at the date of payment. The following stock price performance graph is presented pursuant to SEC rules and is not meant to be an indication of future performance.
| |
2004 | 2005 | 2006 | 2007 | 2008 | 2009 | |||||||||||||
|---|---|---|---|---|---|---|---|---|---|---|---|---|---|---|---|---|---|---|---|
United Stationers (USTR) |
$ | 100.00 | $ | 104.98 | $ | 101.06 | $ | 100.02 | $ | 72.49 | $ | 123.12 | |||||||
NASDAQ (U.S. Companies) |
$ | 100.00 | $ | 102.13 | $ | 112.19 | $ | 121.66 | $ | 58.61 | $ | 84.24 | |||||||
Value Line Office Equipment |
$ | 100.00 | $ | 99.28 | $ | 127.47 | $ | 99.84 | $ | 70.92 | $ | 98.00 | |||||||
Common Stock Repurchases
As of December 31, 2009, the Company had $100.9 million under share repurchase authorizations from its Board of Directors. The Company did not repurchase any common stock during 2009.
Purchases may be made from time to time in the open market or in privately negotiated transactions. Depending on market and business conditions and other factors, the Company may continue or suspend purchasing its common stock at any time without notice.
Acquired shares are included in the issued shares of the Company and treasury stock, but are not included in average shares outstanding when calculating earnings per share data.
Dividends
The Company's policy has been to reinvest earnings to enhance its financial flexibility and to fund future growth. Accordingly, USI has not paid cash dividends and has no plans to declare cash dividends on its common stock at this time. Furthermore, as a holding company, USI's ability to pay cash dividends in the
14
future depends upon the receipt of dividends or other payments from its operating subsidiary, USSC. The Company's debt agreements impose limited restrictions on the payment of dividends. For further information on the Company's debt agreements, see "Management's Discussion and Analysis of Financial Condition and Results of Operations—Liquidity and Capital Resources" in Item 7, and Note 9 to the Consolidated Financial Statements included in Item 8 of this Annual Report.
Securities Authorized for Issuance under Equity Compensation Plans
The information required by Item 201(d) of Regulation S-K (Securities Authorized for Issuance under Equity Compensation Plans) is included in Item 12 of this Annual Report.
15
ITEM 6. SELECTED FINANCIAL DATA.
The selected consolidated financial data of the Company for the years ended December 31, 2005 through 2009 have been derived from the Consolidated Financial Statements of the Company, which have been audited by Ernst & Young LLP, an independent registered public accounting firm. The adoption of new accounting pronouncements, changes in certain accounting policies, reclassifications of discontinued operations and certain other reclassifications are reflected in the financial information presented below. The selected consolidated financial data below should be read in conjunction with, and is qualified in its entirety by, Management's Discussion and Analysis of Financial Condition and Results of Operations and the Consolidated Financial Statements of the Company included in Items 7 and 8, respectively, of this Annual Report. Except for per share data, all amounts presented are in thousands:
| |
Years Ended December 31,(1) | ||||||||||||||||
|---|---|---|---|---|---|---|---|---|---|---|---|---|---|---|---|---|---|
| |
2009 | 2008 | 2007 | 2006(2) | 2005 | ||||||||||||
Income Statement Data: |
|||||||||||||||||
Net sales |
$ | 4,710,291 | $ | 4,986,878 | $ | 4,646,399 | $ | 4,546,914 | $ | 4,279,089 | |||||||
Cost of goods sold |
4,019,650 | 4,246,199 | 3,939,684 | 3,792,833 | 3,637,065 | ||||||||||||
Gross profit |
690,641 | 740,679 | 706,715 | 754,081 | 642,024 | ||||||||||||
Operating expenses: |
|||||||||||||||||
Warehousing, marketing and administrative expenses |
499,659 | 548,222 | 502,810 | 516,234 | 471,193 | ||||||||||||
Restructuring, severance and other charges (reversals), net(3) |
3,354 | — | 1,378 | 1,941 | (1,331 | ) | |||||||||||
Total operating expenses |
503,013 | 548,222 | 504,188 | 518,175 | 469,862 | ||||||||||||
Operating Income |
187,628 | 192,457 | 202,527 | 235,906 | 172,162 | ||||||||||||
Interest expense |
(27,797 | ) | (28,563 | ) | (13,109 | ) | (8,276 | ) | (3,050 | ) | |||||||
Interest income |
474 | 1,048 | 1,197 | 970 | 342 | ||||||||||||
Other expense, net(4) |
(204 | ) | (8,079 | ) | (14,595 | ) | (12,786 | ) | (7,035 | ) | |||||||
Income from continuing operations before income taxes |
160,101 | 156,863 | 176,020 | 215,814 | 162,419 | ||||||||||||
Income tax expense |
59,116 | 58,449 | 68,825 | 80,510 | 60,949 | ||||||||||||
Income from continuing operations |
100,985 | 98,414 | 107,195 | 135,304 | 101,470 | ||||||||||||
Loss from discontinued operations, net of tax |
— | — | — | (3,091 | ) | (3,969 | ) | ||||||||||
Net income |
$ | 100,985 | $ | 98,414 | $ | 107,195 | $ | 132,213 | $ | 97,501 | |||||||
Net income per share—basic: |
|||||||||||||||||
Income from continuing operations |
$ | 4.32 | $ | 4.17 | $ | 3.92 | $ | 4.37 | $ | 3.08 | |||||||
Loss from discontinued operations, net of tax |
— | — | — | (0.10 | ) | (0.12 | ) | ||||||||||
Net income per common share—basic |
$ | 4.32 | $ | 4.17 | $ | 3.92 | $ | 4.27 | $ | 2.96 | |||||||
Net income per share—diluted: |
|||||||||||||||||
Income from continuing operations |
$ | 4.19 | $ | 4.13 | $ | 3.83 | $ | 4.31 | $ | 3.02 | |||||||
Loss from discontinued operations, net of tax |
— | — | — | (0.10 | ) | (0.12 | ) | ||||||||||
Net income per common share—diluted |
$ | 4.19 | $ | 4.13 | $ | 3.83 | $ | 4.21 | $ | 2.90 | |||||||
Cash dividends declared per share |
$ | — | $ | — | $ | — | $ | — | $ | — | |||||||
Balance Sheet Data: |
|||||||||||||||||
Working capital(5) |
$ | 721,503 | $ | 807,631 | $ | 543,258 | $ | 551,556 | $ | 421,005 | |||||||
Total assets(5) |
1,808,516 | 1,881,516 | 1,765,555 | 1,560,355 | 1,550,545 | ||||||||||||
Total debt(6) |
441,800 | 663,100 | 451,000 | 117,300 | 21,000 | ||||||||||||
Total stockholders' equity |
706,713 | 565,638 | 574,254 | 800,940 | 768,512 | ||||||||||||
Statement of Cash Flows Data: |
|||||||||||||||||
Net cash provided by (used in) operating activities |
$ | 239,395 | $ | (129,305 | ) | $ | 218,054 | $ | 13,994 | $ | 236,067 | ||||||
Net cash used in investing activities |
(14,829 | ) | (28,366 | ) | (197,898 | ) | (18,624 | ) | (171,748 | ) | |||||||
Net cash (used in) provided by financing activities |
(216,667 | ) | 146,430 | (13,188 | ) | 2,198 | (62,680 | ) | |||||||||
- (1)
- Certain prior period amounts have been reclassified to conform to the current presentation. Such reclassifications were limited to Balance Sheet and Cash Flow Statement presentation and did not impact the Statements of Income. Specifically, the Company reclassified capitalized software costs from "Other Assets" to "Property, Plant and Equipment" beginning in the first quarter of 2006, with prior periods updated to conform to this presentation. For the year ended December 31, 2005,
16
$17.0 million in operating cash outflows were reclassified as cash outflows from investing activities. The reclassification of capitalized software also resulted in a reclassification from "Other Assets" to "Property, Plant and Equipment" for 2005 of $17.0 million. Additionally, the Company reclassified certain offsets to "Accrued Liabilities" related to merchandise return reserves to "Inventory". This reclassification began in the fourth quarter of 2007, with prior periods updated to conform to this presentation. For the years ended December 31, 2006 and 2005, $7.0 million and $8.3 million, respectively, were reclassified to "Inventory" out of "Accrued Liabilities" with corresponding changes made to the Statement of Cash Flows within "Cash Flows From Operating Activities".
- (2)
- In
2006, the Company recorded $60.6 million, or $1.21 per diluted share in favorable benefits from the Company's product content syndication program
and certain marketing program changes.
- (3)
- Reflects
severance and restructuring charges in the following years: 2009—$3.4 million
severance charge. 2007—$1.4 million charge for the 2006 Workforce Reduction Program.
2006—$6.0 million charge for the 2006 Workforce Reduction Program, partially offset by a $4.1 million reversal of previously established restructuring
reserves. 2005—$1.3 million reversal of previously established restructuring reserves.
- (4)
- Primarily
represents the loss on the sale of certain trade accounts receivable through the Company's Prior Receivables Securitization Program. For further
information on the Company's Prior Receivables Securitization Program, see "Management's Discussion and Analysis of Financial Condition and Results of Operations—Off-Balance
Sheet Arrangements—Prior Receivables Securitization Program" under Item 7 of this Annual Report.
- (5)
- In
accordance with Generally Accepted Accounting Principles ("GAAP"), total assets exclude $23.0 million in 2008, $248.0 million in 2007, and
$225.0 million in 2006 and 2005 of certain trade accounts receivable sold through the Company's Prior Receivables Securitization Program. For further information on the Company's Prior
Receivables Securitization Program, see "Management's Discussion and Analysis of Financial Condition and Results of Operations—Off-Balance Sheet Arrangements—Prior
Receivables Securitization Program" under Item 7 of this Annual Report.
- (6)
- Total debt includes current maturities.
FORWARD LOOKING INFORMATION
This Annual Report on Form 10-K contains "forward-looking statements" within the meaning of Section 27A of the Securities Act of 1933 and Section 21E of the Exchange Act. Forward-looking statements often contain words such as "expects", "anticipates", "estimates", "intends", "plans", "believes", "seeks", "will", "is likely", "scheduled", "positioned to", "continue", "forecast", "predicting", "projection", "potential" or similar expressions. Forward-looking statements include references to goals, plans, strategies, objectives, projected costs or savings, anticipated future performance, results or events and other statements that are not strictly historical in nature. These forward-looking statements are based on management's current expectations, forecasts and assumptions. This means they involve a number of risks and uncertainties that could cause actual results to differ materially from those expressed or implied here. These risks and uncertainties include, without limitation, those set forth above under the heading "Risk Factors."
Readers should not place undue reliance on forward-looking statements contained in this Annual Report on Form 10-K. The forward-looking information herein is given as of this date only, and the Company undertakes no obligation to revise or update it.
17
ITEM 7. MANAGEMENT'S DISCUSSION AND ANALYSIS OF FINANCIAL CONDITION AND RESULTS OF OPERATIONS.
The following discussion should be read in conjunction with both the information at the end of Item 6 of this Annual Report on Form 10-K appearing under the caption, "Forward Looking Information", and the Company's Consolidated Financial Statements and related notes contained in Item 8 of this Annual Report.
Overview and Recent Results
The Company is a leading wholesale distributor of business products, with 2009 net sales of approximately $4.7 billion. The Company sells its products through a national distribution network of 64 distribution centers to over 25,000 resellers, who in turn sell directly to end consumers.
Key Company and Industry Trends
The following is a summary of selected trends, events or uncertainties that the Company believes may have a significant impact on its future performance.
- •
- Despite modestly improved market conditions which led to a slight increase in sales during the fourth quarter of 2009,
business conditions remain mixed and uncertain as evidenced by continued high unemployment, recovering industrial production trends and an improving gross domestic product. However, it appears that
job growth and industrial production may still be slow to recover. As a result, the Company remains cautious entering 2010.
- •
- Total Company sales for 2009 declined by a workday adjusted 5.2%, reflecting one less selling day in 2009, to just over
$4.7 billion. Janitorial and breakroom supplies experienced 6.5% growth, buoyed by sales of products used in response to the H1N1 flu. This improvement was more than offset by a 29% decline in
furniture and a 23% drop in industrial supplies. The pace of the sales decline in these categories eased within the latter part of the year. Technology product sales and office product sales declined
2% and 4%, respectively on a workday adjusted basis with sequential improvements seen in the latter part of the year as well.
- •
- Gross margin as a percent of sales for 2009 was 14.7% versus 14.9% in 2008. The gross margin rate in 2009 was negatively
impacted by declines of 20 basis points (bps) due to reduced pricing margin resulting from a less favorable sales product mix, 15 bps from the effects of lower product cost inflation throughout
2009 versus 2008, and 15 bps in lower supplier allowances due to reduced purchasing activity. These declines were partially offset by 30 bps in freight-related components as lower fuel
costs and cost containment initiatives drove favorability in this margin component.
- •
- The Company has set margin management as a primary focus for 2010 as margin pressures are expected in several areas. In
particular, low product cost inflation, especially when compared to high inflation in the first quarter of 2009, is expected to negatively affect margins versus the prior year. In addition, margin
pressure may result from a product mix that continues to be skewed towards value-oriented consumables. Offsetting these margin pressures will be leverage from expected sales growth, WOW2
cost reductions, price management, and marketing programs to earn additional supplier allowances.
- •
- Operating expenses in 2009 were $503.0 million or 10.7% as a percent of sales for the year compared to $548.2 million or 11.0% in 2008. Included in 2009 operating expenses are a $14 million gain related to a negotiated settlement with a service supplier and a $3.4 million severance charge. Operating expenses in 2008 include a $9.8 million gain on the sale of three buildings and a $6.7 million asset impairment charge. Excluding these items operating expenses declined 7% and were 10.9% of sales versus 11.1% in the prior year. The decline is due to reduced
18
- •
- Cost containment and operating leverage will be another key area of focus in 2010 in order to help offset the reversal of
approximately $20 million in compensation and other short-term cost reduction actions taken in 2009. The Company will carefully manage the restoration of these costs dependent on
the Company's performance in 2010. This will occur while the Company continues to invest in key growth strategies and innovative services including e-business capabilities. As a result,
the WOW2 savings plan will be aggressive again in 2010 as the Company strives to gain optimal expense leverage from expected sales growth.
- •
- Operating cash flows for 2009 were $239.4 million versus a use of $129.3 million in 2008. Adjusted to
exclude the effects of accounts receivable sold under the Receivables Securitization Program, the Company's operating cash flows increased to a source of $262.4 million in 2009 from
$95.7 million in 2008. This increase reflects the impacts of lower inventory requirements to support lower sales and effective working capital management particularly in inventories and
payables.
- •
- During 2009, the Company did not repurchase any shares of common stock under its publicly announced share repurchase programs. As of February 23, 2010, the Company had approximately $100.9 million remaining of its existing share repurchase authorizations from the Board of Directors.
salaries and wages as a percent of sales of 5 bps, lower bad debt costs of 7 bps, and reduced discretionary expenses of 25 bps, partially offset by increased healthcare costs of 10 bps and 5 bps of expenses related to the Company's continued execution of its plan to expand ORS Nasco's presence to 18 key markets by leveraging existing company distribution centers.
Critical Accounting Policies, Judgments and Estimates
The Company's significant accounting policies are more fully described in Note 2 of the Consolidated Financial Statements. As described in Note 2, the preparation of financial statements in conformity with U.S. GAAP requires management to make estimates and assumptions about future events that affect the amounts reported in the financial statements and accompanying notes. Future events and their effects cannot be determined with absolute certainty. Therefore, the determination of estimates requires the exercise of judgment. Actual results may differ from those estimates. The Company believes that such differences would have to vary significantly from historical trends to have a material impact on the Company's financial results.
The Company's critical accounting policies are most significant to the Company's financial condition and results of operations and require especially difficult, subjective or complex judgments or estimates by management. In most cases, critical accounting policies require management to make estimates on matters that are uncertain at the time the estimate is made. The basis for the estimates is historical experience, terms of existing contracts, observance of industry trends, information provided by customers or vendors, and information available from other outside sources, as appropriate. These critical accounting policies include the following:
Supplier Allowances
Supplier allowances (fixed and variable) are common practice in the business products industry and have a significant impact on the Company's overall gross margin. Gross margin is determined by, among other items, file margin (determined by reference to invoiced price), as reduced by estimated customer discounts and rebates as discussed below, and increased by estimated supplier allowances and promotional incentives. These allowances and incentives are estimated on an ongoing basis and the potential variation between the actual amount of these margin contribution elements and the Company's estimates of them could be material to its financial results. Reported results include management's current estimate of such allowances and incentives.
19
In 2009, approximately 17% of the Company's estimated annual supplier allowances and incentives were fixed, based on supplier participation in various Company advertising and marketing publications. Fixed allowances and incentives are taken to income through lower cost of goods sold as inventory is sold.
The remaining 83% of the Company's estimated supplier allowances and incentives in 2009 were variable, based on the volume and mix of the Company's product purchases from suppliers. These variable allowances are recorded based on the Company's annual inventory purchase volumes and product mix and are included in the Company's Consolidated Financial Statements as a reduction to cost of goods sold, thereby reflecting the net inventory purchase cost. Supplier allowances and incentives attributable to unsold inventory are carried as a component of net inventory cost. The potential amount of variable supplier allowances often differs based on purchase volumes by supplier and product category. As a result, lower Company sales volume (which reduce inventory purchase requirements) and product sales mix changes (primarily because higher-margin products often benefit from higher supplier allowance rates) can make it difficult to reach supplier allowance goals.
Customer Rebates
Customer rebates and discounts are common in the business products industry and have a significant impact on the Company's overall sales and gross margin. Such rebates are reported in the Consolidated Financial Statements as a reduction of sales.
Customer rebates include volume rebates, sales growth incentives, advertising allowances, participation in promotions and other miscellaneous discount programs. These rebates are paid to customers monthly, quarterly and/or annually. Volume rebates and growth incentives are based on the Company's annual sales volumes to its customers. The aggregate amount of customer rebates depends on product sales mix and customer mix changes.
Revenue Recognition
Revenue is recognized when a service is rendered or when title to the product has transferred to the customer. Management establishes a reserve and records an estimate for future product returns related to revenue recognized in the current period. This estimate requires management to make certain estimates and judgments, including estimating the amount of future returns of products sold in the current period. This estimate is based on historical product-return trends and the loss of gross margin associated with those returns. This methodology involves some risk and uncertainty due to its dependence on historical information for product returns and gross margins to record an estimate of future product returns. If actual product returns on current period sales differ from historical trends, the amounts estimated for product returns (which reduce net sales) for the period may be overstated or understated, causing actual results of operations or financial condition to differ from those expected.
Valuation of Accounts Receivable
To determine an estimate for an allowance for doubtful accounts, the Company makes judgments as to the collectability of accounts receivable based on historical trends and future expectations. This allowance adjusts gross trade accounts receivable downward to its estimated collectible or net realizable value. To determine the appropriate allowance for doubtful accounts, management undertakes a two-step process. First, management reviews specific customer accounts receivable balances and specific customer circumstances to determine whether a further allowance is necessary. As part of this specific-customer analysis, management considers items such as account agings, bankruptcy filings, litigation, government investigations, historical charge-off patterns, accounts receivable concentrations and the current level of receivables compared with historical customer account balances. Second, a set of general allowance percentages are applied to accounts receivable
20
generated as a result of sales. These percentages are based on historical trends for non-specific customer write-offs. Periodically, management reviews these allowance percentages, adjusting for current information and trends.
The primary risks in the methodology used to estimate the allowance for doubtful accounts are its dependence on historical information to predict the collectability of accounts receivable and timeliness of current financial information from customers. To the extent actual collections of accounts receivable differ from historical trends, the allowance for doubtful accounts and related expense for the current period may be overstated or understated.
Goodwill and Intangible Assets
Goodwill is initially recorded based on the premium paid for acquisitions and is subsequently tested for impairment. The Company tests goodwill for impairment annually and whenever events or circumstances indicate that an impairment may have occurred, such as a significant adverse change in the business climate, loss of key personnel or a decision to sell or dispose of a reporting unit. Determining whether an impairment has occurred requires valuation of the respective reporting unit, which the Company estimates using a discounted cash flow method. When available and as appropriate, comparative market multiples are used to corroborate discounted cash flow results. If this analysis indicates goodwill is impaired, an impairment charge would be taken based on the amount of goodwill recorded versus the implied fair value of goodwill computed by independent appraisals. ORS Nasco contains a material amount of goodwill, $86.4 million as of December 31, 2009. The goodwill impairment analysis on this reporting unit resulted in a fair value that exceeded the carrying value of the entity by 5% as of the last goodwill impairment testing date of December 31, 2009. This valuation performed for goodwill impairment testing as of December 31, 2009 was based on both a discounted cash flow method and comparative market multiples. The key assumptions driving the fair value of ORS Nasco for purposes of this goodwill impairment test include forecasted revenues and margins. The discounted cash flow method also relied on a terminal value growth rate and the weighted average cost of capital of a market participant. Continued economic uncertainty, particularly in the industrial services sector, could have a negative effect on the fair value of the reporting unit. The Company's United Stationers Supply and Lagasse reporting units are not at risk of failing the first step of the goodwill impairment test prescribed by related accounting guidance.
Intangible assets are initially recorded at their fair market values determined on quoted market prices in active markets, if available, or recognized valuation models. Intangible assets that have finite useful lives are amortized on a straight-line basis over their useful lives. Intangible assets that have indefinite useful lives are not amortized but are tested at least annually for impairment or whenever events or circumstances indicate an impairment may have occurred. See Note 4 to the Consolidated Financial Statements.
Insured Loss Liability Estimates
The Company is primarily responsible for retained liabilities related to workers' compensation, vehicle, property and general liability and certain employee health benefits. The Company records expense for paid and open claims and an expense for claims incurred but not reported based upon historical trends and certain assumptions about future events. The Company has an annual per-person maximum cap, provided by a third-party insurance company, on certain employee medical benefits. In addition, the Company has both a per-occurrence maximum loss and an annual aggregate maximum cap on workers' compensation claims.
21
Inventories
Inventory constituting approximately 79% and 81% of total inventory as of December 31, 2009 and December 31, 2008, respectively, has been valued under the last-in, first-out ("LIFO") accounting method. LIFO results in a better matching of costs and revenues. The remaining inventory is valued under the first-in, first-out ("FIFO") accounting method. Inventory valued under the FIFO and LIFO accounting methods is recorded at the lower of cost or market. If the Company had valued its entire inventory under the lower of FIFO cost or market, inventory would have been $80.9 million and $84.7 million higher than reported as of December 31, 2009 and December 31, 2008, respectively. The decrease in the LIFO reserve, which reduced cost of sales by $3.8 million, was driven by decrements in certain LIFO pools. These decrements resulted in liquidations of LIFO inventory quantities carried at lower costs in prior years as compared with the cost of current year purchases. These liquidations resulted in LIFO income of $18.6 million, partially offset by LIFO expense of $14.8 million related to current inflation or a net reduction in cost of sales of $3.8 million referenced above.
The Company records adjustments for shrinkage. Inventory that is obsolete, damaged, defective or slow moving is recorded to the lower of cost or market. These adjustments are determined using historical trends and are adjusted, if necessary, as new information becomes available.
Derivative Financial Instruments
The Company's risk management policies allow for the use of derivative financial instruments to prudently manage foreign currency exchange rate and interest rate exposure. The policies do not allow such derivative financial instruments to be used for speculative purposes. At this time, the Company primarily uses interest rate swaps which are subject to the management, direction and control of our financial officers. Risk management practices, including the use of all derivative financial instruments, are presented to the Board of Directors for approval.
All derivatives are recognized on the balance sheet date at their fair value. All derivatives in a net receivable position are included in "Other assets", and those in a net liability position are included in "Other long-term liabilities". The interest rate swaps that the Company has entered into are classified as cash flow hedges in accordance with accounting guidance on derivative instruments and hedging activities as they are hedging a forecasted transaction or the variability of cash flow to be paid by the Company. Changes in the fair value of a derivative that is qualified, designated and highly effective as a cash flow hedge are recorded in other comprehensive income, net of tax, until earnings are affected by the forecasted transaction or the variability of cash flow, and then are reported in current earnings.
The Company formally documents all relationships between hedging instruments and hedged items, as well as the risk-management objective and strategy for undertaking various hedge transactions. This process includes linking all derivatives designated as cash flow hedges to specific forecasted transactions or variability of cash flow.
The Company formally assesses, at both the hedge's inception and on an ongoing basis, whether the derivatives used in hedging transactions are highly effective in offsetting changes in cash flow of hedged items. When it is determined that a derivative is not highly effective as a hedge then hedge accounting is discontinued prospectively in accordance with accounting guidance on derivative instruments and hedging activities. At this time, this has not occurred as all cash flow hedges contain no ineffectiveness. See Note 20, "Derivative Financial Instruments", for further detail.
Income Taxes
The Company accounts for income taxes in accordance with accounting guidance on income taxes. The Company estimates actual current tax expense and assesses temporary differences that exist due to
22
differing treatments of items for tax and financial statement purposes. These temporary differences result in the recognition of deferred tax assets and liabilities.
The current and deferred tax balances and income tax expense recognized by the Company are based on management's interpretation of the tax laws of multiple jurisdictions. Income tax expense also reflects the Company's best estimates and assumptions regarding, among other things, the level of future taxable income, interpretation of tax laws, and tax planning. Future changes in tax laws, changes in projected levels of taxable income, and tax planning could impact the effective tax rate and current and deferred tax balances recorded by the Company. Management's estimates as of the date of the Consolidated Financial Statements reflect its best judgment giving consideration to all currently available facts and circumstances. As such, these estimates may require adjustment in the future, as additional facts become known or as circumstances change. Further, in accordance with accounting guidance on uncertain tax positions, the tax effects from uncertain tax positions are recognized in the Consolidated Financial Statements, only if it is more likely than not that the position will be sustained upon examination, based on the technical merits of the position. The Company also accounts for interest and penalties related to uncertain tax positions as a component of income tax expense.
Pension and Postretirement Health Benefits
Calculating the Company's obligations and expenses related to its pension and postretirement health benefits requires using certain actuarial assumptions. As more fully discussed in Notes 12 and 13 to the Consolidated Financial Statements included in Item 8 of this Annual Report, these actuarial assumptions include discount rates, expected long-term rates of return on plan assets, and rates of increase in compensation and healthcare costs. To select the appropriate actuarial assumptions, management relies on current market trends and historical information. The expected long-term rate of return on plan assets assumption is based on historical returns and the future expectation of returns for each asset category, as well as the target asset allocation of the asset portfolio. Pension expense for 2009 was $6.3 million, compared to $5.6 million in 2008 and $7.4 million in 2007. A one percentage point decrease in the assumed discount rate would have resulted in an increase in pension expense for 2009 of approximately $3.2 million and increased the year-end projected benefit obligation by $20.3 million.
Costs associated with the Company's postretirement health benefits plan were $0.1 million for each of the years ended 2009, 2008 and 2007. A one-percentage point decrease in the assumed discount rate would have resulted in incremental postretirement healthcare expenses for 2009 of approximately $0.1 million and increased the year-end accumulated postretirement benefit obligation by $0.6 million. Current rates of medical cost increases are trending above the Company's medical cost increase cap of 3% provided by the plan. Accordingly, a one percentage point increase in the assumed average healthcare cost trend would not have a significant impact on the Company's postretirement health plan costs.
The following tables summarize the Company's actuarial assumptions for discount rates, expected long-term rates of return on plan assets, and rates of increase in compensation and healthcare costs for the years ended December 31, 2009, 2008 and 2007:
| |
2009 | 2008 | 2007 | |||||||
|---|---|---|---|---|---|---|---|---|---|---|
Pension plan assumptions: |
||||||||||
Assumed discount rate |
6.25 | % | 6.25 | % | 6.00 | % | ||||
Rate of compensation increase |
3.75 | % | 3.75 | % | 3.75 | % | ||||
Expected long-term rate of return on plan assets |
8.25 | % | 8.25 | % | 8.25 | % | ||||
Postretirement health benefits assumptions: |
||||||||||
Assumed average healthcare cost trend |
3.00 | % | 3.00 | % | 3.00 | % | ||||
Assumed discount rate |
6.25 | % | 6.25 | % | 6.00 | % | ||||
23
For the year ending December 31, 2009, the rate of compensation increase was 3.75% prior to March 1, 2009 when the Company froze pension service benefits for employees not covered by collective bargaining agreements. To select the appropriate actuarial assumptions, management relied on current market conditions, historical information and consultation with and input from the Company's outside actuaries. The expected long-term rate of return on plan assets assumption is based on historical returns and the future expectation of returns for each asset category, as well as the target asset allocation of the asset portfolio.
Results for the Years Ended December 31, 2009, 2008 and 2007
The following table presents the Consolidated Statements of Income as a percentage of net sales:
| |
Years Ended December 31, | ||||||||||
|---|---|---|---|---|---|---|---|---|---|---|---|
| |
2009 | 2008 | 2007 | ||||||||
Net sales |
100.00 | % | 100.00 | % | 100.00 | % | |||||
Cost of goods sold |
85.34 | 85.15 | 84.79 | ||||||||
Gross margin |
14.66 | 14.85 | 15.21 | ||||||||
Operating expenses: |
|||||||||||
Warehousing, marketing and administrative expenses |
10.60 | 10.99 | 10.82 | ||||||||
Restructuring, severance and other charges, net |
0.08 | — | 0.03 | ||||||||
Total operating expenses |
10.68 | 10.99 | 10.85 | ||||||||
Operating income |
3.98 | 3.86 | 4.36 | ||||||||
Interest expense, net |
0.58 | 0.55 | 0.26 | ||||||||
Other expense, net |
0.00 | 0.16 | 0.31 | ||||||||
Income from continuing operations before income taxes |
3.40 | 3.15 | 3.79 | ||||||||
Income tax expense |
1.26 | 1.18 | 1.48 | ||||||||
Net income |
2.14 | % | 1.97 | % | 2.31 | % | |||||
The above table includes all items that are separately itemized in the tables below for 2009 and 2008. Operating expenses for 2007 included a $1.4 million restructuring charge related to the 2006 Workforce Reduction Program which began in the fourth quarter of 2006.
24
Adjusted Operating Income and Diluted Earnings Per Share
The following table presents Adjusted Operating Income, Net Income and Diluted Earnings Per Share for the years ended December 31, 2009 and 2008 (in millions, except per share data). The table shows Adjusted Operating Income, Net Income and Diluted Earnings per Share excluding the effects of the negotiated settlement with a service supplier in 2009, the first quarter severance charges in 2009, the gains on sale of buildings in 2008, and an asset impairment charge in 2008 (see "Comparison of Results for the Years Ended December 31, 2009 and 2008" below for more detail). Generally Accepted Accounting Principles require that the effects of these items be included in the Consolidated Statements of Income. The Company believes that excluding these items is an appropriate comparison of its ongoing operating results to last year and that it is helpful to provide readers of its financial statements with a reconciliation of these items to its Consolidated Statements of Income reported in accordance with Generally Accepted Accounting Principles.
| |
For the Years Ended December 31, | |||||||||||||
|---|---|---|---|---|---|---|---|---|---|---|---|---|---|---|
| |
2009 | 2008 | ||||||||||||
| |
Amount | % to Net Sales |
Amount | % to Net Sales |
||||||||||
Sales |
$ | 4,710.3 | 100.00 | % | $ | 4,986.9 | 100.00 | % | ||||||
Gross profit |
$ | 690.6 | 14.66 | % | $ | 740.7 | 14.85 | % | ||||||
Operating expenses |
$ | 503.0 | 10.68 | % | $ | 548.2 | 10.99 | % | ||||||
Gain on the sale of distribution centers |
— | — | 5.1 | 0.10 | % | |||||||||
Gain on sale of former corporate headquarter |
— | — | 4.7 | 0.09 | % | |||||||||
Asset impairment charge |
— | — | (6.7 | ) | (0.13 | )% | ||||||||
Negotiated settlement with a service supplier |
14.0 | 0.30 | % | — | — | |||||||||
Severance charge |
(3.4 | ) | (0.08 | )% | — | — | ||||||||
Adjusted operating expenses |
$ | 513.6 | 10.90 | % | $ | 551.3 | 11.05 | % | ||||||
Operating income |
$ | 187.6 | 3.98 | % | $ | 192.5 | 3.86 | % | ||||||
Operating expense items noted above |
(10.6 | ) | (0.22 | )% | (3.1 | ) | (0.06 | )% | ||||||
Adjusted operating income |
$ | 177.0 | 3.76 | % | $ | 189.4 | 3.80 | % | ||||||
Net Income |
$ |
101.0 |
$ |
98.4 |
||||||||||
Operating expense items noted above |
(6.7 | ) | (1.9 | ) | ||||||||||
Adjusted net income |
$ | 94.3 | $ | 96.5 | ||||||||||
Net income per share—diluted |
$ |
4.19 |
$ |
4.13 |
||||||||||
Per share operating expense items noted above |
(0.28 | ) | (0.08 | ) | ||||||||||
Adjusted net income per share—diluted |
$ |
3.91 |
$ |
4.05 |
||||||||||
Weighted average number of common shares—diluted |
24,096 |
23,847 |
||||||||||||
25
Comparison of Results for the Years Ended December 31, 2009 and 2008
Net Sales. Net sales for the year ended December 31, 2009 were approximately $4.7 billion, down 5.2%, on a workday adjusted basis, compared with $5.0 billion in 2008. The following table shows net sales by product category for 2009 and 2008 (in millions):
| |
Years Ended December 31, |
||||||
|---|---|---|---|---|---|---|---|
| |
2009 | 2008(1) | |||||
Technology products |
$ | 1,636 | $ | 1,683 | |||
Traditional office products (including cut-sheet paper) |
1,282 | 1,346 | |||||
Janitorial and breakroom supplies |
1,117 | 1,053 | |||||
Office furniture |
354 | 504 | |||||
Industrial supplies |
231 | 301 | |||||
Freight revenue |
81 | 91 | |||||
Other |
9 | 9 | |||||
Total net sales |
$ | 4,710 | $ | 4,987 | |||
- (1)
- Certain prior period amounts have been reclassified to conform to the current presentation. Such reclassifications included: i) freight and other revenue from ORS Nasco that is now included in the freight and other revenue line items rather than in the "Industrial supplies" product category, and ii) changes between several product categories due to several specific products being reclassified to different categories. These changes did not impact the Consolidated Statements of Income.
Sales in the technology products category declined 2.4%, after adjusting for one less selling day, in 2009 compared to 2008. This category continues to represent the largest percentage of the Company's consolidated net sales and accounted for approximately 35% for 2009. Discretionary products in this category experienced a year-over-year decline while consumables were relatively flat to the prior year. Increased penetration and sales of the Company's Innovera private brand products, mainly in imaging and supplies, helped limit the overall decline in this category versus the prior year.
Sales of traditional office products in 2009 fell 4.4% per selling day versus 2008. Traditional office supplies represented approximately 27% of the Company's consolidated net sales for 2009. While the decline can be attributed to reduced sales of durable products, there was 4.5% growth within this category in cut-sheet paper sales, which typically earn a lower margin than other traditional office products sales.
Sales growth in the janitorial and breakroom supplies category remained strong, rising 6.5% in 2009, adjusted for one less sales day, as compared to 2008. This category accounted for nearly 24% of the Company's 2009 consolidated net sales. This growth can be attributed to management's focus on cross-selling and channel development activities, sales to a new major paper and janitorial buying group, and sales of flu-related products.
Office furniture sales in 2009 were down 29.4%, after adjusting for selling days, compared to 2008. Office furniture accounted for approximately 8% of the Company's 2009 consolidated net sales. This category, which typically has higher margins, has been negatively impacted by the recession as consumers put off high dollar discretionary purchases of furniture.
Sales of industrial supplies declined 23.0% per selling day, reflecting the overall decline in the United States manufacturing, pipeline, and commercial construction activity, combined with continued de-stocking in the distributor channel. This category accounted for 5% of the Company's net sales in 2009.
The remainder of the Company's consolidated net sales came from freight and advertising revenue.
26
Gross Profit and Gross Margin Rate. Gross profit for 2009 was $690.6 million, compared to $740.7 million in 2008. Gross profit as a percentage of net sales (the gross margin rate) for 2009 was 14.7%, as compared to 14.9% for 2008. The 2009 gross margin rate declined 20 basis points (bps) from 2008 due to: a less favorable sales product mix as consumers moved to more value driven and consumable commodities, reducing pricing margin by 20 bps; a 75 bps decline from lower product cost inflation during 2009 and reduced purchasing activity throughout the year, which spurred a 15 bps decline in supplier allowances and purchase discounts. Partially offsetting these declines were a 60 bp favorable LIFO change related to reduced inflation, inventory mix and inventory decrements and a 30 bp improvement in freight related components, driven by cost containment initiatives and lower fuel costs.
Operating Expenses. Operating expenses were $503.0 million or 10.7% as a percent of sales for the year compared to $548.2 million or 11.0% in 2008. Included in 2009 operating expenses are a $14.0 million gain related to a negotiated settlement with a service supplier and a $3.4 million severance charge. Operating expenses in 2008 include a $9.8 million gain on the sale of three buildings and a $6.7 million asset impairment charge. Excluding these items operating expenses declined 7% and were 10.9% of sales versus 11.1% in the prior year. The decline is due to: reduced salaries and wages as a percent of sales of 5 bps resulting from lower headcount and a temporary wage reduction during the year; lower bad debt costs of 7 bps as the economy began to stabilize and a 25 bps reduction in discretionary expenses, resulting from management efforts to control costs. These improvements were partially offset by increased healthcare costs of 10 bps and 5 bps of expenses related to the Company's continued execution of its plan to expand ORS Nasco's presence to 18 key markets by leveraging existing company distribution centers.
Interest Expense, net. Net interest expense for 2009 was $27.3 million, compared with $27.5 million in 2008. Interest expense remained relatively flat as borrowings under the Company's Prior Receivables Securitization Program were replaced with debt borrowings which kept the average overall debt levels for 2009 relatively flat for the year versus 2008.
Other Expense, net. Other Expense for 2009 was $0.2 million, compared with $8.1 million in 2008. Net Other Expense for 2009 and 2008 primarily reflected costs associated with the sale of certain trade accounts receivable through the Company's Prior Receivables Securitization Program. The 2009 decline was due to the termination of the Prior Receivables Securitization Program in the first quarter of 2009. This program was replaced with the 2009 Receivables Securitization Program which qualifies for on-balance sheet treatment meaning that all borrowing costs from the 2009 Receivables Securitization Program are included in Interest Expense, net. There have been no borrowings under the 2009 Receivables Securitization Program because of significantly reduced funding requirements resulting from strong operating cash flow.
Income Taxes. Income tax expense was $59.1 million in 2009, compared with $58.4 million in 2008. The Company's effective tax rate was 36.9% in 2009, compared to 37.3% in 2008.
Net Income. Net income for 2009 totaled $101.0 million, or $4.19 per diluted share, compared with net income of $98.4 million, or $4.13 per diluted share for 2008. Adjusting for the impact of the negotiated settlement with a service provider and first quarter 2009 severance charge, 2009 adjusted diluted earnings per share were $3.91. Adjusted 2008 earnings per diluted share were $4.05 after excluding the $9.8 million gain on the sale of two distribution centers and the Company's former corporate headquarters and a pre-tax asset impairment charge of $6.7 million related to capitalized software development costs.
Comparison of Results for the Years Ended December 31, 2008 and 2007
Net Sales. Net sales for the year ended December 31, 2008 were approximately $5.0 billion, up 7.3%, compared with $4.6 billion in 2007. The twelve-month period ended December 31, 2008 had one more
27
selling day compared with the same period of 2007. Adjusted for this change in workdays, sales grew 6.9%. The following table shows net sales by product category for 2008 and 2007 (in millions):
| |
Years Ended December 31, |
||||||
|---|---|---|---|---|---|---|---|
| |
2008(1) | 2007(1) | |||||
Technology products |
$ | 1,683 | $ | 1,736 | |||
Traditional office products (including cut-sheet paper) |
1,346 | 1,336 | |||||
Janitorial and breakroom supplies |
1,053 | 925 | |||||
Office furniture |
504 | 566 | |||||
Industrial supplies |
301 | 3 | |||||
Freight revenue |
91 | 77 | |||||
Other |
9 | 3 | |||||
Total net sales |
$ | 4,987 | $ | 4,646 | |||
- (1)
- Certain prior period amounts have been reclassified to conform to the current presentation. Such reclassifications included: i) freight and other revenue from ORS Nasco that is now included in the freight and other revenue line items rather than in the "Industrial supplies" product category, and ii) changes between several product categories due to several specific products being reclassified to different categories. These changes did not impact the Consolidated Statements of Income.
Sales in the technology products category declined about 3%, after adjusting for selling days, in 2008 compared to 2007. This category continues to represent the largest percentage of the Company's consolidated net sales and accounted for approximately 34% for 2008. Competitive pressures, reduced discretionary spending and the weak economy all negatively impacted sales in this category. The Company's continued focus on margin management also has led to declines in this area of the business.
Sales of traditional office products in 2008 grew less than 1% per selling day versus 2007. Traditional office supplies represented approximately 27% of the Company's consolidated net sales for 2008. The growth in this category was primarily driven by higher cut-sheet paper sales which typically earns a lower margin than other traditional office products sales which declined for the year.
Sales growth in the janitorial and breakroom supplies category remained strong, rising approximately 13% in 2008, adjusted for the additional sales day, as compared to 2007. This category accounted for nearly 21% of the Company's 2008 consolidated net sales. Growth in this category was primarily due to continued success in the Company's "office-jan" program to grow sales of janitorial and breakroom supplies to traditional office products resellers, ongoing efforts to convert direct sales to wholesale, and national account business which began late in 2007.
Office furniture sales in 2008 were down just 11%, after adjusting for selling days, compared to 2007. Office furniture accounted for approximately 10% of the Company's 2008 consolidated net sales. This category, which typically has higher margins, has seen the harshest impact from the recession as consumers put off high dollar discretionary purchases of furniture.
Sales of industrial supplies accounted for 6% of the Company's net sales in 2008. ORS Nasco sales of such products contributed approximately 6.5% to the Company's overall annual sales growth.
The remaining 2% of the Company's consolidated net sales came from freight and advertising revenue.
Gross Profit and Gross Margin Rate. Gross profit (gross margin dollars) for 2008 was $740.7 million, compared to $706.7 million in 2007. The gross margin rate (gross profit as a percentage of net sales) for 2008 was 14.9%, as compared to 15.2% for 2007. Lower supplier allowances and purchase discounts, which resulted from the impact of lower sales volume, mix and inventory reductions, negatively impacted
28
the gross margin rate by approximately 45 basis points. The effects of this lower margin sales mix across and within product categories also negatively impacted pricing margin by 40 basis points. The Company also experienced some increased of occupancy costs throughout the year which negatively impacted the gross margin rate by 5 basis points. These items were partially offset by the 20 basis point contribution of ORS Nasco to the gross margin rate and the 40 basis point favorable impact of product cost inflation and selective investment buys in advance of these price increases.
Operating Expenses. Operating expenses for 2008 totaled $548.2 million, or 11.0% of net sales, compared with $504.2 million, or 10.9% of net sales in 2007. Operating expenses in 2008 included $5.1 million related to the gains on the sale of two distribution centers, $4.7 million related to the gain on the sale of the Company's former corporate headquarters, and an asset impairment charge of $6.7 million related to capitalized software development costs. Operating expenses in 2007 include a $1.4 million restructuring charge related to finalizing the 2006 Workforce Reduction Program. ORS Nasco operating expenses for 2008 were $37.5 million and $0.8 million in 2007. Excluding ORS Nasco and the items mentioned above, operating expenses in 2008 and 2007 were 11.0% and 10.8%, respectively, of net sales. The primary cause for the increase was higher bad debt expense of 24 basis points, as the Company increased its reserves for doubtful accounts due to the weak economic environment. Also the Company's incremental strategic investments added 7 basis points to the operating expenses ratio. These increases were partially offset by lower management bonuses of 9 basis points and lower depreciation expense of 7 basis points. Cost containment actions in 2008 also helped offset general inflationary cost increases.
Interest Expense, net. Net interest expense for 2008 was $27.5 million, compared with $11.9 million in 2007. The increase in interest expense in 2008 was attributable to higher average outstanding debt in 2008 resulting primarily from the $200 million Term Loan entered into in December 2007, the $135 million Note Purchase Agreement entered into in October 2007 and an increase in the average outstanding balance of the revolving credit facility resulting from the reduction in the average outstanding amount borrowed under the Prior Receivable Securitization Program. The impact of these increased borrowings on interest expense was partially offset by lower average rates.
Other Expense, net. Other Expense for 2008 was $8.1 million, compared with $14.6 million in 2007. Net Other Expense for 2008 and 2007 primarily reflected costs associated with the sale of certain trade accounts receivable through the Prior Receivables Securitization Program. The 2008 decline was due primarily to reduced average borrowings under the Prior Receivables Securitization Program.
Income Taxes. Income tax expense was $58.4 million in 2008, compared with $68.8 million in 2007. The Company's effective tax rate was 37.3% in 2008, compared to 39.1% in 2007. This effective tax rate decrease primarily related to lower income tax contingencies and the mix of income between jurisdictions and legal entities.
Net Income. Net income for 2008 totaled $98.4 million, or $4.13 per diluted share, compared with net income of $107.2 million, or $3.83 per diluted share for 2007. Adjusting for the impact of the $9.8 million pre-tax gains on the sale of two distribution centers and the Company's former corporate headquarters, and a pre-tax asset impairment charge of $6.7 million related to capitalized software development costs, 2008 diluted earning per share were $4.05 per share versus $3.86 per share after adjusting 2007 by $1.4 million (pre-tax) related to finalizing the 2006 Workforce Reduction Program.
29
Liquidity and Capital Resources
General
USI is a holding company and, as a result, its primary sources of funds are cash generated from the operating activities of its operating subsidiary, USSC, including the sale of certain accounts receivable, and cash from borrowings by USSC. Restrictive covenants in USSC's debt agreements restrict USSC's ability to pay cash dividends and make other distributions to USI. In addition, the right of USI to participate in any distribution of earnings or assets of USSC is subject to the prior claims of the creditors, including trade creditors, of USSC.
The Company's outstanding debt under GAAP, together with funds generated from the sale of accounts receivable under the Company's Prior Receivables Securitization Program (as defined below), consisted of the following amounts (in thousands):
| |
As of December 31, 2009 |
As of December 31, 2008 |
|||||
|---|---|---|---|---|---|---|---|
2007 Credit Agreement—Revolving Credit Facility |
$ | 100,000 | $ | 321,300 | |||
2007 Credit Agreement—Term Loan |
200,000 | 200,000 | |||||
2007 Master Note Purchase Agreement |
135,000 | 135,000 | |||||
Industrial development bond, at market-based interest rates, maturing in 2011 |
6,800 | 6,800 | |||||
Debt under GAAP |
441,800 | 663,100 | |||||
Accounts receivable sold(1) |
— | 23,000 | |||||
Total outstanding debt under GAAP and accounts receivable sold ("adjusted debt") |
441,800 | 686,100 | |||||
Stockholders' equity |
706,713 | 565,638 | |||||
Total capitalization |
$ | 1,148,513 | $ | 1,251,738 | |||
Adjusted debt-to-total capitalization ratio |
38.5 | % | 54.8 | % | |||
- (1)
- See discussion below under "Off-Balance Sheet Arrangements—Prior Receivables Securitization Program"
The most directly comparable financial measure to adjusted debt that is calculated and presented in accordance with GAAP is total debt (shown in the above table as "Debt under GAAP"). Under GAAP, accounts receivable sold under the Company's Prior Receivables Securitization Program are required to be reflected as a reduction in accounts receivable and not reported as debt. Internally, the Company considers accounts receivable sold to be a financing mechanism. The Company therefore believes it is helpful to provide readers of its financial statements with a measure ("adjusted debt") that adds accounts receivable sold to debt and calculates debt-to-total capitalization on the same basis. A reconciliation of these non-GAAP measures is provided in the table above. Adjusted debt and the adjusted-debt-to-total-capitalization ratio are provided as additional liquidity measures.
A decrease in borrowings under the revolving credit feature of the 2007 Credit Agreement resulted in $441.8 million of total debt outstanding at December 31, 2009, in accordance with GAAP; a $221.3 million decrease from the December 31, 2008 balance. Accompanied by a $23.0 million decline in the amount sold under the Company's Prior Receivables Securitization Program, adjusted debt at December 31, 2009 decreased a total of $244.3 million from the balance at December 31, 2008.
At December 31, 2009, the Company's adjusted debt-to-total capitalization ratio was 38.5%, compared to 54.8% at December 31, 2008.
30
Operating cash requirements and capital expenditures are funded from operating cash flow and available financing. Financing available from debt and the sale of accounts receivable as of December 31, 2009, is summarized below (in millions):
| Availability | ||||||||
|---|---|---|---|---|---|---|---|---|
Maximum financing available under: |
||||||||
2007 Credit Agreement—Revolving Credit Facility |
$ | 425.0 | ||||||
2007 Credit Agreement—Term Loan |
200.0 | |||||||
2007 Master Note Purchase Agreement |
135.0 | |||||||
2009 Receivables Securitization Program(1) |
100.0 | |||||||
Industrial Development Bond |
6.8 | |||||||
Maximum financing available |
$ | 866.8 | ||||||
Amounts utilized: |
||||||||
2007 Credit Agreement—Revolving Credit Facility |
100.0 | |||||||
2007 Credit Agreement—Term Loan |
200.0 | |||||||
2007 Master Note Purchase Agreement |
135.0 | |||||||
Receivables Securitization Program |
— | |||||||
Outstanding letters of credit |
17.9 | |||||||
Industrial Development Bond |
6.8 | |||||||
Total financing utilized |
459.7 | |||||||
Available financing, before restrictions |
407.1 | |||||||
Restrictive covenant limitation |
80.3 | |||||||
Available financing as of December 31, 2009 |
$ | 326.8 | ||||||
- (1)
- The 2009 Receivables Securitization Program provides for maximum funding available of the lesser of $100 million or the total amount of eligible receivables less excess concentrations and applicable reserves.
The Credit Agreement, 2007 Note Purchase Agreement, and Transfer and Administration Agreement prohibit the Company from exceeding a Leverage Ratio of 3.25 to 1.00 and impose other restrictions on the Company's ability to incur additional debt. These agreements also contain additional covenants, requirements and events of default that are customary for these types of agreements. The 2007 Credit Agreement, 2007 Note Purchase Agreement, and the Transfer and Administration Agreement all contain cross-default provisions. As a result, if an event of default, including the failure to make any required payments when due, occurs under any of those agreements, the lenders under all of the agreements may cease to make additional loans, accelerate any loans then outstanding and/or terminate the agreements to which they are party.
The Company believes that its operating cash flow and financing capacity, as described, provide adequate liquidity for operating the business for the foreseeable future.
31
Disclosures About Contractual Obligations
The following table aggregates all contractual obligations that affect financial condition and liquidity as of December 31, 2009 (in thousands):
| |
Payment due by period | |
|||||||||||||||
|---|---|---|---|---|---|---|---|---|---|---|---|---|---|---|---|---|---|
Contractual obligations
|
2010 | 2011 & 2012 | 2013 & 2014 | Thereafter | Total | ||||||||||||
Long-term debt |
$ | — | $ | 306,800 | $ | 135,000 | $ | — | $ | 441,800 | |||||||
Fixed interest payments on long-term debt(1) |
19,427 | 32,916 | 332 | — | 52,675 | ||||||||||||
Operating leases |
51,867 | 85,062 | 50,929 | 55,582 | 243,440 | ||||||||||||
Purchase obligations |
1,584 | 660 | 76 | — | 2,320 | ||||||||||||
Total contractual cash obligations |
$ | 72,878 | $ | 425,438 | $ | 186,337 | $ | 55,582 | $ | 740,235 | |||||||
- (1)
- The Company has entered into several interest rate swap transactions on a portion of its long-term debt. The fixed interest payments noted in the table are based on the notional amounts and fixed rates inherent in the swap transactions and related debt instruments. For more detail see Note 20, "Derivative Financial Instruments", in the Notes to the Consolidated Financial Statements. In addition, as of December 31, 2009 the Company has $6.8 million of long-term debt that is based on variable market rates not subject to the Company's interest rate swap transactions. The projected interest payments on this portion of the Company's long-term debt are not included in this table. See Note 9, "Long-Term Debt" for further detail.
At December 31, 2009, the Company had a liability for unrecognized tax benefits of $5.0 million as discussed in Note 15, "Income Taxes", and an accrual for the related interest, that are excluded from the Contractual Obligations table. Due to the uncertainties related to these tax matters, the Company is unable to make a reasonably reliable estimate when cash settlement with a taxing authority may occur.
Credit Agreement and Other Debt
On March 3, 2009, USI entered into an accounts receivables securitization program (as amended to date, the "2009 Receivables Securitization Program" or the "2009 Program") that replaced the securitization program that USI terminated on March 2, 2009 (the "Prior Receivables Securitization Program" or the "Prior Program"). The parties to the 2009 Program are USI, USSC, United Stationers Financial Services ("USFS"), and United Stationers Receivables, LLC ("USR"), and Bank of America, National Association ("Bank of America") and Enterprise Funding Company LLC ("Enterprise" and, together with Bank of America, the "Investors"). The 2009 Program is governed by the following agreements, a
- •
- Transfer and Administration Agreement among USSC, USFS, USR, and the Investors;
- •
- Receivables Sale Agreement between USSC and USFS;
- •
- Receivables Purchase Agreement between USFS and USR; and
- •
- Performance Guaranty executed by USI in favor of USR.
Pursuant to the Receivables Sale Agreement, USSC sells to USFS, on an on-going basis, all the customer accounts receivable and related rights originated by USSC. Pursuant to the Receivables Purchase Agreement, USFS sells to USR, on an on-going basis, all the accounts receivable and related rights purchased from USSC, as well as the accounts receivable and related rights USFS acquired from its then subsidiary, USS Receivables Company, Ltd. ("USSRC"), upon the termination of the Prior Program. Pursuant to the Transfer and Administration Agreement, USR then sells the receivables and related rights to Bank of America, as agent on behalf of Enterprise. The maximum investment to USR at any one time outstanding under the 2009 Program cannot exceed $100 million. USFS retains servicing responsibility over the receivables. USR is a wholly-owned, bankruptcy remote special purpose
32
subsidiary of USFS. The assets of USR are not available to satisfy the creditors of any other person, including USFS, USSC or USI, until all amounts outstanding under the facility are repaid and the 2009 Program has been terminated. The maturity date of the 2009 Program is November 23, 2013, subject to the Investors' renewing their commitments as liquidity providers supporting the 2009 Program, which expire on January 21, 2011.
The receivables sold to Bank of America will remain on USI's Condensed Consolidated Balance Sheet, and amounts advanced to USR by Enterprise, Bank of America or any successor Investor will be recorded as debt on USI's Condensed Consolidated Balance Sheet. The cost of such debt will be recorded as interest expense on USI's income statement. As of December 31, 2009, $445.3 million of receivables have been sold and no amounts have been advanced to USR.
On July 5, 2007, USI and USSC entered into a Second Amended and Restated Five-Year Revolving Credit Agreement with PNC Bank, National Association and U.S. Bank National Association, as Syndication Agents, KeyBank National Association and LaSalle Bank, National Association, as Documentation Agents, and JPMorgan Chase Bank, National Association, as Agent (as amended on December 21, 2007, the "2007 Credit Agreement"). The 2007 Credit Agreement provides a Revolving Credit Facility with a committed principal amount of $425 million and a Term Loan in the principal amount of $200 million. Interest on both the Revolving Credit Facility and the Term Loan is based on the three-month LIBOR plus an interest margin based upon the Company's debt to EBITDA ratio (or "Leverage Ratio", as defined in the 2007 Credit Agreement). The 2007 Credit Agreement prohibits the Company from exceeding a Leverage Ratio of 3.25 to 1.00 and imposes other restrictions on the Company's ability to incur additional debt. The Revolving Credit Facility expires on July 5, 2012, which is also the maturity date of the Term Loan.
On October 15, 2007, USI and USSC entered into a Master Note Purchase Agreement (the "2007 Note Purchase Agreement") with several purchasers. The 2007 Note Purchase Agreement allows USSC to issue up to $1 billion of senior secured notes, subject to the debt restrictions contained in the 2007 Credit Agreement. Pursuant to the 2007 Note Purchase Agreement, USSC issued and sold $135 million of floating rate senior secured notes due October 15, 2014 at par in a private placement (the "Series 2007-A Notes"). Interest on the Series 2007-A Notes is payable quarterly in arrears at a rate per annum equal to three-month LIBOR plus 1.30%, beginning January 15, 2008. USSC may issue additional series of senior secured notes from time to time under the 2007 Note Purchase Agreement but has no specific plans to do so at this time. USSC used the proceeds from the sale of these notes to repay borrowings under the 2007 Credit Agreement.
On November 6, 2007, USSC entered into an interest rate swap transaction (the "November 2007 Swap Transaction") with U.S. Bank National Association as the counterparty. USSC entered into the November 2007 Swap Transaction to mitigate USSC's floating rate risk on an aggregate of $135 million of LIBOR based interest rate risk. Under the terms of the November 2007 Swap Transaction, USSC is required to make quarterly fixed rate payments to the counterparty calculated based on a notional amount of $135 million at a fixed rate of 4.674%, while the counterparty is obligated to make quarterly floating rate payments to USSC based on the three-month LIBOR on the same referenced notional amount. The November 2007 Swap Transaction has an effective date of January 15, 2008 and a termination date of January 15, 2013.
On December 20, 2007, USSC entered into an interest rate swap transaction (the "December 2007 Swap Transaction") with Key Bank National Association as the counterparty. USSC entered into the December 2007 Swap Transaction to mitigate USSC's floating rate risk on an aggregate of $200 million of LIBOR based interest rate risk. Under the terms of the December 2007 Swap Transaction, USSC is required to make quarterly fixed rate payments to the counterparty calculated based on a notional amount of $200 million at a fixed rate of 4.075%, while the counterparty is obligated to make quarterly floating rate payments to USSC based on the three-month LIBOR on the same referenced notional
33
amount. The December 2007 Swap Transaction has an effective date of December 21, 2007 and a termination date of June 21, 2012.
On March 13, 2008, USSC entered into an interest rate swap transaction (the "March 2008 Swap Transaction") with U.S. Bank National Association as the counterparty. USSC entered into the March 2008 Swap Transaction to mitigate USSC's floating rate risk on an aggregate of $100 million of LIBOR based interest rate risk. Under the terms of the March 2008 Swap Transaction, USSC is required to make quarterly fixed rate payments to the counterparty calculated based on a notional amount of $100 million at a fixed rate of 3.212%, while the counterparty is obligated to make quarterly floating rate payments to USSC based on the three-month LIBOR on the same referenced notional amount. The March 2008 Swap Transaction had an effective date of March 31, 2008 and a termination date of June 29, 2012.
The Company had outstanding letters of credit under the 2007 Credit Agreement of $17.9 million and $19.5 million as of December 31, 2009 and December 31, 2008, respectively.
At December 31, 2009 funding levels (including amounts sold under the 2009 Receivables Securitization Program), a 50 basis point movement in interest rates would not result in a material increase or decrease in annualized interest expense on a pre-tax basis, nor upon cash flows from operations.
As of December 31, 2009, the Company had an industrial development bond outstanding with a balance of $6.8 million. This bond is scheduled to mature in 2011 and carries market-based interest rates.
Refer to Note 9, "Long-Term Debt", for further descriptions of the provisions of 2007 Credit Agreement and the 2007 Note Purchase Agreement.
Off-Balance Sheet Arrangements—Prior Receivables Securitization Program
USSC maintained a third-party receivables securitization program (the "Prior Receivables Securitization Program" or the "Prior Program"). On March 2, 2009, in preparation for entering into a new securitization program, USI's subsidiaries USFS and USSRC terminated the Prior Program. Under the Prior Program, USSC sold, on a revolving basis, its eligible trade accounts receivable (except for certain excluded accounts receivable, which initially include all accounts receivable of Lagasse, Inc. and foreign operations) to USSRC. USSRC, in turn, ultimately transferred the eligible trade accounts receivable to a trust. The trust then sold investment certificates, which represented an undivided interest in the pool of accounts receivable owned by the trust, to third-party investors. As of December 31, 2008, the Company sold $23 million of interests in trade accounts receivable.
Cash Flows
Cash flows for the Company for the years ended December 31, 2009, 2008 and 2007 are summarized below (in thousands):
| |
Years Ended December 31, | |||||||||
|---|---|---|---|---|---|---|---|---|---|---|
| |
2009 | 2008 | 2007 | |||||||
Net cash provided by (used in) operating activities |
$ | 239,395 | $ | (129,305 | ) | $ | 218,054 | |||
Net cash used in investing activities |
(14,829 | ) | (28,366 | ) | (197,898 | ) | ||||
Net cash (used in) provided by financing activities |
(216,667 | ) | 146,430 | (13,188 | ) | |||||
Cash Flows From Operations
Net cash provided by operating activities for the year ended December 31, 2009 totaled $239.4 million, compared with net cash used in operating activities of $129.3 million in 2008. After excluding the impacts of accounts receivable sold under the Receivables Securitization Program (see table below), cash flows provided by operating activities were $262.4 million for 2009 and helped fund capital expenditures of
34
$14.9 million and debt reduction of $221.3 million in 2009. This is compared to adjusted cash flows provided by operating activities of $95.7 million for 2008, which helped fund items including $31.7 million in capital expenditures, acquisitions of $14.9 million and stock repurchases of $67.5 million.
Adjusted operating cash flows for 2009 were favorably impacted by a return of accounts payable balances to more typical levels, as a percentage of inventories, at December 31, 2009. Payables were at $390.9 million at December 31, 2009 up from $341.1 million at December 31, 2008 due to the timing of inventory purchases and investment buys. Favorability was also seen with inventories declining $89.6 million to $590.9 million at December 31, 2009 from $680.5 million at December 31, 2008. These two items combined accounted for approximately $139.4 million of the increase in adjusted operating cash flows compared to 2008.
Adjusted operating cash flows for 2008 were unfavorably impacted by unusually low accounts payable balances at December 31, 2008. Payables were at $341.1 million at December 31, 2008 down from $448.6 million at December 31, 2007 due to the timing of inventory purchases and investment buys. Partially offsetting this unfavorable change, inventories were down $34.7 million to $680.5 million at December 31, 2008 from $715.2 million at December 31, 2007. These two items combined accounted for approximately $125.6 million of the decline in adjusted operating cash flows compared to 2007. Operating cash flows were also negatively impacted by $35.3 million due to the timing of accrued liabilities and payments. These three unfavorable items totaling $160.9 million were partially offset by a reduction in accounts receivable of $65.8 million, after excluding the impact of accounts receivable sold.
Internally, the Company views accounts receivable sold through its Prior Receivables Securitization Program (the "Prior Program") and the 2009 Receivables Securitization Program (the "2009 Program"), or collectively, the "Programs", to be a financing mechanism based on the following considerations and reasons:
- •
- During the first quarter of 2009, the company entered into the 2009 Program that was structured to maintain the related
accounts receivable and debt on its balance sheet, with costs of the 2009 Program now included within "Interest Expense, net". In contrast, the Prior Program was structured for off-balance
sheet treatment with costs included in "Other Expense, net";
- •
- The Prior Program historically was the Company's preferred source of floating rate financing, primarily because it had
generally carried a lower cost than other traditional borrowings;
- •
- The Programs' characteristics are similar to those of traditional debt, including being securitized, having an interest
component and being viewed as traditional debt by the Programs' financial providers in determining capacity to support and service debt;
- •
- The terms of the Programs are structured similarly to those in many revolving credit facilities, including provisions
addressing maximum commitments, costs of borrowing, financial covenants and events of default;
- •
- As with debt, the Company elects, in accordance with the terms of the Programs, how much is funded through the Programs at
any given time;
- •
- Provisions of the 2007 Credit Agreement and the 2007 Note Purchase Agreement aggregate true debt (including borrowings
under the Credit Facility) together with the balance of accounts receivable sold under the Programs into the concept of "Consolidated Funded Indebtedness." This effectively treats the Programs as debt
for purposes of requirements and covenants under those agreements; and
- •
- For purposes of managing working capital requirements, the Company evaluates working capital before any sale of accounts receivables sold through the Programs to assess accounts receivable requirements and performance, on measures such as days outstanding and working capital efficiency.
35
Net cash provided by operating activities excluding the effects of receivables sold and net cash used in financing activities including the effects of receivables sold for the years ended December 31, 2009, 2008 and 2007 is provided below as an additional liquidity measure (in thousands):
| |
Years Ended December 31, | ||||||||||
|---|---|---|---|---|---|---|---|---|---|---|---|
| |
2009 | 2008 | 2007 | ||||||||
Cash Flows From Operating Activities: |
|||||||||||
Net cash provided by (used in) operating activities |
$ | 239,395 | $ | (129,305 | ) | $ | 218,054 | ||||
Excluding the change in accounts receivable sold |
23,000 | 225,000 | (23,000 | ) | |||||||
Net cash provided by operating activities excluding the effects of receivables sold |
$ | 262,395 | $ | 95,695 | $ | 195,054 | |||||
Cash Flows From Financing Activities: |
|||||||||||
Net cash (used in) provided by financing activities |
$ | (216,667 | ) | $ | 146,430 | $ | (13,188 | ) | |||
Including the change in accounts receivable sold |
(23,000 | ) | (225,000 | ) | 23,000 | ||||||
Net cash (used in) provided by financing activities including the effects of receivables sold |
$ | (239,667 | ) | $ | (78,570 | ) | $ | 9,812 | |||
Cash Flows From Investing Activities
Net cash used in investing activities for the years ended December 31, 2009, 2008 and 2007 was $14.8 million, $28.4 million and $197.9 million, respectively. Capital spending for 2009 was $14.9 million which was used for various investments in information technology systems, technology hardware, and distribution center equipment including several facility projects. During 2008, the Company used cash for investing activities to acquire Emco Distribution LLC for $15.2 million. Capital spending for 2008 was $31.7 million which was used for various investments in information technology systems, technology hardware, and distribution center equipment including several facility projects. Proceeds from the sales of two distribution centers and the Company's former corporate headquarters were $18.2 million. During 2007, the Company used cash for investing activities to acquire ORS Nasco, for approximately $180.6 million, net of cash acquired. Capital spending in 2007 was $18.7 million. A final payment related to the sale of the Company's Canadian Division was received in 2007 for $1.3 million. The Company expects gross capital spending (before the impact of any sales proceeds) for 2010 to be approximately $30 million.
Cash Flows From Financing Activities
The Company's cash flow from financing activities is largely dependent on levels of borrowing under the Company's credit agreements and the acquisition or issuance of treasury stock.
Net cash used in financing activities for 2009 totaled $216.7 million, compared to a source of cash of $146.4 million in 2008. This change reflects a $433.4 million change in cash used to reduce net borrowings from the revolving credit facility and other financing agreements. This was partially offset by a reduction in share repurchases of $67.5 million in 2009. Net cash provided by financing activities for 2008 totaled $146.4 million, compared to a use of cash of $13.2 million in 2007. This change is due to a decline in share repurchase activity of $315.8 million partially offset by a reduction in net borrowings from the revolving credit facility and other financing agreements of $121.6 million, a $26.9 million decline in net proceeds from the exercise of stock options, and a $9.4 million decline in proceeds from the excess tax benefits related to share-based compensation.
Seasonality
The Company experiences seasonality in its working capital needs, with highest requirements in December through February, reflecting a build-up in inventory prior to and during the peak January sales period. See the information under the heading "Seasonality" in Part I, Item 1 of this Annual Report on
36
Form 10-K. The Company believes that its current availability is sufficient to satisfy the seasonal working capital needs for the foreseeable future.
Inflation/Deflation and Changing Prices
The Company maintains substantial inventories to accommodate the prompt service and delivery requirements of its customers. Accordingly, the Company purchases its products on a regular basis in an effort to maintain its inventory at levels that it believes are sufficient to satisfy the anticipated needs of its customers, based upon historical buying practices and market conditions. Although the Company historically has been able to pass through manufacturers' price increases to its customers on a timely basis, competitive conditions will influence how much of future price increases can be passed on to the Company's customers. Conversely, when manufacturers' prices decline, lower sales prices could result in lower margins as the Company sells existing inventory. As a result, changes in the prices paid by the Company for its products could have a material effect on the Company's net sales, gross margins and net income. See the information under the heading "Comparison of Results for the Years Ended December 31, 2009 and 2008" in Part I, Item 7 of this Annual Report or Form 10-K for further analysis on these changes in prices in 2009.
New Accounting Pronouncements
In December 2007, the Financial Accounting Standards Board ("FASB") issued new accounting guidance on business combinations, which is a revision to previous guidance, originally issued in June 2001. The revised guidance retains the fundamental requirements of the previous guidance but also defines the acquirer and establishes the acquisition date as the date that the acquirer achieves control. The main features of the new business combinations accounting guidance are that it requires an acquirer to recognize the assets acquired, the liabilities assumed, and any non-controlling interest in the acquiree at the acquisition date, measured at their fair values as of that date, with limited exceptions. The new guidance also requires the acquirer to recognize goodwill as of the acquisition date. Finally, the new guidance makes a number of other significant amendments to other prior guidance and other authoritative guidance including requiring research and development costs acquired to be capitalized separately from goodwill and requiring the expensing of transaction costs directly related to an acquisition. This new guidance is effective for acquisitions on or after the beginning of the first fiscal year beginning on or after December 15, 2008. The adoption of this new guidance on business combinations on January 1, 2009 did not have a material impact on the Company's financial position and/or its results of operations.
In December 2007, the FASB issued new guidance on non-controlling interests in consolidated financial statements which requires, among other items, that ownership interest in subsidiaries held by parties other than the parent be clearly identified, labeled, and presented in the consolidated statement of financial position within equity, but separate from the parent's equity. The new guidance also requires that the amount of consolidated net income attributable to the parent and to the non-controlling interest be clearly identified and presented on the face of the consolidated statement of income. Finally, the new guidance requires that entities provide sufficient disclosures that clearly identify and distinguish between the interests of the parent and the interests of the non-controlling owners. This new guidance is effective for fiscal years beginning on or after December 15, 2008. The adoption of this new guidance on January 1, 2009 did not have an impact on the Company's financial position and/or its results of operations.
In February 2008, the FASB issued new guidance which delayed the effective date of prior guidance on fair value accounting for all nonfinancial assets and nonfinancial liabilities, except those that are recognized or disclosed at fair value in the financial statements on a recurring basis (at least annually), until fiscal years beginning after November 15, 2008, and interim periods within those fiscal years. Effective January 1, 2009, the Company adopted this prior guidance on fair value accounting for
37
nonfinancial assets and liabilities recognized at fair value on a non-recurring basis. This adoption did not have a material impact on the Company's consolidated financial position, results of operations or cash flows. See Note 21, "Fair Value Measurements", for information and related disclosures regarding the Company's fair value measurements.
In March 2008, the FASB issued accounting guidance on disclosures about derivative instruments and hedging activities, which amends and expands the disclosure requirements of prior guidance on derivative instruments, with the intent to provide users of financial statements with an enhanced understanding of an entity's derivative and hedging activities. Specifically, this new guidance requires further disclosure on the following: 1) how and why an entity uses derivative instruments; 2) how derivative instruments and related hedged items are accounted for under previous FASB guidance and its related interpretations; and 3) how derivative instruments and related hedged items affect an entity's financial position, financial performance, and cash flows. In order to meet these requirements, the new guidance issued in March 2008 requires qualitative disclosures about objectives and strategies for using derivatives, quantitative disclosures about fair value amounts of gains and losses on derivative instruments, and disclosures about credit risk-related contingent features in derivative agreements. This new guidance is effective for fiscal years beginning after November 15, 2008. The adoption of this new guidance on January 1, 2009 did not have a material impact on the Company's financial position and/or its results of operations. Disclosure requirements of this guidance are included in Note 20, "Derivative Financial Instruments."
In April 2008, the FASB issued accounting guidance on determining the useful life of intangible assets, which amends previous guidance on goodwill and other intangible assets, in an effort to better align the useful life of a recognized intangible asset for provisions of this previous guidance to the period of expected future cash flows, as used to determine the asset's fair value, in accordance with new accounting guidance on business combinations. The new guidance is effective for fiscal years beginning after December 15, 2008 and requires disclosure of an entity's intent and ability to renew and/or extend the useful life of recognized intangibles as well as its accounting treatment of related costs (see Note 4, "Goodwill and Intangible Assets"). In addition, the Statement also requires that entities develop useful life renewal or extension assumptions, either upon its own historical experience or, in such an absence, that which market participants would use, and to incorporate those assumptions into the entity's determination of newly acquired intangible asset fair values. The adoption of this new accounting guidance on January 1, 2009 did not have an impact on the Company's financial position and/or its results of operations.
In December 2008, the FASB issued additional guidance on employers' disclosures about postretirement benefit plan assets. This guidance requires enhanced disclosures about the plan assets of a Company's defined benefit pension and other postretirement plans intended to provide financial users with a greater understanding of: 1) how investment allocations are made; 2) the major categories of plan assets; 3) the inputs and valuation techniques used to measure the fair value of plan assets; 4) the effect of fair value measurements using significant unobservable inputs on changes in plan assets for the period; and 5) significant concentrations of risk within plan assets. The Company adopted these additional disclosure requirements for the year ending December 31, 2009. These additional disclosure requirements had no impact on the Company's financial position, results of operations or cash flows.
In June 2008, the FASB issued new accounting guidance on determining whether instruments granted in share-based payment transactions are participating securities, which states that unvested share-based payment awards that contain non-forfeitable rights to dividends or dividend equivalents (whether paid or unpaid) are considered participating securities and shall be included in the computation of earnings per share pursuant to the two-class method. The two-class method is an earnings allocation formula that treats a participating security as having rights to earnings that would otherwise have been available to common shareholders. The provisions of this new guidance are retrospective. The adoption
38
of this new guidance on January 1, 2009 did not have a material impact on the Company's financial position and/or its results of operations.
In March 2009, the FASB issued new accounting guidance on determining fair value when the volume and level of activity for the asset or liability have significantly decreased and identifying transactions that are not orderly. The new guidance requires entities to evaluate the significance and relevance of market factors for fair value inputs to determine if, due to reduced volume and market activity, the factors are still relevant and substantive measures of fair value. The new guidance is effective for interim and annual reporting periods ending after June 15, 2009. The adoption of this new guidance for the period ending June 30, 2009 did not have a material effect on the Company's financial position and/or results of operations.
In April 2009, the FASB issued new accounting guidance on interim disclosures about fair value of financial instruments. The new guidance requires disclosures about fair value of financial instruments for interim reporting periods of publicly traded companies as well as in annual financial statements. This guidance also amends previous guidance on Interim Financial Reporting, to require those disclosures in summarized financial information at interim reporting periods. The new guidance is effective for interim reporting periods ending after June 15, 2009. The adoption of this new accounting guidance for the period ending June 30, 2009 did not have a material effect on the Company's financial position and/or results of operations.
In May 2009, the FASB issued new accounting guidance on subsequent events intended to improve disclosure of significant events that occur after the interim and/or annual financial statement date as well as to specify a time period through which management has included analysis of such subsequent events. This new guidance is effective for all interim and annual periods beginning on or after June 15, 2009. Accordingly, the Company adopted this guidance during the second quarter of 2009. The Company has evaluated subsequent events through February 24, 2010.
In June 2009, the FASB issued new guidance on the accounting for transfers of financial assets. The new guidance is a revision to prior guidance and will require more information about transfers of financial assets, including securitization transactions, and where companies have continuing exposure to the risks related to transferred financial assets. It eliminates the concept of a "qualifying special-purpose entity," changes the requirements for derecognizing financial assets, and requires additional disclosures. Also, in June 2009, the FASB issued new guidance on accounting for Variable Interest Entities. This new guidance is a revision to prior guidance on Variable Interest Entities, and changes how a company determines when an entity that is insufficiently capitalized or is not controlled through voting (or similar rights) should be consolidated. The determination of whether a company is required to consolidate an entity is based on, among other things, an entity's purpose and design and a company's ability to direct the activities of the entity that most significantly impact the entity's economic performance. This new guidance on Variable Interest Entities will be effective at the start of a company's first fiscal year beginning after November 15, 2009. Management is in the process of evaluating the impact that this guidance will have on the Company's financial position and/or results of operations.
In June 2009, the FASB issued new guidance on the FASB accounting standards codification and the hierarchy of Generally Accepted Accounting Principles, which replaced previous guidance on this subject. The codification will become the source of authoritative U.S. Generally Accepted Accounting Principles (GAAP) recognized by the FASB to be applied by nongovernmental entities. Rules and interpretive releases of the SEC under authority of federal securities laws are also sources of authoritative GAAP for SEC registrants. This statement is effective for financial statements issued for interim and annual periods ending after September 15, 2009. The adoption of this guidance did not have an impact on the Company's financial position and/or its results of operations.
In January 2010, the FASB issued new guidance and clarifications to previously issued guidance to improve disclosures about fair value measurements. These new disclosures include stating separately
39
the amounts of significant transfers in and out of Level 1 and Level 2 fair value measurements and the reasons for the transfers. In addition, it states that a reporting entity should present separately information about purchases, sales, issuances, and settlements in the reconciliation for fair value measurements using Level 3 inputs. The new disclosures and clarifications of existing disclosures are effective for interim and annual reporting periods beginning after December 15, 2009, except for the disclosures about purchases, sales, issuances, and settlements in the roll forward of activity in Level 3 fair value measurements. Those disclosures are effective for fiscal years beginning after December 15, 2010, and for interim periods within those fiscal years. The adoption of this new guidance will not have a material impact on the Company's financial position and/or its results of operations. See Note 21, "Fair Value Measurements", for information and related disclosures regarding the Company's fair value measurements.
ITEM 7A. QUANTITATIVE AND QUALITATIVE DISCLOSURES ABOUT MARKET RISK.
The Company is subject to market risk associated principally with changes in interest rates and foreign currency exchange rates.
Interest Rate Risk
The Company's exposure to interest rate risks is principally limited to the Company's outstanding long-term debt at December 31, 2009 of $441.8 million. As of December 31, 2009, 100% of the Company's outstanding debt is priced at variable interest rates based primarily on the applicable bank prime rate, the LIBOR or the applicable commercial paper rates related to the Receivables Securitization Program. While the Company does have $441.8 million of outstanding debt with interest based on variable market rates at December 31, 2009, the Company has hedged $435.0 million of this debt with three separate fixed interest rate swaps. See Note 2, "Summary of Significant Accounting Policies", and Note 20, "Derivative Financial Instruments", to the Consolidated Financial Statements. As of December 31, 2009, the overall weighted average effective borrowing rate of the Company's debt was 5.0%. At year-end $6.8 million of long-term debt was based on variable market rates not subject to the Company's interest rate swap transactions. A 50 basis point movement in interest rates would not result in a material increase or decrease in annualized interest expense, on a pre-tax basis, nor upon cash flows from operations.
Foreign Currency Exchange Rate Risk
The Company's foreign currency exchange rate risk is limited principally to the Mexican Peso, as well as product purchases from Asian countries valued and paid in U.S. dollars. Many of the products the Company sells in Mexico are purchased in U.S. dollars, while the sale is invoiced in the local currency. The Company's foreign currency exchange rate risk is not material to its financial position, results of operations and cash flows. The Company has not previously hedged these transactions, but it may enter into hedging transactions in the future.
40
ITEM 8. FINANCIAL STATEMENTS AND SUPPLEMENTARY DATA.
MANAGEMENT REPORT ON INTERNAL CONTROL OVER FINANCIAL REPORTING
Management of the Company is responsible for establishing and maintaining adequate internal control over financial reporting. Internal control over financial reporting is defined in Rules 13a-15(f) and 15d-15(f) under the Exchange Act to mean a process designed by, or under the supervision of, the Company's principal executive and principal financial officers to provide reasonable assurance regarding the reliability of financial reporting and the preparation of financial statements for external purposes in accordance with generally accepted accounting principles. Internal control over financial reporting includes those policies and procedures that (i) pertain to the maintenance of records that in reasonable detail accurately and fairly reflect the transactions and dispositions of the assets of the Company; (ii) provide reasonable assurance that transactions are recorded as necessary to permit preparation of financial statements in accordance with generally accepted accounting principles, and that receipts and expenditures of the Company are being made only in accordance with authorizations of management and directors of the Company; and (iii) provide reasonable assurance regarding prevention or timely detection of unauthorized acquisition, use or disposition of the Company's assets that could have a material effect on the Consolidated Financial Statements.
Any system of internal control, no matter how well designed, has inherent limitations, including the possibility that a control can be circumvented or overridden and misstatements due to error or fraud may occur and not be detected. Also, because of changes in conditions, internal control effectiveness may vary over time. Accordingly, even an effective system of internal control will provide only reasonable assurance with respect to financial statement preparation.
Management assessed the effectiveness of the Company's internal control over financial reporting as of December 31, 2009 in relation to the criteria established in Internal Control—Integrated Framework issued by the Committee of Sponsoring Organizations of the Treadway Commission. Management's assessment included an evaluation of elements such as the design and operating effectiveness of key financial reporting controls, process documentation, accounting policies and the Company's overall control environment. That assessment was supported by testing and monitoring performed both by the Company's Internal Audit organization and its Finance organization.
Based on that assessment, management concluded that as of December 31, 2009, the Company's internal control over financial reporting was effective. Management reviewed the results of its assessment with the Audit Committee of our Board of Directors.
Ernst & Young LLP, an independent registered public accounting firm, who audited and reported on the Consolidated Financial Statements included in this Annual Report on Form 10-K, has issued an attestation report on the effectiveness of the Company's internal control over financial reporting as stated in their report which appears on page 42 of this Annual Report on Form 10-K.
41
REPORT OF INDEPENDENT REGISTERED PUBLIC ACCOUNTING FIRM
The Board of Directors and
Stockholders of United Stationers Inc.
We have audited United Stationers Inc. and subsidiaries' internal control over financial reporting as of December 31, 2009, based on criteria established in Internal Control—Integrated Framework issued by the Committee of Sponsoring Organizations of the Treadway Commission (the COSO criteria). United Stationers Inc. and subsidiaries' management is responsible for maintaining effective internal control over financial reporting, and for its assessment of the effectiveness of internal control over financial reporting included in the accompanying report, Management Report of Internal Control over Financial Reporting. Our responsibility is to express an opinion on the company's internal control over financial reporting based on our audit.
We conducted our audit in accordance with the standards of the Public Company Accounting Oversight Board (United States). Those standards require that we plan and perform the audit to obtain reasonable assurance about whether effective internal control over financial reporting was maintained in all material respects. Our audit included obtaining an understanding of internal control over financial reporting, assessing the risk that a material weakness exists, testing and evaluating the design and operating effectiveness of internal control based on the assessed risk, and performing such other procedures as we considered necessary in the circumstances. We believe that our audit provides a reasonable basis for our opinion.
A company's internal control over financial reporting is a process designed to provide reasonable assurance regarding the reliability of financial reporting and the preparation of financial statements for external purposes in accordance with generally accepted accounting principles. A company's internal control over financial reporting includes those policies and procedures that (1) pertain to the maintenance of records that, in reasonable detail, accurately and fairly reflect the transactions and dispositions of the assets of the company; (2) provide reasonable assurance that transactions are recorded as necessary to permit preparation of financial statements in accordance with generally accepted accounting principles, and that receipts and expenditures of the company are being made only in accordance with authorizations of management and directors of the company; and (3) provide reasonable assurance regarding prevention or timely detection of unauthorized acquisition, use, or disposition of the company's assets that could have a material effect on the financial statements.
Because of its inherent limitations, internal control over financial reporting may not prevent or detect misstatements. Also, projections of any evaluation of effectiveness to future periods are subject to the risk that controls may become inadequate because of changes in conditions, or that the degree of compliance with the policies or procedures may deteriorate.
In our opinion, United Stationers Inc. and subsidiaries maintained, in all material respects, effective internal control over financial reporting as of December 31, 2009, based on the COSO criteria.
We also have audited, in accordance with the standards of the Public Company Accounting Oversight Board (United States), the consolidated balance sheets of United Stationers Inc. and subsidiaries as of December 31, 2009 and 2008, and the related consolidated statements of income, stockholders' equity, and cash flows for each of the three years in the period ended December 31, 2009, and our report dated February 25, 2010, expressed an unqualified opinion thereon.
/s/ ERNST & YOUNG LLP |
Chicago, Illinois
February 25, 2010
42
REPORT OF INDEPENDENT REGISTERED PUBLIC ACCOUNTING FIRM
The Board of Directors and Stockholders of
United Stationers Inc.
We have audited the accompanying consolidated balance sheets of United Stationers Inc. and subsidiaries as of December 31, 2009 and 2008, and the related consolidated statements of income, stockholders' equity, and cash flows for each of the three years in the period ended December 31, 2009. Our audits also included the financial statement schedule listed in the index at Item 15(a). These consolidated financial statements and schedule are the responsibility of the Company's management. Our responsibility is to express an opinion on these financial statements and schedule based on our audits.
We conducted our audits in accordance with the standards of the Public Company Accounting Oversight Board (United States). Those standards require that we plan and perform the audit to obtain reasonable assurance about whether the financial statements are free of material misstatement. An audit includes examining, on a test basis, evidence supporting the amounts and disclosures in the financial statements. An audit also includes assessing the accounting principles used and significant estimates made by management, as well as evaluating the overall financial statement presentation. We believe that our audits provide a reasonable basis for our opinion.
In our opinion, the consolidated financial statements referred to above present fairly, in all material respects, the consolidated financial position of United Stationers Inc. and subsidiaries at December 31, 2009 and 2008, and the consolidated results of their operations and their cash flows for each of the three years in the period ended December 31, 2009, in conformity with U.S. generally accepted accounting principles. Also, in our opinion, the related financial statement schedule, when considered in relation to the basic financial statements taken as a whole, presents fairly in all material respects, the information set forth therein.
We also have audited, in accordance with the standards of the Public Company Accounting Oversight Board (United States), United Stationers Inc. and subsidiaries' internal control over financial reporting as of December 31, 2009, based on criteria established in Internal Control-Integrated Framework issued by the Committee of Sponsoring Organizations of the Treadway Commission and our report dated February 25, 2010 expressed an unqualified opinion thereon.
/s/ ERNST & YOUNG LLP |
Chicago, Illinois
February 25, 2010
43
UNITED STATIONERS INC. AND SUBSIDIARIES
CONSOLIDATED STATEMENTS OF INCOME
(in thousands, except per share data)
| |
Years Ended December 31, | ||||||||||
|---|---|---|---|---|---|---|---|---|---|---|---|
| |
2009 | 2008 | 2007 | ||||||||
Net sales |
$ | 4,710,291 | $ | 4,986,878 | $ | 4,646,399 | |||||
Cost of goods sold |
4,019,650 | 4,246,199 | 3,939,684 | ||||||||
Gross profit |
690,641 | 740,679 | 706,715 | ||||||||
Operating expenses: |
|||||||||||
Warehousing, marketing and administrative expenses |
499,659 | 548,222 | 502,810 | ||||||||
Restructuring, severance and other charges, net |
3,354 | — | 1,378 | ||||||||
Total operating expenses |
503,013 | 548,222 | 504,188 | ||||||||
Operating income |
187,628 | 192,457 | 202,527 | ||||||||
Interest expense |
27,797 | 28,563 | 13,109 | ||||||||
Interest income |
(474 | ) | (1,048 | ) | (1,197 | ) | |||||
Other expense, net |
204 | 8,079 | 14,595 | ||||||||
Income before income taxes |
160,101 | 156,863 | 176,020 | ||||||||
Income tax expense |
59,116 | 58,449 | 68,825 | ||||||||
Net income |
$ | 100,985 | $ | 98,414 | $ | 107,195 | |||||
Net income per share—basic: |
|||||||||||
Net income per share—basic |
$ | 4.32 | $ | 4.17 | $ | 3.92 | |||||
Average number of common shares outstanding—basic |
23,370 | 23,578 | 27,323 | ||||||||
Net income per share—diluted: |
|||||||||||
Net income per share—diluted |
$ | 4.19 | $ | 4.13 | $ | 3.83 | |||||
Average number of common shares outstanding—diluted |
24,096 | 23,847 | 27,976 | ||||||||
See notes to Consolidated Financial Statements.
44
UNITED STATIONERS INC. AND SUBSIDIARIES
CONSOLIDATED BALANCE SHEETS
(dollars in thousands, except share data)
| |
As of December 31, | ||||||||
|---|---|---|---|---|---|---|---|---|---|
| |
2009 | 2008 | |||||||
ASSETS |
|||||||||
Current assets: |
|||||||||
Cash and cash equivalents |
$ | 18,555 | $ | 10,662 | |||||
Accounts receivable and retained interest in receivables sold, less allowance for doubtful accounts of $35,216 in 2009 and $32,544 in 2008 |
641,317 | 610,210 | |||||||
Inventories |
590,854 | 680,516 | |||||||
Other current assets |
33,026 | 33,857 | |||||||
Total current assets |
1,283,752 | 1,335,245 | |||||||
Property, plant and equipment, at cost: |
|||||||||
Land |
12,259 | 12,259 | |||||||
Buildings |
58,768 | 58,768 | |||||||
Fixtures and equipment |
272,401 | 268,368 | |||||||
Leasehold improvements |
22,994 | 20,786 | |||||||
Capitalized software costs |
55,912 | 50,971 | |||||||
Total property, plant and equipment |
422,334 | 411,152 | |||||||
Less—accumulated depreciation and amortization |
287,302 | 258,138 | |||||||
Net property, plant and equipment |
135,032 | 153,014 | |||||||
Intangible assets, net |
62,932 | 67,982 | |||||||
Goodwill |
314,429 | 314,441 | |||||||
Other |
12,371 | 10,834 | |||||||
Total assets |
$ | 1,808,516 | $ | 1,881,516 | |||||
|
|||||||||
Current liabilities: |
|||||||||
Accounts payable |
$ | 390,883 | $ | 341,084 | |||||
Accrued liabilities |
171,366 | 186,530 | |||||||
Total current liabilities |
562,249 | 527,614 | |||||||
Deferred income taxes |
4,052 | — | |||||||
Long-term debt |
441,800 | 663,100 | |||||||
Other long-term liabilities |
93,702 | 125,164 | |||||||
Total liabilities |
1,101,803 | 1,315,878 | |||||||
Stockholders' equity: |
|||||||||
Common stock, $0.10 par value; authorized—100,000,000 shares, issued—37,217,814 in 2009 and 2008 |
3,722 | 3,722 | |||||||
Additional paid-in capital |
387,131 | 382,721 | |||||||
Treasury stock, at cost—13,237,495 shares in 2009 and 13,687,843 shares in 2008 |
(700,294 | ) | (712,944 | ) | |||||
Retained earnings |
1,058,074 | 957,089 | |||||||
Accumulated other comprehensive loss, net of tax |
(41,920 | ) | (64,950 | ) | |||||
Total stockholders' equity |
706,713 | 565,638 | |||||||
Total liabilities and stockholders' equity |
$ | 1,808,516 | $ | 1,881,516 | |||||
See notes to Consolidated Financial Statements.
45
UNITED STATIONERS INC. AND SUBSIDIARIES
CONSOLIDATED STATEMENTS OF CHANGES IN STOCKHOLDERS' EQUITY
(dollars in thousands, except share data)
| |
Common Stock | Treasury Stock | |
Accumulated Other Comprehensive Income (Loss) |
|
|
||||||||||||||||||||
|---|---|---|---|---|---|---|---|---|---|---|---|---|---|---|---|---|---|---|---|---|---|---|---|---|---|---|
| |
Additional Paid-in Capital |
Retained Earnings |
Total Stockholders' Equity |
|||||||||||||||||||||||
| |
Shares | Amount | Shares | Amount | ||||||||||||||||||||||
As of December 31, 2006 |
37,217,814 | $ | 3,722 | (7,172,932 | ) | $ | (297,815 | ) | $ | 360,047 | $ | (15,336 | ) | $ | 750,322 | $ | 800,940 | |||||||||
Net income |
— | — | — | — | — | — | 107,195 | 107,195 | ||||||||||||||||||
Unrealized translation adjustments |
— | — | — | — | — | (300 | ) | — | (300 | ) | ||||||||||||||||
Minimum pension liability adjustments, net of tax of $1,789 |
— | — | — | — | — | 2,983 | — | 2,983 | ||||||||||||||||||
Unrealized loss on interest rate swaps, net of tax benefit of $1,380 |
— | — | — | — | — | (2,299 | ) | — | (2,299 | ) | ||||||||||||||||
Comprehensive income |
— | — | — | — | — | 384 | 107,195 | 107,579 | ||||||||||||||||||
Adoption of FIN 48 |
— | — | — | — | — | — | 1,775 | 1,775 | ||||||||||||||||||
Acquisition of treasury stock |
— | — | (6,562,049 | ) | (383,360 | ) | — | — | — | (383,360 | ) | |||||||||||||||
Stock compensation |
— | — | 1,089,468 | 30,988 | 16,332 | — | — | 47,320 | ||||||||||||||||||
As of December 31, 2007 |
37,217,814 | $ | 3,722 | (12,645,513 | ) | $ | (650,187 | ) | $ | 376,379 | $ | (14,952 | ) | $ | 859,292 | $ | 574,254 | |||||||||
Net income |
— | — | — | — | — | — | 98,414 | 98,414 | ||||||||||||||||||
Unrealized translation adjustments |
— | — | — | — | — | (3,585 | ) | — | (3,585 | ) | ||||||||||||||||
Minimum pension liability adjustments, net of tax benefits of $17,059 |
— | — | — | — | — | (27,715 | ) | — | (27,715 | ) | ||||||||||||||||
Unrealized loss on interest rate swaps, net of tax benefit of $11,800 |
— | — | — | — | — | (19,172 | ) | — | (19,172 | ) | ||||||||||||||||
Comprehensive (loss) income |
— | — | — | — | — | (50,472 | ) | 98,414 | 47,942 | |||||||||||||||||
Adjustments to apply SFAS No. 158, net of tax benefit of $88 |
— | — | — | — | — | 474 | (617 | ) | (143 | ) | ||||||||||||||||
Acquisition of treasury stock |
— | — | (1,233,199 | ) | (67,477 | ) | — | — | — | (67,477 | ) | |||||||||||||||
Stock compensation |
— | — | 190,869 | 4,720 | 6,342 | — | — | 11,062 | ||||||||||||||||||
As of December 31, 2008 |
37,217,814 | $ | 3,722 | (13,687,843 | ) | $ | (712,944 | ) | $ | 382,721 | $ | (64,950 | ) | $ | 957,089 | $ | 565,638 | |||||||||
Net income |
— | — | — | — | — | — | 100,985 | 100,985 | ||||||||||||||||||
Unrealized translation adjustments |
— | — | — | — | — | 574 | — | 574 | ||||||||||||||||||
Minimum pension liability adjustments, net of tax loss of $10,502 |
— | — | — | — | — | 17,135 | — | 17,135 | ||||||||||||||||||
Unrealized loss on interest rate swaps, net of tax loss of $3,261 |
— | — | — | — | — | 5,321 | — | 5,321 | ||||||||||||||||||
Comprehensive income |
— | — | — | — | — | 23,030 | 100,985 | 124,015 | ||||||||||||||||||
Stock compensation |
— | — | 450,348 | 12,650 | 4,410 | — | — | 17,060 | ||||||||||||||||||
As of December 31, 2009 |
37,217,814 | $ | 3,722 | (13,237,495 | ) | $ | (700,294 | ) | $ | 387,131 | $ | (41,920 | ) | $ | 1,058,074 | $ | 706,713 | |||||||||
See notes to Consolidated Financial Statements.
46
UNITED STATIONERS INC. AND SUBSIDIARIES
CONSOLIDATED STATEMENTS OF CASH FLOWS
(dollars in thousands)
| |
Years Ended December 31, | ||||||||||||
|---|---|---|---|---|---|---|---|---|---|---|---|---|---|
| |
2009 | 2008 | 2007 | ||||||||||
Cash Flows From Operating Activities: |
|||||||||||||
Net income |
$ | 100,985 | $ | 98,414 | $ | 107,195 | |||||||
Adjustments to reconcile net income to net cash provided by (used in) operating activities: |
|||||||||||||
Depreciation |
35,797 | 38,683 | 40,090 | ||||||||||
Amortization of intangible assets |
4,950 | 4,774 | 2,610 | ||||||||||
Amortization of capitalized financing costs |
927 | 924 | 705 | ||||||||||
Write-off of capitalized software development costs |
— | 6,735 | — | ||||||||||
Share-based compensation |
12,266 | 8,971 | 8,888 | ||||||||||
Excess tax benefits related to share-based compensation |
(712 | ) | (72 | ) | (9,467 | ) | |||||||
Write down of assets held for sale |
— | — | 546 | ||||||||||
Loss (gain) on the disposition of property, plant and equipment |
566 | (9,851 | ) | 529 | |||||||||
Deferred income taxes |
(10,340 | ) | 447 | (4,119 | ) | ||||||||
Changes in operating assets and liabilities, excluding the effects of acquisitions: |
|||||||||||||
Increase in accounts receivable and retained interest in accounts receivable sold, net |
(31,175 | ) | (185,728 | ) | (3,567 | ) | |||||||
Decrease in inventories |
89,815 | 39,530 | 14,404 | ||||||||||
Decrease (increase) in other assets |
2,106 | (14,752 | ) | (6,161 | ) | ||||||||
Increase (decrease) in accounts payable |
647 | (76,449 | ) | 70,012 | |||||||||
Increase (decrease) in checks in-transit |
49,244 | (31,566 | ) | (27,349 | ) | ||||||||
(Decrease) increase in accrued liabilities |
(18,212 | ) | (14,137 | ) | 21,211 | ||||||||
Increase in other liabilities |
2,531 | 4,772 | 2,527 | ||||||||||
Net cash provided by (used in) operating activities |
239,395 | (129,305 | ) | 218,054 | |||||||||
Cash Flows From Investing Activities: |
|||||||||||||
Acquisitions, net of cash acquired |
— | (14,891 | ) | (180,603 | ) | ||||||||
Sale of Canadian Division |
— | — | 1,295 | ||||||||||
Capital expenditures |
(14,924 | ) | (31,713 | ) | (18,685 | ) | |||||||
Proceeds from the disposition of property, plant and equipment |
95 | 18,238 | 95 | ||||||||||
Net cash used in investing activities |
(14,829 | ) | (28,366 | ) | (197,898 | ) | |||||||
Cash Flows From Financing Activities: |
|||||||||||||
Net (repayments) borrowings under Revolving Credit Facility |
(221,300 | ) | 212,100 | (1,300 | ) | ||||||||
Borrowings from financing agreements |
— | — | 335,000 | ||||||||||
Payment of debt issuance costs |
(897 | ) | (256 | ) | (1,990 | ) | |||||||
Net proceeds from the exercise of stock options |
4,818 | 2,019 | 28,965 | ||||||||||
Acquisition of treasury stock, at cost |
— | (67,505 | ) | (383,330 | ) | ||||||||
Excess tax benefits related to share-based compensation |
712 | 72 | 9,467 | ||||||||||
Net cash (used in) provided by financing activities |
(216,667 | ) | 146,430 | (13,188 | ) | ||||||||
Effect of exchange rate changes on cash and cash equivalents |
(6 | ) | (54 | ) | — | ||||||||
Net change in cash and cash equivalents |
7,893 | (11,295 | ) | 6,968 | |||||||||
Cash and cash equivalents, beginning of period |
10,662 | 21,957 | 14,989 | ||||||||||
Cash and cash equivalents, end of period |
$ | 18,555 | $ | 10,662 | $ | 21,957 | |||||||
See notes to Consolidated Financial Statements.
47
UNITED STATIONERS INC. AND SUBSIDIARIES
NOTES TO CONSOLIDATED FINANCIAL STATEMENTS
1. Basis of Presentation
The accompanying Consolidated Financial Statements represent United Stationers Inc. ("USI") with its wholly owned subsidiary United Stationers Supply Co. ("USSC"), and USSC's subsidiaries (collectively, "United" or the "Company"). The Consolidated Financial Statements have been prepared in accordance with accounting principles generally accepted in the United States and include the accounts of USI and its subsidiaries. All intercompany transactions and balances have been eliminated. The Company is a leading wholesale distributor of business products, with net sales of nearly $4.7 billion for the year ended December 31, 2009. The Company operates in a single reportable segment as a national wholesale distributor of business products. The Company stocks about 100,000 items from over 1,000 manufacturers. These items include a broad spectrum of technology products, traditional office products, office furniture, janitorial and breakroom supplies, and industrial supplies. In addition, the Company also offers private brand products. The Company primarily serves commercial and contract office products dealers, janitorial/breakroom product distributors, computer product resellers, furniture dealers and industrial product distributors. The Company sells its products through a national distribution network of 64 distribution centers to over 25,000 resellers, who in turn sell directly to end-consumers.
Reclassifications
Certain prior period amounts have been reclassified to conform to the current presentation. Such reclassifications were limited to Balance Sheet and Cash Flow Statement presentation and did not impact the Statements of Income.
The Company reclassified certain offsets to "Accrued Liabilities" related to merchandise return reserves to "Inventory". This reclassification began in the fourth quarter of 2007, with prior periods updated to conform to this presentation. For the year ended December 31, 2007, $7.0 million was reclassified to "Inventory" out of "Accrued Liabilities" with corresponding changes made to the Statement of Cash Flows within "Cash Flows From Operating Activities".
2. Summary of Significant Accounting Policies
Principles of Consolidation
The Consolidated Financial Statements include the accounts of the Company. All significant intercompany accounts and transactions have been eliminated in consolidation. For all acquisitions, account balances and results of operations are included in the Consolidated Financial Statements as of the date acquired.
Use of Estimates
The preparation of financial statements in conformity with accounting principles generally accepted in the United States requires management to make estimates and assumptions that affect the amounts reported in the Consolidated Financial Statements and accompanying notes. Actual results could differ from these estimates.
Various assumptions and other factors underlie the determination of significant accounting estimates. The process of determining significant estimates is fact specific and takes into account factors such as historical experience, current and expected economic conditions, product mix, and in some cases, actuarial techniques. The Company periodically reevaluates these significant factors and makes adjustments where facts and circumstances dictate.
48
UNITED STATIONERS INC. AND SUBSIDIARIES
NOTES TO CONSOLIDATED FINANCIAL STATEMENTS (Continued)
2. Summary of Significant Accounting Policies (Continued)
Supplier Allowances
Supplier allowances (fixed or variable) are common practice in the business products industry and have a significant impact on the Company's overall gross margin. Gross margin is determined by, among other items, file margin (determined by reference to invoiced price), as reduced by customer discounts and rebates as discussed below, and increased by supplier allowances and promotional incentives. Receivables related to supplier allowances totaled $78.2 million and $91.8 million as of December 31, 2009 and 2008, respectively. These receivables are included in "Accounts receivable" in the Consolidated Balance Sheets.
In 2009, approximately 17% of the Company's annual supplier allowances and incentives were fixed, based on supplier participation in various Company advertising and marketing publications. Fixed allowances and incentives are taken to income through lower cost of goods sold as inventory is sold.
The remaining 83% of the Company's annual supplier allowances and incentives in 2009 were variable, based on the volume and mix of the Company's product purchases from suppliers. These variable allowances are recorded based on the Company's annual inventory purchase volumes and product mix and are included in the Company's Consolidated Financial Statements as a reduction to cost of goods sold, thereby reflecting the net inventory purchase cost. Supplier allowances and incentives attributable to unsold inventory are carried as a component of net inventory cost. The potential amount of variable supplier allowances often differs based on purchase volumes by supplier and product category. As a result, changes in the Company's sales volume (which can increase or reduce inventory purchase requirements) and changes in product sales mix (especially because higher-margin products often benefit from higher supplier allowance rates) can create fluctuations in variable supplier allowances.
Customer Rebates
Customer rebates and discounts are common practice in the business products industry and have a significant impact on the Company's overall sales and gross margin. Such rebates are reported in the Consolidated Financial Statements as a reduction of sales. Customer rebates of $59.5 million and $62.1 million as of December 31, 2009 and 2008, respectively are included as a component of "Accrued liabilities" in the Consolidated Balance Sheets.
Customer rebates include volume rebates, sales growth incentives, advertising allowances, participation in promotions and other miscellaneous discount programs. These rebates are paid to customers monthly, quarterly and/or annually. Estimates for volume rebates and growth incentives are based on estimated annual sales volume to the Company's customers. The aggregate amount of customer rebates depends on product sales mix and customer mix changes. Reported results reflect management's current estimate of such rebates. Changes in estimates of sales volumes, product mix, customer mix or sales patterns, or actual results that vary from such estimates may impact future results.
Revenue Recognition
Revenue is recognized when a service is rendered or when title to the product has transferred to the customer. Management records an estimate for future product returns related to revenue recognized in the current period. This estimate is based on historical product return trends and the gross margin associated with those returns. Management also records customer rebates that are based on annual sales volume to the Company's customers. Annual rebates earned by customers include growth components, volume hurdle components, and advertising allowances.
49
UNITED STATIONERS INC. AND SUBSIDIARIES
NOTES TO CONSOLIDATED FINANCIAL STATEMENTS (Continued)
2. Summary of Significant Accounting Policies (Continued)
Shipping and handling costs billed to customers are treated as revenues and recognized at the time title to the product has transferred to the customer. Freight costs are included in the Company's Consolidated Financial Statements as a component of cost of goods sold and not netted against shipping and handling revenues. Net sales do not include sales tax charged to customers.
Share-Based Compensation
At December 31, 2009, the Company had two active share-based employee compensation plans covering key associates and/or non-employee directors of the Company. See Note 3 to the Consolidated Financial Statements.
Valuation of Accounts Receivable
The Company makes judgments as to the collectability of accounts receivable based on historical trends and future expectations. Management estimates an allowance for doubtful accounts, which addresses the collectability of trade accounts receivable. This allowance adjusts gross trade accounts receivable downward to its estimated collectible, or net realizable value. To determine the allowance for doubtful accounts, management reviews specific customer risks and the Company's accounts receivable aging. Uncollectible receivable balances are written off against the allowance for doubtful accounts when it is determined that the receivable balance is uncollectible.
Goodwill and Intangible Assets
Goodwill is initially recorded based on the premium paid for acquisitions and is subsequently tested for impairment. The Company tests goodwill for impairment annually and whenever events or circumstances indicate that an impairment may have occurred, such as a significant adverse change in the business climate, loss of key personnel or a decision to sell or dispose of a reporting unit. Determining whether an impairment has occurred requires valuation of the respective reporting unit, which the Company estimates using a discounted cash flow method. When available and as appropriate, comparative market multiples are used to corroborate discounted cash flow results. If this analysis indicates goodwill is impaired, an impairment charge would be taken based on the amount of goodwill recorded versus the implied fair value of goodwill computed by independent appraisals.
Intangible assets are initially recorded at their fair market values determined on quoted market prices in active markets, if available, or recognized valuation models. Intangible assets that have finite useful lives are amortized on a straight-line basis over their useful lives. Intangible assets that have indefinite useful lives are not amortized but are tested at least annually for impairment or whenever events or circumstances indicate an impairment may have occurred. See Note 4 to the Consolidated Financial Statements.
Insured Loss Liability Estimates
The Company is primarily responsible for retained liabilities related to workers' compensation, vehicle, property and general liability and certain employee health benefits. The Company records an expense for paid and open claims and an expense for claims incurred but not reported based on historical trends and on certain assumptions about future events. The Company has an annual per-person maximum cap, provided by a third-party insurance company, on certain employee medical benefits. In addition,
50
UNITED STATIONERS INC. AND SUBSIDIARIES
NOTES TO CONSOLIDATED FINANCIAL STATEMENTS (Continued)
2. Summary of Significant Accounting Policies (Continued)
the Company has both a per-occurrence maximum loss and an annual aggregate maximum cap on workers' compensation claims.
Leases
The Company leases real estate and personal property under operating leases. Certain operating leases include incentives from landlords including, landlord "build-out" allowances, rent escalation clauses and rent holidays or periods in which rent is not payable for a certain amount of time. The Company accounts for landlord "build-out" allowances as deferred rent at the time of possession and amortizes this deferred rent on a straight-line basis over the term of the lease. The Company also recognizes leasehold improvements associated with the "build-out" allowances and amortizes these improvements over the shorter of (1) the term of the lease or (2) the expected life of the respective improvements.
The Company accounts for rent escalation and rent holidays as deferred rent at the time of possession and amortizes this deferred rent on a straight-line basis over the term of the lease. As of December 31, 2009, the Company is not a party to any capital leases.
Inventories
Inventory constituting approximately 79% and 81% of total inventory as of December 31, 2009 and December 31, 2008, respectively, has been valued under the last-in, first-out ("LIFO") accounting method. LIFO results in a better matching of costs and revenues. The remaining inventory is valued under the first-in, first-out ("FIFO") accounting method. Inventory valued under the FIFO and LIFO accounting methods is recorded at the lower of cost or market. If the Company had valued its entire inventory under the lower of FIFO cost or market, inventory would have been $80.9 million and $84.7 million higher than reported as of December 31, 2009 and December 31, 2008, respectively. The decrease in the LIFO reserve, which reduced cost of sales by $3.8 million, was driven by decrements in certain LIFO pools. These decrements resulted in liquidations of LIFO inventory quantities carried at lower costs in prior years as compared with the cost of current year purchases. These liquidations resulted in LIFO income of $18.6 million, partially offset by LIFO expense of $14.8 million related to current inflation or a net reduction in cost of sales of $3.8 million referenced above.
The Company records adjustments for shrinkage. Inventory that is obsolete, damaged, defective or slow moving is recorded to the lower of cost or market. These adjustments are determined using historical trends and are adjusted, if necessary, as new information becomes available. The Company charges certain warehousing and administrative expenses to inventory each period with $25.3 million and $29.9 million remaining in inventory as of December 31, 2009 and 2008, respectively.
Pension and Postretirement Health Benefits
The Company adopted the recognition and related disclosure provisions of Financial Accounting Standards Board ("FASB") accounting guidance related to employers' accounting for defined benefit pension and other postretirement plans on December 31, 2006 for its pension and postretirement health benefits. The Company has adopted the measurement date provisions of this accounting guidance for the fiscal year ending December 31, 2008, in accordance with the statement. This adoption measures the plan assets and benefit obligations as of the Company's fiscal year end.
Calculating the Company's obligations and expenses related to its pension and postretirement health benefits requires selection and use of certain actuarial assumptions. As more fully discussed in Notes 12
51
UNITED STATIONERS INC. AND SUBSIDIARIES
NOTES TO CONSOLIDATED FINANCIAL STATEMENTS (Continued)
2. Summary of Significant Accounting Policies (Continued)
and 13 to the Consolidated Financial Statements, these actuarial assumptions include discount rates, expected long-term rates of return on plan assets, and rates of increase in compensation and healthcare costs. To select the appropriate actuarial assumptions, management relies on current market conditions and historical information. Pension expense for 2009 was $6.3 million, compared to $5.6 million and $7.4 million in 2008 and 2007, respectively. A one percentage point decrease in the expected assumed discount rate would have resulted in an increase in pension expense for 2009 of approximately $3.2 million and increased the year-end projected benefit obligation by $20.3 million.
Costs associated with the Company's postretirement health benefits plan totaled $0.1 million each for the years ended 2009, 2008 and 2007. A one-percentage point decrease in the assumed discount rate would have resulted in incremental postretirement healthcare expenses for 2009 of approximately $0.1 million and increased the year-end accumulated postretirement benefit obligation by $0.6 million. Current rates of medical cost increases are trending above the Company's medical cost increase cap of 3% provided by the plan. Accordingly, a one percentage point increase in the assumed average healthcare cost trend would not have a significant impact on the Company's postretirement health plan costs.
The Company implemented a plan to freeze pension service benefits for employees not covered by collective bargaining agreements. The plan freeze was put in place effective March 1, 2009.
Cash Equivalents
An unfunded check balance (payments in-transit) exists for the Company's primary disbursement accounts. Under the Company's cash management system, the Company utilizes available borrowings, on an as-needed basis, to fund the clearing of checks as they are presented for payment. As of December 31, 2009 and 2008, outstanding checks totaling $88.4 million and $39.2 million, respectively, were included in "Accounts payable" in the Consolidated Balance Sheets.
All highly liquid debt instruments with an original maturity of three months or less are considered cash equivalents. Cash equivalents are stated at cost, which approximates market value.
| |
As of December 31, | |||||||
|---|---|---|---|---|---|---|---|---|
| |
2009 | 2008 | ||||||
Cash |
$ | 10,655 | $ | 10,662 | ||||
Short-term investments |
7,900 | — | ||||||
Total cash and cash equivalents |
$ | 18,555 | $ | 10,662 | ||||
Property, Plant and Equipment
Property, plant and equipment is recorded at cost. Depreciation and amortization are determined by using the straight-line method over the estimated useful lives of the assets. The estimated useful life assigned to fixtures and equipment is from two to 10 years; the estimated useful life assigned to buildings does not exceed 40 years; leasehold improvements are amortized over the lesser of their useful lives or the term of the applicable lease. Repair and maintenance costs are charged to expense as incurred.
On July 11, 2008, the Company completed the sale of its distribution center located in Jacksonville, FL for approximately $3.5 million. The net book value of this building and related assets was $1.8 million as
52
UNITED STATIONERS INC. AND SUBSIDIARIES
NOTES TO CONSOLIDATED FINANCIAL STATEMENTS (Continued)
2. Summary of Significant Accounting Policies (Continued)
of the closing date. In addition, the Company closed on the sale of its distribution center in Tampa, FL on August 8, 2008, with a sales price of approximately $4.8 million compared with a net book value of $1.5 million. As of December 31, 2007, the Company had one building and associated assets, related to its former corporate headquarters, with total net book value of $5.4 million classified as "assets held for sale" within "Other assets" on the Consolidated Balance Sheets. On May 7, 2008, the Company completed the sale of this building for approximately $9.8 million. During 2007, the Company recognized an impairment loss of $0.6 million on certain Information Technology (IT) hardware "held for sale".
Software Capitalization
The Company capitalizes internal use software development costs in accordance with accounting guidance on accounting for costs of computer software developed or obtained for internal use. Amortization is recorded on a straight-line basis over the estimated useful life of the software, generally not to exceed ten years. Capitalized software is included in "Property, plant and equipment, at cost" on the Consolidated Balance Sheet. The total costs are as follows (in thousands):
| |
As of December 31, | |||||||
|---|---|---|---|---|---|---|---|---|
| |
2009 | 2008 | ||||||
Capitalized software development costs |
$ | 56,183 | $ | 57,706 | ||||
Write-off of capitalized software development costs |
(271 | ) | (6,735 | ) | ||||
Accumulated amortization |
(40,375 | ) | (36,498 | ) | ||||
Net capitalized software development costs |
$ | 15,537 | $ | 14,473 | ||||
Capitalized software development costs related to the Company's Reseller Technology Solution (RTS) investment were being amortized over five years, with $1.6 million amortized for the year ending December 31, 2008. During 2008, the Company wrote off the remaining $6.7 million of capitalized software development costs related to the RTS investment. The charge reflected delays in bringing this solution to market and the acceleration of development of other such software solutions. As a result of these changing developments, the Company's undiscounted forecasted cash flows and fair value analysis associated with this investment declined such that a write-off of the remaining asset-value was required. This pre-tax write-off is reflected in "Warehousing, marketing and administrative expenses" on the Consolidated Statement of Income for 2008.
Derivative Financial Instruments
The Company's risk management policies allow for the use of derivative financial instruments to prudently manage foreign currency exchange rate and interest rate exposure. The policies do not allow such derivative financial instruments to be used for speculative purposes. At this time, the Company primarily uses interest rate swaps which are subject to the management, direction and control of our financial officers. Risk management practices, including the use of all derivative financial instruments, are presented to the Board of Directors for approval.
All derivatives are recognized on the balance sheet date at their fair value. All derivatives in a net receivable position are included in "Other assets", and those in a net liability position are included in "Other long-term liabilities". The interest rate swaps that the Company has entered into are classified as cash flow hedges in accordance with accounting guidance from the FASB as they are hedging a forecasted transaction or the variability of cash flow to be paid by the Company. Changes in the fair value
53
UNITED STATIONERS INC. AND SUBSIDIARIES
NOTES TO CONSOLIDATED FINANCIAL STATEMENTS (Continued)
2. Summary of Significant Accounting Policies (Continued)
of a derivative that is qualified, designated and highly effective as a cash flow hedge are recorded in other comprehensive income, net of tax, until earnings are affected by the forecasted transaction or the variability of cash flow, and then are reported in current earnings.
The Company formally documents all relationships between hedging instruments and hedged items, as well as the risk-management objective and strategy for undertaking various hedge transactions. This process includes linking all derivatives designated as cash flow hedges to specific forecasted transactions or variability of cash flow.
The Company formally assesses, at both the hedge's inception and on an ongoing basis, whether the derivatives used in hedging transactions are highly effective in offsetting changes in cash flow of hedged items. When it is determined that a derivative is not highly effective as a hedge then hedge accounting is discontinued prospectively in accordance with accounting guidance on derivative instruments and hedging activities. As of December 31, 2009, there is no ineffectiveness to record on the Company's Consolidated Statement of Income resulting from the Company's cash flow hedges. See Note 20, "Derivative Financial Instruments", for further detail.
Income Taxes
The Company accounts for income taxes using the liability method in accordance with the accounting guidance for income taxes. The Company estimates actual current tax expense and assesses temporary differences that exist due to differing treatments of items for tax and financial statement purposes. These temporary differences result in the recognition of deferred tax assets and liabilities.
A provision has not been made for deferred U.S. income taxes on the undistributed earnings of the Company's foreign subsidiaries as these earnings have historically been permanently invested. It is not practicable to determine the amount of unrecognized deferred tax liability for such unremitted foreign earnings.
The current and deferred tax balances and income tax expense recognized by the Company are based on management's interpretation of the tax laws of multiple jurisdictions. Income tax expense also reflects the Company's best estimates and assumptions regarding, among other things, the level of future taxable income, interpretation of tax laws, and tax planning. Future changes in tax laws, changes in projected levels of taxable income, and tax planning could impact the effective tax rate and current and deferred tax balances recorded by the Company. Management's estimates as of the date of the Consolidated Financial Statements reflect its best judgment giving consideration to all currently available facts and circumstances. As such, these estimates may require adjustment in the future, as additional facts become known or as circumstances change. Further, in accordance with the accounting guidance for uncertainty in income taxes, the tax effects from uncertain tax positions are recognized in the Consolidated Financial Statements, only if it is more likely than not that the position will be sustained upon examination, based on the technical merits of the position. The Company accounts for interest and penalties related to uncertain tax positions as a component of income tax expense.
Foreign Currency Translation
The functional currency for the Company's foreign operations is the local currency. Assets and liabilities of these operations are translated into U.S. currency at the rates of exchange at the balance sheet date. The resulting translation adjustments are included in accumulated other comprehensive loss, a separate
54
UNITED STATIONERS INC. AND SUBSIDIARIES
NOTES TO CONSOLIDATED FINANCIAL STATEMENTS (Continued)
2. Summary of Significant Accounting Policies (Continued)
component of stockholders' equity. Income and expense items are translated at average monthly rates of exchange. Realized gains and losses from foreign currency transactions were not material.
New Accounting Pronouncements
In December 2007, the Financial Accounting Standards Board ("FASB") issued new accounting guidance on business combinations, which is a revision to previous guidance, originally issued in June 2001. The revised guidance retains the fundamental requirements of the previous guidance but also defines the acquirer and establishes the acquisition date as the date that the acquirer achieves control. The main features of the new business combinations accounting guidance are that it requires an acquirer to recognize the assets acquired, the liabilities assumed, and any non-controlling interest in the acquiree at the acquisition date, measured at their fair values as of that date, with limited exceptions. The new guidance also requires the acquirer to recognize goodwill as of the acquisition date. Finally, the new guidance makes a number of other significant amendments to other prior guidance and other authoritative guidance including requiring research and development costs acquired to be capitalized separately from goodwill and requiring the expensing of transaction costs directly related to an acquisition. This new guidance is effective for acquisitions on or after the beginning of the first fiscal year beginning on or after December 15, 2008. The adoption of this new guidance on business combinations on January 1, 2009 did not have a material impact on the Company's financial position and/or its results of operations.
In December 2007, the FASB issued new guidance on non-controlling interests in consolidated financial statements which requires, among other items, that ownership interest in subsidiaries held by parties other than the parent be clearly identified, labeled, and presented in the consolidated statement of financial position within equity, but separate from the parent's equity. The new guidance also requires that the amount of consolidated net income attributable to the parent and to the non-controlling interest be clearly identified and presented on the face of the consolidated statement of income. Finally, the new guidance requires that entities provide sufficient disclosures that clearly identify and distinguish between the interests of the parent and the interests of the non-controlling owners. This new guidance is effective for fiscal years beginning on or after December 15, 2008. The adoption of this new guidance on January 1, 2009 did not have an impact on the Company's financial position and/or its results of operations.
In February 2008, the FASB issued new guidance which delayed the effective date of prior guidance on fair value accounting for all nonfinancial assets and nonfinancial liabilities, except those that are recognized or disclosed at fair value in the financial statements on a recurring basis (at least annually), until fiscal years beginning after November 15, 2008, and interim periods within those fiscal years. Effective January 1, 2009, the Company adopted this prior guidance on fair value accounting for nonfinancial assets and liabilities recognized at fair value on a non-recurring basis. This adoption did not have a material impact on the Company's consolidated financial position, results of operations or cash flows. See Note 21, "Fair Value Measurements", for information and related disclosures regarding the Company's fair value measurements.
In March 2008, the FASB issued accounting guidance on disclosures about derivative instruments and hedging activities, which amends and expands the disclosure requirements of prior guidance on derivative instruments, with the intent to provide users of financial statements with an enhanced understanding of an entity's derivative and hedging activities. Specifically, this new guidance requires
55
UNITED STATIONERS INC. AND SUBSIDIARIES
NOTES TO CONSOLIDATED FINANCIAL STATEMENTS (Continued)
2. Summary of Significant Accounting Policies (Continued)
further disclosure on the following: 1) how and why an entity uses derivative instruments; 2) how derivative instruments and related hedged items are accounted for under previous FASB guidance and its related interpretations; and 3) how derivative instruments and related hedged items affect an entity's financial position, financial performance, and cash flows. In order to meet these requirements, the new guidance issued in March 2008 requires qualitative disclosures about objectives and strategies for using derivatives, quantitative disclosures about fair value amounts of gains and losses on derivative instruments, and disclosures about credit risk-related contingent features in derivative agreements. This new guidance is effective for fiscal years beginning after November 15, 2008. The adoption of this new guidance on January 1, 2009 did not have a material impact on the Company's financial position and/or its results of operations. Disclosure requirements of this guidance are included in Note 20, "Derivative Financial Instruments."
In April 2008, the FASB issued accounting guidance on determining the useful life of intangible assets, which amends previous guidance on goodwill and other intangible assets, in an effort to better align the useful life of a recognized intangible asset for provisions of this previous guidance to the period of expected future cash flows, as used to determine the asset's fair value, in accordance with new accounting guidance on business combinations. The new guidance is effective for fiscal years beginning after December 15, 2008 and requires disclosure of an entity's intent and ability to renew and/or extend the useful life of recognized intangibles as well as its accounting treatment of related costs (see Note 4, "Goodwill and Intangible Assets"). In addition, the Statement also requires that entities develop useful life renewal or extension assumptions, either upon its own historical experience or, in such an absence, that which market participants would use, and to incorporate those assumptions into the entity's determination of newly acquired intangible asset fair values. The adoption of this new accounting guidance on January 1, 2009 did not have an impact on the Company's financial position and/or its results of operations.
In June 2008, the FASB issued new accounting guidance on determining whether instruments granted in share-based payment transactions are participating securities, which states that unvested share-based payment awards that contain non-forfeitable rights to dividends or dividend equivalents (whether paid or unpaid) are considered participating securities and shall be included in the computation of earnings per share pursuant to the two-class method. The two-class method is an earnings allocation formula that treats a participating security as having rights to earnings that would otherwise have been available to common shareholders. The provisions of this new guidance are retrospective. The adoption of this new guidance on January 1, 2009 did not have a material impact on the Company's financial position and/or its results of operations.
In December 2008, the FASB issued additional guidance on employers' disclosures about postretirement benefit plan assets. This guidance requires enhanced disclosures about the plan assets of a Company's defined benefit pension and other postretirement plans intended to provide financial users with a greater understanding of: 1) how investment allocations are made; 2) the major categories of plan assets; 3) the inputs and valuation techniques used to measure the fair value of plan assets; 4) the effect of fair value measurements using significant unobservable inputs on changes in plan assets for the period; and 5) significant concentrations of risk within plan assets. The Company adopted these additional disclosure requirements for the year ending December 31, 2009. These additional disclosure requirements had no impact on the Company's financial position, results of operations or cash flows.
56
UNITED STATIONERS INC. AND SUBSIDIARIES
NOTES TO CONSOLIDATED FINANCIAL STATEMENTS (Continued)
2. Summary of Significant Accounting Policies (Continued)
In March 2009, the FASB issued new accounting guidance on determining fair value when the volume and level of activity for the asset or liability have significantly decreased and identifying transactions that are not orderly. The new guidance requires entities to evaluate the significance and relevance of market factors for fair value inputs to determine if, due to reduced volume and market activity, the factors are still relevant and substantive measures of fair value. The new guidance is effective for interim and annual reporting periods ending after June 15, 2009. The adoption of this new guidance for the period ending June 30, 2009 did not have a material effect on the Company's financial position and/or results of operations.
In April 2009, the FASB issued new accounting guidance on interim disclosures about fair value of financial instruments. The new guidance requires disclosures about fair value of financial instruments for interim reporting periods of publicly traded companies as well as in annual financial statements. This guidance also amends previous guidance on Interim Financial Reporting, to require those disclosures in summarized financial information at interim reporting periods. The new guidance is effective for interim reporting periods ending after June 15, 2009. The adoption of this new accounting guidance for the period ending June 30, 2009 did not have a material effect on the Company's financial position and/or results of operations.
In May 2009, the FASB issued new accounting guidance on subsequent events intended to improve disclosure of significant events that occur after the interim and/or annual financial statement date as well as to specify a time period through which management has included analysis of such subsequent events. This new guidance is effective for all interim and annual periods beginning on or after June 15, 2009. Accordingly, the Company adopted this guidance during the second quarter of 2009. The Company has evaluated subsequent events through February 24, 2010.
In June 2009, the FASB issued new guidance on the accounting for transfers of financial assets. The new guidance is a revision to prior guidance and will require more information about transfers of financial assets, including securitization transactions, and where companies have continuing exposure to the risks related to transferred financial assets. It eliminates the concept of a "qualifying special-purpose entity," changes the requirements for derecognizing financial assets, and requires additional disclosures. Also, in June 2009, the FASB issued new guidance on accounting for Variable Interest Entities. This new guidance is a revision to prior guidance on Variable Interest Entities, and changes how a company determines when an entity that is insufficiently capitalized or is not controlled through voting (or similar rights) should be consolidated. The determination of whether a company is required to consolidate an entity is based on, among other things, an entity's purpose and design and a company's ability to direct the activities of the entity that most significantly impact the entity's economic performance. This new guidance on Variable Interest Entities will be effective at the start of a company's first fiscal year beginning after November 15, 2009. Management is in the process of evaluating the impact that this guidance will have on the Company's financial position and/or results of operations.
In June 2009, the FASB issued new guidance on the FASB accounting standards codification and the hierarchy of Generally Accepted Accounting Principles, which replaced previous guidance on this subject. The codification will become the source of authoritative U.S. Generally Accepted Accounting Principles (GAAP) recognized by the FASB to be applied by nongovernmental entities. Rules and interpretive releases of the SEC under authority of federal securities laws are also sources of authoritative GAAP for SEC registrants. This statement is effective for financial statements issued for
57
UNITED STATIONERS INC. AND SUBSIDIARIES
NOTES TO CONSOLIDATED FINANCIAL STATEMENTS (Continued)
2. Summary of Significant Accounting Policies (Continued)
interim and annual periods ending after September 15, 2009. The adoption of this guidance did not have a material impact on the Company's financial position and/or its results of operations.
In January 2010, the FASB issued new guidance and clarifications to previously issued guidance to improve disclosures about fair value measurements. These new disclosures include stating separately the amounts of significant transfers in and out of Level 1 and Level 2 fair value measurements and the reasons for the transfers. In addition, it states that a reporting entity should present separately information about purchases, sales, issuances, and settlements in the reconciliation for fair value measurements using Level 3 inputs. The new disclosures and clarifications of existing disclosures are effective for interim and annual reporting periods beginning after December 15, 2009, except for the disclosures about purchases, sales, issuances, and settlements in the roll forward of activity in Level 3 fair value measurements. Those disclosures are effective for fiscal years beginning after December 15, 2010, and for interim periods within those fiscal years. The adoption of this new guidance will not have a material impact on the Company's financial position and/or its results of operations. See Note 21, "Fair Value Measurements", for information and related disclosures regarding the Company's fair value measurements.
3. Share-Based Compensation
Overview
As of December 31, 2009, the Company has two active equity compensation plans. A description of these plans is as follows:
Amended and Restated 2004 Long-Term Incentive Plan ("LTIP")
In March 2004, the Company's Board of Directors adopted the LTIP to, among other things, attract and retain managerial talent, further align the interest of key associates to those of the Company's shareholders and provide competitive compensation to key associates. Award vehicles include stock options, stock appreciation rights, full value awards, cash incentive awards and performance-based awards. Key associates and non-employee directors of the Company are eligible to become participants in the LTIP, except that non-employee directors may not be granted incentive stock options. The Company granted 320,017 shares of restricted stock and 226,087 restricted stock units (RSUs) under the LTIP. The Company granted no stock options under the LTIP during 2009.
Nonemployee Directors' Deferred Stock Compensation Plan
Pursuant to the United Stationers Inc. Nonemployee Directors' Deferred Stock Compensation Plan, non-employee directors may defer receipt of all or a portion of their retainer and meeting fees. Fees deferred are credited quarterly to each participating director in the form of stock units, based on the fair market value of the Company's common stock on the quarterly deferral date. Each stock unit account generally is distributed and settled in whole shares of the Company's common stock on a one-for-one basis, with a cash-out of any fractional stock unit interests, after the participant ceases to serve as a Company director. For the years ended December 31, 2009, 2008 and 2007, the Company recorded compensation expense of $0.1 million, $0.3 million, and $0.2 million, respectively. As of December 31, 2009, 2008 and 2007, the accumulated number of stock units outstanding under this plan was 39,568; 46,203; and 39,156; respectively.
58
UNITED STATIONERS INC. AND SUBSIDIARIES
NOTES TO CONSOLIDATED FINANCIAL STATEMENTS (Continued)
3. Share-Based Compensation (Continued)
Accounting For Stock-Based Compensation
The Company recorded pre-tax expense of $12.3 million ($7.7 million after-tax), or $0.33 per basic and $0.32 per diluted share, for share-based compensation for the year ended December 31, 2009. The Company recorded pre-tax expense of $9.0 million ($5.6 million after-tax), or $0.24 per basic and diluted share, for share-based compensation for the year ended December 31, 2008. The Company recorded pre-tax expense of $8.9 million ($5.4 million after-tax), or $0.20 per basic and $0.19 per diluted share, for share-based compensation for the year ended December 31, 2007.
The following tables summarize the intrinsic value of options outstanding, exercisable, and exercised for the applicable periods listed below:
Intrinsic Value of Options
(in thousands of dollars)
| |
Outstanding | Exercisable | |||||
|---|---|---|---|---|---|---|---|
As of December 31, 2009 |
$ | 29,534 | $ | 29,510 | |||
As of December 31, 2008 |
1,926 | 1,926 | |||||
As of December 31, 2007 |
11,364 | 11,254 | |||||
Intrinsic Value of Options Exercised
(in thousands of dollars)
For the year ended
|
|
|||
|---|---|---|---|---|
December 31, 2009 |
$ | 1,862 | ||
December 31, 2008 |
1,301 | |||
December 31, 2007 |
28,179 | |||
The following tables summarize the intrinsic value of restricted shares outstanding and vested for the applicable periods listed below:
Intrinsic Value of Restricted Shares
(in thousands of dollars)
Outstanding
|
|
|||
|---|---|---|---|---|
As of December 31, 2009 |
$ | 40,090 | ||
As of December 31, 2008 |
8,609 | |||
As of December 31, 2007 |
5,816 | |||
Intrinsic Value of Restricted Shares Vested
(in thousands of dollars)
For the year ended
|
|
|||
|---|---|---|---|---|
December 31, 2009 |
$ | 3,628 | ||
December 31, 2008 |
1,617 | |||
December 31, 2007 |
476 | |||
59
UNITED STATIONERS INC. AND SUBSIDIARIES
NOTES TO CONSOLIDATED FINANCIAL STATEMENTS (Continued)
3. Share-Based Compensation (Continued)
As of December 31, 2009, there was $19.6 million of total unrecognized compensation cost related to non-vested share-based compensation arrangements granted. This cost is expected to be recognized over a weighted-average period of 2.0 years.
Accounting guidance on share-based payments requires that cash flows resulting from the tax benefits from tax deductions in excess of the compensation cost recognized for those options (excess tax benefits) be classified as financing cash flows. For the years ended December 31, 2009, 2008 and 2007, respectively, the $0.7 million, $0.1 million and $9.5 million excess tax benefits classified as financing cash inflows on the Consolidated Statement of Cash Flows would have been classified as operating cash inflows if the Company had not adopted this guidance on share-based payments.
Historically, the majority of awards issued under these plans have been stock options with service-type conditions. The Company began utilizing restricted stock awards in its annual award grant in September 2007.
Stock Options
The fair value of each option award is estimated on the date of grant using a Black-Scholes option valuation model that uses various assumptions including the expected stock price volatility, risk-free interest rate, and expected life of the option. Stock options generally vest in annual increments over three years and have a term of 10 years. Compensation costs for all stock options are recognized, net of estimated forfeitures, on a straight-line basis as a single award typically over the vesting period. The Company estimates expected volatility based on historical volatility of the price of its common stock. The Company estimates the expected term of share-based awards by using historical data relating to option exercises and employee terminations to estimate the period of time that options granted are expected to be outstanding. The interest rate for periods during the expected life of the option is based on the U.S. Treasury yield curve in effect at the time of the grant. As of December 31, 2009, there was $1.3 million of total unrecognized compensation cost related to stock option awards granted. There were no stock options granted during 2009 or 2008. The Company granted 459,268 stock options during the year ended December 31, 2007. The weighted average fair value for stock options granted during the year ended December 31, 2007 of $14.23 was estimated using the following weighted-average assumptions:
| |
2007 | |||
|---|---|---|---|---|
Exercise price |
$ | 59.62 | ||
Expected stock price volatility |
23.3 | % | ||
Risk-free interest rate |
4.3 | % | ||
Expected life of options (years) |
3.5 | |||
Expected dividend yield |
0.0 | % | ||
60
UNITED STATIONERS INC. AND SUBSIDIARIES
NOTES TO CONSOLIDATED FINANCIAL STATEMENTS (Continued)
3. Share-Based Compensation (Continued)
The following table summarizes the transactions, excluding restricted stock, under the Company's equity compensation plans for the last three years:
| |
2009 | Weighted Average Exercise Price |
2008 | Weighted Average Exercise Price |
2007 | Weighted Average Exercise Price |
|||||||||||||
|---|---|---|---|---|---|---|---|---|---|---|---|---|---|---|---|---|---|---|---|
Options outstanding—January 1 |
2,614,005 | $ | 44.63 | 2,827,582 | $ | 44.45 | 3,631,049 | $ | 39.19 | ||||||||||
Granted |
— | — | — | — | 459,268 | 59.62 | |||||||||||||
Exercised |
(161,810 | ) | 37.89 | (94,135 | ) | 34.17 | (1,120,098 | ) | 33.42 | ||||||||||
Cancelled |
(67,971 | ) | 47.38 | (119,442 | ) | 48.51 | (142,637 | ) | 46.35 | ||||||||||
Options outstanding—December 31 |
2,384,224 | $ | 45.01 | 2,614,005 | $ | 44.63 | 2,827,582 | $ | 44.45 | ||||||||||
Number of options exercisable |
2,246,741 | $ | 44.11 | 2,116,871 | $ | 42.47 | 1,714,434 | $ | 39.75 | ||||||||||
The following table summarizes outstanding and exercisable options granted under the Company's equity compensation plans as of December 31, 2009:
| |
Exercise Prices
|
Outstanding | Remaining Contractual Life (Years) |
Exercisable | |
||||||||
|---|---|---|---|---|---|---|---|---|---|---|---|---|---|
| 20.01—25.00 | 121,954 | 2.6 | 121,954 | ||||||||||
| 25.01—30.00 | 62,128 | 2.1 | 62,128 | ||||||||||
| 30.01—35.00 | 37,900 | 1.6 | 37,900 | ||||||||||
| 35.01—40.00 | 313,903 | 3.6 | 313,903 | ||||||||||
| 40.01—45.00 | 358,031 | 4.7 | 358,031 | ||||||||||
| 45.01—50.00 | 1,086,939 | 6.2 | 1,083,947 | ||||||||||
| 50.01—55.00 | — | — | — | ||||||||||
| 55.01—60.00 | 352,246 | 7.7 | 234,797 | ||||||||||
| 60.01—65.00 | — | — | — | ||||||||||
| 65.01—70.00 | 51,123 | 7.6 | 34,081 | ||||||||||
| Total | 2,384,224 | 5.5 | 2,246,741 | ||||||||||
Restricted Stock and Restricted Stock Units (Restricted Shares, collectively)
The Company granted 320,017 shares of restricted stock awards and 226,087 RSUs during 2009. During 2008, the Company granted 147,448 shares of restricted stock awards and 44,173 RSUs. The restricted stock granted vests three years from the date of the grant. The majority of the RSUs granted vest in four years with annual performance conditions based on a predetermined internal financial performance metric that impacts the number of shares earned. Included in the 2009 and 2008 grants were 366,193 and 88,316 shares granted to employees who were not executive officers, as of December 31, 2009 and 2008, respectively. In addition, there were 19,613 and 20,173 shares granted to non-employee directors during the years ended December 31, 2009 and 2008, respectively. These awards generally vest in annual increments over three years. For the years ended December 31, 2009 and 2008, respectively, there were also 160,298 and 83,132 shares granted to executive officers as of December 31, 2009 and 2008, respectively. These grants to executive officers vest with respect to each officer in annual increments over three years provided that the following conditions are satisfied: (1) the officer is still employed as of the anniversary date of the grant; and (2) the Company's cumulative diluted
61
UNITED STATIONERS INC. AND SUBSIDIARIES
NOTES TO CONSOLIDATED FINANCIAL STATEMENTS (Continued)
3. Share-Based Compensation (Continued)
earnings per share for the four calendar quarters immediately preceding the vesting date exceed $1.00 per diluted share as defined in the officers' restricted stock award agreement. As of December 31, 2009, there was $18.3 million of total unrecognized compensation cost related to non-vested restricted stock awards and RSUs granted. A summary of the status of the Company's restricted stock awards and RSU (restricted shares collectively) grants and changes during the last three years is as follows:
Restricted Shares
|
2009 | Weighted Average Grant Date Fair Value |
2008 | Weighted Average Grant Date Fair Value |
2007 | Weighted Average Grant Date Fair Value |
||||||||||||||
|---|---|---|---|---|---|---|---|---|---|---|---|---|---|---|---|---|---|---|---|---|
Nonvested—January 1 |
257,054 | $ | 52.74 | 125,865 | $ | 58.79 | 14,350 | $ | 47.48 | |||||||||||
Granted |
546,104 | 31.96 | 191,621 | 49.88 | 120,795 | 59.36 | ||||||||||||||
Vested |
(80,711 | ) | 52.77 | (32,612 | ) | 59.02 | (7,500 | ) | 46.23 | |||||||||||
Cancelled |
(17,637 | ) | 40.51 | (27,820 | ) | 53.08 | (1,780 | ) | 59.02 | |||||||||||
Nonvested—December 31 |
704,810 | $ | 36.41 | 257,054 | $ | 52.74 | 125,865 | $ | 58.79 | |||||||||||
4. Goodwill and Intangible Assets
Accounting guidance on goodwill and intangible assets requires that goodwill be tested for impairment at the reporting unit level on an annual basis and between annual tests if an event occurs or circumstances change that would more likely than not reduce the fair value of the reporting unit below its carrying value. The Company performs an annual impairment test on goodwill and intangible assets with indefinite lives at December 31st of each year. Based on this latest test, the Company concluded that the fair value of each of the reporting units was in excess of the carrying value as of December 31, 2009.
As of December 31, 2009 and 2008, the Company's Consolidated Balance Sheet reflected $314.4 million of goodwill. As of December 31, 2009 and 2008, the Company had $62.9 million and $68.0 million in net intangible assets. Net intangible assets as of December 31, 2009 consist primarily of customer listings and non-compete agreements purchased as part of the Sweet Paper acquisition, ORS Nasco acquisition and the Emco Distribution acquisition. The Company has no intention to renew or extend the terms of acquired intangible assets and accordingly, did not incur any related costs during 2009. Amortization of intangible assets purchased as part of these acquisitions totaled $5.0 million, $4.8 million and $2.6 million for the years ended December 31, 2009, 2008, and 2007, respectively. Accumulated amortization of intangible assets as of December 31, 2009 and 2008 totaled $16.4 million and $11.4 million, respectively.
62
UNITED STATIONERS INC. AND SUBSIDIARIES
NOTES TO CONSOLIDATED FINANCIAL STATEMENTS (Continued)
4. Goodwill and Intangible Assets (Continued)
The following table summarizes the intangible assets of the Company by major class of intangible assets and the cost, accumulated amortization, net carrying amount, and weighted average life, if applicable (in thousands):
| |
December 31, 2009 | December 31, 2008 | |||||||||||||||||||||||
|---|---|---|---|---|---|---|---|---|---|---|---|---|---|---|---|---|---|---|---|---|---|---|---|---|---|
| |
Gross Carrying Amount |
Accumulated Amortization |
Net Carrying Amount |
Weighted Average Useful Life (years) |
Gross Carrying Amount |
Accumulated Amortization |
Net Carrying Amount |
Weighted Average Useful Life (years) |
|||||||||||||||||
Intangible assets subject to amortization |
|||||||||||||||||||||||||
Customer Relationships and other intangibles |
$ | 62,360 | $ | (15,003 | ) | $ | 47,357 | 14 | $ | 62,460 | $ | (10,353 | ) | $ | 52,107 | 14 | |||||||||
Non-compete agreements |
3,950 | (1,375 | ) | 2,575 | 4 | 3,950 | (1,075 | ) | 2,875 | 4 | |||||||||||||||
Total |
$ | 66,310 | $ | (16,378 | ) | $ | 49,932 | $ | 66,410 | $ | (11,428 | ) | $ | 54,982 | |||||||||||
Intangible assets not subject to amortization |
|||||||||||||||||||||||||
Trademarks |
$ | 13,000 | — | $ | 13,000 | n/a | $ | 13,000 | — | $ | 13,000 | n/a | |||||||||||||
Total |
$ | 79,310 | $ | (16,378 | ) | $ | 62,932 | $ | 79,410 | $ | (11,428 | ) | $ | 67,982 | |||||||||||
The following table summarizes the amortization expense expected to be incurred over the next five years on intangible assets from acquisitions completed as of December 31, 2009 (in thousands):
Year
|
Amounts | |||
|---|---|---|---|---|
2010 |
$ | 4,773 | ||
2011 |
4,647 | |||
2012 |
4,511 | |||
2013 |
4,511 | |||
2014 |
4,511 | |||
5. Severance and Restructuring Charges
On January 27, 2009, the Company announced a plan to eliminate staff positions through an involuntary separation plan. The severance charge included workforce reductions of 250 associates. The Company recorded a pre-tax charge of $3.4 million in the first quarter of 2009 for estimated severance pay and benefits, and outplacement costs. This charge is included in "Warehousing, marketing and administrative expenses" on the Company's Statements of Income. Cash outlays associated with the severance charge in 2009 totaled $2.9 million. During the third and fourth quarters of 2009, the Company had a reversal of a portion of these severance charges of $0.5 million. As a result of this activity, the Company had no accrued liabilities for the severance charge as of December 31, 2009. In addition, during the third and fourth quarters, the Company incurred several new severance charges and facility closure costs related to other activities totaling $0.5 million. Cash outlays associated with these other severance charges and facility closure costs totaled $0.4 million for 2009. As of December 31, 2009, the Company had accrued liabilities for these charges and costs of $0.1 million.
On October 17, 2006, the Company announced a restructuring plan to eliminate staff positions through both voluntary and involuntary separation plans (the "Workforce Reduction Program"). The Workforce
63
UNITED STATIONERS INC. AND SUBSIDIARIES
NOTES TO CONSOLIDATED FINANCIAL STATEMENTS (Continued)
5. Severance and Restructuring Charges (Continued)
Reduction Program included workforce reductions of 110 associates and as of December 31, 2007, the measures were substantially complete. The Company recorded a pre-tax charge of $6.0 million in 2006 for severance pay and benefits, prorated bonuses, and outplacement costs that will be paid primarily during 2007. The Company recorded an additional charge of $1.7 million related to this action in 2007. Cash outlays associated with the 2006 Workforce Reduction Program in 2009, 2008 and 2007 totaled $0.1 million, $0.6 million, and $6.6 million, respectively. As of December 31, 2009, the Company had no accrued reserves for the 2006 Workforce Reduction Program as all amounts owed were paid as of that time. As of December 31, 2008, the Company had accrued reserves for the 2006 Workforce Reduction Program of $0.1 million.
6. Accumulated Other Comprehensive Loss
Accumulated other comprehensive loss as of December 31, 2009, 2008 and 2007 included the following (in thousands):
| |
As of December 31, | |||||||||
|---|---|---|---|---|---|---|---|---|---|---|
| |
2009 | 2008 | 2007 | |||||||
Unrealized currency translation adjustments |
$ | (6,178 | ) | $ | (6,752 | ) | $ | (3,167 | ) | |
Unrealized loss on interest rate swaps, net of tax |
(16,150 | ) | (21,471 | ) | (2,299 | ) | ||||
Minimum pension liability adjustments, net of tax |
(19,592 | ) | (36,727 | ) | (9,486 | ) | ||||
Total accumulated other comprehensive loss |
$ | (41,920 | ) | $ | (64,950 | ) | $ | (14,952 | ) | |
7. Earnings Per Share
Basic earnings per share ("EPS") is computed by dividing net income by the weighted-average number of common shares outstanding during the period. Diluted EPS reflects the potential dilution that could occur if dilutive securities were exercised into common stock. Stock options, restricted stock and deferred stock units are considered dilutive securities. Stock options to purchase 1.9 million, 1.6 million and 0.2 million shares of common stock were outstanding at December 31, 2009, 2008, and 2007, respectively, but were not included in the computation of diluted earnings per share because the options' exercise prices were greater than the average market price of the common shares and, therefore, the effect would be antidilutive. The amount of antidilutive options in prior years is not material.
64
UNITED STATIONERS INC. AND SUBSIDIARIES
NOTES TO CONSOLIDATED FINANCIAL STATEMENTS (Continued)
7. Earnings Per Share (Continued)
The following table sets forth the computation of basic and diluted earnings per share (in thousands, except per share data):
| |
Years Ended December 31, | |||||||||||
|---|---|---|---|---|---|---|---|---|---|---|---|---|
| |
2009 | 2008 | 2007 | |||||||||
Numerator: |
||||||||||||
Net income |
$ | 100,985 | $ | 98,414 | $ | 107,195 | ||||||
Denominator: |
||||||||||||
Denominator for basic earnings per share—Weighted average shares |
23,370 | 23,578 | 27,323 | |||||||||
Effect of dilutive securities: |
||||||||||||
Employee stock options |
726 | 269 | 653 | |||||||||
Denominator for diluted earnings per share—Adjusted weighted average shares and the effect of dilutive securities |
24,096 | 23,847 | 27,976 | |||||||||
Net income per common share: |
||||||||||||
Net income per share—basic |
$ | 4.32 | $ | 4.17 | $ | 3.92 | ||||||
Net income per share—assuming dilution |
$ | 4.19 | $ | 4.13 | $ | 3.83 | ||||||
Common Stock Repurchases
As of December 31, 2009, the Company had Board authorization to repurchase $100.9 million of USI common stock. During 2009, there were no repurchases of the Company's shares. In 2008, the Company repurchased 1,233,832 shares of USI's common stock at an aggregate cost of $67.5 million. In 2007, the Company repurchased 6,561,416 shares of USI common stock at an aggregate cost of $383.3 million. Depending on market and business conditions and other factors, the Company may continue or suspend purchasing its common stock at any time without notice. Acquired shares are included in the issued shares of the Company and treasury stock, but are not included in average shares outstanding when calculating earnings per share data. During 2009, 2008 and 2007, the Company reissued 450,348; 190,869; and 1,089,468 shares, respectively, of treasury stock to fulfill its obligations under its equity incentive plans.
8. Segment Information
Accounting guidance on segments of an enterprise requires companies to report financial and descriptive information about their reportable operating segments, including segment profit or loss, certain specific revenue and expense items, and segment assets, as well as information about the revenues derived from the Company's products and services, the countries in which the Company earns revenues and holds assets, and major customers. This statement also requires companies that have a single reportable segment to disclose information about products and services, information about geographic areas, and information about major customers. This statement requires the use of the management approach to determine the information to be reported. The management approach is based on the way management organizes the enterprise to assess performance and make operating decisions regarding the allocation of resources. The accounting guidance on segments of an enterprise permits the aggregation, based on specific criteria, of several operating segments into one reportable operating segment. Management has chosen to aggregate its operating segments and report segment information as one reportable segment. A discussion of the factors relied upon and processes
65
UNITED STATIONERS INC. AND SUBSIDIARIES
NOTES TO CONSOLIDATED FINANCIAL STATEMENTS (Continued)
8. Segment Information (Continued)
undertaken by management in determining that the Company meets the aggregation criteria is provided below, followed by the required disclosure regarding the Company's single reportable segment.
Management defines operating segments as individual operations that the Chief Operating Decision Maker ("CODM") (in the Company's case, the President and Chief Executive Officer) reviews for the purpose of assessing performance and making operating decisions. When evaluating operating segments, management considers whether:
- •
- The component engages in business activities from which it may earn revenues and incur expenses;
- •
- The operating results of the component are regularly reviewed by the enterprise's CODM;
- •
- Discrete financial information is available about the component; and
- •
- Other factors are present, such as management structure, presentation of information to the Board of Directors and the nature of the business activity of each component.
Based on the factors referenced above, management has determined that the Company has three operating segments, USSC (referred to by the Company as "Supply"), the first-tier operating subsidiary of USI; Lagasse and ORS Nasco. Supply also includes operations in Mexico conducted through a USSC subsidiary, as well as Azerty, which has been consolidated into Supply.
Management has also concluded that the Company's three operating segments meet all of the aggregation criteria required by the accounting guidance. Such determination is based on company-wide similarities in (1) the nature of products and/or services provided, (2) customers served, (3) production processes and/or distribution methods used, (4) economic characteristics including gross margins and operating expenses and (5) regulatory environment. Management further believes aggregate presentation provides more useful information to the financial statement user and is, therefore, consistent with the principles and objectives of the FASB-issued accounting guidance.
The following discussion sets forth the required disclosure regarding single reportable segment information:
The Company operates as a single reportable segment as a leading wholesale distributor of business products, with 2009 net sales of approximately $4.7 billion—including foreign operations in Mexico. For the years ended December 31, 2009, 2008 and 2007, the Company's net sales from foreign operations in Mexico totaled $92.3 million, $96.0 million and $88.9 million, respectively. The Company stocks about 100,000 items from over 1,000 manufacturers. This includes a broad spectrum of manufacturers' brand and private brand office products, computer supplies, office furniture, business machines, presentation products, janitorial and breakroom supplies and industrial supplies. The Company primarily serves commercial and contract office products dealers and other independent distributors. The Company sells its products through a national distribution network to over 25,000 resellers, who in turn sell directly to end-consumers. These products are distributed through the Company's network of 64 distribution centers. As of December 31, 2009, 2008, and 2007, long-lived assets of the Company's foreign operations in Mexico totaled $4.7 million, $4.7 million, and $4.8 million, respectively.
66
UNITED STATIONERS INC. AND SUBSIDIARIES
NOTES TO CONSOLIDATED FINANCIAL STATEMENTS (Continued)
8. Segment Information (Continued)
The Company's product offerings, comprised of about 100,000 stockkeeping units (SKUs), may be divided into the following primary categories: (i) traditional office products, which include writing instruments, paper products, organizers and calendars and various office accessories; (ii) technology products such as computer supplies and peripherals; (iii) office furniture, such as desks, filing and storage solutions, seating and systems furniture, along with a variety of products for niche markets such as education government, healthcare and professional services; (iv) janitorial and breakroom supplies, which includes janitorial and breakroom supplies, foodservice consumables, safety and security items, and paper and packaging supplies; and (v) industrial supplies which includes hand and power tools, safety and security supplies, janitorial equipment and supplies and welding products. In 2009, the Company's largest supplier was Hewlett-Packard Company, which represented approximately 20% of its total purchases. No other supplier accounted for more than 5% of the Company's total purchases.
The Company's customers include independent office products dealers and contract stationers, office products mega-dealers, office products superstores, computer products resellers, office furniture dealers, mass merchandisers, mail order companies, sanitary supply distributors, drug and grocery store chains, e-commerce dealers and other independent distributors. The Company had one customer, Staples, that constituted 10.7% of its 2009 consolidated net sales. No other single customer accounted for more than 10% of 2009 consolidated net sales.
The following table shows net sales by product category for 2009, 2008 and 2007 (in millions):
| |
Years Ended December 31, | |||||||||
|---|---|---|---|---|---|---|---|---|---|---|
| |
2009 | 2008(1) | 2007(1) | |||||||
Technology products |
$ | 1,636 | $ | 1,683 | $ | 1,736 | ||||
Traditional office products |
1,282 | 1,346 | 1,336 | |||||||
Janitorial and breakroom supplies |
1,117 | 1,053 | 925 | |||||||
Office furniture |
354 | 504 | 566 | |||||||
Industrial supplies |
231 | 301 | 3 | |||||||
Freight revenue |
81 | 91 | 77 | |||||||
Other |
9 | 9 | 3 | |||||||
Total net sales |
$ | 4,710 | $ | 4,987 | $ | 4,646 | ||||
- (1)
- Certain prior period amounts have been reclassified to conform to the current presentation. Such reclassifications included: i) freight and other revenue from ORS Nasco that is now included in the freight and other revenue line items rather than in the "Industrial supplies" product category, and ii) changes between several product categories due to several specific products being reclassified to different categories. These changes did not impact the Consolidated Statements of Income.
9. Long-Term Debt
USI is a holding company and, as a result, its primary sources of funds are cash generated from operating activities of its direct operating subsidiary, USSC, and from borrowings by USSC. The 2007 Credit Agreement (as defined below), the 2007 Master Note Purchase Agreement (as defined below) and the 2009 Receivables Securitization Program (as defined below) contain restrictions on the ability of USSC to transfer cash to USI.
67
UNITED STATIONERS INC. AND SUBSIDIARIES
NOTES TO CONSOLIDATED FINANCIAL STATEMENTS (Continued)
9. Long-Term Debt (Continued)
Long-term debt consisted of the following amounts (in thousands):
| |
As of December 31, | |||||||
|---|---|---|---|---|---|---|---|---|
| |
2009 | 2008 | ||||||
2007 Credit Agreement—Revolving Credit Facility |
$ | 100,000 | $ | 321,300 | ||||
2007 Credit Agreement—Term Loan |
200,000 | 200,000 | ||||||
2007 Master Note Purchase Agreement (Private Placement) |
135,000 | 135,000 | ||||||
Industrial development bond, maturing in 2011 |
6,800 | 6,800 | ||||||
Total |
$ | 441,800 | $ | 663,100 | ||||
As of December 31, 2009, 100% of the Company's outstanding debt is priced at variable interest rates based primarily on the applicable bank prime rate, the London InterBank Offered Rate ("LIBOR") or the applicable commercial paper rates related to the 2009 Receivables Securitization Program (the "2009 Program"). While the Company had primarily all of its outstanding debt based on LIBOR at December 31, 2009, the Company had hedged $435.0 million of this debt with three separate interest rate swaps further discussed in Note 2, "Summary of Significant Accounting Policies", and Note 20, "Derivative Financial Instruments", to the Consolidated Financial Statements. As of December 31, 2009, the overall weighted average effective borrowing rate of the Company's debt was 5.0%. At year-end funding levels based on $6.8 million, a 50 basis point movement in interest rates would not result in a material increase or decrease in annualized interest expense, on a pre-tax basis, nor upon cash flows from operations.
2009 Receivables Securitization Program
On March 3, 2009, USI entered into an accounts receivables securitization program (as amended to date, the "2009 Receivables Securitization Program" or the "2009 Program") that replaced the securitization program that USI terminated on March 2, 2009 (the "Prior Receivables Securitization Program" or the "Prior Program"). The parties to the 2009 Program are USI, USSC, USFS, and USR, and Bank of America, National Association ("Bank of America"), and Enterprise Funding Company LLC ("Enterprise" and, together with Bank of America, the "Investors"). The 2009 Program is governed by the following agreements, a
- •
- Transfer and Administration Agreement among USSC, USFS, USR, and the Investors;
- •
- Receivables Sale Agreement between USSC and USFS;
- •
- Receivables Purchase Agreement between USFS and USR; and
- •
- Performance Guaranty executed by USI in favor of USR.
Pursuant to the Receivables Sale Agreement, USSC sells to USFS, on an on-going basis, all the customer accounts receivable and related rights originated by USSC. Pursuant to the Receivables Purchase Agreement, USFS sells to USR, on an on-going basis, all the accounts receivable and related rights purchased from USSC, as well as the accounts receivable and related rights USFS acquired from its then subsidiary, USSRC, upon the termination of the Prior Program. Pursuant to the Transfer and Administration Agreement, USR then sells the receivables and related rights to Bank of America, as agent on behalf of Enterprise. The maximum investment to USR at any one time outstanding under the 2009 Program cannot exceed $100 million. USFS retains servicing responsibility over the receivables.
68
UNITED STATIONERS INC. AND SUBSIDIARIES
NOTES TO CONSOLIDATED FINANCIAL STATEMENTS (Continued)
9. Long-Term Debt (Continued)
USR is a wholly-owned, bankruptcy remote special purpose subsidiary of USFS. The assets of USR are not available to satisfy the creditors of any other person, including USFS, USSC or USI, until all amounts outstanding under the facility are repaid and the 2009 Program has been terminated. The maturity date of the 2009 Program is November 23, 2013, subject to the Investors' renewing their commitments as liquidity providers supporting the 2009 Program, which expire on January 21, 2011.
The receivables sold to Bank of America will remain on USI's Condensed Consolidated Balance Sheet, and amounts advanced to USR by Enterprise, Bank of America or any successor Investor will be recorded as debt on USI's Condensed Consolidated Balance Sheet. The cost of such debt will be recorded as interest expense on USI's income statement. As of December 31, 2009, $445.3 million of receivables have been sold and no amounts have been advanced to USR.
The Transfer and Administration Agreement prohibits the Company from exceeding a Leverage Ratio of 3.25 to 1.00 and imposes other restrictions on the Company's ability to incur additional debt. This agreement also contains additional covenants, requirements and events of default that are customary for this type of agreement, including the failure to make any required payments when due.
Credit Agreement and Other Debt
On July 5, 2007, USI and USSC entered into a Second Amended and Restated Five-Year Revolving Credit Agreement with PNC Bank, National Association and U.S. Bank National Association, as Syndication Agents, KeyBank National Association and LaSalle Bank, National Association, as Documentation Agents, and JPMorgan Chase Bank, National Association, as Agent (as amended on December 21, 2007, the "2007 Credit Agreement"). The 2007 Credit Agreement provides a Revolving Credit Facility with a committed principal amount of $425 million and a Term Loan in the principal amount of $200 million. Interest on both the Revolving Credit Facility and the Term Loan is based on the three-month LIBOR plus an interest margin based upon the Company's debt to EBITDA ratio (or "Leverage Ratio", as defined in the 2007 Credit Agreement). The 2007 Credit Agreement prohibits the Company from exceeding a Leverage Ratio of 3.25 to 1.00 and imposes other restrictions on the Company's ability to incur additional debt. The Revolving Credit Facility expires on July 5, 2012, which is also the maturity date of the Term Loan.
On October 15, 2007, USI and USSC entered into a Master Note Purchase Agreement (the "2007 Note Purchase Agreement") with several purchasers. The 2007 Note Purchase Agreement allows USSC to issue up to $1 billion of senior secured notes, subject to the debt restrictions contained in the 2007 Credit Agreement. Pursuant to the 2007 Note Purchase Agreement, USSC issued and sold $135 million of floating rate senior secured notes due October 15, 2014 at par in a private placement (the "Series 2007-A Notes"). Interest on the Series 2007-A Notes is payable quarterly in arrears at a rate per annum equal to three-month LIBOR plus 1.30%, beginning January 15, 2008. USSC may issue additional series of senior secured notes from time to time under the 2007 Note Purchase Agreement but has no specific plans to do so at this time. USSC used the proceeds from the sale of these notes to repay borrowings under the 2007 Credit Agreement.
USSC has entered into several interest rate swap transactions to mitigate its floating rate risk on a portion of its total long-term debt. See Note 20, "Derivative Financial Instruments", for further detail on these swap transactions and their accounting treatment.
69
UNITED STATIONERS INC. AND SUBSIDIARIES
NOTES TO CONSOLIDATED FINANCIAL STATEMENTS (Continued)
9. Long-Term Debt (Continued)
The 2007 Credit Agreement also provides for the issuance of letters of credit in an aggregate amount of up to a sublimit of $90 million and provides a sublimit for swingline loans in an aggregate outstanding principal amount not to exceed $30 million at any one time. These amounts, as sublimits, do not increase the maximum aggregate principal amount, and any undrawn issued letters of credit and all outstanding swingline loans under the facility reduce the remaining availability under the 2007 Credit Agreement.
The Company had outstanding letters of credit under the 2007 Credit Agreement of $17.9 million and $19.5 million as of December 31, 2009 and December 31, 2008, respectively. Approximately $7.0 million of these letters of credit were used to guarantee the industrial development bond.
As of December 31, 2009, the Company had an industrial development bond outstanding with a balance of $6.8 million. This bond is scheduled to mature in 2011 and carries market-based interest rates.
Obligations of USSC under the 2007 Credit Agreement and the 2007 Note Purchase Agreement are guaranteed by USI and certain of USSC's domestic subsidiaries. USSC's obligations under these agreements and the guarantors' obligations under the guaranties are secured by liens on substantially all Company assets, including accounts receivable, chattel paper, commercial tort claims, documents, equipment, fixtures, instruments, inventory, investment property, pledged deposits and all other tangible and intangible personal property (including proceeds) and certain real property, but excluding accounts receivable (and related credit support) subject to any accounts receivable securitization program permitted under the 2007 Credit Agreement. Also securing these obligations are first priority pledges of all of the capital stock of USSC and the domestic subsidiaries of USSC.
Debt maturities as of December 31, 2009, were as follows (in thousands):
Year
|
Amount | |||
|---|---|---|---|---|
2010 |
$ | — | ||
2011 |
6,800 | |||
2012 |
300,000 | |||
2013 |
— | |||
2014 |
135,000 | |||
Later years |
— | |||
Total |
$ | 441,800 | ||
10. Off-Balance Sheet Financing
General
On March 28, 2003, USSC entered into a third-party receivables securitization program with JP Morgan Chase Bank, as trustee (the "Prior Receivables Securitization Program" or the "Prior Program"). During the first quarter of 2007, the Company increased its commitments for third party purchases of receivables, and the maximum funding available under the Prior Program became $250 million. On March 2, 2009, in preparation for entering into a new securitization program (see Note 9, "Debt" for more information on the new program), USI's subsidiaries USFS and USSRC terminated the Prior Program. The Prior Program typically had been the Company's preferred source of floating rate financing, primarily because it generally carried a lower cost than other traditional borrowings.
70
UNITED STATIONERS INC. AND SUBSIDIARIES
NOTES TO CONSOLIDATED FINANCIAL STATEMENTS (Continued)
10. Off-Balance Sheet Financing (Continued)
Under the Prior Program, USSC sold, on a revolving basis, its eligible trade accounts receivable (except for certain excluded accounts receivable, which initially included all accounts receivable of Lagasse, Inc. and foreign operations) to USSRC. USSRC, in turn, ultimately transferred the eligible trade accounts receivable to a trust. The trust then sold investment certificates, which represented an undivided interest in the pool of accounts receivable owned by the trust, to third-party investors. Affiliates of J.P. Morgan Chase Bank, PNC Bank and Fifth Third Bank acted as funding agents. The funding agents, or their affiliates, provided standby liquidity funding to support the sale of the accounts receivable by USSRC under 364-day liquidity facilities. The Prior Program provided for the possibility of other liquidity facilities that may have been provided by other commercial banks rated at least A-1/P-1.
Financial Statement Presentation
The Prior Program was accounted for as a sale in accordance with FASB accounting guidance on the accounting for transfers and servicing of financial assets and extinguishments of liabilities. Trade accounts receivable sold under the Prior Program were excluded from accounts receivable in the Consolidated Financial Statements. As of December 31, 2008, the Company sold $23 million of interests in trade accounts receivable. Accordingly, trade accounts receivable of $23 million as of December 31, 2008 was excluded from the Consolidated Financial Statements. As discussed below, the Company retained an interest in the trust based on funding levels determined by USSRC. The Company's retained interest in the trust is included in the Condensed Consolidated Balance Sheets under the caption, "Accounts receivable and retained interest in receivables sold." For further information on the Company's retained interest in the trust, see the caption "Retained Interest" below.
The Company recognized certain costs and/or losses related to the Prior Program. Costs related to the Prior Program varied on a daily basis and generally were related to certain short-term interest rates. The annual interest rate on the certificates issued under the Prior Program for the first two months of 2009 ranged between 0.6% and 2.3%. In addition to the interest on the certificates, the Company paid certain bank fees related to the program. Losses recognized on the sale of accounts receivable, which represent the interest and bank fees that are the financial cost of funding under the Prior Program including amortization of previously capitalized bank fees and excluding servicing revenues, totaled $8.1 million for 2008, compared with $14.6 million for 2007. Proceeds from the collections under the Prior Program for 2009, 2008, and 2007 totaled $0.6 billion, $3.9 billion, and $3.9 billion, respectively. All costs and/or losses related to the Prior Program are included in the Condensed Consolidated Statements of Income under the caption "Other Expense, net."
The Company maintained responsibility for servicing the sold trade accounts receivable and those transferred to the trust. No servicing asset or liability was recorded because the fees received for servicing the receivables approximated the related costs.
Retained Interest
USSRC determined the level of funding achieved by the sale of trade accounts receivable under the Prior Program, subject to a maximum amount. It retained a residual interest in the eligible receivables transferred to the trust, such that amounts payable in respect of the residual interest would be distributed to USSRC upon payment in full of all amounts owed by USSRC to the trust (and by the trust to its investors). The Company's net retained interest on $350.9 million of trade receivables in the trust as of December 31, 2008 was $327.9 million. The Company's retained interest in the trust is included in the
71
UNITED STATIONERS INC. AND SUBSIDIARIES
NOTES TO CONSOLIDATED FINANCIAL STATEMENTS (Continued)
10. Off-Balance Sheet Financing (Continued)
Consolidated Financial Statements under the caption, "Accounts receivable and retained interest in receivables sold."
The Company measured the fair value of its retained interest throughout the term of the Prior Program using a present value model incorporating the following two key economic assumptions: (1) an average collection cycle of approximately 45 days; and (2) an assumed discount rate of 3% per annum, which approximated the Company's interest cost on the Prior Program. In addition, the Company estimated and recorded an allowance for doubtful accounts related to the Company's retained interest. Considering the above noted economic factors and estimates of doubtful accounts, the book value of the Company's retained interest approximated fair value at year-end 2008. A 10% or 20% adverse change in the assumed discount rate or average collection cycle would not have a material impact on the Company's financial position or results of operations. Accounts receivable sold to the trust and written off during first quarter of 2009 were not material.
11. Leases, Contractual Obligations and Contingencies
The Company has entered into non-cancelable long-term leases for certain property and equipment. Future minimum lease payments under operating leases in effect as of December 31, 2009 having initial or remaining non-cancelable lease terms in excess of one year are as follows (in thousands):
Year
|
Operating Leases(1) |
|||
|---|---|---|---|---|
2010 |
$ | 51,867 | ||
2011 |
46,106 | |||
2012 |
38,956 | |||
2013 |
28,925 | |||
2014 |
22,004 | |||
Later years |
55,582 | |||
Total required lease payments |
$ | 243,440 | ||
- (1)
- Operating leases are net of immaterial sublease income.
Operating lease expense was approximately $52.5 million, $53.5 million, and $51.4 million in 2009, 2008, and 2007, respectively.
72
UNITED STATIONERS INC. AND SUBSIDIARIES
NOTES TO CONSOLIDATED FINANCIAL STATEMENTS (Continued)
12. Pension Plans and Defined Contribution Plan
Pension Plans
As of December 31, 2009, the Company has pension plans covering approximately 3,600 of its active associates. Non-contributory plans covering non-union associates provide pension benefits that are based on years of credited service and a percentage of annual compensation. Non-contributory plans covering union members generally provide benefits of stated amounts based on years of service. The Company funds the plans in accordance with all applicable laws and regulations. The Company uses December 31 as its measurement date to determine its pension obligations. The non-union plans have been closed to new associates beginning January 1, 2008. In addition, effective January 1, 2008, in accordance with new measurement provisions required by applicable accounting guidance (see Note 2 for "New Accounting Pronouncements"), the Company changed its measurement date to determine its pension obligations to its fiscal year end.
Effective March 1, 2009, the Company froze pension service benefits for employees not covered by collective bargaining agreements. As a result, the Company incurred a curtailment loss of $0.2 million in the first quarter of 2009. The Company also reduced the Pension Benefit Obligation ("PBO") by $11.8 million as a result of this action. The PBO reduction led to an $11.8 million reduction in the "Accrued pension benefits liability" and a corresponding increase in accumulated other comprehensive income, net of tax.
Change in Projected Benefit Obligation
The following table sets forth the plans' changes in Projected Benefit Obligation for the years ended December 31, 2009 and 2008 (in thousands):
| |
2009 | 2008 | |||||
|---|---|---|---|---|---|---|---|
Benefit obligation at beginning of year |
$ | 142,855 | $ | 127,306 | |||
Service cost—benefit earned during the period |
1,568 | 6,953 | |||||
Interest cost on projected benefit obligation |
8,091 | 8,979 | |||||
Union plan amendments |
615 | — | |||||
Actuarial (gain) loss |
(2,643 | ) | 2,198 | ||||
Decrease in benefit obligation due to plan freeze |
(11,798 | ) | — | ||||
Benefits paid |
(2,529 | ) | (2,581 | ) | |||
Benefit obligation at end of year |
$ | 136,159 | $ | 142,855 | |||
The accumulated benefit obligation for the plan as of December 31, 2009 and 2008 totaled $136.2 million and $128.8 million, respectively.
73
UNITED STATIONERS INC. AND SUBSIDIARIES
NOTES TO CONSOLIDATED FINANCIAL STATEMENTS (Continued)
12. Pension Plans and Defined Contribution Plan (Continued)
Plan Assets and Investment Policies and Strategies
The following table sets forth the change in the plans' assets for the years ended December 31, 2009 and 2008 (in thousands):
| |
2009 | 2008 | |||||
|---|---|---|---|---|---|---|---|
Fair value of plan assets at beginning of year |
$ | 83,672 | $ | 102,609 | |||
Actual return on plan assets |
17,509 | (32,521 | ) | ||||
Company contributions |
3,800 | 16,165 | |||||
Benefits paid |
(2,529 | ) | (2,581 | ) | |||
Fair value of plan assets at end of year |
$ | 102,452 | $ | 83,672 | |||
The Company's pension plan investment allocations, as a percentage of the fair value of total plan assets, as of December 31, 2009 and 2008, by asset category are as follows:
Asset Category
|
2009 | 2008 | |||||
|---|---|---|---|---|---|---|---|
Cash |
1.8 | % | 1.1 | % | |||
Equity securities |
77.2 | % | 62.4 | % | |||
Fixed income |
21.0 | % | 36.5 | % | |||
Total |
100.0 | % | 100.0 | % | |||
The investment policies and strategies for the Company's pension plan assets are established with the goals of generating above-average investment returns over time, while containing risks within acceptable levels and providing adequate liquidity for the payment of plan obligations. The Company recognizes that there typically are tradeoffs among these objectives, and strives to minimize risk associated with a given expected return.
As discussed in Note 2, the Company adopted new disclosure provisions for the year ending December 31, 2009. The new accounting guidance requires enhanced disclosures about the plan assets of a company's defined benefit pension and other postretirement plans intended to provide financial statement users with a greater understanding of the inputs and valuation techniques used to measure the fair value of plan assets and the effect of fair value measurements using significant unobservable inputs on changes in plan assets for the period. This guidance establishes a hierarchy that gives the highest priority to unadjusted quoted prices in active markets for identical assets or liabilities (Level 1 measurement) and the lowest priority to unobservable inputs (Level 3 measurement). This hierarchy requires entities to maximize the use of observable inputs and minimize the use of unobservable inputs. If a financial instrument uses inputs that fall in different levels of the hierarchy, the instrument will be categorized based upon the lowest level of input that is significant to the fair value calculation. The three levels of input used to measure fair value are as follows:
Level 1—unadjusted quoted prices for identical assets or liabilities in active markets accessible by the Company
Level 2—inputs that are observable in the marketplace other than those inputs classified as level 1
Level 3—inputs that are unobservable in the marketplace and significant to the valuation
74
UNITED STATIONERS INC. AND SUBSIDIARIES
NOTES TO CONSOLIDATED FINANCIAL STATEMENTS (Continued)
12. Pension Plans and Defined Contribution Plan (Continued)
The Company's defined benefit plan assets are measured at fair value on a recurring basis and are invested primarily in a diversified mix of fixed income investments and equity securities. The Company establishes target ranges for investment allocation and sets specific allocations. The target allocations for plan assets are 70 percent equity securities, 18 percent corporate bonds and U.S. Treasuries and 12 percent to all other types of investments. Equity securities include investments in large cap and small cap corporations located in the U.S. and a mix of both international and emerging market corporations fixed income securities include investment grade bonds and U.S. treasuries. Other types of investments include commodity futures and Real Estate Investment Trusts (REITs).
The fair values of the Company's pension plan assets at December 31, 2009 by asset category are as follows:
Fair Value Measurements at
December 31, 2009 (in thousands)
Asset Category
|
|
Total | Quoted Prices In Active Markets for Identical Assets (Level 1) |
Significant Observable Inputs (Level 2) |
Significant Unobservable Inputs (Level 3) |
|||||||||||
|---|---|---|---|---|---|---|---|---|---|---|---|---|---|---|---|---|
Cash |
$ | 288 | $ | 288 | ||||||||||||
Equity Securities |
||||||||||||||||
U.S. Large Cap |
(a) | 29,881 | 29,881 | |||||||||||||
International Large Core |
(b) | 22,702 | 22,702 | |||||||||||||
Emerging Markets |
(c) | 8,326 | 8,326 | |||||||||||||
U.S. Small Value Fund |
(d) | 5,281 | 5,281 | |||||||||||||
U.S. Small Growth Fund |
(e) | 5,100 | 5,100 | |||||||||||||
Domestic Real Estate |
(f) | 4,423 | 4,423 | |||||||||||||
Fixed Income |
||||||||||||||||
U.S. Fixed Income |
(g) | 17,828 | 17,828 | |||||||||||||
Commodities/U.S. Fixed income |
(h) | 8,623 | 8,623 | |||||||||||||
Total |
$ | 102,452 | $ | 97,171 | $ | 5,281 | $ | — | ||||||||
- (a)
- A
separately managed, diversified portfolio consisting of publically traded large cap stocks. The portfolio is predominately comprised of U.S. companies but
may also hold international company stock.
- (b)
- A
daily valued mutual fund investment. The fund invests in publically traded companies domiciled outside the U.S. and includes companies located in emerging
market countries.
- (c)
- A
daily valued mutual fund investment. The fund invests in publically traded companies domiciled in emerging market countries.
- (d)
- A
daily valued commingled fund investment. The fund invests in publically traded, small capitalization companies that are considered value in style. The
majority of holdings are domiciled in the U.S. though the fund may hold international stocks. The fund allows for monthly liquidity.
- (e)
- A daily valued mutual fund investment. The fund invests in publically traded, small capitalization companies that are considered growth in style. The majority of holdings are domiciled in the U.S. though the fund may hold international stocks.
75
UNITED STATIONERS INC. AND SUBSIDIARIES
NOTES TO CONSOLIDATED FINANCIAL STATEMENTS (Continued)
12. Pension Plans and Defined Contribution Plan (Continued)
- (f)
- A
daily valued mutual fund investment. The fund invests in publically traded Real Estate Investment Trusts. This is an index mutual fund that tracks the
Morgan Stanley REIT Index. The fund normally invests at least 98% of assets that are included in the Morgan Stanley REIT Index.
- (g)
- A
separately managed fixed income portfolio utilized to match the duration of the Plan's liabilities. This liability driven investment portfolio is
comprised of Treasury securities including STRIPS and zero coupon bonds as well as high quality corporate bonds.
- (h)
- A daily valued mutual fund investment. This fund combines a commodities position, typically through swap agreements, with a portfolio of inflation indexed bonds and other fixed income securities. The commodities position is constructed to track the performance of the Dow Jones UBS Commodity Index.
Plan Funded Status
The following table sets forth the plans' funded status as of December 31, 2009 and 2008 (in thousands):
| |
2009 | 2008 | |||||
|---|---|---|---|---|---|---|---|
Funded status of the plan |
$ | (33,707 | ) | $ | (59,183 | ) | |
Unrecognized prior service cost |
1,378 | 1,059 | |||||
Unrecognized net actuarial loss |
34,670 | 62,946 | |||||
Net amount recognized |
$ | 2,341 | $ | 4,822 | |||
Amounts Recognized in Consolidated Balance Sheet
| |
2009 | 2008 | |||||
|---|---|---|---|---|---|---|---|
Accrued benefit liability |
$ | (33,707 | ) | $ | (59,183 | ) | |
Accumulated other comprehensive income |
36,048 | 64,005 | |||||
Net amount recognized |
$ | 2,341 | $ | 4,822 | |||
Components of Net Periodic Benefit Cost
Net periodic pension cost for the years ended December 31, 2009, 2008 and 2007 for pension and supplemental benefit plans includes the following components (in thousands):
| |
2009 | 2008 | 2007 | |||||||
|---|---|---|---|---|---|---|---|---|---|---|
Service cost—benefit earned during the period |
$ | 1,568 | $ | 5,892 | $ | 6,182 | ||||
Interest cost on projected benefit obligation |
8,091 | 7,729 | 7,016 | |||||||
Expected return on plan assets |
(6,871 | ) | (8,790 | ) | (7,179 | ) | ||||
Amortization of prior service cost |
113 | 205 | 205 | |||||||
Amortization of actuarial loss |
3,198 | 594 | 1,195 | |||||||
Curtailment loss |
182 | — | — | |||||||
Net periodic pension cost |
$ | 6,281 | $ | 5,630 | $ | 7,419 | ||||
The estimated net actuarial loss and prior service cost that will be amortized from accumulated other comprehensive loss into the net periodic benefit cost during 2010 are approximately $2.0 million and
76
UNITED STATIONERS INC. AND SUBSIDIARIES
NOTES TO CONSOLIDATED FINANCIAL STATEMENTS (Continued)
12. Pension Plans and Defined Contribution Plan (Continued)
$0.1 million, respectively. The service cost and interest cost for 2008 shown in this table do not equal the service cost and interest cost shown in the Change in Projected Benefit Obligation table above due to the measurement date change required by applicable accounting guidance.
Assumptions Used
The following tables summarize the Company's actuarial assumptions for discount rates, expected long-term rates of return on plan assets, and rates of increase in compensation and healthcare costs for the years ended December 31, 2009, 2008 and 2007:
| |
2009 | 2008 | 2007 | |||||||
|---|---|---|---|---|---|---|---|---|---|---|
Pension plan assumptions: |
||||||||||
Assumed discount rate |
6.25 | % | 6.25 | % | 6.00 | % | ||||
Rate of compensation increase |
3.75 | % | 3.75 | % | 3.75 | % | ||||
Expected long-term rate of return on plan assets |
8.25 | % | 8.25 | % | 8.25 | % | ||||
For the year ending December 31, 2009, the rate of compensation increase was 3.75% prior to March 1, 2009 when the Company froze pension service benefits for employees not covered by collective bargaining agreements. To select the appropriate actuarial assumptions, management relied on current market conditions, historical information and consultation with and input from the Company's outside actuaries. The expected long-term rate of return on plan assets assumption is based on historical returns and the future expectation of returns for each asset category, as well as the target asset allocation of the asset portfolio. The change in the assumed discount rate in 2008 did not have a material impact on the Company's net periodic pension cost.
Contributions
The May 15, 2010 contribution amount has not yet been determined.
Estimated Future Benefit Payments
The estimated future benefit payments under the Company's pension plans are as follows (in thousands):
| |
Amounts | |||
|---|---|---|---|---|
2010 |
$ | 4,424 | ||
2011 |
5,053 | |||
2012 |
6,080 | |||
2013 |
5,690 | |||
2014 |
6,521 | |||
2015-2019 |
42,186 | |||
Defined Contribution Plan
The Company has a defined contribution plan. Salaried associates and non-union hourly paid associates are eligible to participate after completing six consecutive months of employment. The plan permits associates to have contributions made as 401(k) salary deferrals on their behalf, or as voluntary
77
UNITED STATIONERS INC. AND SUBSIDIARIES
NOTES TO CONSOLIDATED FINANCIAL STATEMENTS (Continued)
12. Pension Plans and Defined Contribution Plan (Continued)
after-tax contributions, and provides for Company contributions, or contributions matching associates' salary deferral contributions, at the discretion of the Board of Directors. Company contributions to match associates' contributions were approximately $2.8 million, $5.1 million and $4.3 million in 2009, 2008 and 2007, respectively. Effective May 1, 2009, the Company temporarily suspended this Company match of employee contributions to the Plan for all exempt associates.
Measurement Date Provisions
Relative accounting guidance for new measurement provisions provides two transition alternatives related to the change in measurement date provisions. The Company elected the standard method. The transition from a previous measurement date of October 31, 2007 to December 31, 2007, beginning in fiscal 2008, required the Company to reduce its Retained Earnings as of January 1, 2008 by $0.6 million to recognize the one-time after-tax effect of an additional two months of net periodic benefit expense for the Company's pension and postretirement healthcare benefit plans. There was no impact on the Company's results of operations. The balance sheet adjustments as of January 1, 2008 were as follows (in thousands):
| |
Increase (decrease) |
|||
|---|---|---|---|---|
Deferred income tax liability |
$ | (88 | ) | |
Accrued pension benefits liability |
488 | |||
Accrued postretirement benefits liability |
(257 | ) | ||
Retained earnings |
(617 | ) | ||
Accumulated other comprehensive income |
474 | |||
13. Postretirement Health Benefits
The Company maintains a postretirement plan. The plan is unfunded and provides healthcare benefits to substantially all retired non-union associates and their dependents. Eligibility requirements are based on the individual's age (minimum age of 55), years of service and hire date. The benefits are subject to retiree contributions, deductible, co-payment provision and other limitations. Effective January 1, 2008, in accordance with accounting guidance on postretirement benefit plans (see Note 2), the Company changed its measurement date to determine its postretirement health obligations to December 31.
Accrued Postretirement Benefit Obligation
The following table provides the plan's change in Accrued Postretirement Benefit Obligation ("APBO") for the years ended December 31, 2009 and 2008 (in thousands):
| |
2009 | 2008 | |||||
|---|---|---|---|---|---|---|---|
Benefit obligation at beginning of year |
$ | 3,910 | $ | 3,965 | |||
Service cost—benefit earned during the period |
224 | 254 | |||||
Interest cost on projected benefit obligation |
220 | 249 | |||||
Plan participants' contributions |
293 | 316 | |||||
Actuarial gain |
— | (465 | ) | ||||
Benefits paid |
(404 | ) | (409 | ) | |||
Benefit obligation at end of year |
$ | 4,243 | $ | 3,910 | |||
78
UNITED STATIONERS INC. AND SUBSIDIARIES
NOTES TO CONSOLIDATED FINANCIAL STATEMENTS (Continued)
13. Postretirement Health Benefits (Continued)
Plan Assets and Investment Policies and Strategies
The Company does not fund its postretirement healthcare plan (see "Plan Funded Status" below). Accordingly, as of December 31, 2009 and 2008, the postretirement healthcare plan held no assets. The following table provides the change in plan assets for the years ended December 31, 2009 and 2008 (in thousands):
| |
2009 | 2008 | |||||
|---|---|---|---|---|---|---|---|
Fair value of plan assets at beginning of year |
$ | — | $ | — | |||
Company contributions |
111 | 93 | |||||
Plan participants' contributions |
293 | 316 | |||||
Benefits paid |
(404 | ) | (409 | ) | |||
Fair value of plan assets at end of year |
$ | — | $ | — | |||
Plan Funded Status
The Company's postretirement healthcare plan is unfunded. The following table sets forth the plans' funded status as of December 31, 2009 and 2008 (in thousands):
| |
2009 | 2008 | |||||
|---|---|---|---|---|---|---|---|
Funded status of the plan |
$ | (4,243 | ) | $ | (3,910 | ) | |
Amount recognized in accumulated other comprehensive income |
$ | (4,552 | ) | $ | (4,874 | ) | |
Components of Net Periodic Postretirement Benefit Cost
The costs of postretirement healthcare benefits for the years ended December 31, 2009, 2008 and 2007 were as follows (in thousands):
| |
2009 | 2008 | 2007 | |||||||
|---|---|---|---|---|---|---|---|---|---|---|
Service cost—benefit earned during the period |
$ | 224 | $ | 207 | $ | 264 | ||||
Interest cost on projected benefit obligation |
220 | 211 | 201 | |||||||
Recognized actuarial gain |
(321 | ) | (366 | ) | (317 | ) | ||||
Net periodic postretirement benefit cost |
$ | 123 | $ | 52 | $ | 148 | ||||
The estimated net actuarial gain that will be amortized from accumulated other comprehensive income into the net periodic benefit cost during 2010 is approximately $0.3 million. The service cost and interest cost for 2008 shown in this table do not equal the service cost and interest cost shown in the Accrued Postretirement Benefit Obligation table above due to the measurement date change required by SFAS No. 158.
79
UNITED STATIONERS INC. AND SUBSIDIARIES
NOTES TO CONSOLIDATED FINANCIAL STATEMENTS (Continued)
13. Postretirement Health Benefits (Continued)
Assumptions Used
The weighted-average assumptions used in accounting for the Company's postretirement plan for the three years presented are set forth below:
| |
2009 | 2008 | 2007 | |||||||
|---|---|---|---|---|---|---|---|---|---|---|
Assumed average healthcare cost trend |
3.00 | % | 3.00 | % | 3.00 | % | ||||
Assumed discount rate |
6.25 | % | 6.25 | % | 6.00 | % | ||||
The Company's medical cost increase rate is capped at 3.00% by the plan.
Contributions
The May 15, 2010 contribution amount has not yet been determined. The postretirement medical plan is paid for by a combination of retirees and company contributions. Company contributions are made as the payments come due. Retiree premiums are set annually by the Company.
Estimated Future Benefit Payments
The estimated future benefits payments under the Company's postretirement healthcare plan are as follows (in thousands):
| |
Amounts | |||
|---|---|---|---|---|
2010 |
$ | 127 | ||
2011 |
140 | |||
2012 |
154 | |||
2013 |
171 | |||
2014 |
192 | |||
2015-2019 |
1,400 | |||
14. Preferred Stock
USI's authorized capital shares include 15 million shares of preferred stock. The rights and preferences of preferred stock are established by USI's Board of Directors upon issuance. As of December 31, 2009, USI had no preferred stock outstanding and all 15 million shares are classified as undesignated preferred stock.
80
UNITED STATIONERS INC. AND SUBSIDIARIES
NOTES TO CONSOLIDATED FINANCIAL STATEMENTS (Continued)
15. Income Taxes
The provision for income taxes consisted of the following (in thousands):
| |
Years Ended December 31, | |||||||||||
|---|---|---|---|---|---|---|---|---|---|---|---|---|
| |
2009 | 2008 | 2007 | |||||||||
Currently payable |
||||||||||||
Federal |
$ | 61,989 | $ | 51,725 | $ | 66,906 | ||||||
State |
7,467 | 6,277 | 6,038 | |||||||||
Total currently payable |
69,456 | 58,002 | 72,944 | |||||||||
Deferred, net— |
||||||||||||
Federal |
(9,096 | ) | (215 | ) | (3,629 | ) | ||||||
State |
(1,244 | ) | 662 | (490 | ) | |||||||
Total deferred, net |
(10,340 | ) | 447 | (4,119 | ) | |||||||
Provision for income taxes |
$ | 59,116 | $ | 58,449 | $ | 68,825 | ||||||
The Company's effective income tax rates for the years ended December 31, 2009, 2008 and 2007 varied from the statutory federal income tax rate as set forth in the following table (in thousands):
| |
Years Ended December 31, | ||||||||||||||||||
|---|---|---|---|---|---|---|---|---|---|---|---|---|---|---|---|---|---|---|---|
| |
2009 | 2008 | 2007 | ||||||||||||||||
| |
Amount | % of Pre-tax Income |
Amount | % of Pre-tax Income |
Amount | % of Pre-tax Income |
|||||||||||||
Tax provision based on the federal statutory rate |
$ | 56,035 | 35.0 | % | $ | 54,902 | 35.0 | % | $ | 61,607 | 35.0 | % | |||||||
State and local income taxes— net of federal income tax benefit |
4,045 | 2.5 | % | 4,510 | 2.9 | % | 3,606 | 2.0 | % | ||||||||||
Change in tax reserves and accrual adjustments |
272 | 0.2 | % | 6 | 0.0 | % | 3,132 | 1.8 | % | ||||||||||
Non-deductible and other |
(1,236 | ) | (0.8 | )% | (969 | ) | (0.6 | )% | 480 | 0.3 | % | ||||||||
Provision for income taxes |
$ | 59,116 | 36.9 | % | $ | 58,449 | 37.3 | % | $ | 68,825 | 39.1 | % | |||||||
81
UNITED STATIONERS INC. AND SUBSIDIARIES
NOTES TO CONSOLIDATED FINANCIAL STATEMENTS (Continued)
15. Income Taxes (Continued)
The deferred tax assets and liabilities resulted from temporary differences in the recognition of certain items for financial and tax accounting purposes. The sources of these differences and the related tax effects were as follows (in thousands):
| |
As of December 31, | ||||||||||||
|---|---|---|---|---|---|---|---|---|---|---|---|---|---|
| |
2009 | 2008 | |||||||||||
| |
Assets | Liabilities | Assets | Liabilities | |||||||||
Accrued expenses |
$ | 15,493 | $ | — | $ | 12,373 | $ | — | |||||
Allowance for doubtful accounts |
13,167 | — | 12,112 | — | |||||||||
Depreciation and amortization |
— | 22,573 | — | 24,424 | |||||||||
Intangibles arising from acquisitions |
— | 18,903 | — | 19,738 | |||||||||
Inventory reserves and adjustments |
— | 21,014 | — | 25,479 | |||||||||
Pension and postretirement |
12,347 | 22,909 | |||||||||||
Interest swap |
9,907 | 13,202 | |||||||||||
Reserve for stock option compensation |
9,873 | — | 7,777 | — | |||||||||
Restructuring costs |
688 | — | 446 | — | |||||||||
Other |
26 | — | — | 180 | |||||||||
Total |
$ | 61,501 | $ | 62,490 | $ | 68,819 | $ | 69,821 | |||||
In the Consolidated Balance Sheets, these deferred assets and liabilities were classified on a net basis as current and non-current, based on the classification of the related asset or liability or the expected reversal date of the temporary difference.
Accounting for Uncertainty in Income Taxes
At December 31, 2008, the Company had $8.0 million in gross unrecognized tax benefits. At December 31, 2009, the gross unrecognized tax benefits decreased to $5.0 million. The following table shows the changes in gross unrecognized tax benefits, for the years ended December 31, 2009 and 2008 (in thousands):
| |
2009 | 2008 | |||||
|---|---|---|---|---|---|---|---|
Beginning Balance, January 1 |
$ | 8,000 | $ | 9,191 | |||
Additions based on tax positions taken during a prior period |
352 | 30 | |||||
Reductions based on tax positions taken during a prior period |
(1,383 | ) | (418 | ) | |||
Additions based on tax positions taken during the current period |
521 | 503 | |||||
Reductions related to settlements of tax matters |
(1,137 | ) | 0 | ||||
Reductions related to a lapse of applicable statute of limitations |
(1,317 | ) | (1,306 | ) | |||
Ending Balance, December 31 |
$ | 5,036 | $ | 8,000 | |||
At December 31, 2009 and December 31, 2008, $5.0 million and $8.0 million, respectively, of these gross unrecognized tax benefits would, if recognized, decrease the Company's effective tax rate.
The Company recognizes net interest and penalties related to unrecognized tax benefits in income tax expense. The gross amount of interest and penalties reflected in the Consolidated Statement of Income for the years ended December 31, 2009, 2008 and 2007 were income of $0.7 million, and expenses of
82
UNITED STATIONERS INC. AND SUBSIDIARIES
NOTES TO CONSOLIDATED FINANCIAL STATEMENTS (Continued)
15. Income Taxes (Continued)
$0.2 million, and $0.4 million, respectively. The Consolidated Balance Sheets at December 31, 2009 and December 31, 2008 include $1.1 million and $1.7 million, respectively, accrued for the potential payment of interest and penalties.
As of December 31, 2009, the Company's U.S. Federal income tax returns for 2006 and subsequent years remain subject to examination by tax authorities. In addition, the Company's state income tax returns for the 2001 and subsequent tax years remain subject to examinations by state and local income tax authorities. Although the Company is not currently under examination by the IRS, a number of state and local examinations are currently ongoing. Due to the potential for resolution of ongoing examinations and the expiration of various statutes of limitation, it is reasonably possible that the Company's gross unrecognized tax benefits balance may change within the next twelve months by a range of zero to $2.8 million.
16. Supplemental Cash Flow Information
In addition to the information provided in the Consolidated Statements of Cash Flows, the following are supplemental disclosures of cash flow information for the years ended December 31, 2009, 2008 and 2007 (in thousands):
| |
Years Ended December 31, | ||||||||||
|---|---|---|---|---|---|---|---|---|---|---|---|
| |
2009 | 2008 | 2007 | ||||||||
Cash Paid During the Year For: |
|||||||||||
Interest |
$ | 24,570 | $ | 26,122 | $ | 8,434 | |||||
Loss on the sale of trade accounts receivable |
423 | 8,409 | 15,574 | ||||||||
Income taxes, net |
65,419 | 55,364 | 57,024 | ||||||||
17. Other Expense
The following table sets forth the components of other expense (dollars in thousands):
| |
Years Ended December 31, | |||||||||
|---|---|---|---|---|---|---|---|---|---|---|
| |
2009 | 2008 | 2007 | |||||||
Loss on sale of accounts receivable, net of servicing revenue |
$ | 204 | $ | 8,079 | $ | 14,566 | ||||
Other |
— | — | 29 | |||||||
Total |
$ | 204 | $ | 8,079 | $ | 14,595 | ||||
83
UNITED STATIONERS INC. AND SUBSIDIARIES
NOTES TO CONSOLIDATED FINANCIAL STATEMENTS (Continued)
18. Fair Value of Financial Instruments
The estimated fair value of the Company's financial instruments approximates their net carrying values. The estimated fair values of the Company's financial instruments are as follows (in thousands):
| |
As of December 31, | ||||||||||||
|---|---|---|---|---|---|---|---|---|---|---|---|---|---|
| |
2009 | 2008 | |||||||||||
| |
Carrying Amount |
Fair Value | Carrying Amount |
Fair Value | |||||||||
Cash and cash equivalents |
$ | 18,555 | $ | 18,555 | $ | 10,662 | $ | 10,662 | |||||
Accounts receivable, net |
641,317 | 641,317 | 610,210 | 610,210 | |||||||||
Accounts payable |
390,883 | 390,883 | 341,084 | 341,084 | |||||||||
Long-term debt |
441,800 | 441,800 | 663,100 | 663,100 | |||||||||
Long-term interest rate swap liability |
26,070 | 26,070 | 34,652 | 34,652 | |||||||||
The fair value of the interest rate swaps is estimated based upon the amount that the Company would receive or pay to terminate the agreements as of December 31 of each year. See Note 20, "Derivative Financial Instruments", for further information.
19. Other Assets and Liabilities
Other assets and liabilities as of December 31, 2009 and 2008 were as follows (in thousands):
| |
As of December 31, | ||||||
|---|---|---|---|---|---|---|---|
| |
2009 | 2008 | |||||
Other Long-Term Assets, net: |
|||||||
Investment in deferred compensation |
$ | 3,939 | $ | 3,118 | |||
Long-Term notes receivable |
5,146 | 5,261 | |||||
Capitalized financing costs |
2,069 | 2,116 | |||||
Long-Term prepaid expenses |
1,154 | — | |||||
Other |
63 | 339 | |||||
Total other long-term assets, net |
$ | 12,371 | $ | 10,834 | |||
Other Long-Term Liabilities: |
|||||||
Accrued pension obligation |
$ | 33,707 | $ | 59,183 | |||
Deferred rent |
18,067 | 14,740 | |||||
Deferred directors compensation |
3,939 | 3,118 | |||||
Postretirement benefits |
4,132 | 3,810 | |||||
Restructuring and exit costs reserves |
887 | 651 | |||||
Long-Term swap liability |
26,070 | 34,652 | |||||
Long-Term income tax liability |
5,380 | 6,856 | |||||
Other |
1,520 | 2,154 | |||||
Total other long-term liabilities |
$ | 93,702 | $ | 125,164 | |||
84
UNITED STATIONERS INC. AND SUBSIDIARIES
NOTES TO CONSOLIDATED FINANCIAL STATEMENTS (Continued)
20. Derivative Financial Instruments
Interest rate movements create a degree of risk to the Company's operations by affecting the amount of interest payments. Interest rate swap agreements are used to manage the Company's exposure to interest rate changes. The Company designates its floating-to-fixed interest rate swaps as cash flow hedges of the variability of future cash flows at the inception of the swap contract to support hedge accounting.
On November 6, 2007, USSC entered into an interest rate swap transaction (the "November 2007 Swap Transaction") with U.S. Bank National Association as the counterparty. USSC entered into the November 2007 Swap Transaction to mitigate USSC's floating rate risk on an aggregate of $135 million of LIBOR based interest rate risk. Under the terms of the November 2007 Swap Transaction, USSC is required to make quarterly fixed rate payments to the counterparty calculated based on a notional amount of $135 million at a fixed rate of 4.674%, while the counterparty is obligated to make quarterly floating rate payments to USSC based on the three-month LIBOR on the same referenced notional amount. The November 2007 Swap Transaction has an effective date of January 15, 2008 and a termination date of January 15, 2013. Notwithstanding the terms of the November 2007 Swap Transaction, USSC is ultimately obligated for all amounts due and payable under its credit agreements.
Subsequently, on December 20, 2007, USSC entered into another interest rate swap transaction (the "December 2007 Swap Transaction") with Key Bank National Association as the counterparty. USSC entered into the December 2007 Swap Transaction to mitigate USSC's floating rate risk on an aggregate of $200 million of LIBOR based interest rate risk. Under the terms of the December 2007 Swap Transaction, USSC is required to make quarterly fixed rate payments to the counterparty calculated based on a notional amount of $200 million at a fixed rate of 4.075%, while the counterparty is obligated to make quarterly floating rate payments to USSC based on the three-month LIBOR on the same referenced notional amount. The December 2007 Swap Transaction has an effective date of December 21, 2007 and a termination date of June 21, 2012. Notwithstanding the terms of the December 2007 Swap Transaction, USSC is ultimately obligated for all amounts due and payable under its credit agreements.
On March 13, 2008, USSC entered into an interest rate swap transaction (the "March 2008 Swap Transaction") with U.S. Bank National Association as the counterparty. USSC entered into the March 2008 Swap Transaction to mitigate USSC's floating rate risk on an aggregate of $100 million of LIBOR based interest rate risk. Under the terms of the March 2008 Swap Transaction, USSC is required to make quarterly fixed rate payments to the counterparty calculated based on a notional amount of $100 million at a fixed rate of 3.212%, while the counterparty is obligated to make quarterly floating rate payments to USSC based on the three-month LIBOR on the same referenced notional amount. The March 2008 Swap Transaction had an effective date of March 31, 2008 and a termination date of June 29, 2012. Notwithstanding the terms of the March 2008 Swap Transaction, USSC is ultimately obligated for all amounts due and payable under its credit agreements.
The hedged transactions described above qualify as cash flow hedges in accordance with accounting guidance on derivative instruments. This guidance requires companies to recognize all of their derivative instruments as either assets or liabilities in the statement of financial position at fair value. The Company does not offset fair value amounts recognized for interest rate swaps executed with the same counterparty.
For derivative instruments that are designated and qualify as a cash flow hedge (for example, hedging the exposure to variability in expected future cash flows that is attributable to a particular risk), the
85
UNITED STATIONERS INC. AND SUBSIDIARIES
NOTES TO CONSOLIDATED FINANCIAL STATEMENTS (Continued)
20. Derivative Financial Instruments (Continued)
effective portion of the gain or loss on the derivative instrument is reported as a component of other comprehensive income and reclassified into earnings in the same line item associated with the forecasted transaction in the same period or periods during which the hedged transaction affects earnings (for example, in "interest expense" when the hedged transactions are interest cash flows associated with floating-rate debt).
The Company has entered into these interest rate swap agreements, described above, that effectively convert a portion of its floating-rate debt to a fixed-rate basis. This reduces the impact of interest rate changes on future interest expense. By using such derivative financial instruments, the Company exposes itself to credit risk and market risk. Credit risk is the risk that the counterparty to the interest rate swap agreements (as noted above) will fail to perform under the terms of the agreements. The Company attempts to minimize the credit risk in these agreements by only entering into transactions with credit worthy counterparties. The market risk is the adverse effect on the value of a derivative financial instrument that results from a change in interest rates.
Approximately 98% ($435 million) of the Company's outstanding long-term debt had its interest payments designated as the hedged forecasted transactions to interest rate swap agreements at December 31, 2009.
The interest rate swap agreements accounted for as cash flow hedges that were outstanding and recorded at fair value on the statement of financial position as of September 30, 2009 were as follows (in thousands):
As of December 31, 2009
|
Notional Amount |
Receive | Pay | Maturity Date | Fair Value Asset (Liability)(1) |
|||||||||
|---|---|---|---|---|---|---|---|---|---|---|---|---|---|---|
November 2007 Swap Transaction |
$ | 135,000 | Floating 3-month LIBOR | 4.674 | % | January 15, 2013 | $ | (10,676 | ) | |||||
December 2007 Swap Transaction |
200,000 | Floating 3-month LIBOR | 4.075 | % | June 21, 2012 | (11,671 | ) | |||||||
March 2008 Swap Transaction |
100,000 | Floating 3-month LIBOR | 3.212 | % | June 29, 2012 | (3,723 | ) | |||||||
- (1)
- These interest rate derivatives qualify for hedge accounting. Therefore, the fair value of each interest rate derivative is included in the Company's Consolidated Balance Sheets as either a component of "Other assets" or "Other long-term liabilities" with an offsetting component in "Stockholders' Equity" as part of "Accumulated Other Comprehensive Loss". Fair value adjustments of the interest rate swaps will be deferred and recognized as an adjustment to interest expense over the remaining term of the hedged instrument.
The Company's agreements with its derivative counterparties provide that if an event of default occurs on any Company debt of $25 million or more, the counterparties can terminate the swap agreements. If an event of default had occurred and the counterparties had exercised their early termination rights under the swap agreements as of December 31, 2009, the Company would have been required to pay the aggregate fair value net liability of $26.1 million plus accrued interest to the counterparties.
These interest rate swap agreements contain no ineffectiveness; therefore, all gains or losses on these derivative instruments are reported as a component of other comprehensive income ("OCI") and reclassified into earnings as "interest expense" in the same period or periods during which the hedged
86
UNITED STATIONERS INC. AND SUBSIDIARIES
NOTES TO CONSOLIDATED FINANCIAL STATEMENTS (Continued)
20. Derivative Financial Instruments (Continued)
transaction affects earnings. The following table depicts the effect of these derivative instruments on the statement of income for the year ended December 31, 2009.
| |
|
|
|
Amount of Gain (Loss) Reclassified from Accumulated OCI into Income (Effective Portion) |
||||||||
|---|---|---|---|---|---|---|---|---|---|---|---|---|
| |
Amount of Gain (Loss) Recognized in OCI on Derivative (Effective Portion) |
|
||||||||||
| |
Location of Gain (Loss) Reclassified from Accumulated OCI into Income (Effective Portion) |
|||||||||||
| |
At December 31, 2008 |
At December 31, 2009 |
For the Year Ended December 31, 2009 |
|||||||||
November 2007 Swap Transaction |
$ | (9,025 | ) | $ | (6,614 | ) | Interest expense, net; Income tax expense |
$ | 2,411 | |||
December 2007 Swap Transaction |
(9,493 |
) |
(7,230 |
) |
Interest expense, net; |
2,263 |
||||||
March 2008 Swap Transaction |
(2,953 |
) |
(2,306 |
) |
Interest expense, net; |
647 |
||||||
21. Fair Value Measurements
The Company measures certain financial assets and liabilities at fair value on a recurring basis, including:
- •
- the retained interest in accounts receivables sold under the Prior Receivables Securitization Program based on company
determined inputs including an average collection cycle and assumed discount rate (see Note 10, "Off-Balance Sheet Financing" for further information and a detailed description of
this asset); and
- •
- interest rate swap liabilities related to interest rate swap derivatives based on the mark-to-market position of the Company's interest rate swap positions and other observable interest rates (see Note 20, "Derivative Financial Instruments", for more information on these interest rate swaps).
FASB accounting guidance on fair value establishes a hierarchy for those instruments measured at fair value which distinguishes between assumptions based on market data (observable inputs) and the Company's own assumptions (unobservable inputs). The hierarchy consists of three levels:
- •
- Level 1—Quoted market prices in active markets for identical assets or liabilities;
- •
- Level 2—Inputs other than Level 1 inputs that are either directly or indirectly observable; and
- •
- Level 3—Unobservable inputs developed using estimates and assumptions developed by the Company which reflect those that a market participant would use.
Determining which category an asset or liability falls within the hierarchy requires significant judgment. The Company evaluates its hierarchy disclosures each quarter. The following table summarizes the
87
UNITED STATIONERS INC. AND SUBSIDIARIES
NOTES TO CONSOLIDATED FINANCIAL STATEMENTS (Continued)
21. Fair Value Measurements (Continued)
financial instruments measured at fair value in the accompanying Consolidated Balance Sheet as of December 31, 2009 (in thousands):
| |
Fair Value Measurements as of December 31, 2009 | |||||||||||||
|---|---|---|---|---|---|---|---|---|---|---|---|---|---|---|
| |
|
Quoted Market Prices in Active Markets for Identical Assets or Liabilities |
Significant Other Observable Inputs |
Significant Unobservable Inputs |
||||||||||
| |
Total | Level 1 | Level 2 | Level 3 | ||||||||||
Liabilities |
||||||||||||||
Interest rate swap liability |
$ | 26,070 | $ | — | $ | 26,070 | $ | — | ||||||
The following tables present the changes in Level 3 assets measured at fair value on a recurring basis for the year ended December 31, 2009:
| |
Retained Interest in receivables sold, net |
|||
|---|---|---|---|---|
Balance as of December 31, 2008 |
$ | 327,860 | ||
Net payments/sales |
(326,741 | ) | ||
Realized losses |
(1,119 | ) | ||
Balance as of December 31, 2009 |
$ | — | ||
The realized losses associated with Level 3 assets relate to that portion of the Company's bad debt expense related to the retained interest in receivables sold. This expense is reflected in the Company's Consolidated Statements of Income under the caption "Warehousing, marketing and administrative expenses."
The carrying amount of accounts receivable at December 31, 2009, including $445.3 million of receivables sold under the 2009 Receivables Securitization Program, approximates fair value because of the short-term nature of this item.
FASB accounting guidance on fair value measurements requires separate disclosure of assets and liabilities measured at fair value on a recurring basis, as noted above, from those measured at fair value on a nonrecurring basis. As of December 31, 2009, no assets or liabilities are measured at fair value on a nonrecurring basis.
88
UNITED STATIONERS INC. AND SUBSIDIARIES
NOTES TO CONSOLIDATED FINANCIAL STATEMENTS (Continued)
22. Quarterly Financial Data—Unaudited
| |
First Quarter(3) |
Second Quarter |
Third Quarter |
Fourth Quarter |
Total(1) | |||||||||||
|---|---|---|---|---|---|---|---|---|---|---|---|---|---|---|---|---|
| |
(dollars in thousands, except per share data) |
|||||||||||||||
Year Ended December 31, 2009: |
||||||||||||||||
Net sales |
$ | 1,121,307 | $ | 1,159,195 | $ | 1,246,743 | $ | 1,183,046 | $ | 4,710,291 | ||||||
Gross profit |
$ | 164,336 | $ | 163,413 | $ | 184,896 | $ | 177,996 | $ | 690,641 | ||||||
Net income(2) |
$ | 13,521 | $ | 21,158 | $ | 33,468 | $ | 32,838 | $ | 100,985 | ||||||
Net income per share—basic |
$ | 0.57 | $ | 0.91 | $ | 1.43 | $ | 1.40 | $ | 4.32 | ||||||
Net income per share—diluted |
$ | 0.57 | $ | 0.88 | $ | 1.38 | $ | 1.33 | $ | 4.19 | ||||||
Year Ended December 31, 2008: |
||||||||||||||||
Net sales |
$ | 1,252,474 | $ | 1,251,335 | $ | 1,337,855 | $ | 1,145,214 | $ | 4,986,878 | ||||||
Gross profit |
$ | 184,301 | $ | 182,023 | $ | 197,860 | $ | 176,495 | $ | 740,679 | ||||||
Net income(2)(3) |
$ | 21,316 | $ | 21,474 | $ | 33,069 | $ | 22,555 | $ | 98,414 | ||||||
Net income per share—basic |
$ | 0.89 | $ | 0.92 | $ | 1.41 | $ | 0.96 | $ | 4.17 | ||||||
Net income per share—diluted |
$ | 0.88 | $ | 0.91 | $ | 1.39 | $ | 0.95 | $ | 4.13 | ||||||
- (1)
- As
a result of changes in the number of common and common equivalent shares during the year, the sum of quarterly earnings per share will not necessarily
equal earnings per share for the total year.
- (2)
- 2009 results were impacted by the following items: (1) a $14.0 million, or $0.57 per diluted share negotiated settlement with a service supplier in the fourth quarter and (2) a $3.4 million, or $0.14 per diluted share severance charge from the first quarter of 2009. (3) 2008 results were impacted by the following items: (1) a $5.1 million, or $0.14 per diluted share gain on the sale of two distribution centers during the third quarter of 2008, (2) a $4.7 million, or $0.12 per diluted share gain on the sale of the Company's former corporate headquarters from the second quarter of 2008, and (3) a second-quarter $6.7 million, or $0.18 per diluted share charge to write-off internal system capitalized software costs.
89
ITEM 9. CHANGES IN AND DISAGREEMENTS WITH ACCOUNTANTS ON ACCOUNTING AND FINANCIAL DISCLOSURE.
The Registrant had no disagreements on accounting and financial disclosure of the type referred to in Item 304 of Regulation S-K.
ITEM 9A. CONTROLS AND PROCEDURES.
Attached as exhibits to this Annual Report are certifications of the Company's President and Chief Executive Officer ("CEO") and Senior Vice President and Chief Financial Officer ("CFO"), which are required in accordance with Rule 13a-14 under the Exchange Act. This "Controls and Procedures" section includes information concerning the controls and controls evaluation referred to in such certifications. It should be read in conjunction with the reports of the Company's management on the Company's internal control over financial reporting and the report thereon of Ernst & Young LLP referred to below.
Inherent Limitations on Effectiveness of Controls
The Company's management, including the CEO and CFO, does not expect that the Company's Disclosure Controls or its internal control over financial reporting will prevent or detect all error or all fraud. A control system, no matter how well designed and operated, can provide only reasonable, not absolute, assurance that the control system's objectives will be met. The design of a control system must reflect the existence of resource constraints. Further, because of the inherent limitations in all control systems, no evaluation of controls can provide absolute assurance that misstatements due to error or fraud will not occur or that all control issues and instances of fraud, if any, within the Company have been detected. These inherent limitations include the fact that judgments in decision making can be faulty and that breakdowns can occur because of simple error or mistake. Controls can also be circumvented by the individual acts of some persons, by collusion of two or more people, or by managerial override. The design of any system of controls is based in part on certain assumptions about the likelihood of future events, and no design is likely to succeed in achieving its stated goals under all potential future conditions. Projections of any evaluation of the effectiveness of controls to future periods are subject to risks, including that controls may become inadequate because of changes in conditions or deterioration in the degree of compliance with policies or procedures.
Disclosure Controls and Procedures
At the end of the period covered by this Annual Report on Form 10-K the Company's management performed an evaluation, under the supervision and with the participation of the Company's CEO and CFO, of the effectiveness of the Company's disclosure controls and procedures (as defined in Exchange Act Rules 13a-15(e) and 15d-15(e)). Such disclosure controls and procedures ("Disclosure Controls") are controls and other procedures designed to provide reasonable assurance that information required to be disclosed in USI's reports filed under the Exchange Act, such as this Annual Report, is recorded, processed, summarized and reported within the time periods specified in the SEC's rules and forms. Disclosure Controls are also designed to reasonably assure that such information is accumulated and communicated to our management, including the CEO and CFO, as appropriate to allow timely decisions regarding required disclosure. Management's quarterly evaluation of Disclosure Controls includes an evaluation of some components of the Company's internal control over financial reporting, and internal control over financial reporting is also separately evaluated on an annual basis.
Based on this evaluation, the Company's management (including its CEO and CFO) concluded that, as of December 31, 2009, the Company's Disclosure Controls were effective, subject to the inherent limitations noted above in this Item 9A.
90
Management's Report on Internal Control over Financial Reporting and Related Report of Independent Registered Public Accounting Firm
Management's report on internal control over financial reporting and the report of Ernst & Young LLP, the Company's independent registered public accounting firm, regarding its audit of the Company's internal control over financial reporting are included in Item 8 of this Annual Report on Form 10-K.
Changes in Internal Control over Financial Reporting
There were no changes to the Company's internal control over financial reporting that occurred during the last quarter of 2009 that have materially affected, or are reasonably likely to materially affect, the Company's internal control over financial reporting.
ITEM 10. DIRECTORS, EXECUTIVE OFFICERS AND CORPORATE GOVERNANCE.
For information about the Company's executive officers, see "Executive Officers of the Registrant" included as Item 4A of this Annual Report on Form 10-K. In addition, the information contained under the captions "Proposal 1: Election of Directors" and "Voting Securities and Principal Holders—Section 16(a) Beneficial Ownership Reporting Compliance" in USI's Proxy Statement for its 2010 Annual Meeting of Stockholders ("2010 Proxy Statement") is incorporated herein by reference.
The information required by Item 10 regarding the Audit Committee's composition and the presence of an "audit committee financial expert" is incorporated herein by reference to the information under the captions "Governance and Board Matters—Board Committees—General" and "—Audit Committee" in USI's 2010 Proxy Statement. In addition, information regarding delinquent filers pursuant to Item 405 of Regulation S-K is incorporated by reference to the information under the captions "Section 16(a) Beneficial Ownership Reporting Compliance" in USI's 2010 Proxy Statement.
The Company has adopted a code of ethics (its "Code of Business Conduct") that applies to all directors, officers and associates, including the Company's CEO, CFO and Controller, and other executive officers identified pursuant to this Item 10. A copy of this Code of Business Conduct is available on the Company's Web site at www.unitedstationers.com. The Company intends to disclose any significant amendments to and waivers of its Code of Conduct by posting the required information at this Web site within the required time periods.
ITEM 11. EXECUTIVE COMPENSATION.
The information required to be furnished pursuant to this Item is incorporated herein by reference to the information under the captions "Director Compensation", "Executive Compensation" and "Compensation Committee Interlocks and Insider Participation" in USI's 2010 Proxy Statement.
ITEM 12. SECURITY OWNERSHIP OF CERTAIN BENEFICIAL OWNERS AND MANAGEMENT AND RELATED STOCKHOLDER MATTERS.
The beneficial ownership information required to be furnished pursuant to this Item is incorporated herein by reference to the information under the captions "Voting Securities and Principal Holders—Security Ownership of Certain Beneficial Owners" and "Voting Securities and Principal Holders—Security Ownership of Management" in USI's 2010 Proxy Statement. Information relating to securities authorized for issuance under United's equity plans is incorporated herein by reference to the information under the caption "Equity Compensation Plan Information" in USI's 2010 Proxy Statement.
91
ITEM 13. CERTAIN RELATIONSHIPS AND RELATED TRANSACTIONS, AND DIRECTOR INDEPENDENCE.
The information required to be furnished pursuant to this Item is incorporated herein by reference to the information under the caption "Certain Relationships and Related Transactions" in USI's 2010 Proxy Statement.
ITEM 14. PRINCIPAL ACCOUNTING FEES AND SERVICES.
The information required to be furnished pursuant to this Item is incorporated herein by reference to the information under the captions "Proposal 2: Ratification of Selection of Independent Registered Public Accountants—Fee Information" and "—Audit Committee Pre-Approval Policy" in USI's 2010 Proxy Statement.
92
ITEM 15. EXHIBITS, FINANCIAL STATEMENT SCHEDULES.
- (a)
- The following financial statements, schedules and exhibits are filed as part of this report:
| |
|
Page No. | ||||
|---|---|---|---|---|---|---|
| (1) | Financial Statements of the Company: | |||||
Management Report on Internal Control Over Financial Reporting |
41 | |||||
Report of Independent Registered Public Accounting Firm on Internal Control Over Financial Reporting |
42 | |||||
Report of Independent Registered Public Accounting Firm |
43 | |||||
Consolidated Statements of Income for the years ended December 31, 2009, 2008 and 2007 |
44 | |||||
Consolidated Balance Sheets as of December 31, 2009 and 2008 |
45 | |||||
Consolidated Statements of Changes in Stockholders' Equity for the years ended December 31, 2009, 2008 and 2007 |
46 | |||||
Consolidated Statements of Cash Flows for the years ended December 31, 2009, 2008 and 2007 |
47 | |||||
Notes to Consolidated Financial Statements |
48 | |||||
(2) |
Financial Statement Schedule: |
|||||
Schedule II—Valuation and Qualifying Accounts |
99 | |||||
All other schedules for which provision is made in the applicable accounting regulation of the Securities and Exchange Commission are not required under the related instructions or are inapplicable and therefore have been omitted. |
||||||
(3) |
Exhibits (numbered in accordance with Item 601 of Regulation S-K): |
|||||
The Company is including as exhibits to this Annual Report certain documents that it has previously filed with the SEC as exhibits, and it is incorporating such documents as exhibits herein by reference from the respective filings identified in parentheses at the end of the exhibit descriptions. Except where otherwise indicated, the identified SEC filings from which such exhibits are incorporated by reference were made by the Company (under USI's file number of 0-10653). The management contracts and compensatory plans or arrangements required to be included as exhibits to this Annual Report pursuant to Item 15(b) are listed below as Exhibits 10.10 through 10.16, Exhibits 10.18 through 10.19, Exhibits 10.25 through 10.36, and Exhibit 10.42, inclusive, and each of them is marked with a double asterisk at the end of the related exhibit description.
93
| |
Exhibit Number |
Description
|
|||
|---|---|---|---|---|---|
| 2.1 | Stock Purchase Agreement, dated as of November 14, 2007, among ORS Nasco Holdings, Inc., United Stationers Supply Co. ("USSC"), the shareholders of ORS Nasco Holding, Inc. parties thereto and Brazos Equity GP II, LLC, as representative. (Exhibit 2.1 to the Company's Current Report on Form 8-K filed on December 28, 2007) | ||||
| 3.1 | Second Restated Certificate of Incorporation of United Stationers, Inc. ("USI" or the "Company"), dated as of March 19, 2002 (Exhibit 3.1 to the Company's Annual Report on Form 10-K for the year ended December 31, 2001, filed on April 1, 2002 (the "2001 Form 10-K")) | ||||
| 3.2 | Amended and Restated Bylaws of United Stationers Inc., dated as of July 16, 2009 (Exhibit 3.1 to the Form 10-Q for the quarter ended September 30, 2009, filed on November 5, 2009) | ||||
| 4.1 | Master Note Purchase Agreement, dated as of October 15, 2007, among USI, USSC, and the note purchasers identified therein (the "2007 Note Purchase Agreement") (Exhibit 4.3 to the Company's Form 10-Q for the quarter ended September 30, 2007, filed on November 7, 2007 (the "Form 10-Q filed on November 7, 2007")) | ||||
| 4.2 | Parent Guaranty, dated as of October 15, 2007, by USI in favor of holders of the promissory notes identified therein (Exhibit 4.4 to the Form 10-Q filed on November 7, 2007) | ||||
| 4.3 | Subsidiary Guaranty, dated as of October 15, 2007, by Lagasse, Inc., United Stationers Technology Services LLC ("USTS") and United Stationers Financial Services LLC ("USFS") in favor of the holders of the promissory notes identified therein (Exhibit 4.5 to the Form 10-Q filed on November 7, 2007) | ||||
| 10.1 | Guaranty, dated as of March 21, 2003, by USSC, as borrower, USI, Azerty Incorporated, Lagasse, Inc., USFS, and USTS in favor of Bank One, NA as administrative agent (Exhibit 4.10 to the Company's Annual Report on Form 10-K for the year ended December 31, 2002, filed on March 31, 2003 (the "2002 Form 10-K") | ||||
| 10.2 | Lease Agreement, dated as of January 12, 1993, as amended, among Stationers Antelope Joint Venture, AVP Trust, Adon V. Panattoni, Yolanda M. Panattoni and USSC (Exhibit 10.32 to the Company's Form S-1 (SEC File No. 033-59811-01) filed on July 28, 1995 (the "1995 S-1") | ||||
| 10.3 | Second Amendment to Lease, dated as of November 22, 2002, between Stationers Joint Venture and USSC (Exhibit 10.8 to the Company's Annual Report on Form 10-K for the year ended December 31, 2003, filed on March 15, 2004 (the "2003 Form 10-K") | ||||
| 10.4 | Lease Agreement, dated as of December 1, 2001, between Panattoni Investments, LLC and USSC (Exhibit 10.8 to the Company's 2001 Form 10-K) | ||||
| 10.5 | Lease Agreement, dated as of October 12, 1998, between Corum Carol Stream Associates, LLC and USSC (Exhibit 10.94 to the Company's Annual Report on Form 10-K for the year ended December 31, 1998, filed on March 29, 1999) | ||||
| 10.6 | Industrial Lease Agreement, executed as of October 21, 2001, by and between Duke Construction Limited Partnership and USSC (Exhibit 10.16 to the Company's 2001 Form 10-K) | ||||
| 10.7 | First Amendment to Industrial Lease Agreement, dated October 1, 2002, between Allianz Life Insurance Co. of North America and USSC (Exhibit 10.20 to the 2003 Form 10-K) | ||||
| 10.8 | Industrial/Commercial Single Tenant Lease—Net, dated November 4, 2004, between Cransud One, L.L.C. and USSC (Exhibit 10.27 to the Company's Annual Report on Form 10-K for the year ended December 31, 2004, filed March 16, 2005) | ||||
| 10.9 | Lease, dated July 25, 2005, among United, USSC and Carr Parkway North I, LLC (Exhibit 10.1 to the Company's Form 10-Q filed on August 9, 2005) | ||||
94
| |
Exhibit Number |
Description
|
|||
|---|---|---|---|---|---|
| 10.10 | United Stationers Inc. 1992 Management Equity Plan (as amended and restated as of July 31, 2002) (Exhibit 10.2 to the Company's Quarterly Report on Form 10-Q for the quarter ended September 30, 2002, filed on November 14, 2002 ("Form 10-Q filed on November 14, 2002"))** | ||||
| 10.11 | United Stationers Inc. 2000 Management Equity Plan (as amended and restated as of July 31, 2002) (Exhibit 10.1 to the Company's Form 10-Q filed on November 14, 2002)** | ||||
| 10.12 | Form of grant letter used for grants of non-qualified options to non-employee directors under the 2004 Long-Term Incentive Plan (Exhibit 10.1 to the Company's Current Report on Form 8-K, filed on September 3, 2004 (the "September 3, 2004 Form 8-K"))** | ||||
| 10.13 | Form of grant letter used for grants of non-qualified stock options to employees under the 2004 Long-Term Incentive Plan (Exhibit 10.2 to the September 3, 2004 Form 8-K)** | ||||
| 10.14 | Form of Indemnification Agreement entered into between USI (and for purposes of one provision) USSC with directors and various executive officers of USI (Exhibit 10.36 to the Company's 2001 Form 10-K) ** | ||||
| 10.15 | Form of Indemnification Agreement entered into by USI and (for purposes of one provision) USSC with each of Richard W. Gochnauer, and other directors and executive officers of USI (Exhibit 10.7 to the Company's Form 10-Q filed on November 14, 2002)** | ||||
| 10.16 | Form of Indemnification Agreement entered into by USI and (for purposes of one provision) USSC with P. Cody Phipps, and other executive officers of USI (Exhibit 10.3 to the Company's Form 10-Q for the quarter ended June 30, 2004, filed on August 6, 2004)** | ||||
| 10.17 | Omnibus Amendment dated as of March 23, 2008, by and among USSR, USFS, Falcon Asset Securitization Corporation, PNC Bank, National Association, Market Street Funding LLC, JPMorgan Chase Bank, NA,, and Fifth Third Bank (Exhibit 10.25 to the Company's Annual Report on Form 10-K for the year ended December 31, 2008, filed on February 27, 2009 (the "2008 Form 10-K")) | ||||
| 10.18 | Non-Qualified Stock Option Grant Letter, dated as of July 24, 2007 among United Stationers Inc. and Victoria J. Reich (Exhibit 10.2 to the Form 10-Q filed on November 7, 2007)** | ||||
| 10.19 | Form of Restricted Stock Award Agreement for Section 16 Officers under the 2004 Long-Term Incentive Plan (Exhibit 10.3 to the Form 10-Q filed on November 7, 2007)** | ||||
| 10.20 | Pledge and Security Agreement dated as of October 15, 2007, among United Stationers Inc., USSC, Lagasse, Inc., USTS and USFS and JPMorgan Chase Bank, N.A. as collateral agent (Exhibit 10.5 to the Form 10-Q filed on November 7, 2007) | ||||
| 10.21 | Intercreditor Agreement, dated as of October 15, 2007, by and among JPMorgan Chase Bank, NA, in its capacity as agent and contractual representative, and the holders of the notes issued pursuant to the 2007 Note Purchase Agreement (Exhibit 10.6 to the Form 10-Q filed on November 7, 2007) | ||||
| 10.22 | Second Amended and Restated Five-Year Revolving Credit Agreement, dated July 5, 2007, among USSC, as borrower, USI, as a credit party, JPMorgan Chase Bank, National Association in its capacity as agent, and the financial institutions listed on the signature pages thereof (Exhibit 10.1 to the Company's Current Report on Form 8-K filed on July 5, 2007) | ||||
| 10.23 | Reaffirmation, dated July 5, 2007 among USI, USSC, Lagasse, Inc., USTS and USFS (Exhibit 10.2 to the Company's Current Report on Form 8-K filed on July 5, 2007) | ||||
95
| |
Exhibit Number |
Description
|
|||
|---|---|---|---|---|---|
| 10.24 | Amendment No. 1, dated December 21, 2007, to Second Amended and Restated Five-Year Revolving Credit Agreement, dated July 5, 2007, among USSC, as borrower, USI, as a credit party, JPMorgan Chase Bank, National Association, in its capacity as agent, and the financial institutions listed on the signature pages thereof (Exhibit 10.1 to the Company's Current Report on Form 8-K filed on December 28, 2007) | ||||
| 10.25 | United Stationers Inc. Nonemployee Directors' Deferred Stock Compensation Plan effective January 1, 2009 (Exhibit 10.33 to the 2008 Form 10-K)** | ||||
| 10.26* | United Stationers Supply Co. Amended and Restated Deferred Compensation Plan, effective as of January 1, 2009** | ||||
| 10.27 | Medical Executive Reimbursement Program, as in effect as of January 1, 2009 (Exhibit 10.35 to the 2008 Form 10-K)** | ||||
| 10.28 | Executive Employment Agreement, effective as of December 31, 2008, by and among USI, USSC, and Richard W. Gochnauer (Exhibit 10.36 to the 2008 Form 10-K)** | ||||
| 10.29 | Executive Employment Agreement, effective December 31, 2008, by and among USI, USSC and Stephen A. Schultz (Exhibit 10.37 to the 2008 Form 10-K)** | ||||
| 10.30 | Executive Employment Agreement, effective as of December 31, 2008, by and among USI, USSC and P. Cody Phipps (Exhibit 10.38 to the 2008 Form 10-K)** | ||||
| 10.31 | Executive Employment Agreement, effective as of December 31, 2008, by and among USI, USSC and Patrick T. Collins (Exhibit 10.39 to the 2008 Form 10-K)** | ||||
| 10.32 | Executive Employment Agreement, effective as of December 31, 2008, by and among USI, USSC and Victoria J. Reich (Exhibit 10.40 to the 2008 Form 10-K)** | ||||
| 10.33 | United Stationers Inc. and Subsidiaries Amended and Restated Management Incentive Plan, effective January 1, 2009 (the "2004 Long-Term Incentive Plan") (Exhibit 10.42 to the 2008 Form 10-K)** | ||||
| 10.34 | United Stationers Inc. Amended and Restated 2004 Long-Term Incentive Plan effective as of January 1, 2009 (Exhibit 10.43 to the 2008 Form 10-K)** | ||||
| 10.35 | Form of Restricted Stock Award Agreement for Non-Employee Directors (Exhibit 10.4 to the Company's Form 10-Q for the quarter ended September 30, 2009, filed on November 7, 2008 (the "Form 10-Q filed on November 7, 2008"))** | ||||
| 10.36 | Form of Restricted Stock Award Unit Agreement for Non-Employee Directors (Exhibit 10.5 to the Form 10-Q filed on November 7, 2008)** | ||||
| 10.37 | Transfer and Administration agreement, by and among United Stationers Receivables, LLC, ("USR"), USSCO as Originator, USFS, as Seller and Servicer, Enterprise Funding Company LLC, as a Conduit Investor, Market Street Funding LLC, as a Conduit Investor, Bank of America, National Association, as Agent, as a Class Agent and as an Alternate Investor, PNC Bank, National Association, as a Class Agent and as an Alternate Investor, and the other alternate investors from time to time parties thereto (Exhibit 10.1 to the Company's Form 10-Q for the quarter ended March 31, 2008, filed on May 8, 2009 (the "Form 10-Q filed on May 8, 2009")) | ||||
| 10.38 | Receivables Sale Agreement by and between USSC, as Originator, and USFS, as Purchaser (Exhibit 10.2 to the Form 10-Q filed on May 8, 2009) | ||||
| 10.39 | Receivables Sale agreement by and between USFS, as Seller, and USR, as Purchaser (Exhibit 10.3 to the Form 10-Q filed on May 8, 2009) | ||||
| 10.40 | Performance Guarantee among USI, as Performance Guarantee, and USR, as Recipient (Exhibit 10.4 to the Form 10-Q filed on May 8, 2009) | ||||
| 10.41 | Form of Restricted Stock Unit Award Agreement under the 2004 Long-Term Incentive Plan (Exhibit 10.10 to the Form 10-Q filed on May 8, 2009) | ||||
| 10.42* | Restricted Stock Unit Award Agreement between USI and Stephen A. Schultz, effective March 4, 2008** | ||||
96
| |
Exhibit Number |
Description
|
|||
|---|---|---|---|---|---|
| 10.43* | First Amendment to the Transfer and Administration Agreement, dated as of May 14, 2009, among, USSC, USFS, USR, Enterprise Funding Company LLC, Market Street Funding LLC, Bank of America, National Association, and PNC Bank, National Association | ||||
| 10.44* | Second Amendment to the Transfer and Administration Agreement, dated as of November 20, 2009, among, USSC, USFS, USR, Enterprise Funding Company LLC, Market Street Funding LLC, Bank of America, National Association, and PNC Bank, National Association | ||||
| 10.45* | Third Amendment to the Transfer and Administration Agreement, dated as of January 22, 2010, among, USSC, USFS, USR, Enterprise Funding Company LLC, and Bank of America, National Association | ||||
| 21* | Subsidiaries of USI | ||||
| 23* | Consent of Ernst & Young LLP, Independent Registered Public Accounting Firm | ||||
| 31.1* | Certification of Chief Executive Officer, dated as of February 25, 2010, as Adopted Pursuant to Section 302(a) of the Sarbanes-Oxley Act of 2002 by Richard W. Gochnauer | ||||
| 31.2* | Certification of Chief Financial Officer, dated as of February 25, 2010, as Adopted Pursuant to Section 302(a) of the Sarbanes-Oxley Act of 2002 by Victoria J. Reich | ||||
| 32.1* | Certification Pursuant to 18 U.S.C. Section 1350, dated February 25, 2010, as Adopted Pursuant to Section 906 of the Sarbanes-Oxley Act of 2002 by Richard W. Gochnauer and Victoria J. Reich | ||||
- *
- Filed
herewith.
- **
- Represents a management contract or compensatory plan or arrangement.
97
Pursuant to the requirements of Section 13 or 15(d) of the Securities Exchange Act of 1934, the Registrant has duly caused this report to be signed on its behalf by the undersigned, thereunto duly authorized.
| UNITED STATIONERS INC. | ||||
BY: |
/s/ RICHARD W. GOCHNAUER Richard W. Gochnauer President and Chief Executive Officer (Principal Executive Officer) |
|||
Dated: February 25, 2010 |
||||
Pursuant to the requirements of the Securities Exchange Act of 1934, this report has been signed below by the following persons on behalf of the Registrant and in the capacities and on the dates indicated:
Signature
|
Capacity
|
Date
|
||
|---|---|---|---|---|
| /s/ RICHARD W. GOCHNAUER Richard W. Gochnauer |
President and Chief Executive Officer (Principal Executive Officer) and a Director | February 25, 2010 | ||
/s/ VICTORIA J. REICH Victoria J. Reich |
Senior Vice President and Chief Financial Officer (Principal Financial Officer) |
February 25, 2010 |
||
/s/ KENNETH M. NICKEL Kenneth M. Nickel |
Vice President, Controller and Chief Accounting Officer (Principal Accounting Officer) |
February 25, 2010 |
||
/s/ FREDERICK B. HEGI, JR. Frederick B. Hegi, Jr. |
Chairman of the Board of Directors |
February 25, 2010 |
||
/s/ JEAN S. BLACKWELL Jean S. Blackwell |
Director |
February 25, 2010 |
||
/s/ DANIEL J. CONNORS Daniel J. Connors |
Director |
February 25, 2010 |
||
/s/ CHARLES K. CROVITZ Charles K. Crovitz |
Director |
February 25, 2010 |
||
/s/ DANIEL J. GOOD Daniel J. Good |
Director |
February 25, 2010 |
||
/s/ ROY W. HALEY Roy W. Haley |
Director |
February 25, 2010 |
||
/s/ NOAH T. MAFFITT Noah T. Maffitt |
Director |
February 25, 2010 |
||
/s/ BENSON P. SHAPIRO Benson P. Shapiro |
Director |
February 25, 2010 |
||
/s/ ALEX D. ZOGHLIN Alex D. Zoghlin |
Director |
February 25, 2010 |
98
UNITED STATIONERS INC. AND SUBSIDIARIES VALUATION AND QUALIFYING ACCOUNTS
YEARS ENDED DECEMBER 31, 2009, 2008 and 2007
Description (in thousands) |
Balance at Beginning of Period |
Additions Charged to Costs and Expenses |
Deductions(1) | Balance at End of Period |
||||||||||
|---|---|---|---|---|---|---|---|---|---|---|---|---|---|---|
Allowance for doubtful accounts(2): |
||||||||||||||
2007 |
$ | 19,217 | $ | 4,147 | $ | (4,119 | ) | $ | 19,245 | |||||
2008 |
19,245 | 16,469 | (3,170 | ) | 32,544 | |||||||||
2009 |
32,544 | 12,218 | (9,546 | ) | 35,216 | |||||||||
(1)—net of any recoveries
(2)—represents allowance for doubtful accounts related to the retained interest in receivables sold and accounts receivable, net.
99
PART I
PART II
-
ITEM 5. MARKET FOR REGISTRANT'S COMMON EQUITY, RELATED STOCKHOLDER MATTERS AND ISSUER PURCHASES OF EQUITY SECURITIES.
ITEM 6. SELECTED FINANCIAL DATA.
-
ITEM 7A. QUANTITATIVE AND QUALITATIVE DISCLOSURES ABOUT MARKET RISK.
ITEM 8. FINANCIAL STATEMENTS AND SUPPLEMENTARY DATA.
-
ITEM 9. CHANGES IN AND DISAGREEMENTS WITH ACCOUNTANTS ON ACCOUNTING AND FINANCIAL DISCLOSURE.
ITEM 9A. CONTROLS AND PROCEDURES.
-
ITEM 10. DIRECTORS, EXECUTIVE OFFICERS AND CORPORATE GOVERNANCE.
ITEM 11. EXECUTIVE COMPENSATION.
ITEM 12. SECURITY OWNERSHIP OF CERTAIN BENEFICIAL OWNERS AND MANAGEMENT AND RELATED STOCKHOLDER MATTERS.
ITEM 13. CERTAIN RELATIONSHIPS AND RELATED TRANSACTIONS, AND DIRECTOR INDEPENDENCE.
ITEM 14. PRINCIPAL ACCOUNTING FEES AND SERVICES.
SIGNATURES