Attached files
| file | filename |
|---|---|
| 8-K - 8-K - KEYCORP /NEW/ | d244503d8k.htm |
| EX-99.3 - EX-99.3 - KEYCORP /NEW/ | d244503dex993.htm |
| EX-99.1 - EX-99.1 - KEYCORP /NEW/ | d244503dex991.htm |
| KeyCorp
Third Quarter 2011 Earnings Review
October 20, 2011
Beth E. Mooney
Chairman and
Chief Executive Officer
Jeffrey B. Weeden
Chief Financial Officer
Exhibit 99.2 |
| 2
PRIVATE SECURITIES LITIGATION REFORM ACT OF
1995 FORWARD-LOOKING STATEMENT DISCLOSURE
This presentation contains forward-looking statements within the meaning of the Private Securities
Litigation Reform Act of 1995, including statements about Key’s financial condition,
results of operations, earnings outlook, asset quality trends and profitability.
Forward-looking statements are not historical facts but instead represent only management’s current
expectations and forecasts regarding future events, many of which, by their nature, are inherently
uncertain and outside of Key’s control. Key’s actual results and financial
condition may differ, possibly materially, from the anticipated results and financial condition
indicated in these forward-looking statements. Factors that could cause Key’s actual results to differ
materially from those described in the forward-looking statements can be found in KeyCorp’s
Annual Report on Form 10-K for the year ended December 31, 2010, and its Quarterly Reports
on Form 10-Q for the periods ended March 31, 2011 and June 30, 2011, which have been filed
with the Securities and Exchange Commission and are available on Key’s website
(www.key.com/ir) and on the Securities and Exchange Commission’s website (www.sec.gov).
Forward-looking statements are not guarantees of future performance and should not be
relied upon as representing management’s views as of any subsequent date. Key does
not undertake any obligation to update the forward-looking statements to reflect the impact of
circumstances or events that may arise after the date of the forward-looking statements.
|
 3
Positive momentum in financial results
Continued improvement in credit quality
Well
controlled
expenses
-
driving
to
create
positive
operating
leverage
Inflection point for loan portfolio
Momentum
in
the
business
–
new
client
acquisition
and
growth
Investing in the business
Growing the
Franchise
Maintained strong balance sheet and moderate risk profile
Disciplined approach to capital deployment to maximize shareholder value
Positioned to meet Basel III requirements
Execution of
Business Plan
Investor Highlights –
Third Quarter 2011
Strategic statement: Key grows by building enduring relationships
through client-focused solutions and extraordinary service
Disciplined
Capital
Management |
 4
(a)
Continuing operations, unless otherwise noted
(b)
Represents period-end consolidated total loans and loans held for sale
(excluding education loans in the securitization trusts) divided by
period-end consolidated total deposits (excluding deposits in foreign office)
Executing Business Plan: Progress on Targets for Success
Improve funding mix
Focus on risk-adjusted returns
Grow client relationships
Leverage Key’s total client solutions and
cross-selling capabilities
>3.50%
3.09%
Net interest margin
Growing high
quality, diverse
revenue streams
>40%
47%
Noninterest income
to total revenue
Improve efficiency and effectiveness
Leverage technology
Change cost base to more variable from fixed
60-65%
67%
Efficiency ratio
Creating positive
operating
leverage
Execute our client insight-driven relationship
model
Lower credit costs
Improved funding mix with lower cost core
deposits
1.00-1.25%
1.14%
Return on average assets
Executing our
strategies
Focus on relationship clients
Exit noncore portfolios
Limit concentrations
Focus on risk-adjusted returns
40-50 bps
.90%
NCOs to average loans
Returning to a
moderate risk
profile
Improve risk profile of loan portfolio and grow
relationships
Improve deposit mix and grow deposit base
90-100%
86%
Loan to deposit ratio
(b)
Core funded
Action Plans
Targets
KEY
3Q11
KEY Metrics
(a)
KEY Business
Model |
 5
Financial Review |
 6
Financial Summary –
Third Quarter 2011
Capital
(b)
Asset Quality
(a)
Financial
Performance
(a)
Metrics
TE = Taxable equivalent, EOP = End of Period
(a) From continuing operations
(b) From consolidated operations
(c) 9-30-11 ratios are estimated
3Q11
2Q11
3Q10
Income from continuing operations attributable to Key
$.24
$.26
$.19
common shareholders
Net interest margin (TE)
3.09%
3.19%
3.35%
Return on average total assets
1.14
1.23
.93
Tier 1 common equity
(c)
11.34%
11.14%
8.61%
Tier 1 risk-based capital
(c)
13.55
13.93
14.30
Tangible common equity to tangible assets
9.82
9.67
8.00
Book value per common share
$10.09
$9.88
$9.54
Net loan charge-offs to average loans
.90%
1.11%
2.69%
NPLs to EOP portfolio loans
1.64
1.76
2.67
NPAs to EOP portfolio loans + OREO + Other NPAs
1.89
1.98
3.48
Allowance for loan losses to period-end loans
2.35
2.57
3.81
Allowance for loan losses to NPLs
143.53
146.08
142.64 |
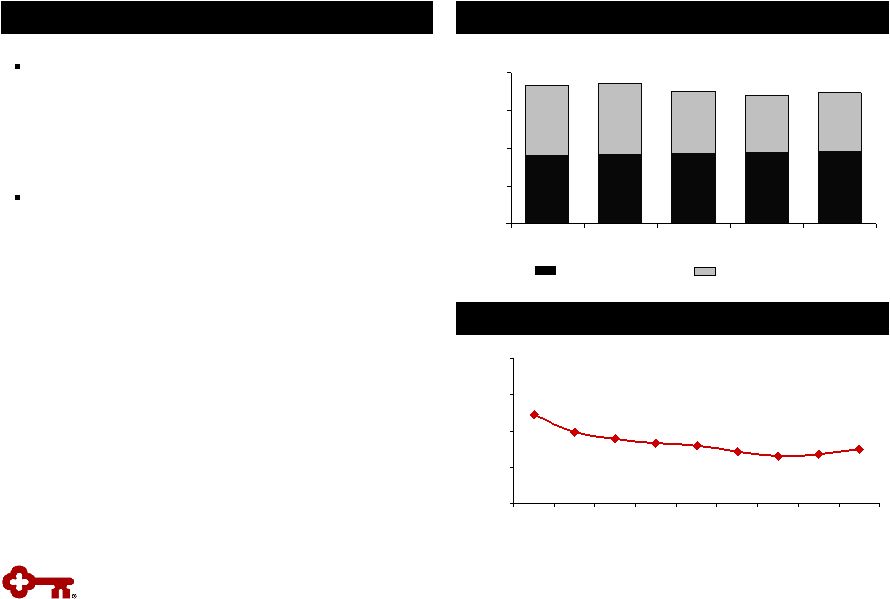
 7
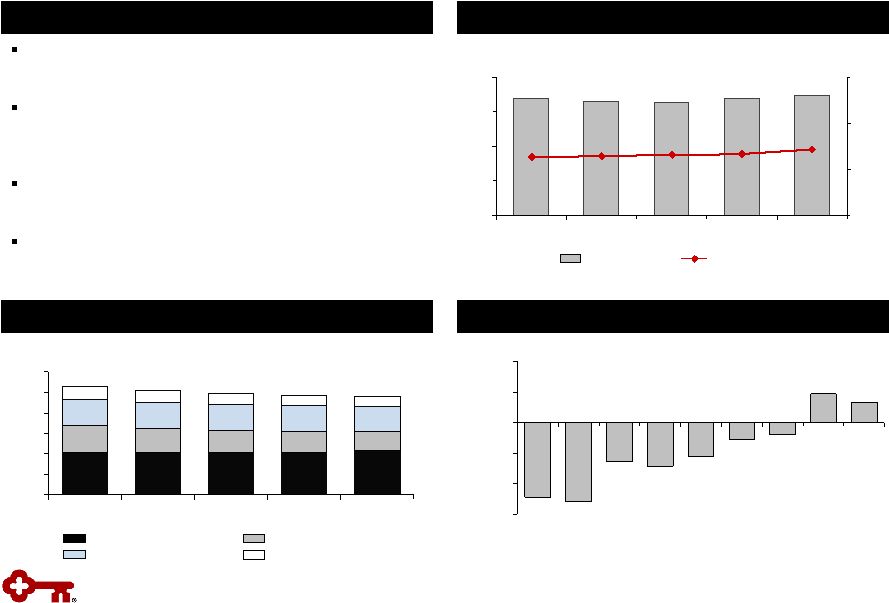
Loan portfolio at inflection point as period-end
loans grew during the third quarter
Period-end Commercial, Financial and Agricultural
loans increased by 5.7% in 3Q11, while average
balances grew 2.7% from the prior quarter
Commercial Real Estate loans continued to
decline, but at a slower pace
Slower run-off in exit portfolio and focus on
targeted segments positions Key for future loan
growth
$0
$10
$20
$30
$40
$50
$60
3Q10
4Q10
1Q11
2Q11
3Q11
Stabilizing Loan Portfolio
$ in billions
Highlights
Average Commercial, Financial & Agricultural Loans
CF&A loans
Utilization rate
Quarterly % Change in Average CF&A Loans
Average Loans
Exit Portfolios
Home Equity & Other
CF&A & Leasing
Commercial Real Estate
$ in billions
$52.6
$50.8
$49.3
$48.5
$17.4
$16.9
$16.3
$16.6
$16.9
44.4%
43.4%
43.2%
42.9%
42.7%
$0
$5
$10
$15
$20
3Q10
4Q10
1Q11
2Q11
3Q11
30%
40%
50%
60%
(9.7)%
(10.3)%
(5.2)%
(5.7)%
(4.4)%
(1.5)%
3.7%
2.7%
(2.3)%
(12.0)%
(8.0)%
(4.0)%
.0%
4.0%
8.0%
3Q09
4Q09
1Q10
2Q10
3Q10
4Q10
1Q11
2Q11
3Q11
$48.0 |
 8
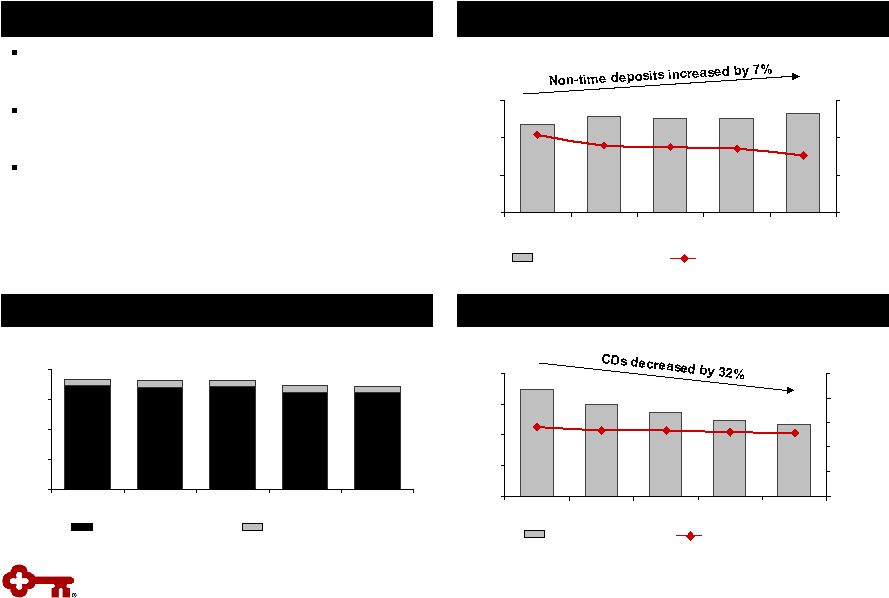
$11.7
$12.4
$13.6
$15.0
$17.3
2.69%
2.66%
2.82%
2.60%
2.59%
$0
$5
$10
$15
$20
3Q10
4Q10
1Q11
2Q11
3Q11
.00%
1.00%
2.00%
3.00%
4.00%
5.00%
$43.6
$45.8
$45.4
$45.3
$46.5
.15%
.17%
.21%
.18%
.18%
$20
$30
$40
$50
3Q10
4Q10
1Q11
2Q11
3Q11
.00%
.10%
.20%
.30%
86%
85%
85%
81%
80%
0%
25%
50%
75%
100%
3Q10
4Q10
1Q11
2Q11
3Q11
Improving Deposit Mix
Highlights
Average Non-time Deposits
(a)
Higher cost CDs continue to decline, while lower
cost deposits have remained strong
Improved funding mix has reduced the cost of
deposits
Total CD maturities and average cost
–
2011: $2.5 billion at 1.23%
–
2012: $5.7 billion at 2.44%
–
2013 & beyond: $2.9 billion at 3.82%
Average
CD Balances
$ in billions
$ in billions
(a) Excludes time deposits and deposits in foreign office
(b) Represents period-end consolidated total loans and loans held for
sale (excluding education loans in the securitization trusts) divided by
period-end consolidated total deposits (excluding deposits in foreign office)
Loan to Deposit Ratio
(b)
Continuing operations
Discontinued operations
90%
92%
91%
Cost of non-time deposits
Non-time deposits
Average rate on CDs
Total average CDs
86%
86% |
 9
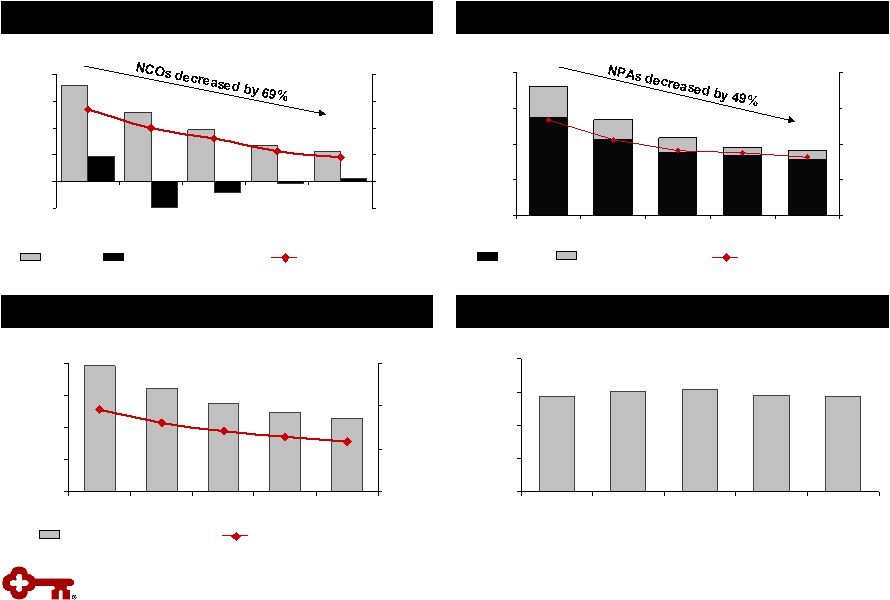
$914
$950
$1,089
1.64%
1.76%
1.82%
2.13%
2.67%
$0
$500
$1,000
$1,500
$2,000
3Q10
4Q10
1Q11
2Q11
3Q11
0.00%
1.00%
2.00%
3.00%
4.00%
$1,801
$1,338
$1,131
$1,230
$1,372
$1,604
$1,957
3.20%
2.83%
3.81%
2.57%
2.35%
$0
$500
$1,000
$1,500
$2,000
3Q10
4Q10
1Q11
2Q11
3Q11
0.0%
2.0%
4.0%
6.0%
143.5%
146.1%
155.0%
150.2%
142.6%
0%
50%
100%
150%
200%
3Q10
4Q10
1Q11
2Q11
3Q11
$10
$357
$256
$193
$134
$109
$(8)
$(40)
$(97)
$94
2.69%
2.00%
1.11%
.90%
1.59%
-$100
$0
$100
$200
$300
$400
3Q10
4Q10
1Q11
2Q11
3Q11
-1.0%
.0%
1.0%
2.0%
3.0%
4.0%
Nonperforming Assets
Net Charge-offs & Provision for Loan Losses
NPLs
NPLs to period-end loans
NCOs
Provision for loan losses
NCOs to average loans
Allowance for Loan Losses
Allowance to Nonperforming Loans
Allowance for loan losses
ALLL to period-end loans
$ in millions
$ in millions
$ in millions
NPLs held for sale,
OREO & other NPAs
Continued Improvement in Asset Quality |
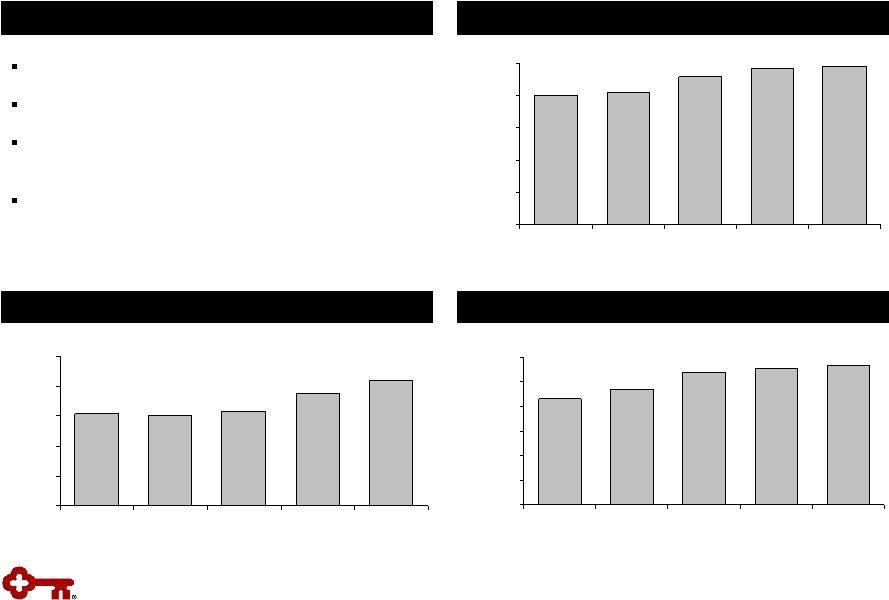
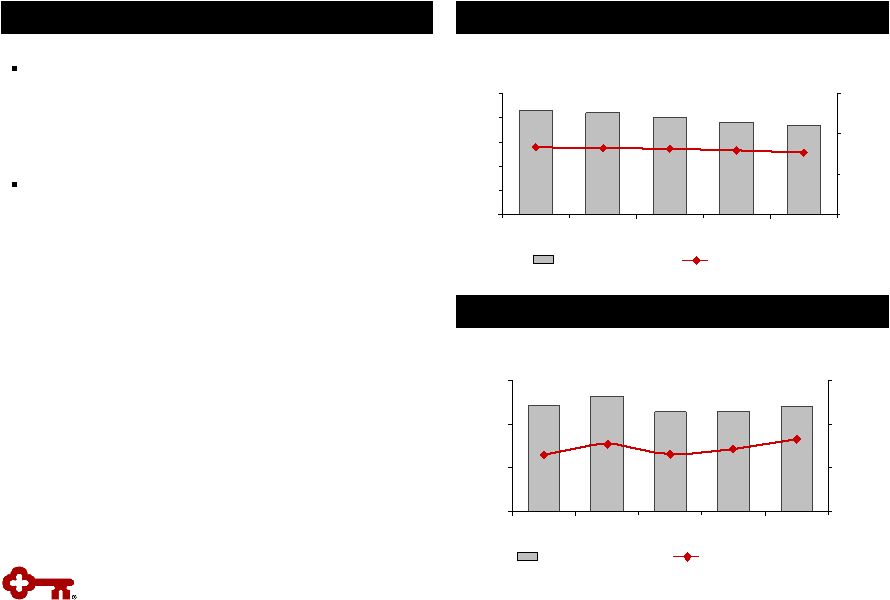 10
Total Revenue
TE = Taxable equivalent
$ in millions
Continuing Operations
Net interest margin
Net interest income
Highlights
Net Interest Margin (TE) Trend
Net interest income and NIM impacted by:
–
Low interest rate environment
–
Higher levels of short-term investments
–
Excess liquidity
New client acquisition and execution of
relationship-based model provide opportunities
to grow noninterest income
Noninterest Income and % of Total Revenue
Noninterest income
Noninterest income to
total revenue
$ in millions
$555
$570
$604
$635
$647
3.31%
3.25%
3.35%
3.19%
3.09%
$0
$150
$300
$450
$600
$750
3Q10
4Q10
1Q11
2Q11
3Q11
0.00%
2.00%
4.00%
6.00%
$486
$526
$457
$454
$483
46.5%
44.3%
42.9%
43.1%
45.3%
$0
$200
$400
$600
3Q10
4Q10
1Q11
2Q11
3Q11
30.0%
40.0%
50.0%
60.0% |
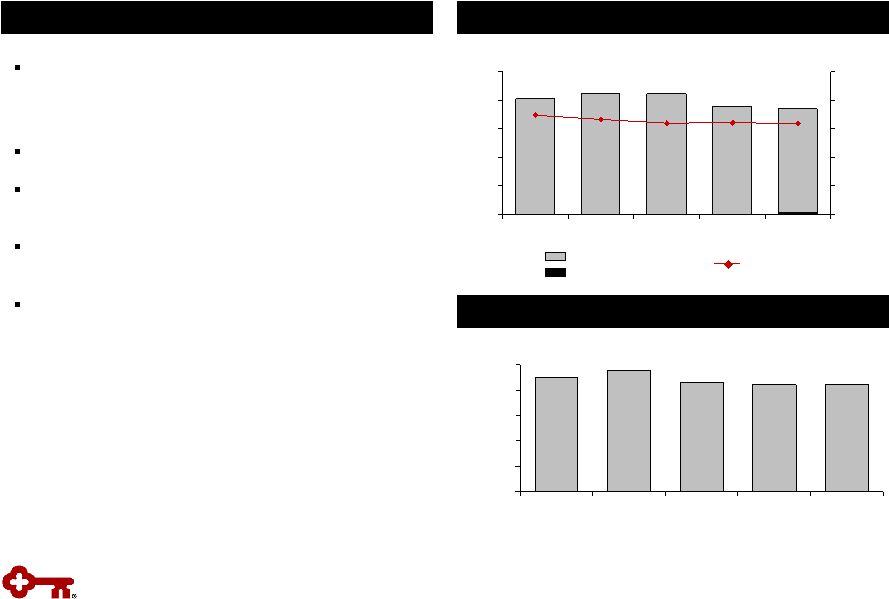
 11
$359
$365
$371
$380
$382
$377
$379
$330
$300
$310
$0
$200
$400
$600
$800
3Q10
4Q10
1Q11
2Q11
3Q11
Focused Expense Management
Noninterest Expense
Personnel expense
$ in millions
Highlights
Noninterest expense increased by $12 million
compared to 2Q11
–
Decreased credit for losses on lending-
related commitments
–
Increased marketing expense
Continued focus on expense management
Average FTEs
Non-personnel expense
$680
$701
$744
$736
15,973
15,349
15,772
16,436
15,665
15,584
15,424
15,301
15,490
14,000
15,000
16,000
17,000
18,000
3Q09
4Q09
1Q10
2Q10
3Q10
4Q10
1Q11
2Q11
3Q11
$692 |
 12
$1,038
$692
$346
Total revenue
Noninterest
expense
PPNR
3Q11 Pre-Provision Net Revenue
Pre-Provision Net Revenue Trend
Pre-Provision
Net
Revenue
(a)
and
ROAA
(b)
(a) Net interest income plus taxable-equivalent adjustment and
noninterest income less noninterest expense (b) From continuing
operations Return on Average Assets
$ in millions
$ in millions
Noninterest
income
47%
Personnel
expense
55%
$397
$417
$360
$344
$346
$0
$100
$200
$300
$400
$500
3Q10
4Q10
1Q11
2Q11
3Q11
1.14%
1.23%
1.32%
1.53%
.93%
.00%
.50%
1.00%
1.50%
2.00%
3Q10
4Q10
1Q11
2Q11
3Q11
Net interest
income
53%
Non-personnel
expense
45% |
 13
Peer leading capital position supports growth
Positioned for successful transition to Basel III
Continued capital generation through execution
of strategy
Disciplined approach to capital management
Tier 1 Common Equity
(a)
Tangible Common Equity to Tangible Assets
Strong Capital Ratios
Highlights
Book Value per Share
9.82%
9.67%
8.00%
8.19%
9.16%
0.00%
2.00%
4.00%
6.00%
8.00%
10.00%
3Q10
4Q10
1Q11
2Q11
3Q11
$10.09
$9.88
$9.54
$9.52
$9.58
$8.00
$8.50
$9.00
$9.50
$10.00
$10.50
3Q10
4Q10
1Q11
2Q11
3Q11
11.34%
11.14%
8.61%
9.34%
10.74%
0.00%
2.00%
4.00%
6.00%
8.00%
10.00%
12.00%
3Q10
4Q10
1Q11
2Q11
3Q11
(a)
9-30-11 ratio is estimated. |
 14
Appendix |
 15
3.19%
3.22%
3.21%
3.33%
3.19%
$0
$5
$10
$15
$20
$25
3Q10
4Q10
1Q11
2Q11
3Q11
0.00%
1.00%
2.00%
3.00%
4.00%
5.00%
$20.3
$21.3
$21.2
$19.0
$18.5
Average Total Investment Securities
Highlights
Average AFS securities
$ in billions
High Quality Investment Portfolio
Portfolio composed of Agency or GSE backed:
GNMA, Fannie & Freddie
–
No private label MBS or financial paper
Average portfolio maturity at 9/30/11: 2.3 years
Unrealized net gain of $648 million on available-
for-sale securities portfolio at 9/30/11
Mortgage paydowns
in 3Q11 were $1.1 billion vs.
$942 million in 2Q11
3Q11 purchases classified as held-to-maturity
Securities to Total Assets
(a)
(a) Includes end of period held-to-maturity and available-for-sale
securities 21.0%
21.1%
22.6%
23.9%
21.6%
0.0%
5.0%
10.0%
15.0%
20.0%
25.0%
3Q10
4Q10
1Q11
2Q11
3Q11
Average yield
Average HTM securities |
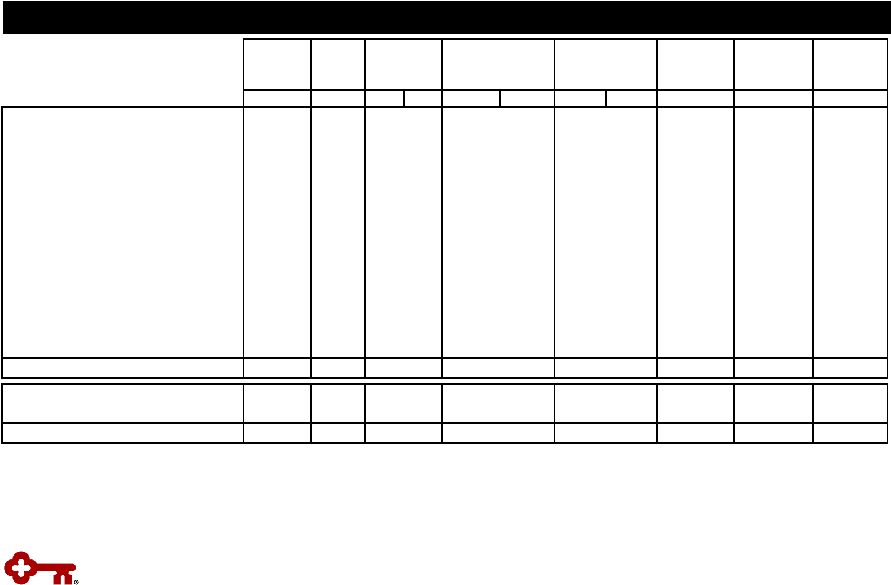 16
N/M = Not Meaningful
(a)
Net charge-off amounts are annualized in calculation. NCO ratios for
discontinued operations and consolidated Key exclude education loans in the
securitization trusts since valued at fair-market value (b)
9-30-11 allowance by portfolio is estimated. Allowance/period loans ratios
for discontinued operations and consolidated Key exclude education loans in
the securitization trusts since valued at fair-market value Credit
Quality Credit Quality by Portfolio
$ in millions
Period-end
loans
Average
loans
9/30/11
3Q11
3Q11
2Q11
3Q11
2Q11
9/30/11
6/30/11
9/30/11
9/30/11
9/30/11
Commercial, financial and agricultural
$17,848
$17,381
$22
$36
.50
%
.85
%
$188
$213
$370
2.07
%
196.81
%
Commercial real estate:
Commercial mortgage
7,958
7,978
25
12
1.24
.57
237
230
305
3.83
128.69
Construction
1,456
1,545
8
24
2.05
5.47
93
131
87
5.98
93.55
Commercial lease financing
5,957
6,045
2
4
.13
.26
31
41
96
1.61
309.68
Real estate -
residential mortgage
1,875
1,853
5
6
1.07
1.32
88
79
34
1.81
38.64
Home equity:
Key Community Bank
9,347
9,388
18
27
.76
1.15
102
101
110
1.18
107.84
Other
565
582
8
10
5.45
6.56
12
11
35
6.19
291.67
Consumer other—
Key Community Bank
1,187
1,169
9
9
3.05
3.14
4
3
41
3.45
N/M
Consumer other:
Marine
1,871
1,928
11
4
2.26
.78
32
32
51
2.73
159.38
Other
131
139
1
2
2.85
5.49
1
1
2
1.53
200.00
Continuing total
$48,195
$48,008
$109
$134
.90
%
1.11
%
$788
$842
$1,131
2.35
%
143.53
%
Discontinued
operations
-
education
lending business
5,984
6,171
31
32
3.93
4.02
22
21
115
3.65
N/M
Consolidated total
$54,179
$54,179
$140
$166
1.09
%
1.29
%
$810
$863
$1,246
2.43
%
153.83
%
Allowance /
period-end
loans
(b)
Allowance /
NPLs
Net loan
charge-offs
Net
loan
charge-offs
(a)
/
average loans
Nonperforming
loans
Ending
allowance
(b) |
 17
Commercial Real Estate by Property Type and Geography
(a) Nonresidential land and development loans
N/M = Not Meaningful
Commercial Real Estate Loans –
9/30/11
$ in millions
Geographic Region
% of
Commercial
West
Southwest
Central
Midwest
Southeast
Northeast
Total
Total CRE
Mortgage
Construction
Nonowner-occupied :
Retail properties
$338
$138
$220
$233
$386
$200
$1,515
16.1
%
$1,246
$269
Multifamily properties
228
143
191
275
328
240
1,405
14.9
1,021
384
Health facilities
189
6
163
115
207
175
855
9.1
805
50
Office buildings
116
65
77
102
60
251
671
7.1
559
112
Warehouses
229
-
44
107
77
82
539
5.7
509
30
Residential properties
52
19
37
70
52
62
292
3.1
96
196
Hotels/motels
60
-
23
6
84
43
216
2.3
174
42
Land and development
(a)
19
13
29
10
35
67
173
1.9
13
160
Manufacturing facilities
1
-
1
8
33
6
49
.5
49
-
Other
61
2
13
30
96
94
296
3.2
284
12
Total nonowner-occupied
1,293
386
798
956
1,358
1,220
6,011
63.9
4,756
1,255
Owner-occupied
1,375
36
312
772
129
779
3,403
36.1
3,202
201
Total
$2,668
$422
$1,110
$1,728
$1,487
$1,999
$9,414
100.0
%
$7,958
$1,456
Nonowner-occupied: September 30, 2011
Nonperforming loans
$50
$49
$2
$39
$38
$50
$228
N/M
$141
$87
90+ days past due
-
-
-
-
-
8
8
N/M
-
8
30-89 days past due
14
-
7
14
47
23
105
N/M
97
8
Nonowner-occupied: June 30, 2011
Nonperforming loans
$53
$56
$6
$50
$51
$54
$270
N/M
$149
$121
90+ days past due
22
-
-
2
-
12
36
N/M
8
28
30-89 days past due
15
4
1
16
36
26
98
N/M
65
33 |
 18
(a) Nonresidential land and development loans
Commercial Real Estate
Commercial Real Estate Credit Quality
$ in millions
Period-end
loans
9-30-11
6-30-11
9-30-11
6-30-11
9-30-11
6-30-11
Retail properties
$1,515
$1,578
$63
$66
-
$6
Multifamily properties
1,405
1,321
44
47
10
(1)
Health facilities
855
967
10
11
-
3
Office builldings
671
756
26
25
7
4
Warehouses
539
511
10
10
-
-
Residential properties
292
388
49
69
13
9
Hotels/motels
216
267
4
5
1
-
173
198
6
18
(8)
6
Other CRE
345
335
16
19
5
4
Total nonowner-occupied
6,011
6,321
228
270
28
31
Owner-occupied
3,403
3,379
102
91
5
5
Total
$9,414
$9,700
$330
$361
$33
$36
Nonperforming
loans
charge-offs
Net loan
Land and development
(a) |
 19
(a)
Average LTVs are at origination.
Community Bank –
Home Equity
Exit Portfolio –
Home Equity
$ in millions, except average loan size
$ in millions, except average loan size
(a)
(a)
Home Equity Loans –
9/30/11
Vintage (% of Loans)
Loan
Balances
Average Loan
Size ($)
Average
FICO
Average
LTV
% of Loans
LTV>90%
2010 and
2011
2009
2008
2007
2006 and
prior
Home equity loans and lines
First lien
25
$
23,215
$
747
33
%
.4
%
-
-
1
%
24
%
75
%
Second lie
540
25,138
731
82
32.7
-
-
1
41
58
Total home equity loans and lines
565
$
25,047
$
731
80
31.2
-
-
1
40
59
Nonaccrual loans
First lien
1
$
19,951
$
714
35
%
-
-
-
-
11
%
89
%
Second lie
11
27,778
709
84
39.0
%
-
-
2
%
37
61
Total home equity nonaccrual loans
12
$
27,152
$
710
82
36.7
-
-
2
35
63
Exit Portfolio - Home Equity
Third quarter net charge-offs
8
$
-
-
1
%
44
%
55
%
Net loan charge-offs to average loans
5.45
%
Vintage (% of Loans)
Loan
Balances
Average Loan
Size ($)
Average
FICO
Average
LTV
% of Loans
LTV>90%
2010 and
2011
2009
2008
2007
2006 and
prior
Home equity loans and lines
First lien
4,927
$
58,180
$
751
66
%
.6
%
19
%
10
%
11
%
8
%
52
%
Second lien
4,420
44,903
750
75
3.4
14
8
18
17
43
Total home equity loans and lines
9,347
$
51,043
$
751
70
1.9
17
9
14
12
48
Nonaccrual loans
First lien
57
$
70,886
$
714
73
%
1
%
2
%
3
%
6
%
16
%
73
%
Second lien
45
53,652
708
77
3.8
1
4
13
22
60
Total home equity nonaccrual loans
102
$
62,075
$
711
75
2.0
1
4
9
18
68
Community Bank - Home Equity
Third quarter net charge-offs
18
$
-
2
%
18
%
31
%
49
%
Net loan charge-offs to average loans
.76
% |
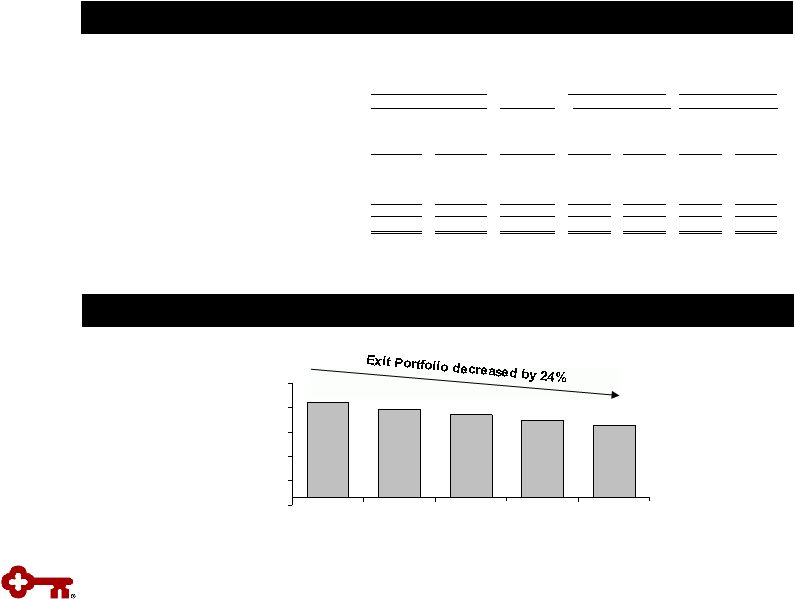 20
$4,435
$4,736
$5,846
$5,388
$5,048
-$500
$1,000
$2,500
$4,000
$5,500
$7,000
3Q10
4Q10
1Q11
2Q11
3Q11
Exit Loan Portfolio Trend (Excluding Discontinued Operations)
Exit Loan Portfolio
$ in millions
$ in millions
Exit Loan Portfolio
Change
9-30-11 vs.
9-30-11
6-30-11
6-30-11
3Q11
2Q11
9-30-11
6-30-11
Residential
properties
–
homebuilder
$48
$62
$(14)
$4
$1
$28
$33
Marine and RV floor plan
92
122
(30)
3
1
38
31
Commercial lease financing
(a)
1,728
1,826
(98)
-
7
9
19
Total commercial loans
1,868
2,010
(142)
7
9
75
83
Home
equity
–
Other
565
595
(30)
8
10
12
11
Marine
1,871
1,989
(118)
11
4
32
32
RV and other consumer
131
142
(11)
1
2
-
-
Total consumer loans
2,567
2,726
(159)
20
16
44
43
Total exit loans in loan portfolio
$4,435
$4,736
$(301)
$27
$25
$119
$126
Discontinued
operations
-
education
lending business (not included in exit loans above)
(b)
$5,984
$6,261
$(277)
$31
$32
$22
$21
Balance on
Nonperforming
Status
Balance
Outstanding
Charge-offs
Net Loan
(a)
Includes the business aviation, commercial vehicle, office products, construction and industrial
leases, and Canadian lease financing portfolios; and all remaining balances related to lease
in, lease out; sale in, sale out; service contract leases; and qualified technological
equipment leases
(b)
Includes loans in Key’s consolidated education loan securitization trusts
|
 21
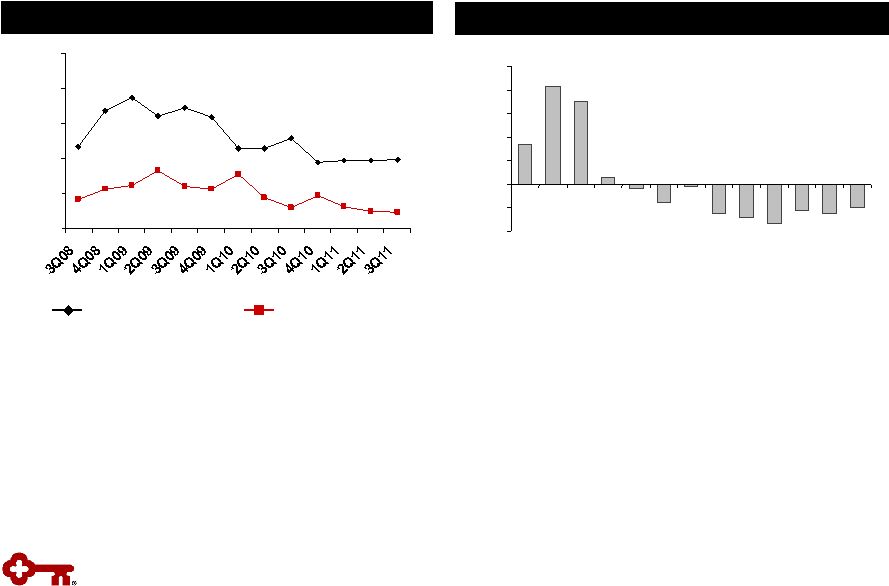
Credit Quality Trends
Quarterly Change in Criticized Outstandings
(a)
Delinquencies to Period-end Total Loans
(a)
Loan and lease outstandings
.99%
.97%
.98%
.95%
1.29%
1.14%
1.14%
1.59%
1.72%
1.61%
1.87%
1.69%
1.17%
.24%
.25%
.32%
.48%
.30%
.45%
.78%
.56%
.60%
.82%
.62%
.57%
.42%
0.00%
0.50%
1.00%
1.50%
2.00%
2.50%
30 –
89 days delinquent
90+ days delinquent
(10.2)%
(12.3)%
(11.2)%
(16.7)%
(14.3)%
(12.8)%
(1.0)%
(8.1)%
(2.0)%
2.8%
35.1%
41.5%
17.1%
-20%
-10%
0%
10%
20%
30%
40%
50%
3Q08
4Q08
1Q09
2Q09
3Q09
4Q09
1Q10
2Q10
3Q10
4Q10
1Q11
2Q11
3Q11 |