Attached files
| file | filename |
|---|---|
| EX-32.2 - EX-32.2 - KEYCORP /NEW/ | key-33121xexx322.htm |
| EX-32.1 - EX-32.1 - KEYCORP /NEW/ | key-33121xexx321.htm |
| EX-31.2 - EX-31.2 - KEYCORP /NEW/ | key-33121xexx312.htm |
| EX-31.1 - EX-31.1 - KEYCORP /NEW/ | key-33121xexx311.htm |
| EX-15 - EX-15 - KEYCORP /NEW/ | key-33121xexx15.htm |
UNITED STATES
SECURITIES AND EXCHANGE COMMISSION
Washington D.C. 20549
FORM 10-Q
☒ QUARTERLY REPORT PURSUANT TO SECTION 13 OR 15(d) OF THE SECURITIES EXCHANGE ACT OF 1934
For the quarterly period ended March 31, 2021
or
☐ TRANSITION REPORT PURSUANT TO SECTION 13 OR 15(d) OF THE SECURITIES EXCHANGE ACT OF 1934
For the transition period from to
Commission File Number 001-11302
KeyCorp

Exact name of registrant as specified in its charter:
Ohio | 34-6542451 | ||||
| State or other jurisdiction of incorporation or organization: | I.R.S. Employer Identification Number: | ||||
127 Public Square, | Cleveland, | Ohio | 44114-1306 | ||||||||
| Address of principal executive offices: | Zip Code: | ||||||||||
(216) 689-3000
Registrant’s telephone number, including area code:
SECURITIES REGISTERED PURSUANT TO SECTION 12(b) OF THE ACT:
| Title of each class | Trading Symbol(s) | Name of each exchange on which registered | ||||||
Common Shares, $1 par value | KEY | New York Stock Exchange | ||||||
Depositary Shares (each representing a 1/40th interest in a share of Fixed-to-Floating Rate | KEY PrI | New York Stock Exchange | ||||||
Perpetual Non-Cumulative Preferred Stock, Series E) | ||||||||
Depositary Shares (each representing a 1/40th interest in a share of Fixed Rate Perpetual Non- | KEY PrJ | New York Stock Exchange | ||||||
Cumulative Preferred Stock, Series F) | ||||||||
Depositary Shares (each representing a 1/40th interest in a share of Fixed Rate Perpetual Non- | KEY PrK | New York Stock Exchange | ||||||
Cumulative Preferred Stock, Series G) | ||||||||
Indicate by check mark whether the registrant (1) has filed all reports required to be filed by Section 13 or 15(d) of the Securities Exchange Act of 1934 during the preceding 12 months (or for such shorter period that the registrant was required to file such reports), and (2) has been subject to such filing requirements for the past 90 days. Yes ☒ No ☐
Indicate by check mark whether the registrant has submitted electronically every Interactive Data File required to be submitted pursuant to Rule 405 of Regulation S-T (§232.405 of this chapter) during the preceding 12 months (or for such shorter period that the registrant was required to submit such files). Yes ☒ No ☐
Indicate by check mark whether the registrant is a large accelerated filer, an accelerated filer, a non-accelerated filer, a smaller reporting company, or an emerging growth company. See the definitions of “large accelerated filer,” “accelerated filer,” “smaller reporting company,” and “emerging growth company” in Rule 12b-2 of the Exchange Act.
| Large accelerated filer | ☒ | Accelerated filer | ☐ | Non-accelerated filer | ☐ | ||||||||||||
| Smaller reporting company | ☐ | Emerging growth company | ☐ | ||||||||||||||
If an emerging growth company, indicate by check mark if the registrant has elected not to use the extended transition period for complying with any new or revised financial accounting standards provided pursuant to Section 13(a) of the Exchange Act. ☐
Indicate by check mark whether the registrant is a shell company (as defined in Rule 12b-2 of the Exchange Act). Yes ☐ No ☒
Indicate the number of shares outstanding of each of the issuer’s classes of common stock, as of the latest practicable date.
| Common Shares with a par value of $1 each | 970,519,438 shares | ||||
| Title of class | Outstanding at April 29, 2021 | ||||
1
KEYCORP
TABLE OF CONTENTS
PART I. FINANCIAL INFORMATION
| Page Number | ||||||||
| Item 1. | ||||||||
2
| Item 2. | ||||||||
Selected financial data | ||||||||
| Item 3. | ||||||||
| Item 4. | ||||||||
| PART II. OTHER INFORMATION | ||||||||
| Item 1. | ||||||||
| Item 1A. | ||||||||
| Item 2. | ||||||||
| Item 6. | ||||||||
3
PART I. FINANCIAL INFORMATION
Item 2. Management’s Discussion & Analysis of Financial Condition & Results of Operations
Introduction
This section reviews the financial condition and results of operations of KeyCorp and its subsidiaries for the quarterly periods ended March 31, 2021, and March 31, 2020. Some tables may include additional periods to comply with disclosure requirements or to illustrate trends in greater depth. When you read this discussion, you should also refer to the consolidated financial statements and related notes in this report. The page locations of specific sections and notes that we refer to are presented in the Table of Contents.
References to our “2020 Form 10-K” refer to our Form 10-K for the year ended December 31, 2020, which has been filed with the SEC and is available on its website (www.sec.gov) and on our website (www.key.com/ir).
Terminology
Throughout this discussion, references to “Key,” “we,” “our,” “us,” and similar terms refer to the consolidated entity consisting of KeyCorp and its subsidiaries. “KeyCorp” refers solely to the parent holding company, and “KeyBank” refers to KeyCorp’s subsidiary bank, KeyBank National Association.
We want to explain some industry-specific terms at the outset so you can better understand the discussion that follows.
•We use the phrase continuing operations in this document to mean all of our businesses other than our government-guaranteed and private education lending business, which has been accounted for as discontinued operations since 2009.
•We engage in capital markets activities primarily through business conducted by our Commercial Bank segment. These activities encompass a variety of products and services. Among other things, we trade securities as a dealer, enter into derivative contracts (both to accommodate clients’ financing needs and to mitigate certain risks), and conduct transactions in foreign currencies (both to accommodate clients’ needs and to benefit from fluctuations in exchange rates).
•For regulatory purposes, capital is divided into two classes. Federal regulations currently prescribe that at least one-half of a bank or BHC’s total risk-based capital must qualify as Tier 1 capital. Both total and Tier 1 capital serve as bases for several measures of capital adequacy, which is an important indicator of financial stability and condition. Banking regulators evaluate a component of Tier 1 capital, known as Common Equity Tier 1, under the Regulatory Capital Rules. The “Capital” section of this report under the heading “Capital adequacy” provides more information on total capital, Tier 1 capital, and the Regulatory Capital Rules, including Common Equity Tier 1, and describes how these measures are calculated.
4
The acronyms and abbreviations identified below are used in the Management’s Discussion & Analysis of Financial Condition & Results of Operations as well as in the Notes to Consolidated Financial Statements (Unaudited). You may find it helpful to refer back to this page as you read this report.
ABO: Accumulated benefit obligation. ALCO: Asset/Liability Management Committee. ALLL: Allowance for loan and lease losses. A/LM: Asset/liability management. AML: Anti-money laundering. AOCI: Accumulated other comprehensive income (loss). APBO: Accumulated postretirement benefit obligation. ARRC: Alternative Reference Rates Committee. ASC: Accounting Standards Codification. ASU: Accounting Standards Update. ATMs: Automated teller machines. Austin: Austin Capital Management, Ltd. BSA: Bank Secrecy Act. BHCA: Bank Holding Company Act of 1956, as amended. BHCs: Bank holding companies. Board: KeyCorp Board of Directors. CAPM: Capital Asset Pricing Model. CCAR: Comprehensive Capital Analysis and Review. Cain Brothers: Cain Brothers & Company, LLC. CECL: Current Expected Credit Losses. CFPB: Consumer Financial Protection Bureau, also known as the Bureau of Consumer Financial Protection. CFTC: Commodities Futures Trading Commission. CMBS: Commercial mortgage-backed securities. CMO: Collateralized mortgage obligation. Common Shares: KeyCorp common shares, $1 par value. CVA: Credit Valuation Adjustment. DCF: Discounted cash flow. DIF: Deposit Insurance Fund of the FDIC. Dodd-Frank Act: Dodd-Frank Wall Street Reform and Consumer Protection Act of 2010. EAD: Exposure at default. EBITDA: Earnings before interest, taxes, depreciation, and amortization. EPS: Earnings per share. ERISA: Employee Retirement Income Security Act of 1974. ERM: Enterprise risk management. EVE: Economic value of equity. FASB: Financial Accounting Standards Board. FDIA: Federal Deposit Insurance Act, as amended. FDIC: Federal Deposit Insurance Corporation. Federal Reserve: Board of Governors of the Federal Reserve System. FHLB: Federal Home Loan Bank of Cincinnati. FHLMC: Federal Home Loan Mortgage Corporation. FICO: Fair Isaac Corporation. FINRA: Financial Industry Regulatory Authority. First Niagara: First Niagara Financial Group, Inc. FNMA: Federal National Mortgage Association. FSOC: Financial Stability Oversight Council. FVA: Fair value of employee benefit plan assets. GAAP: U.S. generally accepted accounting principles. | GNMA: Government National Mortgage Association. HelloWallet: HelloWallet, LLC. HTC: Historic tax credit. IRS: Internal Revenue Service. ISDA: International Swaps and Derivatives Association. KBCM: KeyBanc Capital Markets, Inc. KCC: Key Capital Corporation. KCDC: Key Community Development Corporation. KEF: Key Equipment Finance. KIBS: Key Insurance & Benefits Services, Inc. LCR: Liquidity coverage ratio. LGD: Loss given default. LIBOR: London Interbank Offered Rate. LIHTC: Low-income housing tax credit. LTV: Loan-to-value. Moody’s: Moody’s Investor Services, Inc. MRM: Market Risk Management group. MRC: Market Risk Committee. N/A: Not applicable. Nasdaq: The Nasdaq Stock Market LLC. NAV: Net asset value. NFA: National Futures Association. N/M: Not meaningful. NMTC: New market tax credit. NOW: Negotiable Order of Withdrawal. NPR: Notice of proposed rulemaking. NYSE: New York Stock Exchange. OCC: Office of the Comptroller of the Currency. OCI: Other comprehensive income (loss). OREO: Other real estate owned. PBO: Projected benefit obligation. PCCR: Purchased credit card relationship. PCD: Purchased credit deteriorated. PD: Probability of default. PPP: Paycheck Protection Program. S&P: Standard and Poor’s Ratings Services, a Division of The McGraw-Hill Companies, Inc. SEC: U.S. Securities & Exchange Commission. SIFIs: Systemically important financial institutions, including large, interconnected BHCs and nonbank financial companies designated by FSOC for supervision by the Federal Reserve. SOFR: Secured Overnight Financing Rate. TCJ Act: Tax Cuts and Jobs Act. TDR: Troubled debt restructuring. TE: Taxable-equivalent. U.S. Treasury: United States Department of the Treasury. VaR: Value at risk. VEBA: Voluntary Employee Beneficiary Association. VIE: Variable interest entity. | ||||
Forward-looking statements
From time to time, we have made or will make forward-looking statements within the meaning of the Private Securities Litigation Reform Act of 1995. These statements do not relate strictly to historical or current facts. Forward-looking statements usually can be identified by the use of words such as “goal,” “objective,” “plan,” “expect,” “assume,” “anticipate,” “intend,” “project,” “believe,” “estimate,” or other words of similar meaning. Forward-looking statements provide our current expectations or forecasts of future events, circumstances, results or aspirations. Our disclosures in this report contain forward-looking statements. We may also make forward-looking statements in other documents filed with or furnished to the SEC. In addition, we may make forward-looking statements orally to analysts, investors, representatives of the media, and others.
Forward-looking statements, by their nature, are subject to assumptions, risks, and uncertainties, many of which are outside of our control. Our actual results may differ materially from those set forth in our forward-looking statements.
5
There is no assurance that any list of risks and uncertainties or risk factors is complete. Factors that could cause our actual results to differ from those described in forward-looking statements include, but are not limited to:
•our concentrated credit exposure in commercial and industrial loans;
•deterioration of commercial real estate market fundamentals;
•defaults by our loan counterparties or clients;
•adverse changes in credit quality trends;
•declining asset prices;
•deterioration of asset quality and an increase in credit losses due to the COVID-19 global pandemic;
•the decline in oil prices;
•the extensive regulation of the U.S. financial services industry;
•changes in accounting policies, standards, and interpretations;
•operational or risk management failures by us or critical third parties;
•breaches of security or failures of our technology systems due to technological or other factors and cybersecurity threats;
•negative outcomes from claims or litigation;
•failure or circumvention of our controls and procedures;
•the occurrence of natural or man-made disasters, global pandemics, conflicts, or terrorist attacks, or other adverse external events;
•increased operational risks resulting from the COVID-19 global pandemic;
•our participation in the Paycheck Protection Program;
•evolving capital and liquidity standards under applicable regulatory rules;
•disruption of the U.S. financial system;
•our ability to receive dividends from our subsidiaries, including KeyBank;
•unanticipated changes in our liquidity position, including but not limited to, changes in our access to or the cost of funding and our ability to secure alternative funding sources;
•downgrades in our credit ratings or those of KeyBank;
•uncertainty in markets due to the COVID-19 global pandemic;
•a worsening of the U.S. economy due to financial, political or other shocks;
•our ability to anticipate interest rate changes and manage interest rate risk;
•uncertainty surrounding the transition from LIBOR to an alternate reference rate;
•deterioration of economic conditions in the geographic regions where we operate;
•the soundness of other financial institutions;
•economic disruption related to interest rate risk and market risk due to the COVID-19 global pandemic;
•our ability to attract and retain talented executives and employees and to manage our reputational risks;
•our ability to timely and effectively implement our strategic initiatives;
•increased competitive pressure;
•our ability to adapt our products and services to industry standards and consumer preferences;
•unanticipated adverse effects of strategic partnerships or acquisitions and dispositions of assets or businesses; and
•our ability to develop and effectively use the quantitative models we rely upon in our business planning.
Any forward-looking statements made by us or on our behalf speak only as of the date they are made, and we do not undertake any obligation to update any forward-looking statement to reflect the impact of subsequent events or circumstances. Before making an investment decision, you should carefully consider all risks and uncertainties disclosed in our 2020 Form 10-K and any subsequent reports filed with the SEC by Key, as well as our registration statements under the Securities Act of 1933, as amended, all of which are or will upon filing be accessible on the SEC’s website at www.sec.gov and on our website at www.key.com/ir.
6
Long-term financial targets
Our financial outlook and results of operations have been impacted by the economic fallout of the COVID-19 pandemic. Our long-term targets have not changed as we expect to continue to deliver positive operating leverage and strong financial returns as we emerge from this period of economic & financial stress.
(a)See the section entitled “GAAP to Non-GAAP Reconciliations,” which presents the computations of certain financial measures related to “cash efficiency.” The section includes tables that reconcile the GAAP performance measures to the corresponding non-GAAP measures, which provides a basis for period-to-period comparisons.
(a)See the section entitled “GAAP to Non-GAAP Reconciliations,” which presents the computations of certain financial measures related to “tangible common equity.” The section includes tables that reconcile the GAAP performance measures to the corresponding non-GAAP measures, which provides a basis for period-to-period comparisons.
Positive Operating Leverage
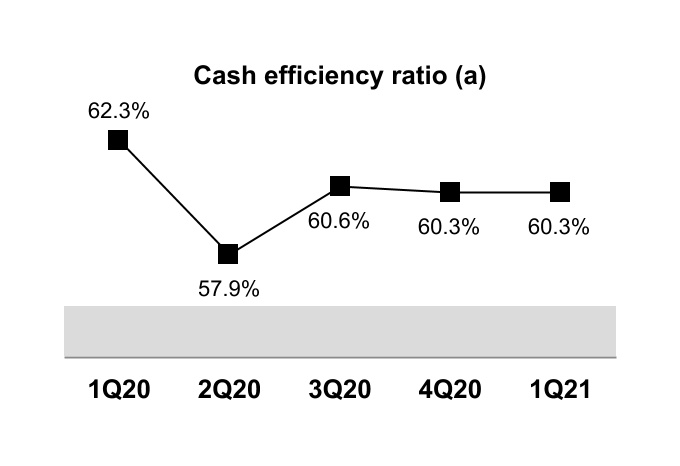
Generate positive operating leverage and a cash efficiency ratio in the range of 54.0% to 56.0%.
Our results for the first quarter of 2021 continue to reflect the hard work and dedication of our team and their commitment to serving our clients as we work through the ongoing pandemic. We achieved positive operating leverage compared to the year-ago quarter, and generated record first quarter revenue, up 19% from the year-ago quarter. This was driven by a record first quarter for investment banking & debt placement fees and continued strength in consumer mortgage fee income.
Moderate Risk Profile
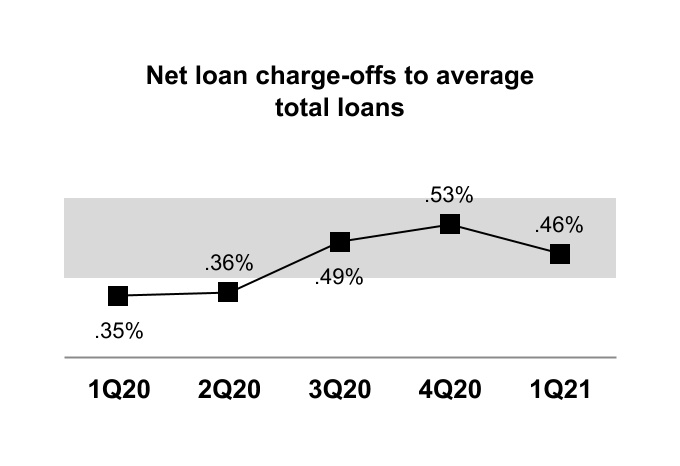
Maintain a moderate risk profile by targeting a net loan charge-offs to average loans ratio in the range of .40% to .60% through a credit cycle.
We believe our strong risk management practices and disciplined underwriting continue to strengthen our credit quality. Net charge-offs to average loans decreased seven basis points, and nonperforming loans declined by $57 million from the prior quarter. Our provision for credit losses reflects a benefit from strong credit metrics and an improved outlook for the overall economy, credit migration, and loan production.
Financial Return
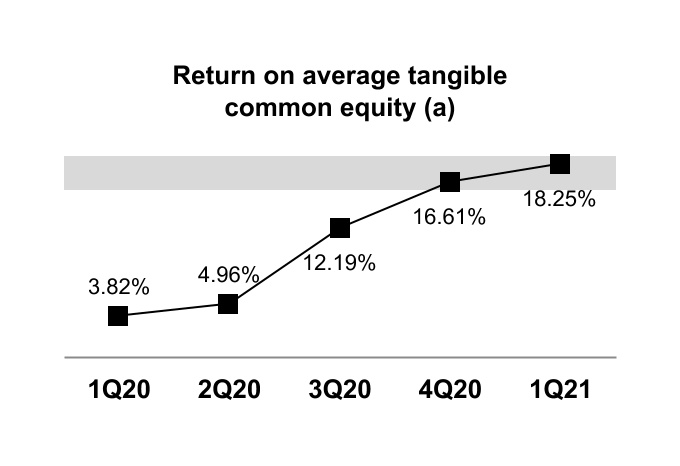
A return on average tangible common equity in the range of 16.00% to 19.00%.
We have continued to maintain a strong level of capital. Return on average tangible common equity increased ~160 basis points from the prior quarter, to 18.2%. We ended the first quarter of 2021 with a Common Equity Tier 1 ratio of 9.9%, which is above our targeted range of 9.0% to 9.5%. We believe that this provides us with sufficient capacity to continue to support our customers and their borrowing needs and return capital to our shareholders.
7
Selected financial data
Our financial performance for each of the last five quarters is summarized in Figure 1.
Figure 1. Selected Financial Data
| 2021 | 2020 | ||||||||||||||||||||||
| dollars in millions, except per share amounts | First | Fourth | Third | Second | First | ||||||||||||||||||
| FOR THE PERIOD | |||||||||||||||||||||||
| Interest income | $ | 1,087 | $ | 1,125 | $ | 1,119 | $ | 1,190 | $ | 1,251 | |||||||||||||
| Interest expense | 82 | 90 | 119 | 172 | 270 | ||||||||||||||||||
| Net interest income | 1,005 | 1,035 | 1,000 | 1,018 | 981 | ||||||||||||||||||
| Provision for credit losses | (93) | 20 | 160 | 482 | 359 | ||||||||||||||||||
| Noninterest income | 738 | 802 | 681 | 692 | 477 | ||||||||||||||||||
| Noninterest expense | 1,071 | 1,128 | 1,037 | 1,013 | 931 | ||||||||||||||||||
| Income (loss) from continuing operations before income taxes | 765 | 689 | 484 | 215 | 168 | ||||||||||||||||||
| Income (loss) from continuing operations attributable to Key | 618 | 575 | 424 | 185 | 145 | ||||||||||||||||||
| Income (loss) from discontinued operations, net of taxes | 4 | 7 | 4 | 2 | 1 | ||||||||||||||||||
| Net income (loss) attributable to Key | 622 | 582 | 428 | 187 | 146 | ||||||||||||||||||
| Income (loss) from continuing operations attributable to Key common shareholders | 591 | 549 | 397 | 159 | 118 | ||||||||||||||||||
| Income (loss) from discontinued operations, net of taxes | 4 | 7 | 4 | 2 | 1 | ||||||||||||||||||
| Net income (loss) attributable to Key common shareholders | 595 | 556 | 401 | 161 | 119 | ||||||||||||||||||
| PER COMMON SHARE | |||||||||||||||||||||||
| Income (loss) from continuing operations attributable to Key common shareholders | $ | .61 | $ | .57 | $ | .41 | $ | .16 | $ | .12 | |||||||||||||
| Income (loss) from discontinued operations, net of taxes | — | .01 | — | — | — | ||||||||||||||||||
Net income (loss) attributable to Key common shareholders (a) | .62 | .57 | .41 | .17 | .12 | ||||||||||||||||||
| Income (loss) from continuing operations attributable to Key common shareholders — assuming dilution | .61 | .56 | .41 | .16 | .12 | ||||||||||||||||||
| Income (loss) from discontinued operations, net of taxes — assuming dilution | — | .01 | — | — | — | ||||||||||||||||||
Net income (loss) attributable to Key common shareholders — assuming dilution (a) | .61 | .57 | .41 | .17 | .12 | ||||||||||||||||||
| Cash dividends paid | .185 | .185 | .185 | .185 | .185 | ||||||||||||||||||
| Book value at period end | 16.22 | 16.53 | 16.25 | 16.07 | 15.95 | ||||||||||||||||||
| Tangible book value at period end | 13.30 | 13.61 | 13.32 | 13.12 | 12.98 | ||||||||||||||||||
| Weighted-average common shares outstanding (000) | 964,878 | 967,987 | 967,804 | 967,147 | 967,446 | ||||||||||||||||||
Weighted-average common shares and potential common shares outstanding (000) (b) | 974,297 | 976,460 | 973,988 | 972,141 | 976,110 | ||||||||||||||||||
| AT PERIOD END | |||||||||||||||||||||||
| Loans | $ | 100,926 | $ | 101,185 | $ | 103,081 | $ | 106,159 | $ | 103,198 | |||||||||||||
| Earning assets | 160,810 | 155,469 | 155,585 | 156,177 | 141,333 | ||||||||||||||||||
| Total assets | 176,203 | 170,336 | 170,540 | 171,192 | 156,197 | ||||||||||||||||||
| Deposits | 142,183 | 135,282 | 136,746 | 135,513 | 115,304 | ||||||||||||||||||
| Long-term debt | 12,499 | 13,709 | 12,685 | 13,734 | 13,732 | ||||||||||||||||||
| Key common shareholders’ equity | 15,734 | 16,081 | 15,822 | 15,642 | 15,511 | ||||||||||||||||||
| Key shareholders’ equity | 17,634 | 17,981 | 17,722 | 17,542 | 17,411 | ||||||||||||||||||
| PERFORMANCE RATIOS — FROM CONTINUING OPERATIONS | |||||||||||||||||||||||
| Return on average total assets | 1.44 | % | 1.35 | % | 1.00 | % | .45 | % | .40 | % | |||||||||||||
| Return on average common equity | 14.98 | 13.65 | 9.98 | 4.05 | 3.10 | ||||||||||||||||||
Return on average tangible common equity (c) | 18.25 | 16.61 | 12.19 | 4.96 | 3.82 | ||||||||||||||||||
| Net interest margin (TE) | 2.61 | 2.70 | 2.62 | 2.76 | 3.01 | ||||||||||||||||||
Cash efficiency ratio (c) | 60.3 | 60.3 | 60.6 | 57.9 | 62.3 | ||||||||||||||||||
| PERFORMANCE RATIOS — FROM CONSOLIDATED OPERATIONS | |||||||||||||||||||||||
| Return on average total assets | 1.45 | % | 1.36 | % | 1.00 | % | .46 | % | .40 | % | |||||||||||||
| Return on average common equity | 15.08 | 13.82 | 10.08 | 4.10 | 3.12 | ||||||||||||||||||
Return on average tangible common equity (c) | 18.37 | 16.82 | 12.31 | 5.02 | 3.86 | ||||||||||||||||||
| Net interest margin (TE) | 2.60 | 2.69 | 2.62 | 2.76 | 3.00 | ||||||||||||||||||
Loan-to-deposit (d) | 73.1 | 76.5 | 77.2 | 80.4 | 92.1 | ||||||||||||||||||
| CAPITAL RATIOS AT PERIOD END | |||||||||||||||||||||||
| Key shareholders’ equity to assets | 10.0 | % | 10.6 | % | 10.4 | % | 10.2 | % | 11.1 | % | |||||||||||||
| Key common shareholders’ equity to assets | 9.0 | 9.5 | 9.3 | 9.2 | 10.0 | ||||||||||||||||||
Tangible common equity to tangible assets (c) | 7.5 | 7.9 | 7.8 | 7.6 | 8.3 | ||||||||||||||||||
| Common Equity Tier 1 | 9.9 | 9.7 | 9.5 | 9.1 | 8.9 | ||||||||||||||||||
| Tier 1 risk-based capital | 11.3 | 11.1 | 10.9 | 10.5 | 10.2 | ||||||||||||||||||
| Total risk-based capital | 13.4 | 13.4 | 13.3 | 12.8 | 12.2 | ||||||||||||||||||
| Leverage | 8.9 | 8.9 | 8.7 | 8.8 | 9.8 | ||||||||||||||||||
| TRUST ASSETS | |||||||||||||||||||||||
| Assets under management | $ | 45,218 | $ | 44,140 | $ | 41,312 | $ | 39,722 | $ | 36,189 | |||||||||||||
| OTHER DATA | |||||||||||||||||||||||
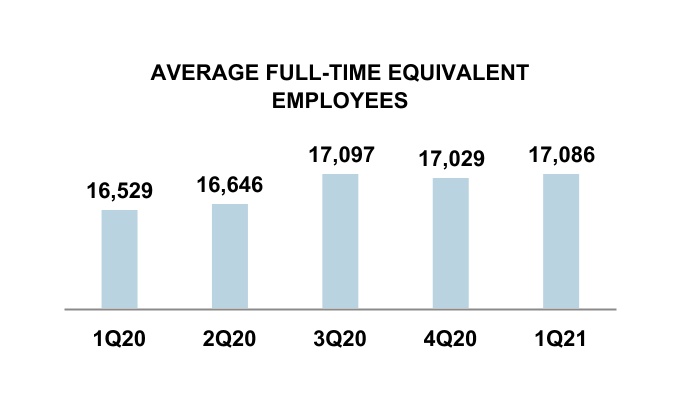
| Average full-time-equivalent employees | 17,086 | 17,029 | 17,097 | 16,646 | 16,529 | ||||||||||||||||||
| Branches | 1,068 | 1,073 | 1,077 | 1,077 | 1,082 | ||||||||||||||||||
(a)EPS may not foot due to rounding.
(b)Assumes conversion of Common Share options and other stock awards and/or convertible preferred stock, as applicable.
(c)See the section entitled “GAAP to Non-GAAP Reconciliations,” which presents the computations of certain financial measures related to “tangible common equity” and “cash efficiency.” The section includes tables that reconcile the GAAP performance measures to the corresponding non-GAAP measures, which provides a basis for period-to-period comparisons.
(d)Represents period-end consolidated total loans and loans held for sale divided by period-end consolidated total deposits.
8
Strategic developments
The first quarter of 2021 was a strong start to the year and positions us to grow and deliver on our commitments to all of our stakeholders. We have remained committed to supporting our employees, our communities, and our clients throughout the pandemic. Providing value to all stakeholders creates the foundation to deliver sustainable long-term performance. The corporate governance processes that we have in place allow us to oversee any changes and new requirements that may occur across our geographic footprint. Our actions and results during the first quarter of 2021 reflect our response to the current environment and support our corporate strategy described in the “Introduction” section under the “Corporate strategy” heading on page 45 of our 2020 Form 10-K.
•Our business resiliency plans remained in effect and we maintained our operational effectiveness across the entire organization. The health and safety of our clients, employees, and communities in which we operate have continued to be our top priority. Nearly every branch has been open for business and continues to follow guidelines on how to minimize physical contact with our clients and between our employees. Our return-to-office protocols, which began in the second quarter of 2020, continued during the first quarter of 2021. This plan is flexible as the ongoing pandemic changes and may impact the communities in which our employees and clients operate differently.
•We are committed to playing a critical role in providing capital and assistance to our clients and supporting broader initiatives to strengthen our economy. We continue to support our clients through SBA-guaranteed loans to small businesses, payment deferrals, hardship support, borrower assistance programs, and forbearance options to help provide a bridge for individuals and businesses through these uncertain times.
•On February 25, 2021, we acquired AQN Strategies, a client-focused analytics firm with deep expertise in the financial services industry. This acquisition aligns to Key’s relationship strategy and underscores our commitment to a data-driven approach to grow our business.
•On March 30, 2021, we unveiled Laurel Road for Doctors, a national digital bank tailored to physicians and dentists with products and services informed by their needs. With Laurel Road for Doctors, we continue to expand targeted client relationships by bringing together a full set of solutions, expertise, and services to drive value for healthcare professionals.
•Credit quality is also playing a critical role in this environment. Our risk profile and strategy is different than the one we had leading up to, and during, the 2007-2009 financial crisis. We have significantly reduced our exposure to high-risk sectors and industries and have positioned Key to perform well through all phases of the business cycle, including highly stressed environments. Our moderate risk profile will continue to inform our credit decisions and the way we underwrite loans.
•Capital and liquidity continued to be clear strengths for us during the first quarter of 2021. Our strong capital position allows us to continue to execute against each of our capital priorities of organic growth, dividends, and share repurchases. During the first quarter we repurchased $135 million of common shares, and the Board of Directors approved a common share dividend of $.185 per Common Share.
Demographics
The Consumer Bank serves individuals and small businesses throughout our 15-state branch footprint and through our Laurel Road digital brand by offering a variety of deposit and investment products, personal finance and financial wellness services, lending, student loan refinancing, mortgage and home equity, credit card, treasury services, and business advisory services. In addition, wealth management and investment services are offered to assist non-profit and high-net-worth clients with their banking, trust, portfolio management, life insurance, charitable giving, and related needs.
The Commercial Bank is an aggregation of our Institutional and Commercial operating segments. The Commercial operating segment is a full-service corporate bank focused principally on serving the needs of middle market clients in seven industry sectors: consumer, energy, healthcare, industrial, public sector, real estate, and technology. The Commercial operating segment is also a significant servicer of commercial mortgage loans and a significant special servicer of CMBS. The Institutional operating segment delivers a broad suite of banking and capital markets products to its clients, including syndicated finance, debt and equity capital markets, commercial payments, equipment finance, commercial mortgage banking, derivatives, foreign exchange, financial advisory, and public finance.
9
Supervision and regulation
The following discussion provides a summary of recent regulatory developments and should be read in conjunction with the disclosure included in our 2020 Form 10-K under the heading “Supervision and Regulation” in Item 1. Business and under the heading “II. Compliance Risk” in Item 1A. Risk Factors.
Regulatory capital requirements
The final rule to implement the Basel III international capital framework (“Basel III”) was effective January 1, 2015, with a multi-year transition period (“Regulatory Capital Rules”). As of April 1, 2020, the Regulatory Capital Rules were fully phased-in for Key. The Basel III capital framework and the U.S. implementation of the Basel III capital framework are discussed in more detail in Item 1. Business of our 2020 Form 10-K under the heading “Supervision and Regulation — Regulatory capital requirements.”
Under the Regulatory Capital Rules, standardized approach banking organizations, such as KeyCorp and KeyBank, are required to meet the minimum capital and leverage ratios set forth in Figure 2 below. At March 31, 2021, KeyCorp’s ratios under the fully phased-in Regulatory Capital Rules are set forth in Figure 2.
Figure 2. Minimum Capital Ratios and KeyCorp Ratios Under the Regulatory Capital Rules
| Ratios (including stress capital buffer) | Regulatory Minimum Requirement | Stress Capital Buffer (b) | Regulatory Minimum With Stress Capital Buffer | KeyCorp March 31, 2021 (c) | ||||||||||
| Common Equity Tier 1 | 4.5 | % | 2.5 | % | 7.0 | % | 9.9 | % | ||||||
| Tier 1 Capital | 6.0 | 2.5 | 8.5 | 11.3 | ||||||||||
| Total Capital | 8.0 | 2.5 | 10.5 | 13.4 | ||||||||||
Leverage (a) | 4.0 | N/A | 4.0 | 8.9 | ||||||||||
(a)As a standardized approach banking organization, KeyCorp is not subject to the 3% supplemental leverage ratio requirement, which became effective January 1, 2018.
(b)Stress capital buffer must consist of Common Equity Tier 1 capital. As a standardized approach banking organization, KeyCorp is not subject to the countercyclical capital buffer of up to 2.5% imposed upon an advanced approaches banking organization under the Regulatory Capital Rules.
(c)Ratios reflect the five-year transition of CECL impacts on regulatory ratios.
Revised prompt corrective action framework
The federal prompt corrective action (“PCA”) framework under the FDIA groups FDIC-insured depository institutions into one of five prompt corrective action capital categories: “well capitalized,” “adequately capitalized,” “undercapitalized,” “significantly undercapitalized,” and “critically undercapitalized.” In addition to implementing the Basel III capital framework in the United States, the Regulatory Capital Rules also revised the PCA capital category threshold ratios applicable to FDIC-insured depository institutions such as KeyBank, with an effective date of January 1, 2015. The revised PCA framework table in Figure 3 identifies the capital category thresholds for a “well capitalized” and an “adequately capitalized” institution under the PCA Framework.
Figure 3. "Well Capitalized" and "Adequately Capitalized" Capital Category Ratios under Revised PCA Framework
| Prompt Corrective Action | Capital Category | ||||||||||
| Ratio | Well Capitalized (a) | Adequately Capitalized | |||||||||
| Common Equity Tier 1 Risk-Based | 6.5 | % | 4.5 | % | |||||||
| Tier 1 Risk-Based | 8.0 | 6.0 | |||||||||
| Total Risk-Based | 10.0 | 8.0 | |||||||||
Tier 1 Leverage (b) | 5.0 | 4.0 | |||||||||
(a)A “well capitalized” institution also must not be subject to any written agreement, order, or directive to meet and maintain a specific capital level for any capital measure.
(b)As a “standardized approach” banking organization, KeyBank is not subject to the 3% supplemental leverage ratio requirement, which became effective January 1, 2018.
As of March 31, 2021, KeyBank (consolidated) satisfied the risk-based and leverage capital requirements necessary to be considered “well capitalized” for purposes of the PCA framework. However, investors should not regard this determination as a representation of the overall financial condition or prospects of KeyBank because the PCA framework is intended to serve a limited supervisory function. Moreover, it is important to note that the PCA framework does not apply to BHCs, like KeyCorp.
10
Recent regulatory capital-related developments
See Item 1. Business of our 2020 Form 10-K under the heading “Supervision and Regulation - Regulatory capital requirements - Recent regulatory capital-related developments” for a discussion of recent regulatory capital-related developments.
Capital planning and stress testing
On January 19, 2021, the Federal Reserve issued a final rule to make conforming changes to the capital planning, regulatory reporting, and stress capital buffer requirements for firms subject to Category IV standards (including KeyCorp) to make these requirements consistent with the tailored regulatory framework for large banking organizations that the Federal Reserve adopted in an October 2019 rulemaking. The final rule revises the elements of the capital plan that Category IV firms are required to submit to the Federal Reserve and makes related changes to regulatory reporting requirements. Also, the final rule updates the frequency for calculating the stress capital buffer for these firms. In addition, the final rule makes certain clarifying changes to the stress testing rules applicable to all large banking organizations.
Due to the economic uncertainty caused by the COVID-19 pandemic, the Federal Reserve placed temporary restrictions on capital distributions by BHCs having more than $100 billion in total consolidated assets (including KeyCorp), that are in addition to limitations on capital distributions that apply under the Regulatory Capital Rules. On June 25, 2020, the Federal Reserve stated that for the third quarter of 2020, BHCs with more than $100 billion in total assets are prohibited from (i) making share repurchases (other than share repurchase relating to issuances of common stock for employee stock ownership plans); and (ii) paying common stock dividends that exceed the amount paid in the second quarter of 2020 or exceed an amount equal to the average of the firm’s net income for the four preceding calendar quarters unless otherwise specified by the Federal Reserve. The Federal Reserve continued these restriction on dividends and share repurchases by large BHCs for the fourth quarter of 2020 in an announcement made on September 17, 2020.
On December 18, 2020, the Federal Reserve stated that because of the ongoing economic uncertainty, it was extending its limits on capital distributions by BHCs with more than $100 billion in total assets into the first quarter of 2021, with certain modifications. The Federal Reserve noted that these firms (i) are prohibited from increasing their common stock dividends to an amount greater than the amount paid in the second quarter of 2020; and (ii) are prohibited from paying common stock dividends and making share repurchase that, in the aggregate, exceed an amount equal to the average of the firm’s net income for the four preceding calendar quarters. The Federal Reserve further indicated that it was extending the time period for the Federal Reserve to notify firms whether their stress capital buffer requirements will be recalculated until March 31, 2021.
On March 25, 2021, the Federal Reserve said that it was continuing into the second quarter of 2021 the restrictions on dividends and share repurchases for BHCs with more than $100 billion in total assets that it announced on December 18, 2020, and indicated that it was extending the time period for the Federal Reserve to notify firms whether their stress capital buffer requirements will be recalculated until June 30, 2021. The Federal Reserve also announced that these temporary restrictions on BHC dividends and share repurchases will end for most firms after June 30, 2021. Firms subject to the Federal Reserve’s supervisory stress test in 2021 with capital levels above those required by the stress test will no longer by subject to the temporary additional restrictions after that date while firms with capital levels below those required by the stress test will remain subject to the restrictions.
For BHCs that are on a two-year stress test cycle and are not subject to the Federal Reserve’s supervisory stress test in 2021 (including KeyCorp), the temporary additional restrictions on dividends and share repurchases will end after June 30, 2021. Beginning on July 1, 2021, these firms will be allowed to make capital distributions that are consistent with the Regulatory Capital Rules, inclusive of the stress capital buffer requirement based on the firm’s June 2020 stress test. In August 2020, the Federal Reserve confirmed that KeyCorp’s required stress capital buffer, based on its June 2020 stress test, is 2.5%, which is the minimum buffer requirement for firms the size of KeyCorp.
See Item 1. Business of our 2020 Form 10-K under the heading “Supervision and Regulation - Regulatory capital requirements - Capital planning and stress testing” for an overview of capital planning and stress testing requirements.
11
Liquidity requirements
See Item. 1 Business of our 2020 Form 10-K under the heading “Supervision and Regulation - Regulatory capital requirements - Liquidity requirements” for a discussion of liquidity requirements, including the Liquidity Coverage Rules.
Volcker Rule
The Volcker Rule is discussed in detail in Item 1. Business of our 2020 Form 10-K under the heading “Supervision and Regulation - Other Regulatory Developments - Volcker Rule.”
Community Reinvestment Act
See Item 1. Business of our 2020 Form 10-K under the heading “Supervision and Regulation - Other Regulatory Developments - Community Reinvestment Act” for a discussion of recent developments concerning the Community Reinvestment Act.
Supervision and governance
On February 26, 2021, the Federal Reserve issued supervisory guidance describing the key attributes of effective boards of directors of large financial institutions, including BHCs with $100 billion or more in total consolidated assets. This supervisory guidance adopts a principles-based approach to describe attributes of effective boards of directors and provides illustrative examples of effective practices. The Federal Reserve indicated that it intends to use the board effectiveness guidance in informing its assessment of governance and controls at all firms subject to the large financial institution rating system (“LFI Rating System”) (including KeyCorp).
See Item 1. Business of our 2020 Form 10-K under the heading “Supervision and Regulation - Other Regulatory Developments - Supervision and governance” for a discussion of other recent supervision and governance-related developments, including a discussion of the LFI Rating System.
Regulatory developments concerning COVID-19
On March 30, 2021, President Biden signed into law the PPP Extension Act, which extends the deadline for submitting loan applications under this program from March 31, 2021, to May 31, 2021. KeyBank participates as a lender in the PPP, which provides SBA-guaranteed loans to small businesses.
On March 31, 2021, the CFPB announced that it is rescinding seven policy statements issued in 2020, which provided financial institutions with temporary regulatory flexibility in complying with various consumer protection laws when they are working with customers affected by the COVID-19 pandemic. The CFPB indicated that, with these rescissions, it intends to exercise the full scope of its supervision and enforcement authority provided by the Dodd-Frank Act.
The CFPB issued a compliance bulletin on April 1, 2021, urging mortgage servicers to take proactive measures to prevent avoidable foreclosures. The CFPB indicated that it will be closely monitoring how servicers engage with borrowers and will consider a servicer’s effectiveness in helping borrowers when it evaluates a servicer’s compliance with mortgage servicing rules.
On April 5, 2021, the CFPB requested public comment on a proposal that would amend the CFPB’s mortgage servicing rules to help ensure that borrowers affected by the COVID-19 pandemic have an opportunity to be evaluated for loss mitigation before the initiation of foreclosure proceedings. Among other things, the proposal (i) would establish a temporary COVID-19 emergency pre-foreclosure review period that would generally prohibit servicers from commencing a foreclosure action involving a borrower’s principal residence until after December 31, 2021; (ii) would permit servicers to offer certain streamlined loan modification options based on the evaluation of an incomplete application; and (iii) would revise the early intervention and reasonable diligence obligations of servicers to ensure that they communicate timely and accurate information to borrowers about their loss mitigation options. Certain requirements would apply only until August 31, 2022. Comments on the proposal are due by May 10, 2021.
12
See Item 1. Business of our 2020 Form 10-K under the heading “Supervision and Regulation - Other Regulatory Developments - Regulatory developments concerning COVID-19” for a discussion of other recent regulatory developments relating to the COVID-19 pandemic.
Results of Operations
Earnings overview
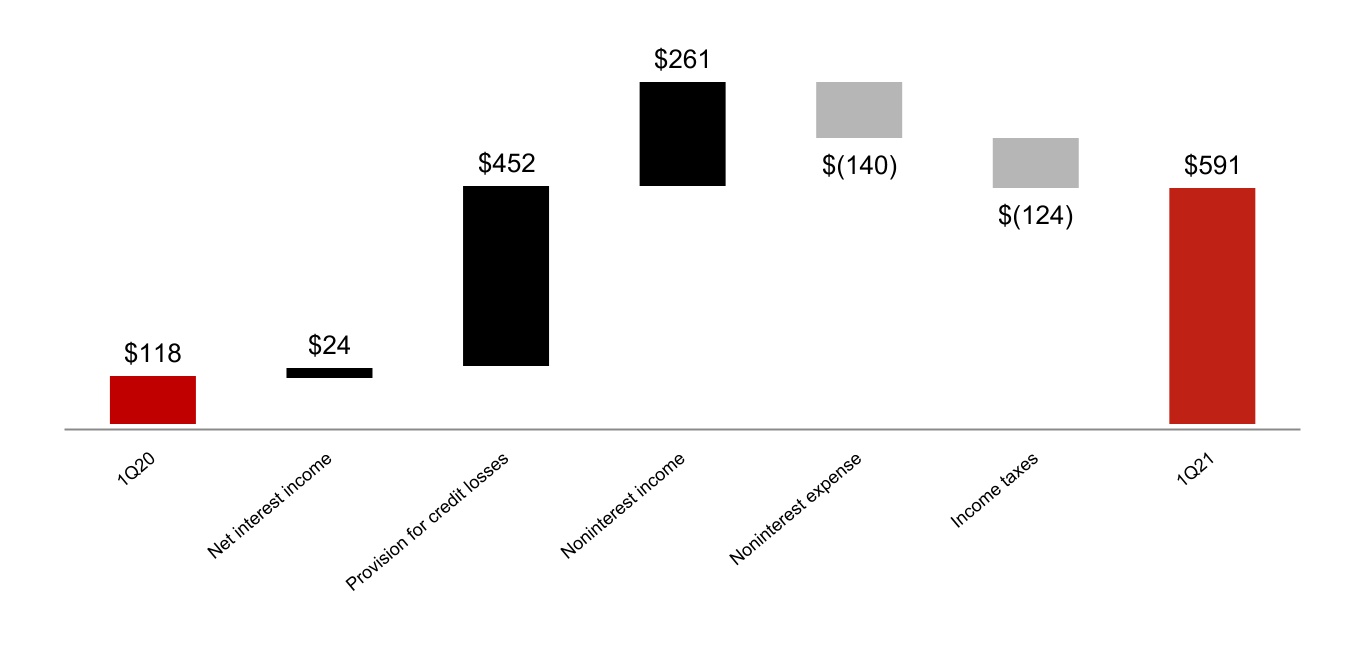
The following chart provides a reconciliation of net income from continuing operations attributable to Key common shareholders for the three months ended March 31, 2020, to the three months ended March 31, 2021 (dollars in millions):
Net interest income
One of our principal sources of revenue is net interest income. Net interest income is the difference between interest income received on earning assets (such as loans and securities) and loan-related fee income, and interest expense paid on deposits and borrowings. There are several factors that affect net interest income, including:
•the volume, pricing, mix, and maturity of earning assets and interest-bearing liabilities;
•the volume and value of net free funds, such as noninterest-bearing deposits and equity capital;
•the use of derivative instruments to manage interest rate risk;
•interest rate fluctuations and competitive conditions within the marketplace;
•asset quality; and
•fair value accounting of acquired earning assets and interest-bearing liabilities.
To make it easier to compare both the results across several periods and the yields on various types of earning assets (some taxable, some not), we present net interest income in this discussion on a “TE basis” (i.e., as if all income were taxable and at the same rate). For example, $100 of tax-exempt income would be presented as $126, an amount that, if taxed at the statutory federal income tax rate of 21%, would yield $100.
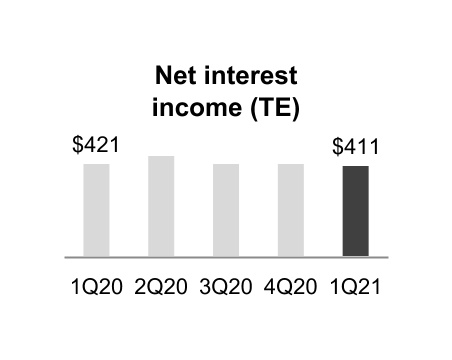
Figure 4 shows the various components of our balance sheet that affect interest income and expense and their respective yields or rates over the past five quarters. This figure also presents a reconciliation of TE net interest income to net interest income reported in accordance with GAAP for each of those quarters. The net interest margin, which is an indicator of the profitability of the earning assets portfolio less cost of funding, is calculated by dividing annualized TE net interest income by average earning assets.
13
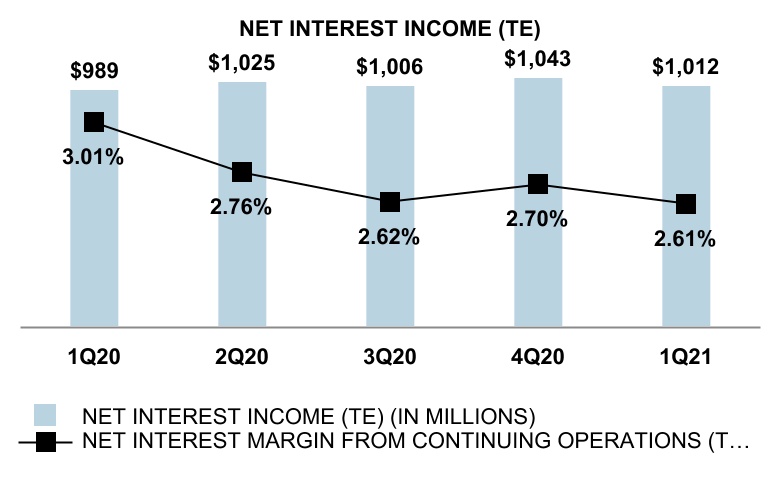
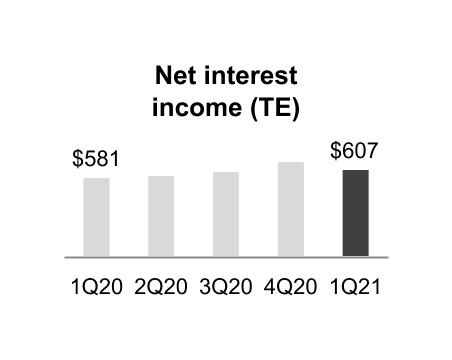
TE net interest income was $1.0 billion for the first quarter of 2021, compared to TE net interest income of $989 million for the first quarter of 2020. The increase in net interest income reflects higher earning asset balances and loan fees partially offset by a lower net interest margin. The net interest margin was impacted by lower interest rates and a change in balance sheet mix, including elevated levels of liquidity.
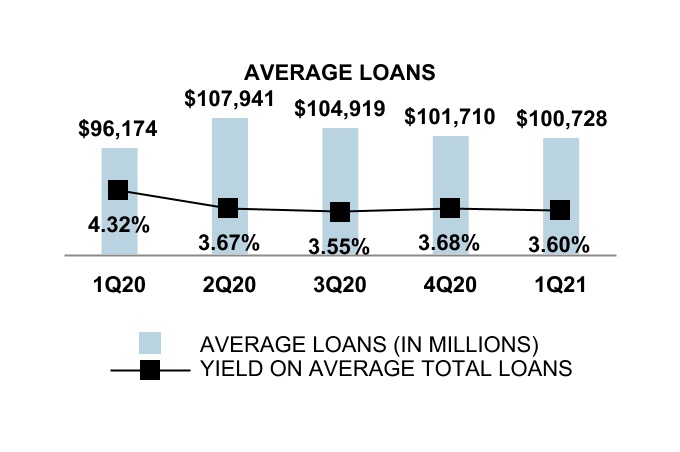
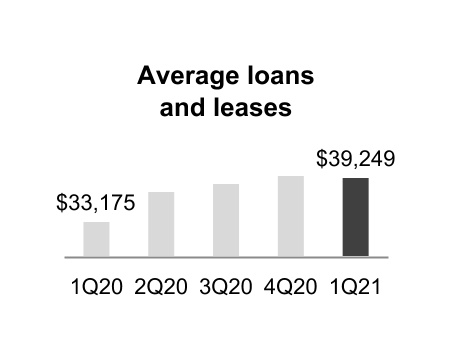
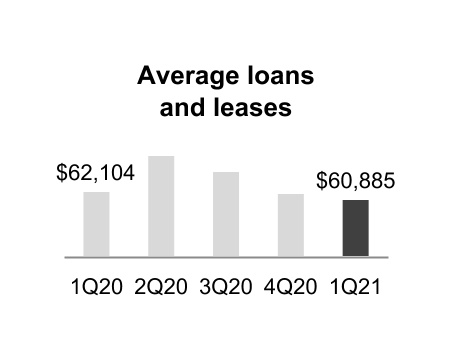
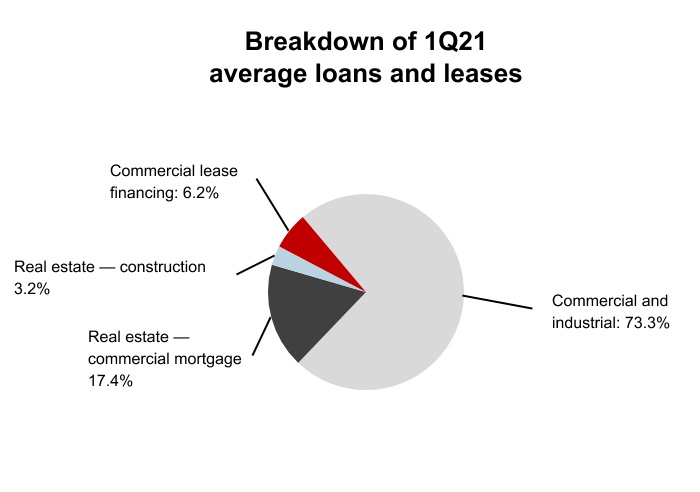
Average loans were $100.7 billion for the first quarter of 2021, an increase of $4.6 billion compared to the first quarter of 2020. Commercial loans increased $2.2 billion, reflecting Key’s participation in the PPP partially offset by decreased utilization versus the year-ago period. Consumer loans increased $2.4 billion, driven by strength from Laurel Road and Key's consumer mortgage business.
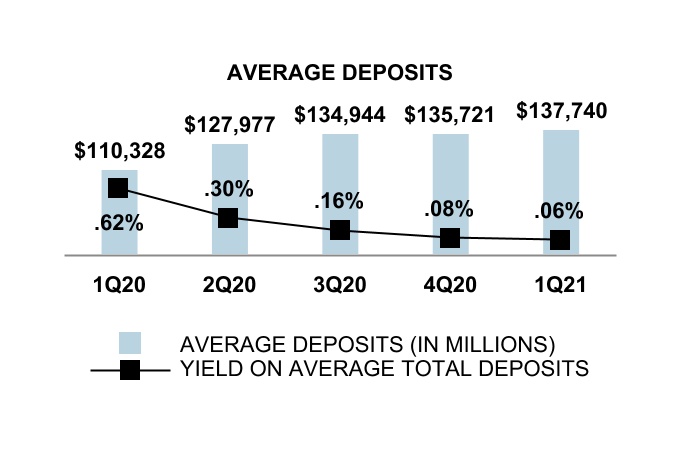
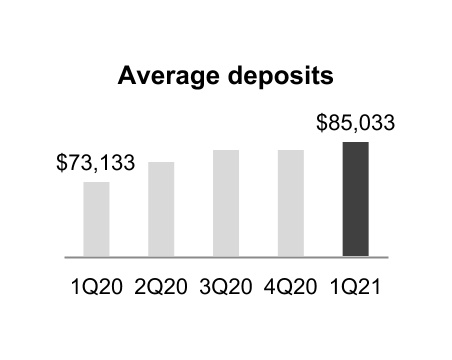
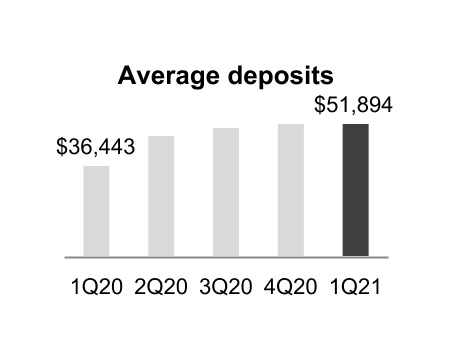
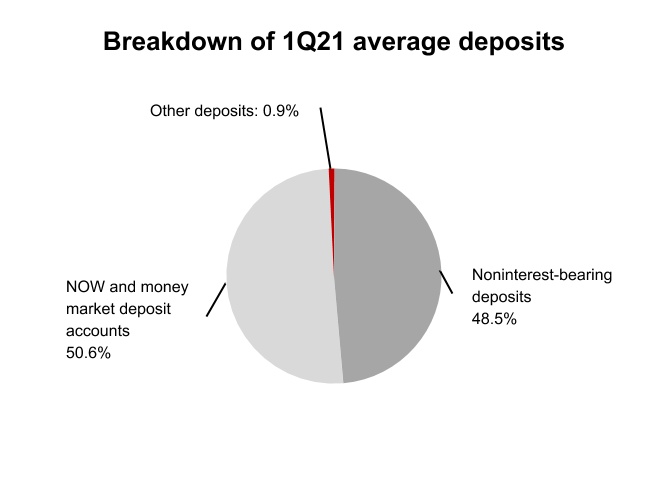
Average deposits totaled $137.7 billion for the first quarter of 2021, an increase of $27.4 billion compared to the year-ago quarter, reflecting growth from consumer and commercial relationships, partially offset by a decline in time deposits as a result of lower interest rates.
14
Figure 4. Consolidated Average Balance Sheets, Net Interest Income, and Yields/Rates and Components of Net Interest Income Changes from Continuing Operations
| Three months ended March 31, 2021 | Three months ended March 31, 2020 | Change in Net interest income due to | |||||||||||||||||||||||||||||||||
| dollars in millions | Average Balance | Interest (a) | Yield/ Rate (a) | Average Balance | Interest (a) | Yield/ Rate (a) | Volume | Yield/Rate | Total | ||||||||||||||||||||||||||
| ASSETS | |||||||||||||||||||||||||||||||||||
Loans (b), (c) | |||||||||||||||||||||||||||||||||||
Commercial and industrial (d) | $ | 52,581 | $ | 453 | 3.48 | % | $ | 49,466 | $ | 508 | 4.13 | % | $ | 31 | $ | (86) | $ | (55) | |||||||||||||||||
| Real estate — commercial mortgage | 12,658 | 114 | 3.67 | 13,548 | 155 | 4.60 | (10) | (31) | (41) | ||||||||||||||||||||||||||
| Real estate — construction | 2,048 | 19 | 3.75 | 1,666 | 20 | 4.75 | 4 | (5) | (1) | ||||||||||||||||||||||||||
| Commercial lease financing | 4,142 | 31 | 2.99 | 4,565 | 39 | 3.39 | (3) | (5) | (8) | ||||||||||||||||||||||||||
| Total commercial loans | 71,429 | 617 | 3.50 | 69,245 | 722 | 4.19 | 22 | (127) | (105) | ||||||||||||||||||||||||||
| Real estate — residential mortgage | 9,699 | 76 | 3.12 | 7,215 | 68 | 3.75 | 21 | (13) | 8 | ||||||||||||||||||||||||||
| Home equity loans | 9,282 | 85 | 3.73 | 10,155 | 113 | 4.49 | (9) | (19) | (28) | ||||||||||||||||||||||||||
| Consumer direct loans | 4,817 | 56 | 4.72 | 3,709 | 54 | 5.91 | 14 | (12) | 2 | ||||||||||||||||||||||||||
| Credit cards | 933 | 24 | 10.45 | 1,082 | 31 | 11.50 | (4) | (3) | (7) | ||||||||||||||||||||||||||
| Consumer indirect loans | 4,568 | 37 | 3.30 | 4,768 | 46 | 3.86 | (2) | (7) | (9) | ||||||||||||||||||||||||||
| Total consumer loans | 29,299 | 278 | 3.84 | 26,929 | 312 | 4.66 | 20 | (54) | (34) | ||||||||||||||||||||||||||
| Total loans | 100,728 | 895 | 3.60 | 96,174 | 1,034 | 4.32 | 42 | (181) | (139) | ||||||||||||||||||||||||||
| Loans held for sale | 1,531 | 11 | 2.89 | 1,885 | 19 | 3.99 | (3) | (5) | (8) | ||||||||||||||||||||||||||
Securities available for sale (b), (e) | 30,039 | 130 | 1.76 | 21,172 | 129 | 2.49 | 45 | (44) | 1 | ||||||||||||||||||||||||||
Held-to-maturity securities (b) | 7,188 | 45 | 2.53 | 9,820 | 62 | 2.51 | (16) | (1) | (17) | ||||||||||||||||||||||||||
| Trading account assets | 848 | 5 | 2.15 | 1,065 | 8 | 2.95 | (1) | (2) | (3) | ||||||||||||||||||||||||||
| Short-term investments | 16,510 | 5 | .13 | 1,764 | 6 | 1.42 | 9 | (10) | (1) | ||||||||||||||||||||||||||
Other investments (e) | 614 | 2 | 1.40 | 614 | 1 | .40 | — | 1 | 1 | ||||||||||||||||||||||||||
| Total earning assets | 157,458 | 1,094 | 2.81 | 132,494 | 1,259 | 3.82 | 76 | (242) | (166) | ||||||||||||||||||||||||||
| Allowance for loan and lease losses | (1,623) | (1,097) | |||||||||||||||||||||||||||||||||
| Accrued income and other assets | 16,398 | 14,831 | |||||||||||||||||||||||||||||||||
| Discontinued assets | 686 | 838 | |||||||||||||||||||||||||||||||||
| Total assets | $ | 172,919 | $ | 147,066 | |||||||||||||||||||||||||||||||
| LIABILITIES | |||||||||||||||||||||||||||||||||||
NOW and money market deposit accounts | $ | 81,439 | 10 | .05 | $ | 66,721 | 112 | .67 | 20 | (122) | (102) | ||||||||||||||||||||||||
| Savings deposits | 6,203 | 1 | .03 | 4,655 | 1 | .05 | — | — | — | ||||||||||||||||||||||||||
| Certificates of deposit ($100,000 or more) | 2,571 | 6 | .96 | 6,310 | 34 | 2.20 | (14) | (14) | (28) | ||||||||||||||||||||||||||
| Other time deposits | 2,902 | 4 | .57 | 4,901 | 22 | 1.81 | (7) | (11) | (18) | ||||||||||||||||||||||||||
| Total interest-bearing deposits | 93,115 | 21 | .09 | 82,587 | 169 | .82 | (1) | (147) | (148) | ||||||||||||||||||||||||||
Federal funds purchased and securities sold under repurchase agreements | 243 | — | .04 | 2,002 | 6 | 1.17 | (3) | (3) | (6) | ||||||||||||||||||||||||||
Bank notes and other short-term borrowings | 878 | 1 | .64 | 1,401 | 5 | 1.58 | (1) | (3) | (4) | ||||||||||||||||||||||||||
Long-term debt (f), (g) | 12,831 | 60 | 1.93 | 12,443 | 90 | 2.96 | 3 | (33) | (30) | ||||||||||||||||||||||||||
| Total interest-bearing liabilities | 107,067 | 82 | .31 | 98,433 | 270 | 1.10 | (2) | (186) | (188) | ||||||||||||||||||||||||||
| Noninterest-bearing deposits | 44,625 | 27,741 | |||||||||||||||||||||||||||||||||
| Accrued expense and other liabilities | 2,772 | 2,838 | |||||||||||||||||||||||||||||||||
Discontinued liabilities (g) | 686 | 838 | |||||||||||||||||||||||||||||||||
| Total liabilities | 155,150 | 129,850 | |||||||||||||||||||||||||||||||||
| EQUITY | |||||||||||||||||||||||||||||||||||
| Key shareholders’ equity | 17,769 | 17,216 | |||||||||||||||||||||||||||||||||
| Noncontrolling interests | — | — | |||||||||||||||||||||||||||||||||
| Total equity | 17,769 | 17,216 | |||||||||||||||||||||||||||||||||
| Total liabilities and equity | $ | 172,919 | $ | 147,066 | |||||||||||||||||||||||||||||||
| Interest rate spread (TE) | 2.50 | % | 2.72 | % | |||||||||||||||||||||||||||||||
Net interest income (TE) and net interest margin (TE) | 1,012 | 2.61 | % | 989 | 3.01 | % | $ | 78 | $ | (56) | 22 | ||||||||||||||||||||||||
TE adjustment (b) | 7 | 8 | |||||||||||||||||||||||||||||||||
| Net interest income, GAAP basis | $ | 1,005 | $ | 981 | |||||||||||||||||||||||||||||||
(a)Results are from continuing operations. Interest excludes the interest associated with the liabilities referred to in (g), calculated using a matched funds transfer pricing methodology.
(b)Interest income on tax-exempt securities and loans has been adjusted to a taxable-equivalent basis using the statutory federal income tax rate of 21% for the three months ended March 31, 2021, and March 31, 2020.
(c)For purposes of these computations, nonaccrual loans are included in average loan balances.
(d)Commercial and industrial average balances include $126 million and $145 million of assets from commercial credit cards for the three months ended March 31, 2021, and March 31, 2020, respectively.
(e)Yield is calculated on the basis of amortized cost.
(f)Rate calculation excludes basis adjustments related to fair value hedges.
(g)A portion of long-term debt and the related interest expense is allocated to discontinued liabilities as a result of applying our matched funds transfer pricing methodology to discontinued operations.
15
Provision for credit losses
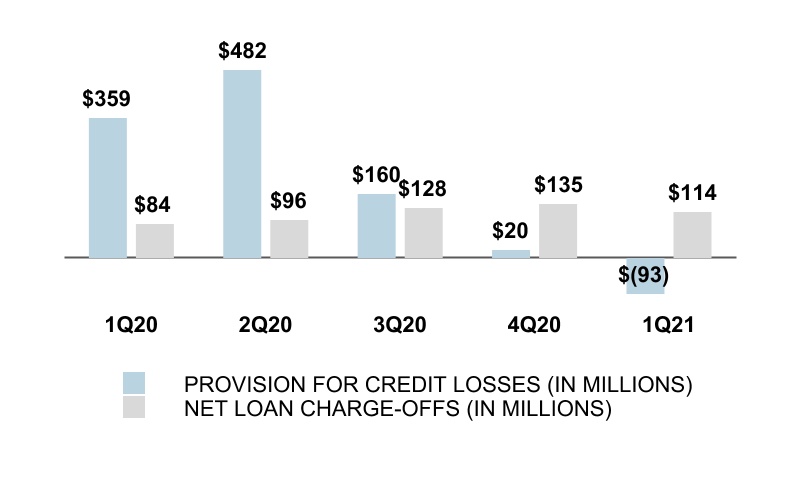
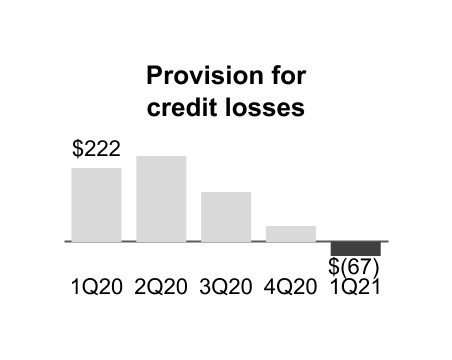
Key’s provision for credit losses was a net benefit of $93 million, including a $207 million reserve release for the three months ended March 31, 2021, compared to an expense of $359 million for the three months ended March 31, 2020. The reserve release was largely driven by expected improvement in the economic outlook.
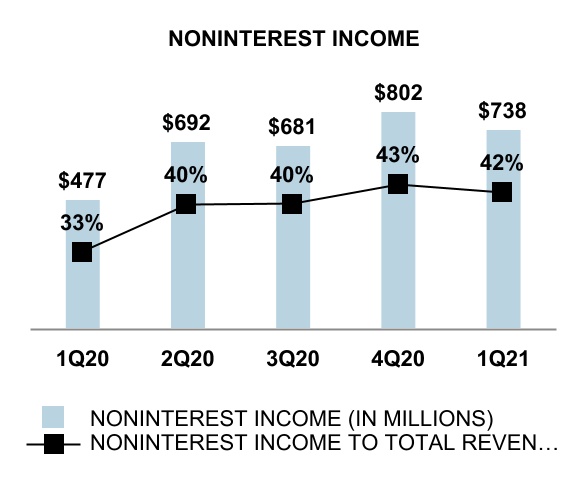
Noninterest income
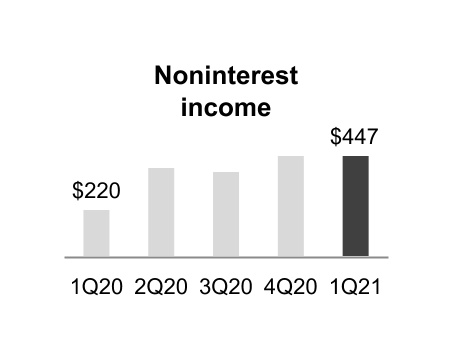
As shown in Figure 5, noninterest income was $738 million, and represented 42% of total revenue for the first quarter of 2021, compared to $477 million, representing 33% of total revenue, for the year-ago quarter.
The following discussion explains the composition of certain elements of our noninterest income and the factors that caused those elements to change.
Figure 5. Noninterest Income
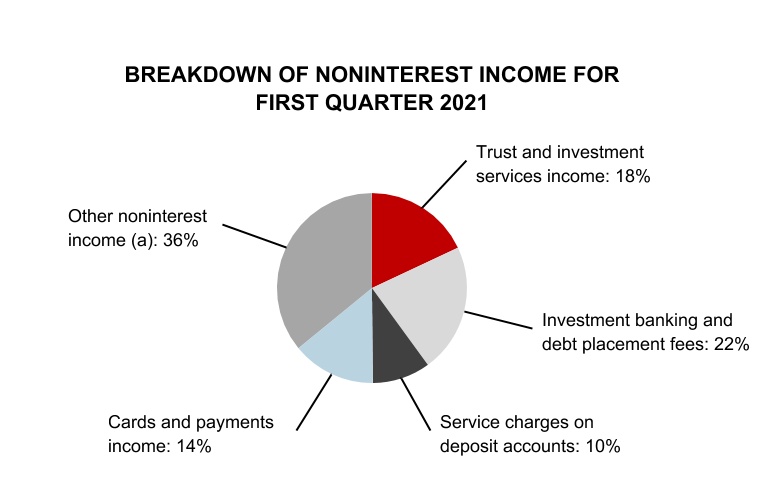
(a)Other noninterest income includes operating lease income and other leasing gains, corporate services income, corporate-owned life insurance income, consumer mortgage income, commercial mortgage servicing fees, and other income. See the "Consolidated Statements of Income" in Item 1. Financial Statements of this report.
16
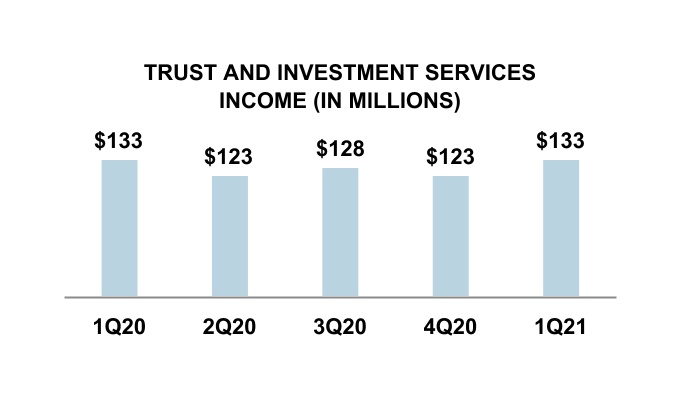
Trust and investment services income
Trust and investment services income consists of brokerage commissions, trust and asset management fees, and insurance income. The assets under management that primarily generate these revenues are shown in Figure 6. For the three months ended March 31, 2021, trust and investment services income remained constant compared to the same period one year ago. This was primarily due to an increase in trust and asset management fees partially related to higher levels of assets under management offset by decreased commercial brokerage income.
A significant portion of our trust and investment services income depends on the value and mix of assets under management. At March 31, 2021, our bank, trust, and registered investment advisory subsidiaries had assets under management of $45.2 billion, compared to $36.2 billion at March 31, 2020. Assets under management were up, as shown in Figure 6, due to increased portfolio yields.
Figure 6. Assets Under Management
| in millions | March 31, 2021 | December 31, 2020 | September 30, 2020 | June 30, 2020 | March 31, 2020 | ||||||||||||
| Assets under management by investment type: | |||||||||||||||||
| Equity | $ | 29,071 | $ | 27,384 | $ | 24,851 | $ | 23,303 | $ | 20,421 | |||||||
| Securities lending | 155 | 131 | 130 | 171 | 188 | ||||||||||||
| Fixed income | 11,865 | 12,130 | 11,767 | 11,318 | 10,911 | ||||||||||||
| Money market | 4,127 | 4,495 | 4,564 | 4,930 | 4,669 | ||||||||||||
| Total assets under management | $ | 45,218 | $ | 44,140 | $ | 41,312 | $ | 39,722 | $ | 36,189 | |||||||
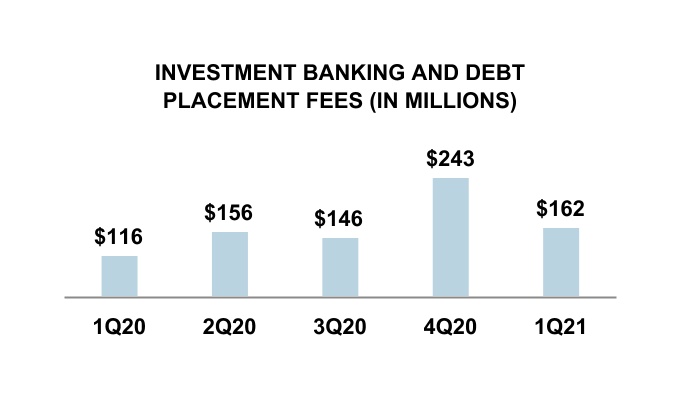
Investment banking and debt placement fees
Investment banking and debt placement fees consists of syndication fees, debt and equity financing fees, financial adviser fees, gains on sales of commercial mortgages, and agency origination fees. Investment banking and debt placement fees for the three months ended March 31, 2021, increased $46 million, or 39.7%, from the year-ago quarter. This increase was primarily driven by higher gains on the sales of commercial mortgages, and increased debt and equity underwriting fees.
17
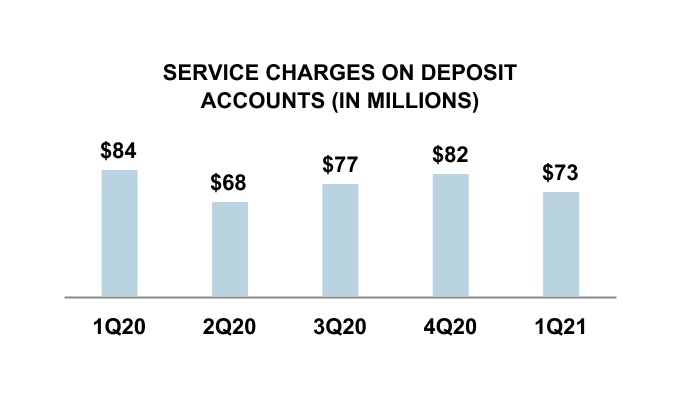
Service charges on deposit accounts
Service charges on deposit accounts decreased $11 million, or 13.1%, for the three months ended March 31, 2021, compared to the same period one year ago. This decrease was primarily driven by elevated balances reducing fee assessments and higher fee waivers related to the ongoing COVID-19 pandemic.
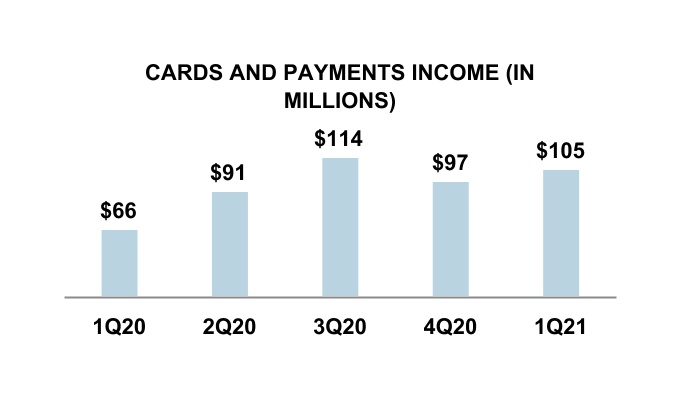
Cards and payments income
Cards and payments income, which consists of debit card, prepaid card, consumer and commercial credit card, and merchant services income, increased $39 million, or 59.1%, for the three months ended March 31, 2021, compared to the same period one year ago. This increase was primarily driven by increased prepaid card activity due to state support program activity.
Other noninterest income
Other noninterest income includes operating lease income and other leasing gains, corporate services income,
corporate-owned life insurance income, consumer mortgage income, commercial mortgage servicing fees, and other income. Other noninterest income for the three months ended March 31, 2021, increased $187 million, or 239.7%, from the year-ago quarter, primarily due to higher consumer mortgage income driven by strong loan originations and related fees.
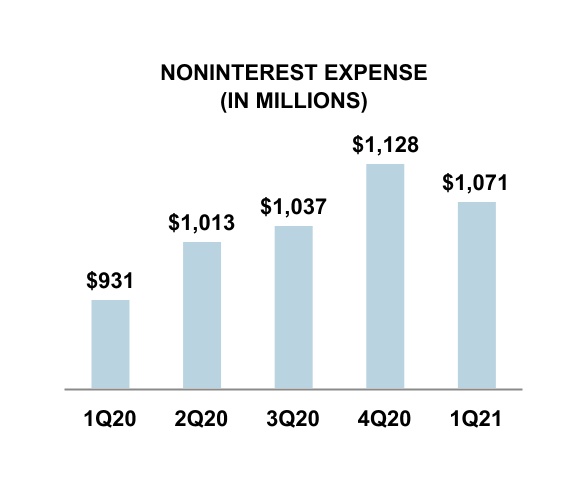
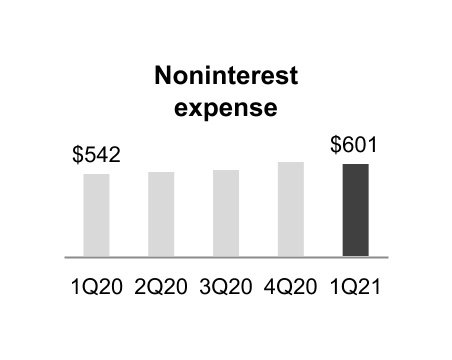
Noninterest expense
As shown in Figure 7, noninterest expense was $1.1 billion for the first quarter of 2021, compared to $931 million for the first quarter of 2020.
The following discussion explains the composition of certain elements of our noninterest expense and the factors that caused those elements to change.
18
Figure 7. Noninterest Expense
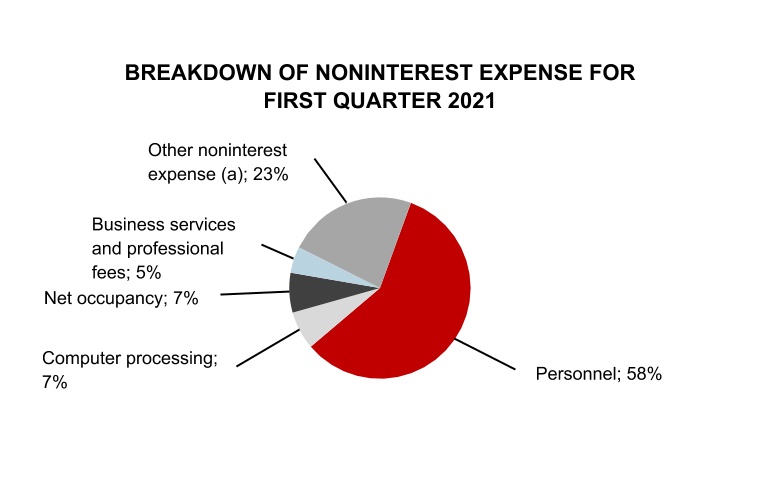
(a)Other noninterest expense includes equipment, operating lease expense, marketing, FDIC assessment, intangible asset amortization, OREO expense, net, and other expense. See the "Consolidated Statements of Income" in Item 1. Financial Statements of this report.
Personnel
Personnel expense, the largest category of our noninterest expense, increased by $109 million, or 21.2%, for the three months ended March 31, 2021, compared to the same period one year ago. The activity reflected higher incentive and stock-based compensation, attributed to an increase in revenue from stock performance and an increase in employee benefits compared to the year ago quarter.
Net occupancy
Net occupancy expense remained constant for the first quarter of 2021, compared to the same period one year ago.
Other noninterest expense
Other noninterest expense includes equipment, operating lease expense, marketing, FDIC assessment, intangible asset amortization, OREO expense, and other miscellaneous expense categories. Other noninterest expense for the three months ended March 31, 2021, increased $7 million, or 2.9%, from the year-ago quarter, primarily due to payments-related expense from increased prepaid card activity partially offset by a decrease in other real estate owned expenses.
19
Income taxes
We recorded tax expense of $147 million for the first quarter of 2021 and $23 million for the first quarter of 2020.
Our federal tax expense and effective tax rate differs from the amount that would be calculated using the federal statutory tax rate; primarily from investments in tax-advantaged assets, such as corporate-owned life insurance, tax credits associated with energy related projects and low-income housing investments, and periodic adjustments to our tax reserves.
Additional information pertaining to how our tax expense (benefit) and the resulting effective tax rates were derived is included in Note 14 (“Income Taxes”) beginning on page 158 of our 2020 Form 10-K.
Business Segment Results
This section summarizes the financial performance of our two major business segments (operating segments): Consumer Bank and Commercial Bank. Note 20 (“Business Segment Reporting”) describes the products and services offered by each of these business segments and provides more detailed financial information pertaining to the segments. For more information on the segment imperatives and market and business overview, see “Business Segment Results” beginning on page 54 of our 2020 Form 10-K. Dollars in the charts are presented in millions.
Consumer Bank
Summary of operations
•Net income attributable to Key of $217 million for the first quarter of 2021, compared to $103 million for the year-ago quarter
•Taxable-equivalent net interest income increased by $26 million, or 4.5%, compared to the first quarter of 2020, driven by strong balance sheet growth and fees related to PPP loans, partially offset by the lower interest rate environment
•Average loans and leases increased $6.1 billion, or 18.3%, driven by benefit from the PPP, as well as growth from Laurel Road and consumer mortgage
•Average deposits increased $11.9 billion, or 16.3%, from the first quarter of 2020. This was driven by consumer stimulus payments and relationship growth
20
•Provision for credit losses decreased $159 million compared to the first quarter of 2020. The provision for credit losses was a net benefit and was driven by expected improvements in economic conditions and continued strength in client credit quality
•Noninterest income increased $28 million, or 12.2%, from the year ago quarter, due to higher trust and investment services income, and strength in consumer mortgage income
•Noninterest expense increased $62 million, or 11.5%, from the year ago quarter, driven by higher variable compensation from significantly favorable revenue and higher variable expenses related to higher loan volumes
Commercial Bank
Summary of operations
•Net income attributable to Key of $383 million for the first quarter of 2021, compared to $66 million for the year-ago quarter
•Taxable-equivalent net interest income decreased by $10 million, compared to the first quarter of 2020, as the lower interest rate environment offset fees related to PPP loans
•Average loan and lease balances decreased $1.2 billion, compared to the first quarter of 2020 as lower utilization offset PPP loans
•Average deposit balances increased $15.5 billion, or 42.4%, compared to the first quarter of 2020, driven by growth in targeted relationships and the impact of government programs
21
•Provision for credit losses decreased $289 million compared to the first quarter of 2020. The provision for credit losses was a net benefit and was driven by expected improvements in economic conditions
•Noninterest income increased $227 million, from the year-ago quarter, driven by favorable market-related adjustments to customer derivatives compared to detriments in 2020, increased investment banking client activity, and higher cards and payments income related to prepaid card revenue
•Noninterest expense increased by $81 million, or 22.4%, from the first quarter of 2020, driven by higher variable compensation from significantly favorable revenue and elevated variable expenses related to prepaid card

22
Financial Condition
Loans and loans held for sale
Figure 8. Breakdown of Loans at March 31, 2021
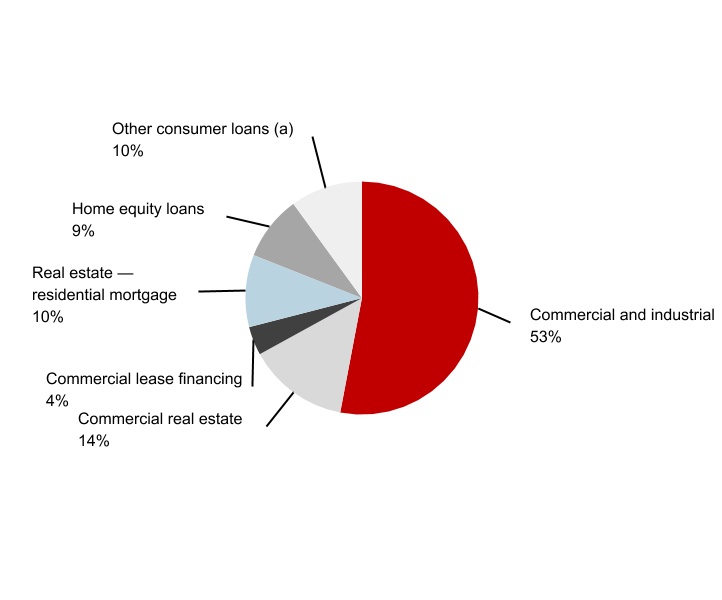
(a)Other consumer loans include Consumer direct loans, Credit cards, and Consumer indirect loans. See Note 3 (“Loan Portfolio”) in Item 1. Financial Statements of this report.
At March 31, 2021, total loans outstanding from continuing operations were $100.9 billion, compared to $101.2 billion at December 31, 2020. For more information on balance sheet carrying value, see Note 1 (“Summary of Significant Accounting Policies”) under the headings “Loans” and “Loans Held for Sale” starting on page 100 of our 2020 Form 10-K.
COVID-19 Hardship Relief Programs
In response to the COVID-19 pandemic, beginning in March 2020, we began providing relief and flexibility to our customers through a variety of solutions, including fee waivers, short-term loan modifications, and payment deferrals as well as the suspension of vehicle repossessions and home foreclosures. While the solutions for our commercial borrowers are individually negotiated and tailored to each borrower’s specific facts and circumstances, the most commonly offered relief measures included temporary covenant waivers and/or deferrals of principal and/or interest payments for up to 90 days. We have also granted short-term loan modifications for our consumer loan customers through extensions, deferrals, and forbearance.
The following table provides a summary of portfolio loans and leases as of March 31, 2021, and December 31, 2020, that have received a payment deferral or forbearance as part of our COVID-19 hardship relief programs:
23
Figure 9. Loans and Leases COVID-19 Hardship Relief
| Outstanding Balance of Loans and Leases | ||||||||||||||
| March 31, 2021 | ||||||||||||||
| dollars in millions | Completed Relief | In Active Relief | Total that have Received Payment Relief | |||||||||||
| Commercial Loans | $ | 2,716 | $ | 129 | $ | 2,844 | ||||||||
| Consumer Loans | 1,204 | 255 | 1,459 | |||||||||||
| Total Portfolio Loans and Leases | $ | 3,920 | $ | 384 | $ | 4,304 | ||||||||
| December 31, 2020 | ||||||||||||||
| dollars in millions | Completed Relief | In Active Relief | Total that have Received Payment Relief | |||||||||||
| Commercial Loans | $ | 2,899 | $ | 181 | $ | 3,079 | ||||||||
| Consumer Loans | 1,179 | 394 | 1,572 | |||||||||||
| Total Portfolio Loans and Leases | $ | 4,077 | $ | 575 | $ | 4,652 | ||||||||
The total outstanding balance of commercial loans in active relief as of March 31, 2021, represented 0.2% of the commercial loan portfolio and the total outstanding balance of consumer loans in active relief as of March 31, 2021, represented 0.9% of the consumer loan portfolio.
Under the CARES Act as well as banking regulator interagency guidance, certain loan modifications to borrowers experiencing financial distress as a result of the economic impacts created by COVID-19 may not be required to be treated as TDRs under U.S. GAAP. For COVID-19 related loan modifications which occurred from March 1, 2020, through March 31, 2021, and met the loan modification criteria under either the CARES Act or the criteria specified by the regulatory agencies or were otherwise considered to be short term in nature, we have elected to suspend TDR accounting for such loan modifications. Additionally, loans qualifying for these modifications are not required to be reported as delinquent, nonaccrual, impaired, or criticized solely as a result of a COVID-19 loan modification. Refer to Note 4 (“Asset Quality”) under the headings “TDRs” and “Nonperforming and Past Due Loans.”
For loans that receive a payment deferral or forbearance under these hardship relief programs, we continue to accrue interest and recognize interest income during the period of the deferral. Depending on the terms of each program, all or a portion of this accrued interest may be paid directly by the borrower (either during the relief period, at the end of the relief period, or at maturity of the loan) or added to the customer’s outstanding balance. For certain programs, the maturity date of the loan may also be extended by the number of payments deferred. Interest income will continue to be accrued at the original contractual interest rate unless that rate is concurrently modified upon entering the relief program (in which case, the modified rate would be used to recognize interest).
Commercial loan portfolio
Commercial loans outstanding were $71.4 billion at March 31, 2021, a decrease of $0.6 billion, or .8%, compared to December 31, 2020, driven by lower commercial and industrial utilization rates, partly offset by an increase in PPP funding.
As a result of the current economic environment, our commercial loan portfolio is going through active portfolio surveillance. We are conducting ongoing portfolio reviews on our commercial loans with any risk rating migrations being closely monitored. We have centralized internal reporting on enterprise-wide relief initiatives, as well as following any potential relief initiatives that may come in the future. We established a pandemic watchlist and are performing ongoing reviews of commercial clients that are likely to be impacted by COVID-19. These clients represent a small portion of the overall portfolio and are diversified by type and geography. Figure 10 summarizes our commercial portfolios that are at risk of being impacted by the COVID-19 pandemic as of March 31, 2021, and December 31, 2020.
24
Figure 10. Select Commercial Portfolio Focus Areas
| dollars in millions | Outstanding as of March 31, 2021 | Percentage of total loans as of March 31, 2021 | Outstanding as of December 31, 2020 | Percentage of total loans as of December 31, 2020 | ||||||||||
Consumer behavior (a) | $ | 5,112 | 5.1 | % | $ | 5,083 | 5.0 | % | ||||||
| Education | 1,557 | 1.5 | 1,541 | 1.5 | ||||||||||
| Sports | 664 | .7 | 690 | .7 | ||||||||||
| Restaurants | 368 | .4 | 400 | .4 | ||||||||||
Retail commercial real estate (b) | 396 | .4 | 525 | .5 | ||||||||||
Nondurable retail (c) | 595 | .6 | 638 | .6 | ||||||||||
Travel/Tourism (d) | 2,440 | 2.4 | 2,523 | 2.5 | ||||||||||
| Hotels | 767 | .8 | 784 | .8 | ||||||||||
Leveraged lending (e) | 1,674 | 1.7 | 1,700 | 1.7 | ||||||||||
| Oil and gas | 1,792 | 1.8 | 1,992 | 2.0 | ||||||||||
| Upstream (reserve based) | 1,141 | 1.1 | 1,263 | 1.2 | ||||||||||
| Midstream | 389 | .4 | 468 | .5 | ||||||||||
| Downstream | 58 | .1 | 98 | .1 | ||||||||||
(a)Consumer behavior includes restaurants, sports, entertainment and leisure, services, education, etc.
(b)Retail commercial real estate is mainly composed of regional malls, strip centers (unanchored) and lifestyle centers.
(c)Nondurable retail includes direct lending to retailers including apparel, hobby shops, nursery garden centers, cosmetics, and gas stations with convenience stores.
(d)Travel/Tourism includes hotels, tours, and air/water/rail leasing.
(e)Leveraged lending exposures have total debt to EBITDA greater than four times or senior debt to EBITDA greater than three times and meet the purpose test (the new debt finances a buyout, acquisition, or capital distribution).
25
Figure 11 provides our commercial loan portfolios by industry classification at March 31, 2021, and December 31, 2020.
Figure 11. Commercial Loans by Industry
| March 31, 2021 | Commercial and industrial | Commercial real estate | Commercial lease financing | Total commercial loans | Percent of total | ||||||||||||||||||||||||
| dollars in millions | |||||||||||||||||||||||||||||
| Industry classification: | |||||||||||||||||||||||||||||
| Agriculture | $ | 958 | $ | 129 | $ | 97 | $ | 1,184 | 1.7 | % | |||||||||||||||||||
| Automotive | 1,672 | 509 | 17 | 2,198 | 3.1 | ||||||||||||||||||||||||
| Business products | 1,561 | 128 | 43 | 1,732 | 2.4 | ||||||||||||||||||||||||
| Business services | 3,942 | 218 | 204 | 4,364 | 6.1 | ||||||||||||||||||||||||
| Chemicals | 761 | 32 | 29 | 822 | 1.2 | ||||||||||||||||||||||||
| Commercial real estate | 5,591 | 10,353 | 11 | 15,955 | 22.3 | ||||||||||||||||||||||||
| Construction materials and contractors | 2,606 | 263 | 228 | 3,097 | 4.3 | ||||||||||||||||||||||||
| Consumer discretionary | 3,744 | 489 | 258 | 4,491 | 6.3 | ||||||||||||||||||||||||
| Consumer services | 5,883 | 906 | 490 | 7,279 | 10.2 | ||||||||||||||||||||||||
| Equipment | 1,339 | 84 | 131 | 1,554 | 2.2 | ||||||||||||||||||||||||
| Finance | 5,770 | 93 | 357 | 6,220 | 8.7 | ||||||||||||||||||||||||
| Healthcare | 3,945 | 1,351 | 292 | 5,588 | 7.8 | ||||||||||||||||||||||||
| Metals and mining | 1,076 | 51 | 25 | 1,152 | 1.6 | ||||||||||||||||||||||||
| Oil and gas | 1,742 | 41 | 55 | 1,838 | 2.6 | ||||||||||||||||||||||||
| Public exposure | 2,475 | 14 | 696 | 3,185 | 4.5 | ||||||||||||||||||||||||
| Technology | 748 | 18 | 169 | 935 | 1.3 | ||||||||||||||||||||||||
| Transportation | 1,431 | 130 | 603 | 2,164 | 3.0 | ||||||||||||||||||||||||
| Utilities | 5,269 | — | 394 | 5,663 | 7.9 | ||||||||||||||||||||||||
| Other | 1,973 | 15 | 5 | 1,993 | 2.8 | ||||||||||||||||||||||||
| Total | $ | 52,486 | $ | 14,824 | $ | 4,104 | $ | 71,414 | 100.0 | % | |||||||||||||||||||
| December 31, 2020 | Commercial and industrial | Commercial real estate | Commercial lease financing | Total commercial loans | Percent of total | ||||||||||||||||||||||||
| dollars in millions | |||||||||||||||||||||||||||||
| Industry classification: | |||||||||||||||||||||||||||||
| Agriculture | $ | 1,002 | $ | 148 | $ | 97 | $ | 1,247 | 1.7 | % | |||||||||||||||||||
| Automotive | 1,863 | 510 | 19 | 2,392 | 3.3 | ||||||||||||||||||||||||
| Business products | 1,523 | 117 | 45 | 1,685 | 2.3 | ||||||||||||||||||||||||
| Business services | 4,098 | 221 | 202 | 4,521 | 6.3 | ||||||||||||||||||||||||
| Chemicals | 700 | 30 | 34 | 764 | 1.1 | ||||||||||||||||||||||||
| Commercial real estate | 5,966 | 10,187 | 11 | 16,164 | 22.5 | ||||||||||||||||||||||||
| Construction materials and contractors | 2,571 | 271 | 233 | 3,075 | 4.3 | ||||||||||||||||||||||||
| Consumer discretionary | 3,832 | 404 | 371 | 4,607 | 6.4 | ||||||||||||||||||||||||
| Consumer services | 6,123 | 900 | 525 | 7,548 | 10.5 | ||||||||||||||||||||||||
| Equipment | 1,447 | 84 | 120 | 1,651 | 2.3 | ||||||||||||||||||||||||
| Finance | 6,190 | 92 | 396 | 6,678 | 9.3 | ||||||||||||||||||||||||
| Healthcare | 4,348 | 1,396 | 306 | 6,050 | 8.4 | ||||||||||||||||||||||||
| Metals and mining | 1,074 | 56 | 29 | 1,159 | 1.6 | ||||||||||||||||||||||||
| Oil and gas | 1,928 | 43 | 62 | 2,033 | 2.8 | ||||||||||||||||||||||||
| Public exposure | 2,332 | 25 | 709 | 3,066 | 4.3 | ||||||||||||||||||||||||
| Technology | 741 | 20 | 191 | 952 | 1.2 | ||||||||||||||||||||||||
| Transportation | 1,434 | 144 | 631 | 2,209 | 3.1 | ||||||||||||||||||||||||
| Utilities | 5,239 | 1 | 397 | 5,637 | 7.8 | ||||||||||||||||||||||||
| Other | 496 | 25 | 21 | 542 | .8 | ||||||||||||||||||||||||
| Total | $ | 52,907 | $ | 14,674 | $ | 4,399 | $ | 71,980 | 100.0 | % | |||||||||||||||||||
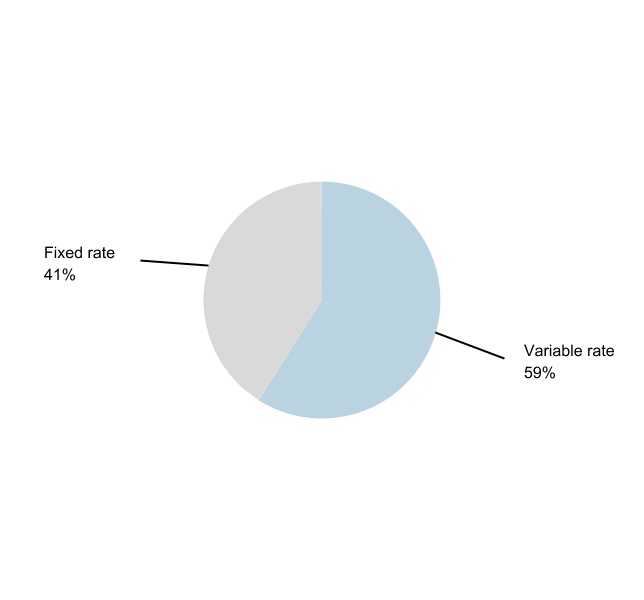
Commercial and industrial. Commercial and industrial loans are the largest component of our loan portfolio, representing 52% of our total loan portfolio at March 31, 2021, and 52% at December 31, 2020. This portfolio is approximately 71% variable rate and consists of loans originated primarily to large corporate, middle market, and small business clients.
Commercial and industrial loans totaled $52.5 billion at March 31, 2021, a decrease of $0.4 billion, or 0.8%, compared to December 31, 2020. The decline was broad-based and spread across most industry categories, reflecting continued declines in commercial line utilization rates, mostly offset by over $2 billion of additional lending related to the PPP during the first quarter of 2021.
Commercial real estate loans. Our commercial real estate portfolio includes both mortgage and construction loans and is conducted through two primary sources: our 15-state banking franchise, and KeyBank Real Estate Capital, a national line of business within the Commercial Bank that cultivates relationships with owners of commercial real estate located both within and beyond the branch system. Nonowner-occupied properties, generally properties for which at least 50% of the debt service is provided by rental income from nonaffiliated third parties, represented 79% of total commercial real estate loans outstanding at March 31, 2021. Construction loans, which provide a stream of
26
funding for properties not fully leased at origination to support debt service payments over the term of the contract or project, represented 14% of commercial real estate loans at period end.
At March 31, 2021, commercial real estate loans totaled $14.8 billion, which includes $12.7 billion of mortgage loans and $2.1 billion of construction loans. Compared to December 31, 2020, this portfolio increased $150 million, or 1.0%. The growth reflects an increase in construction loans as the impact of COVID-19 resulted in a decline in retail, office and hospitality lending. However, we continue to focus primarily on owners of completed and stabilized commercial real estate in accordance with our relationship strategy.
As shown in Figure 12, our commercial real estate loan portfolio includes various property types and geographic
locations of the underlying collateral. These loans include commercial mortgage and construction loans in both
Consumer Bank and Commercial Bank.
Figure 12. Commercial Real Estate Loans
| Geographic Region | Total | Percent of Total | Construction | Commercial Mortgage | |||||||||||||||||||||||||||||||
| dollars in millions | West | Southwest | Central | Midwest | Southeast | Northeast | National | ||||||||||||||||||||||||||||
| March 31, 2021 | |||||||||||||||||||||||||||||||||||
| Nonowner-occupied: | |||||||||||||||||||||||||||||||||||
| Retail properties | $ | 119 | $ | 15 | $ | 127 | $ | 120 | $ | 71 | $ | 434 | $ | 125 | $ | 1,011 | 6.8 | % | $ | 55 | $ | 956 | |||||||||||||
| Multifamily properties | 658 | 271 | 988 | 820 | 1,348 | 1,493 | 161 | 5,739 | 38.7 | 1,559 | 4,180 | ||||||||||||||||||||||||
| Health facilities | 87 | 49 | 81 | 87 | 170 | 479 | 293 | 1,246 | 8.4 | 106 | 1,140 | ||||||||||||||||||||||||
| Office buildings | 287 | — | 272 | 144 | 230 | 597 | 131 | 1,661 | 11.2 | 43 | 1,618 | ||||||||||||||||||||||||
| Warehouses | 53 | 30 | 66 | 18 | 66 | 268 | 120 | 621 | 4.2 | 65 | 556 | ||||||||||||||||||||||||
| Manufacturing facilities | 41 | — | 28 | 20 | 40 | 34 | 47 | 210 | 1.4 | 15 | 195 | ||||||||||||||||||||||||
| Hotels/Motels | 75 | — | 19 | — | 12 | 110 | 91 | 307 | 2.1 | 19 | 288 | ||||||||||||||||||||||||
| Residential properties | — | — | — | 3 | — | 47 | — | 50 | .4 | — | 50 | ||||||||||||||||||||||||
| Land and development | 18 | 5 | — | 2 | 5 | 28 | — | 58 | .4 | 35 | 23 | ||||||||||||||||||||||||
| Other | 125 | 21 | 6 | 99 | 67 | 241 | 305 | 864 | 5.8 | 65 | 799 | ||||||||||||||||||||||||
| Total nonowner-occupied | 1,463 | 391 | 1,587 | 1,313 | 2,009 | 3,731 | 1,273 | 11,767 | 79.4 | 1,962 | 9,805 | ||||||||||||||||||||||||
| Owner-occupied | 960 | 1 | 277 | 488 | 60 | 1,271 | — | 3,057 | 20.6 | 160 | 2,897 | ||||||||||||||||||||||||
| Total | $ | 2,423 | $ | 392 | $ | 1,864 | $ | 1,801 | $ | 2,069 | $ | 5,002 | $ | 1,273 | 14,824 | 100.0 | % | $ | 2,122 | $ | 12,702 | ||||||||||||||
| Nonperforming loans | $ | 1 | — | — | $ | 8 | $ | 4 | $ | 23 | $ | 29 | $ | 65 | N/M | $ | — | $ | 65 | ||||||||||||||||
Accruing loans past due 90 days or more | 1 | — | — | 1 | 3 | 21 | — | 26 | N/M | — | 26 | ||||||||||||||||||||||||
Accruing loans past due 30 through 89 days | 5 | $ | — | $ | 12 | 3 | — | 20 | — | 40 | N/M | 10 | 30 | ||||||||||||||||||||||
| December 31, 2020 | |||||||||||||||||||||||||||||||||||
| Nonowner-occupied: | |||||||||||||||||||||||||||||||||||
| Retail properties | $ | 119 | $ | 15 | $ | 129 | $ | 122 | $ | 72 | $ | 448 | $ | 122 | $ | 1,027 | 6.8 | % | $ | 54 | $ | 973 | |||||||||||||
| Multifamily properties | 685 | 228 | 875 | 800 | 1,284 | 1,493 | 229 | 5,594 | 38.1 | 1,442 | 4,152 | ||||||||||||||||||||||||
| Health facilities | 83 | 53 | 85 | 87 | 170 | 487 | 338 | 1,303 | 8.7 | 91 | 1,212 | ||||||||||||||||||||||||
| Office buildings | 276 | — | 253 | 142 | 193 | 628 | 147 | 1,639 | 11.2 | 48 | 1,591 | ||||||||||||||||||||||||
| Warehouses | 54 | 31 | 66 | 40 | 52 | 259 | 161 | 663 | 4.6 | 74 | 589 | ||||||||||||||||||||||||
| Manufacturing facilities | 42 | — | 28 | 15 | 40 | 34 | 43 | 202 | 1.3 | 10 | 192 | ||||||||||||||||||||||||
| Hotels/Motels | 76 | — | 19 | — | 12 | 107 | 91 | 305 | 2.1 | 18 | 287 | ||||||||||||||||||||||||
| Residential properties | — | — | — | 3 | — | 53 | — | 56 | .4 | — | 56 | ||||||||||||||||||||||||
| Land and development | 15 | 5 | — | 2 | 5 | 28 | — | 55 | .4 | 33 | 22 | ||||||||||||||||||||||||
| Other | 108 | 22 | 6 | 93 | 69 | 245 | 279 | 822 | 6.4 | 65 | 757 | ||||||||||||||||||||||||
| Total nonowner-occupied | 1,458 | 354 | 1,461 | 1,304 | 1,897 | 3,782 | 1,410 | 11,666 | 80.0 | 1,835 | 9,831 | ||||||||||||||||||||||||
| Owner-occupied | 870 | 4 | 275 | 499 | 63 | 1,297 | — | 3,008 | 20.0 | 152 | 2,856 | ||||||||||||||||||||||||
| Total | $ | 2,328 | $ | 358 | $ | 1,736 | $ | 1,803 | $ | 1,960 | $ | 5,079 | $ | 1,410 | $ | 14,674 | 100.0 | % | $ | 1,987 | $ | 12,687 | |||||||||||||
| Nonperforming loans | $ | 1 | — | — | $ | 7 | $ | 6 | $ | 44 | $ | 44 | $ | 103 | N/M | $ | 2 | $ | 85 | ||||||||||||||||
Accruing loans past due 90 days or more | — | — | — | 1 | — | 22 | — | 22 | N/M | 1 | 12 | ||||||||||||||||||||||||
Accruing loans past due 30 through 89 days | 3 | — | — | 2 | 3 | 7 | — | 14 | N/M | 2 | 14 | ||||||||||||||||||||||||
| West – | Alaska, California, Hawaii, Idaho, Montana, Oregon, Washington, and Wyoming | ||||
| Southwest – | Arizona, Nevada, and New Mexico | ||||
| Central – | Arkansas, Colorado, Oklahoma, Texas, and Utah | ||||
| Midwest – | Illinois, Indiana, Iowa, Kansas, Michigan, Minnesota, Missouri, Nebraska, North Dakota, Ohio, South Dakota, and Wisconsin | ||||
| Southeast – | Alabama, Delaware, Florida, Georgia, Kentucky, Louisiana, Maryland, Mississippi, North Carolina, South Carolina, Tennessee, Virginia, Washington D.C., and West Virginia | ||||
| Northeast – | Connecticut, Maine, Massachusetts, New Hampshire, New Jersey, New York, Pennsylvania, Rhode Island, and Vermont | ||||
| National – | Accounts in three or more regions | ||||
27
Consumer loan portfolio
Consumer loans outstanding as of March 31, 2021 totaled $29.5 billion, an increase of $0.3 billion, or 1.1%, from December 31, 2020, driven by growth from the consumer mortgage business and Laurel Road, partly offset by the runoff of indirect auto loans.
The home equity portfolio is comprised of loans originated by our Consumer Bank within our 15-state footprint and is the largest segment of our consumer loan portfolio, representing 31% of consumer loans outstanding at March 31, 2021.
We held the first lien position for approximately 68% of the home equity portfolio at March 31, 2021, and 66% at December 31, 2020. For loans with real estate collateral, we track borrower performance monthly. Regardless of the lien position, credit metrics are refreshed quarterly, including recent FICO scores as well as updated loan-to-value ratios. This information is used in establishing the ALLL. Our methodology is described in Note 1 (“Basis of Presentation and Accounting Policies”) under the heading “Allowance for Loan and Lease Losses” of this report.
Figure 13. Consumer Loans by State
| in millions | Real estate — residential mortgage | Home equity loans | Consumer direct loans | Credit cards | Consumer indirect loans | Total | ||||||||||||||
| March 31, 2021 | ||||||||||||||||||||
| New York | $ | 1,150 | $ | 2,545 | $ | 586 | $ | 323 | $ | 642 | $ | 5,246 | ||||||||
| Ohio | 732 | 1,362 | 476 | 201 | 856 | 3,627 | ||||||||||||||
| Washington | 2,141 | 1,237 | 227 | 80 | 18 | 3,703 | ||||||||||||||
| Pennsylvania | 290 | 642 | 261 | 49 | 481 | 1,723 | ||||||||||||||
| California | 807 | 13 | 332 | 3 | 17 | 1,172 | ||||||||||||||
| Texas | 84 | 7 | 263 | 3 | 9 | 366 | ||||||||||||||
| Colorado | 899 | 317 | 145 | 28 | 5 | 1,394 | ||||||||||||||
| Connecticut | 881 | 345 | 91 | 23 | 124 | 1,464 | ||||||||||||||
| Oregon | 756 | 767 | 98 | 39 | 3 | 1,663 | ||||||||||||||
| Florida | 364 | 57 | 250 | 12 | 29 | 712 | ||||||||||||||
| Other | 2,196 | 1,866 | 2,133 | 148 | 2,099 | 8,442 | ||||||||||||||
| Total | $ | 10,300 | $ | 9,158 | $ | 4,862 | $ | 909 | $ | 4,283 | $ | 29,512 | ||||||||
| December 31, 2020 | ||||||||||||||||||||
| New York | $ | 1,164 | $ | 2,553 | $ | 593 | $ | 353 | $ | 731 | $ | 5,394 | ||||||||
| Ohio | 698 | 1,375 | 479 | 217 | 957 | 3,726 | ||||||||||||||
| Washington | 1,835 | 1,300 | 236 | 86 | 20 | 3,477 | ||||||||||||||
| Pennsylvania | 286 | 648 | 255 | 52 | 539 | 1,780 | ||||||||||||||
| California | 516 | 14 | 303 | 4 | 19 | 856 | ||||||||||||||
| Texas | 74 | 7 | 241 | 3 | 10 | 335 | ||||||||||||||
| Colorado | 828 | 345 | 140 | 30 | 6 | 1,349 | ||||||||||||||
| Connecticut | 914 | 352 | 87 | 25 | 141 | 1,519 | ||||||||||||||
| Oregon | 720 | 782 | 97 | 41 | 4 | 1,644 | ||||||||||||||
| Massachusetts | 239 | 48 | 103 | 5 | 460 | 855 | ||||||||||||||
| Other | 2,024 | 1,936 | 2,180 | 173 | 1,957 | 8,270 | ||||||||||||||
| Total | $ | 9,298 | $ | 9,360 | $ | 4,714 | $ | 989 | $ | 4,844 | $ | 29,205 | ||||||||
Figure 14 summarizes our loan sales for the first three months of 2021 and all of 2020.
Figure 14. Loans Sold (Including Loans Held for Sale)
| in millions | Commercial | Commercial Real Estate | Commercial Lease Financing | Residential Real Estate | Consumer Direct | Total | ||||||||||||||
| 2021 | ||||||||||||||||||||
| First quarter | $ | 124 | $ | 1,930 | $ | 156 | $ | 1,129 | $ | — | $ | 3,339 | ||||||||
| Total | $ | 124 | $ | 1,930 | $ | 156 | $ | 1,129 | $ | — | $ | 3,339 | ||||||||
| 2020 | ||||||||||||||||||||
| Fourth quarter | $ | 197 | $ | 2,412 | $ | 135 | $ | 1,256 | $ | — | $ | 4,000 | ||||||||
| Third quarter | 163 | 1,999 | 67 | 1,235 | 208 | 3,672 | ||||||||||||||
| Second quarter | 82 | 2,661 | 47 | 925 | — | 3,715 | ||||||||||||||
| First quarter | 55 | 2,022 | 81 | 546 | — | 2,704 | ||||||||||||||
| Total | $ | 497 | $ | 9,094 | $ | 330 | $ | 3,962 | $ | 208 | $ | 14,091 | ||||||||
28
Figure 15 shows loans that are either administered or serviced by us, but not recorded on the balance sheet; this includes loans that were sold.
Figure 15. Loans Administered or Serviced
| in millions | March 31, 2021 | December 31, 2020 | September 30, 2020 | June 30, 2020 | March 31, 2020 | ||||||||||||
| Commercial real estate loans | $ | 386,908 | $ | 371,016 | $ | 380,110 | $ | 357,509 | $ | 354,919 | |||||||
| Residential mortgage | 8,838 | 8,311 | 7,670 | 6,922 | 6,405 | ||||||||||||
| Education loans | 489 | 516 | 540 | 567 | 594 | ||||||||||||
| Commercial lease financing | 1,371 | 1,359 | 1,273 | 1,126 | 1,029 | ||||||||||||
| Commercial loans | 695 | 684 | 652 | 623 | 614 | ||||||||||||
| Consumer direct | 1,109 | 1,711 | 1,966 | 1,710 | 1,999 | ||||||||||||
| Total | $ | 399,410 | $ | 383,597 | $ | 392,211 | $ | 368,457 | $ | 365,560 | |||||||
In the event of default by a borrower, we are subject to recourse with respect to approximately $6.0 billion of the $399.4 billion of loans administered or serviced at March 31, 2021. Additional information about this recourse arrangement is included in Note 17 (“Contingent Liabilities and Guarantees”) under the heading “Recourse agreement with FNMA.”
We derive income from several sources when retaining the right to administer or service loans that are sold. We earn noninterest income (recorded as “Consumer mortgage income” and “Commercial mortgage servicing fees”) from fees for servicing or administering loans. This fee income is reduced by the amortization of related servicing assets. In addition, we earn interest income from investing funds generated by escrow deposits collected in connection with the servicing loans. Additional information about our mortgage servicing assets is included in Note 8 (“Mortgage Servicing Assets”).
Securities
Our securities portfolio totaled $40.8 billion at March 31, 2021, compared to $35.2 billion at December 31, 2020. Available-for-sale securities were $33.9 billion at March 31, 2021, compared to $27.6 billion at December 31, 2020. Held-to-maturity securities were $6.9 billion at March 31, 2021, and $7.6 billion at December 31, 2020.
As shown in Figure 16, all of our mortgage-backed securities, which include both securities available-for-sale and held-to-maturity securities, are issued by government-sponsored enterprises or GNMA, and are traded in liquid secondary markets. These securities are recorded on the balance sheet at fair value for the available-for-sale portfolio and at amortized cost for the held-to-maturity portfolio. For more information about these securities, see Note 1 (“Basis of Presentation and Accounting Policies”), Note 5 (“Fair Value Measurements”) under the heading “Qualitative Disclosures of Valuation Techniques,” and Note 6 (“Securities”).
Figure 16. Mortgage-Backed Securities by Issuer
| in millions | March 31, 2021 | December 31, 2020 | ||||||
| FHLMC | $ | 8,969 | $ | 8,782 | ||||
| FNMA | 15,414 | 13,213 | ||||||
| GNMA | 11,442 | 12,109 | ||||||
Total (a) | $ | 35,825 | $ | 34,104 | ||||
(a) Includes securities held in the available-for-sale and held-to-maturity portfolios
Securities available for sale
The majority of our securities available-for-sale portfolio consists of Federal Agency CMOs and mortgage-backed securities. CMOs are debt securities secured by a pool of mortgages or mortgage-backed securities. These mortgage securities generate interest income, serve as collateral to support certain pledging agreements, and provide liquidity value under regulatory requirements.
29
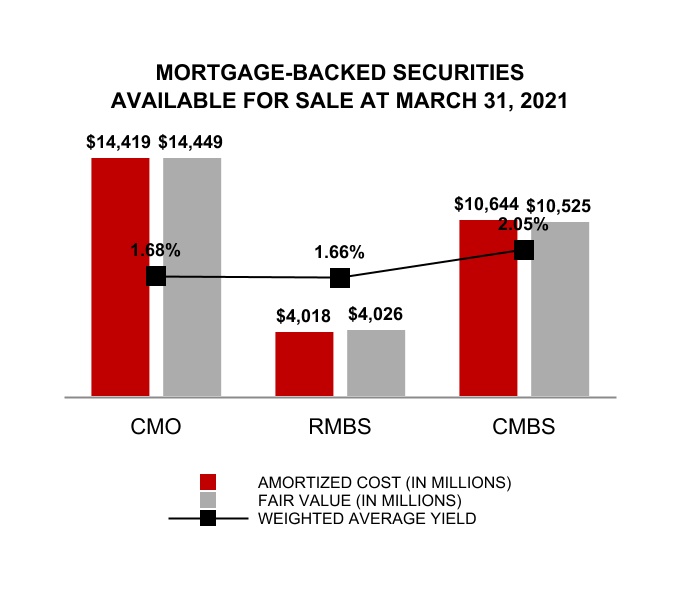
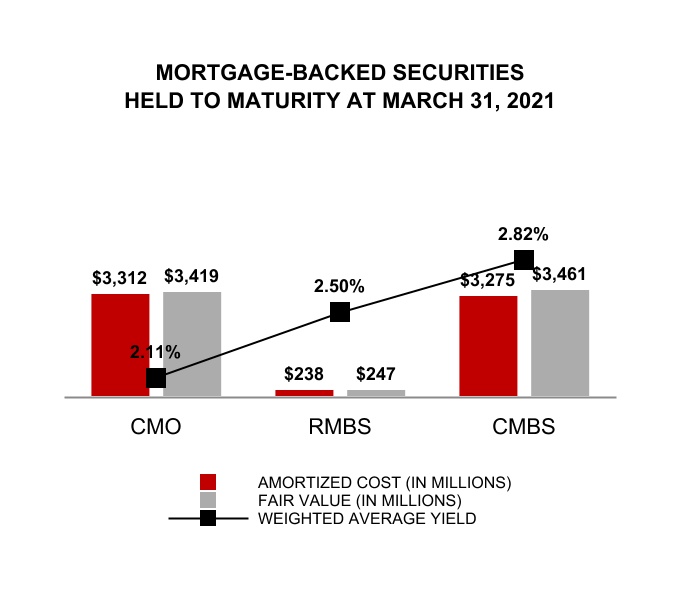
Figure 17 shows the composition, yields, and remaining maturities of our securities available for sale. For more information about these securities, including gross unrealized gains and losses by type of security and securities pledged, see Note 6 (“Securities”).
Figure 17. Securities Available for Sale
| dollars in millions | U.S. Treasury, Agencies, and Corporations | States and Political Subdivisions | Agency Residential Collateralized Mortgage Obligations (a) | Agency Residential Mortgage-backed Securities (a) | Agency Commercial Mortgage-backed Securities (a) | Other Securities | Total | Weighted-Average Yield (b) | ||||||||||||||||||
| March 31, 2021 | ||||||||||||||||||||||||||
| Remaining maturity: | ||||||||||||||||||||||||||
| One year or less | $ | — | — | $ | 878 | $ | 3 | — | $ | 22 | $ | 903 | 1.14 | % | ||||||||||||
| After one through five years | 4,901 | — | 10,550 | 2,664 | $ | 3,118 | — | 21,233 | 1.55 | |||||||||||||||||
| After five through ten years | — | — | 2,804 | 1,357 | 4,236 | — | 8,397 | 1.79 | ||||||||||||||||||
| After ten years | — | — | 217 | 2 | 3,171 | — | 3,390 | 1.46 | ||||||||||||||||||
| Fair value | $ | 4,901 | — | $ | 14,449 | $ | 4,026 | $ | 10,525 | $ | 22 | $ | 33,923 | — | ||||||||||||
| Amortized cost | $ | 4,914 | — | $ | 14,419 | $ | 4,018 | $ | 10,644 | $ | 8 | $ | 34,003 | 1.59 | % | |||||||||||
Weighted-average yield (b) | .29 | % | — | 1.68 | % | 1.66 | % | 2.05 | % | .05 | % | 1.59 | % | — | ||||||||||||
| Weighted-average maturity | 3.0 years | — years | 3.8 years | 4.8 years | 8.1 years | .7 years | 5.1 years | — | ||||||||||||||||||
| December 31, 2020 | ||||||||||||||||||||||||||
| Fair value | $ | 1,000 | — | $ | 14,273 | $ | 2,164 | $ | 10,106 | $ | 13 | $ | 27,556 | — | ||||||||||||
| Amortized cost | 1,000 | — | 14,001 | 2,094 | 9,707 | 8 | 26,810 | 2.09 | % | |||||||||||||||||
(a)Maturity is based upon expected average lives rather than contractual terms.
(b)Weighted-average yields are calculated based on amortized cost. Such yields have been adjusted to a TE basis using the statutory federal income tax rate of 21%.
30
Held-to-maturity securities
Federal agency CMOs and mortgage-backed securities constitute essentially all of our held-to-maturity securities. The remaining balance is comprised of foreign bonds and asset-backed securities. Figure 18 shows the composition, yields, and remaining maturities of these securities.
Figure 18. Held-to-Maturity Securities
| dollars in millions | Agency Residential Collateralized Mortgage Obligations (a) | Agency Residential Mortgage-backed Securities (a) | Agency Commercial Mortgage-backed Securities (a) | Asset-backed securities | Other Securities | Total | Weighted-Average Yield (b) | ||||||||||||||||
| March 31, 2021 | |||||||||||||||||||||||
| Remaining maturity: | |||||||||||||||||||||||
| One year or less | $ | 78 | — | — | $ | 2 | $ | 4 | $ | 84 | 2.18 | % | |||||||||||
| After one through five years | 2,495 | $ | 205 | $ | 1,877 | 14 | 12 | 4,603 | 2.40 | ||||||||||||||
| After five through ten years | 739 | 33 | 1,398 | — | — | 2,170 | 2.62 | ||||||||||||||||
| After ten years | — | — | — | — | — | — | — | ||||||||||||||||
| Amortized cost | $ | 3,312 | $ | 238 | $ | 3,275 | $ | 16 | $ | 16 | $ | 6,857 | 2.46 | % | |||||||||
| Fair value | $ | 3,419 | $ | 247 | $ | 3,461 | $ | 16 | $ | 16 | $ | 7,159 | — | ||||||||||
Weighted-average yield (b) | 2.11 | % | 2.50 | % | 2.82 | % | 1.76 | % | 2.63 | % | 2.46 | % | — | ||||||||||
| Weighted-average maturity | 3.8 years | 4.4 years | 4.9 years | 2.9 years | 2.8 years | 4.3 years | — | ||||||||||||||||
| December 31, 2020 | |||||||||||||||||||||||
| Amortized cost | $ | 3,775 | $ | 271 | $ | 3,515 | 19 | $ | 15 | $ | 7,595 | 2.46 | % | ||||||||||
| Fair value | 3,899 | 285 | 3,805 | 19 | 15 | 8,023 | — | ||||||||||||||||
(a)Maturity is based upon expected average lives rather than contractual terms.
(b)Weighted-average yields are calculated based on amortized cost. Such yields have been adjusted to a TE basis using the statutory federal income tax rate of 21%.
Deposits and other sources of funds
Figure 19. Breakdown of Deposits at March 31, 2021
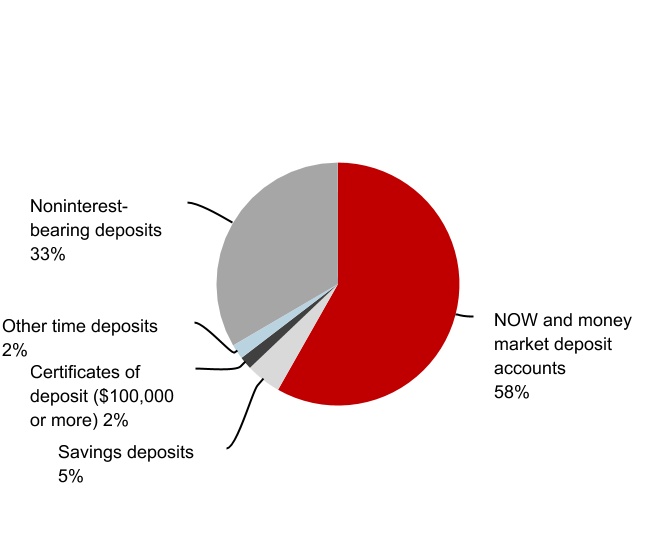
Deposits are our primary source of funding. At March 31, 2021, our deposits totaled $142.2 billion, an increase of $6.9 billion compared to December 31, 2020. The increase was driven by existing relationships and targeted strategic growth of commercial clients, as well as growth from consumer stimulus payments and lower consumer spending.
Wholesale funds, consisting of short-term borrowings and long-term debt, totaled $13.5 billion at March 31, 2021, compared to $14.7 billion at December 31, 2020. Strong deposit growth and elevated levels of liquidity resulted in less reliance on wholesale funds to support the growth in the balance sheet.
Capital
The objective of capital management is to maintain capital levels consistent with our risk appetite and of a sufficient amount to operate under a wide range of economic conditions. We have identified three primary uses of capital:
1. Investing in our businesses, supporting our clients, and loan growth;
31
2. Maintaining or increasing our Common Share dividend; and
3. Returning capital in the form of Common Share repurchases to our shareholders.
The following sections discuss certain ways we have deployed our capital. For further information, see the Consolidated Statements of Changes in Equity and Note 19 (“Shareholders' Equity”).
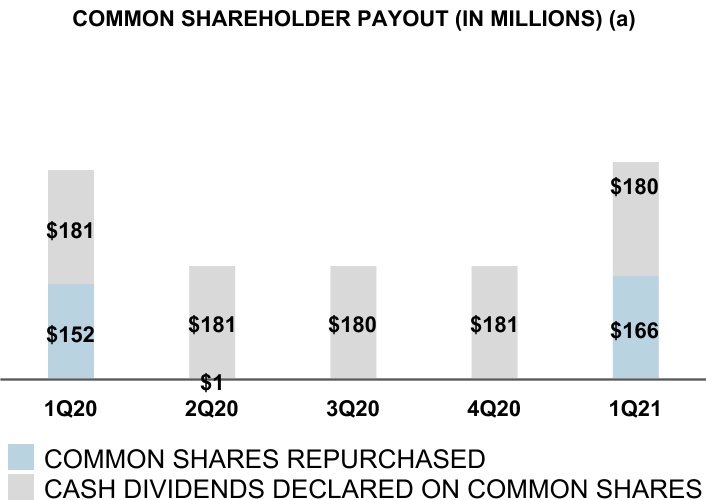
(a)Common Share repurchases which were suspended during the first quarter of 2020 in response to the COVID-19 pandemic have resumed in the first quarter of 2021.
(b)The dividend payout ratio for the first and second quarters of 2020 was impacted by lower EPS which was impacted by the economic fallout from the COVID-19 pandemic.
Dividends
Consistent with our 2020 capital plan, we paid a quarterly dividend of $.185 per Common Share for the first quarter of 2021. Further information regarding the capital planning process and CCAR is included under the heading “Capital planning and stress testing” in the “Supervision and Regulation” section beginning on page 15 of our 2020 Form 10-K.
Common shares outstanding
Our Common Shares are traded on the NYSE under the symbol KEY with 31,754 holders of record at March 31, 2021. Our book value per Common Share was $16.22 based on 972.6 million shares outstanding at March 31, 2021, compared to $16.53 per Common Share based on 975.8 million shares outstanding at December 31, 2020. At March 31, 2021, our tangible book value per Common Share was $13.30, compared to $13.61 per Common Share at December 31, 2020.
Figure 20 shows activities that caused the change in outstanding Common Shares over the past five quarters.
Figure 20. Changes in Common Shares Outstanding
| 2021 | 2020 | |||||||||||||||||||
| in thousands | First | Fourth | Third | Second | First | |||||||||||||||
| Shares outstanding at beginning of period | 975,773 | 976,205 | 975,947 | 975,319 | 977,189 | |||||||||||||||
| Open market repurchases and return of shares under employee compensation plans | (9,277) | (1,092) | (1) | (19) | (7,862) | |||||||||||||||
| Shares issued under employee compensation plans (net of cancellations) | 6,091 | 660 | 259 | 647 | 5,992 | |||||||||||||||
| Shares outstanding at end of period | 972,587 | 975,773 | 976,205 | 975,947 | 975,319 | |||||||||||||||
As shown above, Common Shares outstanding decreased by 3.2 million shares during the first quarter of 2021.
At March 31, 2021, we had 284.1 million treasury shares, compared to 280.9 million treasury shares at December 31, 2020. Going forward we expect to reissue treasury shares as needed in connection with stock-based compensation awards and for other corporate purposes.
Information on repurchases of Common Shares by KeyCorp is included in Part II, Item 2. “Unregistered Sales of Equity Securities and Use of Proceeds” of this report.
32
Capital adequacy
Capital adequacy is an important indicator of financial stability and performance. All of our capital ratios remained in excess of regulatory requirements at March 31, 2021. Our capital and liquidity levels are intended to position us to weather an adverse operating environment while continuing to serve our clients’ needs, as well as to meet the Regulatory Capital Rules described in Item 1. Business of our 2020 Form 10-K under the heading “Supervision and Regulation.” Our shareholders’ equity to assets ratio was 10.01% at March 31, 2021, compared to 10.56% at December 31, 2020. Our tangible common equity to tangible assets ratio was 7.46% at March 31, 2021, compared to 7.93% at December 31, 2020. See the section entitled “GAAP to Non-GAAP Reconciliations,” which presents the computations of certain financial measures related to “tangible common equity.” The minimum capital and leverage ratios under the Regulatory Capital Rules together with the ratios of KeyCorp at March 31, 2021, are set forth in the “Supervision and regulation — Regulatory capital requirements” section in Item 2 of this report.
Figure 21 represents the details of our regulatory capital positions at March 31, 2021, and December 31, 2020, under the Regulatory Capital Rules. Information regarding the regulatory capital ratios of KeyCorp’s banking subsidiaries is presented annually, with the most recent information included in Note 24 (“Shareholders' Equity”) beginning on page 177 of our 2020 Form 10-K.
Figure 21. Capital Components and Risk-Weighted Assets
| dollars in millions | March 31, 2021 | December 31, 2020 | |||||||||
| COMMON EQUITY TIER 1 | |||||||||||
| Key shareholders’ equity (GAAP) | $ | 17,634 | $ | 17,981 | |||||||
| Less: | Preferred Stock (a) | 1,856 | 1,856 | ||||||||
| Add: | CECL phase-in (b) | 322 | 375 | ||||||||
| Common Equity Tier 1 capital before adjustments and deductions | 16,100 | 16,500 | |||||||||
| Less: | Goodwill, net of deferred taxes | 2,564 | 2,560 | ||||||||
| Intangible assets, net of deferred taxes | 138 | 151 | |||||||||
| Deferred tax assets | 11 | 1 | |||||||||
| Net unrealized gains (losses) on available-for-sale securities, net of deferred taxes | 158 | 583 | |||||||||
| Accumulated gains (losses) on cash flow hedges, net of deferred taxes | 248 | 460 | |||||||||
| Amounts in AOCI attributed to pension and postretirement benefit costs, net of deferred taxes | (303) | (306) | |||||||||
| Total Common Equity Tier 1 capital | $ | 13,284 | $ | 13,051 | |||||||
| TIER 1 CAPITAL | |||||||||||
| Common Equity Tier 1 | $ | 13,284 | $ | 13,051 | |||||||
| Additional Tier 1 capital instruments and related surplus | 1,856 | 1,856 | |||||||||
| Less: | Deductions | — | — | ||||||||
| Total Tier 1 capital | 15,140 | 14,907 | |||||||||
| TIER 2 CAPITAL | |||||||||||
| Tier 2 capital instruments and related surplus | 1,658 | 1,657 | |||||||||
Allowance for losses on loans and liability for losses on lending-related commitments (c) | 1,254 | 1,412 | |||||||||
| Less: | Deductions | — | — | ||||||||
| Total Tier 2 capital | 2,912 | 3,069 | |||||||||
| Total risk-based capital | $ | 18,052 | $ | 17,976 | |||||||
| RISK-WEIGHTED ASSETS | |||||||||||
| Risk-weighted assets on balance sheet | $ | 102,878 | $ | 103,604 | |||||||
| Risk-weighted off-balance sheet exposure | 29,392 | 29,240 | |||||||||
| Market risk-equivalent assets | 2,046 | 1,354 | |||||||||
| Gross risk-weighted assets | 134,316 | 134,198 | |||||||||
| Less: | Excess allowance for loan and lease losses | — | — | ||||||||
| Net risk-weighted assets | $ | 134,316 | $ | 134,198 | |||||||
| AVERAGE QUARTERLY TOTAL ASSETS | $ | 170,220 | $ | 166,771 | |||||||
| CAPITAL RATIOS | |||||||||||
| Tier 1 risk-based capital | 11.27 | % | 11.11 | % | |||||||
| Total risk-based capital | 13.44 | % | 13.40 | % | |||||||
Leverage (d) | 8.89 | % | 8.94 | % | |||||||
| Common Equity Tier 1 | 9.89 | % | 9.73 | % | |||||||
(a)Net of capital surplus.
(b)Amount reflects our decision to adopt the CECL transitional provision.
(c)The ALLL included in Tier 2 capital is limited by regulation to 1.25% of the institution’s standardized total risk-weighted assets (excluding its standardized market risk-weighted assets). The ALLL includes $33 million and $36 million of allowance classified as “discontinued assets” on the balance sheet at March 31, 2021, and December 31, 2020, respectively.
(d)This ratio is Tier 1 capital divided by average quarterly total assets as defined by the Federal Reserve less: (i) goodwill, (ii) the disallowed intangible and deferred tax assets, and (iii) other deductions from assets for leverage capital purposes.
33
Risk Management
Overview
Like all financial services companies, we engage in business activities and assume the related risks. The most significant risks we face are credit, compliance, operational, liquidity, market, reputation, strategic, and model risks. Our risk management activities are focused on ensuring that we properly identify, measure, and manage such risks across the entire enterprise to maintain safety and soundness, and to maximize profitability. There have been no significant changes in our Risk Management practices as described under the heading “Risk Management” beginning on page 72 of our 2020 Form 10-K.
Market risk management
Market risk is the risk that movements in market risk factors, including interest rates, foreign exchange rates, equity prices, commodity prices, credit spreads, and volatilities will reduce Key’s income and the value of its portfolios. These factors influence prospective yields, values, or prices associated with the instrument. We are exposed to market risk both in our trading and nontrading activities, which include asset and liability management activities. Information regarding our fair value policies, procedures, and methodologies is provided in Note 1 (“Summary of Significant Accounting Policies”) under the heading “Fair Value Measurements” on page 112 of our 2020 Form 10-K and Note 5 (“Fair Value Measurements”) in this report.
Trading market risk
Key incurs market risk as a result of trading activities that are used in support of client facilitation and hedging activities, principally within our investment banking and capital markets businesses. Key has exposures to a wide range of risk factors including interest rates, equity prices, foreign exchange rates, credit spreads, and commodity prices, as well as the associated implied volatilities and spreads. Our primary market risk exposures are a result of trading and hedging activities in the derivative and fixed income markets, including securitization positions exposures. At March 31, 2021, we did not have any re-securitization positions. We maintain modest trading inventories to facilitate customer flow, make markets in securities, and hedge certain risks including but not limited to credit risk and interest rate risk. The risks associated with these activities are mitigated in accordance with the Market Risk hedging policy. The majority of our positions are traded in active markets.
Market risk management is an integral part of Key’s risk culture. The Risk Committee of our Board provides oversight of trading market risks. The ERM Committee and the Market Risk Committee regularly review and discuss market risk reports prepared by our MRM that contain our market risk exposures and results of monitoring activities. Market risk policies and procedures have been defined and approved by the Market Risk Committee, a Tier 2 Risk Governance Committee, and take into account our tolerance for risk and consideration for the business environment. For more information regarding monitoring of trading positions and the activities related to the Market Risk Rule compliance, see ”Market Risk Management” beginning on page 73 of our 2020 Form 10-K.
VaR and stressed VaR. VaR is the estimate of the maximum amount of loss on an instrument or portfolio due to adverse market conditions during a given time interval within a stated confidence level. Stressed VaR is used to assess extreme conditions on market risk within our trading portfolios. The MRM calculates VaR and stressed VaR on a daily basis, and the results are distributed to appropriate management. VaR and stressed VaR results are also provided to our regulators and utilized in regulatory capital calculations.
We use a historical simulation VaR model to measure the potential adverse effect of changes in interest rates, foreign exchange rates, equity prices, and credit spreads on the fair value of our covered positions and other non-covered positions. We analyze market risk by portfolios and do not separately measure and monitor our portfolios by risk type. Historical scenarios are customized for specific positions, and numerous risk factors are incorporated in the calculation. Additional consideration is given to the risk factors to estimate the exposures that contain optionality features, such as options and cancelable provisions. VaR is calculated using daily observations over a one-year time horizon and approximates a 95% confidence level. Statistically, this means that we would expect to incur losses greater than VaR, on average, five out of 100 trading days, or three to four times each quarter. We also calculate VaR and stressed VaR at a 99% confidence level. For more information regarding our VaR model, its governance and assumptions, see ”Market Risk Management” on page 73 of our 2020 Form 10-K.
34
Actual losses for the total covered portfolios did not exceed aggregate daily VaR at any day during the quarter ended March 31, 2021. Actual losses for the total covered portfolios exceeded aggregate daily VaR at a 99% confidence level and one day holding period twice during the quarter ended March 31, 2020, due to market volatility related to COVID-19. The MRM backtests our VaR model on a daily basis to evaluate its predictive power. The test compares VaR model results at the 99% confidence level to daily held profit and loss. Results of backtesting are provided to the Market Risk Committee. Backtesting exceptions occur when trading losses exceed VaR. We do not engage in correlation trading or utilize the internal model approach for measuring default and credit migration risk. Our net VaR approach incorporates diversification, but our VaR calculation does not include the impact of counterparty risk and our own credit spreads on derivatives.
The aggregate VaR at the 99% confidence level with a one day holding period for all covered positions was $2.5 million at March 31, 2021, and $3.0 million at March 31, 2020. Figure 22 summarizes our VaR at the 99% confidence level with a one day holding period for significant portfolios of covered positions for the three months ended March 31, 2021, and March 31, 2020.
Figure 22. VaR for Significant Portfolios of Covered Positions
| 2021 | 2020 | ||||||||||||||||||||||||||||
| Three months ended March 31, | Three months ended March 31, | ||||||||||||||||||||||||||||
| in millions | High | Low | Mean | March 31, | High | Low | Mean | March 31, | |||||||||||||||||||||
| Trading account assets: | |||||||||||||||||||||||||||||
| Fixed income | $ | 6.4 | $ | 2.0 | $ | 4.0 | $ | 2.1 | $ | 3.3 | $ | .5 | $ | 1.2 | $ | 2.6 | |||||||||||||
| Derivatives: | |||||||||||||||||||||||||||||
| Interest rate | $ | .6 | .2 | $ | .4 | $ | .2 | $ | .3 | .1 | $ | .1 | $ | .3 | |||||||||||||||
Stressed VaR is calculated by running the portfolios through a predetermined stress period which is approved by the Market Risk Committee and is calculated at the 99% confidence level using the same model and assumptions used for general VaR. The aggregate stressed VaR for all covered positions was $6.2 million at March 31, 2021, and $4.1 million at March 31, 2020. Figure 23 summarizes our stressed VaR at the 99% confidence level with a one day holding period for significant portfolios of covered positions for the three months ended March 31, 2021, and March 31, 2020.
Figure 23. Stressed VaR for Significant Portfolios of Covered Positions
| 2021 | 2020 | ||||||||||||||||||||||||||||
| Three months ended March 31, | Three months ended March 31, | ||||||||||||||||||||||||||||
| in millions | High | Low | Mean | March 31, | High | Low | Mean | March 31, | |||||||||||||||||||||
| Trading account assets: | |||||||||||||||||||||||||||||
| Fixed income | $ | 6.6 | $ | 2.0 | $ | 4.5 | $ | 5.5 | $ | 5.1 | $ | 2.2 | $ | 3.8 | $ | 3.7 | |||||||||||||
| Derivatives: | |||||||||||||||||||||||||||||
| Interest rate | $ | .6 | $ | .2 | $ | .4 | $ | .4 | $ | 1.0 | $ | .1 | $ | .3 | $ | .2 | |||||||||||||
Internal capital adequacy assessment. Market risk is a component of our internal capital adequacy assessment. Our risk-weighted assets include a market risk-equivalent asset amount, which consists of a VaR component, stressed VaR component, a de minimis exposure amount, and a specific risk add-on including the securitization positions. The aggregate market value of the securitization positions as defined by the Market Risk Rule was $33 million at March 31, 2021, all of which were mortgage-backed security positions. Specific risk is the price risk of individual financial instruments, which is not accounted for by changes in broad market risk factors and is measured through a standardized approach. Market risk weighted assets, including the specific risk calculations, are run quarterly by the MRM in accordance with the Market Risk Rule, and approved by the Chief Market Risk Officer.
Nontrading market risk
Most of our nontrading market risk is derived from interest rate fluctuations and its impacts on our traditional loan and deposit products, as well as investments, hedging relationships, long-term debt, and certain short-term borrowings. Interest rate risk, which is inherent in the banking industry, is measured by the potential for fluctuations in net interest income and the EVE. Such fluctuations may result from changes in interest rates and differences in the repricing and maturity characteristics of interest-earning assets and interest-bearing liabilities. We manage the exposure to changes in net interest income and the EVE in accordance with our risk appetite and in accordance with the Board approved ERM policy.
35
Interest rate risk positions are influenced by a number of factors, including the balance sheet positioning that arises out of customer preferences for loan and deposit products, economic conditions, the competitive environment within our markets, changes in market interest rates that affect client activity, and our hedging, investing, funding, and capital positions. The primary components of interest rate risk exposure consist of reprice risk, basis risk, yield curve risk, and option risk.
•“Reprice risk” is the exposure to changes in the level of interest rates and occurs when the volume of interest-bearing liabilities and the volume of interest-earning assets they fund (e.g., deposits used to fund loans) do not mature or reprice at the same time.
•“Basis risk” is the exposure to asymmetrical changes in interest rate indexes and occurs when floating-rate assets and floating-rate liabilities reprice at the same time, but in response to different market factors or indexes.
•“Yield curve risk” is the exposure to nonparallel changes in the slope of the yield curve (where the yield curve depicts the relationship between the yield on a particular type of security and its term to maturity) and occurs when interest-bearing liabilities and the interest-earning assets that they fund do not price or reprice to the same term point on the yield curve.
•“Option risk” is the exposure to a customer or counterparty’s ability to take advantage of the interest rate environment and terminate or reprice one of our assets, liabilities, or off-balance sheet instruments prior to contractual maturity without a penalty. Option risk occurs when exposures to customer and counterparty early withdrawals or prepayments are not mitigated with an offsetting position or appropriate compensation.
The management of nontrading market risk is centralized within Corporate Treasury. The Risk Committee of our Board provides oversight of nontrading market risk. The ERM Committee and the ALCO review reports on the interest rate risk exposures described above. In addition, the ALCO reviews reports on stress tests and sensitivity analyses related to interest rate risk. These committees have various responsibilities related to managing nontrading market risk, including recommending, approving, and monitoring strategies that maintain risk positions within approved tolerance ranges. The A/LM policy provides the framework for the oversight and management of interest rate risk and is administered by the ALCO. The MRM, as the second line of defense, provides additional oversight.
LIBOR Transition
As disclosed in Item 1A. Risk Factors of our 2020 Form 10-K, LIBOR in its current form will generally not be available after 2021 for new contracts and will cease publishing all tenors entirely after June 30, 2023. For most products, the most likely replacement rate is expected to be SOFR, which has been recommended by the ARRC, although uncertainty remains as to whether new benchmarks may evolve and a different credit sensitive benchmark could instead become the market-accepted benchmark. The Federal Reserve and the OCC have encouraged financial institutions not to wait for the end of 2021 to make the transition away from LIBOR. We have established an enterprise wide program to identify and address all LIBOR transition issues. We are collaborating closely with regulators and industry groups on the transition and closely monitoring developments in industry practices related to LIBOR alternatives. The goals of our LIBOR transition program are to:
•Identify and analyze LIBOR-based exposure and develop and execute transition strategies;
•Review and update near-term strategies and actions for our current LIBOR-based business currently being written;
•Assess financial impact and risk while planning and executing mitigation actions;
•Understand and strategically address the current market approach to LIBOR and SOFR;
•Determine and execute system and process work to be operationally ready for SOFR or additional credit sensitive benchmarks; and
•Originate new loans using SOFR.
As part of the LIBOR transition program, we completed an initial risk assessment to help us identify the impact and risks associated with various products, systems, processes, and models. This risk assessment has assisted us in making necessary updates to our infrastructure and operational systems and processes to implement a replacement rate, and we are progressing on schedule to be operationally ready for SOFR. We have compiled an inventory of existing legal contracts that are impacted by the LIBOR transition. We are assessing the LIBOR fallback language in those contracts and are devising a strategy to address the LIBOR transition for those contracts. We have also focused on refining LIBOR fallback language in new legal contracts including requiring the use of robust fallback language. Our progress is well-paced, especially as many of the legacy contracts will be provided additional
36
time to remediate due to announcements by the ICE Benchmark Administration, the FCA-regulated and authorized administrator of LIBOR, that certain LIBOR tenors may continue until June 2023 for legacy contract purposes. In addition, we are on schedule with executing a strategy to address the LIBOR transition for contracts that must transition by the end of 2021. We expect to leverage recommendations made by the ARRC and ISDA that are tailored to our specific client segments.
Net interest income simulation analysis. The primary tool we use to measure our interest rate risk is simulation analysis. For purposes of this analysis, we estimate our net interest income based on the current and projected composition of our on- and off-balance sheet positions, accounting for recent and anticipated trends in customer activity. The analysis also incorporates assumptions for the current and projected interest rate environments and balance sheet growth projections based on a most likely macroeconomic view. The modeling incorporates investment portfolio and swap portfolio balances consistent with management's desired interest rate risk positioning. The simulation model estimates the amount of net interest income at risk by simulating the change in net interest income that would occur if rates were to gradually increase or decrease from current levels over the next 12 months (subject to a floor on market interest rates at zero).
Figure 24 presents the results of the simulation analysis at March 31, 2021, and March 31, 2020. At March 31, 2021, our simulated impact to changes in interest rates was modest. The exposure to declining rates has decreased from an elevated level at March 31, 2020 that was a result of a short term widening of the spread between the Fed Funds Target Rate and LIBOR. As LIBOR declined and the relationship between the two short term market rates normalized, the exposure to declining rates decreased. Exposure to declining rates remains nominal given the low level of market rates in comparison to the floor utilized in the scenario. Tolerance levels for risk management require the development of remediation plans to maintain residual risk within tolerance if simulation modeling demonstrates that a gradual, parallel 200 basis point increase or 200 basis point decrease in interest rates over the next 12 months would adversely affect net interest income over the same period by more than 5.5%. Current modeled exposure is within Board approved tolerances.
Figure 24. Simulated Change in Net Interest Income
| March 31, 2021 | March 31, 2020 | |||||||||||||||||||||||||
| Basis point change assumption (short-term rates) | -200 | +200 | -200 | 200 | ||||||||||||||||||||||
| Assumed floor in market rates (in basis points) | — | N/A | — | N/A | ||||||||||||||||||||||
| Tolerance level | -5.50 | % | -5.50 | % | -5.50 | % | -5.50 | % | ||||||||||||||||||
| Interest rate risk assessment | -2.89 | % | 4.75 | % | -4.97 | % | 5.95 | % | ||||||||||||||||||
Simulation analysis produces a sophisticated estimate of interest rate exposure based on assumptions input into the model. We tailor certain assumptions to the specific interest rate environment and yield curve shape being modeled and validate those assumptions on a regular basis. However, actual results may differ from those derived in simulation analysis due to unanticipated changes to the balance sheet composition, customer behavior, product pricing, market interest rates, changes in management’s desired interest rate risk positioning, investment, funding and hedging activities, and repercussions from unanticipated or unknown events.
We also perform regular stress tests and sensitivity analyses on the model inputs that could materially change the resulting risk assessments. Assessments are performed using different shapes of the yield curve, including steepening or flattening of the yield curve, immediate changes in market interest rates, and changes in the relationship of money market interest rates. Assessments are also performed on changes to the following assumptions: loan and deposit balances, the pricing of deposits without contractual maturities, changes in lending spreads, prepayments on loans and securities, investment, funding and hedging activities, and liquidity and capital management strategies.
The results of additional assessments indicate that net interest income could increase or decrease from the base simulation results presented in Figure 24. Net interest income is highly dependent on the timing, magnitude, frequency, and path of interest rate changes and the associated assumptions for deposit repricing relationships, lending spreads, and the balance behavior of transaction accounts. If fixed rate assets increase by $1 billion, or fixed rate liabilities decrease by $1 billion, then the benefit to rising rates would decrease by approximately 25 basis points. If the interest-bearing liquid deposit beta assumption increases or decreases by 5% (e.g., 40% to 45%), then the benefit to rising rates would decrease or increase by approximately 120 basis points.
Our current interest rate risk position could fluctuate to higher or lower levels of risk depending on the competitive environment and client behavior that may affect the actual volume, mix, maturity, and repricing characteristics of loan and deposit flows. Corporate Treasury discretionary activities related to funding, investing, and hedging may
37
also change as a result of changes in customer business flows or changes in management’s desired interest rate risk positioning. As changes occur to both the configuration of the balance sheet and the outlook for the economy, management proactively evaluates hedging opportunities that may change our interest rate risk profile.
We also conduct simulations that measure the effect of changes in market interest rates in the second and third years of a three-year horizon. These simulations are conducted in a manner similar to those based on a 12-month horizon. To capture longer-term exposures, we calculate exposures to changes of the EVE as discussed in the following section.
Economic value of equity modeling. EVE complements net interest income simulation analysis as it estimates risk exposure beyond 12-, 24-, and 36-month horizons. EVE modeling measures the extent to which the economic values of assets, liabilities, and off-balance sheet instruments may change in response to fluctuations in interest rates. EVE is calculated by subjecting the balance sheet to an immediate increase or decrease in interest rates, measuring the resulting change in the values of assets, liabilities, and off-balance sheet instruments, and comparing those amounts with the base case of the current interest rate environment. The interest rate shock scenarios are equal to the current Fed Target Rate capped at 200 basis points. In the current low rate environment, the declining shock scenario is reduced with a 100 basis point minimum. This analysis is highly dependent upon assumptions applied to assets and liabilities with non-contractual maturities. Those assumptions are based on historical behaviors, as well as our expectations. We develop remediation plans that would maintain residual risk within tolerance if this analysis indicates that our EVE will decrease by more than 15% in response to an immediate increase or decrease in interest rates. We are operating within these guidelines as of March 31, 2021.
Management of interest rate exposure. We use the results of our various interest rate risk analyses to formulate A/LM strategies to achieve the desired risk profile while managing to our objectives for capital adequacy and liquidity risk exposures. Specifically, we manage interest rate risk positions by purchasing securities, issuing term debt with floating or fixed interest rates, and using derivatives. We predominantly use interest rate swaps and options, which modify the interest rate characteristics of certain assets and liabilities.
Figure 25 shows all swap positions that we hold for A/LM purposes. These positions are used to convert the contractual interest rate index of agreed-upon amounts of assets and liabilities (i.e., notional amounts) to another interest rate index. For example, fixed-rate debt is converted to a floating rate through a “receive fixed/pay variable” interest rate swap. The volume, maturity, and mix of portfolio swaps change frequently as we adjust our broader A/LM objectives and the balance sheet positions to be hedged. For more information about how we use interest rate swaps to manage our risk profile, see Note 7 (“Derivatives and Hedging Activities”).
Figure 25. Portfolio Swaps by Interest Rate Risk Management Strategy
| March 31, 2021 | ||||||||||||||||||||||||||||||||
| Weighted-Average | December 31, 2020 | |||||||||||||||||||||||||||||||
| dollars in millions | Notional Amount | Fair Value | Maturity (Years) | Receive Rate | Pay Rate | Notional Amount | Fair Value | |||||||||||||||||||||||||
| Receive fixed/pay variable — conventional A/LM (a) | $ | 25,785 | $ | 344 | 2.7 | 1.4 | % | .1 | % | $ | 21,035 | $ | 632 | |||||||||||||||||||
| Receive fixed/pay variable — conventional debt | 6,902 | 210 | 4.0 | 1.9 | .1 | 7,787 | 415 | |||||||||||||||||||||||||
| Receive fixed/pay variable — forward A/LM | — | — | — | — | — | — | — | |||||||||||||||||||||||||
| Pay fixed/receive variable — conventional debt | 50 | (7) | 7.3 | .2 | 3.6 | 50 | (11) | |||||||||||||||||||||||||
| Pay fixed/receive variable — forward securities | 3,880 | 287 | 10.9 | .6 | 1.0 | 2,080 | 21 | |||||||||||||||||||||||||
| Total portfolio swaps | $ | 36,617 | $ | 834 | (c) | 3.8 | 1.5 | % | .2 | % | $ | 30,952 | $ | 1,057 | (c) | |||||||||||||||||
| Floors — conventional A/LM — purchased (b) | $ | 5,000 | $ | 11 | .6 | — | — | $ | 5,000 | 17 | ||||||||||||||||||||||
| Floors — conventional A/LM — sold (b) | — | — | — | — | — | — | — | |||||||||||||||||||||||||
| Total floors | $ | 5,000 | $ | 11 | 1.0 | — | — | $ | 5,000 | 17 | ||||||||||||||||||||||
(a)Portfolio swaps designated as A/LM are used to manage interest rate risk tied to both assets and liabilities
(b)Conventional A/LM and forward A/LM floors do not have a stated receive rate or pay rate and are given a strike price on the option.
(c)Excludes accrued interest of $127 million and $145 million at March 31, 2021, and December 31, 2020, respectively.
Liquidity risk management
Liquidity risk, which is inherent in the banking industry, is measured by our ability to accommodate liability maturities and deposit withdrawals, meet contractual obligations, and fund new business opportunities at a reasonable cost, in a timely manner, and without adverse consequences. Liquidity management involves maintaining sufficient and diverse sources of funding to accommodate planned, as well as unanticipated, changes in assets and liabilities under both normal and adverse conditions.
38
Factors affecting liquidity
Our liquidity could be adversely affected by both direct and indirect events. An example of a direct event would be a downgrade in our public credit ratings by a rating agency. Examples of indirect events (events unrelated to us) that could impair our access to liquidity would be an act of terrorism or war, natural disasters, global pandemics (including COVID-19), political events, or the default or bankruptcy of a major corporation, mutual fund, or hedge fund. Similarly, market speculation, or rumors about us or the banking industry in general, may adversely affect the cost and availability of normal funding sources. See Part I, Item 1A. Risk Factors section “IV. Liquidity Risk” in our 2020 Form 10-K for a discussion of how the COVID-19 global pandemic has impacted our liquidity and may continue to impact it in the future.
Our credit ratings at March 31, 2021, are shown in Figure 26. We believe these credit ratings, under normal conditions in the capital markets, would enable KeyCorp or KeyBank to issue fixed income securities to investors.
Figure 26. Credit Ratings
| March 31, 2021 | Short-Term Borrowings | Long-Term Deposits (a) | Senior Long-Term Debt | Subordinated Long-Term Debt | Capital Securities | Preferred Stock | ||||||||||||||
KEYCORP (THE PARENT COMPANY) | ||||||||||||||||||||
Standard & Poor’s | A-2 | N/A | BBB+ | BBB | BB+ | BB+ | ||||||||||||||
Moody’s | P-2 | N/A | Baa1 | Baa1 | Baa2 | Baa3 | ||||||||||||||
Fitch Ratings, Inc. | F1 | N/A | A- | BBB+ | BB+ | BB+ | ||||||||||||||
DBRS, Inc. | R-1 (low) | N/A | A | A (low) | A (low) | BBB | ||||||||||||||
KEYBANK | ||||||||||||||||||||
Standard & Poor’s | A-2 | N/A | A- | BBB+ | N/A | N/A | ||||||||||||||
Moody’s | P-2 | P-1/Aa3 | A3 | Baa1 | N/A | N/A | ||||||||||||||
Fitch Ratings, Inc. | F1 | A | A- | BBB+ | N/A | N/A | ||||||||||||||
DBRS, Inc. | R-1 (middle) | A (high) | A (high) | A | N/A | N/A | ||||||||||||||
(a)P-1 rating assigned by Moody’s is specific to KeyBank’s short-term bank deposit ratings.
Sources of liquidity
Our primary sources of funding for KeyBank include customer deposits, wholesale funding, and liquid assets. As of March 31, 2021, our consolidated loan-to-deposit ratio was 73%. In addition, we also have access to various sources of wholesale funding, maintain a portfolio of liquid assets, and have borrowing capacity at the FHLB and Federal Reserve Bank of Cleveland. Our liquid asset portfolio at March 31, 2021, totaled $41.0 billion, consisting of $25.9 billion of unpledged securities, $49.2 million of securities available for secured funding at the FHLB, and $15.1 billion of net balances of federal funds sold and balances in our Federal Reserve account. Additionally, as of March 31, 2021, our unused borrowing capacity secured by loan collateral was $22.7 billion at the Federal Reserve Bank of Cleveland and $9.2 billion at the FHLB. During the first quarter of 2021, our secured term borrowings decreased $1.4 million as advances were paid down. If the cash flows needed to support operating and investing activities are not satisfied by deposit balances, we rely on wholesale funding or on-balance sheet liquid reserves. Conversely, excess cash generated by operating, investing, and deposit-gathering activities may be used to repay outstanding debt or invest in liquid assets.
Liquidity for KeyCorp
The primary source of liquidity for KeyCorp is from subsidiary dividends, primarily from KeyBank. KeyCorp has sufficient liquidity when it can service its debt; support customary corporate operations and activities (including acquisitions); support occasional guarantees of subsidiaries’ obligations in transactions with third parties at a reasonable cost, in a timely manner, and without adverse consequences; and fund capital distributions in the form of dividends and share buybacks.
At March 31, 2021, KeyCorp held $2.7 billion in cash, which we projected to be sufficient to meet our projected obligations, including the repayment of our maturing debt obligations for the periods prescribed by our risk tolerance.
Typically, KeyCorp meets its liquidity requirements through regular dividends from KeyBank, supplemented with term debt. During the first quarter of 2021, KeyBank paid $375 million in cash dividends to KeyCorp. As of March 31, 2021, KeyBank had regulatory capacity to pay $975 million in dividends to KeyCorp without prior regulatory approval.
39
Our liquidity position and recent activity
Over the past quarter, our liquid asset portfolio, which includes overnight and short-term investments, as well as unencumbered, high quality liquid securities held as protection against a range of potential liquidity stress scenarios, has increased as a result of an increase in unpledged securities, which was partially offset by a decrease in cash held at the Federal Reserve. The liquid asset portfolio continues to exceed the amount that we estimate would be necessary to manage through an adverse liquidity event by providing sufficient time to develop and execute a longer-term solution.
From time to time, KeyCorp or KeyBank may seek to retire, repurchase, or exchange outstanding debt, capital securities, preferred shares, or Common Shares through cash purchase, privately negotiated transactions or other means. Additional information on repurchases of Common Shares by KeyCorp is included in Part II, Item 5. Market for the Registrant’s Common Equity, Related Stockholder Matters and Issuer Purchases of Equity Securities beginning on page 39 of our 2020 Form 10-K. Such transactions depend on prevailing market conditions, our liquidity and capital requirements, contractual restrictions, regulatory requirements, and other factors. The amounts involved may be material, individually or collectively.
The Consolidated Statements of Cash Flows summarize our sources and uses of cash by type of activity for the three-month periods ended March 31, 2021, and March 31, 2020.
For more information regarding liquidity governance structure, factors affecting liquidity, management of liquidity risk at KeyBank and KeyCorp, long-term liquidity strategies, and other liquidity programs, see ”Liquidity Risk Management” beginning on page 79 of our 2020 Form 10-K.
Credit risk management
Credit risk is the risk of loss arising from an obligor’s inability or failure to meet contractual payment or performance terms. Like other financial services institutions, we make loans, extend credit, purchase securities, provide financial and payments products, and enter into financial derivative contracts, all of which have related credit risk.
Credit policy, approval, and evaluation
We manage credit risk exposure through a multifaceted program. The Credit Risk Committee approves management credit policies and recommends significant credit policies to the Enterprise Risk Management Committee, the KeyBank Board, and the Risk Committee of the Board for approval. These policies are communicated throughout the organization to foster a consistent approach to granting credit. As a result of the current economic environment, our commercial loan portfolio is going through active portfolio surveillance which is described in more detail in the section entitled “Loans and loans held for sale — Commercial loan portfolio.”
Our credit risk management team and certain individuals within our lines of business, to whom credit risk management has delegated limited credit authority, are responsible for credit approval. Individuals with assigned credit authority are authorized to grant exceptions to credit policies. It is not unusual to make exceptions to established policies when mitigating circumstances dictate, however, a corporate level tolerance has been established to keep exceptions at an acceptable level based upon portfolio and economic considerations.
Our credit risk management team uses risk models to evaluate consumer loans. These models, known as scorecards, forecast the probability of serious delinquency and default for an applicant. The scorecards are embedded in the application processing system, which allows for real-time scoring and automated decisions for many of our products. We periodically validate the loan scoring processes.
We maintain an active concentration management program to mitigate concentration risk in our credit portfolios. For individual obligors, we employ a sliding scale of exposure, known as hold limits, which is dictated by the type of loan and strength of the borrower.
40
Allowance for loan and lease losses
We estimate the appropriate level of the ALLL on at least a quarterly basis. The methodology used is described in Note 1 (“Basis of Presentation and Accounting Policies”) under the heading “Allowance for Loan and Lease Losses” beginning on page 110 of our 2020 Form 10-K. Briefly, the ALLL estimate uses various models and estimation techniques based on our historical loss experience, current borrower characteristics, current conditions, reasonable and supportable forecasts and other relevant factors. As described in Note 1 (“Summary of Significant Accounting Policies”) of our 2020 Form 10-K, on January 1, 2020, we adopted ASC 326, Financial Instruments — Credit Losses, and as such, an expected credit loss methodology, specifically current expected credit losses for the remaining life of our loans and leases, is used to estimate the appropriate level of the ALLL. The ALLL at March 31, 2021, represents our best estimate of the lifetime expected credit losses inherent in the loan portfolio at that date.
As shown in Figure 27, our ALLL from continuing operations decreased by $188 million, or 11.6%, from December 31, 2020. The commercial ALLL decreased by $162 million, or 14.7%, from December 31, 2020, through March 31, 2021, driven by updated economic forecasts that reflect improved economic outlooks, as well as favorable commercial portfolio asset quality migration. Our consumer ALLL decreased by $26 million, or 4.9%, from December 31, 2020, through March 31, 2021, driven by updated economic forecasts that reflect improved economic outlooks.
Figure 27. Allocation of the Allowance for Loan and Lease Losses
| March 31, 2021 | December 31, 2020 | ||||||||||||||||||||||
| dollars in millions | Amount | Percent of Allowance to Total Allowance | Percent of Loan Type to Total Loans | Amount | Percent of Allowance to Total Allowance | Percent of Loan Type to Total Loans | |||||||||||||||||
| Commercial and industrial | $ | 596 | 41.4 | % | 52.0 | % | $ | 678 | 41.7 | % | 52.3 | % | |||||||||||
| Commercial real estate: | |||||||||||||||||||||||
| Commercial mortgage | 256 | 17.8 | 12.6 | 327 | 20.1 | 12.5 | |||||||||||||||||
| Construction | 45 | 3.1 | 2.1 | 47 | 2.9 | 2.0 | |||||||||||||||||
| Total commercial real estate loans | 301 | 20.9 | 14.7 | 374 | 23.0 | 14.5 | |||||||||||||||||
| Commercial lease financing | 40 | 2.8 | 4.0 | 47 | 2.9 | 4.3 | |||||||||||||||||
| Total commercial loans | 937 | 65.1 | 70.7 | 1,099 | 67.6 | 71.1 | |||||||||||||||||
| Real estate — residential mortgage | 100 | 7.0 | 10.2 | 102 | 6.3 | 9.2 | |||||||||||||||||
| Home equity loans | 157 | 10.9 | 9.1 | 171 | 10.5 | 9.2 | |||||||||||||||||
| Consumer direct loans | 126 | 8.8 | 4.8 | 128 | 5.3 | 4.7 | |||||||||||||||||
| Credit cards | 80 | 5.6 | 1.0 | 87 | 7.9 | 1.0 | |||||||||||||||||
| Consumer indirect loans | 38 | 2.6 | 4.2 | 39 | 2.4 | 4.8 | |||||||||||||||||
| Total consumer loans | 501 | 34.9 | 29.3 | 527 | 32.4 | 28.9 | |||||||||||||||||
Total ALLL — continuing operations (a) | $ | 1,438 | 100.0 | % | 100.0 | % | $ | 1,626 | 100.0 | % | 100.0 | % | |||||||||||
(a)Excludes allocations of the ALLL related to the discontinued operations of the education lending business in the amount of $33 million at March 31, 2021, and $36 million at December 31, 2020.
Net loan charge-offs
Figure 28 shows the trend in our net loan charge-offs by loan type, while the composition of loan charge-offs and recoveries by type of loan is presented in Figure 29.
Net loan charge-offs for the three months ended March 31, 2021, increased $30 million compared to the year-ago quarter. For the remainder of 2021, we expect net loan charge-offs to average loans to be between 35 to 45 basis points which is in line with or below our long-term financial targets.
41
Figure 28. Net Loan Charge-offs from Continuing Operations (a)
| 2021 | 2020 | |||||||||||||||||||
| dollars in millions | First | Fourth | Third | Second | First | |||||||||||||||
| Commercial and industrial | $ | 65 | $ | 104 | $ | 92 | $ | 66 | $ | 55 | ||||||||||
| Real estate — Commercial mortgage | 34 | 1 | 11 | 2 | 2 | |||||||||||||||
| Real estate — Construction | — | — | — | — | — | |||||||||||||||
| Commercial lease financing | 3 | 19 | 10 | 3 | 2 | |||||||||||||||
| Total commercial loans | 102 | 124 | 113 | 71 | 59 | |||||||||||||||
| Real estate — Residential mortgage | (1) | — | (1) | 2 | — | |||||||||||||||
| Home equity loans | 1 | — | 1 | 1 | 2 | |||||||||||||||
| Consumer direct loans | 6 | 6 | 6 | 8 | 10 | |||||||||||||||
| Credit cards | 4 | 5 | 7 | 10 | 9 | |||||||||||||||
| Consumer indirect loans | 2 | — | 2 | 4 | 4 | |||||||||||||||
| Total consumer loans | 12 | 11 | 15 | 25 | 25 | |||||||||||||||
| Total net loan charge-offs | $ | 114 | $ | 135 | $ | 128 | $ | 96 | $ | 84 | ||||||||||
| Net loan charge-offs to average loans | .46 | % | .53 | % | .49 | % | .36 | % | .35 | % | ||||||||||
| Net loan charge-offs from discontinued operations — education lending business | — | $ | 1 | — | — | $ | 1 | |||||||||||||
(a)Credit amounts indicate that recoveries exceeded charge-offs.
42
Figure 29. Summary of Loan and Lease Loss Experience from Continuing Operations
| Three months ended March 31, | ||||||||
dollars in millions | 2021 | 2020 | ||||||
Average loans outstanding | $ | 100,728 | $ | 96,174 | ||||
| Allowance for loan and lease losses at the end of the prior period | $ | 1,626 | $ | 900 | ||||
Cumulative effect from change in accounting principle (a) | — | 204 | ||||||
Allowance for loan and lease losses at beginning of period | 1,626 | 1,104 | ||||||
Loans charged off: | ||||||||
Commercial and industrial | 73 | 60 | ||||||
Real estate — commercial mortgage | 35 | 3 | ||||||
Real estate — construction | — | — | ||||||
Commercial lease financing | 4 | 2 | ||||||
Total commercial loans | 112 | 65 | ||||||
Real estate — residential mortgage | — | — | ||||||
Home equity loans | 2 | 4 | ||||||
Consumer direct loans | 8 | 12 | ||||||
Credit cards | 6 | 11 | ||||||
Consumer indirect loans | 7 | 9 | ||||||
Total consumer loans | 23 | 36 | ||||||
Total loans charged off | 135 | 101 | ||||||
Recoveries: | ||||||||
Commercial and industrial | 8 | 5 | ||||||
Real estate — commercial mortgage | 1 | 1 | ||||||
Real estate — construction | — | — | ||||||
Commercial lease financing | 1 | — | ||||||
Total commercial loans | 10 | 6 | ||||||
Real estate — residential mortgage | 1 | — | ||||||
Home equity loans | 1 | 2 | ||||||
Consumer direct loans | 2 | 2 | ||||||
Credit cards | 2 | 2 | ||||||
Consumer indirect loans | 5 | 5 | ||||||
Total consumer loans | 11 | 11 | ||||||
Total recoveries | 21 | 17 | ||||||
Net loan charge-offs | (114) | (84) | ||||||
Provision (credit) for loan and lease losses | (74) | 339 | ||||||
| Allowance for loan and lease losses at end of period | $ | 1,438 | $ | 1,359 | ||||
Liability for credit losses on lending-related commitments at the end of the prior period | $ | 197 | $ | 68 | ||||
Liability for credit losses on contingent guarantees at the end of the prior period | — | 7 | ||||||
Cumulative effect from change in accounting principle (a), (b) | — | 66 | ||||||
Liability for credit losses on off-balance sheet exposures at beginning of period | 197 | 141 | ||||||
Provision (credit) for losses on off-balance sheet exposures | (19) | 20 | ||||||
Liability for credit losses on off-balance sheet exposures at end of period (c) | $ | 178 | $ | 161 | ||||
Total allowance for credit losses at end of period | $ | 1,616 | $ | 1,520 | ||||
Net loan charge-offs to average total loans | .46 | % | .35 | % | ||||
Allowance for loan and lease losses to period-end loans | 1.42 | 1.32 | ||||||
Allowance for credit losses to period-end loans | 1.60 | 1.47 | ||||||
Allowance for loan and lease losses to nonperforming loans | 197.5 | 215.0 | ||||||
Allowance for credit losses to nonperforming loans | 222.0 | 240.5 | ||||||
Discontinued operations — education lending business: | ||||||||
Loans charged off | $ | 1 | $ | 2 | ||||
Recoveries | 1 | 1 | ||||||
Net loan charge-offs | $ | — | $ | (1) | ||||
(a)The cumulative effect from change in accounting principle relates to the January 1, 2020, adoption of ASU 2016-13.
(b)For the period ended March 31, 2020, excludes $4 million related to the provision for other financial assets.
(c)Included in "Accrued expense and other liabilities" on the balance sheet.
43
Nonperforming assets
Figure 30 shows the composition of our nonperforming assets. As shown in Figure 30, nonperforming assets at March 31, 2021, decreased $147 million from December 31, 2020. This decrease was primarily driven by the completion of the sale of a large commercial OREO asset at a small gain during the first quarter of 2021.
Under the CARES Act as well as banking regulator interagency guidance, certain loan modifications to borrowers experiencing financial distress as a result of the economic impacts created by the COVID-19 pandemic may not be reported as past due. Refer to Note 4 (“Asset Quality”) under the heading “Nonperforming and Past Due Loans.”
See Note 1 (“Basis of Presentation and Accounting Policies”) under the headings “Nonperforming Loans,” “Impaired Loans,” and “Allowance for Loan and Lease Losses” and Note 1 (“Summary of Significant Accounting Policies”) of our 2020 Form 10-K for a summary of our nonaccrual and charge-off policies.
Figure 30. Summary of Nonperforming Assets and Past Due Loans from Continuing Operations
| dollars in millions | March 31, 2021 | December 31, 2020 | September 30, 2020 | June 30, 2020 | March 31, 2020 | ||||||||||||
| Commercial and industrial | $ | 387 | $ | 385 | $ | 459 | $ | 404 | $ | 277 | |||||||
| Real estate — commercial mortgage | 66 | 104 | 104 | 91 | 87 | ||||||||||||
| Real estate — construction | — | — | 1 | 1 | 2 | ||||||||||||
Total commercial real estate loans (a) | 66 | 104 | 105 | 92 | 89 | ||||||||||||
| Commercial lease financing | 8 | 8 | 6 | 9 | 5 | ||||||||||||
Total commercial loans (b) | 461 | 497 | 570 | 505 | 371 | ||||||||||||
| Real estate — residential mortgage | 95 | 110 | 96 | 89 | 89 | ||||||||||||
| Home equity loans | 148 | 154 | 146 | 141 | 143 | ||||||||||||
| Consumer direct loans | 5 | 5 | 3 | 3 | 4 | ||||||||||||
| Credit cards | 3 | 2 | 2 | 2 | 3 | ||||||||||||
| Consumer indirect loans | 16 | 17 | 17 | 20 | 22 | ||||||||||||
| Total consumer loans | 267 | 288 | 264 | 255 | 261 | ||||||||||||
| Total nonperforming loans | 728 | 785 | 834 | 760 | 632 | ||||||||||||
| OREO | 12 | 100 | 105 | 112 | 119 | ||||||||||||
| Nonperforming loans held for sale | 47 | 49 | 61 | 75 | 89 | ||||||||||||
| Other nonperforming assets | 3 | 3 | 3 | 4 | 4 | ||||||||||||
| Total nonperforming assets | $ | 790 | $ | 937 | $ | 1,003 | $ | 951 | $ | 844 | |||||||
| Accruing loans past due 90 days or more | $ | 92 | $ | 86 | $ | 73 | $ | 87 | $ | 128 | |||||||
| Accruing loans past due 30 through 89 days | 191 | 241 | 336 | 419 | 393 | ||||||||||||
Restructured loans — accruing and nonaccruing (c) | 376 | 363 | 306 | 310 | 340 | ||||||||||||
Restructured loans included in nonperforming loans (c) | 192 | 229 | 168 | 166 | 172 | ||||||||||||
Nonperforming assets from discontinued operations — education lending business | 5 | 5 | 6 | 7 | 7 | ||||||||||||
Nonperforming loans to period-end portfolio loans | .72 | % | .78 | % | .81 | % | .72 | % | .61 | % | |||||||
Nonperforming assets to period-end portfolio loans plus OREO and other nonperforming assets | .78 | .92 | .97 | .89 | .82 | ||||||||||||
(a)See Figure 12 and the accompanying discussion in the “Loans and loans held for sale” section for more information related to our commercial real estate loan portfolio.
(b)See Figure 11 and the accompanying discussion in the “Loans and loans held for sale” section for more information related to our commercial loan portfolio.
(c)Restructured loans (i.e., TDRs) are those for which Key, for reasons related to a borrower’s financial difficulties, grants a concession to the borrower that it would not otherwise consider. These concessions are made to improve the collectability of the loan and generally take the form of a reduction of the interest rate, extension of the maturity date or reduction in the principal balance.
Figure 31 shows the types of activity that caused the change in our nonperforming loan balance during each of the last five quarters.
Figure 31. Summary of Changes in Nonperforming Loans from Continuing Operations
| 2021 | 2020 | |||||||||||||||||||
| in millions | First | Fourth | Third | Second | First | |||||||||||||||
| Balance at beginning of period | $ | 785 | $ | 834 | $ | 760 | $ | 632 | $ | 577 | ||||||||||
| Loans placed on nonaccrual status | 196 | 300 | 387 | 293 | 219 | |||||||||||||||
| Charge-offs | (135) | (160) | (150) | (111) | (100) | |||||||||||||||
| Loans sold | (13) | (9) | (6) | (5) | (4) | |||||||||||||||
| Payments | (37) | (83) | (83) | (29) | (31) | |||||||||||||||
| Transfers to OREO | (3) | (3) | — | — | (3) | |||||||||||||||
| Transfers to nonperforming loans held for sale | — | — | — | — | — | |||||||||||||||
| Transfers to other nonperforming assets | — | — | — | — | — | |||||||||||||||
| Loans returned to accrual status | (65) | (94) | (74) | (20) | (26) | |||||||||||||||
| Balance at end of period | $ | 728 | $ | 785 | $ | 834 | $ | 760 | $ | 632 | ||||||||||
44
Operational and compliance risk management
Like all businesses, we are subject to operational risk, which is the risk of loss resulting from human error or malfeasance, inadequate or failed internal processes and systems, and external events. These events include, among other things, threats to our cybersecurity, as we are reliant upon information systems and the internet to conduct our business activities. Operational risk also encompasses compliance risk, which is the risk of loss from violations of, or noncompliance with, laws, rules and regulations, prescribed practices, and ethical standards. This includes our compliance with lending programs established by the CARES Act, including the PPP and Main Street Lending Program. Under the Dodd-Frank Act, large financial companies like Key are subject to heightened prudential standards and regulation. This heightened level of regulation has increased our operational risk. Resulting operational risk losses and/or additional regulatory compliance costs could take the form of explicit charges, increased operational costs, harm to our reputation, or foregone opportunities.
We seek to mitigate operational risk through identification and measurement of risk, alignment of business strategies with risk appetite and tolerance, and a system of internal controls and reporting. We continuously strive to strengthen our system of internal controls to improve the oversight of our operational risk and to ensure compliance with laws, rules, and regulations. For example, an operational event database tracks the amounts and sources of operational risk and losses. This tracking mechanism helps to identify weaknesses and to highlight the need to take corrective action. We also rely upon software programs designed to assist in assessing operational risk and monitoring our control processes. This technology has enhanced the reporting of the effectiveness of our controls to senior management and the Board.
The Operational Risk Management Program provides the framework for the structure, governance, roles, and responsibilities, as well as the content, to manage operational risk for Key. The Compliance Risk Management Program serves the same function in managing compliance risk for Key. The Operational Risk Committee and the Compliance Risk Committee support the ERM Committee by identifying early warning events and trends, escalating emerging risks, and discussing forward-looking assessments. Both the Operational Risk Committee and the Compliance Risk Committee include attendees from each of the Three Lines of Defense. Primary responsibility for managing and monitoring internal control mechanisms lies with the managers of our various lines of business. The Operational Risk Committee and Compliance Risk Committee are senior management committees that oversee our level of operational and compliance risk and direct and support our operational and compliance infrastructure and related activities. These committees and the Operational Risk Management and Compliance Risk Management functions are an integral part of our ERM Program. Our Risk Review function regularly assesses the overall effectiveness of our Operational Risk Management and Compliance Risk Management Programs and our system of internal controls. Risk Review reports the results of reviews on internal controls and systems to senior
management and the Risk and Audit Committees and independently supports the Risk Committee’s oversight of these controls.
Cybersecurity
We maintain comprehensive Cyber Incident Response Plans, and we devote significant time and resources to maintaining and regularly updating our technology systems and processes to protect the security of our computer systems, software, networks, and other technology assets against attempts by third parties to obtain unauthorized access to confidential information, destroy data, disrupt or degrade service, sabotage systems, shut down access to systems for ransom, or cause other damage. As the threat landscape continues to evolve, critical infrastructure, including financial services, remains a top target for cyberattacks. The emergence of COVID-19 has created a unique situation globally with many more employees and third-party service providers working from home, which inherently introduces additional risk. Cyberattacks may include, but are not limited to, attacks that are intended to disrupt or disable banking services and prevent banking transactions, attempts to breach the security of systems and data, and social engineering attempts aimed at tricking employees and clients into providing sensitive information or executing financial transactions.
Cyberattack risks may also occur with our third-party technology service providers and may result in financial loss or liability that could adversely affect our financial condition or results of operations. Cyberattacks could also interfere with third-party providers’ ability to fulfill their contractual obligations to us. Recent high-profile cyberattacks have targeted retailers, credit bureaus, and other businesses for the purpose of acquiring the confidential information (including personal, financial, and credit card information) of customers, some of whom are customers of ours. We may incur expenses related to the investigation of such attacks or related to the protection of our customers from identity theft as a result of such attacks. We may also incur expenses to enhance our systems or processes to
45
protect against cyber or other security incidents. Risks and exposures related to cyberattacks are expected to remain high for the foreseeable future due to the rapidly evolving nature and sophistication of these threats, as well as due to the expanding use of Internet banking, mobile banking, and other technology-based products and services by us and our clients. To date, Key has not experienced material disruption of our operations, or material harm to our customers, as a result of the heightened threat landscape or cyberattacks.
As described in more detail starting on page 72 of our 2020 Form 10-K under the heading “Risk Management — Overview,” the Board serves in an oversight capacity ensuring that Key’s risks are managed in a manner that is effective and balanced and adds value for the shareholders. The Board’s Risk Committee has primary oversight for enterprise-wide risk at KeyCorp, including operational risk (which includes cybersecurity). The Risk Committee reviews and provides oversight of management’s activities related to the enterprise-wide risk management framework, including cyber-related risk. The ERM Committee, chaired by the Chief Executive Officer and comprising other senior level executives, is responsible for managing risk (including cyber-related risk) and ensuring that the corporate risk profile is managed in a manner consistent with our risk appetite. The ERM Committee reports to the Board’s Risk Committee.
GAAP to Non-GAAP Reconciliations
Non-GAAP financial measures have inherent limitations, are not required to be uniformly applied, and are not
audited. Although these non-GAAP financial measures are frequently used by investors to evaluate a company,
they have limitations as analytical tools, and should not be considered in isolation, nor as a substitute for analyses
of results as reported under GAAP.
The tangible common equity ratio and the return on tangible common equity ratio have been a focus for some investors, and management believes that these ratios may assist investors in analyzing Key’s capital position without regard to the effects of intangible assets and preferred stock. Since analysts and banking regulators may assess our capital adequacy using tangible common equity, we believe it is useful to enable investors to assess our capital adequacy on these same bases.
| Three months ended | ||||||||||||||||||||
dollars in millions | 3/31/2021 | 12/31/2020 | 9/30/2020 | 6/30/2020 | 3/31/2020 | |||||||||||||||
Tangible common equity to tangible assets at period-end | ||||||||||||||||||||
Key shareholders’ equity (GAAP) | $ | 17,634 | $ | 17,981 | $ | 17,722 | $ | 17,542 | $ | 17,411 | ||||||||||
Less: | Intangible assets (a) | 2,842 | 2,848 | 2,862 | 2,877 | 2,894 | ||||||||||||||
Preferred Stock (b) | 1,856 | 1,856 | 1,856 | 1,856 | 1,856 | |||||||||||||||
Tangible common equity (non-GAAP) | $ | 12,936 | $ | 13,277 | $ | 13,004 | $ | 12,809 | $ | 12,661 | ||||||||||
Total assets (GAAP) | $ | 176,203 | $ | 170,336 | $ | 170,540 | $ | 171,192 | $ | 156,197 | ||||||||||
Less: | Intangible assets (a) | 2,842 | 2,848 | 2,862 | 2,877 | 2,894 | ||||||||||||||
Tangible assets (non-GAAP) | $ | 173,361 | $ | 167,488 | $ | 167,678 | $ | 168,315 | $ | 153,303 | ||||||||||
Tangible common equity to tangible assets ratio (non-GAAP) | 7.5 | % | 7.9 | % | 7.8 | % | 7.6 | % | 8.3 | % | ||||||||||
Average tangible common equity | ||||||||||||||||||||
Average Key shareholders’ equity (GAAP) | $ | 17,769 | $ | 17,905 | $ | 17,730 | $ | 17,688 | $ | 17,216 | ||||||||||
Less: | Intangible assets (average) (c) | 2,844 | 2,855 | 2,870 | 2,886 | 2,902 | ||||||||||||||
Preferred Stock (average) | 1,900 | 1,900 | 1,900 | 1,900 | 1,900 | |||||||||||||||
Average tangible common equity (non-GAAP) | $ | 13,025 | $ | 13,150 | $ | 12,960 | $ | 12,902 | $ | 12,414 | ||||||||||
Return on average tangible common equity from continuing operations | ||||||||||||||||||||
Net income (loss) from continuing operations attributable to Key common shareholders (GAAP) | $ | 591 | $ | 549 | $ | 397 | $ | 159 | $ | 118 | ||||||||||
Average tangible common equity (non-GAAP) | 13,025 | 13,150 | 12,960 | 12,902 | 12,414 | |||||||||||||||
Return on average tangible common equity from continuing operations (non-GAAP) | 18.25 | % | 16.61 | % | 12.19 | % | 4.96 | % | 3.82 | % | ||||||||||
Return on average tangible common equity consolidated | ||||||||||||||||||||
Net income (loss) attributable to Key common shareholders (GAAP) | $ | 595 | $ | 556 | $ | 401 | $ | 161 | $ | 119 | ||||||||||
Average tangible common equity (non-GAAP) | 13,025 | 13,150 | 12,960 | 12,902 | 12,414 | |||||||||||||||
Return on average tangible common equity consolidated (non-GAAP) | 18.37 | % | 16.82 | % | 12.31 | % | 5.02 | % | 3.86 | % | ||||||||||
(a)For the three months ended March 31, 2021, December 31, 2020, September 30, 2020, June 30, 2020, and March 31, 2020, intangible assets exclude $4 million, $4 million, $5 million, $5 million, and $6 million, respectively, of period-end purchased credit card receivables.
(b)Net of capital surplus.
(c)For the three months ended March 31, 2021, December 31, 2020, September 30, 2020, June 30, 2020, and March 31, 2020, average intangible assets exclude $4 million, $5 million, $5 million, $6 million, and $7 million, respectively, of average purchased credit card receivables.
The cash efficiency ratio is a ratio of two non-GAAP performance measures, adjusted noninterest expense and total taxable-equivalent revenue. Accordingly, there is no directly comparable GAAP performance measure. The cash efficiency ratio excludes the impact of our intangible asset amortization from the calculation. We believe this ratio provides greater consistency and comparability between our results and those of our peer banks. Additionally, this ratio is used by analysts and investors to evaluate how effectively management is controlling noninterest expenses in generating revenue, as they develop earnings forecasts and peer bank analysis.
46
| Three months ended | ||||||||||||||||||||
| dollars in millions | 3/31/2021 | 12/31/2020 | 9/30/2020 | 6/30/2020 | 3/31/2020 | |||||||||||||||
| Cash efficiency ratio | ||||||||||||||||||||
| Noninterest expense (GAAP) | $ | 1,071 | $ | 1,128 | $ | 1,037 | $ | 1,013 | $ | 931 | ||||||||||
| Less: | Intangible asset amortization | 15 | 15 | 15 | 18 | 17 | ||||||||||||||
| Adjusted noninterest expense (non-GAAP) | $ | 1,056 | $ | 1,113 | $ | 1,022 | $ | 995 | $ | 914 | ||||||||||
| Net interest income (GAAP) | $ | 1,005 | $ | 1,035 | $ | 1,000 | $ | 1,018 | $ | 981 | ||||||||||
| Plus: | Taxable-equivalent adjustment | 7 | 8 | 6 | 7 | 8 | ||||||||||||||
| Noninterest income (GAAP) | 738 | 802 | 681 | 692 | 477 | |||||||||||||||
| Total taxable-equivalent revenue (non-GAAP) | $ | 1,750 | $ | 1,845 | $ | 1,687 | $ | 1,717 | $ | 1,466 | ||||||||||
| Cash efficiency ratio (non-GAAP) | 60.3 | % | 60.3 | % | 60.6 | % | 57.9 | % | 62.3 | % | ||||||||||
Critical Accounting Policies and Estimates
Our business is dynamic and complex. Consequently, we must exercise judgment in choosing and applying accounting policies and methodologies. These choices are critical – not only are they necessary to comply with GAAP, they also reflect our view of the appropriate way to record and report our overall financial performance. All accounting policies are important, and all policies described in Note 1 (“Summary of Significant Accounting Policies”) beginning on page 108 of our 2020 Form 10-K should be reviewed for a greater understanding of how we record and report our financial performance. Note 1 (“Basis of Presentation and Accounting Policies”) of this report should also be reviewed for more information on accounting standards that have been adopted during the period.
In our opinion, some accounting policies are more likely than others to have a critical effect on our financial results and to expose those results to potentially greater volatility. These policies apply to areas of relatively greater business importance or require us to exercise judgment and to make assumptions and estimates that affect amounts reported in the financial statements. Because these assumptions and estimates are based on current circumstances, they may prove to be inaccurate, or we may find it necessary to change them.
We rely heavily on the use of judgment, assumptions, and estimates to make a number of core decisions, including accounting for the ALLL; contingent liabilities, guarantees and income taxes; derivatives and related hedging activities; and assets and liabilities that involve valuation methodologies. In addition, we may employ outside valuation experts to assist us in determining fair values of certain assets and liabilities. A brief discussion of each of these areas appears on pages 91 through 96 of our 2020 Form 10-K. During the first three months of 2021, we did not significantly alter the manner in which we applied our critical accounting policies or developed related assumptions and estimates.
47
Accounting and Reporting Developments
Accounting Guidance Pending Adoption at March 31, 2021
| Standard | Required Adoption | Description | Effect on Financial Statements or Other Significant Matters | ||||||||
| ASU 2020-06, Debt—Debt with Conversion and Other Options (Subtopic 470-20) and Derivatives and Hedging— Contracts in Entity’s Own Equity (Subtopic 815-40) | January 1, 2022 Early adoption is permitted. | The ASU simplifies the accounting for convertible debt instruments by eliminating the legacy accounting models for convertible instruments with beneficial conversion features or cash conversion features. The guidance also amends the guidance used to determine if a freestanding financial instrument or an embedded feature qualifies for a scope exception from derivative accounting. For freestanding financial instruments and embedded features that have all the characteristics of a derivative instrument and are potentially settled in an entity’s own stock, the guidance simplifies the settlement assessment that entities are required to perform. Also, the Update now requires the use of the if-converted method for all convertible instruments and includes the effect of potential share settlement in diluted EPS if the effect is more dilutive. The new guidance also makes clarifications to the EPS calculation. Further, the ASU expands disclosure requirements. The guidance should be applied on a modified retrospective or retrospective basis. | The adoption of this accounting guidance is not expected to have a material effect on our financial condition or results of operations. | ||||||||
| Reference Rate Reform (Topic 848) | December 31, 2022 | London Interbank Offered Rate (LIBOR), a reference rate presumed to capture bank funding costs, is being phased out and will no longer be published. This transition to alternate rates will impact, among other things, contracts that reference LIBOR. | Key has established an enterprise-wide program to identify and address all LIBOR related issues and will assess the impacts in conjunction with the reference rate transition as it occurs over the next two years. | ||||||||
48
European Sovereign and Nonsovereign Debt Exposures
Our total European sovereign and Nonsovereign debt exposure is presented in Figure 32.
Figure 32. European Sovereign and Nonsovereign Debt Exposures
| March 31, 2021 | Short- and Long- Term Commercial Total (a) | Foreign Exchange and Derivatives with Collateral (b) | Net Exposure | ||||||||
| in millions | |||||||||||
| France: | |||||||||||
| Sovereigns | — | — | — | ||||||||
| Nonsovereign financial institutions | — | 1 | 1 | ||||||||
| Nonsovereign non-financial institutions | $ | 1 | — | $ | 1 | ||||||
| Total | 1 | 1 | 2 | ||||||||
| Germany: | |||||||||||
| Sovereigns | — | — | — | ||||||||
| Nonsovereign financial institutions | — | — | — | ||||||||
| Nonsovereign non-financial institutions | 33 | — | 33 | ||||||||
| Total | 33 | — | 33 | ||||||||
| Italy: | |||||||||||
| Sovereigns | — | — | — | ||||||||
| Nonsovereign financial institutions | — | — | — | ||||||||
| Nonsovereign non-financial institutions | 17 | — | 17 | ||||||||
| Switzerland: | |||||||||||
| Sovereigns | — | — | — | ||||||||
| Nonsovereign financial institutions | — | 1 | 1 | ||||||||
| Nonsovereign non-financial institutions | — | — | — | ||||||||
| Total | — | 1 | 1 | ||||||||
| United Kingdom: | |||||||||||
| Sovereigns | — | — | — | ||||||||
| Nonsovereign financial institutions | — | $ | 375 | 375 | |||||||
| Nonsovereign non-financial institutions | — | — | — | ||||||||
| Total | — | 375 | 375 | ||||||||
| Total Europe: | |||||||||||
| Sovereigns | — | — | — | ||||||||
| Nonsovereign financial institutions | — | 377 | 377 | ||||||||
| Nonsovereign non-financial institutions | 51 | — | 51 | ||||||||
| Total | $ | 51 | $ | 377 | $ | 428 | |||||
(a)Represents our outstanding leases.
(b)Represents contracts to hedge our balance sheet asset and liability needs and to accommodate our clients’ trading and/or hedging needs. Our derivative mark-to-market exposures are calculated and reported on a daily basis. These exposures are largely covered by cash or highly marketable securities collateral with daily collateral calls.
Our credit risk exposure is largely concentrated in developed countries with emerging market exposure essentially limited to commercial facilities; these exposures are actively monitored by management. We do not have at-risk exposures in the rest of the world.
49
Item 1. Financial Statements
Consolidated Balance Sheets
| in millions, except per share data | March 31, 2021 | December 31, 2020 | ||||||
| (Unaudited) | ||||||||
| ASSETS | ||||||||
| Cash and due from banks | $ | 938 | $ | 1,091 | ||||
| Short-term investments | 15,376 | 16,194 | ||||||
| Trading account assets | 811 | 735 | ||||||
| Securities available for sale | 33,923 | 27,556 | ||||||
Held-to-maturity securities (fair value: $7,159 and $8,023) | 6,857 | 7,595 | ||||||
| Other investments | 621 | 621 | ||||||
Loans, net of unearned income of $408 and $449 | 100,926 | 101,185 | ||||||
| Less: Allowance for loan and lease losses | (1,438) | (1,626) | ||||||
| Net loans | 99,488 | 99,559 | ||||||
Loans held for sale (a) | 2,296 | 1,583 | ||||||
| Premises and equipment | 737 | 753 | ||||||
| Goodwill | 2,673 | 2,664 | ||||||
| Other intangible assets | 173 | 188 | ||||||
| Corporate-owned life insurance | 4,296 | 4,286 | ||||||
| Accrued income and other assets | 7,347 | 6,812 | ||||||
| Discontinued assets | 667 | 699 | ||||||
| Total assets | $ | 176,203 | $ | 170,336 | ||||
| LIABILITIES | ||||||||
| Deposits in domestic offices: | ||||||||
| NOW and money market deposit accounts | $ | 82,777 | $ | 80,427 | ||||
| Savings deposits | 6,655 | 5,913 | ||||||
Certificates of deposit ($100,000 or more) | 2,437 | 2,733 | ||||||
| Other time deposits | 2,782 | 3,010 | ||||||
| Total interest-bearing deposits | 94,651 | 92,083 | ||||||
| Noninterest-bearing deposits | 47,532 | 43,199 | ||||||
| Total deposits | 142,183 | 135,282 | ||||||
| Federal funds purchased and securities sold under repurchase agreements | 281 | 220 | ||||||
| Bank notes and other short-term borrowings | 744 | 759 | ||||||
| Accrued expense and other liabilities | 2,862 | 2,385 | ||||||
| Long-term debt | 12,499 | 13,709 | ||||||
| Total liabilities | 158,569 | 152,355 | ||||||
| EQUITY | ||||||||
| Preferred stock | 1,900 | 1,900 | ||||||
Common Shares, $1 par value; authorized 2,100,000,000 and 2,100,000,000 shares; issued 1,256,702,081 and 1,256,702,081 shares | 1,257 | 1,257 | ||||||
| Capital surplus | 6,213 | 6,281 | ||||||
| Retained earnings | 13,166 | 12,751 | ||||||
Treasury stock, at cost (284,115,148 and 280,928,782 shares) | (5,005) | (4,946) | ||||||
| Accumulated other comprehensive income (loss) | 103 | 738 | ||||||
| Key shareholders’ equity | 17,634 | 17,981 | ||||||
| Noncontrolling interests | — | — | ||||||
| Total equity | 17,634 | 17,981 | ||||||
| Total liabilities and equity | $ | 176,203 | $ | 170,336 | ||||
(a)Total loans held for sale include real estate — residential mortgage loans held for sale at fair value of $236 million at March 31, 2021, and $264 million at December 31, 2020.
See Notes to Consolidated Financial Statements (Unaudited).
50
Consolidated Statements of Income
| dollars in millions, except per share amounts | Three months ended March 31, | |||||||
| (Unaudited) | 2021 | 2020 | ||||||
| INTEREST INCOME | ||||||||
| Loans | $ | 889 | $ | 1,026 | ||||
| Loans held for sale | 11 | 19 | ||||||
| Securities available for sale | 130 | 129 | ||||||
| Held-to-maturity securities | 45 | 62 | ||||||
| Trading account assets | 5 | 8 | ||||||
| Short-term investments | 5 | 6 | ||||||
| Other investments | 2 | 1 | ||||||
| Total interest income | 1,087 | 1,251 | ||||||
| INTEREST EXPENSE | ||||||||
| Deposits | 21 | 169 | ||||||
| Federal funds purchased and securities sold under repurchase agreements | — | 6 | ||||||
| Bank notes and other short-term borrowings | 1 | 5 | ||||||
| Long-term debt | 60 | 90 | ||||||
| Total interest expense | 82 | 270 | ||||||
| NET INTEREST INCOME | 1,005 | 981 | ||||||
| Provision for credit losses | (93) | 359 | ||||||
| Net interest income after provision for credit losses | 1,098 | 622 | ||||||
| NONINTEREST INCOME | ||||||||
| Trust and investment services income | 133 | 133 | ||||||
| Investment banking and debt placement fees | 162 | 116 | ||||||
| Service charges on deposit accounts | 73 | 84 | ||||||
| Operating lease income and other leasing gains | 38 | 30 | ||||||
| Corporate services income | 64 | 62 | ||||||
| Cards and payments income | 105 | 66 | ||||||
| Corporate-owned life insurance income | 31 | 36 | ||||||
| Consumer mortgage income | 47 | 20 | ||||||
| Commercial mortgage servicing fees | 34 | 18 | ||||||
Other income (a) | 51 | (88) | ||||||
| Total noninterest income | 738 | 477 | ||||||
| NONINTEREST EXPENSE | ||||||||
| Personnel | 624 | 515 | ||||||
| Net occupancy | 76 | 76 | ||||||
| Computer processing | 73 | 55 | ||||||
| Business services and professional fees | 50 | 44 | ||||||
| Equipment | 25 | 24 | ||||||
| Operating lease expense | 34 | 36 | ||||||
| Marketing | 26 | 21 | ||||||
| Intangible asset amortization | 15 | 17 | ||||||
| Other expense | 148 | 143 | ||||||
| Total noninterest expense | 1,071 | 931 | ||||||
INCOME (LOSS) FROM CONTINUING OPERATIONS BEFORE INCOME TAXES | 765 | 168 | ||||||
| Income taxes | 147 | 23 | ||||||
| INCOME (LOSS) FROM CONTINUING OPERATIONS | 618 | 145 | ||||||
| Income (loss) from discontinued operations | 4 | 1 | ||||||
| NET INCOME (LOSS) | 622 | 146 | ||||||
| Less: Net income (loss) attributable to noncontrolling interests | — | — | ||||||
| NET INCOME (LOSS) ATTRIBUTABLE TO KEY | $ | 622 | $ | 146 | ||||
Income (loss) from continuing operations attributable to Key common shareholders | $ | 591 | $ | 118 | ||||
| Net income (loss) attributable to Key common shareholders | 595 | 119 | ||||||
| Per Common Share: | ||||||||
Income (loss) from continuing operations attributable to Key common shareholders | $ | .61 | $ | .12 | ||||
| Income (loss) from discontinued operations, net of taxes | — | — | ||||||
Net income (loss) attributable to Key common shareholders (b) | .62 | .12 | ||||||
| Per Common Share — assuming dilution: | ||||||||
Income (loss) from continuing operations attributable to Key common shareholders | $ | .61 | $ | .12 | ||||
| Income (loss) from discontinued operations, net of taxes | — | — | ||||||
Net income (loss) attributable to Key common shareholders (b) | .61 | .12 | ||||||
| Cash dividends declared per Common Share | $ | .185 | $ | .185 | ||||
| Weighted-average Common Shares outstanding (000) | 964,878 | 967,446 | ||||||
| Effect of Common Share options and other stock awards | 9,419 | 8,664 | ||||||
Weighted-average Common Shares and potential Common Shares outstanding (000) (c) | 974,297 | 976,110 | ||||||
(a)For the three months ended March 31, 2021, net securities gains (losses) totaled less than $1 million for the three months ended March 31, 2020, net securities gains (losses) totaled $4 million. For the three months ended March 31, 2021, and March 31, 2020, we did not have any impairment losses related to securities.
(b)EPS may not foot due to rounding.
(c)Assumes conversion of Common Share options and other stock awards and/or convertible preferred stock, as applicable.
See Notes to Consolidated Financial Statements (Unaudited).
51
Consolidated Statements of Comprehensive Income
| in millions | Three months ended March 31, | |||||||
| (Unaudited) | 2021 | 2020 | ||||||
| Net income (loss) | $ | 622 | $ | 146 | ||||
| Other comprehensive income (loss), net of tax: | ||||||||
Net unrealized gains (losses) on securities available for sale, net of income taxes of $(198) and $126 | (628) | 405 | ||||||
Net unrealized gains (losses) on derivative financial instruments, net of income taxes of $(3) and $117 | (10) | 377 | ||||||
Foreign currency translation adjustments, net of income taxes of $0 and $0 | — | — | ||||||
Net pension and postretirement benefit costs, net of income taxes of $1 and $2 | 3 | 6 | ||||||
| Total other comprehensive income (loss), net of tax | (635) | 788 | ||||||
| Comprehensive income (loss) | (13) | 934 | ||||||
| Less: Comprehensive income attributable to noncontrolling interests | — | — | ||||||
| Comprehensive income (loss) attributable to Key | $ | (13) | $ | 934 | ||||
See Notes to Consolidated Financial Statements (Unaudited).
52
Consolidated Statements of Changes in Equity
| Key Shareholders’ Equity | |||||||||||||||||||||||||||||
dollars in millions, except per share amounts (Unaudited) | Preferred Shares Outstanding (000) | Common Shares Outstanding (000) | Preferred Stock | Common Shares | Capital Surplus | Retained Earnings | Treasury Stock, at Cost | Accumulated Other Comprehensive Income (Loss) | Noncontrolling Interests | ||||||||||||||||||||
| BALANCE AT DECEMBER 31, 2019 | 1,396 | 977,189 | $ | 1,900 | $ | 1,257 | $ | 6,295 | $ | 12,469 | $ | (4,909) | $ | 26 | $ | — | |||||||||||||
| Cumulative effect from changes in accounting principle (a) | (230) | ||||||||||||||||||||||||||||
| Net income (loss) | 146 | — | |||||||||||||||||||||||||||
| Other comprehensive income (loss): | 788 | ||||||||||||||||||||||||||||
| Deferred compensation | (1) | ||||||||||||||||||||||||||||
| Cash dividends declared | |||||||||||||||||||||||||||||
Common Shares ($.185 per share) | (181) | ||||||||||||||||||||||||||||
Series D Preferred Stock ($12.50 per depositary share) | (7) | ||||||||||||||||||||||||||||
Series E Preferred Stock ($.382813 per depositary share) | (8) | ||||||||||||||||||||||||||||
Series F Preferred Stock ($.353125 per depositary share) | (6) | ||||||||||||||||||||||||||||
Series G Preferred Stock ($.351563 per depositary share) | (6) | ||||||||||||||||||||||||||||
| Open market Common Share repurchases | (6,067) | (117) | |||||||||||||||||||||||||||
Employee equity compensation program Common Share repurchases | (1,795) | (72) | (35) | ||||||||||||||||||||||||||
Common shares reissued (returned) for stock options and other employee benefit plans | 5,992 | — | 105 | ||||||||||||||||||||||||||
Net contribution from (distribution to) noncontrolling interests | — | ||||||||||||||||||||||||||||
| Other | (3) | ||||||||||||||||||||||||||||
| BALANCE AT MARCH 31, 2020 | 1,396 | 975,319 | $ | 1,900 | $ | 1,257 | $ | 6,222 | $ | 12,174 | $ | (4,956) | $ | 814 | $ | — | |||||||||||||
(a)Includes the impact of implementing ASU 2016-13, Financial Instruments - Credit Losses (ASC 326): Measurement of Credit Losses on Financial Instruments. See Note 1 (“Summary of Significant Accounting Policies) in our 2020 Form 10-K for more information on our adoption of this guidance and the impact to our results of operations.
See Notes to Consolidated Financial Statements (Unaudited).
| Key Shareholders’ Equity | |||||||||||||||||||||||||||||
dollars in millions, except per share amounts (Unaudited) | Preferred Shares Outstanding (000) | Common Shares Outstanding (000) | Preferred Stock | Common Shares | Capital Surplus | Retained Earnings | Treasury Stock, at Cost | Accumulated Other Comprehensive Income (Loss) | Noncontrolling Interests | ||||||||||||||||||||
| BALANCE AT DECEMBER 31, 2020 | 1,396 | 975,773 | $ | 1,900 | $ | 1,257 | $ | 6,281 | $ | 12,751 | $ | (4,946) | $ | 738 | — | ||||||||||||||
| Net income (loss) | 622 | — | |||||||||||||||||||||||||||
| Other comprehensive income (loss) | (635) | ||||||||||||||||||||||||||||
| Deferred compensation | (3) | ||||||||||||||||||||||||||||
| Cash dividends declared | |||||||||||||||||||||||||||||
Common Shares ($.185 per share) | (180) | ||||||||||||||||||||||||||||
Series D Preferred Stock ($12.50 per depositary share) | (7) | ||||||||||||||||||||||||||||
Series E Preferred Stock ($.382813 per depositary share) | (8) | ||||||||||||||||||||||||||||
Series F Preferred Stock ($.353125 per depositary share) | (6) | ||||||||||||||||||||||||||||
Series G Preferred Stock ($.351563 per depositary share) | (6) | ||||||||||||||||||||||||||||
| Open market Common Share repurchases | (7,701) | (135) | |||||||||||||||||||||||||||
Employee equity compensation program Common Share repurchases | (1,576) | — | (31) | ||||||||||||||||||||||||||
Common Shares reissued (returned) for stock options and other employee benefit plans | 6,091 | (65) | 107 | ||||||||||||||||||||||||||
Net contribution from (distribution to) noncontrolling interests | — | ||||||||||||||||||||||||||||
Other | — | ||||||||||||||||||||||||||||
| BALANCE AT MARCH 31, 2021 | 1,396 | 972,587 | $ | 1,900 | $ | 1,257 | $ | 6,213 | $ | 13,166 | $ | (5,005) | $ | 103 | — | ||||||||||||||
See Notes to Consolidated Financial Statements (Unaudited).
53
Consolidated Statements of Cash Flows
| in millions | Three months ended March 31, | ||||||||||
| (Unaudited) | 2021 | 2020 | |||||||||
| OPERATING ACTIVITIES | |||||||||||
| Net income (loss) | $ | 622 | $ | 146 | |||||||
| Adjustments to reconcile net income (loss) to net cash provided by (used in) operating activities: | |||||||||||
| Provision for credit losses | (93) | 359 | |||||||||
| Depreciation and amortization expense, net | 17 | 54 | |||||||||
| Accretion of acquired loans | 6 | 10 | |||||||||
| Increase in cash surrender value of corporate-owned life insurance | (27) | (29) | |||||||||
| Stock-based compensation expense | 26 | 25 | |||||||||
| Deferred income taxes (benefit) | 108 | (18) | |||||||||
| Proceeds from sales of loans held for sale | 3,357 | 2,687 | |||||||||
| Originations of loans held for sale, net of repayments | (3,937) | (3,256) | |||||||||
| Net losses (gains) on sales of loans held for sale | (55) | (38) | |||||||||
| Net losses (gains) on leased equipment | (3) | 6 | |||||||||
| Net securities losses (gains) | — | (4) | |||||||||
| Net losses (gains) on sales of fixed assets | — | 2 | |||||||||
| Net decrease (increase) in trading account assets | (76) | 245 | |||||||||
| Other operating activities, net | (150) | (362) | |||||||||
| NET CASH PROVIDED BY (USED IN) OPERATING ACTIVITIES | (205) | (173) | |||||||||
| INVESTING ACTIVITIES | |||||||||||
| Cash received (used) in acquisitions, net of cash acquired | (9) | — | |||||||||
| Net decrease (increase) in short-term investments, excluding acquisitions | 818 | (2,801) | |||||||||
| Purchases of securities available for sale | (9,854) | (190) | |||||||||
| Proceeds from sales of securities available for sale | — | 583 | |||||||||
| Proceeds from prepayments and maturities of securities available for sale | 2,653 | 1,176 | |||||||||
| Proceeds from prepayments and maturities of held-to-maturity securities | 743 | 434 | |||||||||
| Purchases of held-to-maturity securities | (3) | (4) | |||||||||
| Purchases of other investments | (9) | (91) | |||||||||
| Proceeds from sales of other investments | 17 | 2 | |||||||||
| Proceeds from prepayments and maturities of other investments | 3 | 10 | |||||||||
| Net decrease (increase) in loans, excluding acquisitions, sales and transfers | 204 | (8,902) | |||||||||
| Proceeds from sales of portfolio loans | (98) | 54 | |||||||||
| Proceeds from corporate-owned life insurance | 17 | 19 | |||||||||
| Purchases of premises, equipment, and software | (12) | (12) | |||||||||
| NET CASH PROVIDED BY (USED IN) INVESTING ACTIVITIES | (5,530) | (9,722) | |||||||||
| FINANCING ACTIVITIES | |||||||||||
| Net increase (decrease) in deposits, excluding acquisitions | 6,901 | 3,434 | |||||||||
| Net increase (decrease) in short-term borrowings | 46 | 5,958 | |||||||||
| Net proceeds from issuance of long-term debt | — | 2,497 | |||||||||
| Payments on long-term debt | (1,004) | (1,506) | |||||||||
| Open market Common Share repurchases | (135) | (117) | |||||||||
| Employee equity compensation program Common Share repurchases | (31) | (35) | |||||||||
| Net proceeds from reissuance of Common Shares | 12 | 5 | |||||||||
| Cash dividends paid | (207) | (208) | |||||||||
| NET CASH PROVIDED BY (USED IN) FINANCING ACTIVITIES | 5,582 | 10,028 | |||||||||
| NET INCREASE (DECREASE) IN CASH AND DUE FROM BANKS | (153) | 133 | |||||||||
| CASH AND DUE FROM BANKS AT BEGINNING OF PERIOD | 1,091 | 732 | |||||||||
| CASH AND DUE FROM BANKS AT END OF PERIOD | $ | 938 | $ | 865 | |||||||
| Additional disclosures relative to cash flows: | |||||||||||
| Interest paid | $ | 80 | $ | 267 | |||||||
| Income taxes paid (refunded) | 43 | 35 | |||||||||
| Noncash items: | |||||||||||
| Reduction of secured borrowing and related collateral | $ | 2 | $ | 1 | |||||||
| Loans transferred to portfolio from held for sale | 8 | 10 | |||||||||
| Loans transferred to held for sale from portfolio | 91 | 210 | |||||||||
| Loans transferred to OREO | 2 | 92 | |||||||||
| CMBS risk retentions | (1) | 12 | |||||||||
| ABS risk retentions | 17 | 11 | |||||||||
See Notes to Consolidated Financial Statements (Unaudited).
54
Notes to Consolidated Financial Statements (Unaudited)
1. Basis of Presentation and Accounting Policies
The consolidated financial statements include the accounts of KeyCorp and its subsidiaries. All significant intercompany accounts and transactions have been eliminated in consolidation. Some previously reported amounts have been reclassified to conform to current reporting practices.
The consolidated financial statements include any voting rights entities in which we have a controlling financial interest. In accordance with the applicable accounting guidance for consolidations, we consolidate a VIE if we have: (i) a variable interest in the entity; (ii) the power to direct activities of the VIE that most significantly affect the entity’s economic performance; and (iii) the obligation to absorb losses of the entity or the right to receive benefits from the entity that could potentially be significant to the VIE (i.e., we are considered to be the primary beneficiary). Variable interests can include equity interests, subordinated debt, derivative contracts, leases, service agreements, guarantees, standby letters of credit, loan commitments, and other contracts, agreements, and financial instruments. See Note 11 (“Variable Interest Entities”) for information on our involvement with VIEs.
We use the equity method to account for unconsolidated investments in voting rights entities or VIEs if we have significant influence over the entity’s operating and financing decisions (usually defined as a voting or economic interest of 20% to 50%, but not controlling). Unconsolidated investments in voting rights entities or VIEs in which we have a voting or economic interest of less than 20% are carried at the cost measurement alternative or at fair value. Investments held by our registered broker-dealer and investment company subsidiaries (principal investing entities and Real Estate Capital line of business) are carried at fair value.
The unaudited consolidated interim financial statements reflect all adjustments of a normal recurring nature and disclosures that are necessary for a fair presentation of the results for the interim periods presented. The results of operations for the interim period are not necessarily indicative of the results of operations to be expected for the full year. The interim financial statements should be read in conjunction with the audited consolidated financial statements and related notes included in our 2020 Form 10-K.
In preparing these financial statements, subsequent events were evaluated through the time the financial statements were issued. Financial statements are considered issued when they are widely distributed to all shareholders and other financial statement users or filed with the SEC.
Goodwill and Other Intangible Assets
Effective January 1, 2021, Key changed its approach for allocating equity to its reporting units. The carrying amounts of Key’s reporting units now represent the combination of regulatory and economic equity for goodwill impairment testing and management reporting purposes. The fair values of each reporting unit are estimated using a combination of market and income approaches. For more information, refer to Note 10 (“Goodwill”).
55
Accounting Guidance Adopted in 2021
| Standard | Required Adoption | Description | Effect on Financial Statements or Other Significant Matters | ||||||||
| ASU 2019-12, Simplifying the Accounting for Income Taxes | January 1, 2021 | This ASU simplifies the accounting for income taxes by removing certain exceptions to the existing guidance, such as exceptions related to the incremental approach for intraperiod tax allocation, the methodology for calculating income taxes in an interim period when a year-to-date loss exceeds the anticipated loss, and the recognition of deferred tax liabilities when a foreign subsidiary becomes an equity method investment and when a foreign equity method investment becomes a subsidiary. Along with general improvements, it adds simplifications related to franchise taxes, the tax basis of goodwill, and the method for recognizing an enacted change in tax laws. The guidance also specifies that an entity is not required to allocate the consolidated amount of certain tax expense to a legal entity not subject to tax in its own separate financial statements. The guidance should be applied on either a retrospective, modified retrospective, or prospective basis depending on the amendment. | The adoption of this accounting guidance did not have a material effect on our financial condition or results of operations. | ||||||||
| ASU 2020-01, Clarifying the Interactions between Topic 321,Investments —Equity Securities; Topic 323, Investments— Equity Method and Joint Ventures; and Topic 815, Derivatives and Hedging | January 1, 2021 | This guidance clarifies that when applying the measurement alternative in Topic 321, companies should consider certain observable transactions that require the application or discontinuance of the equity method under Topic 323. It also clarifies that companies should not consider whether the underlying securities in certain forward contracts and purchased options would be accounted for under the equity method or fair value option when determining the method of accounting for those contracts. This guidance should be applied on a prospective basis. | The adoption of this accounting guidance did not have a material effect on our financial condition or results of operations. | ||||||||
ASU 2020-08, Codification Improvements to Subtopic 310-20, Receivables—Nonrefundable Fees and Other Costs | January 1, 2021 | This ASU clarifies that at each reporting period an entity should reevaluate whether a callable debt security is within the scope of ASC 310, which says that to the extent the amortized cost basis of an individual callable debt security exceeds the amount repayable by the issuer at the earliest call date, the premium shall be amortized to the earliest call date, unless prepayment guidance is applied. This guidance should be applied on a prospective basis. | The adoption of this accounting guidance did not have a material effect on our financial condition or results of operations. | ||||||||
| ASU 2021-01, Reference Rate Reform (Topic 848) | January 1, 2021 | The ASU clarifies that certain optional expedients and exceptions related to contracts modified as a result of reference rate reform and hedge accounting apply to derivatives affected by the discounting transition, such as those that use an interest rate for margining, discounting, or contract price alignment. The guidance may be applied on a full retrospective basis as of any date from the beginning of an interim period that includes or is subsequent to March 12, 2020. Alternatively, it may be applied on a prospective basis to new modifications from any date within an interim period that includes or is subsequent to the date of the issuance of a final Update, until the financial statements are available to be issued. | Key adopted this guidance on January 1, 2021, on a prospective basis and will assess the impact in conjunction with the reference rate transition as it occurs over the next two years. | ||||||||
56
2. Earnings Per Common Share
Basic earnings per share is the amount of earnings (adjusted for dividends declared on our preferred stock) available to each Common Share outstanding during the reporting periods. Diluted earnings per share is the amount of earnings available to each Common Share outstanding during the reporting periods adjusted to include the effects of potentially dilutive Common Shares. Potentially dilutive Common Shares include stock options and other stock-based awards. Potentially dilutive Common Shares are excluded from the computation of diluted earnings per share in the periods where the effect would be antidilutive.
Our basic and diluted earnings per Common Share are calculated as follows:
| Three months ended March 31, | ||||||||
| dollars in millions, except per share amounts | 2021 | 2020 | ||||||
| EARNINGS | ||||||||
Income (loss) from continuing operations | $ | 618 | $ | 145 | ||||
| Less: Net income (loss) attributable to noncontrolling interests | — | — | ||||||
| Income (loss) from continuing operations attributable to Key | 618 | 145 | ||||||
| Less: Dividends on Preferred Stock | 27 | 27 | ||||||
| Income (loss) from continuing operations attributable to Key common shareholders | 591 | 118 | ||||||
| Income (loss) from discontinued operations, net of taxes | 4 | 1 | ||||||
| Net income (loss) attributable to Key common shareholders | $ | 595 | $ | 119 | ||||
| WEIGHTED-AVERAGE COMMON SHARES | ||||||||
| Weighted-average Common Shares outstanding (000) | 964,878 | 967,446 | ||||||
| Effect of Common Share options and other stock awards | 9,419 | 8,664 | ||||||
Weighted-average Common Shares and potential Common Shares outstanding (000) (a) | 974,297 | 976,110 | ||||||
| EARNINGS PER COMMON SHARE | ||||||||
| Income (loss) from continuing operations attributable to Key common shareholders | $ | .61 | $ | .12 | ||||
| Income (loss) from discontinued operations, net of taxes | — | — | ||||||
Net income (loss) attributable to Key common shareholders (b) | .62 | .12 | ||||||
Income (loss) from continuing operations attributable to Key common shareholders — assuming dilution | $ | .61 | $ | .12 | ||||
| Income (loss) from discontinued operations, net of taxes — assuming dilution | — | — | ||||||
Net income (loss) attributable to Key common shareholders — assuming dilution (b) | .61 | .12 | ||||||
(a)Assumes conversion of Common Share options and other stock awards and/or convertible preferred stock, as applicable.
(b)EPS may not foot due to rounding.
3. Loan Portfolio
Loan Portfolio by Portfolio Segment and Financing Receivable (a)
| in millions | March 31, 2021 | December 31, 2020 | ||||||
Commercial and industrial (b) | $ | 52,486 | $ | 52,907 | ||||
| Commercial real estate: | ||||||||
| Commercial mortgage | 12,702 | 12,687 | ||||||
| Construction | 2,122 | 1,987 | ||||||
| Total commercial real estate loans | 14,824 | 14,674 | ||||||
Commercial lease financing (c) | 4,104 | 4,399 | ||||||
| Total commercial loans | 71,414 | 71,980 | ||||||
| Residential — prime loans: | ||||||||
| Real estate — residential mortgage | 10,300 | 9,298 | ||||||
| Home equity loans | 9,158 | 9,360 | ||||||
| Total residential — prime loans | 19,458 | 18,658 | ||||||
| Consumer direct loans | 4,862 | 4,714 | ||||||
| Credit cards | 909 | 989 | ||||||
| Consumer indirect loans | 4,283 | 4,844 | ||||||
| Total consumer loans | 29,512 | 29,205 | ||||||
Total loans (d) | $ | 100,926 | $ | 101,185 | ||||
(a)Accrued interest of $242 million and $241 million at March 31, 2021, and December 31, 2020, respectively, presented in "other assets" on the Consolidated Balance Sheets is excluded from the amortized cost basis disclosed in this table.
(b)Loan balances include $126 million and $127 million of commercial credit card balances at March 31, 2021, and December 31, 2020, respectively.
(c)Commercial lease financing includes receivables held as collateral for a secured borrowing of $21 million and $23 million at March 31, 2021, and December 31, 2020, respectively. Principal reductions are based on the cash payments received from these related receivables. Additional information pertaining to this secured borrowing is included in Note 20 (“Long-Term Debt”) beginning on page 171 of our 2020 Form 10-K.
(d)Total loans exclude loans of $675 million at March 31, 2021, and $710 million at December 31, 2020, related to the discontinued operations of the education lending business.
57
4. Asset Quality
ALLL
We estimate the appropriate level of the ALLL on at least a quarterly basis. The methodology is described in Note 1 ("Summary of Significant Accounting Policies") under the heading "Allowance for Loan and Lease Losses" beginning on page 110 of our 2020 Form 10-K.
The ALLL at March 31, 2021, represents our current estimate of lifetime credit losses inherent in the loan portfolio at that date. The changes in the ALLL by loan category for the periods indicated are as follows:
Three months ended March 31, 2021:
| in millions | December 31, 2020 | Provision | Charge-offs | Recoveries | March 31, 2021 | |||||||||||||||
| Commercial and Industrial | $ | 678 | $ | (17) | $ | (73) | $ | 8 | $ | 596 | ||||||||||
| Commercial real estate: | ||||||||||||||||||||
| Real estate — commercial mortgage | 327 | (37) | (35) | 1 | 256 | |||||||||||||||
| Real estate — construction | 47 | (2) | — | — | 45 | |||||||||||||||
| Total commercial real estate loans | 374 | (39) | (35) | 1 | 301 | |||||||||||||||
| Commercial lease financing | 47 | (4) | (4) | 1 | 40 | |||||||||||||||
| Total commercial loans | 1,099 | (60) | (112) | 10 | 937 | |||||||||||||||
| Real estate — residential mortgage | 102 | (3) | — | 1 | 100 | |||||||||||||||
| Home equity loans | 171 | (13) | (2) | 1 | 157 | |||||||||||||||
| Consumer direct loans | 128 | 4 | (8) | 2 | 126 | |||||||||||||||
| Credit cards | 87 | (3) | (6) | 2 | 80 | |||||||||||||||
| Consumer indirect loans | 39 | 1 | (7) | 5 | 38 | |||||||||||||||
| Total consumer loans | 527 | (14) | (23) | 11 | 501 | |||||||||||||||
| Total ALLL — continuing operations | 1,626 | (74) | (a) | (135) | 21 | 1,438 | ||||||||||||||
| Discontinued operations | 36 | (3) | (1) | 1 | 33 | |||||||||||||||
| Total ALLL — including discontinued operations | $ | 1,662 | $ | (77) | $ | (136) | $ | 22 | $ | 1,471 | ||||||||||
(a)Excludes a credit for losses on lending-related commitments of $19 million.
Three months ended March 31, 2020:
| in millions | Pre-ASC 326 Adoption December 31, 2019 | Impact of ASC 326 Adoption | January 1, 2020 | Provision | Charge-offs | Recoveries | March 31, 2020 | |||||||||||||||||||
| Commercial and Industrial | $ | 551 | $ | (141) | $ | 410 | $ | 187 | $ | (60) | $ | 5 | $ | 542 | ||||||||||||
| Commercial real estate: | ||||||||||||||||||||||||||
| Real estate — commercial mortgage | 143 | 16 | 159 | 50 | (3) | 1 | 207 | |||||||||||||||||||
| Real estate — construction | 22 | (7) | 15 | 10 | — | — | 25 | |||||||||||||||||||
| Total commercial real estate loans | 165 | 9 | 174 | 60 | (3) | 1 | 232 | |||||||||||||||||||
| Commercial lease financing | 35 | 8 | 43 | 3 | (2) | — | 44 | |||||||||||||||||||
| Total commercial loans | 751 | (124) | 627 | 250 | (65) | 6 | 818 | |||||||||||||||||||
| Real estate — residential mortgage | 7 | 77 | 84 | 5 | — | — | 89 | |||||||||||||||||||
| Home equity loans | 31 | 147 | 178 | 8 | (4) | 2 | 184 | |||||||||||||||||||
| Consumer direct loans | 34 | 63 | 97 | 29 | (12) | 2 | 116 | |||||||||||||||||||
| Credit cards | 47 | 35 | 82 | 31 | (11) | 2 | 104 | |||||||||||||||||||
| Consumer indirect loans | 30 | 6 | 36 | 16 | (9) | 5 | 48 | |||||||||||||||||||
| Total consumer loans | 149 | 328 | 477 | 89 | (36) | 11 | 541 | |||||||||||||||||||
| Total ALLL — continuing operations | 900 | 204 | 1,104 | 339 | (a) | (101) | 17 | 1,359 | ||||||||||||||||||
| Discontinued operations | 10 | 31 | 41 | 3 | (2) | 1 | 43 | |||||||||||||||||||
| Total ALLL — including discontinued operations | $ | 910 | $ | 235 | $ | 1,145 | $ | 342 | $ | (103) | $ | 18 | $ | 1,402 | ||||||||||||
(a)Excludes a provision for losses on lending-related commitments of $20 million.
As described in Note 1 ("Summary of Significant Accounting Policies"), under the heading “Allowance for Loan and Lease Losses” beginning on page 110 of our 2020 Form 10-K, we estimate the ALLL using relevant available information, from internal and external sources, relating to past events, current conditions, and reasonable and supportable forecasts. In our estimation of expected credit losses, we use a two year reasonable and supportable period across all products. Following this two year period in which supportable forecasts can be generated, for all modeled loan portfolios, we revert expected credit losses to a level that is consistent with our historical information by reverting the macroeconomic variables (model inputs) to their long run average. We revert to historical loss rates for less complex estimation methods for smaller portfolios. A 20 year fixed length look back period is used to calculate the long run average of the macroeconomic variables. A four quarter reversion period is used where the
58
macroeconomic variables linearly revert to their long run average following the two year reasonable and supportable period.
We develop our reasonable and supportable forecasts using relevant data including, but not limited to, changes in economic output, unemployment rates, property values, and other factors associated with the credit losses on financial assets. Some macroeconomic variables apply to all portfolio segments, while others are more portfolio specific. The following table discloses key macroeconomic variables for each loan portfolio.
| Segment | Portfolio | Key Macroeconomic Variables (a) | ||||||
| Commercial | Commercial and industrial | BBB corporate bond rate (spread), GDP, industrial production, and unemployment rate | ||||||
| Commercial real estate | BBB corporate bond rate (spread), property and real estate price indices, and unemployment rate | |||||||
| Commercial lease financing | BBB corporate bond rate (spread), GDP, and unemployment rate | |||||||
| Consumer | Real estate — residential mortgage | GDP, home price index, unemployment rate, and 30 year mortgage rate | ||||||
| Home equity | Home price index, unemployment rate, and 30 year mortgage rate | |||||||
| Consumer direct | Unemployment rate and U.S. household income | |||||||
| Consumer indirect | New vehicle sales and unemployment rate | |||||||
| Credit cards | Unemployment rate and U.S. household income | |||||||
| Discontinued operations | Unemployment rate | |||||||
(a)Variables include all transformations and interactions with other risk drivers. Additionally, variables may have varying impacts at different points in the economic cycle.
In addition to macroeconomic drivers, portfolio attributes such as remaining term, outstanding balance, risk ratings, FICO, LTV, and delinquency also drive ALLL changes. Our ALLL models were designed to capture the correlation between economic and portfolio changes. As such, evaluating shifts in individual portfolio attributes and macroeconomic variables in isolation may not be indicative of past or future performance.
Economic Outlook
As of March 31, 2021, the COVID-19 pandemic has continued to create unprecedented economic uncertainty in the U.S. and globally. We utilized the Moody’s February 2021 Consensus forecast to estimate our expected credit losses as of March 31, 2021. We determined such forecast to be a reasonable view of the outlook for the economy given all available information at quarter end.
The baseline scenario reflects modest economic growth over the next two years in markets in which we operate. U.S. GDP continues to rebound with a projected 3.3% annualized growth rate in the first quarter of 2021 and continues to accelerate during the year, which is anticipated to return to pre-pandemic levels by the fourth quarter of 2021 and an overall growth rate of approximately 5% expected for the year. The national unemployment rate forecast is 6.3% in the first quarter of 2021, and expected to decline to 5.4% by the fourth quarter of 2021.
To the extent we identified credit risk considerations that were not captured by the third-party economic forecast, we addressed the risk through management’s qualitative adjustments to the ALLL.
As a result of the unprecedented economic uncertainty caused by the COVID-19 pandemic, our future loss estimates may vary considerably from our March 31, 2021 assumptions.
Commercial Loan Portfolio
The ALLL from continuing operations for the commercial segment decreased by $162 million, or 14.7%, from December 31, 2020. The overall decrease in the allowance is driven by improvements in economic forecasts, a slight decline in loan balances, and improving asset quality.
The changes to the economic forecast primarily reflect improvements in economic drivers used in our models. The unemployment and GDP positive growth outlook contributes to the overall commercial segment reserve decrease. Expected improvements in real estate price indices lead to a reduction in reserve in our commercial real estate book. Risk rating migrations are driving a modest increase in ALLL levels for the commercial and industrial portfolio. The ALLL results also reflect incremental credit risk considerations as a result of the future economic uncertainties which are addressed through qualitative adjustments.
As of March 31, 2021, we concluded that no ALLL is necessary for $6.5 billion in outstanding PPP loans as they are 100% guaranteed by the SBA.
59
Consumer Loan Portfolio
The ALLL from continuing operations for the consumer segment decreased by $26 million, or 4.9%, from December 31, 2020. The overall decrease in the allowance is driven by updated economic forecasts that capture an improving outlook for several drivers and strong portfolio performance.
The most meaningful changes to the economic forecast contributing to the reduction in reserves include improvement in the unemployment rate outlook, which impacts all consumer portfolios. In addition, the housing market and HPI outlook continue to display strength, which impacts the residential mortgage and home equity segments. As it relates to the decline in the ALLL due to portfolio factors, shifts are largely driven by attrition activity, targeted portfolio growth and overall strong credit drivers. The ALLL results also reflect incremental credit risk considerations as a result of the economic stress and related borrower assistance programs, which are addressed through qualitative adjustments.
Credit Risk Profile
The prevalent risk characteristic for both commercial and consumer loans is the risk of loss arising from an obligor’s inability or failure to meet contractual payment or performance terms. Evaluation of this risk is stratified and monitored by the loan risk rating grades assigned for the commercial loan portfolios and the refreshed FICO score assigned for the consumer loan portfolios. The internal risk grades assigned to loans follow our definitions of Pass and Criticized, which are consistent with published definitions of regulatory risk classifications. Loans with a pass rating represent those loans not classified on our rating scale for problem credits, as minimal credit risk has been identified. Criticized loans are those loans that either have a potential weakness deserving management's close attention or have a well-defined weakness that may put full collection of contractual cash flows at risk. Borrower FICO scores provide information about the credit quality of our consumer loan portfolio as they provide an indication as to the likelihood that a debtor will repay its debts. The scores are obtained from a nationally recognized consumer rating agency and are presented in the tables below at the dates indicated.
Most extensions of credit are subject to loan grading or scoring. Loan grades are assigned at the time of origination, verified by credit risk management, and periodically re-evaluated thereafter. This risk rating methodology blends our judgment with quantitative modeling. Commercial loans generally are assigned two internal risk ratings. The first rating reflects the probability that the borrower will default on an obligation; the second rating reflects expected recovery rates on the credit facility. Default probability is determined based on, among other factors, the financial strength of the borrower, an assessment of the borrower’s management, the borrower’s competitive position within its industry sector, and our view of industry risk in the context of the general economic outlook. Types of exposure, transaction structure, and collateral, including credit risk mitigants, affect the expected recovery assessment.
60
Commercial Credit Exposure
Credit Risk Profile by Creditworthiness Category and Vintage (a)
| As of March 31, 2021 | Term Loans | Revolving Loans Amortized Cost Basis | Revolving Loans Converted to Term Loans Amortized Cost Basis | ||||||||||||||||||||||||||
| Amortized Cost Basis by Origination Year and Internal Risk Rating | |||||||||||||||||||||||||||||
| in millions | 2021 | 2020 | 2019 | 2018 | 2017 | Prior | Total | ||||||||||||||||||||||
| Commercial and Industrial | |||||||||||||||||||||||||||||
| Risk Rating: | |||||||||||||||||||||||||||||
| Pass | $ | 2,246 | $ | 11,524 | $ | 5,062 | $ | 3,728 | $ | 2,360 | $ | 5,560 | $ | 18,992 | $ | 81 | $ | 49,553 | |||||||||||
| Criticized (Accruing) | 4 | 96 | 220 | 217 | 223 | 340 | 1,426 | 20 | 2,546 | ||||||||||||||||||||
| Criticized (Nonaccruing) | — | 8 | 19 | 64 | 13 | 54 | 227 | 2 | 387 | ||||||||||||||||||||
| Total commercial and industrial | 2,250 | 11,628 | 5,301 | 4,009 | 2,596 | 5,954 | 20,645 | 103 | 52,486 | ||||||||||||||||||||
| Real estate — commercial mortgage | |||||||||||||||||||||||||||||
| Risk Rating: | |||||||||||||||||||||||||||||
| Pass | 602 | 1,603 | 2,916 | 1,599 | 819 | 3,589 | 695 | 29 | 11,852 | ||||||||||||||||||||
| Criticized (Accruing) | — | 14 | 123 | 103 | 159 | 290 | 93 | 2 | 784 | ||||||||||||||||||||
| Criticized (Nonaccruing) | — | — | 2 | 4 | 4 | 51 | 5 | — | 66 | ||||||||||||||||||||
Total real estate — commercial mortgage | 602 | 1,617 | 3,041 | 1,706 | 982 | 3,930 | 793 | 31 | 12,702 | ||||||||||||||||||||
| Real estate — construction | |||||||||||||||||||||||||||||
| Risk Rating: | |||||||||||||||||||||||||||||
| Pass | 16 | 451 | 798 | 501 | 187 | 49 | 31 | — | 2,033 | ||||||||||||||||||||
| Criticized (Accruing) | — | 4 | 14 | 51 | 18 | 1 | 1 | — | 89 | ||||||||||||||||||||
| Criticized (Nonaccruing) | — | — | — | — | — | — | — | — | — | ||||||||||||||||||||
| Total real estate — construction | 16 | 455 | 812 | 552 | 205 | 50 | 32 | — | 2,122 | ||||||||||||||||||||
| Commercial lease financing | |||||||||||||||||||||||||||||
| Risk Rating: | |||||||||||||||||||||||||||||
| Pass | 152 | 952 | 931 | 462 | 416 | 1,077 | — | — | 3,990 | ||||||||||||||||||||
| Criticized (Accruing) | — | 21 | 35 | 15 | 26 | 9 | — | — | 106 | ||||||||||||||||||||
| Criticized (Nonaccruing) | — | — | 2 | 2 | 2 | 2 | — | — | 8 | ||||||||||||||||||||
| Total commercial lease financing | 152 | 973 | 968 | 479 | 444 | 1,088 | — | 4,104 | |||||||||||||||||||||
| Total commercial loans | $ | 3,020 | $ | 14,673 | $ | 10,122 | $ | 6,746 | $ | 4,227 | $ | 11,022 | $ | 21,470 | $ | 134 | $ | 71,414 | |||||||||||
| As of December 31, 2020 | Term Loans | Revolving Loans Amortized Cost Basis | Revolving Loans Converted to Term Loans Amortized Cost Basis | ||||||||||||||||||||||||||
| Amortized Cost Basis by Origination Year and Internal Risk Rating | |||||||||||||||||||||||||||||
| in millions | 2020 | 2019 | 2018 | 2017 | 2016 | Prior | Total | ||||||||||||||||||||||
| Commercial and Industrial | |||||||||||||||||||||||||||||
| Risk Rating: | |||||||||||||||||||||||||||||
| Pass | $ | 13,100 | $ | 5,487 | $ | 4,040 | $ | 2,617 | $ | 1,967 | $ | 2,709 | $ | 19,832 | $ | 118 | $ | 49,870 | |||||||||||
| Criticized (Accruing) | 66 | 198 | 174 | 236 | 150 | 279 | 1,527 | 22 | 2,652 | ||||||||||||||||||||
| Criticized (Nonaccruing) | 8 | 27 | 71 | 28 | 17 | 7 | 226 | 1 | 385 | ||||||||||||||||||||
| Total commercial and industrial | 13,174 | 5,712 | 4,285 | 2,881 | 2,134 | 2,995 | 21,585 | 141 | 52,907 | ||||||||||||||||||||
| Real estate — commercial mortgage | |||||||||||||||||||||||||||||
| Risk Rating: | |||||||||||||||||||||||||||||
| Pass | 1,591 | 2,937 | 1,737 | 867 | 765 | 3,027 | 885 | 43 | 11,852 | ||||||||||||||||||||
| Criticized (Accruing) | 12 | 142 | 81 | 145 | 72 | 255 | 22 | 2 | 731 | ||||||||||||||||||||
| Criticized (Nonaccruing) | — | 1 | 4 | 4 | 2 | 88 | 5 | — | 104 | ||||||||||||||||||||
Total real estate — commercial mortgage | 1,603 | 3,080 | 1,822 | 1,016 | 839 | 3,370 | 912 | 45 | 12,687 | ||||||||||||||||||||
| Real estate — construction | |||||||||||||||||||||||||||||
| Risk Rating: | |||||||||||||||||||||||||||||
| Pass | 367 | 764 | 510 | 188 | 27 | 22 | 31 | 5 | 1,914 | ||||||||||||||||||||
| Criticized (Accruing) | — | 14 | 38 | 18 | — | 2 | 1 | — | 73 | ||||||||||||||||||||
| Criticized (Nonaccruing) | — | — | — | — | — | — | — | — | — | ||||||||||||||||||||
| Total real estate — construction | 367 | 778 | 548 | 206 | 27 | 24 | 32 | 5 | 1,987 | ||||||||||||||||||||
| Commercial lease financing | |||||||||||||||||||||||||||||
| Risk Rating: | |||||||||||||||||||||||||||||
| Pass | 1,076 | 1,050 | 534 | 504 | 228 | 901 | — | — | 4,293 | ||||||||||||||||||||
| Criticized (Accruing) | 10 | 35 | 15 | 26 | 7 | 4 | — | — | 97 | ||||||||||||||||||||
| Criticized (Nonaccruing) | — | 2 | 2 | 2 | 2 | 1 | — | — | 9 | ||||||||||||||||||||
| Total commercial lease financing | 1,086 | 1,087 | 551 | 532 | 237 | 906 | 0 | — | 4,399 | ||||||||||||||||||||
| Total commercial loans | $ | 16,230 | $ | 10,657 | $ | 7,206 | $ | 4,635 | $ | 3,237 | $ | 7,295 | $ | 22,529 | $ | 191 | $ | 71,980 | |||||||||||
(a)Accrued interest of $143 million and $140 million as of March 31, 2021 and December 31, 2020, respectively, presented in Other Assets on the Consolidated Balance Sheets, was excluded from the amortized cost basis disclosed in these tables.
61
Consumer Credit Exposure
Credit Risk Profile by FICO Score and Vintage (a)
| As of March 31, 2021 | Term Loans | Revolving Loans Amortized Cost Basis | Revolving Loans Converted to Term Loans Amortized Cost Basis | ||||||||||||||||||||||||||
| Amortized Cost Basis by Origination Year and FICO Score | |||||||||||||||||||||||||||||
| in millions | 2021 | 2020 | 2019 | 2018 | 2017 | Prior | Total | ||||||||||||||||||||||
| Real estate — residential mortgage | |||||||||||||||||||||||||||||
| FICO Score: | |||||||||||||||||||||||||||||
| 750 and above | $ | 1,684 | $ | 3,503 | $ | 1,326 | $ | 159 | $ | 213 | $ | 1,525 | — | — | $ | 8,410 | |||||||||||||
| 660 to 749 | 300 | 534 | 245 | 63 | 40 | 384 | — | — | 1,566 | ||||||||||||||||||||
| Less than 660 | 2 | 19 | 17 | 20 | 9 | 172 | — | — | 239 | ||||||||||||||||||||
| No Score | 1 | 1 | 2 | 2 | 6 | 73 | — | — | 85 | ||||||||||||||||||||
| Total real estate — residential mortgage | 1,987 | 4,057 | 1,590 | 244 | 268 | 2,154 | — | — | 10,300 | ||||||||||||||||||||
| Home equity loans | |||||||||||||||||||||||||||||
| FICO Score: | |||||||||||||||||||||||||||||
| 750 and above | 407 | 943 | 367 | 151 | 182 | 926 | $ | 2,544 | $ | 551 | 6,071 | ||||||||||||||||||
| 660 to 749 | 121 | 386 | 172 | 65 | 63 | 280 | 1,132 | 186 | 2,405 | ||||||||||||||||||||
| Less than 660 | 7 | 27 | 24 | 17 | 17 | 121 | 400 | 56 | 669 | ||||||||||||||||||||
| No Score | — | 2 | 2 | 1 | — | 2 | 5 | 1 | 13 | ||||||||||||||||||||
| Total home equity loans | 535 | 1,358 | 565 | 234 | 262 | 1,329 | 4,081 | 794 | 9,158 | ||||||||||||||||||||
| Consumer direct loans | |||||||||||||||||||||||||||||
| FICO Score: | |||||||||||||||||||||||||||||
| 750 and above | 499 | 1,636 | 759 | 103 | 29 | 102 | 110 | — | 3,238 | ||||||||||||||||||||
| 660 to 749 | 120 | 421 | 233 | 67 | 17 | 48 | 231 | 1 | 1,138 | ||||||||||||||||||||
| Less than 660 | 4 | 21 | 31 | 19 | 6 | 14 | 71 | — | 166 | ||||||||||||||||||||
| No Score | 10 | 47 | 37 | 18 | 14 | 20 | 174 | — | 320 | ||||||||||||||||||||
| Total consumer direct loans | 633 | 2,125 | 1,060 | 207 | 66 | 184 | 586 | 1 | 4,862 | ||||||||||||||||||||
| Credit cards | |||||||||||||||||||||||||||||
| FICO Score: | |||||||||||||||||||||||||||||
| 750 and above | — | — | — | — | — | — | 441 | — | 441 | ||||||||||||||||||||
| 660 to 749 | — | — | — | — | — | — | 379 | — | 379 | ||||||||||||||||||||
| Less than 660 | — | — | — | — | — | — | 88 | — | 88 | ||||||||||||||||||||
| No Score | — | — | — | — | — | — | 1 | — | 1 | ||||||||||||||||||||
| Total credit cards | — | — | — | — | — | — | 909 | — | 909 | ||||||||||||||||||||
| Consumer indirect loans | |||||||||||||||||||||||||||||
| FICO Score: | |||||||||||||||||||||||||||||
| 750 and above | 135 | 880 | 851 | 329 | 158 | 105 | — | — | 2,458 | ||||||||||||||||||||
| 660 to 749 | — | 566 | 483 | 193 | 79 | 68 | — | — | 1,389 | ||||||||||||||||||||
| Less than 660 | — | 124 | 140 | 85 | 44 | 42 | — | — | 435 | ||||||||||||||||||||
| No Score | — | — | — | — | — | 1 | — | — | 1 | ||||||||||||||||||||
| Total consumer indirect loans | 135 | 1,570 | 1,474 | 607 | 281 | 216 | — | — | 4,283 | ||||||||||||||||||||
| Total consumer loans | $ | 3,290 | $ | 9,110 | $ | 4,689 | $ | 1,292 | $ | 877 | $ | 3,883 | $ | 5,576 | $ | 795 | $ | 29,512 | |||||||||||
62
| As of December 31, 2020 | Term Loans | Revolving Loans Amortized Cost Basis | Revolving Loans Converted to Term Loans Amortized Cost Basis | ||||||||||||||||||||||||||
| Amortized Cost Basis by Origination Year and FICO Score | |||||||||||||||||||||||||||||
| in millions | 2020 | 2019 | 2018 | 2017 | 2016 | Prior | Total | ||||||||||||||||||||||
| Real estate — residential mortgage | |||||||||||||||||||||||||||||
| FICO Score: | |||||||||||||||||||||||||||||
| 750 and above | $ | 3,595 | $ | 1,620 | $ | 194 | $ | 254 | $ | 537 | $ | 1,211 | — | — | $ | 7,411 | |||||||||||||
| 660 to 749 | 710 | 284 | 76 | 48 | 100 | 332 | — | — | 1,550 | ||||||||||||||||||||
| Less than 660 | 16 | 28 | 21 | 10 | 26 | 170 | — | — | 271 | ||||||||||||||||||||
| No Score | 1 | 2 | 2 | 7 | 2 | 52 | — | — | 66 | ||||||||||||||||||||
| Total real estate — residential mortgage | 4,322 | 1,934 | 293 | 319 | 665 | 1,765 | — | — | 9,298 | ||||||||||||||||||||
| Home equity loans | |||||||||||||||||||||||||||||
| FICO Score: | |||||||||||||||||||||||||||||
| 750 and above | 1,043 | 404 | 168 | 202 | 190 | 839 | $ | 2,689 | $ | 590 | 6,125 | ||||||||||||||||||
| 660 to 749 | 385 | 198 | 82 | 77 | 69 | 253 | 1,237 | 206 | 2,507 | ||||||||||||||||||||
| Less than 660 | 27 | 30 | 18 | 20 | 20 | 113 | 426 | 61 | 715 | ||||||||||||||||||||
| No Score | 2 | 2 | 1 | — | — | 2 | 5 | 1 | 13 | ||||||||||||||||||||
| Total home equity loans | 1,457 | 634 | 269 | 299 | 279 | 1,207 | 4,357 | 858 | 9,360 | ||||||||||||||||||||
| Consumer direct loans | |||||||||||||||||||||||||||||
| FICO Score: | |||||||||||||||||||||||||||||
| 750 and above | 1,840 | 883 | 115 | 32 | 16 | 57 | 119 | — | 3,062 | ||||||||||||||||||||
| 660 to 749 | 479 | 268 | 80 | 22 | 14 | 33 | 254 | 1 | 1,151 | ||||||||||||||||||||
| Less than 660 | 23 | 37 | 21 | 8 | 5 | 10 | 81 | — | 185 | ||||||||||||||||||||
| No Score | 65 | 35 | 21 | 21 | 10 | 11 | 153 | — | 316 | ||||||||||||||||||||
| Total consumer direct loans | 2,407 | 1,223 | 237 | 83 | 45 | 111 | 607 | 1 | 4,714 | ||||||||||||||||||||
| Credit cards | |||||||||||||||||||||||||||||
| FICO Score: | |||||||||||||||||||||||||||||
| 750 and above | — | — | — | — | — | — | 488 | — | 488 | ||||||||||||||||||||
| 660 to 749 | — | — | — | — | — | — | 407 | — | 407 | ||||||||||||||||||||
| Less than 660 | — | — | — | — | — | — | 93 | — | 93 | ||||||||||||||||||||
| No Score | — | — | — | — | — | — | 1 | — | 1 | ||||||||||||||||||||
| Total credit cards | — | — | — | — | — | — | 989 | — | 989 | ||||||||||||||||||||
| Consumer indirect loans | |||||||||||||||||||||||||||||
| FICO Score: | |||||||||||||||||||||||||||||
| 750 and above | 1,092 | 924 | 369 | 188 | 69 | 66 | — | — | 2,708 | ||||||||||||||||||||
| 660 to 749 | 653 | 558 | 232 | 97 | 36 | 47 | — | — | 1,623 | ||||||||||||||||||||
| Less than 660 | 143 | 163 | 99 | 54 | 25 | 28 | — | — | 512 | ||||||||||||||||||||
| No Score | 1 | — | — | — | — | — | — | — | 1 | ||||||||||||||||||||
| Total consumer indirect loans | 1,889 | 1,645 | 700 | 339 | 130 | 141 | — | — | 4,844 | ||||||||||||||||||||
| Total consumer loans | $ | 10,075 | $ | 5,436 | $ | 1,499 | $ | 1,040 | $ | 1,119 | $ | 3,224 | $ | 5,953 | $ | 859 | $ | 29,205 | |||||||||||
(a)Accrued interest of $98 million and $101 million as of March 31, 2021 and December 31, 2020, respectively, presented in Other Assets on the Consolidated Balance Sheets, was excluded from the amortized cost basis disclosed in this table.
Nonperforming and Past Due Loans
Our policies for determining past due loans, placing loans on nonaccrual, applying payments on nonaccrual loans, and resuming accrual of interest for our commercial and consumer loan portfolios are disclosed in Note 1 (“Summary of Significant Accounting Policies”) under the heading “Nonperforming Loans” beginning on page 108 of our 2020 Form 10-K.
Under the CARES Act as well as banking regulator interagency guidance, certain loan modifications to borrowers experiencing financial distress as a result of the economic impacts created by the COVID-19 pandemic may not be required to be reported as past due. For COVID-19 related loan modifications which occurred from March 1, 2020, through March 31, 2021, and met the loan modification criteria under either the CARES Act or the criteria specified by the regulatory agencies, we have elected to re-age to current status all commercial loans and consumer loans that are not secured by real-estate and freeze the delinquency status of consumer real estate secured loans as of the modification or forbearance grant date. At March 31, 2021, the portfolio loans and leases in active deferral or forebearance as part of our COVID-19 hardship relief programs totaled $384 million, of which $328 million of loan modifications and forbearances made under the criteria of either the CARES Act, banking regulator interagency guidance, or short-term forbearance policies were not reported as nonperforming.
63
The following aging analysis of past due and current loans as of March 31, 2021, and December 31, 2020, provides further information regarding Key’s credit exposure.
Aging Analysis of Loan Portfolio(a)
| March 31, 2021 | Current | 30-59 Days Past Due (b) | 60-89 Days Past Due (b) | 90 and Greater Days Past Due (b) | Non-performing Loans | Total Past Due and Non-performing Loans | Total Loans (c) | ||||||||||||||||
| in millions | |||||||||||||||||||||||
| LOAN TYPE | |||||||||||||||||||||||
| Commercial and industrial | $ | 52,000 | $ | 42 | $ | 16 | $ | 41 | $ | 387 | $ | 486 | $ | 52,486 | |||||||||
| Commercial real estate: | |||||||||||||||||||||||
| Commercial mortgage | 12,580 | 17 | 14 | 25 | 66 | 122 | 12,702 | ||||||||||||||||
| Construction | 2,113 | 8 | 1 | — | — | 9 | 2,122 | ||||||||||||||||
| Total commercial real estate loans | 14,693 | 25 | 15 | 25 | 66 | 131 | 14,824 | ||||||||||||||||
| Commercial lease financing | 4,088 | 7 | 1 | — | 8 | 16 | 4,104 | ||||||||||||||||
| Total commercial loans | $ | 70,781 | $ | 74 | $ | 32 | $ | 66 | $ | 461 | $ | 633 | $ | 71,414 | |||||||||
| Real estate — residential mortgage | $ | 10,190 | $ | 9 | $ | 4 | $ | 2 | $ | 95 | $ | 110 | $ | 10,300 | |||||||||
| Home equity loans | 8,958 | 31 | 11 | 10 | 148 | 200 | 9,158 | ||||||||||||||||
| Consumer direct loans | 4,844 | 4 | 4 | 5 | 5 | 18 | 4,862 | ||||||||||||||||
| Credit cards | 892 | 4 | 3 | 7 | 3 | 17 | 909 | ||||||||||||||||
| Consumer indirect loans | 4,250 | 12 | 3 | 2 | 16 | 33 | 4,283 | ||||||||||||||||
| Total consumer loans | $ | 29,134 | $ | 60 | $ | 25 | $ | 26 | $ | 267 | $ | 378 | $ | 29,512 | |||||||||
| Total loans | $ | 99,915 | $ | 134 | $ | 57 | $ | 92 | $ | 728 | $ | 1,011 | $ | 100,926 | |||||||||
(a)Amounts in table represent amortized cost and exclude loans held for sale.
(b)Accrued interest of $242 million presented in Other Assets on the Consolidated Balance Sheets is excluded from the amortized cost basis disclosed in this table.
(c)Net of unearned income, net of deferred fees and costs, and unamortized discounts and premiums.
| December 31, 2020 | Current | 30-59 Days Past Due (b) | 60-89 Days Past Due (b) | 90 and Greater Days Past Due (b) | Non-performing Loans | Total Past Due and Non-performing Loans | Total Loans (c) | ||||||||||||||||
| in millions | |||||||||||||||||||||||
| LOAN TYPE | |||||||||||||||||||||||
| Commercial and industrial | $ | 52,396 | $ | 36 | $ | 50 | $ | 40 | $ | 385 | $ | 511 | $ | 52,907 | |||||||||
| Commercial real estate: | |||||||||||||||||||||||
| Commercial mortgage | 12,548 | 9 | 5 | 21 | 104 | 139 | 12,687 | ||||||||||||||||
| Construction | 1,986 | — | — | 1 | — | 1 | 1,987 | ||||||||||||||||
| Total commercial real estate loans | 14,534 | 9 | 5 | 22 | 104 | 140 | 14,674 | ||||||||||||||||
| Commercial lease financing | 4,369 | 21 | 1 | — | 8 | 30 | 4,399 | ||||||||||||||||
| Total commercial loans | $ | 71,299 | $ | 66 | $ | 56 | $ | 62 | $ | 497 | $ | 681 | $ | 71,980 | |||||||||
| Real estate — residential mortgage | $ | 9,173 | $ | 11 | $ | 3 | $ | 1 | $ | 110 | $ | 125 | $ | 9,298 | |||||||||
| Home equity loans | 9,143 | 34 | 20 | 9 | 154 | 217 | 9,360 | ||||||||||||||||
| Consumer direct loans | 4,694 | 7 | 4 | 4 | 5 | 20 | 4,714 | ||||||||||||||||
| Credit cards | 972 | 5 | 3 | 7 | 2 | 17 | 989 | ||||||||||||||||
| Consumer indirect loans | 4,792 | 25 | 7 | 3 | 17 | 52 | 4,844 | ||||||||||||||||
| Total consumer loans | $ | 28,774 | $ | 82 | $ | 37 | $ | 24 | $ | 288 | $ | 431 | $ | 29,205 | |||||||||
| Total loans | $ | 100,073 | $ | 148 | $ | 93 | $ | 86 | $ | 785 | $ | 1,112 | $ | 101,185 | |||||||||
(a)Amounts in table represent amortized cost and exclude loans held for sale.
(b)Accrued interest of $241 million presented in Other Assets on the Consolidated Balance Sheets is excluded from the amortized cost basis disclosed in this table.
(c)Net of unearned income, net of deferred fees and costs, and unamortized discounts and premiums.
At March 31, 2021, the approximate carrying amount of our commercial nonperforming loans outstanding represented 68% of their original contractual amount owed, total nonperforming loans outstanding represented 75% of their original contractual amount owed, and nonperforming assets in total were carried at 81% of their original contractual amount owed.
Nonperforming loans reduced expected interest income by $7 million for the three months ended March 31, 2021, and $6 million for the three months ended March 31, 2020.
The amortized cost basis of nonperforming loans on nonaccrual status for which there is no related allowance for credit losses was $461 million at March 31, 2021.
64
Collateral-dependent Financial Assets
We classify financial assets as collateral-dependent when our borrower is experiencing financial difficulty, and we expect repayment to be provided substantially through the operation or sale of the collateral. Our commercial loans have collateral that includes commercial machinery, commercial properties, and commercial real estate construction projects. Our consumer loans have collateral that includes residential real estate, automobiles, boats, and RVs.
There were no significant changes in the extent to which collateral secures our collateral-dependent financial assets during the three months ended March 31, 2021.
TDRs
We classify loan modifications as TDRs when a borrower is experiencing financial difficulties and we have granted a concession without commensurate financial, structural, or legal consideration. Our loan modifications are handled on a case-by-case basis and are negotiated to achieve mutually agreeable terms that maximize loan collectability and meet the borrower’s financial needs. Under the CARES Act as well as banking regulator interagency guidance, certain loan modifications to borrowers experiencing financial distress as a result of the economic impacts created by the COVID-19 pandemic may not be required to be treated as TDRs under U.S. GAAP. We elected to suspend TDR accounting for $328 million of COVID-19 related loan modifications as of March 31, 2021 as such loan modifications met the criteria under either the CARES Act or banking regulator interagency guidance.
Commitments outstanding to lend additional funds to borrowers whose loan terms have been modified in TDRs were $14 million and $1 million at March 31, 2021, and December 31, 2020, respectively.
The consumer TDR other concession category in the table below primarily includes those borrowers’ debts that are discharged through Chapter 7 bankruptcy and have not been formally re-affirmed. At March 31, 2021, and December 31, 2020, the recorded investment of consumer residential mortgage loans in the process of foreclosure was approximately $83 million and $92 million, respectively.
The following table shows the post-modification outstanding recorded investment by concession type for our commercial and consumer accruing and nonaccruing TDRs that occurred during the periods indicated:
| Three Months Ended March 31, | ||||||||
| in millions | 2021 | 2020 | ||||||
| Commercial loans: | ||||||||
| Extension of Maturity Date | 41 | $ | — | |||||
| Payment or Covenant Modification/Deferment | 10 | — | ||||||
| Total | 51 | $ | — | |||||
| Consumer loans: | ||||||||
| Interest rate reduction | $ | 2 | $ | 9 | ||||
| Other | 4 | 9 | ||||||
| Total | $ | 6 | $ | 18 | ||||
| Total TDRs | $ | 57 | $ | 18 | ||||
The following table summarizes the change in the post-modification outstanding recorded investment of our accruing and nonaccruing TDRs during the periods indicated:
| Three Months Ended March 31, | ||||||||
| in millions | 2021 | 2020 | ||||||
| Balance at beginning of the period | $ | 363 | $ | 347 | ||||
| Additions | 59 | 17 | ||||||
| Payments | (21) | (18) | ||||||
| Charge-offs | (25) | (6) | ||||||
| Balance at end of period | $ | 376 | $ | 340 | ||||
65
A further breakdown of TDRs included in nonperforming loans by loan category for the periods indicated are as follows:
| March 31, 2021 | December 31, 2020 | ||||||||||||||||||||||
Number of Loans | Pre-modification Outstanding Recorded Investment | Post-modification Outstanding Recorded Investment | Number of Loans | Pre-modification Outstanding Recorded Investment | Post-modification Outstanding Recorded Investment | ||||||||||||||||||
| dollars in millions | |||||||||||||||||||||||
| LOAN TYPE | |||||||||||||||||||||||
| Nonperforming: | |||||||||||||||||||||||
| Commercial and industrial | 57 | $ | 128 | $ | 87 | 66 | $ | 136 | $ | 92 | |||||||||||||
| Commercial real estate: | |||||||||||||||||||||||
| Commercial mortgage | 5 | 62 | 34 | 7 | 62 | 50 | |||||||||||||||||
| Total commercial real estate loans | 5 | 62 | 34 | 7 | 62 | 50 | |||||||||||||||||
| Total commercial loans | 62 | 190 | 121 | 73 | 198 | 142 | |||||||||||||||||
| Real estate — residential mortgage | 206 | 25 | 24 | 258 | 35 | 34 | |||||||||||||||||
| Home equity loans | 564 | 35 | 32 | 630 | 41 | 37 | |||||||||||||||||
| Consumer direct loans | 203 | 4 | 3 | 212 | 3 | 3 | |||||||||||||||||
| Credit cards | 265 | 2 | 2 | 356 | 2 | 2 | |||||||||||||||||
| Consumer indirect loans | 776 | 14 | 10 | 861 | 15 | 11 | |||||||||||||||||
| Total consumer loans | 2,014 | 80 | 71 | 2,317 | 96 | 87 | |||||||||||||||||
| Total nonperforming TDRs | 2,076 | 270 | 192 | 2,390 | 294 | 229 | |||||||||||||||||
Prior-year accruing:(a) | |||||||||||||||||||||||
| Commercial and industrial | 12 | 43 | 41 | 3 | 5 | — | |||||||||||||||||
| Commercial real estate | |||||||||||||||||||||||
| Commercial mortgage | — | — | — | — | — | — | |||||||||||||||||
| Total commercial real estate loans | — | — | — | — | — | — | |||||||||||||||||
| Total commercial loans | 12 | 43 | 41 | 3 | 5 | — | |||||||||||||||||
| Real estate — residential mortgage | 513 | 44 | 39 | 485 | 37 | 31 | |||||||||||||||||
| Home equity loans | 1,779 | 107 | 84 | 1,781 | 106 | 83 | |||||||||||||||||
| Consumer direct loans | 202 | 5 | 3 | 163 | 4 | 3 | |||||||||||||||||
| Credit cards | 638 | 4 | 2 | 536 | 3 | 1 | |||||||||||||||||
| Consumer indirect loans | 787 | 28 | 15 | 775 | 29 | 16 | |||||||||||||||||
| Total consumer loans | 3,919 | 188 | 143 | 3,740 | 179 | 134 | |||||||||||||||||
| Total prior-year accruing TDRs | 3,931 | 231 | 184 | 3,743 | 184 | 134 | |||||||||||||||||
| Total TDRs | 6,007 | $ | 501 | $ | 376 | 6,133 | $ | 478 | $ | 363 | |||||||||||||
(a)All TDRs that were restructured prior to January 1, 2021, and January 1, 2020, and are fully accruing.
Commercial loan TDRs are considered defaulted when principal and interest payments are 90 days past due. Consumer loan TDRs are considered defaulted when principal and interest payments are more than 60 days past due. During the three months ended March 31, 2021, there were two commercial loan TDRs and 36 consumer loan TDRs with a combined recorded investment of $1 million that experienced payment defaults after modifications resulting in TDR status during 2020. During the three months ended March 31, 2020, there were no commercial loan TDRs and 84 consumer loan TDRs with a combined recorded investment of $2 million that experienced payment defaults after modifications resulting in TDR status during 2019.
Liability for Credit Losses on Off Balance Sheet Exposures
The liability for credit losses inherent in unfunded lending-related commitments, such as letters of credit and unfunded loan commitments, and certain financial guarantees is included in “accrued expense and other liabilities” on the balance sheet.
Changes in the liability for credit losses on off balance sheet exposures are summarized as follows:
| Three months ended March 31, | ||||||||
| in millions | 2021 | 2020 | ||||||
| Balance at the end of the prior period | $ | 197 | $ | 68 | ||||
| Liability for credit losses on contingent guarantees at the end of the prior period | — | 7 | ||||||
Cumulative effect from change in accounting principle (a), (b) | — | 66 | ||||||
| Balance at beginning of period | 197 | 141 | ||||||
| Provision (credit) for losses on off balance sheet exposures | (19) | 20 | ||||||
| Balance at end of period | $ | 178 | $ | 161 | ||||
(a)The cumulative effect from change in accounting principle relates to the January 1, 2020, adoption of ASU 2016-13.
(b)The three months ended March 31, 2020, amount excludes $4 million related to the provision for other financial assets.
66
5. Fair Value Measurements
In accordance with GAAP, Key measures certain assets and liabilities at fair value. Fair value is defined as the price to sell an asset or transfer a liability in an orderly transaction between market participants in our principal market. Additional information regarding our accounting policies for determining fair value is provided in Note 6 (“Fair Value Measurements”) and Note 1 (“Summary of Significant Accounting Policies”) under the heading “Fair Value Measurements” of our 2020 Form 10-K.
67
Assets and Liabilities Measured at Fair Value on a Recurring Basis
Certain assets and liabilities are measured at fair value on a recurring basis in accordance with GAAP. For more information on the valuation techniques used to measure classes of assets and liabilities reported at fair value on a recurring basis as well as the classification of each in the valuation hierarchy, refer to Note 6 (“Fair Value Measurements” in our 2020 Form 10-K. The following tables present these assets and liabilities at March 31, 2021, and December 31, 2020.
| March 31, 2021 | December 31, 2020 | |||||||||||||||||||||||||
| Level 1 | Level 2 | Level 3 | Total | Level 1 | Level 2 | Level 3 | Total | |||||||||||||||||||
| in millions | ||||||||||||||||||||||||||
| ASSETS MEASURED ON A RECURRING BASIS | ||||||||||||||||||||||||||
| Short-term investments | ||||||||||||||||||||||||||
| U.S. Treasury Bills | — | — | — | — | — | — | — | — | ||||||||||||||||||
| Total short-term investments | — | — | — | — | — | — | — | — | ||||||||||||||||||
| Trading account assets: | ||||||||||||||||||||||||||
| U.S. Treasury, agencies and corporations | — | $ | 550 | — | $ | 550 | — | $ | 633 | — | $ | 633 | ||||||||||||||
| States and political subdivisions | — | 72 | — | 72 | — | 24 | — | 24 | ||||||||||||||||||
| Other mortgage-backed securities | — | 162 | — | 162 | — | 47 | — | 47 | ||||||||||||||||||
| Other securities | — | 14 | — | 14 | — | 13 | — | 13 | ||||||||||||||||||
| Total trading account securities | — | 798 | — | 798 | — | 717 | — | 717 | ||||||||||||||||||
| Commercial loans | — | 13 | — | 13 | — | 18 | — | 18 | ||||||||||||||||||
| Total trading account assets | — | 811 | — | 811 | — | 735 | — | 735 | ||||||||||||||||||
| Securities available for sale: | ||||||||||||||||||||||||||
| U.S. Treasury, agencies and corporations | — | 4,901 | — | 4,901 | — | 1,000 | — | 1,000 | ||||||||||||||||||
| States and political subdivisions | — | — | — | — | — | — | — | — | ||||||||||||||||||
| Agency residential collateralized mortgage obligations | — | 14,449 | — | 14,449 | — | 14,273 | — | 14,273 | ||||||||||||||||||
| Agency residential mortgage-backed securities | — | 4,026 | — | 4,026 | — | 2,164 | — | 2,164 | ||||||||||||||||||
| Agency commercial mortgage-backed securities | — | 10,525 | — | 10,525 | — | 10,106 | — | 10,106 | ||||||||||||||||||
| Other securities | — | — | $ | 22 | 22 | — | — | $ | 13 | 13 | ||||||||||||||||
| Total securities available for sale | — | 33,901 | 22 | 33,923 | — | 27,543 | 13 | 27,556 | ||||||||||||||||||
| Other investments: | ||||||||||||||||||||||||||
| Principal investments: | ||||||||||||||||||||||||||
| Direct | — | — | 1 | 1 | — | — | 1 | 1 | ||||||||||||||||||
Indirect (measured at NAV) (a) | — | — | — | 51 | — | — | — | 53 | ||||||||||||||||||
| Total principal investments | — | — | 1 | 52 | — | — | 1 | 54 | ||||||||||||||||||
| Equity investments: | ||||||||||||||||||||||||||
| Direct | — | 13 | 9 | 22 | — | — | 13 | 13 | ||||||||||||||||||
Direct (measured at NAV) (a) | — | — | — | 7 | — | — | — | 7 | ||||||||||||||||||
Indirect (measured at NAV) (a) | — | — | — | 7 | — | — | — | 7 | ||||||||||||||||||
| Total equity investments | — | 13 | 9 | 36 | — | — | 13 | 27 | ||||||||||||||||||
| Total other investments | — | 13 | 10 | 88 | — | — | 14 | 81 | ||||||||||||||||||
| Loans, net of unearned income (residential) | — | — | 11 | 11 | — | — | 11 | 11 | ||||||||||||||||||
| Loans held for sale (residential) | — | 236 | — | 236 | — | 264 | — | 264 | ||||||||||||||||||
| Derivative assets: | ||||||||||||||||||||||||||
| Interest rate | — | 985 | 30 | 1,015 | — | 1,528 | 56 | 1,584 | ||||||||||||||||||
| Foreign exchange | $ | 74 | 21 | — | 95 | $ | 78 | 31 | — | 109 | ||||||||||||||||
| Commodity | — | 638 | — | 638 | — | 424 | 2 | 426 | ||||||||||||||||||
| Credit | — | — | 1 | 1 | — | — | 1 | 1 | ||||||||||||||||||
| Other | — | 25 | 8 | 33 | — | 26 | 32 | 58 | ||||||||||||||||||
| Derivative assets | 74 | 1,669 | 39 | 1,782 | 78 | 2,009 | 91 | 2,178 | ||||||||||||||||||
Netting adjustments (b) | — | — | — | (258) | — | — | — | (380) | ||||||||||||||||||
| Total derivative assets | 74 | 1,669 | 39 | 1,524 | 78 | 2,009 | 91 | 1,798 | ||||||||||||||||||
| Accrued income and other assets | — | — | — | — | — | — | — | — | ||||||||||||||||||
| Total assets on a recurring basis at fair value | $ | 74 | $ | 36,630 | $ | 82 | $ | 36,593 | $ | 78 | $ | 30,551 | $ | 129 | $ | 30,445 | ||||||||||
| LIABILITIES MEASURED ON A RECURRING BASIS | ||||||||||||||||||||||||||
| Bank notes and other short-term borrowings: | ||||||||||||||||||||||||||
| Short positions | $ | 143 | $ | 600 | — | $ | 743 | $ | 256 | $ | 503 | — | $ | 759 | ||||||||||||
| Derivative liabilities: | ||||||||||||||||||||||||||
| Interest rate | — | 318 | — | 318 | — | 288 | — | 288 | ||||||||||||||||||
| Foreign exchange | 64 | 20 | — | 84 | 72 | 31 | — | 103 | ||||||||||||||||||
| Commodity | — | 620 | — | 620 | — | 408 | — | 408 | ||||||||||||||||||
| Credit | — | 3 | $ | 5 | 8 | — | — | $ | 11 | 11 | ||||||||||||||||
| Other | — | 11 | 3 | 14 | — | 16 | — | 16 | ||||||||||||||||||
| Derivative liabilities | 64 | 972 | 8 | 1,044 | 72 | 743 | 11 | 826 | ||||||||||||||||||
Netting adjustments (b) | — | — | — | (861) | — | — | — | (675) | ||||||||||||||||||
| Total derivative liabilities | 64 | 972 | 8 | 183 | 72 | 743 | 11 | 151 | ||||||||||||||||||
| Total liabilities on a recurring basis at fair value | $ | 207 | $ | 1,572 | $ | 8 | $ | 926 | $ | 328 | $ | 1,246 | $ | 11 | $ | 910 | ||||||||||
(a)Certain investments that are measured at fair value using the net asset value per share (or its equivalent) practical expedient have not been classified in the fair value hierarchy. The fair value amounts presented in this table are intended to permit reconciliation of the fair value hierarchy to the amounts presented in the consolidated balance sheet.
(b)Netting adjustments represent the amounts recorded to convert our derivative assets and liabilities from a gross basis to a net basis in accordance with the applicable accounting guidance. The net basis takes into account the impact of bilateral collateral and master netting agreements that allow us to settle all derivative contracts with a single counterparty on a net basis and to offset the net derivative position with the related cash collateral. Total derivative assets and liabilities include these netting adjustments.
68
The following table presents the fair value of our direct and indirect principal investments and related unfunded commitments at March 31, 2021, as well as financial support provided for the three months ended March 31, 2021, and March 31, 2020.
| Financial support provided | ||||||||||||||||||||||||||
| Three months ended March 31, | ||||||||||||||||||||||||||
| March 31, 2021 | 2021 | 2020 | ||||||||||||||||||||||||
| in millions | Fair Value | Unfunded Commitments | Funded Commitments | Funded Other | Funded Commitments | Funded Other | ||||||||||||||||||||
| INVESTMENT TYPE | ||||||||||||||||||||||||||
| Direct investments | $ | 1 | — | — | — | — | — | |||||||||||||||||||
Indirect investments (measured at NAV) (a) | 51 | $ | 16 | $ | 2 | — | — | — | ||||||||||||||||||
| Total | $ | 52 | $ | 16 | $ | 2 | — | — | — | |||||||||||||||||
(a) Our indirect investments consist of buyout funds, venture capital funds, and fund of funds. These investments are generally not redeemable. Instead, distributions are received through the liquidation of the underlying investments of the fund. An investment in any one of these funds typically can be sold only with the approval of the fund’s general partners. At March 31, 2021, no significant liquidation of the underlying investments has been communicated to Key. The purpose of funding our capital commitments to these investments is to allow the funds to make additional follow-on investments and pay fund expenses until the fund dissolves. We, and all other investors in the fund, are obligated to fund the full amount of our respective capital commitments to the fund based on our and their respective ownership percentages, as noted in the applicable Limited Partnership Agreement.
Changes in Level 3 Fair Value Measurements
The following table shows the components of the change in the fair values of our Level 3 financial instruments measured at fair value on a recurring basis for the three months ended March 31, 2021, and March 31, 2020.
| in millions | Beginning of Period Balance | Gains (Losses) Included in Other Comprehensive Income | Gains (Losses) Included in Earnings | Purchases | Sales | Settlements | Transfers Other | Transfers into Level 3 | Transfers out of Level 3 | End of Period Balance | Unrealized Gains (Losses) Included in Earnings | |||||||||||||||||||||||||||||||||
| Three months ended March 31, 2021 | ||||||||||||||||||||||||||||||||||||||||||||
| Securities available for sale | ||||||||||||||||||||||||||||||||||||||||||||
| Other securities | $ | 13 | $ | 9 | — | — | — | — | — | — | — | $ | 22 | — | ||||||||||||||||||||||||||||||
| Other investments | ||||||||||||||||||||||||||||||||||||||||||||
| Principal investments | ||||||||||||||||||||||||||||||||||||||||||||
Direct (a) | 1 | — | — | — | — | — | — | — | — | 1 | — | |||||||||||||||||||||||||||||||||
| Equity investments | ||||||||||||||||||||||||||||||||||||||||||||
Direct (a) | 13 | — | $ | (1) | — | — | — | — | — | (3) | 9 | $ | (1) | |||||||||||||||||||||||||||||||
| Loans held for sale (residential) | — | — | — | — | $ | (1) | — | $ | 1 | — | — | — | — | |||||||||||||||||||||||||||||||
| Loans, net of unearned income (residential) | 11 | — | — | — | (1) | — | 1 | — | — | 11 | — | |||||||||||||||||||||||||||||||||
Derivative instruments (b) | ||||||||||||||||||||||||||||||||||||||||||||
| Interest rate | 56 | — | $ | (22) | (c) | $ | — | (4) | — | — | $ | 7 | (d) | $ | (7) | (d) | 30 | — | ||||||||||||||||||||||||||
| Credit | (10) | — | 5 | (c) | — | — | — | — | — | — | (5) | — | ||||||||||||||||||||||||||||||||
Other (e) | 32 | — | (4) | — | — | — | (22) | — | — | 6 | — | |||||||||||||||||||||||||||||||||
| in millions | Beginning of Period Balance | Gains (Losses) Included in Other Comprehensive Income | Gains (Losses) Included in Earnings | Purchases | Sales | Settlements | Transfers Other | Transfers into Level 3 | Transfers out of Level 3 | End of Period Balance | Unrealized Gains (Losses) Included in Earnings | |||||||||||||||||||||||||||||||||
| Three months ended March 31, 2020 | ||||||||||||||||||||||||||||||||||||||||||||
| Securities available for sale | ||||||||||||||||||||||||||||||||||||||||||||
| Other securities | $ | 11 | $ | (2) | — | — | — | — | — | — | — | $ | 9 | — | ||||||||||||||||||||||||||||||
| Other investments | ||||||||||||||||||||||||||||||||||||||||||||
| Principal investments | ||||||||||||||||||||||||||||||||||||||||||||
Direct (a) | 1 | — | — | — | — | — | — | — | — | 1 | — | |||||||||||||||||||||||||||||||||
| Equity investments | ||||||||||||||||||||||||||||||||||||||||||||
Direct (a) | 12 | — | $ | (2) | — | — | — | — | — | — | 10 | $ | (2) | |||||||||||||||||||||||||||||||
| Loans held for sale (residential) | — | — | — | — | — | — | $ | 10 | — | — | 10 | — | ||||||||||||||||||||||||||||||||
| Loans, net of unearned income (residential) | 4 | — | — | — | $ | (1) | — | — | — | — | 3 | — | ||||||||||||||||||||||||||||||||
Derivative instruments (b) | ||||||||||||||||||||||||||||||||||||||||||||
| Interest rate | 22 | — | 19 | (c) | 11 | (1) | — | — | $ | 55 | (d) | $ | (10) | (d) | 96 | — | ||||||||||||||||||||||||||||
| Credit | (8) | — | (16) | (c) | $ | 1 | — | — | — | (23) | — | |||||||||||||||||||||||||||||||||
Other (e) | 5 | — | — | — | — | — | 18 | — | — | 23 | — | |||||||||||||||||||||||||||||||||
(a)Realized and unrealized gains and losses on principal investments and other equity investments are reported in “other income” on the income statement.
(b)Amounts represent Level 3 derivative assets less Level 3 derivative liabilities.
(c)Realized and unrealized gains and losses on derivative instruments are reported in “corporate services income” and “other income” on the income statement.
(d)Certain instruments previously classified as Level 2 were transferred to Level 3 because Level 3 unobservable inputs became significant. Certain derivatives previously classified as Level 3 were transferred to Level 2 because Level 3 unobservable inputs became less significant.
(e)Amounts represent Level 3 interest rate lock commitments.
69
Assets and Liabilities Measured at Fair Value on a Nonrecurring Basis
Certain assets and liabilities are measured at fair value on a nonrecurring basis in accordance with GAAP. The adjustments to fair value generally result from the application of accounting guidance that requires assets and liabilities to be recorded at the lower of cost or fair value, or assessed for impairment. For more information on the valuation techniques used to measure classes of assets and liabilities measured at fair value on a nonrecurring basis, refer to Note 6 (“Fair Value Measurements” in our 2020 Form 10-K. There were no liabilities measured at fair value on a nonrecurring basis at March 31, 2021, and December 31, 2020.
The following table presents our assets measured at fair value on a nonrecurring basis at March 31, 2021, and December 31, 2020:
| March 31, 2021 | December 31, 2020 | ||||||||||||||||||||||||||||
| in millions | Level 1 | Level 2 | Level 3 | Total | Level 1 | Level 2 | Level 3 | Total | |||||||||||||||||||||
| ASSETS MEASURED ON A NONRECURRING BASIS | |||||||||||||||||||||||||||||
| Collateral-dependent loans | — | — | $ | 64 | $ | 64 | — | $ | 108 | $ | 108 | ||||||||||||||||||
| Loans held for sale | — | — | 8 | 8 | — | — | — | ||||||||||||||||||||||
| Accrued income and other assets | — | — | 72 | 72 | — | 56 | 56 | ||||||||||||||||||||||
| Total assets on a nonrecurring basis at fair value | — | — | $ | 144 | $ | 144 | — | — | $ | 164 | $ | 164 | |||||||||||||||||
We have other investments in equity securities that do not have readily determinable fair values and do not qualify for the practical expedient to measure the investment using a net asset value per share. We have elected to measure these securities at cost less impairment plus or minus adjustments due to observable orderly transactions. Impairment is recorded when there is evidence that the expected fair value of the investment has declined to below the recorded cost. At each reporting period, we assess if these investments continue to qualify for this measurement alternative. At March 31, 2021, and December 31, 2020, the carrying amount of equity investments under this method was $171 million and $171 million, respectively. No impairment was recorded for the three months ended March 31, 2021.
Quantitative Information about Level 3 Fair Value Measurements
The range and weighted-average of the significant unobservable inputs used to fair value our material Level 3
recurring and nonrecurring assets at March 31, 2021, and December 31, 2020, along with the valuation
techniques used, are shown in the following table:
| Level 3 Asset (Liability) | Valuation Technique | Significant Unobservable Input | Range (Weighted-Average) (b), (c) | |||||||||||||||||
dollars in millions | March 31, 2021 | December 31, 2020 | March 31, 2021 | December 31, 2020 | ||||||||||||||||
| Recurring | ||||||||||||||||||||
Securities available-for-sale: | ||||||||||||||||||||
Other securities | $ | 22 | 13 | Discounted cash flows | Discount rate | N/A (16.61%) | N/A (15.09%) | |||||||||||||
Marketability discount | N/A (30.00%) | N/A (30.00%) | ||||||||||||||||||
Volatility factor | N/A (55.00%) | N/A (44.00%) | ||||||||||||||||||
Other investments:(a) | ||||||||||||||||||||
Equity investments | ||||||||||||||||||||
Direct | 9 | 13 | Discounted cash flows | Discount rate | 14.60 - 18.14% (16.13%) | 13.90 - 17.04% (15.47%) | ||||||||||||||
Marketability discount | N/A (30.00%) | N/A (30.00%) | ||||||||||||||||||
Volatility factor | N/A (52.00%) | N/A (52.00%) | ||||||||||||||||||
Loans, net of unearned income (residential) | 11 | 11 | Market comparable pricing | Comparability factor | .00 - 98.11% (95.06%) | 64.50-99.04% (94.17%) | ||||||||||||||
Derivative instruments: | ||||||||||||||||||||
Interest rate | 30 | 56 | Discounted cash flows | Probability of default | .02 - 100% (6.70%) | .02 - 100% (7.90%) | ||||||||||||||
Internal risk rating | 1 - 19 (9.731) | 1 - 19 (9.675) | ||||||||||||||||||
Loss given default | 0 - 1 (.485) | 0 - 1 (.483) | ||||||||||||||||||
Credit (assets) | 1 | 1 | Discounted cash flows | Probability of default | .02 - 100% (3.60%) | .02 - 100% (4.70%) | ||||||||||||||
Internal risk rating | 1 - 19 (10.281) | 1 - 19 (10.478) | ||||||||||||||||||
Loss given default | 0 - 1 (.491) | 0 - 1 (.490) | ||||||||||||||||||
Credit (liabilities) | (5) | (11) | Discounted cash flows | Probability of default | .02 - 100% (13.10%) | .02 - 100% (15.45%) | ||||||||||||||
Internal risk rating | 1 - 19 (8.738) | 1 - 19 (8.555) | ||||||||||||||||||
Loss given default | 0 - 1 (.443) | 0 - 1 (.431) | ||||||||||||||||||
Other(d) | 6 | 32 | Discounted cash flows | Loan closing rates | 36.95 - 99.68% (77.51%) | 36.95 - 99.68% (77.51%) | ||||||||||||||
| Nonrecurring | ||||||||||||||||||||
| Collateral-dependent loans | 64 | 108 | Fair value of collateral | Discount rate | 0 - 100.00% (32.00%) | 0 - 100.00% (36.00%) | ||||||||||||||
| Loans held for sale | 8 | — | Market comparable pricing | Comparability factor | N/M | N/A | ||||||||||||||
Accrued income and other assets: | ||||||||||||||||||||
OREO and other Level 3 assets (e) | 11 | 16 | Appraised value | Appraised value | N/M | N/M | ||||||||||||||
(a)Principal investments, direct is excluded from this table as the balance at March 31, 2021, and December 31, 2020, is insignificant (less than $1 million).
70
(b)The weighted average of significant unobservable inputs is calculated using a weighting relative to fair value.
(c)For significant unobservable inputs with no range, a single figure is reported to denote the single quantitative factor used.
(d)Amounts represent interest rate lock commitments.
(e)Excludes $61 million and $40 million pertaining to servicing assets at March 31, 2021, and December 31, 2020, respectively. Refer to Note 8 (“Mortgage Servicing Assets”) for significant unobservable inputs pertaining to these assets.
Fair Value Disclosures of Financial Instruments
The Levels in the fair value hierarchy ascribed to our financial instruments and the related carrying amounts at March 31, 2021, and December 31, 2020, are shown in the following tables. Assets and liabilities are further arranged by measurement category.
| March 31, 2021 | ||||||||||||||||||||||||||
| Fair Value | ||||||||||||||||||||||||||
| in millions | Carrying Amount | Level 1 | Level 2 | Level 3 | Measured at NAV | Netting Adjustment | Total | |||||||||||||||||||
| ASSETS (by measurement category) | ||||||||||||||||||||||||||
| Fair value - net income | ||||||||||||||||||||||||||
Trading account assets (b) | $ | 811 | $ | — | $ | 811 | — | — | — | $ | 811 | |||||||||||||||
Other investments (b) | 621 | — | 13 | $ | 542 | $ | 66 | — | 621 | |||||||||||||||||
Loans, net of unearned income (residential) (d) | 11 | — | — | 11 | — | — | 11 | |||||||||||||||||||
Loans held for sale (residential) (b) | 236 | — | 236 | — | — | — | 236 | |||||||||||||||||||
Derivative assets - trading (b) | 1,421 | 74 | 1,625 | 38 | — | $ | (316) | (f) | 1,421 | |||||||||||||||||
| Fair value - OCI | ||||||||||||||||||||||||||
Securities available for sale (b) | 33,923 | — | 33,901 | 22 | — | — | 33,923 | |||||||||||||||||||
Derivative assets - hedging (b)(g) | 103 | — | 45 | — | — | 58 | (f) | 103 | ||||||||||||||||||
| Amortized cost | ||||||||||||||||||||||||||
Held-to-maturity securities (c) | 6,857 | — | 7,159 | — | — | — | 7,159 | |||||||||||||||||||
Loans, net of unearned income (d) | 99,477 | — | — | 99,253 | — | — | 99,253 | |||||||||||||||||||
Loans held for sale (b) | 2,060 | — | — | 2,060 | — | — | 2,060 | |||||||||||||||||||
| Other | ||||||||||||||||||||||||||
Cash and other short-term investments (a) | 16,314 | 16,314 | — | — | — | — | 16,314 | |||||||||||||||||||
| LIABILITIES (by measurement category) | ||||||||||||||||||||||||||
| Fair value - net income | ||||||||||||||||||||||||||
Derivative liabilities - trading (b) | $ | 177 | $ | 64 | $ | 966 | 8 | — | $ | (861) | (f) | $ | 177 | |||||||||||||
| Fair value - OCI | ||||||||||||||||||||||||||
Derivative liabilities - hedging (b)(g) | 6 | — | 6 | — | — | — | (f) | 6 | ||||||||||||||||||
| Amortized cost | ||||||||||||||||||||||||||
Time deposits (e) | 5,219 | — | 5,234 | — | — | — | 5,234 | |||||||||||||||||||
Short-term borrowings (a) | 1,025 | 143 | 882 | — | — | — | 1,025 | |||||||||||||||||||
Long-term debt (e) | 12,499 | 12,396 | 727 | — | — | — | 13,123 | |||||||||||||||||||
| Other | ||||||||||||||||||||||||||
Deposits with no stated maturity (a) | 136,964 | — | 136,964 | — | — | — | 136,964 | |||||||||||||||||||
| December 31, 2020 | ||||||||||||||||||||||||||
| Fair Value | ||||||||||||||||||||||||||
| in millions | Carrying Amount | Level 1 | Level 2 | Level 3 | Measured at NAV | Netting Adjustment | Total | |||||||||||||||||||
| ASSETS (by measurement category) | ||||||||||||||||||||||||||
| Fair value - net income | ||||||||||||||||||||||||||
Trading account assets (b) | $ | 735 | — | $ | 735 | — | — | — | $ | 735 | ||||||||||||||||
Other investments (b) | 621 | — | — | $ | 555 | $ | 66 | — | 621 | |||||||||||||||||
Loans, net of unearned income (residential) (d) | 11 | — | — | 11 | — | — | 11 | |||||||||||||||||||
Loans held for sale (residential) (b) | 264 | — | 264 | — | — | — | 264 | |||||||||||||||||||
Derivative assets - trading (b) | 1,676 | $ | 78 | 1,939 | 91 | — | $ | (433) | (f) | 1,675 | ||||||||||||||||
| Fair value - OCI | ||||||||||||||||||||||||||
Securities available for sale (b) | 27,556 | — | 27,543 | 13 | — | — | 27,556 | |||||||||||||||||||
Derivative assets - hedging (b)(g) | 123 | — | 70 | — | — | 53 | (f) | 123 | ||||||||||||||||||
| Amortized cost | ||||||||||||||||||||||||||
Held-to-maturity securities (c) | 7,595 | — | 8,023 | — | — | — | 8,023 | |||||||||||||||||||
Loans, net of unearned income (d) | 99,548 | — | — | 98,946 | — | — | 98,946 | |||||||||||||||||||
Loans held for sale (b) | 1,319 | — | — | 1,319 | — | — | 1,319 | |||||||||||||||||||
| Other | ||||||||||||||||||||||||||
Short-term investments - U.S. Treasury Bills (b) | — | — | — | — | — | — | — | |||||||||||||||||||
Cash and other short-term investments (a) | 17,285 | 17,285 | — | — | — | — | 17,285 | |||||||||||||||||||
| LIABILITIES (by measurement category) | ||||||||||||||||||||||||||
| Fair value - net income | ||||||||||||||||||||||||||
Derivative liabilities - trading (b) | $ | 154 | $ | 72 | $ | 746 | $ | 11 | — | $ | (675) | (f) | $ | 154 | ||||||||||||
| Fair value - OCI | ||||||||||||||||||||||||||
Derivative liabilities - hedging (b)(g) | (3) | — | (3) | — | — | — | (f) | (3) | ||||||||||||||||||
| Amortized cost | ||||||||||||||||||||||||||
Time deposits (e) | 5,743 | — | 5,765 | — | — | — | 5,765 | |||||||||||||||||||
Short-term borrowings (a) | 979 | 256 | 723 | — | — | — | 979 | |||||||||||||||||||
Long-term debt (e) | 13,709 | 13,925 | 734 | — | — | — | 14,659 | |||||||||||||||||||
| Other | ||||||||||||||||||||||||||
Deposits with no stated maturity (a) | 129,539 | — | 129,539 | — | — | — | 129,539 | |||||||||||||||||||
71
Valuation Methods and Assumptions
(a)Fair value equals or approximates carrying amount. The fair value of deposits with no stated maturity does not take into consideration the value ascribed to core deposit intangibles.
(b)Information pertaining to our methodology for measuring the fair values of these assets and liabilities is included in the sections entitled “Qualitative Disclosures of Valuation Techniques” and “Assets and Liabilities Measured at Fair Value on a Nonrecurring Basis” within our 2020 Form 10-K Note 6 (“Fair Value Measurements”). Investments accounted for under the cost method (or cost less impairment adjusted for observable price changes for certain equity investments) are classified as Level 3 assets. These investments are not actively traded in an open market as sales for these types of investments are rare. The carrying amount of the investments carried at cost are adjusted for declines in value if they are considered to be other-than-temporary (or due to observable orderly transactions of the same issuer for equity investments eligible for the cost less impairment measurement alternative). These adjustments are included in “other income” on the income statement.
(c)Fair values of held-to-maturity securities are determined by using models that are based on security-specific details, as well as relevant industry and economic factors. The most significant of these inputs are quoted market prices, interest rate spreads on relevant benchmark securities, and certain prepayment assumptions. We review the valuations derived from the models to ensure that they are reasonable and consistent with the values placed on similar securities traded in the secondary markets.
(d)The fair value of loans is based on the present value of the expected cash flows. The projected cash flows are based on the contractual terms of the loans, adjusted for prepayments and use of a discount rate based on the relative risk of the cash flows, taking into account the loan type, maturity of the loan, liquidity risk, servicing costs, and a required return on debt and capital. In addition, an incremental liquidity discount is applied to certain loans, using historical sales of loans during periods of similar economic conditions as a benchmark. The fair value of loans includes lease financing receivables at their aggregate carrying amount, which is equivalent to their fair value.
(e)Fair values of time deposits and long-term debt are based on discounted cash flows utilizing relevant market inputs.
(f)Netting adjustments represent the amounts recorded to convert our derivative assets and liabilities from a gross basis to a net basis in accordance with the applicable accounting guidance. The net basis takes into account the impact of bilateral collateral and master netting agreements that allow us to settle all derivative contracts with a single counterparty on a net basis and to offset the net derivative position with the related cash collateral. Total derivative assets and liabilities include these netting adjustments.
(g)Derivative assets-hedging and derivative liabilities-hedging includes both cash flow and fair value hedges. Additional information regarding our accounting policies for cash flow and fair value hedges is provided in Note 1 (“1. Summary of Significant Accounting Policies”) under the heading “Derivatives and Hedging” beginning on page 114 of our 2020 Form 10-K.
Discontinued assets — education lending business. Our discontinued assets include government-guaranteed and private education loans originated through our education lending business that was discontinued in September 2009. This portfolio consists of loans recorded at carrying value with appropriate valuation reserves, and loans in portfolio recorded at fair value. All of these loans were excluded from the table above as follows:
•Loans at carrying value, net of allowance, of $643 million ($563 million at fair value) at March 31, 2021, and $674 million ($567 million at fair value) at December 31, 2020;
•Portfolio loans at fair value of $2 million at March 31, 2021, and $2 million at December 31, 2020.
These loans and securities are classified as Level 3 because we rely on unobservable inputs when determining fair value since observable market data is not available.
6. Securities
The amortized cost, unrealized gains and losses, and approximate fair value of our securities available for sale and held-to-maturity securities are presented in the following tables. Gross unrealized gains and losses represent the difference between the amortized cost and the fair value of securities on the balance sheet as of the dates indicated. Accordingly, the amount of these gains and losses may change in the future as market conditions change.
| March 31, 2021 | December 31, 2020 | ||||||||||||||||||||||||||||
| in millions | Amortized Cost (a) | Gross Unrealized Gains | Gross Unrealized Losses | Fair Value | Amortized Cost (b) | Gross Unrealized Gains | Gross Unrealized Losses | Fair Value | |||||||||||||||||||||
| SECURITIES AVAILABLE FOR SALE | |||||||||||||||||||||||||||||
| U.S. Treasury, agencies, and corporations | $ | 4,914 | $ | — | $ | 13 | $ | 4,901 | $ | 1,000 | — | — | $ | 1,000 | |||||||||||||||
| States and political subdivisions | — | — | — | — | — | — | — | — | |||||||||||||||||||||
Agency residential collateralized mortgage obligations | 14,419 | $ | 249 | 219 | 14,449 | 14,001 | $ | 297 | $ | 25 | 14,273 | ||||||||||||||||||
| Agency residential mortgage-backed securities | 4,018 | 57 | 49 | 4,026 | 2,094 | 70 | — | 2,164 | |||||||||||||||||||||
| Agency commercial mortgage-backed securities | 10,644 | 275 | 394 | 10,525 | 9,707 | 432 | 33 | 10,106 | |||||||||||||||||||||
| Other securities | 8 | 14 | 22 | 8 | 5 | — | 13 | ||||||||||||||||||||||
| Total securities available for sale | $ | 34,003 | $ | 595 | $ | 675 | $ | 33,923 | $ | 26,810 | $ | 804 | $ | 58 | $ | 27,556 | |||||||||||||
| HELD-TO-MATURITY SECURITIES | |||||||||||||||||||||||||||||
Agency residential collateralized mortgage obligations | $ | 3,312 | $ | 107 | — | $ | 3,419 | $ | 3,775 | $ | 124 | — | $ | 3,899 | |||||||||||||||
| Agency residential mortgage-backed securities | 238 | 9 | — | 247 | 271 | 14 | — | 285 | |||||||||||||||||||||
| Agency commercial mortgage-backed securities | 3,275 | 186 | — | 3,461 | 3,515 | 290 | — | 3,805 | |||||||||||||||||||||
| Asset-backed securities | 16 | — | — | 16 | 19 | — | — | 19 | |||||||||||||||||||||
| Other securities | 16 | — | — | 16 | 15 | — | — | 15 | |||||||||||||||||||||
| Total held-to-maturity securities | $ | 6,857 | $ | 302 | — | $ | 7,159 | $ | 7,595 | $ | 428 | $ | — | $ | 8,023 | ||||||||||||||
(a)Amortized cost amounts exclude accrued interest receivable which is recorded within Other Assets on the balance sheet. At March 31, 2021, accrued interest receivable on available for sale securities and held-to-maturity securities totaled $49 million and $14 million, respectively.
(b)Amortized cost amounts exclude accrued interest receivable which is recorded within Other Assets on the balance sheet. At December 31, 2020, accrued interest receivable on available for sale securities and held-to-maturity securities totaled $42 million and $15 million, respectively.
72
The following table summarizes available for sale securities in an unrealized loss position for which an allowance for credit losses has not been recorded as of March 31, 2021, and December 31, 2020.
| Duration of Unrealized Loss Position | ||||||||||||||||||||||||||
| Less than 12 Months | 12 Months or Longer | Total | ||||||||||||||||||||||||
| in millions | Fair Value | Gross Unrealized Losses | Fair Value | Gross Unrealized Losses | Fair Value | Gross Unrealized Losses | ||||||||||||||||||||
| March 31, 2021 | ||||||||||||||||||||||||||
Securities available for sale: | ||||||||||||||||||||||||||
U.S Treasury, agencies, and corporations | $ | 4,488 | $ | 13 | — | — | $ | 4,488 | $ | 13 | ||||||||||||||||
Agency residential collateralized mortgage obligations | 5,401 | 219 | — | — | 5,401 | 219 | ||||||||||||||||||||
Agency residential mortgage-backed securities | 2,930 | 49 | $ | 7 | — | (a) | 2,937 | 49 | ||||||||||||||||||
Agency commercial mortgage-backed securities | 5,194 | 394 | — | — | 5,194 | 394 | ||||||||||||||||||||
Other securities | — | — | 1 | — | 1 | — | ||||||||||||||||||||
Held-to-maturity securities: | ||||||||||||||||||||||||||
Agency residential collateralized mortgage obligations | — | — | 20 | — | (a) | 20 | — | |||||||||||||||||||
Asset-backed securities | 9 | — | (a) | — | — | 9 | — | |||||||||||||||||||
Other securities | 3 | — | (a) | — | — | 3 | — | |||||||||||||||||||
| Total securities in an unrealized loss position | $ | 18,025 | $ | 675 | $ | 28 | — | $ | 18,053 | $ | 675 | |||||||||||||||
| December 31, 2020 | ||||||||||||||||||||||||||
Securities available for sale: | ||||||||||||||||||||||||||
U.S. Treasury, agencies, and corporations | — | — | — | — | — | — | ||||||||||||||||||||
| Agency residential collateralized mortgage obligations | $ | 2,110 | $ | 25 | $ | — | $ | — | $ | 2,110 | $ | 25 | ||||||||||||||
Agency residential mortgage-backed securities | 6 | — | (b) | 5 | — | (b) | 11 | — | ||||||||||||||||||
| Agency commercial mortgage-backed securities | 2,709 | 33 | — | — | 2,709 | 33 | ||||||||||||||||||||
Held-to-maturity securities: | ||||||||||||||||||||||||||
| Agency residential collateralized mortgage obligations | — | — | 24 | — | (b) | 24 | — | |||||||||||||||||||
Asset-backed securities | — | — | — | — | — | — | ||||||||||||||||||||
Other securities | 5 | — | (b) | — | — | 5 | — | |||||||||||||||||||
| Total securities in an unrealized loss position | $ | 4,830 | $ | 58 | $ | 29 | — | $ | 4,859 | $ | 58 | |||||||||||||||
(a)At March 31, 2021, gross unrealized losses totaled less than $1 million for asset-backed securities and other securities held-to-maturity with a loss duration of less than 12 months. At March 31, 2021, gross unrealized losses totaled less than $1 million for agency residential mortgage-backed securities available for sale with a loss duration greater than 12 months or longer and less than $1 million for agency residential collateralized mortgage obligations held-to-maturity with a loss duration greater than 12 months or longer.
(b)At December 31, 2020, gross unrealized losses totaled less than $1 million for agency residential mortgage-backed securities available for sale with a loss duration of less than 12 months and less than $1 million for other securities held-to-maturity with a loss duration of less than 12 months. At December 31, 2020, gross unrealized losses totaled less than $1 million for agency residential mortgage-backed securities available for sale with a loss duration greater than 12 months or longer and less than $1 million for agency residential collateralized mortgage obligations held to maturity with a loss duration greater than 12 months or longer.
Based on our evaluation at March 31, 2021, an allowance for credit losses has not been recorded nor have unrealized losses been recognized into income. The issuers of the securities are of high credit quality and have a long history of no credit losses, management does not intend to sell and it is likely that management will not be required to sell the securities prior to their anticipated recovery, and the decline in fair value is largely attributed to changes in interest rates and other market conditions. The issuers continue to make timely principal and interest payments.
At March 31, 2021, securities available for sale and held-to-maturity securities totaling $14.4 billion were pledged to secure securities sold under repurchase agreements, to secure public and trust deposits, to facilitate access to secured funding, and for other purposes required or permitted by law.
The following table shows our securities by remaining maturity. CMOs and other mortgage-backed securities in the available for sale portfolio and held-to-maturity portfolio are presented based on their expected average lives. The remaining securities, in both the available-for-sale and held-to-maturity portfolios, are presented based on their remaining contractual maturity. Actual maturities may differ from expected or contractual maturities since borrowers have the right to prepay obligations with or without prepayment penalties.
| March 31, 2021 | Securities Available for Sale | Held to Maturity Securities | ||||||||||||
| in millions | Amortized Cost | Fair Value | Amortized Cost | Fair Value | ||||||||||
| Due in one year or less | $ | 896 | $ | 903 | $ | 84 | $ | 84 | ||||||
| Due after one through five years | 21,029 | 21,233 | 4,603 | 4,771 | ||||||||||
| Due after five through ten years | 8,440 | 8,397 | 2,170 | 2,304 | ||||||||||
| Due after ten years | 3,638 | 3,390 | — | — | ||||||||||
| Total | $ | 34,003 | $ | 33,923 | $ | 6,857 | $ | 7,159 | ||||||
73
7. Derivatives and Hedging Activities
We are a party to various derivative instruments, mainly through our subsidiary, KeyBank. The primary derivatives that we use are interest rate swaps, caps, floors, and futures; foreign exchange contracts; commodity derivatives; and credit derivatives. Generally, these instruments help us manage exposure to interest rate risk, mitigate the credit risk inherent in our loan portfolio, hedge against changes in foreign currency exchange rates, and meet client financing and hedging needs.
At March 31, 2021, after taking into account the effects of bilateral collateral and master netting agreements, we had $103 million of derivative assets and $6 million of derivative liabilities that relate to contracts entered into for hedging purposes. As of the same date, after taking into account the effects of bilateral collateral and master netting agreements and a reserve for potential future losses, we had derivative assets of $1.4 billion and derivative liabilities of $177 million that were not designated as hedging instruments. These positions are primarily comprised of derivative contracts entered into for client accommodation purposes.
Additional information regarding our accounting policies for derivatives is provided in Note 1 (“Summary of Significant Accounting Policies”) under the heading “Derivatives and Hedging” beginning on page 108 of our 2020 Form 10-K. Our derivative strategies and related risk management objectives are described in Note 8 (“Derivatives and Hedging Activities”) beginning on page 143 of our 2020 Form 10-K.
Fair Values, Volume of Activity, and Gain/Loss Information Related to Derivative Instruments
The following table summarizes the fair values of our derivative instruments on a gross and net basis as of March 31, 2021, and December 31, 2020. The derivative asset and liability balances are presented on a gross basis, prior to the application of bilateral collateral and master netting agreements, but after the variation margin payments with central clearing organizations have been applied as settlement, as applicable. Total derivative assets and liabilities are adjusted to take into account the impact of legally enforceable master netting agreements that allow us to settle all derivative contracts with a single counterparty on a net basis and to offset the net derivative position with the related cash collateral. Securities collateral related to legally enforceable master netting agreements is not offset on the balance sheet. Our derivative instruments are included in “accrued income and other assets” or “accrued expenses and other liabilities” on the balance sheet, as follows:
| March 31, 2021 | December 31, 2020 | ||||||||||||||||||||||
| Fair Value | Fair Value | ||||||||||||||||||||||
| in millions | Notional Amount | Derivative Assets | Derivative Liabilities | Notional Amount | Derivative Assets | Derivative Liabilities | |||||||||||||||||
| Derivatives designated as hedging instruments: | |||||||||||||||||||||||
| Interest rate | $ | 41,835 | $ | 44 | $ | 6 | $ | 36,135 | $ | 70 | $ | (3) | |||||||||||
| Derivatives not designated as hedging instruments: | |||||||||||||||||||||||
| Interest rate | 76,937 | 971 | 312 | 78,424 | 1,514 | 291 | |||||||||||||||||
| Foreign exchange | 6,412 | 95 | 84 | 6,385 | 109 | 103 | |||||||||||||||||
| Commodity | 11,126 | 638 | 620 | 9,702 | 426 | 408 | |||||||||||||||||
| Credit | 392 | 1 | 8 | 423 | 1 | 11 | |||||||||||||||||
Other (a) | 5,024 | 33 | 14 | 4,951 | 58 | 16 | |||||||||||||||||
| Total | 99,891 | 1,738 | 1,038 | 99,885 | 2,108 | 829 | |||||||||||||||||
Netting adjustments (b) | — | (258) | (861) | — | (380) | (675) | |||||||||||||||||
| Net derivatives in the balance sheet | 141,726 | 1,524 | 183 | 136,020 | 1,798 | 151 | |||||||||||||||||
Other collateral (c) | — | (1) | (6) | — | (2) | (11) | |||||||||||||||||
| Net derivative amounts | $ | 141,726 | $ | 1,523 | $ | 177 | $ | 136,020 | $ | 1,796 | $ | 140 | |||||||||||
(a)Other derivatives include interest rate lock commitments and forward sale commitments related to our residential mortgage banking activities, forward purchase and sales contracts consisting of contractual commitments associated with “to be announced” securities and when-issued securities, and other customized derivative contracts.
(b)Netting adjustments represent the amounts recorded to convert our derivative assets and liabilities from a gross basis to a net basis in accordance with the applicable accounting guidance.
(c)Other collateral represents the amount that cannot be used to offset our derivative assets and liabilities from a gross basis to a net basis in accordance with the applicable accounting guidance. The other collateral consists of securities and is exchanged under bilateral collateral and master netting agreements that allow us to offset the net derivative position with the related collateral. The application of the other collateral cannot reduce the net derivative position below zero. Therefore, excess other collateral, if any, is not reflected above.
Fair value hedges. During the three-month period ended March 31, 2021, we did not exclude any portion of fair value hedging instruments from the assessment of hedge effectiveness.
The following tables summarize the amounts that were recorded on the balance sheet as of March 31, 2021, and December 31, 2020, related to cumulative basis adjustments for fair value hedges.
74
| March 31, 2021 | |||||||||||
| in millions | Balance sheet line item in which the hedge item is included | Carrying amount of hedged item (a) | Hedge accounting basis adjustment (b) | ||||||||
| Interest rate contracts | Long-term debt | $ | 7,094 | $ | 211 | ||||||
| Interest rate contracts | Securities Available for Sale(c) | 3,880 | 287 | ||||||||
| December 31, 2020 | |||||||||||
| Balance sheet line item in which the hedge item is included | Carrying amount of hedged item (a) | Hedge accounting basis adjustment (b) | |||||||||
| Interest rate contracts | Long-term debt | $ | 8,182 | $ | 416 | ||||||
| Interest rate contracts | Securities Available for Sale(c) | 2,080 | 21 | ||||||||
(a)The carrying amount represents the portion of the liability designated as the hedged item.
(b)Basis adjustments related to de-designated hedged items that no longer qualify as fair value hedges reduced the hedge accounting basis adjustment by $8 million and $8 million at March 31, 2021, and December 31, 2020, respectively,
(c)These amounts are designed as fair value hedges under the last-of-layer method. The carrying amount represents the amortized costs basis of the prepayable financial assets used to designate hedging relationships in which the hedged item is the last layer expected to be remaining at the end of the relationship. At March 31, 2021, and December 31, 2020, the amortized costs of the closed portfolios in these hedging relationships was $5.0 billion and $2.5 billion, respectively.
Cash flow hedges. During the three-month period ended March 31, 2021, we did not exclude any portion of cash flow hedging instruments from the assessment of hedge effectiveness.
Considering the interest rates, yield curves, and notional amounts as of March 31, 2021, we expect to reclassify an estimated $215 million of after-tax net gains on derivative instruments designated as cash flow hedges from AOCI to income during the next 12 months. In addition, we expect to reclassify approximately $9 million of net gains related to terminated cash flow hedges from AOCI to income during the next 12 months. As of March 31, 2021, the maximum length of time over which we hedge forecasted transactions is 6.0 years.
The following tables summarize the effect of fair value and cash flow hedge accounting on the income statement for the three-month periods ended March 31, 2021, and March 31, 2020.
| Location and amount of net gains (losses) recognized in income on fair value and cash flow hedging relationships | ||||||||||||||||||||
| in millions | Interest expense – long-term debt | Interest income – loans | Interest Income - securities | Investment banking and debt placement fees | Interest expense - deposits | Other income | ||||||||||||||
| Three months ended March 31, 2021 | ||||||||||||||||||||
| Total amounts presented in the consolidated statement of income | $ | 60 | $ | 889 | $ | 130 | $ | 162 | $ | 21 | $ | 51 | ||||||||
| Net gains (losses) on fair value hedging relationships | ||||||||||||||||||||
| Interest contracts | ||||||||||||||||||||
| Recognized on hedged items | 204 | — | (266) | — | — | — | ||||||||||||||
| Recognized on derivatives designated as hedging instruments | (166) | — | 267 | — | — | — | ||||||||||||||
| Net income (expense) recognized on fair value hedges | $ | 38 | — | $ | 1 | — | — | — | ||||||||||||
| Net gain (loss) on cash flow hedging relationships | ||||||||||||||||||||
| Interest contracts | ||||||||||||||||||||
| Realized gains (losses) (pre-tax) reclassified from AOCI into net income | $ | (1) | $ | 89 | $ | — | $ | 1 | — | — | ||||||||||
| Net income (expense) recognized on cash flow hedges | $ | (1) | $ | 89 | — | $ | 1 | — | — | |||||||||||
| Three months ended March 31, 2020 | ||||||||||||||||||||
| Total amounts presented in the consolidated statement of income | $ | 90 | $ | 1,026 | $ | 129 | $ | 116 | $ | (169) | $ | (88) | ||||||||
| Net gains (losses) on fair value hedging relationships | ||||||||||||||||||||
| Interest contracts | ||||||||||||||||||||
| Recognized on hedged items | $ | (294) | — | — | — | — | — | |||||||||||||
| Recognized on derivatives designated as hedging instruments | 311 | — | — | — | — | — | ||||||||||||||
| Net income (expense) recognized on fair value hedges | $ | 17 | — | $ | — | $ | — | $ | — | — | ||||||||||
| Net gain (loss) on cash flow hedging relationships | ||||||||||||||||||||
| Interest contracts | ||||||||||||||||||||
| Realized gains (losses) (pre-tax) reclassified from AOCI into net income | $ | (1) | $ | 34 | — | — | — | — | ||||||||||||
| Net income (expense) recognized on cash flow hedges | $ | (1) | $ | 34 | — | — | — | — | ||||||||||||
The following tables summarize the pre-tax net gains (losses) on our cash flow hedges for the three-month periods ended March 31, 2021, and March 31, 2020, and where they are recorded on the income statement. The table includes net gains (losses) recognized in OCI during the period and net gains (losses) reclassified from OCI into income during the current period.
75
| in millions | Net Gains (Losses) Recognized in OCI | Income Statement Location of Net Gains (Losses) Reclassified From OCI Into Income | Net Gains (Losses) Reclassified From OCI Into Income | ||||||||
| Three months ended March 31, 2021 | |||||||||||
| Cash Flow Hedges | |||||||||||
| Interest rate | $ | (203) | Interest income — Loans | $ | 89 | ||||||
| Interest rate | 3 | Interest expense — Long-term debt | (1) | ||||||||
| Interest rate | 10 | Investment banking and debt placement fees | 1 | ||||||||
| Total | $ | (190) | $ | 89 | |||||||
| Three months ended March 31, 2020 | |||||||||||
| Cash Flow Hedges | |||||||||||
| Interest rate | $ | 562 | Interest income — Loans | $ | 34 | ||||||
| Interest rate | (5) | Interest expense — Long-term debt | (1) | ||||||||
| Interest rate | (30) | Investment banking and debt placement fees | — | ||||||||
| Total | $ | 527 | $ | 33 | |||||||
Nonhedging instruments
The following table summarizes the pre-tax net gains (losses) on our derivatives that are not designated as hedging instruments for the three-month periods ended March 31, 2021, and March 31, 2020, and where they are recorded on the income statement.
| Three months ended March 31, 2021 | Three months ended March 31, 2020 | ||||||||||||||||||||||||||||
| in millions | Corporate services income | Consumer mortgage income | Other income | Total | Corporate services income | Consumer mortgage income | Other income | Total | |||||||||||||||||||||
| NET GAINS (LOSSES) | |||||||||||||||||||||||||||||
| Interest rate | $ | 6 | — | — | $ | 6 | $ | 11 | — | $ | (9) | $ | 2 | ||||||||||||||||
| Foreign exchange | 11 | — | — | 11 | 12 | — | — | 12 | |||||||||||||||||||||
| Commodity | 4 | — | — | 4 | 2 | — | — | 2 | |||||||||||||||||||||
| Credit | 5 | — | $ | (9) | (4) | (16) | — | 1 | (15) | ||||||||||||||||||||
| Other | — | $ | 1 | (22) | (21) | — | $ | 4 | 9 | 13 | |||||||||||||||||||
| Total net gains (losses) | $ | 26 | $ | 1 | $ | (31) | $ | (4) | $ | 9 | $ | 4 | $ | 1 | $ | 14 | |||||||||||||
Counterparty Credit Risk
We hold collateral in the form of cash and highly rated securities issued by the U.S. Treasury, government-sponsored enterprises, or GNMA. Cash collateral of $86 million was netted against derivative assets on the balance sheet at March 31, 2021, compared to $63 million of cash collateral netted against derivative assets at December 31, 2020. The cash collateral netted against derivative liabilities totaled $518 million at March 31, 2021, and $232 million at December 31, 2020. Our means of mitigating and managing exposure to credit risk on derivative contracts is described in Note 8 (“Derivatives and Hedging Activities”) beginning on page 147 of our 2020 Form 10-K under the heading “Counterparty Credit Risk.”
The following table summarizes the fair value of our derivative assets by type at the dates indicated. These assets represent our gross exposure to potential loss after taking into account the effects of bilateral collateral and master netting agreements and other means used to mitigate risk.
| in millions | March 31, 2021 | December 31, 2020 | ||||||
| Interest rate | $ | 858 | $ | 1,448 | ||||
| Foreign exchange | 55 | 52 | ||||||
| Commodity | 492 | 178 | ||||||
| Credit | — | (1) | ||||||
| Other | 33 | 58 | ||||||
| Derivative assets before collateral | 1,438 | 1,735 | ||||||
| Plus(Less): Related collateral | 86 | 63 | ||||||
| Total derivative assets | $ | 1,524 | $ | 1,798 | ||||
We enter into derivative transactions with two primary groups: broker-dealers and banks, and clients. Given that these groups have different economic characteristics, we have different methods for managing counterparty credit exposure and credit risk.
We enter into transactions with broker-dealers and banks for various risk management purposes. These types of
transactions are primarily high dollar volume. We enter into bilateral collateral and master netting agreements with
these counterparties. We clear certain types of derivative transactions with these counterparties, whereby central
76
clearing organizations become the counterparties to our derivative contracts. In addition, we enter into derivative
contracts through swap execution facilities. Swap clearing and swap execution facilities reduce our exposure to
counterparty credit risk. At March 31, 2021, we had gross exposure of $234 million to broker-dealers and banks. We had net exposure of $228 million after the application of master netting agreements and cash collateral, where such qualifying agreements exist. We had net exposure of $225 million after considering $3 million of additional collateral held in the form of securities.
We enter into transactions using master netting agreements with clients to accommodate their business needs. In
most cases, we mitigate our credit exposure by cross-collateralizing these transactions to the underlying loan collateral. For transactions that are not clearable, we mitigate our market risk by buying and selling U.S. Treasuries and Eurodollar futures or entering into offsetting positions. Due to the cross-collateralization to the underlying loan, we typically do not exchange cash or marketable securities collateral in connection with these transactions. To address the risk of default associated with these contracts, we have established a CVA reserve (included in
“accrued income and other assets”) in the amount of $23 million at March 31, 2021. The CVA is calculated from
potential future exposures, expected recovery rates, and market-implied probabilities of default. At March 31, 2021, we had gross exposure of $1.4 billion to client counterparties and other entities that are not broker-dealers or banks for derivatives that have associated master netting agreements. We had net exposure of $1.3 billion on our derivatives with these counterparties after the application of master netting agreements, collateral, and the related reserve.
Credit Derivatives
We are a buyer and, under limited circumstances, may be a seller of credit protection through the credit derivative market. We purchase credit derivatives to manage the credit risk associated with specific commercial lending and swap obligations as well as exposures to debt securities. Our credit derivative portfolio was in a net liability position of $8 million as of March 31, 2021, and $9 million as of December 31, 2020. Our credit derivative portfolio consists of traded credit default swap indices and risk participation agreements. Additional descriptions of our credit derivatives are provided in Note 8 (“Derivatives and Hedging Activities”) beginning on page 148 of our 2020 Form 10-K under the heading “Credit Derivatives.”
The following table provides information on the types of credit derivatives sold by us and held on the balance sheet at March 31, 2021, and December 31, 2020. The notional amount represents the amount that the seller could
be required to pay. The payment/performance risk shown in the table represents a weighted average of the default
probabilities for all reference entities in the respective portfolios. These default probabilities are implied from
observed credit indices in the credit default swap market, which are mapped to reference entities based on Key’s
internal risk rating.
| March 31, 2021 | December 31, 2020 | ||||||||||||||||||||||
| dollars in millions | Notional Amount | Average Term (Years) | Payment / Performance Risk | Notional Amount | Average Term (Years) | Payment / Performance Risk | |||||||||||||||||
| Other | $ | 104 | 10.08 | 15.11 | % | $ | 227 | 12.76 | 19.53 | % | |||||||||||||
| Total credit derivatives sold | $ | 104 | — | — | $ | 227 | — | — | |||||||||||||||
Credit Risk Contingent Features
We have entered into certain derivative contracts that require us to post collateral to the counterparties when these contracts are in a net liability position. The amount of collateral to be posted is based on the amount of the net liability and thresholds generally related to our long-term senior unsecured credit ratings with Moody’s and S&P. Collateral requirements also are based on minimum transfer amounts, which are specific to each Credit Support Annex (a component of the ISDA Master Agreement) that we have signed with the counterparties. In a limited number of instances, counterparties have the right to terminate their ISDA Master Agreements with us if our ratings fall below a certain level, usually investment-grade level (i.e., “Baa3” for Moody’s and “BBB-” for S&P). At March 31, 2021, KeyBank’s rating was “A3” with Moody’s and “A-” with S&P, and KeyCorp’s rating was “Baa1” with Moody’s and “BBB+” with S&P. As of March 31, 2021, the aggregate fair value of all derivative contracts with credit risk contingent features (i.e., those containing collateral posting or termination provisions based on our ratings) held by KeyBank that were in a net liability position totaled $496 million, which was comprised of $121 million in derivative assets and $617 million in derivative liabilities. We had $530 million in cash and securities collateral posted to cover those positions as of March 31, 2021. There were no derivative contracts with credit risk contingent features held by KeyCorp at March 31, 2021.
77
The following table summarizes the additional cash and securities collateral that KeyBank would have been required to deliver under the ISDA Master Agreements had the credit risk contingent features been triggered for the derivative contracts in a net liability position as of March 31, 2021, and December 31, 2020. The additional collateral amounts were calculated based on scenarios under which KeyBank’s ratings are downgraded one, two, or three ratings as of March 31, 2021, and December 31, 2020, and take into account all collateral already posted. A similar calculation was performed for KeyCorp, and no additional collateral would have been required as of March 31, 2021, and December 31, 2020. For more information about the credit ratings for KeyBank and KeyCorp, see the discussion under the heading “Factors affecting liquidity” in the section entitled “Liquidity risk management” in Item 2 of this report.
| March 31, 2021 | December 31, 2020 | ||||||||||||||||
| in millions | Moody’s | S&P | Moody’s | S&P | |||||||||||||
| KeyBank’s long-term senior unsecured credit ratings | A3 | A- | A3 | A- | |||||||||||||
| One rating downgrade | $ | 1 | $ | 1 | $ | 1 | $ | 1 | |||||||||
| Two rating downgrades | 2 | 2 | 1 | 1 | |||||||||||||
| Three rating downgrades | 2 | 2 | 1 | 1 | |||||||||||||
KeyBank’s long-term senior unsecured credit rating was four ratings above noninvestment grade at Moody’s and S&P as of March 31, 2021, and December 31, 2020. If KeyBank’s ratings had been downgraded below investment grade as of March 31, 2021, or December 31, 2020, payments of $3 million and $2 million, respectively, would have been required to either terminate the contracts or post additional collateral for those contracts in a net liability position, taking into account all collateral already posted. If KeyCorp’s ratings had been downgraded below investment grade as of March 31, 2021, or December 31, 2020, no payments would have been required to either terminate the contracts or post additional collateral for those contracts in a net liability position, taking into account all collateral already posted.
8. Mortgage Servicing Assets
We originate and periodically sell commercial and residential mortgage loans but continue to service those loans for the buyers. We also may purchase the right to service commercial mortgage loans for other lenders. We record a servicing asset if we purchase or retain the right to service loans in exchange for servicing fees that exceed the going market servicing rate and are considered more than adequate compensation for servicing. Additional information pertaining to the accounting for mortgage and other servicing assets is included in Note 1 (“Summary of Significant Accounting Policies”) under the heading “Servicing Assets” beginning on page 115 of our 2020 Form 10-K.
Commercial
Changes in the carrying amount of commercial mortgage servicing assets are summarized as follows:
| Three months ended March 31, | ||||||||
| in millions | 2021 | 2020 | ||||||
| Balance at beginning of period | $ | 578 | $ | 539 | ||||
| Servicing retained from loan sales | 29 | 24 | ||||||
| Purchases | 7 | 11 | ||||||
| Amortization | (29) | (29) | ||||||
| Temporary (impairments) recoveries | 3 | (2) | ||||||
| Balance at end of period | $ | 588 | $ | 543 | ||||
| Fair value at end of period | $ | 682 | $ | 655 | ||||
The fair value of commercial mortgage servicing assets is determined by calculating the present value of future cash flows associated with servicing the loans. This calculation uses a number of assumptions that are based on current market conditions. The range and weighted average of the significant unobservable inputs used to determine the fair value of our commercial mortgage servicing assets at March 31, 2021, and March 31, 2020, along with the valuation techniques, are shown in the following table:
| dollars in millions | March 31, 2021 | March 31, 2020 | ||||||||||||||||||||||||
| Valuation Technique | Significant Unobservable Input | Range | Weighted Average | Range | Weighted Average | |||||||||||||||||||||
| Discounted cash flow | Expected defaults | 1.01 | 2.00 | % | 1.18 | % | 0.97 | 2.00 | % | 1.14 | % | |||||||||||||||
| Residual cash flows discount rate | 7.42 | 10.59 | % | 9.20 | % | 7.00 | 11.42 | % | 9.24 | % | ||||||||||||||||
| Escrow earn rate | 0.94 | 1.22 | % | 1.10 | % | 1.20 | 1.92 | % | 1.67 | % | ||||||||||||||||
| Loan assumption rate | 0.00 | 1.75 | % | 1.44 | % | 0.01 | 3.37 | % | 1.32 | % | ||||||||||||||||
78
If these economic assumptions change or prove incorrect, the fair value of commercial mortgage servicing assets may also change. Expected credit losses, escrow earning rates, and discount rates are critical to the valuation of commercial mortgage servicing assets. Estimates of these assumptions are based on how a market participant would view the respective rates, and reflect historical data associated with the commercial mortgage loans, industry trends, and other considerations. Actual rates may differ from those estimated due to changes in a variety of economic factors. A decrease in the value assigned to the escrow earning rates would cause a decrease in the fair value of our commercial mortgage servicing assets. An increase in the assumed default rates of commercial mortgage loans or an increase in the assigned discount rates would cause a decrease in the fair value of our commercial mortgage servicing assets. Prepayment activity on commercial serviced loans does not significantly affect the valuation of our commercial mortgage servicing assets. Unlike residential mortgages, commercial mortgages experience significantly lower prepayments due to certain contractual restrictions affecting the borrower’s ability to prepay the mortgage.
The amortization of commercial servicing assets is determined in proportion to, and over the period of, the estimated net servicing income. The amortization of commercial servicing assets for each period, as shown in the table at the beginning of this note, is recorded as a reduction to contractual fee income. The contractual fee income from servicing commercial mortgage loans totaled $61 million for the three-month period ended March 31, 2021, and $50 million for the three-month period ended March 31, 2020. This fee income was offset by $29 million of amortization for the three-month period ended March 31, 2021, and $29 million for the three-month period ended March 31, 2020. Both the contractual fee income and the amortization are recorded, net, in “commercial mortgage servicing fees” on the income statement.
Residential
Changes in the carrying amount of residential mortgage servicing assets are summarized as follows:
| Three months ended March 31, | ||||||||
| in millions | 2021 | 2020 | ||||||
| Balance at beginning of period | $ | 58 | $ | 46 | ||||
| Servicing retained from loan sales | 11 | 5 | ||||||
| Purchases | — | — | ||||||
| Amortization | (5) | (2) | ||||||
| Temporary (impairments) recoveries | 8 | (9) | ||||||
| Balance at end of period | $ | 72 | $ | 40 | ||||
| Fair value at end of period | $ | 77 | $ | 41 | ||||
The fair value of mortgage servicing assets is determined by calculating the present value of future cash flows associated with servicing the loans. This calculation uses a number of assumptions that are based on current market conditions. The range and weighted-average of the significant unobservable inputs used to fair value our mortgage servicing assets at March 31, 2021, and March 31, 2020, along with the valuation techniques, are shown in the following table:
| March 31, 2021 | March 31, 2020 | |||||||||||||||||||||||||
| Valuation Technique | Significant Unobservable Input | Range | Weighted Average | Range | Weighted Average | |||||||||||||||||||||
| Discounted cash flow | Prepayment speed | 10.55 | 50.81 | % | 12.82 | % | 10.50 | 55.60 | % | 17.16 | % | |||||||||||||||
| Discount rate | 7.51 | 8.63 | % | 7.55 | % | 7.50 | 8.50 | % | 7.52 | % | ||||||||||||||||
| Servicing cost | $62.00 | 4375 | 72.48 | $ | 62.00 | 8,375 | 68.14 | |||||||||||||||||||
If these economic assumptions change or prove incorrect, the fair value of residential mortgage servicing assets may also change. Prepayment speed, discount rates, and servicing cost are critical to the valuation of residential mortgage servicing assets. Estimates of these assumptions are based on how a market participant would view the respective rates and reflect historical data associated with the residential mortgage loans, industry trends, and other considerations. Actual rates may differ from those estimated due to changes in a variety of economic factors. An
increase in the prepayment speed would cause a decrease in the fair value of our residential mortgage servicing
assets. An increase in the assigned discount rates and servicing cost assumptions would cause a decrease in the
fair value of our residential mortgage servicing assets.
The amortization of servicing assets for March 31, 2021, as shown in the table above, is recorded as a reduction to contractual fee income. The contractual fee income from servicing residential mortgage loans totaled $10 million for the three-month period ended March 31, 2021, and $6 million for the three-month period ended March 31, 2020.
79
This fee income was offset by $5 million of amortization for the three-month period ended March 31, 2021, and $2 million for the three-month period ended March 31, 2020. Both the contractual fee income and the amortization are recorded, net, in “consumer mortgage income” on the income statement.
9. Leases
As a lessee, we enter into leases of land, buildings, and equipment. Our real estate leases primarily relate to bank branches and office space. The leases of equipment principally relate to technology assets for data processing and data storage. As a lessor, we primarily provide financing through our equipment leasing business. For more information on our leasing activity, see Note 10 (“Leases”) beginning on page 152 of our 2020 Form 10-K.
Lessor Equipment Leasing
Leases may have fixed or floating rate terms. Variable payments are based on an index or other specified rate and are included in rental payments. Certain leases contain an option to extend the lease term or the option to terminate at the discretion of the lessee. Under certain conditions, lease agreements may also contain the option for a lessee to purchase the underlying asset.
Interest income from sales-type and direct financing leases is recognized in "interest income — loans" on the income statement. Income related to operating leases is recognized in “operating lease income and other leasing gains” on the income statement. The components of equipment leasing income are summarized in the table below:
| Three months ended March 31, | ||||||||
| in millions | 2021 | 2020 | ||||||
| Sales-type and direct financing leases | ||||||||
| Interest income on lease receivable | $ | 23 | $ | 28 | ||||
| Interest income related to accretion of unguaranteed residual asset | 2 | 3 | ||||||
| Total sales-type and direct financing lease income | 25 | 31 | ||||||
| Operating leases | ||||||||
| Operating lease income related to lease payments | 32 | 34 | ||||||
| Other operating leasing gains | 6 | (4) | ||||||
| Total operating lease income and other leasing gains | 38 | 30 | ||||||
| Total lease income | $ | 63 | $ | 61 | ||||
In April 2020, the FASB provided elections under which entities can choose to account for eligible rent concessions either by applying the modification accounting in ASC 842 or by applying an expedient to account for them outside of the modification framework, thus, forgoing the performance of an assessment to determine whether contractual provisions in existing lease arrangements provide enforceable rights and obligations. Modification accounting may require remeasurement and reallocation of contract consideration. To be eligible for the expedient, rent concessions must relate to the COVID-19 pandemic and meet certain criteria. As a result of the pandemic, Key has begun providing lessees with 90 day deferrals on its equipment leases and has elected not to apply modification accounting. Rent concessions were not material at March 31, 2021.
10. Goodwill
Our annual goodwill impairment testing is performed as of October 1 each year, or more frequently as events occur or circumstances change that would more-likely-than-not reduce the fair value of a reporting unit below its carrying amount. A quantitative or qualitative testing approach may be used. Additional information pertaining to our accounting policy for goodwill and other intangible assets is summarized in Note 1 (“Summary of Significant Accounting Policies”) under the heading “Goodwill and Other Intangible Assets” beginning on page 115 of our 2020 Form 10-K.
The fair values of each reporting unit are estimated using a combination of market and income approaches. In our latest quantitative test as of September 30, 2020, the income approach, which was weighted at 75%, utilized discounted cash flow projections for each reporting unit. The market approach, which was weighted at 25%, consisted primarily of public company metrics but also considered recent transactions in the financial services industry. The carrying amounts of Key’s reporting units represent the combination of regulatory and economic equity for goodwill impairment testing and management reporting purposes.
80
Changes in the carrying amount of goodwill by reporting segment are presented in the following table:
| in millions | Consumer Bank | Commercial Bank | Total | ||||||||
| BALANCE AT MARCH 31, 2020 | 1,752 | 912 | 2,664 | ||||||||
| BALANCE AT BALANCE AT DECEMBER 31, 2020 | $ | 1,752 | $ | 912 | $ | 2,664 | |||||
| AQN acquisition | $ | 9 | $ | — | $ | 9 | |||||
| BALANCE AT MARCH 31, 2021 | $ | 1,761 | $ | 912 | $ | 2,673 | |||||
11. Variable Interest Entities
Our significant VIEs are summarized below. Additional information pertaining to the criteria used in determining if an entity is a VIE is included in Note 13 (“Variable Interest Entities “) beginning on page 156 of our 2020 Form 10-K.
LIHTC investments. We had $1.4 billion and $1.4 billion of investments in LIHTC operating partnerships at March 31, 2021, and December 31, 2020, respectively. These investments are recorded in “accrued income and other assets” on our balance sheet. We do not have any loss reserves recorded related to these investments because we believe the likelihood of any loss to be remote. For all legally binding, unfunded equity commitments, we increase our recognized investment and recognize a liability. As of March 31, 2021, and December 31, 2020, we had liabilities of $463 million and $484 million, respectively, related to investments in qualified affordable housing projects, which are recorded in “accrued expenses and other liabilities” on our balance sheet. We continue to invest in these LIHTC operating partnerships.
The assets and liabilities presented in the table below convey the size of KCDC’s direct and indirect investments at March 31, 2021, and December 31, 2020. As these investments represent unconsolidated VIEs, the assets and liabilities of the investments themselves are not recorded on our balance sheet. Additional information pertaining to our LIHTC investments is included in Note 13 (“Variable Interest Entities”) beginning on page 156 of our 2020 Form 10-K.
| Unconsolidated VIEs | |||||||||||
| in millions | Total Assets | Total Liabilities | Maximum Exposure to Loss | ||||||||
| March 31, 2021 | |||||||||||
| LIHTC investments | $ | 7,034 | $ | 2,857 | $ | 1,811 | |||||
| December 31, 2020 | |||||||||||
| LIHTC investments | $ | 6,914 | $ | 2,765 | $ | 1,823 | |||||
We amortize our LIHTC investments over the period that we expect to receive the tax benefits. During the first three months of 2021, we recognized $50 million of amortization and $47 million of tax credits associated with these investments within “income taxes” on our income statement. During the first three months of 2020, we recognized $49 million of amortization and $46 million of tax credits associated with these investments within “income taxes” on our income statement.
Principal investments. Our maximum exposure to loss associated with indirect principal investments consists of the investments’ fair value plus any unfunded equity commitments. The fair value of our indirect principal investments totaled $51 million and $53 million at March 31, 2021, and December 31, 2020, respectively. These investments are recorded in “other investments” on our balance sheet. The table below reflects the size of the private equity funds in which we were invested as well as our maximum exposure to loss in connection with these investments at March 31, 2021, and December 31, 2020.
| Unconsolidated VIEs | |||||||||||
| in millions | Total Assets | Total Liabilities | Maximum Exposure to Loss | ||||||||
| March 31, 2021 | |||||||||||
| Indirect investments | $ | 10,583 | $ | 165 | $ | 67 | |||||
| December 31, 2020 | |||||||||||
| Indirect investments | $ | 10,899 | $ | 168 | $ | 78 | |||||
Through our principal investing entities, we have formed and funded operating entities that provide management and other related services to our investment company funds, which directly invest in portfolio companies. These entities had no assets at March 31, 2021, and December 31, 2020, that can be used to settle the entities’
81
obligations. The entities had no liabilities at March 31, 2021, and December 31, 2020, and other equity investors have no recourse to our general credit.
Additional information on our indirect and direct principal investments is provided in Note 5 (“Fair Value Measurements”) and in Note 13 (“Variable Interest Entities “) beginning on page 156 of our 2020 Form 10-K.
Other unconsolidated VIEs. We are involved with other various entities in the normal course of business which we have determined to be VIEs. We have determined that we are not the primary beneficiary of these VIEs because we do not have the power to direct the activities that most significantly impact their economic performance. Our assets associated with these unconsolidated VIEs totaled $364 million at March 31, 2021, and $351 million at December 31, 2020. These assets are recorded in “accrued income and other assets,” “other investments,” “securities available for sale,” and “loans, net of unearned income” on our balance sheet. We had liabilities totaling $1 million and $1 million associated with these unconsolidated VIEs at March 31, 2021, and December 31, 2020, respectively. Additional information pertaining to our other unconsolidated VIEs is included in Note 13 (“Variable Interest Entities“) under the heading “Other unconsolidated VIEs” on page 1 of our 2020 Form 10-K.
12. Income Taxes
Income Tax Provision
In accordance with the applicable accounting guidance, the principal method established for computing the provision for income taxes in interim periods requires us to make our best estimate of the effective tax rate expected to be applicable for the full year. This estimated effective tax rate is then applied to interim consolidated pre-tax operating income to determine the interim provision for income taxes.
The effective tax rate, which is the provision for income taxes as a percentage of income before income taxes, was 19.4% for the first quarter of 2021 and 13.4% for the first quarter of 2020. The effective tax rates are less than our combined federal and state statutory tax rate of 23.7%, primarily due to income from investments in tax-advantaged assets such as corporate-owned life insurance and credits associated with renewable energy and low-income housing investments.
Deferred Taxes
At March 31, 2021, we had a net deferred tax liability of $11 million, compared to a net deferred tax liability of $100 million at December 31, 2020.
To determine the amount of deferred tax assets that are more likely than not to be realized, and therefore recorded, we conduct a quarterly assessment of all available evidence. This evidence includes, but is not limited to, taxable income in prior periods, projected future taxable income, and projected future reversals of deferred tax items. These assessments involve a degree of subjectivity and may undergo change. Based on these criteria, we had no valuation allowance at March 31, 2021, and December 31, 2020.
Unrecognized Tax Benefits
At March 31, 2021, Key’s unrecognized tax benefits were $56 million. As permitted under the applicable accounting guidance for income taxes, it is our policy to recognize interest and penalties related to unrecognized tax benefits in “income tax expense.”
Pre-1988 Bank Reserves Acquired in a Business Combination
Retained earnings of KeyBank included approximately $92 million of allocated bad debt deductions for which no income taxes have been recorded. Under current federal law, these reserves are subject to recapture into taxable income if KeyBank, or any successor, fails to maintain its bank status under the Internal Revenue Code or makes non-dividend distributions or distributions greater than its accumulated earnings and profits. No deferred tax liability has been established as these events are not expected to occur in the foreseeable future.
82
13. Acquisition and Discontinued Operations
Acquisitions
Arbitria Quum Notitia, LLC (AQN Strategies). On February 25, 2021, KeyCorp acquired AQN Strategies, a diversified consulting practice, specializing in analytically driven strategies and solutions as it relates to bank transformations, credit and growth, and payments intelligence. The acquisition of AQN Strategies will advance Key’s analytics by adding senior talent and expertise directly aligned to Key’s focus areas. The acquisition was accounted for as a business combination. As a result, we recognized goodwill of $9 million. No other material assets were acquired or liabilities assumed as a result of the acquisition.
Discontinued operations
Discontinued operations primarily includes our government-guaranteed and private education lending business. At March 31, 2021, and December 31, 2020, approximately $675 million and $710 million, respectively, of education loans are included in discontinued assets on the Consolidated Balance Sheets. Net interest income after provision for credit losses for this business is not material and is included in income (loss) from discontinued operations, net of taxes on the Consolidated Statements of Income.
14. Securities Financing Activities
We enter into repurchase agreements to finance overnight customer sweep deposits. We also enter into repurchase and reverse repurchase agreements to settle other securities obligations. We account for these securities financing agreements as collateralized financing transactions. Repurchase and reverse repurchase agreements are recorded on the balance sheet at the amounts for which the securities will be subsequently sold or repurchased. Securities borrowed transactions are recorded on the balance sheet at the amounts of cash collateral advanced. While our securities financing agreements incorporate a right of set off, the assets and liabilities are reported on a gross basis. Reverse repurchase agreements and securities borrowed transactions are included in “short-term investments” on the Consolidated Balance Sheets; repurchase agreements are included in “federal funds purchased and securities sold under repurchase agreements.” Additional information regarding our securities financing activities, including risk management activities, is provided in Note 16 (“Securities Financing Activities”) beginning on page 160 of our 2020 Form 10-K.
The following table summarizes our securities financing agreements at March 31, 2021, and December 31, 2020:
| March 31, 2021 | December 31, 2020 | ||||||||||||||||||||||||||||
| in millions | Gross Amount Presented in Balance Sheet | Netting Adjustments (a) | Collateral (b) | Net Amounts | Gross Amount Presented in Balance Sheet | Netting Adjustments (a) | Collateral (b) | Net Amounts | |||||||||||||||||||||
| Offsetting of financial assets: | |||||||||||||||||||||||||||||
| Reverse repurchase agreements | $ | 18 | $ | (13) | $ | (5) | — | $ | 6 | $ | (6) | — | — | ||||||||||||||||
| Securities borrowed | — | — | — | — | $ | 500 | — | $ | (500) | — | |||||||||||||||||||
| Total | $ | 18 | $ | (13) | $ | (5) | — | $ | 506 | $ | (6) | $ | (500) | — | |||||||||||||||
| Offsetting of financial liabilities: | |||||||||||||||||||||||||||||
Repurchase agreements (c) | $ | 281 | $ | (13) | $ | (268) | — | $ | 220 | $ | (6) | $ | (214) | — | |||||||||||||||
| Total | $ | 281 | $ | (13) | $ | (268) | — | $ | 220 | $ | (6) | $ | (214) | — | |||||||||||||||
(a)Netting adjustments take into account the impact of master netting agreements that allow us to settle with a single counterparty on a net basis.
(b)These adjustments take into account the impact of bilateral collateral agreements that allow us to offset the net positions with the related collateral. The application of collateral cannot reduce the net position below zero. Therefore, excess collateral, if any, is not reflected above.
(c)Repurchase agreements are collateralized by mortgaged-backed agency securities and are contracted on an overnight or continuous basis.
As of March 31, 2021, the carrying amount of assets pledged as collateral against repurchase agreements totaled $307 million. Assets pledged as collateral are reported in “securities available for sale” and “held-to-maturity securities” on the Consolidated Balance Sheets. At March 31, 2021, the liabilities associated with collateral pledged were solely comprised of customer sweep financing activity and had a carrying value of $268 million. The collateral pledged under customer sweep repurchase agreements is posted to a third-party custodian and cannot be sold or repledged by the secured party. The risk related to a decline in the market value of collateral pledged is minimal given the collateral's high credit quality and the overnight duration of the repurchase agreements.
83
15. Employee Benefits
Pension Plans
The components of net pension cost (benefit) for all funded and unfunded plans are recorded in Other expense and are summarized in the following table. For more information on our Pension Plans and Other Postretirement Benefit Plans, see Note 18 (“Employee Benefits”) beginning on page 164 of our 2020 Form 10-K.
| Three months ended March 31, | ||||||||
| in millions | 2021 | 2020 | ||||||
| Interest cost on PBO | $ | 6 | $ | 9 | ||||
| Expected return on plan assets | (7) | (10) | ||||||
| Amortization of losses | 5 | 4 | ||||||
| Settlement loss | — | 4 | ||||||
| Net pension cost | $ | 4 | $ | 7 | ||||
16. Trust Preferred Securities Issued by Unconsolidated Subsidiaries
We own the outstanding common stock of business trusts formed by us that issued corporation-obligated, mandatorily redeemable, trust preferred securities. The trusts used the proceeds from the issuance of their trust preferred securities and common stock to buy debentures issued by KeyCorp. These debentures are the trusts’ only assets; the interest payments from the debentures finance the distributions paid on the mandatorily redeemable trust preferred securities. The outstanding common stock of these business trusts is recorded in Other investments on the Consolidated Balance Sheets. We unconditionally guarantee the following payments or distributions on behalf of the trusts:
•required distributions on the trust preferred securities;
•the redemption price when a capital security is redeemed; and
•the amounts due if a trust is liquidated or terminated.
The Regulatory Capital Rules, discussed in “Supervision and regulation” in Item 2 of this report, require us to treat our mandatorily redeemable trust preferred securities as Tier 2 capital.
The trust preferred securities, common stock, and related debentures are summarized as follows:
| dollars in millions | Trust Preferred Securities, Net of Discount (a) | Common Stock | Principal Amount of Debentures, Net of Discount (b) | Interest Rate of Trust Preferred Securities and Debentures (c) | Maturity of Trust Preferred Securities and Debentures | ||||||||||||
| March 31, 2021 | |||||||||||||||||
| KeyCorp Capital I | $ | 156 | $ | 6 | $ | 162 | 0.965 | % | 2028 | ||||||||
| KeyCorp Capital II | 126 | 4 | 130 | 6.875 | 2029 | ||||||||||||
| KeyCorp Capital III | 115 | 4 | 119 | 7.750 | 2029 | ||||||||||||
| HNC Statutory Trust III | 20 | 1 | 21 | 1.605 | 2035 | ||||||||||||
| Willow Grove Statutory Trust I | 19 | 1 | 20 | 1.527 | 2036 | ||||||||||||
| HNC Statutory Trust IV | 17 | 1 | 18 | 1.494 | 2037 | ||||||||||||
| Westbank Capital Trust II | 8 | — | 8 | 2.429 | 2034 | ||||||||||||
| Westbank Capital Trust III | 8 | — | 8 | 2.429 | 2034 | ||||||||||||
Total | $ | 469 | $ | 17 | $ | 486 | 4.334 | % | — | ||||||||
| December 31, 2020 | $ | 483 | $ | 17 | $ | 500 | 4.464 | % | — | ||||||||
(a)The trust preferred securities must be redeemed when the related debentures mature, or earlier if provided in the governing indenture. Each issue of trust preferred securities carries an interest rate identical to that of the related debenture. Certain trust preferred securities include basis adjustments related to fair value hedges totaling $56 million at March 31, 2021, and $70 million at December 31, 2020. See Note 7 (“Derivatives and Hedging Activities”) for an explanation of fair value hedges.
(b)We have the right to redeem these debentures. If the debentures purchased by KeyCorp Capital I, HNC Statutory Trust III, Willow Grove Statutory Trust I, HNC Statutory Trust IV, Westbank Capital Trust II, or Westbank Capital Trust III are redeemed before they mature, the redemption price will be the principal amount, plus any accrued but unpaid interest. If the debentures purchased by KeyCorp Capital II or KeyCorp Capital III are redeemed before they mature, the redemption price will be the greater of: (i) the principal amount, plus any accrued but unpaid interest, or (ii) the sum of the present values of principal and interest payments discounted at the Treasury Rate (as defined in the applicable indenture), plus 20 basis points for KeyCorp Capital II or 25 basis points for KeyCorp Capital III, or 50 basis points in the case of redemption upon either a tax or a capital treatment event for either KeyCorp Capital II or KeyCorp Capital III, plus any accrued but unpaid interest. The principal amount of certain debentures includes basis adjustments related to fair value hedges totaling $56 million at March 31, 2021, and $70 million at December 31, 2020. See Note 7 (“Derivatives and Hedging Activities”) for an explanation of fair value hedges. The principal amount of debentures, net of discounts, is included in “long-term debt” on the balance sheet.
(c)The interest rates for the trust preferred securities issued by KeyCorp Capital II and KeyCorp Capital III are fixed. The trust preferred securities issued by KeyCorp Capital I have a floating interest rate, equal to three-month LIBOR plus 74 basis points, that reprices quarterly. The trust preferred securities issued by HNC Statutory Trust III have a floating interest rate, equal to three-month LIBOR plus 140 basis points, that reprices quarterly. The trust preferred securities issued by Willow Grove Statutory Trust I have a floating interest rate, equal to three-month LIBOR plus 131 basis points, that reprices quarterly. The trust preferred securities issued by HNC Statutory Trust IV have a floating interest rate, equal to three-month LIBOR plus 128 basis points, that reprices quarterly. The trust preferred securities issued by Westbank Capital Trust II and Westbank Capital Trust III each have a floating interest rate, equal to three-month LIBOR plus 219 basis points, that reprices quarterly. The total interest rates are weighted-average rates.
84
17. Contingent Liabilities and Guarantees
Legal Proceedings
Litigation. From time to time, in the ordinary course of business, we and our subsidiaries are subject to various litigation, investigations, and administrative proceedings. Private, civil litigation may range from individual actions involving a single plaintiff to putative class action lawsuits with potentially thousands of class members. Investigations may involve both formal and informal proceedings, by both government agencies and self-regulatory bodies. These matters may involve claims for substantial monetary relief. At times, these matters may present novel claims or legal theories. Due to the complex nature of these various other matters, it may be years before some matters are resolved. While it is impossible to ascertain the ultimate resolution or range of financial liability, based on information presently known to us, we do not believe there is any matter to which we are a party, or involving any of our properties that, individually or in the aggregate, would reasonably be expected to have a material adverse effect on our financial condition. We continually monitor and reassess the potential materiality of these litigation matters. We note, however, that in light of the inherent uncertainty in legal proceedings there can be no assurance that the ultimate resolution will not exceed established reserves. As a result, the outcome of a particular matter, or a combination of matters, may be material to our results of operations for a particular period, depending upon the size of the loss or our income for that particular period.
Guarantees
We are a guarantor in various agreements with third parties. The following table shows the types of guarantees that we had outstanding at March 31, 2021. Information pertaining to the basis for determining the liabilities recorded in connection with these guarantees is included in Note 1 (“Summary of Significant Accounting Policies”) under the heading “Contingencies and Guarantees” beginning on page 116 of our 2020 Form 10-K.
| March 31, 2021 | Maximum Potential Undiscounted Future Payments | Liability Recorded | ||||||
| in millions | ||||||||
| Financial guarantees: | ||||||||
| Standby letters of credit | $ | 3,229 | $ | 72 | ||||
| Recourse agreement with FNMA | 5,951 | 23 | ||||||
| Residential mortgage reserve | 2,652 | 11 | ||||||
Written put options (a) | 3,991 | 46 | ||||||
| Total | $ | 15,823 | $ | 152 | ||||
(a)The maximum potential undiscounted future payments represent notional amounts of derivatives qualifying as guarantees.
We determine the payment/performance risk associated with each type of guarantee described below based on the probability that we could be required to make the maximum potential undiscounted future payments shown in the preceding table. We use a scale of low (0% to 30% probability of payment), moderate (greater than 30% to 70% probability of payment), or high (greater than 70% probability of payment) to assess the payment/performance risk, and have determined that the payment/performance risk associated with each type of guarantee outstanding at March 31, 2021, is low. Information pertaining to the nature of each of the guarantees listed below is included in Note 22 (“Commitments, Contingent Liabilities, and Guarantees”) under the heading “Guarantees” beginning on page 174 of our 2020 Form 10-K.
Standby letters of credit. At March 31, 2021, our standby letters of credit had a remaining weighted-average life of 1.7 years, with remaining actual lives ranging from less than 1 year to as many as 13.7 years.
Recourse agreement with FNMA. At March 31, 2021, the outstanding commercial mortgage loans in this program had a weighted-average remaining term of 7.8 years, and the unpaid principal balance outstanding of loans sold by us as a participant was $19.6 billion. The maximum potential amount of undiscounted future payments that we could be required to make under this program, as shown in the preceding table, is equal to approximately 30% of the principal balance of loans outstanding at March 31, 2021. FNMA delegates responsibility for originating, underwriting, and servicing mortgages, and we assume a limited portion of the risk of loss during the remaining term on each commercial mortgage loan that we sell to FNMA. We maintain a reserve for such potential losses in an amount that we believe approximates the fair value of our liability in addition to the expected credit loss for the guarantee as described in Note 4 (“Asset Quality“).
85
Residential Mortgage Banking. At March 31, 2021, the unpaid principal balance outstanding of loans sold by us in this program was $8.8 billion. The maximum potential amount of undiscounted future payments that we could be required to make under this program, as shown in the preceding table, is equal to approximately 30% of the principal balance of loans outstanding at March 31, 2021.
Our liability for estimated repurchase obligations on loans sold, which is included in Other liabilities on the Consolidated Balance Sheets, was $11 million at March 31, 2021. For more information on our residential mortgages, see Note 8 (“Mortgage Servicing Assets“).
Written put options. At March 31, 2021, our written put options had an average life of 2.4 years. These written put options are accounted for as derivatives at fair value, as further discussed in Note 7 (“Derivatives and Hedging Activities”).
Written put options where the counterparty is a broker-dealer or bank are accounted for as derivatives at fair value but are not considered guarantees since these counterparties typically do not hold the underlying instruments. In addition, we are a purchaser and seller of credit derivatives, which are further discussed in Note 7 (“Derivatives and Hedging Activities”).
Other Off-Balance Sheet Risk
Other off-balance sheet risk stems from financial instruments that do not meet the definition of a guarantee as specified in the applicable accounting guidance, and from other relationships. Additional information pertaining to types of other off-balance sheet risk is included in Note 22 (“Commitments, Contingent Liabilities, and Guarantees”) under the heading “Other Off-Balance Sheet Risk” on page 175 of our 2020 Form 10-K.
18. Accumulated Other Comprehensive Income
Our changes in AOCI for the three months ended March 31, 2021, and March 31, 2020, are as follows:
| in millions | Unrealized gains (losses) on securities available for sale | Unrealized gains (losses) on derivative financial instruments | Foreign currency translation adjustment | Net pension and postretirement benefit costs | Total | ||||||||||||
| Balance at December 31, 2020 | $ | 567 | $ | 476 | — | $ | (305) | $ | 738 | ||||||||
Other comprehensive income before reclassification, net of income taxes | (628) | 58 | — | (1) | (571) | ||||||||||||
Amounts reclassified from AOCI, net of income taxes (a) | — | (68) | — | 4 | (64) | ||||||||||||
| Net current-period other comprehensive income, net of income taxes | (628) | (10) | — | 3 | (635) | ||||||||||||
| Balance at March 31, 2021 | $ | (61) | $ | 466 | — | $ | (302) | $ | 103 | ||||||||
| Balance at December 31, 2019 | $ | 115 | $ | 250 | — | $ | (339) | $ | 26 | ||||||||
Other comprehensive income before reclassification, net of income taxes | 408 | 402 | — | — | 810 | ||||||||||||
Amounts reclassified from AOCI, net of income taxes (a) | (3) | (25) | — | 6 | (22) | ||||||||||||
| Net current-period other comprehensive income, net of income taxes | 405 | 377 | — | 6 | 788 | ||||||||||||
| Balance at March 31, 2020 | $ | 520 | $ | 627 | — | $ | (333) | $ | 814 | ||||||||
(a)See table below for details about these reclassifications.
Our reclassifications out of AOCI for the three months ended March 31, 2021, and March 31, 2020, are as follows:
86
| Three months ended March 31, | Affected Line Item in the Statement Where Net Income is Presented | ||||||||||
| in millions | 2021 | 2020 | |||||||||
| Unrealized gains (losses) on available for sale securities | |||||||||||
| Realized gains | — | $ | 4 | Other income | |||||||
| — | 4 | Income (loss) from continuing operations before income taxes | |||||||||
| — | 1 | Income taxes | |||||||||
| — | $ | 3 | Income (loss) from continuing operations | ||||||||
| Unrealized gains (losses) on derivative financial instruments | |||||||||||
| Interest rate | $ | 89 | $ | 34 | Interest income — Loans | ||||||
| Interest rate | (1) | (1) | Interest expense — Long-term debt | ||||||||
| Interest rate | 1 | — | Investment banking and debt placement fees | ||||||||
| 89 | 33 | Income (loss) from continuing operations before income taxes | |||||||||
| 21 | 8 | Income taxes | |||||||||
| $ | 68 | $ | 25 | Income (loss) from continuing operations | |||||||
| Net pension and postretirement benefit costs | |||||||||||
| Amortization of losses | $ | (5) | $ | (4) | Other expense | ||||||
| Settlement loss | — | (4) | Other expense | ||||||||
| (5) | (8) | Income (loss) from continuing operations before income taxes | |||||||||
| (1) | (2) | Income taxes | |||||||||
| $ | (4) | $ | (6) | Income (loss) from continuing operations | |||||||
19. Shareholders' Equity
Comprehensive Capital Plan
In January 2021, the Board of Directors authorized the repurchase of up to $900 million of our Common Shares, effective through the third quarter of 2021. We completed $166 million of Common Share repurchases, including $135 million of Common Share repurchases in the open market and $31 million of Common Share repurchases related to employee equity compensation programs, in the first quarter of 2021 under this authorization.
Consistent with our 2020 capital plan, the Board declared a quarterly dividend of $.185 per Common Share for the first quarter of 2021. Common Share repurchases and Common Share dividends paid during the first quarter are consistent with the Federal Reserve’s first quarter capital distribution limitations.
Preferred Stock
| Preferred stock series | Amount outstanding (in millions) | Shares authorized and outstanding | Par value | Liquidation preference | Ownership interest per depositary share | Liquidation preference per depositary share | First quarter 2021 dividends paid per depositary share | ||||||||||||||||
| Fixed-to-Floating Rate Perpetual Noncumulative Series D | $ | 525 | 21,000 | $ | 1 | $ | 25,000 | 1/25th | $ | 1,000 | $ | 12.50 | |||||||||||
| Fixed-to-Floating Rate Perpetual Noncumulative Series E | 500 | 500,000 | 1 | 1,000 | 1/40th | 25 | .382813 | ||||||||||||||||
| Fixed Rate Perpetual Noncumulative Series F | 425 | 425,000 | 1 | 1,000 | 1/40th | 25 | .353125 | ||||||||||||||||
| Fixed Rate Perpetual Non-Cumulative Series G | 450 | 450,000 | 1 | 1,000 | 1/40th | 25 | .351563 | ||||||||||||||||
87
20. Business Segment Reporting
Consumer Bank
The Consumer Bank serves individuals and small businesses throughout our 15-state branch footprint and through our Laurel Road digital brand by offering a variety of deposit and investment products, personal finance and financial wellness services, lending, student loan refinancing, mortgage and home equity,credit card, treasury services, and business advisory services. In addition, wealth management and investment services are offered to assist non-profit, and high-net-worth clients with their banking, trust, portfolio management, life insurance, charitable giving, and related needs.
Commercial Bank
The Commercial Bank is an aggregation of our Institutional and Commercial operating segments. The Commercial operating segment is a full-service corporate bank focused principally on serving the needs of middle market clients in seven industry sectors: consumer, energy, healthcare, industrial, public sector, real estate, and technology. The Commercial operating segment is also a significant servicer of commercial mortgage loans and a significant special servicer of CMBS. The Institutional operating segment delivers a broad suite of banking and capital markets products to its clients, including syndicated finance, debt and equity capital markets, commercial payments, equipment finance, commercial mortgage banking, derivatives, foreign exchange, financial advisory, and public finance.
Other
Other includes various corporate treasury activities such as management of our investment securities portfolio, long-term debt, short-term liquidity and funding activities, and balance sheet risk management, our principal investing unit, and various exit portfolios as well as reconciling items which primarily represents the unallocated portion of nonearning assets of corporate support functions. Charges related to the funding of these assets are part of net interest income and are allocated to the business segments through noninterest expense. Reconciling items also include intercompany eliminations and certain items that are not allocated to the business segments because they do not reflect their normal operations.
The development and application of the methodologies that we use to allocate items among our business segments is a dynamic process. Accordingly, financial results may be revised periodically to reflect enhanced alignment of expense base allocations drivers, changes in the risk profile of a particular business, or changes in our organizational structure.
88
The table below shows selected financial data for our business segments for the three-month periods ended March 31, 2021, and March 31, 2020. Capital is assigned to each business segment based on a combination of regulatory and economic equity.
| Three months ended March 31, | Consumer Bank | Commercial Bank | Other | Total Key | |||||||||||||||||||||||||||||||
| dollars in millions | 2021 | 2020 | 2021 | 2020 | 2021 | 2020 | 2021 | 2020 | |||||||||||||||||||||||||||
| SUMMARY OF OPERATIONS | |||||||||||||||||||||||||||||||||||
| Net interest income (TE) | $ | 607 | $ | 581 | $ | 411 | $ | 421 | $ | (6) | $ | (13) | $ | 1,012 | $ | 989 | |||||||||||||||||||
| Noninterest income | 257 | 229 | 447 | 220 | 34 | 28 | 738 | 477 | |||||||||||||||||||||||||||
Total revenue (TE) (a) | 864 | 810 | 858 | 641 | 28 | 15 | 1,750 | 1,466 | |||||||||||||||||||||||||||
| Provision for credit losses | (23) | 136 | (67) | 222 | (3) | 1 | (93) | 359 | |||||||||||||||||||||||||||
| Depreciation and amortization expense | 18 | 21 | 34 | 36 | 38 | 35 | 90 | 92 | |||||||||||||||||||||||||||
| Other noninterest expense | 583 | 518 | 409 | 326 | (11) | (5) | 981 | 839 | |||||||||||||||||||||||||||
Income (loss) from continuing operations before income taxes (TE) | 286 | 135 | 482 | 57 | 4 | (16) | 772 | 176 | |||||||||||||||||||||||||||
Allocated income taxes and TE adjustments | 69 | 32 | 99 | (9) | (14) | 8 | 154 | 31 | |||||||||||||||||||||||||||
| Income (loss) from continuing operations | 217 | 103 | 383 | 66 | 18 | (24) | 618 | 145 | |||||||||||||||||||||||||||
Income (loss) from discontinued operations, net of taxes | — | — | — | — | 4 | 1 | 4 | 1 | |||||||||||||||||||||||||||
| Net income (loss) | 217 | 103 | 383 | 66 | 22 | (23) | 622 | 146 | |||||||||||||||||||||||||||
Less: Net income (loss) attributable to noncontrolling interests | — | — | — | — | — | — | — | — | |||||||||||||||||||||||||||
| Net income (loss) attributable to Key | $ | 217 | $ | 103 | $ | 383 | $ | 66 | $ | 22 | $ | (23) | $ | 622 | $ | 146 | |||||||||||||||||||
AVERAGE BALANCES (b) | |||||||||||||||||||||||||||||||||||
| Loans and leases | $ | 39,249 | $ | 33,175 | $ | 60,885 | $ | 62,104 | $ | 594 | $ | 895 | $ | 100,728 | $ | 96,174 | |||||||||||||||||||
Total assets (a) | 42,476 | 36,415 | 70,114 | 71,410 | 59,643 | 38,403 | 172,233 | 146,228 | |||||||||||||||||||||||||||
| Deposits | 85,033 | 73,133 | 51,894 | 36,443 | 813 | 752 | 137,740 | 110,328 | |||||||||||||||||||||||||||
| OTHER FINANCIAL DATA | |||||||||||||||||||||||||||||||||||
Net loan charge-offs (b) | $ | 36 | $ | 43 | $ | 78 | $ | 40 | $ | — | $ | 1 | $ | 114 | $ | 84 | |||||||||||||||||||
Return on average allocated equity (b) | 25.76 | % | 12.30 | % | 17.47 | % | 5.57 | % | 1.34 | % | (1.06) | % | 14.11 | % | 3.39 | % | |||||||||||||||||||
| Return on average allocated equity | 25.76 | 12.30 | 17.47 | 5.57 | 1.63 | (1.02) | 14.20 | 3.41 | |||||||||||||||||||||||||||
Average full-time equivalent employees (c) | 8,284 | 8,144 | 2,066 | 2,091 | 6,736 | 6,294 | 17,086 | 16,529 | |||||||||||||||||||||||||||
(a)Substantially all revenue generated by our major business segments is derived from clients that reside in the United States. Substantially all long-lived assets, including premises and equipment, capitalized software, and goodwill held by our major business segments, are located in the United States.
(b)From continuing operations.
(c)The number of average full-time equivalent employees was not adjusted for discontinued operations.
21. Revenue from Contracts with Customers
The following table represents a disaggregation of revenue from contracts with customers, by business segment, for the three-month periods ended March 31, 2021, and March 31, 2020.
| Three months ended March 31, 2021 | Three months ended March 31, 2020 | ||||||||||||||||||||||
| dollars in millions | Consumer Bank | Commercial Bank | Total Contract Revenue | Consumer Bank | Commercial Bank | Total Contract Revenue | |||||||||||||||||
| NONINTEREST INCOME | |||||||||||||||||||||||
| Trust and investment services income | $ | 101 | $ | 18 | $ | 119 | $ | 93 | $ | 19 | $ | 112 | |||||||||||
| Investment banking and debt placement fees | — | 79 | 79 | — | 47 | 47 | |||||||||||||||||
| Services charges on deposit accounts | 39 | 34 | 73 | 56 | 28 | 84 | |||||||||||||||||
| Cards and payments income | 43 | 61 | 104 | 38 | 26 | 64 | |||||||||||||||||
| Other noninterest income | 3 | 1 | 4 | 2 | — | 2 | |||||||||||||||||
| Total revenue from contracts with customers | $ | 186 | $ | 193 | $ | 379 | $ | 189 | $ | 120 | $ | 309 | |||||||||||
Other noninterest income (a) | $ | 325 | $ | 140 | |||||||||||||||||||
Noninterest income from Other(b) | 34 | 28 | |||||||||||||||||||||
| Total noninterest income | $ | 738 | $ | 477 | |||||||||||||||||||
(a)Noninterest income considered earned outside the scope of contracts with customers.
(b)Other includes other segments that consists of corporate treasury, our principal investing unit, and various exit portfolios as well as reconciling items which primarily represents the unallocated portion of nonearning assets of corporate support functions. Charges related to the funding of these assets are part of net interest income and are allocated to the business segments through noninterest expense. Reconciling items also includes intercompany eliminations and certain items that are not allocated to the business segments because they do not reflect their normal operations. Refer to Note 20 (“Business Segment Reporting”) for more information.
We had no material contract assets or contract liabilities as of March 31, 2021, and March 31, 2020.
89
Report of Ernst & Young LLP, Independent Registered Public Accounting Firm
To the Shareholders and Board of Directors of KeyCorp
Results of Review of Interim Financial Statements
We have reviewed the accompanying consolidated balance sheet of KeyCorp as of March 31, 2021, the related consolidated statements of income, comprehensive income, changes in equity and cash flows for the three-months ended March 31, 2021 and 2020, and the related notes (collectively referred to as the “consolidated interim financial statements”). Based on our reviews, we are not aware of any material modifications that should be made to the consolidated interim financial statements for them to be in conformity with U.S. generally accepted accounting principles.
We have previously audited, in accordance with the standards of the Public Company Accounting Oversight Board (United States) (PCAOB), the consolidated balance sheet of KeyCorp as of December 31, 2020, and the related consolidated statements of income, comprehensive income, changes in equity and cash flows for the year then ended, and the related notes (not presented herein); and in our report dated February 22, 2021, we expressed an unqualified opinion on those consolidated financial statements. In our opinion, the information set forth in the accompanying consolidated balance sheet as of December 31, 2020 is fairly stated, in all material respects, in relation to the consolidated balance sheet from which it has been derived.
Basis for Review Results
These financial statements are the responsibility of KeyCorp's management. We are a public accounting firm registered with the PCAOB and are required to be independent with respect to KeyCorp in accordance with the U.S. federal securities laws and the applicable rules and regulations of the SEC and the PCAOB. We conducted our review in accordance with the standards of the PCAOB. A review of interim financial statements consists principally of applying analytical procedures and making inquiries of persons responsible for financial and accounting matters. It is substantially less in scope than an audit conducted in accordance with the standards of the PCAOB, the objective of which is the expression of an opinion regarding the financial statements taken as a whole. Accordingly, we do not express such an opinion.
 | |||||
| Cleveland, Ohio | |||||
| May 4, 2021 | |||||
90
Item 3. Quantitative and Qualitative Disclosure about Market Risk
The information presented in the “Market risk management” section of the Management’s Discussion & Analysis of Financial Condition & Results of Operations is incorporated herein by reference.
Item 4. Controls and Procedures
As of the end of the period covered by this report, KeyCorp carried out an evaluation, under the supervision and with the participation of KeyCorp’s management, including our Chief Executive Officer and Chief Financial Officer, of the effectiveness of the design and operation of KeyCorp’s disclosure controls and procedures (as defined in Rule 13a-15(e) under the Securities Exchange Act of 1934 (the “Exchange Act”)), to ensure that information required to be disclosed by KeyCorp in reports that it files or submits under the Exchange Act, is recorded, processed, summarized and reported within the time periods specified in the SEC’s rules and forms, and that such information is accumulated and communicated to KeyCorp’s management, including its Chief Executive Officer and Chief Financial Officer, as appropriate, to allow for timely decisions regarding required disclosure. Based upon that evaluation, KeyCorp’s Chief Executive Officer and Chief Financial Officer concluded that the design and operation of these disclosure controls and procedures were effective, in all material respects, as of the end of the period covered by this report.
No changes were made to KeyCorp’s internal control over financial reporting (as defined in Rule 13a-15(f) under
the Exchange Act) during the last quarter that materially affected, or are reasonably likely to materially affect,
KeyCorp’s internal control over financial reporting.
PART II. OTHER INFORMATION
Item 1. Legal Proceedings
The information presented in the Legal Proceedings section of Note 17 (“Contingent Liabilities and Guarantees”) of the Notes to Consolidated Financial Statements (Unaudited) is incorporated herein by reference.
On at least a quarterly basis, we assess our liabilities and contingencies in connection with outstanding legal proceedings utilizing the latest information available. Where it is probable that we will incur a loss and the amount of the loss can be reasonably estimated, we record a liability in our consolidated financial statements. These legal reserves may be increased or decreased to reflect any relevant developments on a quarterly basis. Where a loss is not probable or the amount of the loss is not estimable, we have not accrued legal reserves, consistent with applicable accounting guidance. Based on information currently available to us, advice of counsel, and available insurance coverage, we believe that our established reserves are adequate and the liabilities arising from the legal proceedings will not have a material adverse effect on our consolidated financial condition. We note, however, that in light of the inherent uncertainty in legal proceedings there can be no assurance that the ultimate resolution will not exceed established reserves. As a result, the outcome of a particular matter or a combination of matters may be material to our results of operations for a particular period, depending upon the size of the loss or our income for that particular period.
Item 1A. Risk Factors
For a discussion of certain risk factors affecting us, see the section titled “Supervision and Regulation” in Part I, Item 1. Business, on pages 10-25 of our 2020 Form 10-K; Part I, Item 1A. Risk Factors, on pages 26-38 of our 2020 Form 10-K; the sections titled “Supervision and regulation” and “Strategic developments” in this Form 10-Q; and our disclosure regarding forward-looking statements in this Form 10-Q.
91
Item 2. Unregistered Sales of Equity Securities and Use of Proceeds
From time to time, KeyCorp or its principal subsidiary, KeyBank, may seek to retire, repurchase, or exchange outstanding debt of KeyCorp or KeyBank, and capital securities or preferred stock of KeyCorp, through cash purchase, privately negotiated transactions, or otherwise. Such transactions, if any, depend on prevailing market conditions, our liquidity and capital requirements, contractual restrictions, and other factors. The amounts involved may be material.
In January 2021, the Board of Directors authorized the repurchase of up to $900 million of our common shares, effective through the third quarter of 2021.
The following table summarizes our repurchases of our Common Shares for the three months ended March 31, 2021.
| Calendar month | Total number of shares purchased (a) | Average price paid per share | Total number of shares purchased as part of publicly announced plans or programs | Maximum number of shares that may yet be purchased as part of publicly announced plans or programs (b) | |||||||||||||||||||
| January 1 - 31 | 4,435,575 | 17.24 | 4,435,575 | 48,846,334 | |||||||||||||||||||
| February 1 - 28 | 4,838,713 | 18.54 | 4,838,713 | 36,436,251 | |||||||||||||||||||
| March 1 - 31 | 2,485 | 21.18 | 2,485 | 36,725,399 | |||||||||||||||||||
| Total | 9,276,773 | $ | 17.92 | 9,276,773 | |||||||||||||||||||
(a)Includes Common Shares deemed surrendered by employees in connection with our stock compensation and benefit plans to satisfy tax obligations.
(b)Calculated using the remaining general repurchase amount divided by the closing price of KeyCorp Common Shares as follows: on January 29, 2021, at $16.86; on February 26, 2021, at $20.14; and on March 31, 2021, at $19.98.
Item 6. Exhibits
| 101 | The following materials from KeyCorp’s Form 10-Q Report for the quarterly period ended March 31, 2021, formatted in inline XBRL: (i) the Consolidated Balance Sheets; (ii) the Consolidated Statements of Income and Consolidated Statements of Comprehensive Income; (iii) the Consolidated Statements of Changes in Equity; (iv) the Consolidated Statements of Cash Flows; and (v) the Notes to Consolidated Financial Statements. | ||||
| 104 | The cover page from KeyCorp’s Form 10-Q for the quarterly period ended March 31, 2021, formatted in inline XBRL (contained in Exhibit 101). | ||||
* | Furnished herewith. | ||||
Information Available on Website
KeyCorp makes available free of charge on its website, www.key.com, its 2020 Form 10-K, quarterly reports on Form 10-Q, current reports on Form 8-K, and amendments to these reports as soon as reasonably practicable after KeyCorp electronically files such material with, or furnishes it to, the SEC. We also make available a summary of filings made with the SEC of statements of beneficial ownership of our equity securities filed by our directors and officers under Section 16 of the Exchange Act. The “Financials — Regulatory Disclosures and Filings” tab of the investor relations section of our website includes public disclosures concerning our prior annual and mid-year stress-testing activities under the Dodd-Frank Act. Information contained on or accessible through our website or any other website referenced in this report is not part of this report.
92
SIGNATURE
Pursuant to the requirements of the Securities Exchange Act of 1934, the Registrant has duly caused this report to be signed on its behalf by the undersigned, thereunto duly authorized, on the date indicated.
| KEYCORP | |||||
| (Registrant) | |||||
| Date: May 4, 2021 | /s/ Douglas M. Schosser | ||||
| By: Douglas M. Schosser | |||||
Chief Accounting Officer (Principal Accounting Officer) | |||||
93