Attached files
| file | filename |
|---|---|
| 8-K - FORM 8-K - FIRST MARBLEHEAD CORP | d244223d8k.htm |
 ABS East
Presentation October 16 -
18, 2011
Exhibit 99.1 |
 ABS East
Conference Investor Presentation - 2
Forward-Looking Statements
Statements in this presentation regarding First Marblehead’s strategy, future financial
and operational results, competitive position, future opportunities and
platform, and the future performance of loan portfolios that First Marblehead has previously
facilitated, including projected forbearance, prepayment, delinquency and default
rates, as well as any other statements that are not purely historical, constitute forward-looking statements for purposes of the safe
harbor provisions of The Private Securities Litigation Reform Act of 1995. These
forward-looking statements are based on our historical performance, the historical
performance of the securitization trusts that we have facilitated (the “Trusts”), and on our plans, estimates and expectations as of October 14, 2011.
The inclusion of this forward-looking information should not be regarded as a
representation by us or any other person that the future results, plans, projections,
estimates or expectations expressed or implied by us will actually be achieved. You are cautioned that matters subject to forward-looking
statements involve known and unknown risks and uncertainties, including economic, legislative,
regulatory, competitive and other factors, which may cause actual financial or
operational results, including the performance of the Trusts and facilitated loan volumes, or the timing of events, including loan defaults, to
be materially different than those expressed or implied by our forward-looking statements.
Important factors that could cause or contribute to such differences include: market
acceptance of and demand for our Monogram platform and fee-based service offerings; our success in designing, implementing and
commercializing private education loan programs through Union Federal Savings Bank, including
receipt of and compliance with regulatory approvals and conditions with respect to such
programs; the successful marketing and sales of our clients’ Monogram-based loan offerings; the volume, timing and
performance of facilitated loans; the size and structure of any credit enhancement provided by
us in connection with our Monogram platform; capital market receptivity to private
student loan asset-backed securities and our ability to structure securitizations or alternative financings; the size, structure and timing of
any such securitizations or alternative financings; our success in realizing the anticipated
benefits of our acquisition of Tuition Management Systems, LLC; economic, legislative,
regulatory, competitive and other factors affecting discount, default, recovery and prepayment rates on private student loan portfolios,
including general economic conditions, the consumer credit environment, interest rates and
unemployment rates; borrower defaults and the Trusts’ ability to recover principal
and interest from such borrowers, including the effectiveness of various risk mitigation strategies, such as alternative payment plans; any
investigation, audit, claim, regulatory action or suit relating to the transfer of the trust
certificate of NC Residuals Owner Trust or the asset services agreement between the
purchaser and us, including as a result of the audit being conducted by the Internal Revenue Service relating to tax refunds previously received;
resolution of pending litigation pertaining to our Massachusetts state income tax returns;
management’s determination of which qualitative and quantitative factors,
including macroeconomic indicators and historical experience, should be weighted in our projections, and the weight to be given to each such factor;
and the other factors set forth under the caption "risk factors" in our annual report
on Form 10-K filed with the Securities and Exchange Commission on September 8,
2011. We specifically disclaim any obligation to update any forward-looking statements as a result of developments occurring after October 14,
2011.
Disclaimer
The information in this presentation is intended to provide a broad overview of a portfolio of
private education loans previously facilitated by First Marblehead. Neither First
Marblehead nor any other party is offering any securities by making this presentation or soliciting any action based upon the information provided.
Nothing in this presentation should be relied upon as a representation by First Marblehead, or
any other person, as to the future performance of any securitization trust described in
this presentation or as to any securities that may be issued in the future. The information contained herein is intended to be
illustrative only, and historical collateral pools may not be representative of any future
collateral pool. growth
prospects,
liquidity,
the
demand
for
private
education
loans,
the
characteristics
and
performance
of
future
loan
pools
based
on
our
Monogram
® |
 ABS East
Conference Investor Presentation - 3
Section I
FMD Corporate Update & Overview
Section II
Legacy Portfolio Experience
Section III
Data Driven Approach to Risk & Portfolio Management
Section IV
Monogram
®
Platform –
The Next Generation of Private Student Lending
TABLE OF CONTENTS |
 ABS East
Conference Investor Presentation - 4
Section I
FMD Corporate Update & Overview |
 ABS East
Conference Investor Presentation - 5
Corporate Update –
Recent Highlights
Entered peak student loan origination season for the first time since 2008 with
programs in place at three lenders
•
Since the launch of these programs, we have processed ~50,000 applications requesting
over
$525
million
in
funds,
and
approved
~$124
million
•
Credit characteristics of booked loan volume is strong:
88% cosigned
Weighted
average
FICO
score
is
757
60% of applicants have selected immediately cash flowing options
76% of applicants have selected repayment terms of 10 years or less
In the quarter ended 06/30/11, Tuition Management Systems, LLC (TMS) provided
$623,000 of positive cash flow, excluding capital expenditures
•
TMS is the largest volume tuition payment plan provider in the U.S.
As
of
6/30/11,
FMD
had
$267.4
million
in
cash,
cash
equivalents,
&
short-term
investments
1
1
1
Origination and credit data is as of October 10, 2011 and includes all FMD-facilitated
programs. Weighted average FICO score is based upon the cosigner’s FICO
score if the loan is cosigned, otherwise it is based upon the borrower’s FICO score. |
 ABS East
Conference Investor Presentation - 6
Focus. Flexibility. Innovation.
Work with lender and school clients to create responsible, affordable choices for students and
their families as they prepare to meet the cost of higher education
Approach credit with data-driven quantitative analysis based on 20 years of industry
experience Operate a highly specialized business model deriving revenue from
fee-for-service operations, partnered lending platforms and capital markets
execution strategies What We Do
Industry
leading
financial
services
intermediary
specializing
in
the
design,
origination,
management
and financing of private student loan programs
Outsourced tuition planning, billing and payment technology services through our subsidiary
Tuition Management Systems, LLC
Our bank subsidiary, Union Federal, offers banking services and products including private
student loans
Over 6 million loan applications processed totaling over $16.5 billion volume; 38
asset-backed bond securitizations sponsored totaling over $16 billion in
issuance Who We Are |
 ABS East
Conference Investor Presentation - 7
Focus. Flexibility. Innovation.
Families
struggling
more
than
ever
to
fill
the
“funding
gap”
created
by
ever-increasing
college
costs,
limits on federal student loans along with shrinking state and institutional aid
Legislative changes and the credit crisis have tempered lending activities
Number of competitors has diminished
Ensure
the
right
students
at
the
right
schools
receive
the
right
student
loans
Why We Do It
Leverage extensive private student loan experience applying sophisticated risk analysis
capabilities and high-touch portfolio management strategies designed to optimize
performance Utilize a seasoned national sales force and transparent loan application
process to deliver customized
loan
products
uniquely
designed
to
meet
borrowers’
needs
Coordinate with investment banks, rating agencies and investors to strategically deploy
capital to create viable and flexible disposition strategies for clients
How We Do It |
 ABS East
Conference Investor Presentation - 8
Diversified Revenue Sources
Private Student Loan Origination
•
Union Federal offers traditional higher education and K-12 loan programs nationally;
earns net interest margin by holding loans to term
Partnered Lending
•
Provide customized loan programs to lender clients; earn up-front fees for loan
origination and marketing; can earn a share of ongoing borrower interest income in
exchange for providing credit enhancement and portfolio management
Capital Markets
•
Long-term financing solutions for FMD-facilitated loan programs; earn ongoing fees
for trust administration and portfolio management; earn net interest margin by
retaining residual interests
Fee-For-Service
•
Services provided in our Private Student Loan Origination, Partnered Lending, Trust
Administration and Capital Markets businesses available on an a la carte basis
Tuition Payment Plans
•
Offer schools a suite of outsourced billing, payment processing and education payment
counseling products and services from TMS |
 ABS East
Conference Investor Presentation - 9
Building Blocks for Growth in Place
Industry Expertise
•
Historical focus on non-Federal student loan programs
•
Highly skilled and analytically focused Risk and Portfolio Management groups
•
Experienced Capital Markets team
•
Top flight National Sales team
•
Decisions driven by over 20 years of private student loan performance data
Strong Synergies with Subsidiaries and Strategic Partners
•
TMS tuition payment programs provide potential lead-generation for loan marketing
•
TMS deposit base provides scalability for Union Federal
•
Federally chartered thrift provides platform for national programs
•
Industry leading loan servicer and top-tier collections agencies used in portfolio
management
•
Highly reputable and stable regional banks for Partnered Lending
Monogram Platform –
The Next Generation of Private Student Lending
•
Flexible design aimed at producing medium and long-term, high quality assets
•
More granular assessment of risk
•
Exceptional transparency and increased disclosure throughout borrower application
process •
Proactive, analytical approach to portfolio management drives performance
|
 ABS East
Conference Investor Presentation - 10
Opportunity for Growth Exists
Consumers Demanding Private Student Loans
•
Enrollment continues to increase
•
Cost of education continues to rise
•
Federal aid targeting weaker credits
Capital Markets Demanding Better Credits
•
Investors seeking high credit quality loans
•
Better risk-based pricing
•
Traditional schools
Innovative Products Needed
•
Greater ability to control risk
•
Fully transparent application
•
Better analytics
•
Compliant with all regulatory requirements |
 Section
II Legacy Portfolio Experience
ABS East Conference Investor Presentation - 11 |
 ABS East
Conference Investor Presentation - 12
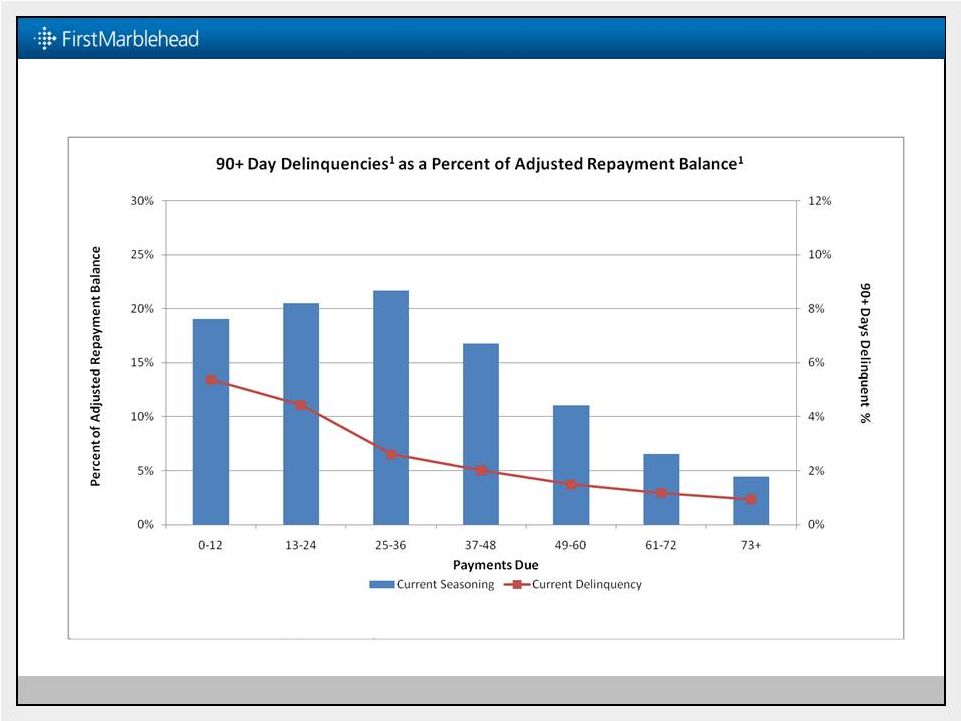
Delinquency Rates
1
Improve as Loans Season
1
Based on NCSLT data on PHEAA serviced loans as of September 30, 2011. A borrower making
reduced payments for a limited period of time pursuant to an alternative payment plan
will be considered current if such reduced payments are timely made and delinquent if such reduced
payments are past due. Adjusted Repayment Balance includes all loans in repayment status on
9/30/2011 excluding loans in basic forbearance. |
 ABS East
Conference Investor Presentation - 13
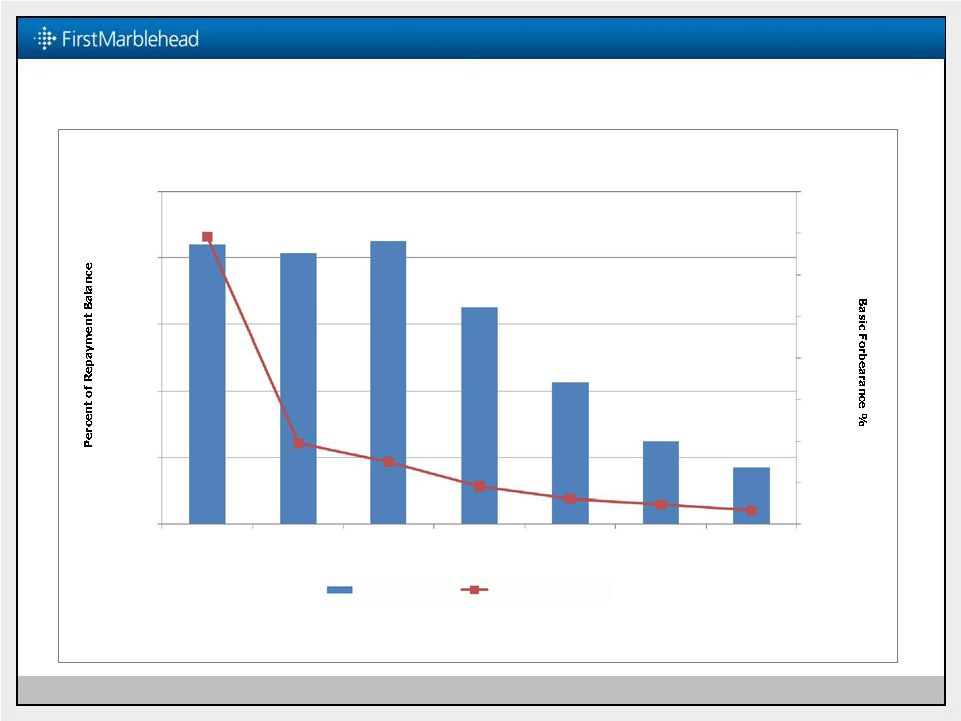
Basic Forbearance
Most Prevalent in Year 1 of Repayment
Payments Due at Time of Entering Basic Forbearance
Current
Seasoning
Current
Forbearance
25%
20%
15%
10%
5%
0%
0-12
13-24
25-36
37-48
49-60
61-72
73+
0%
2%
4%
6%
8%
10%
12%
14%
16%
Basic
Forbearance
as
a
Percent
of
Repayment
Balance
¹
1
1
Based on NCSLT data on PHEAA serviced loans as of September 30, 2011. Basic Forbearance does
not include loans in alternative payment plans, and alternative payment plans may
reduce utilization of basic forbearance. Repayment Balance includes all loans in repayment status
as of 9/30/2011, including loans in basic forbearance, alternative payment plans, and loans
that have entered repayment status and subsequently deferred payment.
|
 ABS East
Conference Investor Presentation - 14
Legacy Portfolio Risk Segmentation
1)
Outstanding
aggregate
principal
and
capitalized
interest
balance
as
of
June
30,
2011.
2)
Loans “not in repayment”
include loans in deferment or basic forbearance status as of June 30, 2011. We
classify loans subject to alternative payment plans, a form of forbearance, as “in
repayment.” 3)
Historical and projected defaults over the lives of the trusts as a percentage of original
outstanding aggregate principal.
4)
Historical and projected recoveries, net of historical and projected collection costs, as a
percentage of historical and projected cumulative gross defaults.
5)
Historical and projected defaults over the lives of the trusts less historical and projected
recoveries, net of collection costs, as a percentage of original outstanding aggregate
principal. 6)
Amount presented is the weighted average conditional prepayment rate (CPR) over the lives of
the trusts. The CPR is an estimate of the likelihood that a loan will be prepaid
during a period given that it has not previously defaulted or been repaid in
full. Source: FMD 10-K for the fiscal year ending June 30, 2011
June 30, 2011
NCSLT Portfolio
Segment 1
Segment 2
Segment 3
Distribution by original loan amount
25.5%
27.0%
47.5%
Distribution by total outstanding loan amount(1):
Not in repayment(2)
2.4
4.1
11.0
In repayment(2)
20.8
23.6
38.0
Gross default rate(3)
10.5
21.4
52.2
Recovery rate(4)
36.3
32.1
22.1
Net default rate(5)
6.7
14.5
40.7
Prepayment rate(6)
7.1
5.1
3.2 |
 Better Credits
Tend to Follow the Economy ABS East Conference Investor Presentation - 15 |
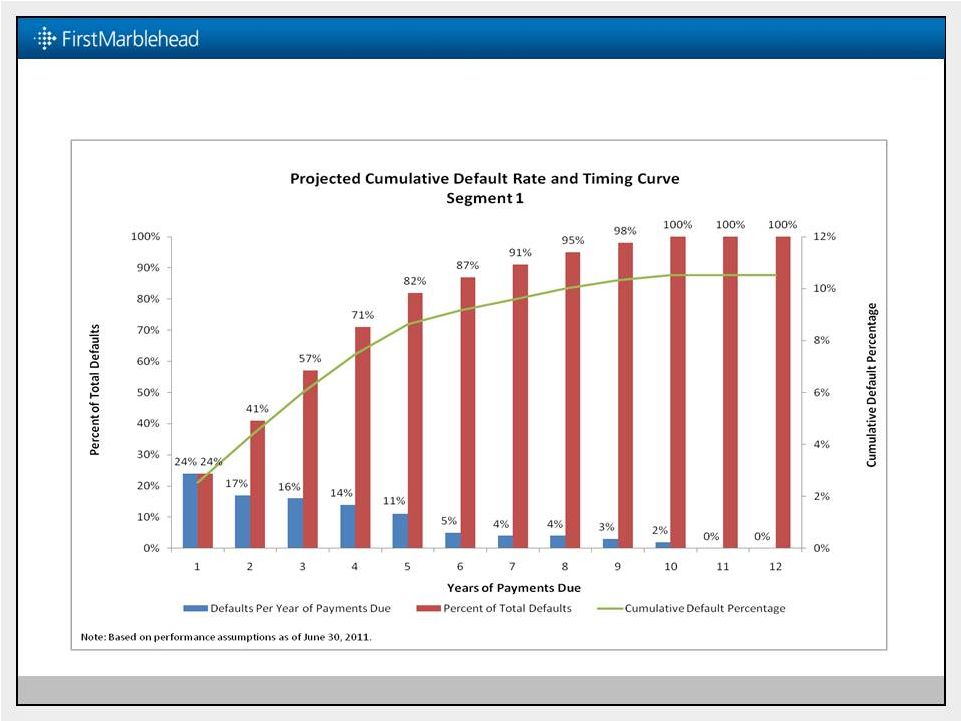
 Segment 2 Curve
More Frontloaded Than Segment 1 ABS East Conference Investor Presentation - 16 |
 Lower Credits at
Higher Risk of First Payment Default ABS East Conference Investor Presentation -
17 |
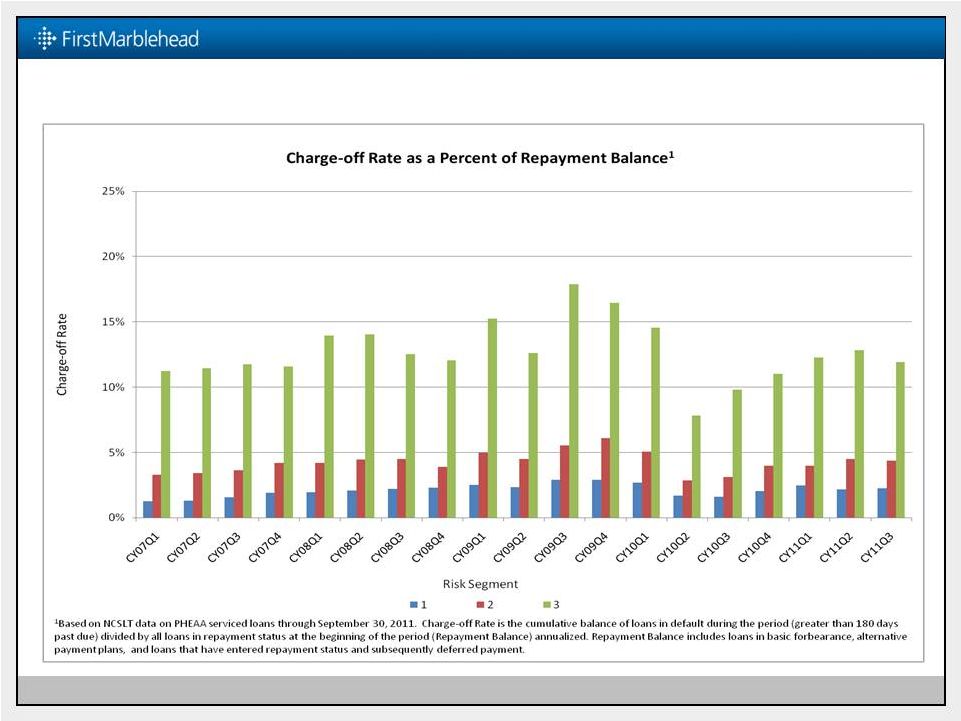 Charge-off
Rates Down From Peak in CY 2009 ABS East Conference Investor Presentation -
18 1
|
 ABS East
Conference Investor Presentation - 19
Section III
Data Driven Approach to Risk & Portfolio Management |
 Core Principles
of Credit Risk for Private Student Loans ABS East Conference Investor Presentation -
20 Data and Analytics
must be a Priority
Effective,
Quantitative
Underwriting
Market Responsibly
to Students
Dynamic Portfolio
Management
Ongoing Effort to
Determine LTV for
Student Loans
•
Complex asset class requires sophisticated analytical capabilities
•
Integration of multiple sources of historical data with prospective
modeling
•
Proprietary underwriting scorecard looks extensively at credit
profile of both student and cosigner
•
Approve schools based on risk parameters
•
Prevent over-borrowing
•
Seek to avoid adverse selection
•
Involve the cosigner early and often
•
•
Ideally, assign a value to the student’s education
•
Pursue through data gathering and analysis of borrower behavior
Apply adaptive strategies to fit borrowers’ changing credit profiles
|
 ABS East
Conference Investor Presentation - 21
FMD Proprietary Scorecard: Summary
Scorecard Results
•
Target variable: probability of default within first 2 years of time in repayment (exposure
time)
•
Effectively ranks applications from high to low risk of default
•
Requires
fewer
declined
applications
in
order
to
reduce
defaults
than
using
traditional
credit
score or previous version of the score
•
Variables scrutinized by internal legal and compliance functions
Predictive Attributes
•
Product
attributes:
repayment
option,
loan
amount,
expected
time
in
deferment,
applicant
income and homeowner status, student’s grade level and undergraduate/graduate
status •
Cosigner presence and credit
•
Credit bureau data across multiple asset classes: FICO, charge-offs, inquiries,
indebtedness, performance on all assets
•
The score attributes can be grouped into the following:
–
Application information
–
Wealth of credit experience
–
Delinquencies and derogatory information
–
Level of recent credit activity
–
Utilization of credit and level of indebtedness
Result:
FMD
Scorecard
continues
to
outperform
other
generic
credit
scores
for
underwriting
private
student
loans |
 ABS East
Conference Investor Presentation - 22
FMD Proprietary Scorecard: Version 2 Implemented in 2011
Updating a scorecard is standard procedure
•
We expect to deploy updates every 12-24 months
•
External validation of model part of update process
Updated Scorecard uses additional 18 months of performance data
•
Now includes 2008-2009 performance data
•
Doubled
the
number
of
loans
with
at
least
two
years
of
repayment
history
•
Now includes recession period data
Continued analysis leads to enhancements
•
Refinement of variables, such as:
–
Presence and type of mortgage handled differently and separately
–
Utilization of credit on other accounts looked at more granularly
–
‘Hunger for credit’
looks beyond just inquiries
–
Thick vs. thin files
•
New variables, such as:
–
Income
–
Year in school, including undergraduate vs. graduate student
–
Amount of deferment requested
Refined structure
•
Sub-scores for both student and cosigner
•
Traditional credit score not used in sub-scores; instead it is combined with the
sub-scores on segments of population
|
 ABS East
Conference Investor Presentation - 23
* Analysis based on historical school-certified volume from institutions currently on
FMD School List FMD Proprietary Scorecard: Improved Default Capture Rate
5%
10%
15%
20%
25%
30%
35%
40%
45%
50%
55%
60%
65%
70%
75%
80%
85%
90%
95%
100%
Percent of Applications
To Remove 75% of Defaults
•
Eliminate worst 55% using FICO
•
Eliminate worst 35% using FMD1
•
Eliminate worst 26% using FMD2
•
Worst 15% assigned by FMD Score Version 2
captures 58% of defaults
•
Worst 15% assigned by FMD Score Version 1 captures 50%
of defaults
•
Worst 15% assigned by FICO Score captures 35% of
defaults
Cosigner FICO
FMD Score Version 1
FMD Score Version 2
10%
20%
30%
40%
50%
60%
70%
80%
90%
100% |
 ABS East
Conference Investor Presentation - 24
Robust Analytics Throughout Life Cycle
Credit Scoring
Fraud Mitigation
Prepayment
Drop-Out Probability
Early Awareness
Collectability
Recoverability
Monthly Default Risk Score
Our suite of risk models are used throughout the life cycle of a
loan to optimize profitability and manage risk |
 ABS East
Conference Investor Presentation - 25
Validation and Controls are Vital to Protecting Monogram Platform’s
Integrity
Internal Controls
Maintain a dedicated Enterprise Risk
Management staff
Internal controls are regularly audited by
KPMG and Corporate Audit staffs
External Validation
Third-party review and validation of
proprietary rank order model
Third-party review and validation of method
of performance data analysis
Regulatory Oversight
Subject to SEC and NYSE regulation and
oversight as a publicly traded company
Subject to FRB supervision and examination
as a savings and loan holding company
MONOGRAM
PLATFORM |
 ABS East
Conference Investor Presentation - 26
Performance-Driven Portfolio Management Strategy
•
Account segmentation strategy driven by risk-based scoring model outcomes
•
Proactive borrower contact strategies to yield favorable repayment performance
•
Aggressive early delinquency coordination with servicer to decrease roll rates
•
Rigorous collection agency management to improve liquidation rates
•
Robust skip tracing techniques to increase success in locating borrowers
•
Efficient recovery process to result in greater and faster loss mitigation
•
Granular performance-based portfolio reporting to improve transparency
|
 ABS East
Conference Investor Presentation - 27
Section IV
Monogram
®
Platform –
The Next Generation of Private Student Lending |
 Monogram
Platform Incorporates FMD’s Core Competencies •School Focused
(GATE)
•Consumer
Focused (NCSLT)
•Credit Focused
(Monogram
Platform)
Customized
Program
Design
Dedicated
Sales
Support
Credit-driven
Loan
Origination
Process
Capital
Markets
Expertise
Active
Portfolio
Management
MONOGRAM
PLATFORM
1
Generation
Product
2
Generation
Product
3
Generation
Product
st
nd
rd
ABS East Conference Investor Presentation - 28 |
 ABS East
Conference Investor Presentation - 29
Monogram Platform Designed to Source the Best Credits
Targeting and approving only higher credit quality applicants
•
Focuses
on
the
best
legacy
loans
–
Segment
1
•
Removes any non-school-certified historical products
•
Limits school list to traditional Title IV schools with lower FFELP cohort default
rates Granular risk segmentation allows for better risk-based pricing
•
Credit quality of borrower and cosigner evaluated in decision process
•
FICO only part of the story
•
Repay type and term are controlled
School involved in the process
•
Student enrollment and loan amount certified by school
•
Funds disbursed directly to school
Monitor results
•
Daily review of actual portfolio distribution
•
Proactive portfolio management
•
Agility to evolve program as necessary in a timely manner |
 ABS East
Conference Investor Presentation - 30
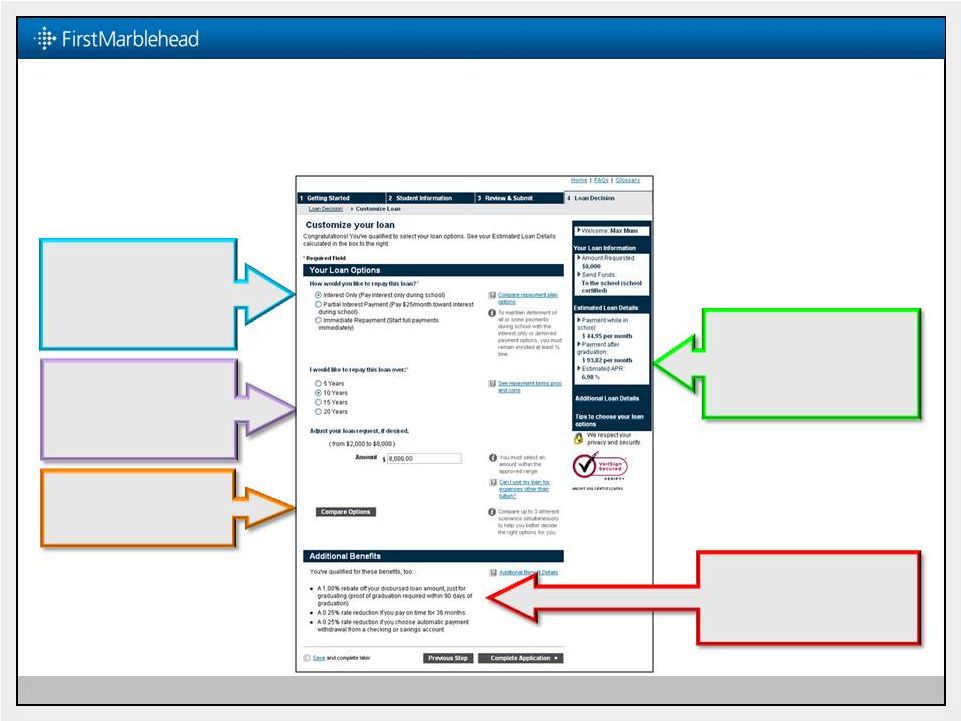
Innovative Application Process Keeps Borrower Informed at All Times
•
Real-time product
comparison and
analysis is available
•
Choice of repayment
option and repayment
term will impact
borrower’s loan
interest rate
•
Borrower can adjust
the approved loan
amount to meet
optimal needs
•
Borrower sees, in real-
time, how changing the
combination of these
attributes affect interest
rate and monthly payment
•
Borrower benefits can be
tied to any of the product
attributes to influence
portfolio composition |
 ABS East
Conference Investor Presentation - 31
1
2
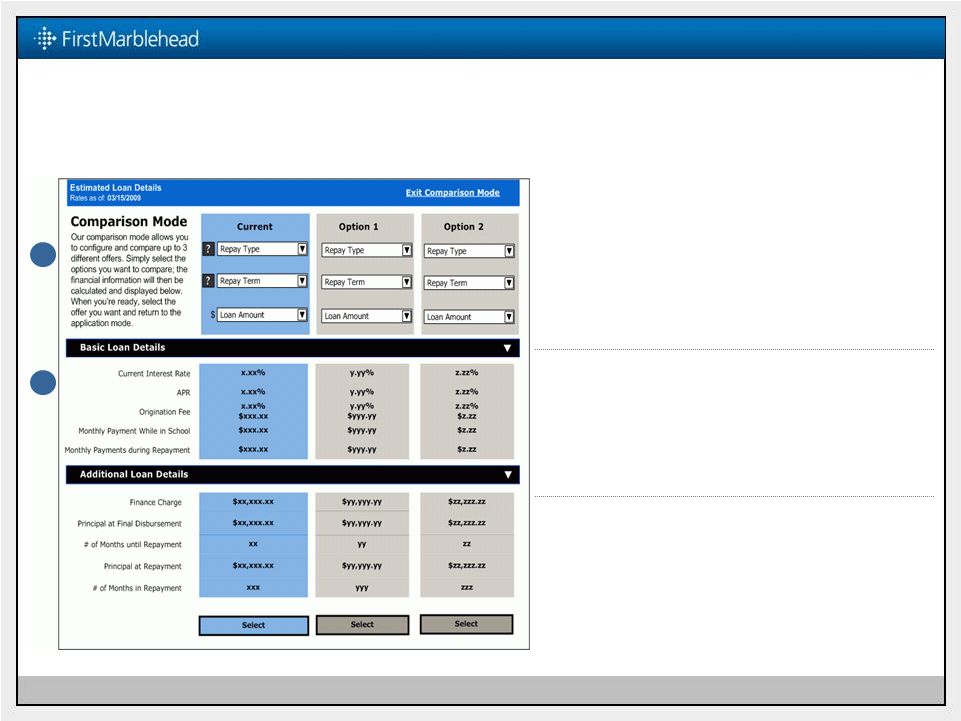
Product Comparison Page Encourages Smart Borrowing
1
Product
Comparison
Feature
Borrowers can compare up to 3
product options by selecting
Repayment Type and Repayment
Term. Loan amount will be pre-
populated
2
Loan Details
Borrowers can expand the additional
pricing details to view and compare
the impact of their choices side-by-
side to drive smarter decisions |
 ABS East
Conference Investor Presentation - 32
Monogram Platform Yielding High Quality Portfolios
Union Federal Booked Volume Characteristics through October 10, 2011
Weighted Average Interest Rate
One Month LIBOR + 6.1%
Booked Volume
$18.6 million
Application Request Volume
$310.4 million
Weighted Average FICO Score
753
Immediate Repay/Interest Only/Reduced
Interest/Full Defer
15%/23%/19%/42%
5 Year/10 Year/15 Year
27%/40%/33%
% School-Certified/Disbursed to School
100%
% Undergraduate/Graduate Degree-granting
Programs
100%
% Cosigned
87%
Projected Weighted Average Life
5.7 yrs
Projected Cumulative Gross Default Rate
6.4%
Approval Rate
16% |
 ABS East
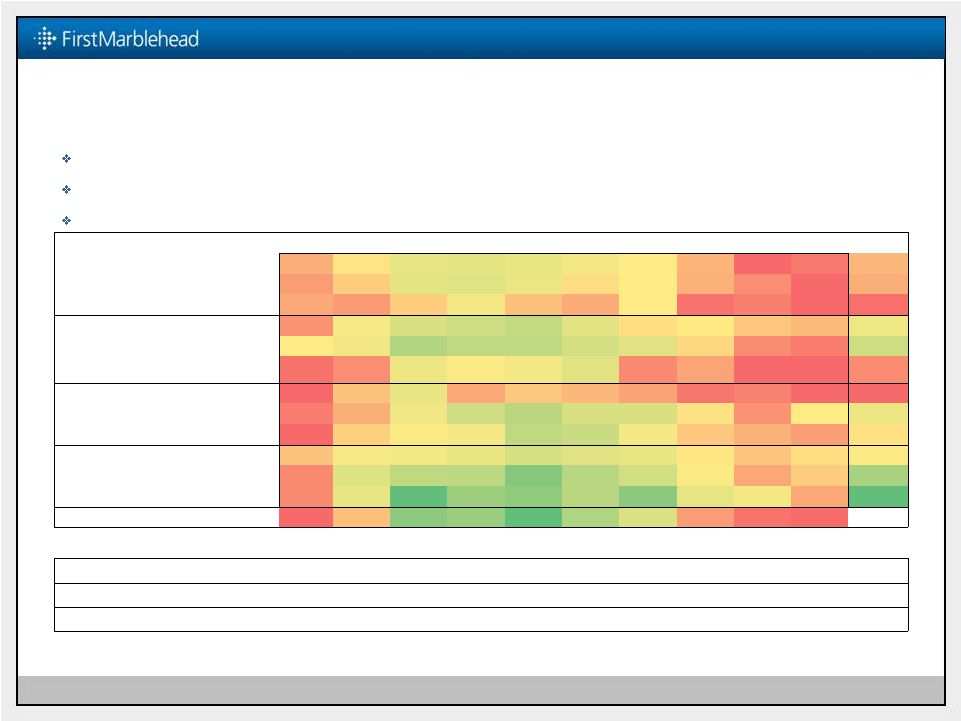
Conference Investor Presentation - 33
Borrower Choices Reflect Smart Borrowing
Union Federal Booked Volume through October 10, 2011
88% Cosigned
67% of loans are 5-
or 10-year terms
58% are immediately cash flowing upon disbursement
Tier
Payment Option:
Term:
1
2
3
4
5
6
7
8
9
10
SubTotal:
Immediate
Repay
IM
5
0.3%
0.9%
1.2%
1.1%
1.2%
0.8%
0.5%
0.4%
0.2%
0.3%
6.8%
IM
10
0.2%
0.4%
1.0%
1.1%
1.0%
0.5%
0.5%
0.3%
0.2%
0.0%
5.2%
IM
15
0.2%
0.2%
0.2%
0.8%
0.4%
0.2%
0.5%
0.2%
0.1%
0.0%
2.8%
Interest
Only
IO
5
0.2%
0.8%
1.3%
1.7%
1.8%
1.2%
0.5%
0.5%
0.3%
0.3%
8.6%
IO
10
0.6%
0.8%
2.1%
1.9%
2.1%
1.5%
1.3%
0.5%
0.1%
0.3%
11.0%
IO
15
0.1%
0.1%
1.0%
0.5%
0.7%
1.1%
0.1%
0.2%
0.0%
0.0%
3.9%
Partial
Interest
PI
5
0.0%
0.3%
1.0%
0.5%
0.4%
0.4%
0.3%
0.2%
0.1%
0.0%
3.2%
PI
10
0.1%
0.3%
0.8%
1.5%
2.0%
1.5%
1.3%
0.8%
0.2%
0.6%
9.0%
PI
15
0.0%
0.4%
0.6%
0.8%
2.0%
1.7%
0.7%
0.3%
0.3%
0.5%
7.2%
Full
Deferment
DF
5
0.5%
0.9%
1.1%
1.1%
1.6%
1.2%
0.9%
0.4%
0.4%
0.5%
8.6%
DF
10
0.2%
1.3%
2.1%
2.0%
4.0%
2.3%
1.7%
0.8%
0.3%
0.6%
15.1%
DF
15
0.1%
0.9%
3.9%
2.6%
2.7%
2.1%
3.6%
1.0%
1.2%
0.5%
18.6%
SubTotal:
2.4%
7.2%
16.3%
15.4%
19.8%
14.4%
11.9%
5.7%
3.4%
3.5%
Wtd Avg. FICO Score:
789
777
770
768
755
743
736
720
721
722
753
% Homeownership
96.1%
93.0%
92.3%
86.7%
79.3%
74.5%
72.0%
70.7%
50.9%
64.4%
80.4%
Avg. age of oldest trade line (yrs)
23.6
22.0
23.0
21.3
20.1
19.2
17.2
16.7
16.6
16.0
20.0 |
 ABS East
Conference Investor Presentation - 34
Capital Markets Contacts |