Attached files
Use these links to rapidly review the document
TABLE OF CONTENTS
UNITED STATES
SECURITIES AND EXCHANGE COMMISSION
Washington, DC 20549
Form 10-K
| (Mark One) | ||
ý |
ANNUAL REPORT PURSUANT TO SECTION 13 OR 15(d) OF THE SECURITIES EXCHANGE ACT OF 1934 |
|
For the fiscal year ended June 30, 2010 |
||
OR |
||
o |
TRANSITION REPORT PURSUANT TO SECTION 13 OR 15(d) OF THE SECURITIES EXCHANGE ACT OF 1934 |
|
For the transition period from to |
||
Commission file number: 001-31825
THE FIRST MARBLEHEAD CORPORATION
(Exact name of registrant as specified in its charter)
| Delaware (State or other jurisdiction of incorporation or organization) |
04-3295311 (I.R.S. Employer Identification No.) |
|
The Prudential Tower 800 Boylston Street, 34th Floor Boston, Massachusetts (Address of principal executive offices) |
02199-8157 (Zip Code) |
Registrant's telephone number, including area code: (800) 895-4283
Securities registered pursuant to Section 12(b) of the Act:
| Title of each class | Name of each exchange on which registered | |
|---|---|---|
| Common Stock, $.01 par value | New York Stock Exchange |
Securities registered pursuant to Section 12(g) of the Act: None
Indicate by check mark if the registrant is a well-known seasoned issuer, as defined in Rule 405 of the Securities Act. Yes o No ý
Indicate by check mark if the registrant is not required to file reports pursuant to Section 13 or Section 15(d) of the Act. Yes o No ý
Indicate by check mark whether the registrant (1) has filed all reports required to be filed by Section 13 or 15(d) of the Securities Exchange Act of 1934 during the preceding 12 months (or for such shorter period that the registrant was required to file such reports), and (2) has been subject to such filing requirements for the past 90 days. Yes ý No o
Indicate by check mark whether the registrant has submitted electronically and posted on its corporate Web site, if any, every Interactive Data File required to be submitted and posted pursuant to Rule 405 of Regulation S-T (§232.405 of this chapter) during the preceding 12 months (or for such shorter period that the registrant was required to submit and post such files). Yes o No o
Indicate by check mark if disclosure of delinquent filers pursuant to Item 405 of Regulation S-K (§229.405) is not contained herein, and will not be contained, to the best of registrant's knowledge, in definitive proxy or information statements incorporated by reference in Part III of this Form 10-K or any amendment to this Form 10-K. ý
Indicate by check mark whether the registrant is a large accelerated filer, an accelerated filer, a non-accelerated filer or a smaller reporting company. See the definitions of "large accelerated filer," "accelerated filer" and "smaller reporting company" in Rule 12b-2 of the Exchange Act (check one):
| Large accelerated filer o | Accelerated filer ý | Non-accelerated filer o (Do not check if a smaller reporting company) |
Smaller reporting company o |
Indicate by check mark whether the registrant is a shell company (as defined in Rule 12b-2 of the Act). Yes o No ý
The aggregate market value of the voting and non-voting common equity held by non-affiliates of the registrant (without admitting that any person whose shares are not included in the calculation is an affiliate) was approximately $126,367,956 based on the last reported sale price of the common stock on the New York Stock Exchange on December 31, 2009. For the purposes of the immediately preceding sentence, the term "affiliate" refers to each director, executive officer and greater than 10% stockholder of the registrant as of December 31, 2009.
Number of shares of the registrant's common stock outstanding as of September 1, 2010: 100,760,184.
DOCUMENTS INCORPORATED BY REFERENCE
The registrant intends to file a proxy statement pursuant to Regulation 14A within 120 days of the end of the fiscal year ended June 30, 2010. Pursuant to Paragraph G(3) of the General Instructions to Form 10-K, information required by Items 10, 11, 12, 13 and 14 of Part III have been omitted from this report (except for information required with respect to our executive officers and code of ethics, which is set forth under "Executive Officers of the Registrant" and "Code of Ethics" in Part I of this annual report, respectively) and are incorporated by reference to the definitive proxy statement to be filed with the Securities and Exchange Commission.
THE FIRST MARBLEHEAD CORPORATION
ANNUAL REPORT ON FORM 10-K
For the Fiscal Year Ended June 30, 2010
TABLE OF CONTENTS
FIRSTMARBLEHEAD and MONOGRAM are either registered trademarks or trademarks of The First Marblehead Corporation. All other trademarks, service marks or trade names appearing in this annual report are the property of their respective owners.
In addition to historical information, this annual report includes forward-looking statements within the meaning of Section 21E of the Securities Exchange Act of 1934, as amended, or the Exchange Act, and Section 27A of the Securities Act of 1933, as amended, or the Securities Act. For this purpose, any statements contained herein regarding our strategy, future operations and products, financial performance and liquidity, future funding transactions, projected costs, future market position, prospects, plans and outlook, other than statements of historical facts, are forward-looking statements. The words "anticipates," "believes," "estimates," "expects," "intends," "may," "observe," "plans," "projects," "will," "would" and similar expressions are intended to identify forward-looking statements, although not all forward-looking statements contain these identifying words. We cannot guaranty that we actually will achieve the plans, intentions or expectations expressed or implied in our forward-looking statements, which involve risks, assumptions and uncertainties. There are a number of important factors that could cause actual results, levels of activity, performance or timing of events to differ materially from those expressed or implied in the forward-looking statements we make. These important factors include our "critical accounting estimates" described in Item 7 of Part II of this annual report, and factors including, but not limited to, those set forth under the caption "Risk
Factors" in Item 1A of Part I of this annual report. Although we may elect to update forward-looking statements in the future, we specifically disclaim any obligation to do so, even if our estimates change, and readers should not rely on those forward-looking statements as representing our views as of any date subsequent to September 2, 2010.
We use the terms "First Marblehead," "we," "us" and "our" in this annual report to refer to the business of The First Marblehead Corporation and its subsidiaries on a consolidated basis. We use the term "FMD" in this annual report to refer to the business of The First Marblehead Corporation on a standalone basis.
We offer outsourcing services to national and regional financial and educational institutions for designing and implementing private education loan programs. These school-certified loan programs are designed to be marketed through educational institutions or to prospective student borrowers and their families directly and to generate portfolios intended to be held by the originating lender or financed in the capital markets. We offer a fully integrated suite of services through our Monogram product, as well as certain services on a stand alone, fee-for-service basis. In addition, we provide administrative and other services to securitization trusts that we facilitated, asset servicing to the third-party owner of certain of those securitization trusts, which we refer to as the NCSLT Trusts, as well as portfolio management services.
Our bank subsidiary, Union Federal Savings Bank, which we refer to as Union Federal, is a federally chartered thrift that offers residential and commercial mortgage loans, and retail savings, money market and time deposit products. As a result of our ownership of Union Federal, we are a savings and loan holding company subject to regulation, supervision and examination by the U.S. Office of Thrift Supervision, or OTS. As of September 2, 2010, we are actively considering our strategic alternatives for Union Federal, including a potential sale.
Substantially all of our financial results have been derived from services relating to private education loans, which are considered to be in a single industry segment for financial reporting purposes. For information about our financial results, see "Selected Financial Data," included in Item 6 of this annual report, and "Management's Discussion and Analysis of Financial Condition and Results of Operations," included in Item 7 of this annual report.
General Developments
During the fiscal years ended June 30, 2009 and June 30, 2010, which we refer to as fiscal 2009 and fiscal 2010, respectively, we implemented changes to our business model in order to address dislocations in the capital markets and the private education lending industry. Since the beginning of fiscal 2009, we have made major changes in senior management, redesigned our service offerings, significantly reduced operating expenses and taken measures to reduce the risk on our balance sheet through the sale of private education loans and the trust certificate, or Trust Certificate, of NC Residuals Owners Trust, which held our residual interests in the NCSLT Trusts. We made substantial progress in improving our financial condition and competitive position during fiscal 2010, and the first loans based on our Monogram product offering were disbursed during the first quarter of the fiscal year ending June 30, 2011, which we refer to as fiscal 2011.
The following events occurred during fiscal 2010 which were significant to our operations:
- •
- During the fourth quarter of fiscal 2010, we entered into loan program agreements with SunTrust Bank and Kinecta Federal Credit Union. Pursuant to the agreements, we will perform a range of services in support of school-certified private education loan programs to be funded by these lenders, including, as applicable, loan origination, portfolio management and other services. We have invested specified amounts of capital as a credit enhancement feature for these loan programs, and we expect to generate ongoing monthly revenue through the maturity of the program loans. This revenue model is consistent with our objective of improving our cash flows and reducing our dependence on the credit and capital markets.
1
- •
- In April 2010, we restructured the education loan warehouse facility of UFSB Private Loan SPV, LLC, or
UFSB-SPV, a subsidiary of Union Federal at that time. The facility previously served as a source of interim financing for private education loan programs that had been funded by Union
Federal. The restructuring involved the substitution of FMD for Union Federal as master servicer under the indenture relating to the facility, the assumption by FMD of certain potential contingent
liabilities of Union Federal under the facility, subject to a cap, and the indirect contribution by FMD of $6.5 million in cash and current private education loans with an outstanding principal
and interest balance of approximately $6.9 million, and a fair value of $3.1 million, to the facility. In exchange, the third-party conduit lender released Union Federal and
UFSB-SPV from certain potential contingent liabilities, permitted the transfer of the membership interests of UFSB-SPV from Union Federal to a non-bank subsidiary
of FMD and made certain concessions with respect to the interest rate and fees applicable to the facility. We believe that the restructuring will be viewed favorably by potential purchasers as we
consider our strategic alternatives with respect to Union Federal.
- •
- In March 2010, the OTS terminated a supervisory agreement with FMD and an order to cease and desist with Union Federal. We
refer to the supervisory agreement with the OTS as the Supervisory Agreement, and the order to cease and desist as the Order. The Supervisory Agreement required FMD, among other things, to maintain a
deposit at Union Federal in the amount of $30.0 million and maintain Union Federal's regulatory capital ratios at specified levels. The Order required Union Federal, among other things, to
reduce by December 31, 2009 the concentration of private education loans to Tier 1 capital (as defined in the regulations) plus allowances for loan losses below 50%.
- •
- During the second quarter of fiscal 2010, Union Federal sold its entire portfolio of private education loans, other than
loans held by UFSB-SPV. In October 2009, Union Federal sold approximately 88% of its portfolio of private education loans held for sale, which excluded loans held by UFSB-SPV,
for gross proceeds of $121.6 million. As a result of the sale, Union Federal achieved the loan concentration reduction imposed by the OTS, and FMD was refunded a deposit in the amount of
$30.0 million that FMD had been required to maintain at Union Federal. In November 2009, Union Federal sold the remainder of its portfolio of private education loans held for sale, excluding
loans held by UFSB-SPV, to a newly formed statutory trust owned by a subsidiary of FMD.
- •
- In October 2009, we received tax refunds of $176.6 million related to operating losses for fiscal 2009 and the sale
of the Trust Certificate in fiscal 2009. In addition to the tax refund generated, the sale of the Trust Certificate is expected to eliminate certain future tax liabilities, which would have had a
material negative effect on our financial condition and liquidity. As a result of the sale, we are no longer entitled to receive residual cash flows from the NCSLT Trusts, although we continue to have
rights to previously recorded additional structural advisory fees and ongoing asset servicing fees from the NCSLT Trusts, as well as previously recorded additional structural advisory fees and
residuals from certain trusts other than the NCSLT Trusts.
- •
- During the first quarter of fiscal 2010, we favorably resolved certain securities litigation, including dismissals of a
consolidated class action lawsuit and state and federal shareholder derivative lawsuits. No compensation in any form passed directly or indirectly from any defendant to any plaintiff or any of
plaintiffs' attorneys in any of these actions. In November 2009, we recouped $1.0 million in legal expenses pursuant to our directors and officers liability insurance policy.
- •
- Although our Monogram product offering has been designed to generate recurring revenue with less dependence on the securitization market, our future financial results and growth may continue to be affected by our inability to structure securitizations or alternative financing
2
transactions involving private education loans. Conditions in the debt capital markets, generally, and the asset-backed securities, or ABS, market, specifically, rapidly deteriorated during the second quarter of fiscal 2008, and we did not complete a securitization transaction during fiscal 2009 or fiscal 2010.
Credit performance of consumer-related loans generally, as well as the private education loans held by us and the various securitization trusts we facilitated, were adversely affected during fiscal 2009 and fiscal 2010 by general economic conditions in the United States, including increased unemployment rates. Our private education loan portfolios and those held by the NCSLT Trusts have experienced higher levels of defaults and lower levels of repayments than we originally projected. As a result, we significantly adjusted our projected performance assumptions associated with the NCSLT Trusts and the portfolio of loans held by UFSB-SPV during fiscal 2009 and fiscal 2010, including significant increases in our assumed default rates, partially offset by lower prepayment rates. The interest rate and economic and credit environments may continue to have a material negative effect on the estimated fair value of our service receivables associated with the various securitization trusts that we facilitated.
Overview
Our business is focused on private education loan programs primarily for undergraduate and graduate students in the United States. Private education loans are funded by private sector lenders and are not guaranteed by the U.S. government. They are intended to be used by borrowers who have first utilized other sources of education funding, including government loan programs, scholarships, grants and other aid. For the 2009-2010 academic year, we believe that there was a "funding gap" in post-secondary education in the United States of approximately $133 billion between the costs of attendance and these other sources of education funding, based on information from the National Center for Education Statistics and the College Board. We believe that enrollment in post-secondary education institutions will continue to increase over the next several years, as will costs of attendance. As a result, we also believe that private education loan products will continue to be necessary for students and their families after applying personal savings and other funding sources, and exhausting all available government loan programs, scholarships, grants and other aid.
Our clients in the past have typically been lenders that desired to supplement their existing federal education loan or other consumer lending programs with a private education loan offering. In response to legislative changes that significantly reduced the profit margins of traditional non-governmental providers of federal loans, as well as legislation that eliminated the Federal Family Education Loan Program, or FFELP, as of July 2010, many lenders have re-evaluated their business strategies related to education lending. We believe that general economic conditions, capital markets disruptions and the declining credit performance of consumer-related loans, including private education loans, have contributed to an overall reluctance by many lenders to focus on their education lending business segments. As a result, we believe that there is significant unmet demand for private education loans and generally less competition in addressing that demand. As market conditions for other consumer finance segments improve, we expect more lenders to focus on education lending and consider private education loans as part of an array of consumer lending products offered to their customers. One of our primary challenges is to convince national and regional lenders that they can address the market opportunity in a manner that meets their desired risk control and return objectives. A related challenge is to finance successfully through the capital markets loans generated through our Monogram product offering.
The lifecycle of a private education loan, which can be over 20 years long, consists of a series of processes, many of which are highly regulated, and involves many distinct parties. As a result, the activities associated with designing, implementing, financing and administering private education loan programs are complex, resource intensive and costly. We offer specialized knowledge, experience and capabilities to assist clients in participating in the private education loan market. Our service offerings
3
are intended to serve a range of potential client needs throughout the life cycle of a private education loan. For example, we can assist clients in developing all aspects of a private education loan program with our Monogram product, or we can provide tailored loan origination, portfolio management and other services to meet specific needs. Our near term financial performance and future growth depend, in large part, on our ability to successfully market our Monogram product and transition to more fee-based revenues while growing our client base.
Prior Business Model
Prior to fiscal 2009, we did not charge separate fees for many of our services, but generally entered into agreements with clients giving us the exclusive right to securitize the private education loans that they did not intend to hold. As a result, we historically recognized substantially all of our income from structuring securitization transactions. Through the securitization process, a series of special purpose statutory trusts obtained private education loans from the originating lenders or their assignees, which relinquished to the trusts their ownership interest in the loans. The debt instruments issued by the trusts to finance the purchase of these private education loans are obligations of the trusts, not obligations of ours or the originating lenders or their assignees. For our past securitization services, we are entitled to receive previously recorded additional structural advisory fees from the trusts over time. We are also entitled to receive administrative and other fees associated with these trusts, as well as asset servicing fees and residuals associated with certain trusts.
Historically, asset-backed securitizations had been our sole source of permanent financing for clients' private education loan programs. Conditions of the debt capital markets generally, and the ABS market specifically, rapidly deteriorated during the second quarter of fiscal 2008, and the ability to finance private education loans through securitization continued to be constrained through fiscal 2009 and, to a lesser extent, fiscal 2010. Our business has been and continues to be materially adversely impacted by these market dynamics, as we did not complete a securitization transaction during fiscal 2009 or fiscal 2010. Further, we expect the structure and pricing terms in near-term financing transactions, if any, to be less favorable than in the past.
Our lender clients previously had the opportunity to mitigate their credit risk through a loan repayment guaranty by The Education Resources Institute, Inc., which we refer to as TERI. TERI guaranteed the private education loans held by the NCSLT Trusts, and we historically received reimbursement from TERI for outsourced loan processing services we performed on TERI's behalf. In April 2008, TERI filed a voluntary petition for relief, which we refer to as the TERI Reorganization, under Chapter 11 of the United States Bankruptcy Code, or the Bankruptcy Code. The TERI Reorganization had a material negative effect on the NCSLT Trusts' ability to realize guaranty obligations of TERI, and our ability to realize fully the cost reimbursement obligations of TERI. In April 2010, the United States Bankruptcy Court for the District of Massachusetts, or the Bankruptcy Court, held a hearing to consider confirmation of the fourth amended and restated plan of reorganization, which we refer to as the Plan of Reorganization, jointly proposed by TERI and its official committee of unsecured creditors, or the Creditors Committee. In July 2010, the Bankruptcy Court denied a motion by TERI and the Creditors Committee to modify the Plan of Reorganization and vacated earlier findings that the Plan of Reorganization met the requirements for confirmation under the Bankruptcy Code. On August 26, 2010, TERI and the Creditors Committee filed a second joint motion to modify the Plan of Reorganization, approve revised disclosure materials and approve procedures by which creditors who previously voted on the Plan of Reorganization would have the opportunity to change their vote with respect to the modified Plan of Reorganization, which we refer to as the Modified Plan of Reorganization. On August 31, 2010, the Bankruptcy Court approved the disclosure materials and solicitation procedures, subject to entry of a formal order, and the solicitation of votes on the Modified Plan of Reorganization is expected to commence on or about September 13,
4
2010. As of September 2, 2010, it is unclear whether or when the Modified Plan of Reorganization will become effective.
As a result of capital market disruptions and the TERI Reorganization, many clients elected to terminate some or all of their agreements with us, which resulted in a significant reduction in our facilitated loan volumes during fiscal 2009 and fiscal 2010 compared to prior fiscal years. We earned $320.4 million in revenues from new securitizations during fiscal 2008, but we did not earn any revenue from new securitizations in fiscal 2009 or fiscal 2010. In addition to the absence of revenue from new securitizations, our financial results for fiscal 2009 and fiscal 2010 were negatively affected by significant write-downs of the estimated fair value of our service receivables and portfolio of private education loans held for sale.
New Business Model
Since the beginning of fiscal 2009, we have significantly refined our service offerings and added fee-for-service offerings, such as portfolio management and asset servicing. During fiscal 2010, we completed the development of our Monogram product offering, which incorporates refinements to our origination process, including an enhanced application interface, an expanded credit decisioning model and additional reporting capabilities. As of September 2, 2010 we had begun originating private education loans under our Monogram loan program agreement with SunTrust Bank, and we expect to begin originating private education loans under our Monogram loan program agreement with Kinecta Federal Credit Union by September 30, 2010.
Our Monogram product integrates all of our service offerings, including program design, marketing support, loan origination and portfolio management. We enable lenders to offer borrowers private education loans with competitive terms and clear pricing alternatives, but which are also structured to offer product options to qualified applicants based on their credit profile. Specifically, the client can customize the range of loan terms offered to their qualified applicants, such as repayment options, repayment terms and borrower pricing.
The product can be structured to offer lenders a "make and hold" or "make and sell" loan program. In "make and hold" loan programs, lenders finance the loans on their balance sheet and generally intend to hold the loans through scheduled repayment, prepayment or default. In "make and sell" loan programs, lenders intend to hold the loans on their balance sheet for some limited period of time before disposing of the loans in a capital markets transaction. We believe that the loans generated through our Monogram product will generally have shorter repayment periods and an increased percentage of borrowers making payments while in school, in each case when compared to loan products we previously facilitated, as well as high cosigner participation rates.
We designed our Monogram product to generate recurring revenue with less dependence on the securitization market and third-party credit enhancements. In connection with our Monogram product, we have invested, and may continue to invest, specified amounts of capital as a credit enhancement feature to various lenders' loan programs. The amount of any contribution offered to a particular lender would be determined by the anticipated size of the lender's program, the underwriting guidelines of the program and the particular terms of our business relationship with the lender. We believe this approach may provide lenders with increased confidence that we are committed to the quality of our new proprietary scoring models and risk mitigation and pricing strategies. In connection with the two initial Monogram-based loan programs, we have provided or will provide an initial deposit toward our credit enhancement commitment and agreed to provide supplementary deposits on a quarterly basis during the terms of our loan program agreements based on the credit mix and volume of disbursed program loans and adjustments to default projections for program loans. To the extent that loan volumes decrease as a result of repayments or default experience is less than our funded amounts, we would be eligible to receive a monthly release of funds beginning in July 2014, in the case of SunTrust
5
Bank, and following expiration of the term of our loan program agreement, in the case of Kinecta Federal Credit Union.
As part of our Monogram product, we will continue to monitor the performance of loan accounts after origination and tailor risk mitigation strategies according to the performance patterns of those accounts. We have built a flexible infrastructure to support our portfolio management strategy, which requires extensive operational and data integration among the loan servicer, multiple default prevention and recovery agencies and us. Finally, we provide extensive customer service to each client, including ongoing analysis and comprehensive reporting of loan performance data.
Description of Services
We offer the following services as part of a fully integrated suite of services through our Monogram product, or as stand-alone tailored outsourcing services for our clients:
Program Design
Lenders face an array of choices in attempting to satisfy their strategic and financial goals, as well as the needs of their borrowers. In designing private education loan programs, the factors that lenders generally consider include:
- •
- borrower creditworthiness criteria, including acceptable origination risk scores, credit bureau ratings and cosigner
requirements, as well as factors such as employment and income history and any past derogatory credit events;
- •
- borrower eligibility criteria, including enrollment status;
- •
- loan limits, including minimum and maximum loan amounts on both an annual and aggregate basis;
- •
- interest rates, including the frequency and method of adjustment;
- •
- amount of fees charged to the borrower, including origination, guaranty and late fees;
- •
- repayment terms, including maximum repayment terms, minimum monthly payment amounts, rate reduction incentive programs and
deferment and forbearance options;
- •
- appropriate loss reserve levels to ensure repayment of defaulted principal and interest payments;
- •
- loan servicing, default management and collection arrangements;
- •
- asset financing or loan disposition alternatives; and
- •
- legal compliance with numerous federal laws and regulations, including but not limited to the Higher Education Opportunity Act, the Truth-in-Lending Act, or TILA, the Fair Credit Reporting Act, the Equal Credit Opportunity Act, the Federal Trade Commission, or FTC, Act, the FTC Telemarketing Sales Rule and numerous state laws that replicate and, in some cases, expand upon the requirements of federal laws.
We help clients design their private education loan programs. Our design approach begins with a standard set of pricing options, legal agreements and third-party relationships that we can then customize for our clients in order to satisfy their particular needs. Although we assist lenders in selecting the underwriting criteria to be used in their loan programs, each lender has ultimate control over, and responsibility for, the selection of their underwriting criteria, and we are obligated to comply with the lender's criteria. While we are not currently separately compensated for our loan program design services, our ability to earn revenue is dependent on service fees we earn through loan origination and subsequent loan portfolio management services that we may provide pursuant to the program design.
6
Marketing Support
In creating their loan marketing programs, institutions face choices in the channels and media available to them to reach potential borrowers, including financial aid offices, online advertising, direct mail campaigns, e-mail campaigns, telemarketing and print, radio and television advertising. Historically, we provided marketing support services to our clients on a cost-reimbursement basis because we benefited from the higher volume of loans processed as a result of these marketing efforts. As part of our Monogram product and future outsourcing arrangements with clients, we expect that marketing support services will be provided for a fee based on loan volume disbursed, depending on the level of services provided to each client. With our focus on school-certified loan programs, we also believe that financial aid offices will be an important distribution channel. In July 2010, we announced that we had expanded our national sales team to provide sales and school relationship management in support of loan programs based on our Monogram product offering.
Loan Origination
Prospective and current students and their families confront a complicated process in applying for financial aid. Because private education loans are often used to bridge the gap between the cost of attending an educational institution and available funds, including family resources and federal and state loans and grants, many borrowers must navigate multiple application processes. In order to respond to questions about these processes from borrowers, lenders and educational institutions must either invest in an appropriate infrastructure or outsource these services. We provide online resources and a staff of customer service personnel who understand the terms of our clients' private education loan programs and the financial aid process as a whole. In addition to a customer service function, we can provide personnel to respond to requests for loan materials and loan applications.
We have developed proprietary processing platforms, applications and infrastructure, supplemented by customized vendor solutions, for use in providing loan processing services. As part of our Monogram product and future outsourcing arrangements with clients, we expect that loan origination services will be provided for a fee based on either loan volume disbursed or applications processed, depending on the particular terms of the client's contract.
Our systems are designed to provide applicants with consumer protection disclosures required by law and regulation, as well as information helpful for making informed decisions about private education loans. For example, our online application has been designed to give qualified applicants some ability to configure loan terms, showing the financial effects of the choices using a real-time repayment calculator. In addition, we continue to support our www.SmartBorrowing.org website, which we established to provide an education-based environment for students and parents to gather information about financing college education. We designed this website based on the principle that students should first consider scholarships, grants and federal and state aid options before seeking private education loans.
In performing our loan origination services, we are required to comply with applicable laws and regulations in loan documentation, disclosure and processing. The lenders with which we work generally assume responsibility for compliance with federal and state laws regarding the forms of loan documentation and disclosure. We are generally responsible for populating such forms in accordance with the program guidelines. We, in turn, work with lenders to prepare lender-specific credit agreement templates. We maintain and utilize these templates, reflecting applicable legal requirements and lender preferences. We are then responsible for maintaining processes and systems that properly execute the lender's origination requirements and administer the credit agreement templates and required disclosures. We may also deliver each lender's privacy policy and prepare and deliver truth-in-lending and various state law disclosures to borrowers.
7
Our proprietary origination risk score model, which is based on borrower and cosigner attributes, as well as distribution channel variables, assigns a specific level of credit risk to the application at the time of initial credit decisioning. Once an applicant submits an application for processing, our customized third-party credit decision software can be configured for each client's specific program parameters, and analyzes, often within minutes, the submitted application. Application data are automatically sent to credit bureaus, which generate and return a credit report. The credit decision software then evaluates the applicant data and the credit report data and assigns a score to the applicant based on our risk score model. The score results in a credit decision and also governs the loan terms offered by the client, aligning product options made available to qualified applicants with their credit risk. This automated underwriting process can deliver a loan application decision, and accompanying credit agreement when applicable, within the same online session. We also enable applicants to submit applications by facsimile or mail. Applications with either incomplete information or information mismatches can be sent automatically to a credit analyst for review. We then communicate the initial determination to the applicant(s), including through e-mail, informing him or her whether the application has passed the credit check, been rejected or is in review. The applicant receives instructions for completing the loan application and funding process and is provided a website navigation link to check his or her loan status. To avoid unauthorized disclosure, access requires use of security protocols established during the application process. Simultaneously, our customer service platforms, including our automated voice response unit, online status and customer service applications are updated.
Once a loan application is submitted and passes the credit check, and the applicant has selected his or her loan options, we generate a credit agreement, a legal contract between the applicant, cosigner, if any, and lender which contains the terms and conditions of the loan, for the applicant based on lender-specific templates. For those lenders and applicants that prefer electronic document delivery, a credit agreement and certain regulatory disclosures are created in the same online session. The credit agreement can be viewed, downloaded and electronically signed or printed by the applicant and faxed or mailed back to us. For those applicants who prefer paper documentation, we print and mail a pre-filled credit agreement to the applicant for him or her to sign and return to us by mail.
Once we have obtained all applicant data, including the signed credit agreement, evidence of enrollment or required certifications from the school or applicant, and any required employment verification, we approve the application and disburse the loan funds on behalf of the lender, with funds made available to us by the lenders. Depending on the loan program and type of disbursement, funds are either sent to the school or to certain central disbursing agents, such as ELM Resources, which then pass the funds along to the school.
We monitor developments in state and federal requirements for loan processing and implement changes to our systems and processes based on our analysis and input we receive from clients and industry groups. For example, we designed and made available to lenders a customer identification program in connection with their past private education loan programs that we will continue to use going forward. This identification program was designed to meet USA PATRIOT Act requirements that lenders gather identifying data, verify applicant identity and maintain records of the process. We also completed similar process improvements in the area of secure access to pending loan information, in order to comply with federal privacy and state identity theft laws. In general, contractual liability for identification of process requirements rests with the lenders and liability for properly executing such requirements rests with us.
Portfolio Management
Once loans are disbursed, holders of the loans may outsource the management of such loans to third-party service providers, such as us. In our role as portfolio manager, we monitor the performance of portfolio vendors, including both loan servicers and collection agencies.
8
We work with approximately 22 portfolio vendors, including six loan servicers, to manage loans on behalf of our clients. The Pennsylvania Higher Education Assistance Agency, or PHEAA, services a majority of the loans we facilitate. Generally, loan servicers establish and maintain contact with borrowers whose loans are current and collection agencies establish and maintain contact with borrowers whose loans are delinquent or defaulted. As of September 2, 2010, no single collection agency services more than 20% of the loan volume that we manage.
The duties of the portfolio vendors that we manage include, for example, preparing repayment invoices, collecting payments from borrowers, maintaining records of borrower payments, responding to questions from borrowers relating to their loans and reporting information to the loan owner. In addition, portfolio vendors may perform skip-tracing services, make collections calls and conduct other collections activities, and report borrower delinquencies or defaults to credit bureaus. If borrower payments are deferred while the borrower is in school, the portfolio vendor typically provides monthly account information and educational materials to the student and any cosigner.
We use a multi-faceted approach to portfolio management. To maximize the return on each portfolio, we collect updated credit bureau data on each borrower and each cosigner each quarter and use it in combination with monthly performance data and experiential data to re-evaluate the risk profile of the portfolio. We assign proprietary collectibility scores that drive our portfolio management strategies by dictating the level of resources we apply to each account, including when the account is outsourced to a collection agency and which agency is used in that process. For example, certain collections agencies may specialize in early-stage delinquencies while others may specialize in the collection of defaulted loans. This process requires a highly integrated infrastructure among the loan servicers, collection agencies and us, in addition to extensive data analysis on each account as it moves through its repayment lifecycle. We believe this approach will allow us to better identify and control losses over time.
For portfolio management services, we charge a fee generally based on aggregate principal balances of loans under management.
Loan Securitization
Although some lenders originate loans and then hold them for the life of the loan, other lenders originate and then seek to dispose of the loans, either through a sale of whole loans or by means of a securitization. Whole loans can be purchased by other financial institutions, which may add them to an existing portfolio, or by entities that serve to warehouse the loans for some period of time, pending eventual securitization.
In the past, we served as an intermediary between our clients and the capital markets. We formed special purpose statutory trusts, which issued notes and used the resulting proceeds to purchase private education loans from the originating lenders. The loans were used as security for repayment of the notes. Our compensation for these services was in the form of structural advisory fees, as well as a residual interest in the securitization trusts.
Over the last three years, the conditions of the debt capital markets generally, and the ABS market specifically, have resulted in a reduction in the new issuance volume of education loan ABS. According to industry sources, new issuances in the market totaled approximately $19.7 billion for the fiscal year ended June 30, 2010. Of that total, approximately $11.5 billion were backed by federally guaranteed education loans and $8.3 billion were backed by private education loans, none of which we facilitated. The new issuance volume of both federally guaranteed and private education loan ABS totaled approximately $19.1 billion in calendar 2009 and $28.1 billion in calendar 2008.
9
Securitizations historically provided several benefits to lenders and developed into a diverse, flexible funding mechanism for the financing of private education loan pools. Securitization enabled lender clients to sell potentially otherwise illiquid assets in both the public and private securities markets, and to limit credit and interest rate risk, and enabled the reallocation or transfer of risk through the use of derivative products such as interest rate swaps or caps, a senior-subordinated liability securities structure, financial guaranty insurance for the securities issued, loan guarantees from third-party debt guarantors, the tiering of maturities of securities issued and the issuance of several different types of bonds matching projected pool repayment characteristics. Although this flexibility added to the complexity of the funding process, it also enabled the originating lender to reduce the cost of financing and recycle capital, thereby improving the economics of the loan program and improving loan terms by passing incremental savings back to the borrower. The availability of many of these structural elements for originating lenders may decline or cease to exist in the future due to economic or regulatory factors.
Securitizations require a high level of specialized knowledge and experience regarding both the capital markets generally, and the repayment characteristics and defaults on the part of borrowers specifically. The process of issuing ABS requires compliance with state and federal securities laws, as well as coordination among originating lenders, servicers, securities rating agencies, attorneys, securities dealers, loan guarantors, structural advisors, trust management providers and auditors.
To date, we have structured and facilitated 38 securitizations consisting entirely of private education loans involving debt issuances in the aggregate original principal amount of $17.5 billion. We have securitized loan pools using various financing structures, including both public offerings registered with the Securities and Exchange Commission, or SEC, and private placements, and have utilized various ABS, including borrowings from commercial paper conduits, London Interbank Offered Rate, or LIBOR, floating rate notes, auction-rate debt and senior-subordinated and third-party credit enhanced debt.
We believe that our capital markets experience gives us special insight into funding options available to our clients. In addition, the extensive database provided by our private education loan repayment statistics dating back to 1986 has helped us in the past to optimize the financing of the private education loan pools our clients generated. We have used this data to estimate the default, recovery and prepayment characteristics of the different types of loans that constitute a loan pool. We believe that our experience and historical data will assist us in future discussions with rating agencies, insurance providers, underwriters and securities investors relating to financing structures and terms.
While the recent demand for securitizations backed by private education loans has been limited, we plan to participate in future securitizations or other capital markets transactions, subject to market acceptance. If we are able to facilitate such transactions in the near-term, we expect the structure and economics of the transactions to be substantially different than our past transactions, including lower revenues and additional cash requirements on our part.
Asset Servicing
Effective March 31, 2009, we entered into an asset services agreement with the purchaser of the Trust Certificate, pursuant to which we provide certain services to support the purchaser's ownership of the residual interests in the NCSLT Trusts, including, among others, analysis and valuation optimization services and services relating to funding strategy. In this annual report, we refer to this agreement as the Asset Services Agreement. We are entitled to certain asset servicing fees for these contractual services, although receipt of the fees is contingent upon distributions available to the owners of the residual interests of such trusts.
10
Trust Administration
As administrator of the trusts we facilitated, we perform various administrative functions, including monitoring the performance of loan servicers and third-party collection agencies. In this capacity, we confirm compliance with servicing guidelines and review default prevention and collection activities. We receive administrative fees from the trusts, ranging from 0.05% to 0.20% per year of the principal loan balance in the trust, for daily management and for the services we provide in obtaining information from the loan servicer and reporting this and other information to the parties related to the securitization.
Competition
Although a number of competitors and potential competitors exited the private education loan industry as a result of market developments since fiscal 2008, the industry remains competitive with a number of active participants. Based on the range of services we offer, we believe that our principal competitor is SLM Corporation, also known as Sallie Mae. Our business could be adversely affected if Sallie Mae's program to market private education loans continues to grow, or if Sallie Mae or Nelnet, Inc., which currently provides fee-based origination and servicing activities for non-federally guaranteed loans, seeks to market more aggressively to third parties the full range of services or products that we offer.
Other private education loan originators include JPMorgan Chase Bank, N.A., Wells Fargo & Company, Discover Financial Services and Student Loan Corporation, an 80% owned subsidiary of Citibank, N.A.
To the extent that loan originators develop an internal capability to provide any of the services that we currently offer, demand for our services would decline. For example, a loan originator that has, or decides to develop, a portfolio management or capital markets function may not engage us for our services. Historically, lenders in the education loan market have focused their lending activities on federal loans because of the relative size of the federal loan market and because the federal government guarantees repayment of those loans. As a result of the College Cost Reduction and Access Act of 2007, which significantly reduced the profit margins of traditional non-governmental providers of federal loans, and elimination of the FFELP as of July 2010, lenders may place additional emphasis on the private education loan market or develop an internal capability to conduct the services we provide, which could result in a decline in demand for our service offerings. We believe the most significant competitive factors in terms of developing private education loan products are technical and legal competence, including in connection with the process of originating private education loans, cost, data relating to the performance of private education loans, risk analytics capabilities, capital markets experience, reliability, quality and speed of service. We differentiate ourselves from other service providers by the range of services we can provide our clients.
Several of our current and potential competitors have longer operating histories and significantly greater financial, marketing, technical or other competitive resources, as well as greater name recognition than we do. As a result, our competitors or potential competitors may be able to adapt more quickly to new or emerging technologies and changes in customer requirements or may be able to devote greater resources to the promotion and sale of their services. In addition, competitors may be able to adopt more aggressive pricing policies in order to attract potential clients. We cannot assure you that we will be able to compete successfully with new or existing competitors. To remain competitive, we need to continue to invest in information technology, sales and marketing, as well as legal, compliance and product development resources.
11
Proprietary Systems and Processes
In addition to our database that tracks historical private education loan performance, we maintain advanced proprietary information processing systems. We use these information systems to analyze loan applications efficiently, expedite loan processing and enhance our other services.
Key benefits of our information processing systems include:
- •
- the ability to analyze and assess loan applications based on a variety of underwriting and product factors, including
flexibility to adapt to different product parameters required in customized client implementations;
- •
- a transaction/application processing system that includes automated updating of an applicant's loan status that a borrower
can access online or by telephone;
- •
- automated preparation and secure electronic delivery of loan documents, including credit agreements and certain legal
disclosures;
- •
- online certification tools enabling financial aid offices to speed loan disbursement by quickly confirming student
applicants' enrollment status and financial need;
- •
- reporting tools enabling clients to track and sort information about student applicants and borrowers, including
application status and disbursement dates;
- •
- custom built data transmission techniques designed to ensure that data are compiled, integrated and properly migrated both
across our enterprise and to external third parties such as servicers, collection and placement agencies and other third-party vendors; and
- •
- interfaces with internal accounting systems intended to ensure proper booking and tracking of loan information for our clients, as well as support for our capital markets group in its financing activities.
We use a number of leading commercial products to secure, protect, manage and back-up data.
Intellectual Property
We own the following federally registered trademarks: FIRSTMARBLEHEAD, ASTRIVE, MONTICELLO STUDENT LOANS, prepGATE, GATE, GATE Guaranteed Access to Education, and National Collegiate Trust. The federal registrations for these registered trademarks expire at various times between 2015 and 2019, but the registrations may be renewed for additional 10-year terms provided that we continue to use the trademarks. We have filed with the U.S. Patent and Trademark Office federal trademark applications with respect to existing or planned uses of the marks LAUREL COLLEGIATE LOANS and MONOGRAM. We filed a patent application in June 2007 relating to a method and system for administering linked loans between two parties.
Education Loan Market Seasonality
Origination of education loans is generally subject to seasonal trends, with the volume of loan applications increasing with the approach of tuition payment dates. Historically, we have processed the greatest application volume during the summer months, as students seek to borrow money in order to pay tuition costs for the fall semester or the entire school year. We have also tended to process an increased volume of loan applications during November, December and January, as students and their families seek to borrow money to pay tuition costs for the spring semester. Historically, this seasonality of loan originations has impacted the timing and size of securitization transactions, the amount of processing fees that we earned in a particular quarter and the level of expenses incurred to market and process the higher origination activity.
12
Union Federal Savings Bank
In November 2006, we acquired Union Federal, a community savings bank located in North Providence, Rhode Island. Union Federal is a federally chartered thrift that offers residential and commercial mortgage loans, and retail savings, money market and time deposit products. Union Federal has also funded a portion of our loan product offerings in the past, although it is not doing so as of September 2, 2010. Union Federal held approximately $8.2 million of mortgage loans as of June 30, 2010. We derived approximately $3.9 million of net interest income during fiscal 2010 from Union Federal, primarily from the private education loan portfolio held by it during the first and second quarters of fiscal 2010. As a result of disruptions in the ABS market and the TERI Reorganization, we were unable to facilitate the securitization of private education loans originated by Union Federal since September 2007 through the date of our final disposition of such loans as described below.
In October 2009, following receipt of approval from the OTS, Union Federal completed a sale of all private education loans that it directly held and that were less than 31 days delinquent. These loans had an aggregate outstanding principal and accrued interest balance of approximately $233.8 million and represented approximately 88% of the private education loans directly held by Union Federal. The sale resulted in gross proceeds of $121.6 million to Union Federal. Following the sale, the purchaser bears the risk of future performance of the loans, including risk of future default, except as otherwise set forth in the loan purchase and sale agreement. This sale did not include loans held by UFSB-SPV, a subsidiary of Union Federal at the time of sale. In November 2009, following receipt of approval from the OTS, Union Federal sold the remainder of its portfolio of private education loans held for sale, excluding loans held by UFSB-SPV, to a newly formed statutory trust owned by a subsidiary of FMD. We retained an independent third party to assess the fair value of the portfolio, which served as the basis for the sale price for the transaction. Union Federal received proceeds of $3.9 million from the sale. In April 2010, FMD transferred loans with a fair value of $3.1 million from this new subsidiary to UFSB-SPV, and FMD indirectly contributed cash of $6.5 million to UFSB-SPV in conjunction with the restructuring of the debt of UFSB-SPV under its education loan warehouse facility. As part of that transaction, we transferred ownership of UFSB-SPV from Union Federal to a non-bank subsidiary of FMD. See Note 10, "Liabilities and Unused Lines of Credit—Education Loan Warehouse Facility," in the notes to our consolidated financial statements included in Item 8 of this annual report for additional details.
In July 2009, FMD entered into the Supervisory Agreement with the OTS, and Union Federal consented to the Order. The OTS terminated the Supervisory Agreement and the Order, each in its entirety, in March 2010. In connection with the termination of the Supervisory Agreement, our Board of Directors adopted resolutions requiring FMD to support the implementation by Union Federal of its business plan, so long as Union Federal is owned or controlled by FMD, and to notify the OTS in advance of any distributions to our stockholders in excess of $1.0 million per fiscal quarter and any incurrence or guarantee of debt in excess of $5.0 million. Following termination of the Supervisory Agreement and the Order, FMD remains subject to extensive regulation, supervision and examination by the OTS as a savings and loan holding company, and Union Federal remains subject to extensive regulation, supervision and examination by the OTS and the Federal Deposit Insurance Corporation, or FDIC. See Note 21, "Union Federal Regulatory Matters—Supervisory Agreement and Order to Cease and Desist," in the notes to our consolidated financial statements included in Item 8 of this annual report, and "Risk Factors—Risks Relating to Regulatory Matters," included in Item 1A of this annual report for additional details.
13
Government Regulation
We provide services in connection with the creation, management and disposition of private education loans, a form of consumer loan asset. This business is highly regulated at both the state and federal level, through statutes and regulations that focus upon:
- •
- licensure and examination of industry participants;
- •
- regulation and disclosure of consumer loan terms;
- •
- regulation of loan origination processing; and
- •
- licensure and general regulation of loan collection and servicing.
Failure to conform to any of these statutes or regulations may result in civil and/or criminal fines, and may affect the enforceability of the underlying consumer loan assets.
Many states have statutes and regulations that require the licensure of small loan lenders, loan brokers, credit services organizations and loan arrangers. Some of these statutes are drafted or interpreted to cover a broad scope of activities. As of September 2, 2010, our subsidiary First Marblehead Education Resources, Inc., or FMER, has been approved for licenses in Massachusetts, New Jersey, Pennsylvania and Texas. Although we believe that our prior consultations with regulatory counsel and, in some cases state regulators, have identified all material licensing, registration and other regulatory requirements that could be applicable to us based on current laws and the manner in which we currently conduct business, we may be subject to additional state licensing, registration and other regulatory requirements in the future. In particular, certain state licenses or registrations may be required if we divest Union Federal, if we change our operations, if regulators reconsider their prior guidance or if federal or state laws or regulations are changed. Even if we are not physically present in a state, its regulators may take the position that registration or licensing is required because we provide services to borrowers located in the state by mail, telephone, the Internet or other remote means.
Absent a change in federal law, either by judicial interpretation or legislation, including as discussed below, to the extent that our services are conducted through Union Federal, we believe it is less likely that state regulatory requirements affecting loan brokers, small lenders, credit services organizations or loan arrangers will be asserted. However, we are examining strategic alternatives for Union Federal, including a potential sale, and the Dodd-Frank Wall Street Reform and Consumer Protection Act, signed into law on July 21, 2010, which we refer to as the Dodd-Frank Act, weakens federal pre-emption of state regulations currently enjoyed by federal savings associations and their operating subsidiaries, such as Union Federal and its operating subsidiary, FM Loan Origination Services, LLC, or FMLOS. Specifically, the Dodd-Frank Act eliminates for operating subsidiaries of federal banks the pre-emption of state licensing requirements and consumer protection laws.
The Dodd-Frank Act also restructures the regulation of depository institutions. Under the Dodd-Frank Act, the OTS, which is currently the primary federal regulator for FMD and Union Federal, will cease to exist on July 21, 2011 unless the Secretary of the Treasury opts to delay such date for up to an additional six months. The Office of the Comptroller of the Currency, or OCC, which is currently the primary federal regulator for national banks, will become the primary federal regulator for federal thrifts, including Union Federal. The Board of Governors of the Federal Reserve System, or Federal Reserve, will supervise and regulate all savings and loan holding companies that were formerly regulated by the OTS, including FMD. Although the OCC and Federal Reserve are directed to implement existing OTS regulations, orders, resolutions, determinations and agreements for thrifts and their holding companies under the Home Owners' Loan Act, or HOLA, the transition of supervisory functions from the OTS to the OCC (with respect to Union Federal) and the Federal Reserve (with respect to FMD) could alter the supervisory approach for Union Federal and FMD. This could in turn affect the operations of FMD and Union Federal. The Dodd-Frank Act also will impose consolidated capital requirements on savings and loan holding companies, but they are not effective for five years.
14
The Dodd-Frank Act establishes the Bureau of Consumer Financial Protection, or BCFP, as an independent agency within the Federal Reserve to regulate consumer financial products, including education loans, and services offered primarily for personal, family or household purposes, with rule-making and enforcement authority over unfair, deceptive or abusive practices. These laws may directly impact our business operations, whether or not Union Federal is sold. The potential reach of the BCFP's broad new rulemaking powers and enforcement authority on the operations of financial institutions offering consumer financial products or services, including FMD, is currently unknown. In addition, the Dodd-Frank Act establishes a private education loan ombudsman within the BCFP, which would, among other things, receive, review and attempt to resolve informally complaints from private education loan borrowers. Finally, the Dodd-Frank Act requires the BCFP and the Secretary of Education, in consultation with FTC commissioners and the Attorney General, to submit a report, within two years of enactment of the Dodd-Frank Act, on a variety of information relating to the private education lending market, including private education loan lenders.
The Dodd-Frank Act also includes several provisions that could affect our future portfolio funding transactions, if any, including "skin in the game" risk retention requirements applicable to any entity that organizes and initiates an ABS transaction, new disclosure and reporting requirements for each tranche of ABS, including new loan-level data requirements, and new disclosure requirements relating to the representations, warranties and enforcement mechanisms available to ABS investors.
The Dodd-Frank Act requires various federal agencies to adopt a broad range of new implementing rules and regulations, and the federal agencies are given significant discretion in drafting the implementing rules and regulations. Consequently, many of the details and much of the impact of the Dodd-Frank Act may not be known for many months or years.
We will continue to review state registration and licensing requirements, and we intend to pursue registration or licensing in applicable jurisdictions where we are not currently registered or licensed if we elect to operate through an entity that does not enjoy federal pre-emption. We cannot assure you that we will be successful in obtaining additional state licenses or registrations in a timely manner, or at all. If we determine that additional state registrations or licenses are necessary, we may be required to delay or restructure our activities in a manner that will not subject us to such licensing or registration requirements.
Compliance with state licensing requirements could involve additional costs or delays, which could have a material adverse effect on our business. Our failure to comply with these laws could lead to, among other things:
- •
- curtailment of our ability to continue to conduct business in the relevant jurisdiction, pending a return to compliance or
processing of registration or a license application;
- •
- administrative enforcement actions;
- •
- class action lawsuits; and
- •
- criminal as well as civil liability.
Any of the foregoing could have a material adverse effect on our business.
The consumer assets with which we deal are subject to the full panoply of state and federal regulation, and a defect in such assets could affect our business. Similarly, the growing complexity of regulation of loan origination and collection may affect the cost and efficiency of our operations. We have sought to minimize the risk created by consumer loan regulation in a number of ways. The securitizations that we facilitated have involved sales by financial institutions regulated by the FDIC and other parties which represented and warranted that the assets in question were originated in compliance with all applicable law and were valid, binding and enforceable in accordance with their terms. Similarly, the securitization trusts have benefited from an assignment of representations and
15
warranties made by the lender and by the applicable loan servicer regarding compliance with law in the origination and servicing of loan assets. TERI may nonetheless have recourse to us to the extent that a regulatory failure in loan origination of a TERI-guaranteed loan by us breached the standards of care under the master servicing agreement formerly in effect between TERI and us.
In August 2009, the Federal Reserve Board issued regulations to implement provisions of the Higher Education Opportunity Act, which was signed into law in August 2008. The regulations revised the number, timing, and content of disclosures required for private education loans by TILA and the Federal Reserve Board's implementing regulation for TILA, Regulation Z. Under the regulations, private education loan creditors are now required to provide disclosures about loan terms and features on or with the loan application and are also required to disclose information about federal education loan programs that may offer less costly alternatives to private education loans. Additional disclosures must be provided when the loan is approved and after loan acceptance but prior to loan disbursement. Compliance with the new regulations became mandatory in February 2010. In addition, in December 2009, the Federal Reserve Board and the FTC announced final rules to implement the risk-based pricing provisions of the Fair and Accurate Credit Transactions Act of 2003. The final rules will generally require that lenders provide disclosures to certain consumers if credit is offered to them on less favorable terms than those offered by the lender to other consumers. Compliance with the disclosure requirements is mandatory as of January 1, 2011.
In delivering services, our operations must conform to consumer loan regulation that applies to lenders. This regulation includes, but is not limited to, compliance with TILA, the Higher Education Opportunity Act, the Fair Credit Reporting Act, the USA PATRIOT Act, the Equal Credit Opportunity Act, the Gramm Leach Bliley Act, the FTC Act, the Fair Debt Collection Practices Act and numerous state laws that replicate and expand upon the requirements of federal law. In addition, there is increasing regulation of the type of electronic loan application processing that we conduct, as well as regulation of access to and use of consumer information databases. A growing number of states are imposing disparate and costly requirements on our operations, including protections against identity theft, privacy protection and data security protection. The Fair and Accurate Credit Transactions Act of 2003 imposed significant federal law requirements on loan application processors, including requirements with respect to resolving address inconsistencies, responding to "red flags" of potential identity theft and processing identity theft notices, notices of adverse credit decisions based on credit scoring and other requirements that required both changes to automated loan processing and the creation of manual exception systems. These requirements strained, and future legislation or regulation may also strain, our systems. Failure to comply with these requirements will interfere with our ability to develop and market our new business model for processing services.
Employees
We had 219 full-time employees at June 30, 2010, compared to 223 full-time employees as of June 30, 2009.
We are not subject to any collective bargaining agreements, and we believe our relationships with our employees are good.
Our Corporate Information
We were formed as a limited partnership in 1991 and were incorporated in Delaware in August 1994. Our principal executive offices are located at The Prudential Tower, 800 Boylston Street, 34th Floor, Boston, Massachusetts 02199. The telephone number of our principal executive offices is (800) 895-4283.
16
Available Information
Our Internet address is www.firstmarblehead.com. The contents of our website are not part of this annual report on Form 10-K, and our Internet address is included in this document as an inactive textual reference only. We make our annual reports on Form 10-K, quarterly reports on Form 10-Q, current reports on Form 8-K and all amendments to those reports available free of charge on our website as soon as reasonably practicable after we file such reports with, or furnish such reports to, the SEC. Alternatively, reports filed with or furnished to the SEC are available from the SEC on its website, www.sec.gov, by request from the Public Reference Room at 100 F Street, NE, Washington, D.C. 20549, or by phone at (800) SEC-0330.
Executive Officers of the Registrant
The following table sets forth information regarding our executive officers as of September 2, 2010, including their ages as of such date.
Name
|
Age | Position | |||
|---|---|---|---|---|---|
| Daniel Meyers | 47 | Chief Executive Officer, President and Chairman of the Board of Directors | |||
| Kenneth Klipper | 51 | Managing Director, Chief Financial Officer, Treasurer and Chief Accounting Officer | |||
| William P. Baumer | 49 | Managing Director and Chief Risk Officer | |||
| Seth Gelber | 31 | Managing Director and Chief Administrative Officer | |||
| Michael Plunkett | 53 | Managing Director, Loan Operations and Information Technology | |||
| Gary F. Santo, Jr. | 43 | Managing Director and Head of Capital Markets | |||
| Gregory M. Woods | 36 | Managing Director, General Counsel and Secretary | |||
Set forth below is certain information regarding the business experience of each of the above-named persons.
Daniel Meyers has served as our Chief Executive Officer and President and as a Director since September 2008, and as Chairman of the Board of Directors since May 2010. Mr. Meyers also served as our Chief Executive Officer and Chairman of the Board of Directors from our incorporation in 1994 to September 2005 and as our President from November 2004 to September 2005. From 1980 to 1991, Mr. Meyers was involved in arbitrage and derivatives trading at EF Hutton, Prudential Bache Securities, LF Rothschild Unterberg Towbin and Commodities Corporation, each of which were financial services firms. He began working on ABS financings in 1986. He currently serves as the Chair of the Board of the Curry School of Education Foundation at the University of Virginia and as the Chairman of the Board of Caritas Physician Network, a unit of Caritas Christi Health Care, a New England-based healthcare system. He is also currently a member of the International Institute for Strategic Studies and serves on the Board of the Forum for the Future of Higher Education. Mr. Meyers received an A.B. from Brandeis University and completed the Owner President Management Program at the Harvard Graduate School of Business Administration.
Kenneth Klipper has served as our Chief Financial Officer and a Managing Director since September 2008 and as our Treasurer and Chief Accounting Officer since November 2006. Mr. Klipper served as our Senior Vice President, Finance from March 2005 to September 2008. From January 2003 to April 2003, Mr. Klipper served as the Chief Financial Officer of Brown Co., an online brokerage firm owned by JPMorgan at the time, and as the Chief Executive Officer from April 2003 to March 2005. From May 2002 to January 2003, Mr. Klipper served as the Chief Financial Officer and Chief Operating Officer of Park Street Capital, a private equity firm. From January 2000 to April 2002, Mr. Klipper served as the Chief Financial Officer of Tucker Anthony Sutro, Inc., a publicly traded securities brokerage firm. Prior to joining Tucker Anthony, Mr. Klipper served for five years as both the Chief Financial Officer and Controller for the securities brokerage unit of Fidelity Investments, and
17
he held positions with KPMG LLP, a registered public accounting firm, for 11 years. Mr. Klipper received a B.S. from the University of Richmond and is a Certified Public Accountant.
William P. Baumer has served as our Chief Risk Officer since September 2007, as a Managing Director since September 2008 and as the Chief Executive Officer of Union Federal since July 2010. Mr. Baumer served as Senior Vice President, Compliance from July 2004 to September 2007. From 2003 to June 2004, Mr. Baumer served as the Compliance Manager for the nationwide mortgage operations at Bank of America, N.A. From 2000 to 2003, Mr. Baumer was the Compliance Director-Core Banking for Fleet Boston Financial Corporation, a bank which was acquired by Bank of America, and was responsible for regulatory compliance programs in Fleet's consumer, commercial and administrative staff units. He joined Fleet in 1984 and held various leadership positions in the Compliance, Audit, Credit and Retail Banking business units. Mr. Baumer received a B.S. from Franklin Pierce College and has earned Certified Regulatory Compliance Manager, Certified Internal Auditor and Certified Anti-Money Laundering Specialist certifications.
Seth Gelber has served as our Chief Administrative Officer since March 2010 and a Managing Director since September 2008. He served as Senior Vice President, Corporate Development from August 2008 to September 2008. From October 2006 to August 2008, Mr. Gelber served as President of Sextant Holdings, LLC, a private investment firm, the sole member of which is Mr. Meyers. From 2001 to 2006, Mr. Gelber held various positions at First Marblehead in the Capital Markets and Product Strategy groups. From 1997 to 2001, Mr. Gelber served as a Legislative Assistant to Congressman Jack Quinn (NY), primarily focused on education, telecommunication and banking legislation. Mr. Gelber received a B.A. from The George Washington University.
Michael Plunkett has served as our Managing Director, Loan Operations and Information Technology since September 2008. From May 2003 to September 2008, Mr. Plunkett held various positions in our Operations, Information Technology and Program Management groups, serving most recently as a Senior Vice President. Prior to joining First Marblehead, Mr. Plunkett served over 24 years in the U.S. Navy and retired with the rank of Captain in July 2003. While in the Navy, Mr. Plunkett served in a variety of ashore and afloat positions, including serving as the primary assistant to the Deputy Chief of Naval Operations, Fleet Readiness and Logistics. Mr. Plunkett received a B.S. from Saint John Fisher College, an M.S. from the Naval Postgraduate School and an M.A. from the Naval War College.
Gary F. Santo, Jr. has served as our Head of Capital Markets since July 2010 and as a Managing Director since September 2008. From September 2008 to July 2010, Mr. Santo served as Co-Head of Capital Markets. From July 2007 to September 2008, Mr. Santo served as a Managing Director in the Structured Finance Group at Fitch, Inc., a global ratings agency. While at Fitch, Mr. Santo managed the Consumer ABS Group, which was responsible for the credit rating analysis of privately and publicly placed asset-backed securities, including those backed by student loans, credit card receivables and tobacco settlements. From January 1996 to June 2007, Mr. Santo held various positions at First Marblehead in the Capital Markets and Investors Relations groups. Mr. Santo served as a Financial Aid Officer at Mount Ida College from January 1993 to January 1996, and at Boston University from September 1991 to January 1993. Mr. Santo received a B.A. from Boston University.
Gregory M. Woods has served as a Managing Director since September 2008, as our General Counsel since August 2008 and as our Secretary since November 2006. From April 2006 to August 2008, Mr. Woods served as Senior Vice President, Corporate Law. From June 2004 to April 2006, Mr. Woods was a Junior Partner at Wilmer Cutler Pickering Hale and Dorr LLP, a law firm, and from October 1999 to May 2004, Mr. Woods was an associate at WilmerHale. While at WilmerHale, Mr. Woods practiced general corporate and securities law, with an emphasis on public equity offerings, SEC compliance and corporate governance matters. Mr. Woods received an A.B. from Brown University and a J.D. from Georgetown University.
18
Code of Ethics
We have adopted a code of conduct that applies to our employees and officers, including our principal executive officer, principal financial officer, principal accounting officer or persons serving similar functions. We have also adopted a statement of business ethics that applies to our directors. We will provide a copy of our code of conduct and statement of business ethics for our directors to any person without charge, upon written request to: Corporate Secretary, The First Marblehead Corporation, The Prudential Tower, 800 Boylston Street, 34th Floor, Boston, Massachusetts 02199. Our code of conduct and statement of business ethics for our directors, as well as our corporate governance guidelines and the charters of the standing committees of our Board of Directors, are posted on our website at www.firstmarblehead.com under the heading "Investors—Governance," and each of these documents is available in print to any stockholder who submits a written request to our corporate secretary. If we amend our code of conduct in the future or grant a waiver under our code of conduct to an officer or anyone functioning as our principal accounting officer, we intend to post information about such amendment or waiver on our website.
Investing in our common stock involves a high degree of risk. You should carefully consider the risks and uncertainties described below in addition to the other information included in this annual report. If any of the following risks actually occurs, our business, financial condition or results of operations could be adversely affected, which, in turn, could have a negative impact on the price of our common stock. Although we have grouped risk factors by category, the categories are not mutually exclusive. Risks described under one category may also apply to another category, and you should carefully read the entire risk factors section, not just any one category of risk factors.
Risks Related to Our Industry, Business and Operations
Challenges exist in implementing revisions to our business model.
During fiscal 2009 and fiscal 2010, we took several measures to adjust our business in response to economic conditions. Most significantly, we refined our service offerings and added fee-for-service offerings such as portfolio management and asset servicing. In August 2009, we completed the development of our Monogram product offering, which incorporates refinements to our origination process, including an enhanced application interface, an expanded credit decisioning model and additional reporting capabilities.
We have limited experience with our Monogram product, which is based on a new, proprietary origination risk score model and does not contemplate a third-party guaranty. We are uncertain of the extent to which the market will accept our Monogram product, particularly in the current economic environment where there has been reluctance by many lenders to focus on education lending opportunities. As of September 2, 2010, we have signed only two loan program agreements and expect to have fully deployed the product to only two clients by September 30, 2010. Successful sales of our services, including our Monogram product, will be critical to growing and diversifying our revenues and client base in the future.
Our Monogram product may include capital commitments on our part for credit enhancement. We have provided or agreed to provide capital commitments in connection with our two initial Monogram-based loan programs. Should additional lenders require credit enhancement from us as a condition to entering into a loan program agreement, our growth may be constrained by the level of capital available to us.
Commercial banks have historically served as the initial funding sources for loans we facilitate and have been our principal clients. Since the first quarter of fiscal 2008, we have not facilitated take-out securitization transactions to support the long-term funding of private education loans, and commercial
19
banks are facing liquidity and credit challenges from other sources, in particular mortgage, auto loan and credit card lending losses. In addition, the synergies that previously existed between federal education loan marketing and private education loan marketing have been eliminated by legislation that eliminated FFELP. As a result, many lenders have re-evaluated their business strategies related to education lending. In light of general economic conditions, capital markets disruptions and the declining credit performance of consumer-related loans, the private education loan business may generally be less attractive to commercial banks than in the past.
In this environment, it is uncertain whether commercial banks will continue funding private education loans. Some of our former clients have exited the private education loan market completely. To the extent that commercial banks exit the private education loan market, the number of our prospective clients diminishes. One of our primary challenges is to convince national and regional lenders that they can address the market opportunity in a manner that meets their desired risk control and return objectives. A related challenge is to finance successfully loans generated through our Monogram product through capital market transactions. We cannot assure you that we will be successful in either the short-term or the long-term in meeting these challenges.
We have provided or agreed to provide credit enhancement in connection with two loan programs and plan to enter into similar arrangements in connection with future loan programs based on our Monogram product. As a result, we have capital at risk in connection with each lender's loan program. We may lose the capital we have provided as credit enhancement, and our financial results could be adversely affected.
Historically, the loan programs that we facilitated included a third-party guaranty, pursuant to which the guarantor agreed to reimburse lenders for unpaid principal and interest on defaulted loans. Our Monogram product does not include a third-party guaranty. In connection with two loan programs based on our Monogram product, we have provided or agreed to provide credit enhancement by funding an account for each lender, which we refer to as a Participation Account, up to a specified dollar limit, which we refer to as the Participation Cap, to serve as a first-loss reserve for defaulted program loans. We provided or agreed to provide an initial deposit into the Participation Accounts and agreed to provide supplementary deposits into such accounts on a quarterly basis during the term of the loan program agreements based on disbursed program loan volume and adjustments to default projections for program loans. Although we will not be required to provide any credit enhancement in excess of the Participation Cap, we have or will have capital at risk in connection with lenders' loan programs and the amount of such capital at risk will increase quarterly. As of September 2, 2010, we have funded capital commitments in the amount of $7.4 million in support of SunTrust Bank's Monogram-based program. We could lose some or all of the amounts that we have deposited, or will deposit in the future, in the Participation Accounts depending on the performance of the portfolio of program loans. Any such loss would erode our liquidity position and damage business prospects for our Monogram product.
Our Monogram product is based on proprietary scoring models and risk mitigation and pricing strategies that we have only recently developed. We have no experience with the actual performance of loan portfolios generated by lenders based on our Monogram product. We must closely monitor the characteristics and performance of each lender's loan portfolio in order to suggest adjustments to the lenders' programs and tailor our default prevention and recovery strategies. We have limited experience with the infrastructure that we have built for such monitoring, which requires extensive operational and data integration among the loan servicer, multiple default prevention and recovery agencies, and us. To the extent that our infrastructure is inadequate or we are otherwise unsuccessful in identifying portfolio performance characteristics and trends, or to the extent that lenders are unwilling to adjust their loan programs, our risk of losing amounts deposited in the Participation Accounts may increase.
We may offer additional prospective clients similar credit enhancement arrangements. We expect that the amount of any such credit enhancement offered to a particular lender would be determined
20
based on the particular terms of the lender's loan program, including the underwriting guidelines with respect to such program. We have finite amounts of cash available to offer to prospective clients, and there is a risk that lenders will not enter into loan program agreements with us unless we offer credit enhancement.
We will need to facilitate substantial loan volume in order to return to profitability.
We designed our Monogram product, in part, to reduce our dependence on the securitization market in order to generate revenue. Although we expect to generate ongoing monthly revenue through the maturity of the program loans, we will need to facilitate substantial loan volumes in order to return to profitability. In addition, because the revenues that we expect to generate for Monogram-based loan programs will depend in part on the size, credit mix and actual performance of our lender clients' loan portfolios, it is difficult for us to forecast the level or timing of our revenues or income with respect to our Monogram product generally or a specific lender's Monogram-based program.
The outsourcing services market for education lending is competitive, and if we are not able to compete effectively, our revenue and results of operations may be adversely affected.
We offer our clients and prospective clients, national and regional financial institutions and educational institutions, services in structuring and supporting their private education loan programs. The outsourcing services market in which we operate remains competitive with a number of active participants, some of which have greater financial, technical or other competitive resources, larger customer bases, greater name recognition and more established relationships with their clients than we have. As a result, our competitors or potential competitors may be better able to overcome capital markets dislocations, adapt more quickly to new or emerging technologies and changes in customer preferences, compete for skilled professionals, build upon efficiencies based on a larger volume of loan transactions, fund internal growth and compete for market share, generally, than we are.
Based on the range of services that we offer, we believe that Sallie Mae is our principal competitor. Sallie Mae has announced that it intends to concentrate on growth of its private education loan volumes, particularly following the elimination of FFELP. Our business could be adversely affected if Sallie Mae's program to market private education loans continues to grow, or if Sallie Mae or Nelnet, Inc., which currently provides fee-based services for non-federally guaranteed loans, seeks to market more aggressively to third parties the full range of services that we offer. Other private education loan originators include JPMorgan Chase Bank, N.A., Wells Fargo & Company, Discover Financial Services and Student Loan Corporation, an 80% owned subsidiary of Citibank, N.A.
We may face competition from loan originators, including our clients or former clients, if they choose to develop an internal capability to provide any of the services that we currently offer. For example, a loan originator that has, or decides to develop, a portfolio management or capital markets function may not choose to engage us for our services. Historically, lenders in the education loan market have focused their lending activities on federal loans because of the relative size of the federal loan market and because the federal government guarantees repayment of these loans, thereby significantly limiting the lenders' credit risk. The demand for our services could decline if lenders exit educational lending altogether or place additional emphasis on the private education loan market and offer the services we provide in response to the elimination of FFELP.
We cannot assure you that we will be able to compete successfully with new or existing competitors. If we are not able to compete effectively, our results of operations may be adversely affected.
21
The growth of our business could be adversely affected by changes in government education loan programs or expansions in the population of students eligible for loans under government education loan programs.
We focus our business exclusively on the market for private education loans, and substantially all of our business is concentrated in products for post-secondary education. The availability and terms of loans that the government originates or guarantees affects the demand for private education loans because students and their families often rely on private education loans to bridge a gap between available funds, including family savings, grants and federal and state loans, and the costs of post-secondary education. The federal government currently places both annual and aggregate limitations on the amount of federal loans that any student can receive and determines the criteria for student eligibility. These guidelines are generally adjusted in connection with funding authorizations from the United States Congress for programs under the Higher Education Act of 1965. Recent federal legislation expands federal grant and loan assistance, which could weaken the demand for private education loans. In addition, the elimination of FFELP could result in increased competition in the market for private education loans, as well as a shift by students away from higher cost schools. Increased competition could adversely affect the volume of private education loans and future capital markets transactions, if any, that we facilitate and impede the growth of our business.
In May 2008, the Ensuring Continued Access to Student Loans Act of 2008 was signed into law and contains provisions which might adversely impact the demand for private education loans and outsourcing services provided by us, availability and flow of funds for private education loans, and our liquidity position. Among other things, the Act:
- •
- permits a parent borrower under the federal Parent Loan for Undergraduate Students, or PLUS, loan program to defer
repayment of a PLUS loan until six months after the student ceases to carry at least one-half the normal full-time academic workload;
- •
- extends eligibility for a PLUS loan to an applicant who, during the period beginning January 1, 2007 and ending
December 31, 2008, has not been delinquent for more than 180 days on mortgage loan payments or medical bill payments nor more than 89 days delinquent on the repayment of any other
debt, in any case, during such period; and
- •
- increases the loan limits for unsubsidized Stafford loans for undergraduate students.
In August 2008, the Higher Education Opportunity Act was signed into law, which adds:
- •
- significant restrictions to the marketing of federal and private education loans; and
- •
- significant compliance burdens to private education loan lenders by adding new TILA disclosures, procedures and rescission rights, as well as accompanying civil penalties.
Access to alternative means of financing the costs of education may reduce demand for private education loans.
The demand for private education loans could weaken if student borrowers use other vehicles to bridge the gap between available funds and costs of post-secondary education. These vehicles include, among others:
- •
- home equity loans or other borrowings available to families to finance their education costs;
- •
- pre-paid tuition plans, which allow students to pay tuition at today's rates to cover tuition costs in the
future;
- •
- 529 plans, which include both prepaid tuition plans and college savings plans that allow a family to save funds on a
tax-advantaged basis;
- •
- education IRAs, now known as Coverdell Education Savings Accounts, under which a holder can make annual contributions for education savings;
22
- •
- government education loan programs, generally; and
- •
- direct loans from colleges and universities.
If demand for private education loans weakens, we would experience reduced demand for our services, which could have a material adverse effect on our results of operations.
Continuation of the current economic conditions could adversely affect the private education loan industry.
As a result of capital market dislocations that began during the second quarter of fiscal 2008, as well as the TERI Reorganization, we have not completed a securitization transaction since September 2007. In addition, high unemployment rates and the unsteady financial sector have adversely affected many consumers and borrowers throughout the country. Current borrowers may experience more trouble in repaying credit obligations, which could increase loan delinquencies and defaults and negatively affect the value of our service receivables. In addition, some consumers may find that higher education is an unnecessary investment during turbulent economic times and defer enrollment in educational institutions until the economy improves or turn to less costly forms of secondary education, thus decreasing education loan application and funding volumes. Finally, many lending institutions have been reluctant to lend and have significantly tightened their underwriting standards, and several clients and potential clients have exited the private education loan business and may or may not seek our services as the economy improves. If the adverse economic environment continues, our financial condition may deteriorate for any one of the foregoing reasons.
If our clients do not actively or successfully market and fund private education loans, our business will be adversely affected.
We have in the past relied on, and will continue to rely in part, on our clients to market and fund private education loans to student borrowers. If our clients do not devote sufficient time and resources to their marketing efforts or are not successful in these efforts, then we may not reach the full potential of our capacity for facilitated loan volume and our business will be adversely affected.
In addition, if loans were or are marketed by our clients in a manner that is unfair or deceptive, or if the marketing, origination or servicing violated or violates any applicable law, state unfair and deceptive practices acts could impose liability on the holder of the loan or create defenses to the enforceability of the loan. Investigations by the New York Attorney General, the Attorneys General of other states, the United States Congress or others could have a negative impact on lenders' desire to market private education loans. The Higher Education Opportunity Act creates significant additional restrictions on the marketing of private education loans.
If we fail to manage our cost reductions effectively, our business could be disrupted and our financial results could be adversely affected.
During fiscal 2008 and fiscal 2009, we reduced headcount by over 800 employees, including departures of our former Chief Executive Officer, Chief Financial Officer, Chief Administrative Officer, Chief Information Officer and Chief Marketing Officer. Our cost reduction initiatives have placed and will continue to place a strain on our management, systems and resources at a critical point in our business and industry. We must continue to refine our business development capabilities, our systems and processes and our access to financing sources. We must retain, train, supervise and manage our remaining employees during this period of change in our business, and our ability to retain our employees may become more difficult as we face an increasingly competitive landscape with respect to talented employees as the economy begins to re-emerge from the financial crisis.
Based on facilitated loan volumes, we may outsource some borrower services functions in an effort to reduce costs, take advantage of technologies and effectively manage the seasonality associated with education loan volume. We rely on our vendors to provide high levels of service and support. Our
23
reliance on external vendors subjects us to risks associated with inadequate or untimely service and could result in fewer loans than we would experience if we performed the service functions in-house.
We cannot assure you that we will be able to:
- •
- expand our systems effectively;
- •
- successfully develop new products or services;
- •
- allocate our human resources optimally;
- •
- identify, hire and retain qualified employees or vendors; or
- •
- incorporate effectively the components of any business that we may acquire in our effort to achieve growth.
We are dependent upon the retention and motivation of certain key employees and the loss of any such employees could adversely affect our business. In addition, our future performance will also depend upon our ability to attract skilled, new employees. If we are unable to manage our cost reductions, or if we lose key employees or are unable to attract new employees, our operations and our financial results could be adversely affected.
If competitors acquire or develop a private education loan database or advanced loan information processing systems, our business could be adversely affected.
We own a database of historical information on private education loan performance that we use to help us enhance our proprietary origination risk score model, determine the terms of portfolio funding transactions and establish the changes in fair value of the additional structural advisory fees, asset servicing fees and residual receivables that we recognize as revenue. We also have developed a proprietary loan information processing system to enhance our application processing and loan origination capabilities. We believe that our private education loan database and loan information processing system provide us with a competitive advantage in offering our services. Third parties could create or acquire databases and systems such as ours, and TERI possesses certain historical information related to TERI-guaranteed loans. As lenders and other organizations in the private education loan market originate or service loans, they compile over time information for their own private education loan performance database. Our competitors and potential competitors may have originated or serviced a greater volume of private education loans than we have over the past two fiscal years, which may have provided them with comparatively greater borrower or loan data, particularly during the most recent economic cycle. If a third party creates or acquires a private education loan database or develops a loan information processing system, our competitive positioning, ability to attract new clients and business could be adversely affected. In addition, if TERI were to assert successfully that certain contractual restrictions on the use and sale of its historical loan data terminated in the context of the TERI Reorganization or otherwise, the competitive advantage of our loan database could diminish. As a result of the termination of our agreements with TERI in the context of the TERI Reorganization, we have lost access to continuing updates to the database of TERI-guaranteed loan performance data with regard to TERI-guaranteed loans that are neither held by securitization trusts facilitated by us nor Union Federal.
If we are unable to protect the confidentiality of our historical loan database and proprietary information systems and processes, the value of our services and technology will be adversely affected.
We rely on trade secret laws and restrictions on disclosure to protect our historical loan database and proprietary information systems and processes. We have sought to limit TERI's rights to disclose its historical loan database in the context of the TERI Reorganization, and we have entered into confidentiality agreements with third parties and with some of our employees to maintain the confidentiality of our trade secrets and proprietary information. These methods may neither effectively
24
prevent use or disclosure of our confidential or proprietary information nor provide meaningful protection for our confidential or proprietary information if there is unauthorized use or disclosure.
We own no material patents. Accordingly, our technology, including our loan information processing systems, is not covered by patents that would preclude or inhibit competitors from entering our market. Monitoring unauthorized use of the systems and processes that we have developed is difficult, and we cannot be certain that the steps that we have taken will prevent unauthorized use of our technology. Furthermore, others may independently develop substantially equivalent proprietary information and techniques or otherwise gain access to our proprietary information. If we are unable to protect the confidentiality of our proprietary information and know-how, the value of our technology and services will be adversely affected.
The loan origination process is becoming increasingly dependent upon technological advancement, and we could lose clients and market share if we are not able to keep pace with rapid changes in technology.
Our future success depends, in part, on our ability to process loan applications in an automated, error-free manner. The volume of loan originations that we are able to process is based, in large part, on the systems and processes we have implemented and developed. The loan origination process is becoming increasingly dependent upon technological advancement such as the ability to process loans over the Internet, accept electronic signatures and provide initial decisions instantly. Our future success also depends, in part, on our ability to develop and implement technology solutions that anticipate and keep pace with continuing changes in technology, industry standards and client preferences. We may not be successful in anticipating or responding to these developments on a timely basis. If competitors introduce products, services, systems and processes that are better than ours or that gain greater market acceptance, those that we offer or use may become obsolete or noncompetitive. In addition, if we fail to execute our clients' origination requirements or properly administer our clients' credit agreement templates or required disclosures, we could be subject to breach of contract claims and related damages. Any one of these circumstances could have a material adverse effect on our business reputation and ability to obtain and retain clients.
We may be required to expend significant funds to develop or acquire new technologies. If we cannot offer new technologies as quickly as our competitors, we could lose clients and market share. We also could lose market share if our competitors develop more cost effective technologies than those we offer or develop.
Our business could be adversely affected if PHEAA fails to provide adequate or timely services or if our relationship with PHEAA terminates.
As of June 30, 2010, PHEAA serviced a substantial majority of private education loans held by the securitization trusts that we administer and served as the sole loan servicer for loan programs based on our Monogram product offering. Our arrangements with PHEAA allow us to avoid the overhead investment in servicing operations, but require us to rely on PHEAA to adequately service the private education loans, including collecting payments, responding to borrower inquiries and communicating with borrowers whose loans have become delinquent. We periodically review the costs associated with establishing servicing operations to service loans. During the second quarter of fiscal 2010, we announced that we had entered into negotiations for the acquisition of a loan servicer. We were subsequently unable to agree to terms, and, as of the third quarter of fiscal 2010, negotiations with respect to the contemplated acquisition had terminated. We continue to believe, however, that ownership of a loan servicer could complement our overall strategy and reduce our reliance on an external service provider for loan servicing, which subjects us to risks associated with inadequate or untimely services, including notice of developments in prepayments, delinquencies and defaults, and usage rates for various borrower benefits or temporarily modified payment plans. A substantial increase in these rates could adversely affect our ability to access profitably the securitization markets for our
25
clients' loans and the value of our additional structural advisory fees, asset servicing fees and residual receivables. If our relationship with PHEAA terminates, we would either need to expand or develop a relationship with another loan servicer, which could be time consuming and costly. In such event, our business could be adversely affected.
An interruption in or breach of our information systems, or those of third parties on which we rely, may result in lost business.
We rely heavily upon communications and information systems to conduct our business. Our systems and operations are potentially vulnerable to damage or interruption from network failure, hardware failure, software failure, power or telecommunications failures, computer viruses and worms, penetration of our network by hackers or other unauthorized users and natural disasters. Any failure, interruption or breach in security of our information systems or the third-party information systems on which we rely could cause underwriting or other delays and could result in fewer loan applications being received, slower processing of applications and reduced efficiency in loan processing or servicing. A failure, interruption or breach in security could also result in an obligation to notify clients in a number of states that require such notification, with possible civil liability resulting from such failure, interruption or breach. Although we maintain and periodically test a business continuity and disaster recovery plan, the majority of our infrastructure and employees are concentrated in the Boston metropolitan area. An interruption in services for any reason could adversely affect our ability to activate our contingency plan if we are unable to communicate among locations or employees.
We cannot assure you that failures, interruptions or breaches will not occur, or if they do occur that we or the third parties on whom we rely will adequately address them. The precautionary measures that we have implemented to avoid systems outages and to minimize the effects of any data or communication systems interruptions may not be adequate, and we may not have anticipated or addressed all of the potential events that could threaten or undermine our information systems. The occurrence of any failure, interruption or breach could significantly impair the reputation of our brand, diminish the attractiveness of our services and harm our business.
If we experience a data security breach and confidential customer information is disclosed, we may be subject to penalties imposed by regulators, civil actions for damages and negative publicity, which could affect our customer relationships and have a material adverse effect on our business. In addition, state and federal legislative proposals, if enacted, may impose additional requirements on us to safeguard confidential customer information, which may result in increased compliance costs.
Data security breaches suffered by well-known companies and institutions have attracted a substantial amount of media attention, prompting state and federal legislation, legislative proposals and regulatory rule-making to address data privacy and security. Consequently, we may be subject to rapidly changing and increasingly extensive requirements intended to protect the applicant and borrower information that we process in connection with the loans. Implementation of systems and procedures to address these requirements has increased our compliance costs, and these costs may increase further as new requirements emerge. If we were to experience a data security breach, or if we or the securitization trusts that we administer were to otherwise improperly disclose confidential customer or consumer information, such breach or other disclosure could generate negative publicity about us and could adversely affect our relationships with our clients, including the lenders and educational institutions with which we do business. This could have a material adverse effect on our business. In addition, such pending legislative proposals and regulations, if adopted, likely would result in substantial penalties for unauthorized disclosure of confidential consumer information. Failure to comply with those requirements could result in regulatory sanctions imposed on our client lenders and loss of business for us.
26
Risks Related to Our Financial Reporting and Liquidity
If the estimates we make, or the assumptions on which we rely, in preparing our financial statements prove inaccurate, our actual results may vary materially from those reflected in our financial statements.
As compensation for our past securitization activities, we were entitled to receive structural advisory fees and a portion of the residual interests in the securitization trusts that we facilitated. We received up-front structural advisory fees when the securitization trusts purchased the loans, and we continue to be entitled to receive additional structural advisory fees over time, based on the amount of loans outstanding in the trust over the life of the trust. As required under accounting principles generally accepted in the United States of America, or GAAP, we recognized the estimated fair value of up-front and additional structural advisory fees and residual receivables as revenue when the securitization trusts purchased the loans because receipt of our fees is not contingent on any further service requirement by us. Quarterly, we update our estimate of the fair value of our receivables, and changes to the fair value, less cash distributions, if any, are recorded as revenue (trust updates) in the period in which the change is made. We are entitled to asset servicing fees for additional services that we are contractually obligated to perform relating to the residual interests in the NCSLT Trusts. We recognize the net present value of asset servicing fees as our services are performed. The receipt of the fees is contingent, however, on distributions available to the owners of the NCSLT Trusts residuals. Quarterly, we update our assumptions with respect to the amount and timing of receipt of these fees, and record the changes in our estimates as revenue (fee updates) in the period in which the change is made.
We have no further financial obligation with respect to our additional structural advisory fees or residuals in the securitization trusts we facilitated. However, our fees are subordinate to securities issued to investors in such securitizations, and the trusts may fail to generate any cash flow for us if the securitized assets do not generate enough cash flow to pay debt holders in full or only generate enough cash flow to pay the debt holders. Our projected cash flows from service receivables from certain securitization trusts are expected to be eliminated entirely, and our projected cash flows from other securitization trusts could be delayed, impaired or eliminated, if actual performance differs from our assumptions at June 30, 2010. As of June 30, 2010, we expected to receive additional structural advisory fees and residuals beginning five to 22 years after the date of a particular securitization transaction, consistent with our expectations at June 30, 2009.
Because there are no quoted market prices for our service receivables or the portfolio of private education loans held by UFSB-SPV, we use discounted cash flow modeling techniques and certain assumptions to estimate fair value. Our key assumptions to estimate fair value include: discount rates; the annual rate and timing of private education loan prepayments; the trend of interest rates over the life of the loan pool, including the forward LIBOR curve, which is a projection of future LIBOR rates over time; the expected annual rate and timing of loan defaults, including the effects of various risk mitigation strategies and temporarily modified payment plans for borrowers, as well as TERI's obligation to pay default claims; expected amount and timing of recoveries of defaulted loans; the source and amount of guaranty payments made on defaulted loans; and the fees and expenses of the securitization trusts. Because our estimates rely on quantitative and qualitative factors, including historical data and macroeconomic indicators to predict prepayment and default rates, management's ability to determine which factors should be more heavily weighted in our estimates, and to accurately incorporate those factors into our loan performance assumptions, are subjective and can have a material effect on valuations.
We adjusted our key accounting assumptions throughout fiscal 2010. During fiscal 2010, we completed initial enhancements to the financial models we employ in developing the assumptions used to estimate the fair value of our service receivables and our portfolio of private education loans held for sale. These refinements resulted in the use of higher default rates, which, when combined with higher discount rates and a downward shift in the forward LIBOR curve, resulted in decreases in the
27
estimated fair value of our service receivables and loans. We benefited in fiscal 2010, however, from lower prepayment rates. The net effect of these adjustments, partially offset by fair value of accretion due to passage of time, was a net decrease of $20.5 million in the value of our additional structural advisory fee, asset servicing fee and residual receivables, and a net loss of $131.0 million in connection with realized losses and fair value adjustments to private education loans held for sale.
In general, our adjustments during fiscal 2010 were necessary because the securitization trusts and UFSB-SPV's portfolio of private education loans held for sale performed below our range of expectations, including with regard to delinquencies and defaults. Other contributing factors included higher assumed discount rates and an overall downward shift in the forward LIBOR curve, somewhat offset by lower prepayment rates. See "Management's Discussion and Analysis of Financial Condition and Results of Operations," included in Item 7 of this annual report for a discussion of changes in assumptions for fiscal 2010 and fiscal 2009 under the caption "Results of Operations—Years ended June 30, 2010, June 30, 2009 and June 30, 2008," and "Executive Summary—Application of Critical Accounting Policies and Estimates" for a sensitivity analysis of the additional structural advisory fees to variations in our assumptions and estimates.
If the actual performance of the private education loan portfolios held by some or all of the securitization trusts were to vary appreciably from the adjusted assumptions we use, we may need to adjust our key assumptions further. Such an adjustment could materially affect our earnings in the period in which our assumptions change, and the additional structural advisory fees and residuals that we receive from the trusts, and the asset servicing fees that we receive from the owner of the Trust Certificate, could be significantly less than that reflected in our current financial statements. In particular, economic, regulatory, competitive and other factors affecting default and recovery rates on loan portfolios could cause or contribute to differences between actual performance of the portfolios and our key assumptions. With regard to TERI, for purposes of estimating the fair value of our service receivables, we assumed at June 30, 2010 that the application of collateral will occur in accordance with the terms of the Plan of Reorganization, notwithstanding that neither such plan nor the Modified Plan of Reorganization had been confirmed by the Bankruptcy Court as of September 2, 2010. Finally, dislocations in the capital markets have generally resulted in increases in investors' yield requirements for ABS. If such conditions degrade, we may need to further adjust our key assumptions.
We will be required to consolidate certain securitization trusts in our financial results after July 1, 2010, which will result in significant changes to the presentation of our financial statements and may result in increased volatility in our reported financial condition and results of operations.
The presentation of our consolidated financial statements beginning with the first quarter of fiscal 2011 will differ significantly from the presentation included in this annual report. Historically, each of the securitization trusts created after January 31, 2003 has met the criteria to be a qualified special-purpose entity, or QSPE, as defined by Accounting Standards Codification, or ASC, 860-40, Transfers and Servicing—Transfers to Qualifying Special Purpose Entities, which we refer to as ASC 860-40. Accordingly, we did not consolidate these existing securitization trusts in our financial statements. In addition, the securitization trusts created prior to January 31, 2003 in which we hold a variable interest that could result in us being considered the primary beneficiary of such trust, have been amended in order for them to be considered QSPEs. Effective July 1, 2010, however, our historical accounting with regard to variable interest entities, including securitization trusts, changed with our adoption of Accounting Standards Update, or ASU, 2009-17, Consolidations (Topic 810)—Improvements to Financial Reporting by Enterprises Involved With Variable Interest Entities, which we refer to as ASU 2009-17.
Effective July 1, 2010, we consolidated 14 securitization trusts that we facilitated and deconsolidated UFSB-SPV. As a result, we recorded a net increase in total assets and total liabilities of approximately $8.0 billion and $8.8 billion, respectively, and a net decrease in total stockholders' equity of approximately $800 million, comprised of an increase in FMD stockholders' equity of approximately
28
$60 million recorded as an adjustment to opening retained earnings, more than offset by a non-controlling interest deficit of approximately $860 million. In addition, after July 1, 2010, our results of operations will no longer reflect securitization-related income, trust updates or administrative fees received from the 14 securitization trusts. Instead, we will recognize interest income associated with securitized loan receivables in the same line item as interest income from non-securitized assets, as well as a provision for loan losses, and we will recognize interest expense associated with debt issued by the securitization trusts to third-party investors on the same line item as other interest-bearing liabilities of FMD. We will recognize additional structural advisory fees, administrative and other fees and revenues from residuals only from variable interest entities that were not consolidated. For additional details regarding our adoption of ASU 2009-17, see "Management's Discussion and Analysis of Financial Condition and Results of Operations—Application of Critical Accounting Policies and Estimates—Consolidation," included in Item 7 of this annual report.
ASU 2009-17 requires us to make additional judgments that are subject to change based on new facts and circumstances, and evolving interpretations and practices. Under ASU 2009-17, the determination of whether to consolidate a variable interest entity is based on whether the company is considered to be the primary beneficiary. Such determination is based on both the power to direct the activities of the entity that most significantly impact the entity's economic performance, and the obligation to absorb losses or the right to receive benefits that could be significant to the entity. The nature of these determinations, made on an entity-by-entity basis, requires a high level of subjectivity and judgment. Moreover, we are required to continuously reassess whether consolidation or deconsolidation of variable interest entities is appropriate, as opposed to the trigger-based assessment allowed under previous guidance. As a result, determinations that we make from time to time will be susceptible to change. We may be required to consolidate or deconsolidate variable interest entities on a quarterly basis, which, given the size of our variable interest entities, could result in significant changes to our reported assets and liabilities and results of operations during the quarter in which the change occurs. Any such consolidations or deconsolidations, were they to occur, could make comparisons of our financial performance between periods challenging to investors.
In addition, our financial results for the first quarter of fiscal 2011 will reflect the adoption of new accounting policies, including policies for the determination of an allowance for loan losses and corresponding provisions and the recognition and presentation of loans and related interest income, including related amortization methods, identification of nonaccrual loans and impact of existing or future borrower payment modification programs. We have also adjusted, and may need to further adjust, elements of our information technology infrastructure in order to support our financial reporting following adoption of ASU 2009-17. We have limited experience with our new policies and infrastructure, and we may need to adjust them in the future based on our actual experience, new facts and circumstances, or evolving interpretations and practices.
Our liquidity could be adversely affected if the sale of the Trust Certificate does not result in the tax consequences that we expect.
Effective March 31, 2009, we completed the sale of the Trust Certificate, representing our ownership interest in NC Residuals Owners Trust, in a transaction intended to improve our financial condition and liquidity. The sale of the Trust Certificate generated a cash refund for income taxes previously paid. The U.S. federal and state income tax consequences of the sale of the Trust Certificate, however, are complex and uncertain. The Internal Revenue Service, or IRS, has begun an audit of our tax returns for fiscal years 2007, 2008 and 2009. The IRS or a state taxing authority could challenge our tax positions in connection with the transactions, notwithstanding our receipt of any tax refund. If such a challenge were successful, in whole or in part, we may not keep all or a portion of any refund for taxes previously paid, or we may not eliminate our tax obligations relating to the residuals. In either case, our near-term and long-term financial condition and liquidity would be materially adversely
29
affected. In addition, any investigation, audit or suit relating to the sale of the Trust Certificate, including any such proceeding brought by the IRS, could result in substantial costs.
We have guaranteed the performance of Union Federal's obligations under a loan purchase and sale agreement and assumed potential contingent liabilities of Union Federal under an indenture. We may incur substantial costs if we have to perform or assume obligations of Union Federal, which could have a material adverse effect on our liquidity or financial condition.
In connection with Union Federal's sale of private education loans in October 2009, we delivered a performance guarantee to the purchaser of the loan portfolio. If Union Federal were to default in the performance of any of its obligations or agreements under the loan purchase and sale agreement, including its indemnification or loan repurchase obligations, we would be required to perform such obligations. As a result, we may incur substantial costs pursuant to the performance guarantee if Union Federal is unable to perform its obligations under the loan purchase and sale agreement.
In April 2010, we entered into agreements relating to the restructuring of the education loan warehouse facility of UFSB-SPV. In connection with the restructuring, the third-party conduit lender released potential claims against Union Federal and UFSB-SPV pursuant to the indenture relating to the warehouse facility based upon events arising prior to April 16, 2010, to the extent such claims exceed $20.0 million in the aggregate. Neither Union Federal nor UFSB-SPV would have any liability until the conduit lender's aggregate losses exceed $3.5 million, at which point Union Federal and UFSB-SPV would only be liable for amounts above such amount up to the $20.0 million liability cap. Neither the liability cap nor the $3.5 million deductible would apply, however, in cases of fraud, willful misconduct, gross negligence or third-party claims by or on behalf of borrowers against the conduit lender based on loan origination errors. In addition, the release is not deemed a waiver of rights previously reserved but not exercised by the conduit lender, except as specifically released pursuant to a settlement agreement.
We assumed any remaining contingent liability of Union Federal and its affiliates, other than UFSB-SPV, under the warehouse facility arising prior to April 16, 2010, subject to the liability cap discussed above. In addition, we assumed any contingent liability of Union Federal under the facility arising prior to April 16, 2010 based on fraud, willful misconduct, gross negligence, third-party claims by or on behalf of borrowers against the conduit lender based on loan origination errors or rights not otherwise released by the conduit lender. As a result, we may incur substantial costs in the event of a claim for damages related to the warehouse facility, which could have a material adverse affect on our liquidity or financial condition.
Changes in interest rates could affect the value of our additional structural advisory fees, asset servicing fees and residual receivables, as well as demand for private education loans and our services.
Private education loans typically carry floating interest rates tied to prevailing short-term interest rates. Higher interest rates would increase the cost of the loan to the borrower, which in turn, could cause an increase in delinquency and default rates for outstanding education loans, as well as increased use of forbearance or temporarily modified payment plans. Other factors, such as challenging economic times, including high unemployment rates, can also lead to an increase in delinquency and default rates or such use. In addition, higher interest rates, or the perception that interest rates could increase in the future, could cause an increase in prepayments, including full or partial prepayments. If the prepayment or default rates increase for the private education loans held by us or the securitization trusts that we have facilitated, we may experience a decline in the value of our additional structural advisory fees, asset servicing fees and residual receivables, which could cause a decline in the price of our common stock and could cause future portfolio funding transactions to be less profitable for us. In addition, an increase in interest rates could reduce borrowing for education generally, which, in turn, could cause the overall demand for our services to decline.
30
LIBOR is the underlying rate for most of the trusts' assets and liabilities and changes in LIBOR can have a significant effect on the cash flows generated by each trust. Changes in the forward LIBOR curve affect the principal balances of private education loans held by the trusts, particularly as interest is capitalized during loan deferment, which affects the net interest margin that the trust generates. In addition, certain trusts have issued a tranche of ABS that bears a fixed interest rate. A decrease in the forward LIBOR curve may result in a reduced spread on the fixed interest-rate tranche, which in turn could decrease the estimated fair value of our service receivables. Significant changes to the forward LIBOR curve can also affect the estimated fair value of our additional structural advisory fees, which bear interest at the rate of LIBOR plus a spread to the extent such fees are accrued but unpaid by the trusts.
If sufficient funds to finance our business, including Union Federal, are not available to us when needed or on acceptable terms, then we may be required to delay, scale back or alter our strategy.
We may require additional funds for our products, our operating expenses, credit enhancement for loan programs, the pursuit of regulatory approvals, acquisition opportunities and the expansion of our capabilities. Historically, we have satisfied our funding needs primarily through private education loan asset-backed securitizations. The securitization market has not been available to us and may not be available to us when needed in the future, and, if available, the terms may not be acceptable to us. We have also satisfied our funding needs through equity financings. We cannot be certain that additional public or private financing would be available in amounts or on terms acceptable to us, if at all. Although we believe that our capital resources as of June 30, 2010, which include proceeds of tax refunds under audit as of September 2, 2010, are sufficient to satisfy our operating needs for the succeeding twelve months, we cannot assure you that they will be sufficient to provide amounts that we may determine to be necessary or appropriate to contribute to prospective clients related to new programs. Insufficient funds could require us to delay, scale back or eliminate certain of our products and further scale back our expenses. In addition, our short-term financing needs are subject to regulatory capital requirements related to Union Federal. See Note 21, "Union Federal Regulatory Matters—Regulatory Capital Requirements," in the notes to our consolidated financial statements included in Item 8 of this annual report for additional details.
Risks Related to Asset-Backed Securitizations and Other Funding Sources
We have historically recognized a significant portion of our revenue and substantially all of our income from structuring securitization transactions; our financial results and future growth may continue to be adversely affected if we are unable to structure securitizations or alternative financings.
In the past, we did not charge separate fees for many of our services, but generally entered into agreements with clients giving us the exclusive right to securitize the private education loans that they did not intend to hold. As a result, we have historically recognized a significant portion of our revenue and substantially all of our income from structuring securitization transactions. We have not completed a securitization since the first quarter of fiscal 2008, contributing to our net losses for each subsequent quarter.
Although our Monogram product offering has been designed to generate recurring revenue with less dependence on the securitization market and third-party credit enhancement, we have limited experience with it and, as of September 2, 2010, expect to have fully deployed it to only two clients by September 30, 2010. In addition, our future financial results and growth may continue to be affected by our inability to structure securitizations or alternative financing transactions involving private education loans. In particular, such transactions may enable us to access and recycle capital previously deployed as credit enhancement for Monogram-based loan programs. If we are able to facilitate securitizations in the near-term, we expect the structure and economics of the transactions to be substantially different than our past transactions, including lower revenues and additional cash requirements on our part.
31
If we continue to be unable to access the ABS market, our revenues may continue to be adversely impacted, and we may continue to generate net losses, which would further erode our liquidity position.
Our business, financial condition, results of operations and cash flows will be adversely affected if we do not achieve widespread market acceptance of loan programs based on our Monogram product offering.
Since the beginning of fiscal 2009, we have significantly refined our service offerings and added fee-for-service offerings, such as portfolio management and asset servicing. During fiscal 2010, we completed the development of our Monogram product offering and entered into Monogram loan program agreements with SunTrust Bank and Kinecta Federal Credit Union pursuant to which we expect to generate ongoing monthly revenue through the maturity of the program loans. Deployment of this product has been limited, however, and we will need to gain widespread market acceptance of our Monogram product in order to improve our long-term financial condition, results of operations and cash flows.
A number of factors, some of which are beyond our control, have adversely affected and may continue to adversely affect our portfolio funding activities and thereby adversely affect our results of operations.
The success of our business may depend on our ability to structure securitizations or other funding transactions for our clients' loan portfolios. Several factors have had, and may continue to have, a material adverse effect on both our ability to structure funding transactions and the revenue we may generate for providing our structural advisory and other services, including the following:
- •
- persistent and prolonged disruption or volatility in the capital markets generally or in the private education loan ABS
sector specifically, which could continue to restrict or delay our access to the capital markets;
- •
- our inability to structure and gain market acceptance for new products or services to meet new demands of ABS investors or
credit facility providers;
- •
- continuing degradation of the credit quality or performance of the loan portfolios of the trusts we have facilitated,
which could reduce or eliminate investor demand for future securitizations that we facilitate, particularly for subordinate classes of ABS, or result in material, adverse modifications in rating
agency assumptions, ratings or conclusions with respect to the securitization trusts;
- •
- rating agency actions, including downgrades, of ABS that we facilitated in the past or any occurrence of an event of
default with respect to such securities, which could reduce demand for additional securitizations that we structure;
- •
- developments in connection with the TERI Reorganization, including the confirmation and effectiveness of the Modified Plan
of Reorganization, as it relates to the implementations of the settlements involving the NCSLT Trusts contemplated by the plan and recoveries to us in respect of our claims as a general unsecured
creditor;
- •
- material breach of our obligations to clients, including securitization trusts and former or current lender clients;
- •
- the timing and size of private education loan asset-backed securitizations that other parties facilitate, or the adverse
performance of, or other problems with, such securitizations, which could impact pricing or demand for our future securitizations, if any;
- •
- challenges to the enforceability of private education loans based on violations of federal or state consumer protection or
licensing laws and related regulations, or imposition of penalties or liabilities on assignees of private education loans for violation of such laws and regulations; and
- •
- changes to bankruptcy laws that change the current non-dischargeable status of education-related loans, which could materially adversely affect recovery rates on defaulted loans.
32
Capital markets dislocations, and the timing, size and structure of any future capital markets transactions, could greatly affect our quarterly financial results.
Continuing dislocations in the capital markets, reductions in the valuations of our service receivables and the size, structure or economic terms of our future capital markets transactions, if any, could increase the variability of our operating results on a quarterly basis. We expect the structure and pricing terms in near-term future transactions, if any, to be less favorable than in the past.
Recent legislation will affect the terms of future securitization transactions.
The SEC has proposed new rules governing ABS issuance that, due to the requirements for risk retention, may affect the desirability of issuing ABS as a funding strategy. In addition, the Dodd-Frank Act grants federal banking regulators substantial discretion in developing specific risk retention requirements for all types of consumer credit products and requires the SEC to establish new data requirements for all issuers, including standards for data format, asset-level or loan-level data, the nature and extent of the compensation of the broker or originator, and the amount of risk retention required by loan securitizers. The Dodd-Frank Act and its implementing regulations, once adopted, will affect the terms of future securitization transactions, if any, that we facilitate and may result in greater risk retention and less flexibility for us in structuring such transactions.
In structuring and facilitating securitizations of our clients' loans, administering securitization trusts or as holders of rights to receive residual cash flows in non-NCSLT Trusts, we may incur liabilities to transaction parties.
We facilitated and structured a number of different special purpose trusts that have been used in securitizations to finance private education loans that our clients originated, including trusts that have issued auction rate notes. Under applicable state and federal securities laws, if investors incur losses as a result of purchasing ABS that those trusts have issued, we could be deemed responsible and could be liable to those investors for damages. If we failed to cause the trusts or other transaction parties to disclose adequately all material information regarding an investment in the ABS, if the trust made statements that were misleading in any material respect in information delivered to investors or if we breach any duties as the structuring advisor or administrator of the securitization trusts, it is possible that we could be sued and ultimately held liable to noteholders or other transaction parties. The Modified Plan of Reorganization would provide exculpation for certain of our actions as administrator of the trusts in connection with the TERI Reorganization, but the Modified Plan of Reorganization may not become effective and the exculpation may not cover all of our actions as administrator of the trusts in the TERI Reorganization. Recent investigations by state attorneys general, as well as private litigation, have focused on auction rate securities, including the marketing and trading of such securities. It is possible that we could become involved in such matters in the future. In addition, under various agreements entered into with underwriters or financial guaranty insurers of those ABS, as well as certain lenders, we are contractually bound to indemnify those persons if investors are successful in seeking to recover losses from those parties and the trusts are found to have made materially misleading statements or to have omitted material information.
If we are liable for losses investors or other transaction parties incur in any of the securitizations that we facilitated or structured and any insurance that we may have does not cover this liability or proves to be insufficient, our results of operations or financial position could be materially adversely affected.
33
Risks Related to the TERI Reorganization
The Creditors Committee has challenged the enforceability of certain of the trusts' security interests, which may result in additional delay and expense, as well as a significant reduction in collateral available to the trusts.
As a result of the automatic stay under the Bankruptcy Code, TERI ceased purchasing defaulted loans, including defaulted loans from the NCSLT Trusts, in April 2008. In June 2008, the Bankruptcy Court entered an order approving a motion by TERI to honor its guaranty agreement obligations using cash in segregated reserve accounts pledged to the NCSLT Trusts to secure TERI's guaranty obligations, which we refer to as the Pledged Accounts. Beginning in July 2008, TERI resumed paying its obligations under the guaranty agreements with respect to defaulted loans from the trusts, but only using cash in the Pledged Account established for the benefit of the specific trusts that owned the defaulted loan. As of September 2, 2010, TERI was not permitted to satisfy its guaranty obligations using funds from TERI's general reserves. Funds in the Pledged Accounts of certain trusts have been exhausted, or are expected to be exhausted in the near term, at which point such trusts will have a general unsecured claim against TERI.
The Bankruptcy Court's June 2008 order granted parties rights to challenge the trusts' security interests in the collateral other than the Pledged Accounts. In January 2009, the Creditors Committee filed an adversary complaint in the Bankruptcy Court against the owner trustee and indenture trustee of 17 securitization trusts, and against our subsidiary First Marblehead Data Services, Inc., as administrator of such trusts. The complaint generally alleges that the security interests granted by TERI to the trusts, excluding the security interests in the Pledged Accounts, are unperfected or may otherwise be avoided under the Bankruptcy Code. In particular, the complaint alleges that the trusts do not have enforceable rights to future recoveries on defaulted loans transferred by the trusts to TERI with an aggregate principal and accrued interest balance of more than $598.0 million as of June 30, 2010, or in amounts owed or transferred by TERI to Pledged Accounts after the filing of TERI's petition for reorganization totaling more than $47.0 million as of June 30, 2010. In February 2009, pending resolution of the issues raised previously in the Creditors Committee's complaint, the trusts generally suspended the transfer of defaulted loans to TERI and generally suspended requests for default claim payments from amounts in the Pledged Accounts.
The Plan of Reorganization included a proposed settlement of the adversary complaint, as well as other provisions that would affect the claims of the NCSLT Trusts. Upon the effective date of the Plan of Reorganization, the litigation regarding the security interests of the trusts would have been settled in accordance with the plan and dismissed with prejudice. In April 2010, all of the NCSLT Trusts voted or were deemed to vote in favor of the Plan of Reorganization, thereby electing to accept the settlement of their respective claims provided in the plan. In April 2010, the Bankruptcy Court held a hearing to consider confirmation of the Plan of Reorganization and made findings that the Plan of Reorganization met the requirements for confirmation under the Bankruptcy Code. Following such hearing, however, TERI and the Creditors Committee filed with the Bankruptcy Court a motion to modify the Plan of Reorganization. We objected to the proposed modifications, in our respective capacities as a general unsecured creditor and administrator to the trusts, and sought to have an order entered confirming the Plan of Reorganization on its original terms. In July 2010, the Bankruptcy Court denied the motion by TERI and the Creditors Committee to modify the Plan of Reorganization and vacated the earlier findings that the Plan of Reorganization met the requirements for confirmation. The Bankruptcy Court ordered TERI and the Creditors Committee to file a fifth amended plan of reorganization prior to August 27, 2010, unless they could negotiate acceptable changes to the Plan of Reorganization. On August 26, 2010, TERI and the Creditors Committee filed a second joint motion to modify the Plan of Reorganization, approve revised disclosure materials and approve procedures by which creditors who previously voted on the Plan of Reorganization would have the opportunity to change their vote with respect to the Modified Plan of Reorganization. On August 31, 2010, the Bankruptcy Court approved
34
the disclosure materials and the solicitation procedures, subject to entry of a formal order, and the solicitation of votes on the Modified Plan of Reorganization is expected to commence on or about September 13, 2010. The Modified Plan of Reorganization would change the terms of the NCSLT Trusts' settlements compared to the settlements proposed in the Plan of Reorganization, including the terms of the settlement of the adversary complaint. See Note 12, "Commitments and Contingencies—TERI Reorganization," in the notes to our consolidated financial statements included in Item 8 of this annual report for additional details.
If the Modified Plan of Reorganization, or a successor plan that provides for settlement of the adversary complaint, is not consummated and if the Creditors Committee or any other party is successful in challenging the trusts' security interests, the amount of pledged collateral available exclusively to a particular securitization trust to satisfy TERI's guaranty obligations to that trust would decrease materially. As a result, the trust's unsecured claims against TERI would increase proportionately. For example, recoveries from defaulted private education loans transferred to TERI, which have historically been used to replenish a particular trust's Pledged Account, would instead become an asset of TERI's bankruptcy estate available for distribution to other holders of claims. The settlement of the adversary complaint, in the context of the Plan of Reorganization or otherwise, could also result in a material decrease in the amount of pledged collateral available exclusively to a particular securitization trust. A challenge to the security interests could delay distributions to creditors, and a successful challenge to the security interests could decrease materially the value of our additional structural advisory fees or our asset servicing fees by decreasing the pledged collateral available exclusively to the NCSLT Trusts.
The TERI Reorganization will adversely affect our ability to facilitate the securitization of TERI-guaranteed loans, and could adversely affect our cash flows from the securitization trusts.
In its role as guarantor, TERI agreed to reimburse lenders for unpaid principal and interest on defaulted loans. TERI had historically been the exclusive provider of borrower default guarantees for our clients' private education loans. Under the terms of our past purchase agreements with lender clients, we generally have an obligation to use our best efforts to facilitate the purchase of a client's TERI-guaranteed loans during a specified loan purchase period. The TERI Reorganization has adversely affected, and will likely continue to adversely affect, our ability to facilitate the securitization of TERI-guaranteed loans. As a result of the TERI Reorganization, no value can be ascribed to the TERI guaranty beyond a trust's Pledged Account. As a result, in structuring future securitizations of loans guaranteed or formerly guaranteed by TERI, if any, we would likely be required to reduce or eliminate our up-front structural advisory fee in order to increase the level of reserves available to the trust. In addition, it is likely that we would need to obtain additional credit enhancement for any future securitizations of such loans, the cost of which would also result in lower revenues.
In general, the termination of the TERI guaranty in the TERI Reorganization would terminate our purchase obligations under the purchase agreements. We may be subject to claims, however, that we breached our contractual obligations under our past purchase agreements, which could adversely affect our business reputation. In addition, our financial results would be adversely affected if we were required to defend or pay damages in connection with any such claim.
To the extent that the Pledged Account available to a particular NCSLT Trust is exhausted and loan defaults continue to occur, that NCSLT Trust would have a related claim as an unsecured creditor of TERI in the context of the TERI Reorganization. TERI's general reserves will be insufficient to satisfy fully the claims of unsecured creditors, and therefore loan defaults would have a further adverse effect on the amount or timing of cash flows that would otherwise be expected to be generated by the NCSLT Trust, which would adversely affect the value of our service receivables, including our asset servicing and additional structural advisory fees.
35
Our claims against TERI will not be settled by the Modified Plan of Reorganization, and our potential recovery from TERI's bankruptcy estate on our general unsecured claim has been eroded by the costs and pace of the reorganization proceeding.
In October 2008, we filed proofs of claim against TERI alleging rejection damages and other claims in excess of $87.0 million. These alleged general unsecured trade claims would not be settled by the Modified Plan of Reorganization, and we have not reflected any recovery from our claims against TERI in our financial statements. TERI and the Creditors Committee have stated that they believe that our claims are substantially inflated and seek damages that are not compensable under state law. The amount and validity of our claims against TERI may require litigation, which could be time-consuming and costly, to resolve, and we cannot assure you that our alleged claims would be allowed in full.
In addition, the amount of our ultimate recovery from TERI's bankruptcy estate in respect of our claims is difficult to estimate. The compensation and other operating expenses of TERI, together with the expenses of its professional advisors and those of the Creditors Committee, during the course of the reorganization proceeding will have consumed a significant portion of TERI's unrestricted cash. Based on filings made with the Bankruptcy Court, TERI had unrestricted cash and marketable securities of $83.1 million as of April 30, 2008, but expects only $42.3 million to remain available for transfer to the liquidating trust under the Modified Plan of Reorganization, assuming such plan becomes effective on September 30, 2010. As a result, general unsecured creditors of TERI will receive a small portion of their claims in cash shortly following the effectiveness of any plan of reorganization. The larger portion of their respective claims will only be received by creditors based on the level of recoveries on defaulted loans previously transferred to TERI. Those recoveries are expected to be collected over many years, and the recovery rate will depend on the experience and skill of the party or parties managing collections with respect to such loans. Under the Modified Plan of Reorganization, reorganized TERI would manage collections with respect to the portion of such loans for which TERI is currently managing collections. As of September 2, 2010, we are managing collections on behalf of TERI with regard to the remainder of such loans. We have only agreed to continue providing such services for up to 90 days following the effective date of the Modified Plan of Reorganization. Moreover, we can provide no assurance that the plan trustee will seek to engage us following the effectiveness of any plan of reorganization or that we will be able to reach acceptable terms with such plan trustee regarding our continued services.
Risks Relating to Regulatory Matters
We will become subject to new regulations which could increase our costs of compliance and alter our business practices.
Regulators have increased diligence and enforcement efforts and new laws and regulations have been passed or are under consideration in Congress as a result of turbulence in the financial services industry. On July 21, 2010, the President signed into law the Dodd-Frank Act. The Dodd-Frank Act requires various federal agencies to adopt a broad range of new implementing rules and regulations, and the federal agencies are given significant discretion in drafting the implementing rules and regulations, and consequently, many of the details and much of the impact of the Dodd-Frank Act may not be known for many months or years. In addition, many of the provisions of the Dodd-Frank Act would not apply to us if Union Federal is sold.
The Dodd-Frank Act also restructures the regulation of depository institutions. Under the Dodd-Frank Act, the OTS, which is currently the primary federal regulator for FMD and Union Federal, will cease to exist on July 21, 2011 unless the Secretary of the Treasury opts to delay such date for up to an additional six months. The OCC, which is currently the primary federal regulator for national banks, will become the primary federal regulator for federal thrifts, including Union Federal. The Federal Reserve will supervise and regulate all savings and loan holding companies that were
36
formerly regulated by the OTS, including FMD. Although the OCC and Federal Reserve are directed to implement existing OTS regulations, orders, resolutions, determinations and agreements for thrifts and their holding companies under HOLA, the transition of supervisory functions from the OTS to the OCC (with respect to Union Federal) and the Federal Reserve (with respect to FMD) could alter the supervisory approach for Union Federal and FMD. This could in turn affect the operations of FMD and Union Federal. The Dodd-Frank Act also will impose consolidated capital requirements on savings and loan holding companies, but they are not effective for five years.
The Dodd-Frank Act establishes the BCFP as an independent agency within the Federal Reserve to regulate consumer financial products, including education loans, and services offered primarily for personal, family or household purposes, with rule-making and enforcement authority over unfair, deceptive or abusive practices. These laws may directly impact our business operations, whether or not Union Federal is sold. The potential reach of the BCFP's broad new rulemaking powers and enforcement authority on the operations of financial institutions offering consumer financial products or services, including FMD, is currently unknown. In addition, the Dodd-Frank Act establishes a private education loan ombudsman within the BCFP, which would, among other things, receive, review and attempt to resolve informally complaints from private education loan borrowers. Finally, the Dodd-Frank Act requires the BCFP and the Secretary of Education, in consultation with FTC commissioners and the Attorney General, to submit a report, within two years of enactment of the Dodd-Frank Act, on a variety of information relating to the private education lending market, including private education loan lenders.
The Dodd-Frank Act also includes several provisions that could affect our future portfolio funding transactions, if any, including "skin in the game" risk retention requirements applicable to any entity that organizes and initiates an ABS transaction, new disclosure and reporting requirements for each tranche of ABS, including new loan-level data requirements, and new disclosure requirements relating to the representations, warranties and enforcement mechanisms available to ABS investors. The Dodd-Frank Act may have a material impact on our operations, including through increased operating and compliance costs.
In addition, regulators and enforcement officials are taking increasingly expansive positions with respect to whether certain products or product terms may run afoul of state and federal unfair or deceptive acts and practices laws. These and other regulatory changes could result in, among other things, increased compliance costs, more limited lending markets and alterations to our business practices, any of which could have a material adverse effect on our business operations and financial results.
We are subject to regulation as a savings and loan holding company, and Union Federal is regulated extensively.
As a result of our acquisition of Union Federal in November 2006, we became subject to regulation as a savings and loan holding company, and our business is limited to activities that are financial or real-estate related. The OTS has certain types of enforcement authority over us, including the ability in certain circumstances to review and approve changes in management and compensation arrangements, issue additional cease-and-desist orders, force divestiture of Union Federal and impose civil and monetary penalties for violations of federal banking laws and regulations or for unsafe or unsound banking practices. Any such actions could adversely affect our reputation, liquidity or ability to execute our business plan.
In addition, Union Federal is subject to extensive regulation, supervision and examination by the OTS and the FDIC. Such regulation covers all banking business, including activities and investments, lending practices, safeguarding deposits, capitalization, risk management policies and procedures, relationships with affiliated companies, efforts to combat money laundering, recordkeeping and conduct and qualifications of personnel. In particular, the failure to meet minimum capital requirements could
37
initiate certain mandatory, and possibly additional discretionary, actions by regulators that, if undertaken, could have a material adverse effect on our operations and financial statements. We have in the past been required to make capital infusions to Union Federal, and regulatory authorities could require additional capital infusions or take other corrective measures in the future.
There is a risk that we could incur additional costs in complying with regulations applicable to savings and loan holding companies and savings banks, or significant penalties if we fail to comply. Our ability to comply with all applicable laws and rules depends largely on our establishment and maintenance of a system to ensure such compliance, as well as our ability to attract and retain qualified compliance personnel. Further reductions in staffing levels could make it difficult to retain experienced personnel to maintain adequate internal controls related to regulatory matters. If severe failures in internal controls occur, regulatory authorities could impose sanctions on Union Federal or us. We could in the future be subject to additional supervisory orders to cease and desist, civil monetary penalties or other actions due to claimed noncompliance, which could have an adverse effect on our business, financial condition and operating results.
The Dodd-Frank Act eliminates the OTS and replaces it with the OCC as the regulator of federal savings banks, such as Union Federal, and with the Federal Reserve as the regulator of savings and loan holding companies, such as FMD. There is a risk that we could incur additional costs in complying with differing interpretations of these new regulators for savings and loan holding companies and savings banks, or significant penalties if we fail to comply.
We may become subject to state registration or licensing requirements. If we determine that we are subject to the registration or licensing requirements of any jurisdiction, our compliance costs could increase significantly and other adverse consequences may result.
Many states have statutes and regulations that require the licensure of small loan lenders, loan brokers, credit services organizations and loan arrangers. Some of these statutes are drafted or interpreted to cover a broad scope of activities. As of September 2, 2010, our subsidiary FMER has been approved for licenses in Massachusetts, New Jersey, Pennsylvania and Texas. Although we believe that our prior consultations with regulatory counsel and, in some cases state regulators, have identified all material licensing, registration and other regulatory requirements that could be applicable to us based on current laws and the manner in which we currently conduct business, we may be subject to additional state licensing, registration and other regulatory requirements in the future. In particular, certain state licenses or registrations may be required if we divest Union Federal, if we change our operations, if regulators reconsider their prior guidance or if federal or state laws or regulations are changed. In particular, the Dodd-Frank Act weakens federal pre-emption of state regulations currently enjoyed by federal savings associations and their operating subsidiaries, such as Union Federal and its operating subsidiary, FMLOS. Even if we are not physically present in a state, its regulators may take the position that registration or licensing is required because we provide services to borrowers located in the state by mail, telephone, the Internet or other remote means.
Absent a change in federal law, either by judicial interpretation or legislation, including as discussed above, to the extent that our services are conducted through Union Federal, we believe it is less likely that state regulatory requirements affecting loan brokers, small lenders, credit services organizations or loan arrangers will be asserted. However, we are examining strategic alternatives for Union Federal, including a potential sale and, as noted above, the Dodd-Frank Act weakens federal pre-emption of state regulations currently enjoyed by federal savings and loan holding companies and their operating subsidiaries, such as Union Federal and FMLOS. Specifically, the Dodd-Frank Act eliminates for operating subsidiaries of federal banks the pre-emption of state licensing requirements. In addition, we may now be subject to state consumer protection laws in each state where we do business and those laws may be interpreted and enforced differently in different states. We will continue to review state registration and licensing requirements, and we intend to pursue registration or
38
licensing in applicable jurisdictions where we are not currently registered or licensed if we elect to operate through an entity that does not enjoy federal pre-emption. We cannot assure you that we will be successful in obtaining additional state licenses or registrations in a timely manner, or at all. If we determine that additional state registrations or licenses are necessary, we may be required to delay or restructure our activities in a manner that will not subject us to such licensing or registration requirements.
Compliance with state licensing requirements could involve additional costs, which could have a material adverse effect on our business. Our failure to comply with these laws could lead to, among other things:
- •
- curtailment of our ability to continue to conduct business in the relevant jurisdiction, pending a return to compliance or
processing of registration or a license application;
- •
- administrative enforcement actions;
- •
- class action lawsuits;
- •
- the assertion of legal defenses delaying or otherwise affecting the enforcement of loans; and
- •
- criminal as well as civil liability.
Any of the foregoing could have a material adverse effect on our business.
We may be exposed to liability for failures of third parties with which we do business to comply with the registration, licensing and other requirements that apply to them.
Third parties with which we do, or have done, business, including federal and state chartered financial institutions, non-bank loan marketers, as well as TERI, are subject to registration, licensing and extensive governmental regulations, including TILA and other consumer protection laws and regulations. For example, some of the third-party marketers with which we have done or may do business may be subject to state registration or licensing requirements and laws and regulations, including those relating to small loans, loan brokers, credit services organizations and loan arrangers. As a result of the activities that we conduct or may conduct for our clients, it may be asserted that we have some responsibility for compliance by third parties with which we do business with the laws and regulations applicable to them, whether on contractual or other grounds. If it is determined that we have failed to comply with our obligations with respect to these third parties, we could be subject to civil or criminal liability. Even if we bear no legal liability for the actions of these third parties, the imposition of licensing and registration requirements on them, or any sanctions against them for conducting business without a license or registration, may reduce the volume of loans we process from them in the future.
Failure to comply with consumer protection laws could subject us to civil and criminal penalties or litigation, including class actions, and have a material adverse effect on our business.
The federal government and state governments regulate extensively the financial institutions and other entities that originate loans in the private education loan market. These regulations include bankruptcy, tax, usury, disclosure, credit reporting, identity theft, privacy, fraud and abuse and other laws to protect borrowers. Changes in consumer protection laws or related regulations, or in the prevailing interpretations thereof, may expose us to litigation, result in greater compliance costs, constrain the marketing of private education loans, adversely affect the collection of balances due on the loan assets held by securitization trusts or otherwise adversely affect our business. We could incur substantial additional expense complying with these requirements and may be required to create new processes and information systems. Moreover, changes in the consumer protection laws and related regulations, or in the prevailing interpretations thereof, could invalidate or call into question the legality of certain of our services and business practices.
39
The risk of noncompliance with regulatory requirements by our lender clients and their marketing partners has been highlighted by state and federal investigations into education loan marketing practices, particularly the payment of marketing fees directly to schools in exchange for loan referrals. State and federal regulatory authorities have sought information from some of our former clients and us regarding the loan programs we coordinated, and it is possible that some marketing or underwriting practices associated with the programs we coordinated and assets we securitized will be challenged as a result of such investigations. In August 2007, we announced that, as part of the New York Attorney General's ongoing investigation of several lending, educational and nonprofit institutions, we had received a subpoena for information regarding our role in the education loan industry. During fiscal 2008, we worked with the New York Attorney General's office regarding the investigation, and we have not received any further requests for information since May 2008.
The regulatory actions described above have also prompted state and federal legislation that will affect our operations. In August 2009, the Federal Reserve Board issued regulations to implement provisions of the Higher Education Opportunity Act. The regulations revised the number, timing, and content of disclosures required for private education loans by TILA and the Federal Reserve Board's implementing regulation for TILA, Regulation Z. Under the regulations, private education loan creditors are now required to provide disclosures about loan terms and features on or with the loan application and are also required to disclose information about federal education loan programs that may offer less costly alternatives to private education loans. Additional disclosures must be provided when the loan is approved and after loan acceptance but prior to loan disbursement. Compliance with the new regulations became mandatory in February 2010. In addition, in December 2009, the Federal Reserve Board and the FTC announced final rules to implement the risk-based pricing provisions of the Fair and Accurate Credit Transactions Act of 2003. The final rules will generally require that lenders provide disclosures to certain consumers if credit is offered to them on less favorable terms than those offered by the lender to other consumers. Compliance with the disclosure requirements is mandatory as of January 1, 2011.
Violations of the laws or regulations governing our operations, or the operations of our clients, could result in the imposition of civil or criminal penalties, the cancellation of our contracts to provide services or our exclusion from participating in education loan programs. These penalties or exclusions, were they to occur, would negatively impair our business reputation and ability to operate our business. In addition, the loan assets held by securitization trusts that we have structured could be adversely impacted by violation of tax or consumer protection laws. In such event, the value of our residual interests or asset servicing fees could also be adversely impacted. In some cases, such violations may render the loan assets unenforceable.
A recent Supreme Court decision, and recent legislative proposals, could affect the non-dischargeability of private education loans in bankruptcy.
Under current law, private education loans can be discharged in bankruptcy only upon a court finding of "undue hardship" if the borrower were required to continue to make loan payments. The bankruptcy court must hear evidence and make a finding of "undue hardship" in order to discharge the debtor's private education loans. In March 2010, the United States Supreme Court upheld a bankruptcy confirmation order which discharged a debtor's private education loans without a finding of "undue hardship" by the bankruptcy court. Specifically, the debtor's proposed plan, which the bankruptcy court ultimately approved, included a discharge of the debtor's private education loans; however, the bankruptcy court never heard evidence or made a finding of "undue hardship." As a result of the Supreme Court's decision, it may be advisable for us, in performing collections management for the securitization trusts and our clients, to review certain bankruptcy filings that we do not currently review to determine if plans include a discharge of private education loans without the necessary adversary
40
proceeding and a finding of "undue hardship." Such additional review could increase our costs and the complexity of our operations.
In April 2010, legislation was introduced in both the U.S. Senate and the U.S. House of Representatives that would generally end the bankruptcy exemption from dischargeability for all private education loans. If enacted as initially proposed, both bills would apply retroactively to loans already made, and would not require the borrower to make any payments before seeking discharge in bankruptcy. If enacted, these bills could adversely affect the performance of the securitization trusts and the key assumptions we used, including recovery assumptions, to estimate the fair value of our additional structural advisory fees. In addition, these bills, if enacted, may restrict the availability of capital to fund private education loans and may increase loan pricing to borrowers to compensate for the additional risk of bankruptcy discharge, which could adversely affect the competitiveness of our Monogram product and our ability to engage lenders to fund loans based on our Monogram product offering.
In July 2009, legislation was introduced in the U.S. Senate that would allow private education loan borrowers to "swap" their private loan debt for federal unsubsidized Stafford or graduate/professional PLUS debt to the extent that previous Stafford or PLUS loans, as applicable, to such borrowers had not exceeded the aggregate limits established by federal law for such loans. Private education loans made between July 1, 1994 and July 1, 2010 would be eligible for such a swap. Borrowers could not be more than 90 days delinquent on their private education loans in order to qualify. In April 2010, similar debt-swap legislation was introduced in the U.S. House of Representatives. If either bill is enacted, borrowers with loans in the securitization trusts could exchange their private education loans for federal Stafford, PLUS, and/or Direct Consolidation loans. Accordingly, the bill could adversely affect the performance of the securitization trusts and the key assumptions that we have used to estimate the fair value of our additional structural advisory fees.
Recent litigation has sought to re-characterize certain loan marketers and other originators as lenders; if litigation on similar theories were successful against us or any third-party marketer we have worked with in the past, the loans that we facilitate would be subject to individual state consumer protection laws.
All of the lenders with which we work are federally-insured banks and credit unions and, therefore, in most cases, are able to charge the interest rates, fees and other charges available to the most favored lender in their home state. In addition, our lender clients or prospective lender clients may be chartered by the federal government and enjoy pre-emption from enforcement of state consumer protection laws. In providing our private education loan services to our clients, we do not act as a lender, guarantor or loan servicer, and the terms of the loans that we facilitate are regulated in accordance with the laws and regulations applicable to the lenders.
The association between marketers of high-interest "payday" loans, tax-return anticipation loans, or subprime credit cards, and online payment services, on the one hand, and banks, on the other hand, has come under recent scrutiny. Recent litigation asserts that loan marketers use lenders with a bank charter that authorizes the lender to charge the most favored interest rate available in the lender's home state in order to evade usury and interest rate caps, and other consumer protection laws imposed by the states where they do business. Such litigation has sought, successfully in some instances, to re-characterize the loan marketer as the lender for purposes of state consumer protection law restrictions. Similar civil actions have been brought in the context of gift cards. Moreover, federal banking regulators and the Federal Trade Commission have undertaken enforcement actions challenging the activities of certain loan marketers and their bank partners, particularly in the context of subprime credit cards. We believe that our activities, and the activities of third parties whose marketing on behalf of lenders has been coordinated by us, are distinguishable from the activities involved in these cases.
41
Additional state consumer protection laws would be applicable to the loans we facilitate if we, or any third-party loan marketer engaged by us or a bank whose loans we facilitate, were re-characterized as a lender, and the loans (or the provisions governing interest rates, fees and other charges) could be unenforceable unless we or a third-party loan marketer had the requisite licenses or other authority to make such loans. In addition, we could be subject to claims by consumers, as well as enforcement actions by regulators. Even if we were not required to cease doing business with residents of certain states or to change our business practices to comply with applicable laws and regulations, we could be required to register or obtain licenses or regulatory approvals that could impose a substantial cost to us. As of September 2, 2010, there have been no actions taken or threatened against us on the theory that we have engaged in unauthorized lending; however, if such actions occurred, they could have a material adverse effect on our business.
Risks Relating to Ownership of Our Common Stock
The price of our common stock may be volatile.
The trading price of our common stock may fluctuate substantially, depending on many factors, some of which are beyond our control and may not be related to our operating performance. These fluctuations could cause you to lose part or all of your investment in your shares of our common stock. Those factors that could cause fluctuations include, but are not limited to, the following:
- •
- the success of our Monogram product offering or our fee-for-service offerings;
- •
- announcement by us, our competitors or our potential competitors of acquisitions, new products or services, significant
contracts, commercial relationships or capital markets activities;
- •
- actual or anticipated changes in our earnings or fluctuations in our operating results or in the expectations of
securities analysts, including as a result of the timing, size or structure of any portfolio funding transactions;
- •
- difficulties we may encounter in structuring securitizations or alternative financings, including continued disruptions in
the private education loan ABS market or demand for securities offered by trusts that we facilitate, or the loss of opportunities to structure securitization transactions;
- •
- any variance between the actual performance of the securitization trusts and the key assumptions that we have used to
estimate the fair value of our additional structural advisory fees, asset servicing fees, residual receivables and private education loans held for sale, including among others, discount, net default
and prepayment rates;
- •
- general economic conditions and trends, including unemployment rates and economic pressure on consumer asset classes such
as private education loans;
- •
- developments in the TERI Reorganization, including consummation of the Plan of Reorganization and resolution of the
challenges to the trusts' security interests in collateral securing TERI's guaranty obligations;
- •
- legislative initiatives affecting federal or private education loans, including initiatives relating to bankruptcy
dischargeability and the federal budget and regulations implementing the Dodd-Frank Act;
- •
- changes in demand for our product and service offerings or in the education finance marketplace generally;
- •
- negative publicity about the private education loan market generally or us specifically;
- •
- regulatory developments or sanctions directed at Union Federal or us;
- •
- adverse rating agency actions with respect to the securitization trusts that we facilitated;
42
- •
- adoption of ASU 2009-17 and its effects on our reported financial condition and results of operations;
- •
- price and volume fluctuations in the overall stock market and volatility in the ABS market, from time to time;
- •
- significant volatility in the market price and trading volume of financial services and process outsourcing companies;
- •
- major catastrophic events;
- •
- purchases or sales of large blocks of our common stock or other strategic investments involving us; or
- •
- departures or long-term unavailability of key personnel, including our Chief Executive Officer, who we believe has unique insights and experience at this point of change in our business and the private education loan industry.
In the past, following periods of volatility in the market price of a company's securities, securities class action litigation has often been brought against that company. We have in the past been the target of securities litigation. Any future litigation could result in substantial costs and divert management's attention and resources from our business.
Insiders have substantial control over us and could limit your ability to influence the outcome of key transactions, including a change of control.
Our directors and executive officers, and entities affiliated with them, owned approximately 22% of the outstanding shares of our common stock as of June 30, 2010, excluding shares issuable upon vesting of outstanding restricted stock units, shares issuable upon exercise of outstanding vested and unvested stock options and shares of preferred stock held by affiliates of GS Capital Partners, or GSCP, convertible into 8,846,733 additional shares of our common stock. Affiliates of GSCP have agreed not to convert shares of preferred stock if, after giving effect to any such conversion, they and their affiliates would own more than 9.9% of our outstanding shares of common stock. Approximately 5,138,803 additional shares of common stock could be issued to affiliates of GSCP upon conversion of shares of preferred stock before they and their affiliates would own more than 9.9% of our outstanding shares of common stock. These stockholders, if acting together, could substantially influence matters requiring approval by our stockholders, including the election of directors and the approval of mergers or other extraordinary transactions. They may also have interests that differ from yours and may vote in a way with which you disagree and which may be adverse to your interests. The concentration of ownership may have the effect of delaying, preventing or deterring a change of control of our company, could deprive our stockholders of an opportunity to receive a premium for their common stock as part of a sale of our company and might ultimately affect the market price of our common stock.
Some provisions in our restated certificate of incorporation and amended and restated by-laws may deter third-parties from acquiring us.
Our restated certificate of incorporation and amended and restated by-laws contain provisions that may make the acquisition of our company more difficult without the approval of our Board of Directors, including the following:
- •
- only our Board of Directors, our Chairman of the Board or our President may call special meetings of our stockholders;
- •
- our stockholders may take action only at a meeting of our stockholders and not by written consent;
43
- •
- we have authorized undesignated preferred stock, the terms of which may be established and shares of which may be issued
without stockholder approval;
- •
- our directors may be removed only for cause by the affirmative vote of a majority of the directors present at a meeting
duly held at which a quorum is present, or by the holders of 75% of the votes that all stockholders would be entitled to cast in the election of directors; and
- •
- we impose advance notice requirements for stockholder proposals.
These anti-takeover defenses could discourage, delay or prevent a transaction involving a change in control of our company. These provisions could also discourage proxy contests and make it more difficult for you and other stockholders to elect directors of your choosing or cause us to take other corporate actions you desire.
Section 203 of the Delaware General Corporation Law may delay, defer or prevent a change in control that our stockholders might consider to be in their best interests.
We are subject to Section 203 of the Delaware General Corporation Law which, subject to certain exceptions, prohibits "business combinations" between a Delaware corporation and an "interested stockholder," which is generally defined as a stockholder who becomes a beneficial owner of 15% or more of a Delaware corporation's voting stock, for a three-year period following the date that such stockholder became an interested stockholder. Section 203 could have the effect of delaying, deferring or preventing a change in control that our stockholders might consider to be in their best interests.
Item 1B. Unresolved Staff Comments
None.
We lease buildings for our executive offices and operations. Our headquarters are located in Boston, Massachusetts, and we have additional offices in Medford, Massachusetts and North Providence, Rhode Island. The following table summarizes information as of September 2, 2010 with respect to the principal facilities that we lease:
Location
|
Principal activities | Area (sq. feet) |
Lease expiration date |
||||||
|---|---|---|---|---|---|---|---|---|---|
Boston, MA (Boylston Street) |
Headquarters | 51,972 | 2014 | ||||||
Medford, MA |
Loan processing | 153,156 | 2012 | ||||||
North Providence, RI |
Union Federal | 13,064 | 2011 | ||||||
In addition, we have leased 135,719 square feet of office space in Boston, Massachusetts pursuant to a lease with a term expiring in 2014. As of September 2, 2010, we do not occupy such office space, of which we have subleased 89,799 square feet.
We do not anticipate significant difficulty in obtaining lease renewals or alternate space as needed. As of September 2, 2010, we were in discussions to amend the lease relating to our Medford, Massachusetts location to, among other things, reduce the rented space by approximately 60,000 square feet by April 1, 2011 and extend the term of the lease to March 31, 2017.
We are involved from time to time in routine legal proceedings occurring in the ordinary course of business. In the opinion of management, there are no matters outstanding that would have a material adverse impact to our operations or financial condition.
Item 4. (Removed and Reserved).
44
Item 5. Market for Registrant's Common Equity, Related Stockholder Matters and Issuer Purchases of Equity Securities
Market Information and Holders
Our common stock is listed on the New York Stock Exchange under the trading symbol FMD. The following table sets forth the high and low sales prices of our common stock, as reported by the New York Stock Exchange of our common stock, for each quarterly period within our two most recent fiscal years. We did not declare dividends on our common stock in fiscal 2010 or fiscal 2009.
| |
High | Low | |||||
|---|---|---|---|---|---|---|---|
Fiscal 2010 |
|||||||
First Quarter |
$ | 2.93 | $ | 1.65 | |||
Second Quarter |
2.44 | 1.85 | |||||
Third Quarter |
3.21 | 2.07 | |||||
Fourth Quarter |
4.08 | 2.35 | |||||
Fiscal 2009 |
|||||||
First Quarter |
$ | 5.14 | $ | 1.65 | |||
Second Quarter |
2.85 | 0.58 | |||||
Third Quarter |
1.68 | 0.71 | |||||
Fourth Quarter |
2.71 | 1.23 | |||||
Computershare Trust Company, N.A. is the transfer agent and registrar for our common stock. As of the close of business on September 1, 2010, we had 78 holders of record of our common stock. This number does not include stockholders for whom shares are held in "street" or nominee name.
45
Performance Graph
The following graph compares the cumulative five-year total return attained by stockholders on our common stock relative to the cumulative total returns of the Dow Jones U.S. index and the Dow Jones U.S. Financial Services index. The graph tracks the performance of a $100 investment in our common stock and in each of the indices (with the reinvestment of all dividends) from June 30, 2005 to June 30, 2010.
COMPARISON OF FIVE YEAR CUMULATIVE TOTAL RETURN*
Among The First Marblehead Corporation, the Dow Jones U.S. Index
and the Dow Jones U.S. Financial Services Index
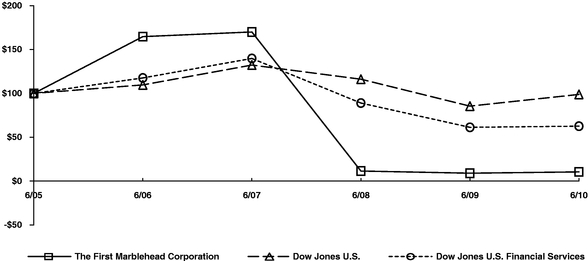
© 2010 Dow Jones & Co. All rights reserved.
- *
- $100 invested on June 30, 2005 in stock or index, including reinvestment of dividends.
The information included under the heading "Performance Graph" is "furnished" and not "filed" for purposes of Section 18 of the Exchange Act, or otherwise subject to the liabilities of that section, nor shall it be deemed to be "soliciting material" subject to Regulation 14A or incorporated by reference in any filing under the Securities Act or the Exchange Act.
Dividends
We did not declare any dividends during fiscal 2010 or fiscal 2009, and we do not expect to declare any dividends in the foreseeable future. Any decision to pay future dividends will be made by our Board of Directors and will depend upon applicable regulatory approvals and our earnings, financial condition, capital and regulatory requirements and such other factors as our Board of Directors deems relevant. In connection with the termination of the Supervisory Agreement, our Board of Directors adopted resolutions requiring FMD to notify the OTS in advance of any distributions to our stockholders in excess of $1.0 million in any fiscal quarter.
46
Issuer Purchases of Equity Securities
In April 2007, our Board of Directors authorized the repurchase of up to 10,000,000 shares of our common stock. The 10,000,000 shares authorized for repurchase included approximately 3,393,300 shares that remained available for repurchase under a previously authorized repurchase program. As of June 30, 2010, we had repurchased an aggregate of 1,169,100 shares under this program at an average price, excluding commissions, of $36.17 per share. We did not repurchase any shares of common stock pursuant to this program in fiscal 2010 or fiscal 2009. Future repurchases pursuant to this program may require regulatory approval.
During fiscal 2010, 596,582 shares were retained by us upon the vesting of employee restricted stock units in order to satisfy the applicable statutory minimum tax withholding obligations in connection with such vesting.
47
Item 6. Selected Financial Data
The following selected consolidated financial data should be read in conjunction with our consolidated financial statements and related notes included in Item 8 of this annual report, and "Management's Discussion and Analysis of Financial Condition and Results of Operations" included in Item 7 of this annual report. We have derived the data from consolidated financial statements, which were audited by KPMG LLP, an independent registered public accounting firm. The historical results presented here are not necessarily indicative of future results.
| |
Fiscal years ended June 30, | ||||||||||||||||||
|---|---|---|---|---|---|---|---|---|---|---|---|---|---|---|---|---|---|---|---|
| |
2010 | 2009 | 2008 | 2007 | 2006 | ||||||||||||||
| |
(dollars and shares in thousands, except per share data) |
||||||||||||||||||
Consolidated Statements of Income Data: |
|||||||||||||||||||
Service revenues: |
|||||||||||||||||||
Additional structural advisory fees: |
|||||||||||||||||||
Trust updates |
$ | (19,825 | ) | $ | (57,157 | ) | $ | (44,106 | ) | $ | 1,363 | $ | 1,241 | ||||||
New securitizations |
— | — | 24,304 | 43,984 | 33,685 | ||||||||||||||
Up-front structural advisory fees |
— | — | 179,106 | 457,352 | 208,178 | ||||||||||||||
Total structural advisory fees |
(19,825 | ) | (57,157 | ) | 159,304 | 502,699 | 243,104 | ||||||||||||
Asset servicing fees: |
|||||||||||||||||||
Fee income |
6,901 | 2,350 | — | — | — | ||||||||||||||
Fee updates |
(3,506 | ) | 35 | — | — | — | |||||||||||||
Total asset servicing fees |
3,395 | 2,385 | — | — | — | ||||||||||||||
Residuals: |
|||||||||||||||||||
Trust updates |
2,863 | (283,295 | ) | (488,832 | ) | 29,548 | 28,239 | ||||||||||||
New securitizations |
— | — | 116,972 | 182,744 | 177,309 | ||||||||||||||
Total residuals |
2,863 | (283,295 | ) | (371,860 | ) | 212,292 | 205,548 | ||||||||||||
Administrative and other fees |
19,967 | 22,958 | 158,525 | 156,342 | 114,920 | ||||||||||||||
Total service revenues |
6,400 | (315,109 | ) | (54,031 | ) | 871,333 | 563,572 | ||||||||||||
Net interest income |
9,871 | 25,103 | 25,622 | 9,371 | 5,463 | ||||||||||||||
Total revenues |
16,271 | (290,006 | ) | (28,409 | ) | 880,704 | 569,035 | ||||||||||||
Non-interest expenses: |
|||||||||||||||||||
Compensation and benefits |
43,096 | 42,232 | 96,735 | 111,364 | 89,214 | ||||||||||||||
General and administrative expenses |
58,064 | 80,438 | 254,439 | 141,591 | 98,593 | ||||||||||||||
Losses on education loans held for sale |
130,955 | 138,163 | 7,373 | — | — | ||||||||||||||
Total non-interest expenses |
232,115 | 260,833 | 358,547 | 252,955 | 187,807 | ||||||||||||||
Income (loss) from operations |
(215,844 | ) | (550,839 | ) | (386,956 | ) | 627,749 | 381,228 | |||||||||||
Other income |
— | — | — | 16 | 2,526 | ||||||||||||||
Income (loss) before income taxes |
(215,844 | ) | (550,839 | ) | (386,956 | ) | 627,765 | 383,754 | |||||||||||
Income tax expense (benefit) |
(70,320 | ) | (187,819 | ) | (151,880 | ) | 256,434 | 147,794 | |||||||||||
Net income (loss) |
$ | (145,524 | ) | $ | (363,020 | ) | $ | (235,076 | ) | $ | 371,331 | $ | 235,960 | ||||||
Net income (loss) per common share: |
|||||||||||||||||||
Basic |
$ | (1.46 | ) | $ | (3.66 | ) | $ | (2.46 | ) | $ | 3.94 | $ | 2.47 | ||||||
Diluted |
(1.46 | ) | (3.66 | ) | (2.46 | ) | 3.92 | 2.45 | |||||||||||
Cash dividends declared per share |
— | — | 0.395 | 0.62 | 0.32 | ||||||||||||||
Weighted average shares outstanding: |
|||||||||||||||||||
Basic |
99,537 | 99,081 | 95,732 | 94,296 | 95,366 | ||||||||||||||
Diluted |
99,537 | 99,081 | 95,732 | 94,845 | 96,258 | ||||||||||||||
48
| |
June 30, | |||||||||||||||
|---|---|---|---|---|---|---|---|---|---|---|---|---|---|---|---|---|
| |
2010 | 2009 | 2008 | 2007 | 2006 | |||||||||||
| |
(dollars in thousands) |
|||||||||||||||
Consolidated Balance Sheet Data: |
||||||||||||||||
Cash and cash equivalents |
$ | 330,073 | $ | 158,770 | $ | 70,280 | $ | 95,937 | $ | 75,711 | ||||||
Federal funds sold |
2,000 | 14,326 | 80,215 | 10,334 | — | |||||||||||
Short-term investments, at cost |
50,000 | — | — | — | — | |||||||||||
Investments held for sale, at fair value |
4,471 | 8,450 | 70,629 | 128,650 | 67,250 | |||||||||||
Education loans held for sale |
107,434 | 350,960 | 497,324 | 24,463 | — | |||||||||||
Service receivables |
53,279 | 67,475 | 407,097 | 798,759 | 541,120 | |||||||||||
Income taxes receivable |
17,560 | 166,410 | — | 49,345 | 11,649 | |||||||||||
Total assets |
633,370 | 821,330 | 1,200,898 | 1,214,463 | 770,346 | |||||||||||
Deposits |
108,732 | 154,462 | 244,113 | 53,523 | — | |||||||||||
Education loan warehouse facility |
218,059 | 230,137 | 242,899 | — | — | |||||||||||
Total liabilities |
363,555 | 415,865 | 563,286 | 371,843 | 194,177 | |||||||||||
Total stockholders' equity |
269,815 | 405,465 | 637,612 | 842,620 | 576,169 | |||||||||||
Item 7. Management's Discussion and Analysis of Financial Condition and Results of Operations
You should read the following discussion and analysis of our financial condition and results of operations together with our "Selected Financial Data" included in Item 6 of this annual report and "Financial Statements and Supplementary Data" included in Item 8 of this annual report. In addition to historical information, this discussion of financial condition and results of operations contains certain forward-looking statements that involve risks and uncertainties. Our actual results could differ materially from those expressed or implied by the forward-looking statements due to applications of our critical accounting policies and factors including, but not limited to, those set forth under the caption "Risk Factors" included in Item 1A of this annual report.
Executive Summary
Overview
We offer outsourcing services to national and regional financial and educational institutions for designing and implementing private education loan programs. These school-certified loan programs are designed to be marketed through educational institutions or to prospective student borrowers and their families directly. The private education loan portfolios generated by these loan programs may be held by the originating lender or financed in the capital markets. In addition, we provide administrative and other services to securitization trusts that we facilitated, asset servicing to the third-party owner of certain securitization trusts as well as portfolio management services.
We offer clients the opportunity to outsource key components of their private education loan programs to us by providing a fully integrated suite of services, including our Monogram product offering. We offer the following services on a stand-alone, fee-for-service basis or as an integrated part of our Monogram product offering:
- •
- Loan origination—We provide loan processing services to
schools and lenders, from application intake through loan disbursement. We are able to customize our services to meet the specific branding, pricing and underwriting requirements of our clients.
- •
- Portfolio management—We manage private education loan portfolios on behalf of their owners, including trusts facilitated by us, by employing risk analytics to monitor and manage the performance of the portfolio over time. As part of this service offering, we monitor portfolio performance metrics, manage the performance of third-party vendors and interface with rating
49
- •
- Trust administration—As administrator for securitization
trusts that we facilitated, we perform various administrative functions, including preparation of financial statements, monitoring of the performance of loan servicers and third-party collection
agencies, including ensuring compliance with the servicing guidelines and various other transaction agreements and overseeing default prevention and collections activities. We are responsible for
reconciliation of funds among the third parties and the trusts, and we also provide regular reporting to investors in the ABS issued by the trusts and other parties related to the trusts.
- •
- Asset Servicing—Our experience enables us to offer asset servicing such as residual analysis and valuation optimization services and strategies relating to asset funding to holders of a residual interest in private education loan securitizations.
agencies. Our infrastructure provides us with data that enables comprehensive analytics, and we are able to customize collections strategies as needed to optimize loan performance.
Our subsidiary, Union Federal, is a federally chartered thrift that offers residential and commercial mortgage loans and retail savings, money market and time deposit products. Prior to 2009, Union Federal also offered private education loans directly to consumers; however, Union Federal did not originate private education loans during fiscal 2009 or fiscal 2010, and as of September 2, 2010, we do not expect Union Federal to offer private education loans during fiscal 2011. We have begun exploring strategic alternatives for Union Federal, including a potential sale.
Substantially all of our financial results have been derived from services provided with respect to private education loans, which we consider to be a single industry segment for financial reporting purposes.
Our Monogram product encompasses some or all of our service offerings and enables a lender to customize its loan program to meet its risk control and return objectives. Specifically, the lender can customize the range of loan terms offered to its qualified applicants, such as borrower repayment options, repayment terms and borrower pricing. Our Monogram product is based on our proprietary origination risk score model, which uses borrower and cosigner attributes, as well as distribution channel variables, to assign a specific level of credit risk to the application at the time of initial credit decisioning. A score is assigned to each application and governs the loan terms and features offered to applicants who pass the credit review. For example, higher risk applicants may not be eligible to defer principal and interest while in school. Our online application also provides a qualified applicant with some ability to configure loan terms, showing the financial effects of the choices using a real-time repayment calculator. Our Monogram product can be structured so that lenders can hold the loans through the scheduled repayment, prepayment or default, or for some limited period of time before disposing of the loans in a capital markets transaction. We believe that the loans generated through our Monogram product will generally have shorter repayment periods and an increased percentage of borrowers making payments while in school, in each case when compared to loans generated under programs that we previously facilitated, and high cosigner participation rates. The success of our Monogram product will be a key driver of our future financial results and will be critical to growing and diversifying our revenues and client base. Development of our Monogram product was completed in August 2009, and the first loans based on our Monogram product offering were disbursed during the first quarter of fiscal 2011. In connection with the two initial Monogram-based loan programs, we agreed to provide credit enhancement to each of the lenders by funding a Participation Account, up to a specified dollar limit, to serve as a first-loss reserve for defaulted program loans. We will or have already provided an initial deposit into the Participation Accounts and have agreed to provide supplementary deposits into such accounts on a quarterly basis during the term of the loan program agreements based on disbursed loan volume and adjustments to default projections for program loans. As consideration for the credit enhancement, we are entitled to receive a share of the interest
50
generated on the loans. As of September 2, 2010, we have funded capital commitments in the amount of $7.4 million in support of SunTrust Bank's Monogram-based program.
Historically, the driver of our results of operations and financial condition was the volume of private education loans for which we provided outsourcing services from loan origination through securitization. In addition, asset-backed securitizations were our sole source of permanent financing for our clients' private education loan programs, and substantially all of our income was derived from securitizations. Securitization refers to the technique of pooling loans and selling them to a special purpose entity, typically a trust, which issues notes backed by those loans to investors. In the past, we offered our clients a fully integrated suite of outsourcing services, but we did not charge separate fees for many of those services. Although we provided those various services without charging a separate fee, or at "cost" in the case of loan processing services, we generally entered into agreements with the lender clients giving us the exclusive right to securitize the private education loans that they did not intend to hold. For our past securitization services, we are entitled to receive additional structural advisory fees from the trusts over time and, in the case of certain trusts, residual cash flows.
Business Trends and Uncertainties
We have not accessed the securitization market since September 2007 as a result of market disruptions that began in the second quarter of fiscal 2008 and, to a lesser extent, persisted as of September 2, 2010. General economic conditions in the United States have deteriorated and not fully recovered over this time period. Our business has been and continues to be materially adversely impacted by these conditions.
Credit performance of consumer related loans generally, as well as our private education loan portfolios and those held by the various securitization trusts that we facilitated, continued to be adversely affected by general economic conditions, including high unemployment rates. The interest rate and economic and credit environments may continue to have a material negative effect on the estimated value of our service receivables and private education loans held for sale, which at June 30, 2010, primarily consisted of a portfolio of private education loans held by our subsidiary, UFSB-SPV, and pledged to a third party conduit lender pursuant to an education loan warehouse facility. See Note 10, "Liabilities and Unused Lines of Credit—Education Loan Warehouse Facility," in the notes to our consolidated financial statements included in Item 8 of this annual report for additional information.
Our private education loan portfolios and those of the NCSLT Trusts have experienced higher levels of defaults and lower levels of repayments than we originally projected. As a result, we significantly adjusted our projected performance assumptions associated with the NCSLT Trusts during fiscal 2010 and fiscal 2009, including significant increases in our assumed default rates. During fiscal 2010, prepayment rates, however, remained at a rate that is extremely low by historical standards. During fiscal 2010, credit rating agencies took negative rating actions with respect to certain securitizations that we facilitated, citing ongoing performance deterioration, higher than expected levels of delinquencies and defaults, the expected reprioritization to senior noteholders of subordinate ABS cash flows, declines in parity levels, reductions in available credit support for the transactions and interest trigger events that resulted in an interest shortfall to certain classes of notes. These events have resulted in net reductions in the fair value of our additional structural advisory fees, asset servicing fees and residual receivables.
We recorded net losses of $17.0 million during fiscal 2010 and $340.5 million during fiscal 2009 as a result of trust updates to our additional structural advisory fee and residual receivables. We also recorded losses of $131.0 million during fiscal 2010 and $138.2 million during fiscal 2009 in connection with fair value adjustments and realized losses on sales of portfolios of private education loans held for sale.
51
In addition, our lender clients previously had the opportunity to mitigate their credit risk through a loan repayment guaranty by TERI, and we historically received reimbursement from TERI for outsourced loan processing services we performed on TERI's behalf. In April 2008, TERI filed a voluntary petition for relief under Chapter 11 of the Bankruptcy Code. As a result of the TERI Reorganization, many clients elected to terminate some or all of their agreements with us, which resulted in a significant reduction in our facilitated loan volumes during fiscal 2009 and fiscal 2010 as compared to prior fiscal years. The TERI Reorganization, together with capital markets dislocations, has had, and will likely continue to have, a material adverse effect on the securitization trusts' ability to realize guaranty obligations of TERI and our ability to realize fully the cost reimbursement obligations of TERI.
As a result of economic conditions, we took several measures in fiscal 2010 and fiscal 2009 to adjust our business model:
- •
- We improved our liquidity position in August 2008, when we received $132.7 million in gross proceeds from an equity
financing.
- •
- We greatly reduced our annual cash expenditure requirements through reductions in headcount, consolidation of office space
and other cost saving initiatives that began in fiscal 2008 and continued through fiscal 2010.
- •
- During fiscal 2009, we made significant changes in our senior management team.
- •
- Effective March 31, 2009, we sold the Trust Certificate. The sale of the Trust Certificate combined with operating
losses in fiscal 2009 resulted in refunds from tax authorities of $176.6 million, received in October 2009. In addition, the purchaser of the Trust Certificate agreed to bear all future federal
and state tax liabilities associated with the NCSLT Trust residuals, which would have had a material negative effect on our financial condition and liquidity. We are no longer entitled to the residual
cash flows of the NCSLT Trusts, although we continue to be entitled to receive residuals from other trusts.
- •
- During fiscal 2009, we designed our Monogram product, including the development and validation of our proprietary
origination risk score model, product pricing, an enhanced application interface and additional disbursement and reporting capabilities. We completed this development in August 2009. Our Monogram
product was designed in part to provide us with fee-based income as our services are provided, reducing our dependence on the securitization market in order to generate revenue. We expect
to earn monthly service fees, as well as a share of the portfolio income generated over the life of the loans.
- •
- In October 2009, we sold approximately 88% of the private education loan portfolio held by Union Federal as part of a risk
reduction plan required by our Supervisory Agreement with the OTS. This sale resulted in gross proceeds of $121.6 million. In November 2009, we sold the remainder of Union Federal's private
education loan portfolio to one of our non-bank subsidiaries.
- •
- In April 2010, we restructured UFSB-SPV's education loan warehouse facility. As part of the restructuring,
ownership of UFSB-SPV was transferred from Union Federal to one of our non-bank subsidiaries, FMD succeeded Union Federal as master servicer under the facility and FMD assumed
certain potential contingent liabilities of Union Federal under the facility, subject to a cap.
- •
- We continue to examine alternatives with respect to Union Federal, including a potential sale, which we believe would provide further liquidity. We believe that the termination by the OTS of the Order and Supervisory Agreement during the third quarter of fiscal 2010 and the elimination of Union Federal's ongoing duties and potential contingent liabilities related to UFSB-SPV's education loan warehouse facility will be viewed favorably by potential purchasers as we consider our strategic alternatives with respect to Union Federal.
52
We remain focused on preserving capital and maximizing liquidity in these challenging market conditions. Changes in any of the following factors could materially affect our financial results:
- •
- the level of market acceptance of our Monogram product and our fee-for-service offerings;
- •
- demand for private education financing, which may be affected by changes in limitations established by the federal
government on the amount of federal loans that a student can receive, the terms and eligibility criteria for loans and grants under the federal government's programs and legislation recently passed or
under consideration as of September 2, 2010;
- •
- competition for providing private education financing and reluctance by lenders to participate in the private education
loan market;
- •
- conditions in the private education loan securitization market, including the costs or availability of financing, rating
agency assumptions or actions, and market receptivity to private education loan asset-backed securitizations;
- •
- regulatory requirements applicable to Union Federal and us;
- •
- general interest rate and consumer credit environments, including their effect on our assumed discount rate, net default
and prepayment rates, the forward LIBOR curve and the trusts' ability to recover principal and interest from borrowers;
- •
- our critical accounting policies and estimates;
- •
- challenges relating to the federal income tax treatment of the sale of the Trust Certificate or our Asset Services
Agreement with the purchaser of the Trust Certificate, including proceedings related to any tax refund previously received;
- •
- changes in GAAP which could impact the carrying value of assets and liabilities, as well as require the consolidation or
deconsolidation of certain variable interest entities, particularly following our consolidation of 14 securitization trusts, and an associated net increase in total assets and liabilities of
approximately $8.0 billion and $8.8 billion, respectively, effective July 1, 2010, as further discussed below;
- •
- applicable laws and regulations, which may affect the terms upon which lenders agree to make private education loans,
recovery rates on defaulted private education loans and the cost and complexity of our loan facilitation operations; and
- •
- developments in connection with the TERI Reorganization, including the consummation of the Modified Plan of Reorganization proposed by TERI and the Creditors Committee in August 2010 or the terms of a successor plan of reorganization.
We have made substantial progress in improving our financial condition and liquidity since the beginning of fiscal 2009. At June 30, 2008, we had $140.9 million of cash, cash equivalents and investments. Compensation and benefits expense during fiscal 2008 was $96.7 million, and our product offering was dependent on securitization markets that we could not access and a bankrupt third-party guarantor. In addition, we were at the time confronting significant future tax liabilities on income from the NCSLT Trusts prior to our receipt of cash from these trusts, and had at June 30, 2008 private education loans held for sale with a principal and interest balance of $504.7 million. In contrast, we ended fiscal 2010 with $384.5 million of cash, cash equivalents and investments. Compensation and benefits expense during fiscal 2010 was $43.1 million, and our Monogram product offering had been designed and successfully sold to two lender clients. We believe that we have eliminated our future tax liabilities relating to income from the NCSLT Trusts, and we have reduced the outstanding principal and interest balance of private education loans held for sale to $273.4 million at June 30, 2010. In addition, we successfully defended securities class action litigation and resolved formal enforcement actions initiated by the OTS.
53
Although we have limited experience with our Monogram product, we believe that it will provide us with an opportunity to structure, process and originate private education loans and that our two recent loan program agreements are a significant step in our return to the private education lending marketplace.
We also believe that conditions in capital markets generally continued to improve during fiscal 2010, potentially creating additional flexibility with regard to the financing of private education loans. We continue to believe, as of September 2, 2010, however, that the structure and economics of any near-term financing transaction would be less favorable than our past securitizations, with possibly lower revenues and additional cash requirements on our part.
During fiscal 2011, we expect to continue to press for resolution of our claims against TERI in the context of the TERI Reorganization, explore strategic alternatives for Union Federal, cultivate additional lender clients for our Monogram product and seek innovative and efficient portfolio funding transactions.
Application of Critical Accounting Policies and Estimates
Our consolidated financial statements have been prepared in accordance with GAAP. The preparation of these financial statements requires us to make estimates, assumptions and judgments that affect the reported amounts of assets and liabilities and the reported amounts of income and expenses during the reporting periods. We base our estimates, assumptions and judgments on historical experience and on various other factors that we believe are reasonable under the circumstances. Actual results may differ from these estimates under varying assumptions or conditions.
Our significant accounting policies are more fully described in Note 2, "Significant Accounting Policies," in the notes to our consolidated financial statements included in Item 8 of this annual report. On an ongoing basis, we evaluate our estimates and judgments, particularly as they relate to accounting policies that we believe are most important to the portrayal of our financial condition and results of operations, such as those involving recognition of service revenues and the valuation of our service receivables and portfolio of private education loans held for sale. We regard an accounting estimate or assumption underlying our financial statements to be a "critical accounting estimate" where:
- •
- the nature of the estimate or assumption is material due to the level of subjectivity and judgment necessary to account
for highly uncertain matters or the susceptibility of such matters to change; and
- •
- the impact of the estimates and assumptions on our financial condition or operating performance is material.
We have discussed our accounting policies with the Audit Committee of our Board of Directors, and we expect to make changes to our critical accounting policies during the first quarter of fiscal 2011 as a result of our adoption of certain accounting pronouncements. See "—Consolidation" below for additional information. As of June 30, 2010, we determined that our estimates relating to the recognition and valuation of our securitization-related revenues and receivables and asset servicing revenue and receivables, as described below, fit the definition of critical accounting estimates. As of June 30, 2010, we also considered our policy with respect to the determination of whether or not to consolidate the financial results of the securitization trusts that we facilitate and the valuation of the portfolios of private education loans held for sale to be critical accounting policies.
Service Receivables and Related Revenue
We have historically structured and facilitated securitization transactions for our clients through a series of special purpose statutory trusts. Through the securitization process, the trusts obtained private education loans from the originating lenders or their assignees, which relinquished to the trust their
54
ownership interest in the loans. The debt instruments that the trusts issued to finance the purchase of these private education loans are obligations of the trusts, rather than our obligations or those of originating lenders or their assignees. We have recognized several types of fees in connection with our past securitization services:
- •
- Additional structural advisory fees. We are entitled to
receive a structural advisory fee over the life of the trust, based on the amount of loans outstanding in the trust from time to time.
- •
- Residuals. We also have the right to receive a portion of
the residual interests, if any, generated by various securitization trusts other than the NCSLT Trusts. This right is junior in priority to the rights of the holders of the debt sold in the
securitizations and additional structural advisory fees.
- •
- Up-front structural advisory fees. We received a structural advisory fee at the time of our previous securitizations, based on the volume of loans securitized.
We are entitled to receive asset servicing fees from the owner of the Trust Certificate for services that we provide on an ongoing basis. Receipt of these fees is contingent upon distributions available to the owners of the residual interests of such trusts.
As required under GAAP, we recognize the fair value of additional structural advisory fees and residuals as revenue at the time the securitization trust purchases the private education loans, as they are deemed to be earned at the time of the securitization but before we actually receive payment. These amounts are deemed earned because evidence of an arrangement exists, we have provided the services, the fee is fixed and determinable based upon a discounted cash flow analysis and there are no future contingencies or obligations due on our part. On a quarterly basis, as required under GAAP, we update our estimate of the fair value of these receivables as if they are investments in securities classified as trading, similar to retained interests in securitizations. We recognize changes in fair value, less cash received, if any, as trust updates in servicing revenue in the period in which the change in estimate occurs.
We earn asset servicing fees as the services are performed; however, the receipt of the fees is contingent on distributions available to the owners of the residual interests of the trusts subject to these services. We estimate the fair value of our asset servicing fee receivable based on income earned to date and the expected timing of the cash receipts of such income. The net present value of fees earned for services performed during the period is recognized in revenue as fee income and changes in the estimated fair value of the receivable are recognized in revenue as fee updates.
Because there are no quoted market prices for our additional structural advisory fees, asset servicing fees or residual receivables, we use discounted cash flow modeling techniques and the following key assumptions to estimate fair value:
- •
- expected annual rate and timing of loan defaults, including the effects of various risk mitigation strategies and
temporarily modified payment plans for borrowers;
- •
- expected amount and timing of recoveries of defaulted loans;
- •
- discount rate, which we use to calculate the present value of our future cash flows;
- •
- trend of interest rates over the life of the loan pool, including the forward LIBOR curve and expected auction rates, if
applicable;
- •
- annual rate and timing of private education loan prepayments;
- •
- results of the TERI Reorganization and anticipated settlement of claims; and
- •
- fees and expenses of the securitization trusts.
55
We base our estimates on historical data, certain macroeconomic indicators, publicly available third-party data and our industry experience adjusted for specific product and borrower characteristics such as loan type and borrower creditworthiness. We monitor trends in loan performance over time and make adjustments we believe are necessary to value properly our receivable balances and private education loans at each balance sheet date. Management's ability to determine which factors should be more heavily weighted in our estimates, and our ability to accurately incorporate those factors into our loan performance assumptions, can have a material effect on our valuations.
At June 30, 2010 and 2009, additional structural advisory fee receivables were primarily due from the NCSLT Trusts. At June 30, 2010 and 2009, the aggregate outstanding principal balance of the debt issued by the NCSLT Trusts was $12.10 billion and $12.77 billion, respectively. The principal underlying assets in the NCSLT Trusts were TERI-guaranteed private education loans with an aggregate outstanding principal and interest balance of $10.48 billion, of which $2.42 billion in outstanding principal and interest, or 23.2%, were in deferment, $495.2 million in outstanding principal and interest, or 4.7%, were in forbearance and $7.56 billion in outstanding principal and interest, or 72.1%, were in repayment status as of June 30, 2010. In accordance with previously established servicer guidelines, certain borrowers have utilized a modified graduated payment program which permitted such borrowers to make payments that, for two years, were less than original contractual amounts due, then reset to require full repayment in accordance with original contractual interest rates and maturity dates. During fiscal 2009 and fiscal 2010, the average outstanding aggregate principal and interest balance of loans entering this program was 26% of the average outstanding aggregate principal and interest balance of loans then in repayment. Outstanding principal and interest in the amount of $6.89 billion, or 91.2%, of the loans in repayment status as of June 30, 2010 were current, $345.6 million in outstanding principal and interest, or 4.5%, were between 31 and 90 days past due, $177.0 million in outstanding principal and interest, or 2.3%, were between 91 and 180 days past due, and $154.0 million in outstanding principal and interest, or 2.0%, were greater than 180 days past due. The payment status of borrowers, including borrowers making payments pursuant to a modified graduated payment program, is determined by contractual due dates. As of June 30, 2010, the cumulative gross default rate with regard to loans in, and loans that have previously been in, repayment status in the NCSLT Trusts was 14.5%. We have posted to our website, www.firstmarblehead.com, and filed as exhibit 99.1 to this annual report, static pool data as of June 30, 2010, including original pool characteristics and borrower payment status, delinquency, cumulative loss and prepayment data as of June 30, 2010 for certain securitization trusts that we facilitated. We have also posted to our website, and filed as exhibit 99.2 to this annual report, a supplemental presentation of certain historical trust performance data, including parity ratios by trust, net recovery rates by year of default, six-month rolling prepayment rates, payment status by trust and payment status by risk segment.
Default, Recovery and Prepayment Rates.
Default, recovery and prepayment rates are defined as follows:
- •
- Default rates are the estimated cumulative principal balance of defaulted loans over the life of a trust divided by the
original principal balance of the loans;
- •
- Recovery rates are the estimated net cumulative amount of recoveries (reduced by costs of recovery) on defaulted loans
over the life of the trust; and
- •
- Prepayments are the difference between the total amount of payments, both principal and interest, received from or on behalf of a borrower and the amount of principal and interest billed to the borrower during the same period.
Prior to the third quarter of fiscal 2010, our assumptions for default, recovery and prepayment rates relied primarily on historical data, updated in the short-term for differences between projected results and actual results. We evaluate our modeling methodologies on an ongoing basis, and during
56
fiscal 2010, we engaged an independent consulting firm to assist us in assessing our loss forecasting modeling methodology. As a result of this assessment, we refined our models effective March 31, 2010 to include a prospective methodology that also applies macroeconomic factors in projecting future loan performance. Historical data was used to validate the enhanced methodology.
Discount Rates. We apply discount rates to each of our financial instruments that we believe are commensurate with the tenure and risks involved. In determining an appropriate discount rate for valuing our asset servicing fee and residual receivables, we consider a number of factors, including market data made available to us on spreads on federally guaranteed loans and private education loans, as well as rates used in the much broader ABS market. We also evaluate yield curves for corporate subordinated debt with maturities similar to the weighted-average life of our residual interests. Until the third quarter of fiscal 2010, the discount rate that we used to estimate fair value of our additional structural advisory fees was based on the 10-year U.S. Treasury Bond rate plus a risk premium. In determining the risk premium, we considered factors such as yields on B-rated instruments, the level of cash flows available to residual interests that support the additional structural advisory fees, as well as the weighted-average life of the additional structural advisory fee receivables. During the fourth quarter of fiscal 2010, we refined our methodology for determining default and prepayment assumptions, which resulted in changes to projected cash flows. These projected cash flows had the effect of lengthening the weighted-average life of the additional structural advisory fee receivables, significantly reducing the amount of cash flows available to the residual interests that support the cash flows available for additional structural advisory fees and delaying the timing of receipt of additional structural advisory fees. The combination of all these factors led us to determine that additional structural advisory fee receivables are more analogous to longer term financial instruments than 10-year debt instruments. The 14.0% discount rate used for additional structural advisory fees reflects market data made available to us on spreads on federally guaranteed loans and private education loans, as well as rates used in the much broader ABS market and is 2.0% less than the 16.0% used for residual receivables, reflecting the seniority of the additional structural advisory fees in the cash flow waterfall of the securitization trusts.
Auction Rate Note Interest Rates. Five of the NCSLT Trusts issued auction rate notes to finance, in whole or in part, the purchase of private education loans. Failed auctions occurred and have persisted as of September 2, 2010 with respect to these five trusts. The failed auctions, deterioration in trust performance and the downgrade in insurance financial strength ratings assigned to the credit enhancement provider for certain auction rate notes, have resulted in the auction rate notes bearing interest at a maximum spread over one-month LIBOR as specified in the indentures, based on the ratings assigned to the notes as of September 2, 2010. We assume that all auction rate notes will continue to bear interest at their current maximum spreads until their expected maturity dates.
Forward LIBOR Curve. The forward LIBOR curve is a market observable input obtained from an independent third party. LIBOR is the underlying rate for most of the trusts' assets and liabilities, and fluctuations in LIBOR can have a significant effect on the cash flows generated by each trust. Changes in the forward LIBOR curve affect the principal balances of private education loans held by the trusts, particularly as interest is capitalized during loan deferment, which affects the net interest margin that the trust generates. In addition, certain trusts have issued a tranche of ABS that bears a fixed interest rate. A decrease in the forward LIBOR curve has resulted in the past in a reduced spread on the fixed-interest tranche, which has in the past decreased the estimated fair value of our service receivables. Significant changes to the forward LIBOR curve can also affect the estimated fair value of our additional structural advisory fees accumulated, the majority of which bear interest at the rate of LIBOR plus a spread to the extent such fees are accrued but unpaid by the trusts.
TERI's Obligation to Pay Claims. During fiscal 2008, we adjusted the estimated fair value of our service receivables to reflect our assumption that TERI would not be able to honor its obligations to the NCSLT Trusts beyond the amounts available in Pledged Accounts, assuming all recoveries on
57
defaulted loans would be used to replenish such Pledged Accounts. During fiscal 2010, we updated our assumptions to reflect the terms of the Plan of Reorganization, as follows:
- •
- With limited exceptions, each NCSLT Trust will receive from TERI the balance, if any, remaining in its respective Pledged
Account;
- •
- Certain defaulted loans transferred by the NCSLT Trusts to TERI prior to the TERI Reorganization will be assigned to the
respective NCSLT Trust, and, with limited exceptions, all recoveries on such loans will benefit the respective NCSLT Trust;
- •
- Defaulted loans transferred by the NCSLT Trusts to TERI subsequent to the TERI Reorganization using funds from a Pledged
Account will not be assigned to the respective NCSLT Trust, but rather will be assigned to a liquidating trust. Recoveries on such loans will benefit unsecured creditors of TERI pro rata, including
the NCSLT Trusts, and will not replenish the Pledged Account of the respective NCSLT Trust; and
- •
- Each NCSLT Trust will receive a pro rata distribution of defaulted loan recoveries available to the general unsecured creditors of TERI based on each trust's unsecured claim. No other amounts have been assumed to benefit the trusts for their claims as general unsecured creditors.
The Modified Plan of Reorganization, which was filed in August 2010, changes certain aspects of the settlements offered to the NCSLT Trusts compared to the settlements offered by the Plan of Reorganization. As of September 2, 2010, we did not expect those changes to have a material effect on the estimated fair value of our service receivables. As of September 2, 2010, the voting and confirmation process for the Modified Plan of Reorganization had not commenced, and the terms of the Modified Plan of Reorganization remain subject to change. See Note 12, "Commitments and Contingencies—TERI Reorganization," in the notes to our consolidated financial statements included in Item 8 of this annual report for additional details.
Sensitivity Analysis
Increases in our estimates of defaults, prepayments and discount rates, as well as decreases in default recovery rates and the multi-year forward estimates of LIBOR, would have a negative effect on the value of our additional structural advisory fees, as well as our asset servicing fee receivables and our private education loans held for sale.
Information about the actual performance of the NCSLT Trusts is included above under "—Application of Critical Accounting Policies and Estimates—Service Receivables and Related Revenue" and as exhibit 99.1 to this annual report. You should consider that actual trust performance data in assessing our projected performance assumptions at June 30, 2010. The following table illustrates the anticipated impact on the fair value of additional structural advisory fee receivables that would occur for changes in loan performance and discount rate assumptions at June 30, 2010. We used variations of 10% and 20%, up and down, except for the forward LIBOR rates, which are based on variations of 1% and 2%, from the assumptions used at June 30, 2010. We also assumed that the Plan of Reorganization, including terms applicable to the NCSLT Trusts, would be confirmed by the Bankruptcy Court. Changes to the Plan of Reorganization, such that the NCLST Trusts were to receive less defaulted loans or less recoveries on defaulted loans, would have an additional negative effect on the value of our receivables.
58
The sensitivities presented below are hypothetical and should be used with caution. The effect of each change in assumption must be calculated independently, holding all other assumptions constant. Because the key assumptions may not in fact be independent, the net effect of simultaneous adverse changes in key assumptions may differ materially from the sum of the individual effects calculated below. For a description of risk segments, see "—Results of Operations—Years ended June 30, 2010, June 30, 2009 and June 30, 2008—Service Revenues—Private Education Loan Performance Assumptions—Risk Segments" below.
| |
|
|
Management assumptions and receivables balance at June 30, 2010 |
|
|
||||||||||||
|---|---|---|---|---|---|---|---|---|---|---|---|---|---|---|---|---|---|
| |
Change in assumption | Change in assumption | |||||||||||||||
Structural advisory fees
|
Down 20% | Down 10% | Up 10% | Up 20% | |||||||||||||
| |
(dollars in thousands) |
||||||||||||||||
Default rate: |
|||||||||||||||||
Management assumptions(1): |
|||||||||||||||||
Segment 1 |
8.8 | % | 9.2 | % | 9.7 | % | 10.1 | % | 10.6 | % | |||||||
Segment 2 |
17.8 | 18.7 | 19.6 | 20.5 | 21.4 | ||||||||||||
Segment 3 |
45.2 | 47.1 | 48.8 | 50.5 | 52.2 | ||||||||||||
Total structural advisory fees |
$ | 37,338 | $ | 35,999 | $ | 34,676 | $ | 33,177 | $ | 27,834 | |||||||
Change in receivables balance |
7.7 | % | 3.8 | % | (4.3 | )% | (19.7 | )% | |||||||||
Default recovery rate: |
|||||||||||||||||
Management assumption |
32.0 | % | 36.0 | % | 40.0 | % | 44.0 | % | 48.0 | % | |||||||
Total structural advisory fees |
$ | 30,471 | $ | 33,242 | $ | 34,676 | $ | 35,732 | $ | 36,699 | |||||||
Change in receivables balance |
(12.1 | )% | (4.1 | )% | 3.0 | % | 5.8 | % | |||||||||
Annual prepayment rate: |
|||||||||||||||||
Management assumption: |
|||||||||||||||||
Segment 1 |
5.5 | % | 6.2 | % | 6.9 | % | 7.6 | % | 8.3 | % | |||||||
Segment 2 |
3.9 | 4.4 | 4.9 | 5.4 | 5.9 | ||||||||||||
Segment 3 |
2.5 | 2.8 | 3.1 | 3.4 | 3.7 | ||||||||||||
Total structural advisory fees |
$ | 35,390 | $ | 35,038 | $ | 34,676 | $ | 34,299 | $ | 33,915 | |||||||
Change in receivables balance |
2.1 | % | 1.0 | % | (1.1 | )% | (2.2 | )% | |||||||||
Discount rate: |
|||||||||||||||||
Management assumption |
11.2 | % | 12.6 | % | 14.0 | % | 15.4 | % | 16.8 | % | |||||||
Total structural advisory fees |
$ | 53,054 | $ | 42,859 | $ | 34,676 | $ | 28,101 | $ | 22,815 | |||||||
Change in receivables balance |
53.0 | % | 23.6 | % | (19.0 | )% | (34.2 | )% | |||||||||
| |
Change in assumption | |
Change in assumption | ||||||||||||||
|---|---|---|---|---|---|---|---|---|---|---|---|---|---|---|---|---|---|
| |
Receivables balance |
||||||||||||||||
| |
Down 2% | Down 1% | Up 1% | Up 2% | |||||||||||||
| |
(dollars in thousands) |
||||||||||||||||
Forward LIBOR rates: |
|||||||||||||||||
Total structural advisory fees |
$ | 28,117 | $ | 31,134 | $ | 34,676 | $ | 38,608 | $ | 39,060 | |||||||
Change in receivables balance |
(18.9 | )% | (10.2 | )% | 11.3 | % | 12.6 | % | |||||||||
- (1)
- The percentage change in assumptions applies to future conditional default rates in the portfolio after taking into account actual defaults occurring in the portfolio through June 30, 2010. As a result, application of the nominal 10% or 20% variation results in a change in the management assumption that is less than 10% or 20% of the default rate.
Education Loans Held for Sale.
Private education loans held for sale by UFSB-SPV have been pledged to an education loan warehouse facility provided by a third-party lender. The loans are subject to call provisions by the
59
third-party lender, and, therefore, we do not have the ability to hold the loans to maturity. Private education loans held for sale are carried at the lower of cost or fair value. The fair value of private education loans held for sale is evaluated on a quarterly basis. When available, the fair value is based on quoted market values. In the absence of readily determined market values, fair value is estimated by management based on the present value of expected future cash flows from the private education loans held for sale. These estimates are based on historical and third-party data, macroeconomic indicators and our industry experience with the assumptions for, among other things, default rates, recovery rates on defaulted loans, prepayment rates and discount rates commensurate with the risks involved. If readily determined market values became available, or if actual performance were to vary appreciably from management's estimates, the fair value of the loans would need to be further adjusted, which could result in material differences from the recorded carrying amounts. Changes in the carrying value of private education loans held for sale are recorded as a separate component of non-interest expense.
Consolidation
Our consolidated financial statements include the accounts of FMD and its subsidiaries, after eliminating inter-company accounts and transactions. We have not consolidated the financial results of the securitization trusts purchasing loans that we have facilitated.
At June 30, 2010 and 2009, each of the securitization trusts created after January 31, 2003, has met the criteria to be a QSPE, as defined by ASC 860-40. Accordingly, we did not consolidate these existing securitization trusts in our financial statements. In addition, the securitization trusts created prior to January 31, 2003 in which we hold a variable interest that could result in our being considered the primary beneficiary of such trusts have been amended in order for them to be considered QSPEs.
Effective July 1, 2010, we adopted ASU 2009-16, Transfers and Servicing (Topic 860)—Accounting for Transfers of Financial Assets, or ASU 2009-16, and ASU 2009-17. Prior to their codification, ASU 2009-16 was referred to as Financial Accounting Standard 166, Accounting for Transfers of Financial Assets, an Amendment of FASB Statement 140, and ASU 2009-17 was referred to as Financials Accounting Standard 167, Amendments to FASB Interpretation No. 46(R).
ASU 2009-16 removes the concept of a QSPE from ASC 860-40 and removes the exemption from consolidation for QSPEs from ASC 810-10, Consolidation, or ASC 810-10. ASU 2009-17 updates ASC 810-10 to require that certain types of enterprises perform analyses to determine if they are the primary beneficiary of a variable interest entity. A primary beneficiary of a variable interest entity is the enterprise that has both of the following characteristics:
- •
- The power to direct the activities of a variable interest entity that most significantly impact the entity's economic
performance; and
- •
- The obligation to absorb losses of the entity that could potentially be significant to the variable interest entity or the right to receive benefits from the entity that could potentially be significant to the variable interest entity.
In addition, ASU 2009-17 requires us to continuously reassess whether consolidation of variable interest entities is appropriate, as opposed to the trigger-based assessment allowed under previous guidance. As a result, we may be required to consolidate or deconsolidate variable interest entities on a quarterly basis, which may lead to volatility in our financial results and make comparisons of results between time periods more challenging.
Effective July 1, 2010, we consolidated 14 securitization trusts that we previously facilitated and deconsolidated UFSB-SPV. Assets and liabilities of the entities consolidated were measured as if they had been consolidated at the time we became the primary beneficiary. All intercompany transactions are eliminated. Profits and losses of the consolidated variable interest entities are allocated to non-controlling interests based on the percentage ownership of voting interests, before the effect of
60
intercompany elimination entries. ASU 2009-17 has been applied through a cumulative-effect adjustment to the opening balance of retained earnings at the effective date.
At the effective date of consolidation, we recorded a net increase in total assets and total liabilities of approximately $8.0 billion and $8.8 billion, respectively, and a net decrease in total stockholders' equity of approximately $800 million (comprised of an increase in FMD stockholders' equity of approximately $60 million recorded as an adjustment to opening retained earnings more than offset by a non-controlling interest deficit of approximately $860 million). Included in these amounts were the following adjustments:
- •
- Consolidation of approximately $8.2 billion of held-to-maturity securitized loan
receivables, at amortized cost;
- •
- Consolidation of approximately $9.0 billion of non-recourse debt issued by the trusts to third-party
investors;
- •
- Reversal of additional structural advisory fee and residual interest receivables totaling $38.7 million, previously
recorded as due from the 14 asset securitization trusts consolidated; and
- •
- Deconsolidation of UFSB-SPV with assets of $108.4 million and liabilities of $225.0 million, and reversal of $45.9 million in deferred tax assets associated with the unrealized losses of UFSB-SPV on private education loans held for sale.
After adoption of ASU 2009-16 and ASU 2009-17, our results of operations will no longer reflect securitization-related income, trust updates or administrative fees from the 14 securitization trusts. Instead, we will recognize interest income associated with securitized loan receivables in the same line item as interest income from non-securitized assets, as well as a provision for loan losses, and we will recognize interest expense associated with debt issued by the trusts to third-party investors on the same line item as other interest-bearing liabilities of FMD. On a consolidated basis, we will not record any revaluation gains or losses related to the additional structural advisory fee and residual interest receivables due from the 14 securitization trusts, but we continue to recognize revaluation gains and losses on receivables from securitization trusts that were not consolidated. The effect of the consolidation will be reflected in our results for the first quarter of fiscal 2011 ending September 30, 2010.
Adoption of ASU 2009-16 and ASU 2009-17 will also have the effect of requiring us to re-evaluate which accounting policies should be considered critical accounting polices. As a result of adoption of these accounting pronouncements, we believe that our critical accounting policies will:
- •
- include policies related to determination of an allowance for loan losses and related provisions;
- •
- include policies related to recognition and presentation of loans and the related interest income;
- •
- continue to include our consolidation policy, although it will be significantly different;
- •
- not include service receivables and related revenue because they will almost entirely be eliminated upon consolidation of
the trusts; and
- •
- not include valuation of private education loans held for sale because all private education loans held for sale are owned by UFSB-SPV, which was deconsolidated upon adoption.
61
Results of Operations—Years ended June 30, 2010, June 30, 2009 and June 30, 2008
Summary
The following table summarizes our results of operations:
| |
Fiscal years ended June 30, | Change between periods | ||||||||||||||
|---|---|---|---|---|---|---|---|---|---|---|---|---|---|---|---|---|
| |
2010 | 2009 | 2008 | 2010 - 2009 | 2009 - 2008 | |||||||||||
| |
(dollars and shares in thousands, except per share data) |
|||||||||||||||
Service revenues |
$ | 6,400 | $ | (315,109 | ) | $ | (54,031 | ) | $ | 321,509 | $ | (261,078 | ) | |||
Net interest income |
9,871 | 25,103 | 25,622 | (15,232 | ) | (519 | ) | |||||||||
Total revenues |
16,271 | (290,006 | ) | (28,409 | ) | 306,277 | (261,597 | ) | ||||||||
Non-interest expenses |
232,115 | 260,833 | 358,547 | (28,718 | ) | (97,714 | ) | |||||||||
Loss before income taxes |
(215,844 | ) | (550,839 | ) | (386,956 | ) | 334,995 | (163,883 | ) | |||||||
Income tax benefit |
(70,320 | ) | (187,819 | ) | (151,880 | ) | 117,499 | (35,939 | ) | |||||||
Net loss |
$ | (145,524 | ) | $ | (363,020 | ) | $ | (235,076 | ) | $ | 217,496 | $ | (127,944 | ) | ||
Net loss per share, diluted |
$ | (1.46 | ) | $ | (3.66 | ) | $ | (2.46 | ) | $ | 2.20 | $ | (1.20 | ) | ||
Diluted weighted average shares outstanding |
99,537 |
99,081 |
95,732 |
456 |
3,349 |
|||||||||||
We reported a net loss of $145.5 million, or $1.46 per share, on a fully diluted basis, for fiscal 2010, compared with a net loss of $363.0 million, or $3.66 per share, in fiscal 2009. The improvement in earnings is attributable to both an increase in revenue of $306.3 million, resulting from lower valuation reductions to service receivables, and to lower non-interest expenses of $28.7 million, resulting from lower general and administrative expenses and lower losses on private education loans held for sale.
We reported a net loss of $363.0 million, or $3.66 per share, on a fully diluted basis, for fiscal 2009, compared with a net loss of $235.1 million, or $2.46 per share, in fiscal 2008. Total revenues decreased $261.6 million, primarily as a result of write-downs of our service receivables in fiscal 2009 due to market conditions and the sale of the Trust Certificate, a $179.1 million decrease in up-front structural advisory fees in fiscal 2009, and a $123.5 million decrease in processing fees from TERI due to the TERI Reorganization. Partially offsetting the decrease in revenue, total non-interest expenses decreased $97.7 million over the same period. The cessation of services for TERI and marketing support services for other clients, combined with reductions in headcount and other cost-savings initiatives, reduced combined compensation and benefits and general and administrative expenses by $228.5 million during fiscal 2009. However, losses to adjust the carrying value of our private education loan portfolio held for sale to fair value increased by $130.8 million from fiscal 2008 to fiscal 2009.
62
Service Revenues
The following table summarizes the changes in our service revenues:
| |
Fiscal years ended June 30, | Change between periods | ||||||||||||||||
|---|---|---|---|---|---|---|---|---|---|---|---|---|---|---|---|---|---|---|
| |
2010 | 2009 | 2008 | 2010 - 2009 | 2009 - 2008 | |||||||||||||
| |
(dollars in thousands) |
|||||||||||||||||
Additional structural advisory fees: |
||||||||||||||||||
Trust updates |
$ | (19,825 | ) | $ | (57,157 | ) | $ | (44,106 | ) | $ | 37,332 | $ | (13,051 | ) | ||||
New securitizations |
— | — | 24,304 | — | (24,304 | ) | ||||||||||||
Up-front structural advisory fees |
— | — | 179,106 | — | (179,106 | ) | ||||||||||||
Total structural advisory fees |
(19,825 | ) | (57,157 | ) | 159,304 | 37,332 | (216,461 | ) | ||||||||||
Asset servicing fees: |
||||||||||||||||||
Fee income |
6,901 | 2,350 | — | 4,551 | 2,350 | |||||||||||||
Fee updates |
(3,506 | ) | 35 | — | (3,541 | ) | 35 | |||||||||||
Total asset servicing fees |
3,395 | 2,385 | — | 1,010 | 2,385 | |||||||||||||
Residuals: |
||||||||||||||||||
Trust updates |
2,863 | (283,295 | ) | (488,832 | ) | 286,158 | 205,537 | |||||||||||
New securitizations |
— | — | 116,972 | — | (116,972 | ) | ||||||||||||
Total residuals |
2,863 | (283,295 | ) | (371,860 | ) | 286,158 | 88,565 | |||||||||||
Administrative and other fees |
19,967 | 22,958 | 158,525 | (2,991 | ) | (135,567 | ) | |||||||||||
Total service fee revenue |
$ | 6,400 | $ | (315,109 | ) | $ | (54,031 | ) | $ | 321,509 | $ | (261,078 | ) | |||||
Total income on new securitizations |
$ | — | $ | — | $ | 320,382 | $ | — | $ | (320,382 | ) | |||||||
Volume of loans securitized |
— | — | 2,027,079 | — | (2,027,079 | ) | ||||||||||||
Total yield on new securitizations(1) |
— | — | 15.8 | % | ||||||||||||||
- (1)
- We believe, as of September 2, 2010, that the structure and economics of any future financing transaction will be less favorable than in the past, with lower revenues and additional cash requirements on our part.
Additional structural advisory fee and residual receivables represent the estimated fair value of service receivables expected to be collected over the life of the various separate securitization trusts that have purchased private education loans facilitated by us, with no further service obligation on our part. Asset servicing fee receivables represent the estimated fair value of service receivables earned as of the balance sheet date.
Additional structural advisory fees
We are entitled to receive additional structural advisory fees over time, based on payment priorities established in the trusts' indentures. In general, the amounts due to us from the trusts accumulate monthly from the date of a securitization at a rate of 0.15% to 0.30% of loan principal outstanding per year plus accrued interest on earned but unpaid fee income. We generally become entitled to receive this fee, plus interest, once the ratio of trust assets to trust liabilities in the particular trust, which we refer to as the parity ratio, reaches a stipulated level, which ranges from 103% to 105.5%. The level applicable to a particular trust is determined at the time of securitization; however, the occurrence of Trigger Events (defined below) can impact the payment priorities. Actual parity ratios at June 30, 2010 for the NCSLT Trusts ranged from 87.24% to 95.02%. Please refer to exhibit 99.2 to this annual report for additional information on actual trust parity ratios for the NCSLT Trusts as of June 30, 2010. The stipulated parity ratio levels may be raised if certain trust characteristics change.
63
At the time of securitization, we recorded additional structural advisory fees at net present value, or estimated fair value, on the balance sheet as additional structural advisory fee receivables and in the statement of operations as additional structural advisory fees—new securitizations. On a quarterly basis, we update our estimate of the fair value of our structural advisory fee receivables and recognize the change in fair value, less cash received, if any, in the statement of operations as additional structural advisory fees—trust updates. To estimate fair value, we apply a discount rate commensurate with the risk applicable to the projected cash flows of the trusts. Projected cash flows are developed using trust performance assumptions including expected operational expenses, expected rate and timing of loan defaults and recoveries on defaulted loans, the rate and timing of prepayments, the trend of contractual and market interest rates over the life of the loan pool, the cost of funding outstanding auction rate notes, assumptions relating to the TERI Reorganization and the existence of certain circumstances, which we refer to as Trigger Events, upon the occurrence of which payments that would otherwise be due with respect to additional structural advisory fees and residuals would instead be directed to the holders of the notes issued by the trusts until the condition causing the Trigger Event ceases to exist or all notes and related interest are paid in full. These assumptions are based on historical and third-party data, macroeconomic indicators and our industry experience.
As of June 30, 2010, we estimate that we will receive fees approximately five to 22 years after the date of a particular securitization transaction. However, for many of the NCSLT Trusts, the bankruptcy filing of their loans' primary guarantor, TERI, or cumulative gross default rates have resulted in Trigger Events. These events may significantly delay the receipt of fees.
The following table summarizes changes in the estimated fair value of our additional structural advisory fee receivables:
| |
Fiscal years ended June 30, | ||||||||||||
|---|---|---|---|---|---|---|---|---|---|---|---|---|---|
| |
2010 | 2009 | 2008 | ||||||||||
| |
(dollars in thousands) |
||||||||||||
Fair value at beginning of period |
$ | 55,130 | $ | 113,842 | $ | 133,644 | |||||||
Additions from new securitizations |
— | — | 24,304 | ||||||||||
Cash received from trust distributions |
(629 | ) | (1,555 | ) | — | ||||||||
Trust updates: |
|||||||||||||
Passage of time—fair value accretion |
6,194 | 9,362 | 10,258 | ||||||||||
Increase in timing and average default rate |
(42,081 | ) | (11,262 | ) | (2,910 | ) | |||||||
Decrease (increase) in average prepayment rate |
25,338 | 3,127 | (3,168 | ) | |||||||||
Increase in discount rate assumptions |
(9,803 | ) | (23,022 | ) | (41,555 | ) | |||||||
Decrease in forward LIBOR curve |
(2,305 | ) | (12,517 | ) | (5,442 | ) | |||||||
Increase in auction rate notes spread |
— | (13,087 | ) | (140 | ) | ||||||||
Decrease in recovery assumption |
— | (9,416 | ) | — | |||||||||
Other factors, net |
2,832 | (342 | ) | (1,149 | ) | ||||||||
Net change from trust updates |
(19,825 | ) | (57,157 | ) | (44,106 | ) | |||||||
Fair value at end of period |
$ | 34,676 | $ | 55,130 | $ | 113,842 | |||||||
During fiscal 2010, we refined our methodology to include prospective macroeconomic factors in projecting future loan performance. Using this refined model, we increased the expected default rate assumptions and decreased the expected prepayment rate assumptions used in our cash flow models. We also increased the discount rate as a result of the reduction in cash flows available to residual interests that support the additional structural advisory fees combined with the lengthening of the weighted average life of the receivables. The combination of changes in our assumptions and a decrease in the forward LIBOR curve resulted in a reduction in the carrying value recorded as trust updates of $19.8 million for fiscal 2010.
64
For fiscal 2009, we recorded losses for additional structural advisory fees—trust updates of $57.2 million, compared to losses from trust updates of $44.1 million for fiscal 2008, reflecting increases in the assumed discount rate, net default rates and auction rate note spreads, as well as a decrease in the forward LIBOR curve.
Fiscal 2008 service revenue also included additional structural advisory fees—new securitizations of $24.3 million of revenue attributable to new securitizations, with no comparable amount recorded in fiscal 2009 or fiscal 2010.
For a detailed discussion of the underlying assumptions used to determine the amounts reported above, see the section "—Private Education Loan Performance Assumptions" below.
Residuals
As we facilitated the securitizations of loan pools, we were entitled to receive a portion of the residual cash flows, if any, generated by the various securitization trusts that purchased the loans. At the time of securitization, we recorded the estimated fair value of these residual cash flows on our balance sheet as residual receivables and in the statement of operations as residuals—new securitizations. On a quarterly basis, we update our estimate of the fair value of residual receivables and recognize the change in fair value less cash received in the statement of operations as residuals—trust updates.
As a result of the sale of the Trust Certificate, effective March 31, 2009, we are no longer entitled to the residual cash flows of the NCSLT Trusts, although we continue to be entitled to receive residuals from other trusts. The sale of the Trust Certificate resulted in a reduction in the carrying value of residual receivables in fiscal 2009 of $134.5 million and reduced our exposure to changes in fair value during fiscal 2010.
The following table summarizes the changes in the estimated fair value of our residual receivables:
| |
Fiscal years ended June 30, | ||||||||||||
|---|---|---|---|---|---|---|---|---|---|---|---|---|---|
| |
2010 | 2009 | 2008 | ||||||||||
| |
(dollars in thousands) |
||||||||||||
Fair value at beginning of period |
$ | 9,960 | $ | 293,255 | $ | 665,115 | |||||||
Additions from new securitizations |
— | — | 116,972 | ||||||||||
Trust updates: |
|||||||||||||
Passage of time—fair value accretion |
1,828 | 20,453 | 75,070 | ||||||||||
Decrease (increase) in discount rate assumptions |
1,176 | (82,571 | ) | (129,169 | ) | ||||||||
Increase in timing and average default rate |
(353 | ) | (50,108 | ) | (49,929 | ) | |||||||
Increase (decrease) in forward LIBOR curve |
160 | (22,009 | ) | (17,590 | ) | ||||||||
Increase in auction rate notes spread |
— | (31,779 | ) | (93,813 | ) | ||||||||
Decrease (increase) in average prepayment rate |
— | 11,336 | (34,765 | ) | |||||||||
Decrease to reflect disposition |
— | (134,481 | ) | — | |||||||||
TERI's inability to pay claims |
— | — | (219,553 | ) | |||||||||
Increase in trust expenses |
— | — | (9,026 | ) | |||||||||
Other factors, net |
52 | 5,864 | (10,057 | ) | |||||||||
Net change from trust updates |
2,863 | (283,295 | ) | (488,832 | ) | ||||||||
Fair value at end of period |
$ | 12,823 | $ | 9,960 | $ | 293,255 | |||||||
Residuals—trust updates in fiscal 2010 of $2.9 million related only to the trusts that were not part of the sale of the Trust Certificate. The net increase primarily reflected accretion for the passage of time and a decrease in the discount rate.
65
For fiscal 2009, residuals—trust updates was a net loss of $283.3 million. The loss, in part, reflected valuation adjustments primarily related to higher default and discount rate assumptions, higher interest rates on auction rate notes and a decrease in the forward LIBOR curve, partially offset by accretion for the passage of time and lower assumed prepayment rates. In addition, we recorded a loss of $134.5 million to reflect a reduction in carrying value due to the sale of the Trust Certificate, as described below.
On March 31, 2009, NC Residuals Owners Trust was formed by the statutory conversion of our wholly-owned subsidiary, GATE Holdings, Inc. As a result of the conversion, we became the sole legal and beneficial owner of the Trust Certificate. NC Residuals Owners Trust, together with its wholly-owned subsidiary, owned certain certificates of beneficial ownership interests, or Residuals, of the NCSLT Trusts. The NCSLT Trusts are the holders of substantially all TERI-guaranteed loans facilitated by us.
Effective March 31, 2009, we entered into, among other agreements, a purchase agreement, or the Purchase Agreement, with VCG Owners Trust, a newly formed statutory trust, which we refer to as the Purchaser, and VCG Securities, LLC, which we refer to as Vanquish Investor. The Purchaser and Vanquish Investor are affiliates of Vanquish Capital Management LLC.
Pursuant to the Purchase Agreement, we transferred the Trust Certificate to the Purchaser effective as of March 31, 2009, and we recorded the decrease in the carrying value of our residual receivables of $134.5 million. As a result, the Purchaser became the indirect owner of the Residuals that were formerly owned by us indirectly through NC Residuals Owners Trust. In consideration for the sale, the Purchaser and Vanquish Investor agreed to bear all future federal and state tax liabilities associated with the Residuals.
Residuals—trust updates for fiscal 2008 was a net loss of $488.8 million, as a result of a $219.6 million adjustment to reflect the TERI Reorganization and TERI's inability to pay future claims beyond the balance in the Pledged Accounts, combined with $269.2 million of losses primarily related to increases in discount and default rate assumptions and higher interest rates on auction rate notes.
Residuals—new securitizations for fiscal 2008 reflected two trusts facilitated during the first quarter of that year. We have been unable to access the securitization market since that time.
To estimate fair value, we apply a discount rate commensurate with the risk involved to the projected cash flows of the trusts. The projected cash flows of the trusts are the same projected cash flows used to estimate the fair value of our additional structural advisory fee receivables. For a detailed discussion of the underlying assumptions used to determine the amounts reported above, see "—Private Education Loan Performance Assumptions" below.
Asset Servicing Fees
In connection with the sale of the Trust Certificate discussed above, we entered into an Asset Services Agreement and a data sharing and license agreement with the Purchaser effective March 31, 2009. Pursuant to the Asset Services Agreement, we have agreed to provide certain asset servicing to the Purchaser to support the Purchaser's ownership of the Residuals, including, among others, analysis and valuation optimization services and services relating to funding strategy. As compensation for services, we are entitled to an asset servicing fee, calculated as a percentage of the aggregate outstanding principal balance of loans outstanding in the trusts. Although this fee is earned monthly, our right to receive the fee is contingent on distributions made to the holders of the Residuals. Distributions made by each of the NCSLT Trusts will be allocated as follows:
- •
- commencing with the first calendar month in which residual cash flows are paid, and for each payment date during the next 60 calendar months from that date, we will receive 60.0% of the Purchaser's residual cash flows;
66
- •
- for each payment date after that, we will receive 40.0% of the Purchaser's residual cash flows until all earned but unpaid
asset servicing fees are paid in full; and
- •
- thereafter, once all earned but unpaid fees have been received, we will receive our monthly fee, paid in full.
We will not receive any asset servicing fees until the Purchaser has begun to receive residual cash flows.
During fiscal 2010, our asset servicing fees earned reflected a full year of earnings, while the Asset Services Agreement was only in effect for one fiscal quarter in fiscal 2009. Fee updates for fiscal 2010 were a loss of $3.5 million, reflecting changes in the volume and timing of projected cash flows available to the holders of the Residuals for the payment of such fees. See "—Private Education Loan Performance Assumptions" below for changes in performance assumptions. Fee updates in fiscal 2009 reflected accretion for the passage of time.
Private Education Loan Performance Assumptions
During the third quarter of fiscal 2010, we completed initial enhancements to the financial models that we use to estimate the fair value of our service receivables. The enhancements provide for the inclusion of certain prospective macroeconomic factors in our performance assumptions for those private education loans securitized in the NCSLT Trusts. As our risk models continue to evolve, we anticipate additional future enhancements.
Risk Segments. During the third quarter of fiscal 2010, we retroactively scored loans in the NCSLT Trusts using our proprietary risk score modeling, loan origination data as well as additional credit bureau data made available following origination. We then divided loans into three risk segments, with loans in Segment 1 expected to perform better than loans in Segment 2 and loans in Segment 2 expected to perform better than loans in Segment 3. The table below identifies performance assumptions for each segment, as well as the percentage of the NCSLT Trust portfolios in each segment.
| |
June 30, 2010 | ||||||||||
|---|---|---|---|---|---|---|---|---|---|---|---|
NCSLT Portfolio
|
Segment 1 | Segment 2 | Segment 3 | ||||||||
Distribution by original loan amount |
25.5 | % | 27.0 | % | 47.5 | % | |||||
Distribution by total outstanding loan amount(1): |
|||||||||||
Not in repayment(2) |
4.3 | 6.7 | 16.9 | ||||||||
In repayment |
18.5 | 20.5 | 33.1 | ||||||||
Total by segment |
22.8 | 27.2 | 50.0 | ||||||||
Gross default rate(3) |
9.7 | 19.6 | 48.8 | ||||||||
Recovery rate(3) |
40.0 | 40.0 | 40.0 | ||||||||
Net default rate(3) |
5.8 | 11.8 | 29.3 | ||||||||
Prepayment rate(4) |
6.9 | 4.9 | 3.1 | ||||||||
- (1)
- Outstanding
aggregate principal and capitalized interest balance as of June 30, 2010.
- (2)
- Loans
"not in repayment" include loans in deferment or forbearance status as of June 30, 2010.
- (3)
- Using projected defaults, net defaults and recoveries over the lives of the trusts as a percentage of original outstanding aggregate principal and accrued interest balance.
67
- (4)
- Amount presented is the weighted average conditional prepayment rate, or CPR, over the lives of the trusts. The CPR is an estimate of the likelihood that a loan will be prepaid during a period given that it has not previously defaulted or been repaid in full.
The table below identifies our overall assumptions as of June 30, 2009 and 2008:
| |
June 30, | Year over year change |
||||||||
|---|---|---|---|---|---|---|---|---|---|---|
| |
2009 | 2008 | 2009 - 2008 | |||||||
Gross default rate |
19.0 | % | 14.8 | % | 4.2 | % | ||||
Net default rate |
11.4 | 7.7 | 3.7 | |||||||
Recovery rate |
40.0 | 48.0 | (8.0 | ) | ||||||
Prepayment rate |
8.0 | 8.4 | (0.4 | ) | ||||||
Year-end discount rate assumptions for fiscal 2010, 2009 and 2008 were as follows:
| |
|
|
|
Year over year change | |||||||||||||||
|---|---|---|---|---|---|---|---|---|---|---|---|---|---|---|---|---|---|---|---|
| |
June 30, | ||||||||||||||||||
| |
2010 - 2009 | 2009 - 2008 | 2008 - 2007 | ||||||||||||||||
| |
2010 | 2009 | 2008 | ||||||||||||||||
Additional structural advisory fee receivables |
14.0 | % | 12.5 | % | 9.7 | % | 1.5 | % | 2.8 | % | 2.7 | % | |||||||
Asset servicing fee and residual receivables |
16.0 | 17.0 | 14.9 | (1.0 | ) | 2.1 | 3.1 | ||||||||||||
Default and Recovery Rates. During fiscal 2010, we reduced the carrying value of additional structural advisory fee receivables by $42.1 million as a result of higher assumed default rates, with no change to recovery rates. The change in our default assumptions had the effect of delaying the projected timing of our receipt and amount of cash flows available for asset servicing fees. As a result, we decreased asset servicing fee receivables by $3.5 million for fiscal 2010. Our residual receivables, which decreased by $353 thousand during fiscal 2010, were less affected by the change in default rates, in light of our sale of the Trust Certificate in fiscal 2009.
During fiscal 2009, we increased our gross default rate assumption from 14.8% to 19.0%, reflecting general economic conditions and actual loss experience of the trusts. In addition, we reduced our assumed recovery rate from 48.0% to 40.0%, and we lengthened the projected recovery timetable we used from nine to 15 years as a result of a refinement to the methodology for determining the endpoint default rate, as well as the actual timing of recoveries. The higher gross default rates resulted in decreases in the estimated fair values of our additional structural advisory fee and residual receivables of $11.3 million and $50.1 million, respectively, during fiscal 2009. The change in rate and timing of recoveries reduced the estimated fair value of additional structural advisory fees by $9.4 million, but did not have a material impact on residual receivables because the change was made in the fourth quarter, subsequent to the sale of the Trust Certificate.
During fiscal 2008, the higher projected gross default rate resulted from weakening general economic conditions. The gross default rate increased by 5.4% during fiscal 2008 to 14.8%, reducing the fair value of additional structural advisory fee and residual receivables by $2.9 million and $49.9 million, respectively. The increase in the recovery rate from 40.0% to 48.0% did not have a material impact.
Prepayment Rates. In general, prepayment rates have been in decline since March 2008. Our financial model enhancements incorporate certain prospective macroeconomic factors in determining prepayment assumptions. As a result of those macroeconomic factors, including the interest rate environment and economic conditions, such as unemployment rates, prepayments are expected to be lower and slower than previously projected, and therefore, we increased the value of our structural advisory fee receivables by $25.3 million during fiscal 2010. Changes to prepayment rates did not significantly affect the fair value of our residual or asset servicing fee receivables.
68
During fiscal 2009, in response to a historically low prepayment rate, we decreased our assumed prepayment rate by 0.4%, which resulted in an increase to additional structural advisory fee receivables of $3.1 million and an increase to the residual receivables of $11.3 million prior to the sale of the Trust Certificate.
During fiscal 2008, prepayment rates increased by 0.4% due to higher prepayment activity experienced by the trusts during that period. As result, we recorded decreases in the estimated fair value of our additional structural advisory fee and residual receivables of $3.2 million and $34.8 million, respectively.
Discount Rate—Additional Structural Advisory Fees. Until the third quarter of fiscal 2010, the discount rate that we used to estimate the fair value of our additional structural advisory fees was based on the 10-year U.S. Treasury Bond rate plus a risk premium. In determining the risk premium, we considered factors such as yields on B-rated instruments, the level of available cash flows from residual interests that support the additional structural advisory fees, as well as the weighted-average life of the additional structural advisory fee receivables.
Beginning in the third quarter of fiscal 2010, we utilized a discount rate of 14.0% in determining the fair value of our additional structural advisory fee receivables. The change from an index-based discount rate to a rate of 14.0% reflects a reduction in the amount of residual interest cash flows available to support the cash flows available for additional structural advisory fees, as well as the lengthening of the weighted-average life of the additional structural advisory fee receivables. The combination of these factors led us to determine that additional structural advisory fee receivables are more analogous to longer-term financial instruments than 10-year debt instruments, and therefore, a higher discount rate is appropriate. The 14.0% discount rate used for the additional structural advisory fees reflects market data made available to us on spreads on federally guaranteed loans and private education loans, as well as rates used in the much broader ABS market and is 2.0% less than the 16.0% used for residual receivables, reflecting the seniority of the additional structural advisory fees in our cash flow waterfall of the securitization trusts. The increase in the discount rate resulted in a $9.8 million decrease in the value of additional structural advisory fee receivables for fiscal 2010.
During fiscal 2009, we increased the discount rate spread over the 10-year U.S. Treasury Bond rate by 3.2%, to 9.0%. In increasing the discount rate, we considered, among other things, overall significant widening in spreads in the ABS marketplace, as well as increases in indicative spreads on subordinate private education loan securities. The 10-year U.S. Treasury Bond rate decreased by 0.4% during the same period, to 3.5% at June 30, 2009. As a result, we applied a discount rate of 12.5% for purposes of estimating the fair value. The increase in the discount rate during fiscal 2009 resulted in a decrease of $23.0 million in the estimated fair value of additional structural advisory fees.
During fiscal 2008, we increased the discount rate spread over the 10-year U.S. Treasury Bond rate from 2.0% to 5.8%. The 10-year U.S. Treasury Note rate decreased by 1.1% during the same period resulting in a discount rate of 9.7%, up 2.7% from June 30, 2007, in response to the deterioration in the market for structured and corporate debt. The effect of the increase to the discount rate was a decrease of $41.6 million in the estimated fair value of additional structural advisory fee receivables during fiscal 2008.
Discount Rate—Asset Servicing Fees and Residuals. In determining an appropriate discount rate for purposes of estimating the fair value of our asset servicing fee and residual receivables, we consider a number of factors, including market data made available to us on spreads on federally guaranteed loans and private education loans, as well as rates used in the much broader ABS market. We also evaluate yield curves for corporate subordinated debt with maturities similar to the weighted-average life of our residuals.
69
We applied a discount rate of 16.0% during fiscal 2010, which was a decrease of 1.0%, from 17.0%, at the prior year-end. As a result, there was an increase in residual receivables of $1.2 million during fiscal 2010 due to changes in the discount rate and no material change to our asset servicing fee receivable.
During fiscal 2009, we increased the discount rate from 14.9% to 17.0%, which resulted in decreases in the estimated fair value of our residual receivables of $82.6 million. The increase over the prior fiscal year was in response to the deterioration of the ABS market and revised assumptions about TERI's ability to pay claims.
During fiscal 2008, we increased the discount rate used for estimating for residual receivables by 3.1% to 14.9% in response to deteriorating market conditions. The higher discount rate resulted in a reduction to the estimated fair value of residual receivables of $129.2 million.
Forward LIBOR Curve. Fluctuations in interest rates, specifically LIBOR, which is the underlying rate for most of the trusts' assets and liabilities, can have a significant impact on the cash flows generated by each trust. The forward LIBOR curve is a market observable input obtained from an independent third party. Changes in the forward LIBOR curve can have a significant impact on the principal balances of the private education loans (especially early in a loan's life when interest is capitalizing on loans in deferment), which affects the overall net interest margin the trust can generate, and can impact our additional structural advisory fee receivables as the majority of accrued but unpaid fees bear interest at LIBOR plus 1.5%. In addition, certain trusts have issued a tranche of ABS that bears a fixed interest rate. A decrease in the forward LIBOR curve may result in a reduced spread on the fixed interest-rate tranche, which, in turn, decreases the estimated fair value of our service receivables.
For the fiscal year ended June 30, 2010, the forward LIBOR curve shifted downward from the prior year-end, reducing the value of the additional structural advisory fee receivables by $2.3 million, with no material impact to residual receivables.
During fiscal 2009, large decreases in the forward LIBOR curve resulted in decreases in the estimated fair value of additional structural advisory fee and residual receivables of $12.5 million and $22.0 million, respectively. Similarly, during fiscal 2008, decreases in the forward LIBOR curve resulted in decreases in the estimated fair value of additional structural advisory fee and residual receivables of $5.4 million and $17.6 million, respectively.
Auction Rate Note Interest Rates. Prior to fiscal 2009, we facilitated five trusts that issued auction rate notes to finance, in whole or in part, the purchase of private education loans. Interest rates for the auction rate notes are determined from time to time at auction; however, during fiscal 2010 and fiscal 2009, failed auctions occurred or persisted with respect to auction rate notes issued by each of the five trusts. In the second quarter of fiscal 2009, the ratings assigned to the auction rate notes of these trusts were downgraded due to failed auctions, deterioration in trust performance and the downgrade of the insurance financial strength rating assigned to the credit enhancement provider for certain auction rate notes. As a result, the auction rate notes bear interest at a maximum spread over one-month LIBOR as specified in the indentures, based on the ratings then assigned to the notes. Increases in the interest expense of the trusts reduced the estimated fair value of our additional structural advisory fees and residual receivables and delayed the timing of receipt of additional structural advisory fees. As a result, during the second quarter of fiscal 2009, we decreased the estimated fair value of our additional structural advisory fee receivables by $13.1 million and our residual receivables by $31.8 million. We did not make any further adjustments during fiscal 2009. During fiscal 2010, we assumed that the notes would continue to bear interest at the contractual maximum spread.
TERI's Obligation to Pay Claims. During fiscal 2008, we reduced the carrying value of our residual receivables in response to the TERI Reorganization and our assumption that TERI would not be able
70
to honor its guaranty obligations to the NCSLT Trusts beyond the amounts available in the Pledged Accounts, assuming that all recoveries on defaulted loans would be used to replenish such Pledged Accounts. The change in our assumptions with regard to TERI's ability to pay claims resulted in a decrease of $219.6 million in the estimated fair value of our residual receivables during fiscal 2008. No changes were made to our assumptions regarding TERI's ability to pay claims during fiscal 2009. During fiscal 2010, we updated our assumptions regarding TERI's obligation to pay claims based on the Plan of Reorganization presented for creditor approval in April 2010. The updated assumptions did not have a material effect on the estimated value of our additional structural advisory fee or asset servicing fee receivables. The Modified Plan of Reorganization, which was filed in August 2010, changes certain aspects of the settlements offered to the NCSLT Trusts compared to the settlements offered by the Plan of Reorganization. As of September 2, 2010, we did not expect those changes to have a material effect on the estimated fair value of our service receivables. As of September 2, 2010, the voting and confirmation process for the Modified Plan of Reorganization had not commenced and the Modified Plan of Reorganization remains subject to change.
Administrative and Other Fees
During fiscal 2010, administrative and other fees were $20.0 million, down $3.0 million from fiscal 2009. Fees in fiscal 2010 primarily consisted of compensation for loan portfolio default prevention and trust administration services provided to the trusts that we facilitated. Fees from these services increased by a net $6.2 million over fiscal 2009; however, the increase was more than offset by declines in marketing-related cost reimbursement and TERI processing fees.
Prior to the TERI Reorganization, we provided outsourcing services for TERI, including loan origination, customer service, default processing, default prevention and administrative services, at cost, under a master servicing agreement. We recognized TERI's reimbursement of our expenses for these services as revenue. In June 2008, in the context of the TERI Reorganization, the Bankruptcy Court entered an order approving a motion by TERI to reject the master servicing agreement effective May 31, 2008, but provided for a transition services agreement between TERI and us with a term through September 29, 2008. As a result, our reimbursement from TERI for fiscal 2009 was $3.0 million, down from $126.5 million in fiscal 2008. We do not expect to receive a material amount of processing fees from TERI in the future. Prior to the TERI Reorganization, we received marketing-related cost reimbursement upon disbursement of loans to borrowers. We generally ceased processing loan applications for TERI-guaranteed loan programs at the time the TERI Reorganization began.
Up-front Structural Advisory Fees
Historically, we received up-front structural advisory fees at the time a securitization trust purchased loans as compensation for structuring debt securities sold in the securitization, coordination of the attorneys, accountants, trustees, loan servicers, loan originators and other transaction participants and preparation of cash flow modeling for rating agencies, as needed. We did not record any up-front structural advisory fees in fiscal 2010 or fiscal 2009 because we did not facilitate any securitizations during these periods. We recorded $179.1 million in up-front structural advisory fees in fiscal 2008 related to two securitizations of TERI-guaranteed loans that we facilitated during the first quarter of fiscal 2008.
Net Interest Income
Net interest income decreased to $9.9 million in fiscal 2010 from $25.1 million in fiscal 2009 and $25.6 million in fiscal 2008. Interest income from private education loans held for sale decreased by $17.7 million in fiscal 2010 as a result of the sale of approximately 88% of Union Federal's portfolio in October 2009, and lower rates on loans, cash and cash equivalents. Interest expense decreased $4.0 million, largely as a result of lower deposit volumes and rates paid on deposits and lower volumes of borrowings, partially offset by a higher rate of interest paid on the education loan warehouse facility.
71
During fiscal 2009, net interest income was relatively flat compared to fiscal 2008. Overall, volumes of interest-bearing assets and liabilities were higher, but rates earned and paid declined during the year. The source of interest income shifted from cash, cash equivalents and federal funds sold to private education loans held for sale, when compared with fiscal 2008, largely because the portfolios generated by Union Federal and held by Union Federal and UFSB-SPV during fiscal 2008 were outstanding for the full year in fiscal 2009. The sources of interest expense shifted from time and savings accounts to money market accounts and the education loan warehouse facility, with the borrowings under the education loan warehouse facility outstanding for a full year in fiscal 2009 versus a partial year in fiscal 2008.
The following table reflects the rates earned on interest-earning assets and paid on interest-bearing liabilities:
Consolidated average balance sheet, interest and rates
(Taxable-equivalent rates(1))
| |
Fiscal years ended June 30, | |||||||||||||||||||||||||||
|---|---|---|---|---|---|---|---|---|---|---|---|---|---|---|---|---|---|---|---|---|---|---|---|---|---|---|---|---|
| |
2010 | 2009 | 2008 | |||||||||||||||||||||||||
| |
Average daily balance |
Interest | Rate | Average daily balance |
Interest | Rate | Average daily balance |
Interest | Rate | |||||||||||||||||||
| |
(dollars in thousands) |
|||||||||||||||||||||||||||
Assets |
||||||||||||||||||||||||||||
Cash and cash equivalents |
$ | 317,524 | $ | 598 | 0.19 | % | $ | 114,507 | $ | 970 | 0.88 | % | $ | 102,732 | $ | 3,697 | 3.87 | % | ||||||||||
Federal funds sold |
6,523 | 3 | 0.06 | 44,852 | 469 | 1.05 | 54,272 | 1,761 | 3.24 | |||||||||||||||||||
Short-term investments |
32,877 | 201 | 0.61 | — | — | — | — | — | — | |||||||||||||||||||
Investments held for sale |
6,542 | 328 | 5.01 | 74,338 | 1,582 | 2.93 | 128,231 | 4,233 | 4.84 | |||||||||||||||||||
Education loans held for sale |
343,436 | 20,974 | 6.11 | 507,889 | 38,646 | 7.61 | 336,975 | 32,656 | 9.69 | |||||||||||||||||||
Loans held to maturity |
27,518 | 925 | 3.36 | 10,727 | 575 | 5.36 | 11,914 | 758 | 6.36 | |||||||||||||||||||
Total interest-earning assets |
734,420 | 23,029 | 3.14 | 752,313 | 42,242 | 5.80 | 634,124 | 43,105 | 7.34 | |||||||||||||||||||
Cash and cash equivalents |
3,738 | 1,248 | 451 | |||||||||||||||||||||||||
Mark-to-market reserves |
(181,576 | ) | (64,834 | ) | (567 | ) | ||||||||||||||||||||||
Other assets |
158,618 | 358,074 | 820,759 | |||||||||||||||||||||||||
Total assets |
$ | 715,200 | $ | 1,046,801 | $ | 1,454,767 | ||||||||||||||||||||||
Liabilities |
||||||||||||||||||||||||||||
Time and savings deposits |
$ | 93,545 | 1,429 | 1.53 | % | $ | 130,183 | 3,885 | 2.98 | % | $ | 162,594 | 7,262 | 4.47 | % | |||||||||||||
Money market deposits |
45,053 | 651 | 1.45 | 48,076 | 1,419 | 2.95 | 7,848 | 240 | 3.06 | |||||||||||||||||||
Education loan warehouse facility |
226,975 | 10,403 | 4.58 | 244,042 | 10,993 | 4.50 | 189,343 | 9,250 | 4.89 | |||||||||||||||||||
Other short-term borrowings |
— | — | — | 22,194 | 128 | 0.58 | — | — | — | |||||||||||||||||||
Other interest-bearing liabilities |
12,245 | 675 | 5.51 | 12,141 | 714 | 5.88 | 11,043 | 731 | 6.62 | |||||||||||||||||||
Total interest-bearing liabilities |
377,818 | 13,158 | 3.48 | 456,636 | 17,139 | 3.75 | 370,828 | 17,483 | 4.71 | |||||||||||||||||||
Non-interest-bearing deposits |
852 | 3,482 | 66 | |||||||||||||||||||||||||
All other liabilities |
20,995 | 11,772 | 240,116 | |||||||||||||||||||||||||
Total liabilities |
399,665 | 471,890 | 611,010 | |||||||||||||||||||||||||
Stockholders' equity |
315,535 | 574,911 | 843,757 | |||||||||||||||||||||||||
Total liabilities and stockholders' equity |
$ | 715,200 | $ | 1,046,801 | $ | 1,454,767 | ||||||||||||||||||||||
Net interest—earning assets |
$ | 734,420 | $ | 752,313 | $ | 634,124 | ||||||||||||||||||||||
Net interest income |
$ | 9,871 | $ | 25,103 | $ | 25,622 | ||||||||||||||||||||||
Net interest margin |
1.34 | % | 3.34 | % | 4.04 | % | ||||||||||||||||||||||
- (1)
- In fiscal 2009 and fiscal 2008, we invested in certain cash equivalents and investments securities that are tax-exempt. Taxable-equivalent rates are a method of presentation in which the tax savings achieved by investing in tax-exempt securities are included in interest revenue for purposes of calculating the yield. This method facilitates the comparison of the performance of tax-exempt and taxable securities. The adjustment is computed using a federal income tax rate of 35%.
72
Analysis of changes in net interest income
| |
From 2009 to 2010 due to change in |
From 2008 to 2009 due to change in |
|||||||||||||||||
|---|---|---|---|---|---|---|---|---|---|---|---|---|---|---|---|---|---|---|---|
| |
Volume | Rate | Net change |
Volume | Rate | Net change |
|||||||||||||
| |
(dollars in thousands) |
||||||||||||||||||
Cash and cash equivalents |
$ | 1,720 | $ | (2,092 | ) | $ | (372 | ) | $ | 482 | $ | (3,209 | ) | $ | (2,727 | ) | |||
Federal funds sold |
(401 | ) | (65 | ) | (466 | ) | (306 | ) | (986 | ) | (1,292 | ) | |||||||
Short-term investments |
201 | — | 201 | — | — | — | |||||||||||||
Investments held for sale |
(1,442 | ) | 188 | (1,254 | ) | (1,717 | ) | (934 | ) | (2,651 | ) | ||||||||
Education loans held for sale |
(12,514 | ) | (5,158 | ) | (17,672 | ) | 16,563 | (10,573 | ) | 5,990 | |||||||||
Loans held to maturity |
900 | (550 | ) | 350 | (76 | ) | (107 | ) | (183 | ) | |||||||||
Total interest income |
(19,213 | ) | (863 | ) | |||||||||||||||
Time and savings deposits |
(1,093 | ) | (1,363 | ) | (2,456 | ) | (1,448 | ) | (1,929 | ) | (3,377 | ) | |||||||
Money market deposits |
(89 | ) | (679 | ) | (768 | ) | 1,228 | (49 | ) | 1,179 | |||||||||
Education loan warehouse facility |
(769 | ) | 179 | (590 | ) | 2,672 | (929 | ) | 1,743 | ||||||||||
Other short-term borrowings |
(128 | ) | — | (128 | ) | 128 | — | 128 | |||||||||||
Other interest-bearing liabilities |
6 | (45 | ) | (39 | ) | 73 | (90 | ) | (17 | ) | |||||||||
Total interest expense |
(3,981 | ) | (344 | ) | |||||||||||||||
Net (decrease) increase in net interest income |
$ | (15,232 | ) | $ | (519 | ) | |||||||||||||
Non-interest Expenses
Total non-interest expenses decreased to $232.1 million in fiscal 2010 from $260.8 million in fiscal 2009, a decrease of $28.7 million, primarily due to decreases in general and administrative expenses of $22.4 million and lower losses on private education loans held for sale of $7.2 million. Non-interest expenses of $260.8 million in fiscal 2009 were down from $358.5 million in fiscal 2008, reflecting decreases in all categories of expense except for losses on private education loans held for sale. The following table reflects non-interest expenses:
| |
|
|
|
Change between periods | |||||||||||||
|---|---|---|---|---|---|---|---|---|---|---|---|---|---|---|---|---|---|
| |
Fiscal years ended June 30, | ||||||||||||||||
| |
From 2010 to 2009 |
From 2009 to 2008 |
|||||||||||||||
| |
2010 | 2009 | 2008 | ||||||||||||||
| |
(dollars in thousands) |
||||||||||||||||
Compensation and benefits |
$ | 43,096 | $ | 42,232 | $ | 96,735 | $ | 864 | $ | (54,503 | ) | ||||||
General and administrative expenses: |
|||||||||||||||||
Depreciation and amortization |
13,359 | 17,800 | 19,633 | (4,441 | ) | (1,833 | ) | ||||||||||
Third-party services |
20,587 | 29,991 | 66,652 | (9,404 | ) | (36,661 | ) | ||||||||||
Occupancy and equipment |
17,078 | 16,699 | 28,752 | 379 | (12,053 | ) | |||||||||||
Marketing |
80 | 3,482 | 100,754 | (3,402 | ) | (97,272 | ) | ||||||||||
Other |
6,960 | 12,466 | 38,648 | (5,506 | ) | (26,182 | ) | ||||||||||
Subtotal—general and administrative expenses |
58,064 | 80,438 | 254,439 | (22,374 | ) | (174,001 | ) | ||||||||||
Losses on education loans held for sale |
130,955 | 138,163 | 7,373 | (7,208 | ) | 130,790 | |||||||||||
Total non-interest expenses |
$ | 232,115 | $ | 260,833 | $ | 358,547 | $ | (28,718 | ) | $ | (97,714 | ) | |||||
Total number of employees at fiscal year-end |
219 | 223 | 368 | (4 | ) | (145 | ) | ||||||||||
73
Compensation and Benefits Expenses
Compensation and benefits expense increased to $43.1 million in fiscal 2010 from $42.2 million in fiscal 2009. The increase relates to the higher cost of stock-based compensation for restricted stock units granted during the year, largely offset by the lower cost of benefits and lower severance costs. During fiscal 2009, compensation and benefits expense decreased by $54.5 million primarily due to a net decrease of headcount of 800 employees during fiscal 2008 and fiscal 2009, including departures of former executive management.
General and Administrative Expenses
In fiscal 2010, general and administrative expenses decreased to $58.1 million from $80.4 million, in part, reflecting continued cost cutting and efficiency efforts. Expenses decreased across every category, except occupancy expense which reflected a charge related to unoccupied space in the amount of $5.6 million taken in fiscal 2010. Depreciation and amortization expense decreased due to the retirement of certain fixed assets. Lower third-party service costs reflect the reduced use of consultants and outside counsel as outstanding litigation was resolved and we recouped $1.0 million in legal fees from insurance providers. Other expenses were down due to lower goodwill write-downs and lower liquidity fees.
General and administrative expenses decreased during fiscal 2009 from fiscal 2008, primarily due to the termination by clients of their marketing-related agreements, largely as a result of the TERI Reorganization. The overall decrease in loan volumes reduced the need for and expenses related to external call centers, professional and consulting services and other costs for loan origination and liquidity and guaranty fees included in other expenses. In addition, the reduced headcount in fiscal 2009 resulted in lower occupancy and equipment costs.
Losses on Private Education Loans Held for Sale
We recorded losses on private education loans held for sale of $131.0 million in fiscal 2010, compared with $138.2 million in fiscal 2009 and $7.4 million in fiscal 2008. During the second quarter of fiscal 2010, we sold private education loans held for sale by Union Federal to an unaffiliated third party for proceeds of $121.6 million. Such loans comprised approximately 88% of Union Federal's portfolio of private education loans directly held by it for sale, excluding loans held by UFSB-SPV. We recorded unrealized losses during the first quarter of fiscal 2010 of $123.9 million on all private education loans held for sale based on the bid we received from the third party for the loans.
In addition to the sale, we recorded additional net unrealized losses of $7.1 million during fiscal 2010. Our estimates of fair value of the private education loans held for sale at June 30, 2010, are based on our cash flow model, which reflects increases in assumptions for default rates and lower recovery rates, similar to the deterioration in performance experienced by the securitization trusts we facilitated.
During fiscal 2009, we recorded losses on private education loans of $138.2 million, reflecting increases in assumptions related to the discount and default rates, and a decrease in the assumption for recoveries. The net default rate used for our own private education loan portfolios is higher than that of the NCSLT Trusts based on trust performance and borrower characteristics.
Income Tax Benefit
Our income tax benefit decreased to $70.3 million in fiscal 2010 from $187.8 million in fiscal 2009. The lower overall benefit in fiscal 2010 was a result of lower pre-tax losses during fiscal 2010. During fiscal 2010, our effective tax rate, or the income tax benefit as a percentage of pre-tax loss, decreased to 32.6% from an effective tax rate of 34.1% for fiscal 2009. Our effective tax rate in fiscal 2010
74
reflects our inability to utilize state net operating losses, particularly in Massachusetts, which does not provide for any carryback or carryforward of such losses, as well as certain non-deductible compensation costs.
As a result of the sale of the Trust Certificate, effective March 31, 2009, as well as our operating losses for fiscal 2009, we recorded income tax receivables during fiscal 2009 for federal and state income taxes paid on prior taxable income. During fiscal 2010, we received a total of $189.3 million in federal and state income tax refunds related to our income tax receivables. During April 2010, the IRS commenced an audit of our tax returns for fiscal years 2007, 2008 and 2009. We cannot predict the timing or outcome of the audit at this time.
In November 2009, the Worker, Homeownership and Business Assistance Act of 2009, or WHBAA, was signed into law. Pursuant to the WHBAA, we are allowed to carry back the taxable losses from either fiscal 2009 or fiscal 2010 for five years, instead of two years. We have estimated that taxable income in previous years will be sufficient to cover the taxable losses of both fiscal 2009 and fiscal 2010 regardless of which fiscal year is carried back. As a result of the WHBAA and pre-existing net operating loss carry back rules, we recorded an income tax receivable of $42.1 million at June 30, 2010.
We have determined that a valuation allowance is necessary for certain deferred tax assets because it is more likely than not that these assets will not be realized through future reversals of existing temporary differences or available tax planning strategies. We review the criteria related to the recognition of deferred tax assets on a quarterly basis. Based on current tax laws, beginning in fiscal 2011, we will not have remaining taxes paid within available net operating loss carry back periods. As a result, the recognition of any additional net operating losses or deductable temporary differences is expected to be more limited than in years prior to fiscal 2011, and a valuation allowance will be required to the extent that deferred tax assets exceed future reversals of then existing temporary differences or available tax planning strategies.
Included in the balance at June 30, 2010 and 2009 are $20.1 million and $14.4 million, respectively, of net unrecognized tax benefits that, if recognized, would favorably affect our effective income tax rate. During fiscal 2010 and fiscal 2009, we accrued approximately $1.7 million and $202 thousand, respectively, of interest. At June 30, 2010, we had approximately $3.8 million accrued for interest and no amount accrued for the payment of penalties. At June 30, 2009, we had approximately $2.1 million accrued for interest and no amount accrued for the payment of penalties.
During fiscal 2009, our income tax benefit increased to $187.8 million from $151.9 million in fiscal 2008. The increase in income tax benefit was primarily the result of an increase in the amount of pre-tax losses between periods, partially offset by a decrease in the effective tax rate. During fiscal 2009, our effective tax rate decreased to 34.1% from an effective tax rate of 39.3% for fiscal 2008. The decrease in our effective tax rate between fiscal 2009 and fiscal 2008 was primarily due to our inability to utilize state net operating losses, primarily in the Commonwealth of Massachusetts, which does not provide for a carry back or a carry forward of such losses.
Subsequent Events
Monogram Loan Programs
As of September 2, 2010, we had begun to perform services under our loan program agreement with SunTrust Bank, and we expect to begin performing services under our loan program agreement with Kinecta Federal Credit Union by September 30, 2010. The loan program agreements each relate to school-certified private education loan programs to be funded by these clients based on our Monogram product. We expect to facilitate up to an aggregate of $275.0 million in loans over the terms
75
of the two loan programs. See "Business—Description of Services," included in Item 1 of this annual report for additional information on our Monogram product offering.
We will perform a range of services in support of the programs, including loan processing and management, and program administration services. We generally provide these services on a fee-for-service basis, although we are also entitled to a portion of the yield generated by the portfolio of program loans in connection with certain administration services and for providing credit enhancement.
Under both loan program agreements, we provide credit enhancement in the form of Participation Accounts, which are deposit accounts funded by us based on credit mix and volume of disbursed program loans, up to the Participation Cap, which is a dollar amount specified in the applicable loan program agreement. The Participation Accounts for each client serve as a first-loss reserve for defaulted program loans. We are not required to fund Participation Accounts in excess of the Participation Cap specified in the applicable loan program agreements. To the extent that loan volumes decrease as a result of repayments or default experience is less than our funded amounts, we would be eligible to receive a monthly release of funds from the Participation Accounts beginning in July 2014, in the case of SunTrust Bank, and following expiration of the terms of our loan program agreement, in the case of Kinecta Federal Credit Union. As of September 2, 2010, we have provided $7.4 million in support of SunTrust Bank's Monogram-based loan program.
Financial Condition, Liquidity and Capital Resources
We expect to fund our short-term liquidity requirements primarily through cash and cash equivalents and revenues from operations, and we expect to fund our long-term liquidity requirements through revenues from operations and issuances of common stock, promissory notes or other securities. We expect to assess our financing alternatives periodically and access the capital markets opportunistically. If our existing resources are insufficient to satisfy our liquidity requirements, or if we were to enter into a strategic arrangement with another company, we may need to sell additional equity or debt securities. Any sale of additional equity or convertible debt securities may result in additional dilution to our stockholders, and we cannot be certain that additional public or private financing will be available in amounts or on terms acceptable to us, if at all. If we are unable to obtain this additional financing, we may be required to further delay, reduce the scope of, or eliminate one or more aspects of our operational activities, which could harm our business.
Our actual liquidity and capital funding requirements may depend on a number of factors, including:
- •
- expenses necessary to fund our operations, including the operations of Union Federal;
- •
- the extent to which our services and products, including our Monogram product, gain market share and remain competitive at
pricing favorable to us;
- •
- the extent to which we contribute cash to clients or credit facility providers in connection with our Monogram product;
- •
- the regulatory capital requirements applicable to Union Federal (see "—Support of Subsidiary Bank" below for
additional information);
- •
- the amount and timing of receipt of additional structural advisory fees, asset servicing fees and residuals;
- •
- the results of the audit conducted by the IRS of our tax returns for fiscal years 2007, 2008 and 2009, which could result in adjustments to tax refunds previously received in connection with the sale of the Trust Certificate; and
76
- •
- the timing, size, structure and terms of any securitization or other funding transactions that we structure, as well as the composition of the loan pool being securitized.
Liquidity is required for capital expenditures, working capital, business development expenses, costs associated with alternative financing transactions, general corporate expenses, credit enhancement provided in connection with our Monogram product and maintaining the regulatory capital of our bank subsidiary, Union Federal. In order to preserve capital and maximize liquidity in challenging market conditions, we have taken certain broad measures to reduce the risk related to private education loans and residual receivables on our balance sheet, change our fee structure and add new products and reduce our overhead expenses. See "—Executive Summary—Business Trends and Uncertainties" above for an expanded description of actions taken by us during fiscal 2010 and fiscal 2009 in response to the economic challenges facing us. In addition, our Board of Directors has eliminated regular quarterly cash dividends and repurchases of our common stock for the foreseeable future.
We had combined cash, cash equivalents, federal funds sold, short-term investments and investments held for sale of $386.5 million and $181.5 million, at June 30, 2010 and June 30, 2009, respectively. Of the $386.5 million at June 30, 2010, approximately $265.0 million was held by FMD and its non-bank subsidiaries and approximately $121.5 million was held by Union Federal. In fiscal 2010, we received a total of $189.3 million in federal and state tax refunds for income taxes previously paid by us on our prior taxable income, and Union Federal received $121.6 million from the sale of a portion of its private education loan portfolio to an unaffiliated third party. Net cash provided by operating activities was $268.5 million in fiscal 2010, reflecting the receipt of the tax refunds and proceeds from the sale of the loans. Net cash used in operating activities was $56.3 million for fiscal 2009, reflecting the funding of operations and payment of taxes. Net cash used in operating activities in fiscal 2008 was $456.1 million, reflecting a net use of $479.0 million by Union Federal to originate private education loans.
During the first quarter of fiscal 2011, we began processing loans based on our Monogram product. See Note 22, "Subsequent Events—Monogram Loan Programs," in the notes to our consolidated financial statements included in Item 8 of this annual report for additional details. We expect to receive fees for our services, and to retain a portion of the interest spread from the loans we facilitate offset by any contribution by us to fund Participation Accounts. While we believe that we may be successful in completing negotiations with respect to the sale of our Monogram product offering to additional potential lenders, we are uncertain as to how much loan volume may be originated by these lenders in fiscal 2011.
We anticipate continuing to receive administrative and other fees related to our daily management and information gathering and reporting services for parties related to securitization trusts, as well as fees on a stand-alone basis for loan portfolio management services. We believe that these administrative and other fees, as well as management of our expenses, coupled with our significant cash, cash equivalents and investments, including the significant tax refunds received in fiscal 2010 and $42.1 million in federal tax refunds expected to be received in fiscal 2011, will be adequate to fund our operations in the short term as we seek to rebuild our client base and generate fee revenues through our Monogram product over the short term and long term. In addition, at June 30, 2010, we had $6.1 million available for borrowing under an unused line of credit with the Federal Home Loan Bank of Boston. There were no borrowings outstanding at June 30, 2010 or June 30, 2009.
Net interest income for fiscal 2010, on a consolidated basis, was $9.9 million, of which $3.9 million was attributable to operations of Union Federal. During the second quarter of fiscal 2010, Union Federal sold its entire portfolio of private education loans held for sale, excluding the loans held by UFSB-SPV, Union Federal's subsidiary at that time. Subsequent to the loss of this source of net interest income, Union Federal has experienced monthly operating losses of approximately $330 thousand. In connection with our previously announced exploration of strategic alternatives for
77
Union Federal, including a potential sale, we have adopted a conservative investment strategy, maintaining Union Federal's investable assets in cash and cash equivalents. We believe this investment strategy will be viewed favorably by potential bidders. Due to the net losses Union Federal is currently generating, we believe a sale of Union Federal would have a positive impact on our consolidated earnings as well as providing enhanced liquidity to us through an additional cash infusion from the sale proceeds. Furthermore, we do not believe a sale of Union Federal would result in a material change to our ongoing operations because we do not expect Union Federal to offer private education loans during fiscal 2011 or to otherwise serve as a funding source.
In considering our short-term and long-term plans to increase cash inflows, we have taken into account the cash flows related to asset servicing fees recorded with respect to services provided to the third-party purchaser of the Trust Certificate, as well as our other service revenue receivables, based on the private education loan performance assumptions as of June 30, 2010. Despite the uncertainties discussed above, we believe, based on our operating plan that we have sufficient liquidity to fund our operations through fiscal 2011.
Cash used in investing activities of $32.9 million in fiscal 2010 was primarily due to a net $50.0 million of cash invested in short-term investments, partially offset by a net reduction in federal funds sold. Cash provided by investing activities of $127.3 million in fiscal 2009 was primarily due to the net reductions in federal funds sold and investments held for sale, the proceeds of which were used to finance operating activities. Cash used by investing activities of $20.6 million in fiscal 2008 reflected a higher volume of federal funds sold and equipment purchases, in part offset by net cash provided by the disposition of investments held for sale.
Cash used in financing activities in fiscal 2010 of $64.3 million reflected decreases in the volume of deposits and payments under capital leases and borrowings under the education loan warehouse facility. Cash payments related to the education loan warehouse facility are generally limited to cash received on the private education loans held for sale used as collateral. See "—Contractual Obligations" below for a more detailed discussion of required payments under the facility.
Cash provided by financing activities in fiscal 2009 reflected the net issuance proceeds of series B non-voting convertible preferred stock of $125.9 million, largely offset by a reduction in deposit levels and payments under capital leases and borrowings under the education loan warehouse facility. In fiscal 2009, at the request of the OTS, we reduced the level of broker deposits at Union Federal by $125.2 million, some of which we were able to offset by increases in other types of deposits. Cash provided by financing activities in fiscal 2008 reflected the build-up of the deposit balance at Union Federal, borrowings made under the education loan warehouse facility to fund private education loans (reflected in cash used by operating activities) and the issuance of common stock, less dividends paid.
The following table summarizes our time deposits at Union Federal greater than $100 thousand by maturity at June 30, 2010:
| |
(dollars in thousands) | |||
|---|---|---|---|---|
Within three months |
$ | 6,949 | ||
Three to six months |
6,798 | |||
Six months to one year |
5,238 | |||
Over one year |
921 | |||
|
$ | 19,906 | ||
The maturities of these deposits are not directly indicative of future timing of cash needed for financing activities because they do not take into account the customers that may reinvest their funds into new time deposits or into other types of deposit accounts.
78
We had treasury stock of $186.2 million and $184.2 million at June 30, 2010 and 2009, respectively. Our treasury stock balance was primarily derived from the repurchases of our common stock in open market transactions. Treasury stock also includes shares of our stock withheld from employees to satisfy statutory minimum withholding obligations as equity compensation awards vest. The increase in treasury stock during fiscal 2010 was solely attributable to withholding obligations relating to compensation awards that vested. In April 2007, our Board of Directors authorized the repurchase of up to 10,000,000 shares of our common stock. As of June 30, 2010, we had repurchased an aggregate of 1,169,100 shares at an average price, excluding commissions, of $36.17 per share, under this repurchase program. We did not repurchase any shares of our common stock pursuant to this repurchase program during fiscal 2010 or fiscal 2009, and as of September 2, 2010, we do not plan to repurchase additional shares of our common stock for the foreseeable future. Future repurchases pursuant to this program may require regulatory approval.
The OTS regulates all capital distributions by Union Federal directly or indirectly to us, including dividend payments. Union Federal is required to file a notice with the OTS at least 30 days before the proposed declaration of a dividend or approval of a proposed capital distribution by Union Federal's board of directors. Union Federal must file an application to receive the approval of the OTS for a proposed capital distribution when, among other circumstances, the total amount of all capital distributions (including the proposed capital distribution) for the applicable calendar year exceeds net income for that year to date plus the retained net income for the preceding two years.
A notice or application to make a capital distribution by Union Federal may be disapproved or denied by the OTS if it determines that, after making the capital distribution, Union Federal would fail to meet minimum required capital levels or if the capital distribution raises safety or soundness concerns or is otherwise restricted by statute, regulation or agreement between Union Federal and the OTS or the FDIC or a condition imposed by an OTS agreement. Under the Federal Deposit Insurance Act, or FDIA, an FDIC-insured depository institution such as Union Federal is prohibited from making capital distributions, including the payment of dividends, if, after making such distribution, the institution would become "undercapitalized" (as such term is used in the FDIA).
Support of Subsidiary Bank
Union Federal is subject to various regulatory capital requirements administered by the federal banking agencies. Failure to meet minimum capital requirements would initiate certain mandatory and possibly additional discretionary actions by the regulators that, if undertaken, could have a direct material effect on our liquidity. Under capital adequacy guidelines and the regulatory framework for prompt corrective action, Union Federal must meet specific capital guidelines that involve quantitative measures of Union Federal's assets, liabilities and certain off-balance sheet items as calculated under regulatory accounting practices. The capital amounts and classification, however, are also subject to qualitative judgments by the regulators about components, risk weighting and other factors.
Union Federal's equity capital was $44.4 million at June 30, 2010, down from $84.3 million at June 30, 2009, due to dispositions of private education loans held for sale during the period and the generation of monthly operating losses. Quantitative measures established by regulation to ensure capital adequacy require Union Federal to maintain minimum amounts and ratios of total capital and Tier 1 capital to risk-weighted assets (each as defined in the regulations). As of June 30, 2010 and June 30, 2009, Union Federal was well capitalized under the regulatory framework for prompt corrective action.
In July 2009, FMD entered into the Supervisory Agreement and Union Federal consented to the Order, pursuant to which FMD and Union Federal agreed to comply with certain requirements imposed by the OTS. During fiscal 2010, FMD and Union Federal complied in all material respects with the conditions set forth in the Supervisory Agreement and the Order, respectively. In March 2010,
79
the OTS terminated the Supervisory Agreement and the Order, each in its entirety. See Note 21, "Union Federal Regulatory Matters—Supervisory Agreement and Order to Cease and Desist," in the notes to our consolidated financial statements included in Item 8 of this annual report for additional details.
In connection with the termination of the Supervisory Agreement, our Board of Directors adopted resolutions requiring FMD to support the implementation by Union Federal of its business plan, so long as Union Federal is owned or controlled by FMD, and to notify the OTS in advance of any distributions to our shareholders in excess of $1.0 million per fiscal quarter and any incurrence or guarantee of debt in excess of $5.0 million. Following termination of the Supervisory Agreement and the Order, FMD remains subject to extensive regulation, supervision and examination by the OTS as a savings and loan holding company, and Union Federal remains subject to extensive regulation, supervision and examination by the OTS and the FDIC.
Union Federal's regulatory capital ratios were as follows as of the dates below:
| |
Regulatory Guidelines | |
|
|||||||||||
|---|---|---|---|---|---|---|---|---|---|---|---|---|---|---|
| |
Minimum | Well Capitalized |
June 30, 2010 |
June 30, 2009 |
||||||||||
Risk-based capital ratios: |
||||||||||||||
Tier 1 capital |
4 | % | 6 | % | 124.83 | % | 37.86 | % | ||||||
Total capital |
8 | 10 | 125.47 | 37.91 | ||||||||||
Tier 1 (core) capital ratio |
4 | 5 | 27.88 | 34.51 | ||||||||||
Contractual Obligations
In July 2007, UFSB-SPV, which was a subsidiary of Union Federal at the time, entered into a $300.0 million education loan warehouse facility with a third-party conduit lender. The facility served as a source of interim financing for private education loan programs initially funded by Union Federal. UFSB-SPV used advances under the facility to fund purchases of private education loans from Union Federal, which we refer to as the financed loans. To secure its repayment obligations, UFSB-SPV granted a security interest to the conduit lender in certain collateral, including the financed loans. Neither FMD nor Union Federal is a borrower or co-borrower under the facility, and the facility was structured to generally limit the conduit lender's recourse to the assets of UFSB-SPV, which consist almost exclusively of the financed loans.
At June 30, 2010 and June 30, 2009, $218.1 million and $230.1 million, respectively, were outstanding under the facility, which we restructured in April 2010. Until April 15, 2010, the borrowings accrued interest at the prime rate plus 2.0%. Following the debt restructuring entered into on April 16, 2010, and until April 16, 2011, outstanding notes under the facility accrue interest at a rate of the lender's cost of funds (as specified in the indenture relating to the facility) plus 0.5%. Beginning April 17, 2011, the rate will increase to the lender's cost of funds plus 3.0%. Principal and interest on each outstanding advance are paid on a monthly settlement date pursuant to the indenture, in accordance with the payment priorities set forth in the indenture. Principal and interest are paid out of amounts collected on the financed loans during the preceding month and deposited in a collection account pursuant to the indenture.
The facility termination date was declared by the conduit lender in April 2008, and UFSB has not been eligible for further borrowings under the facility since that time. All outstanding notes under the facility became due on July 14, 2010, and UFSB-SPV was unable to pay the outstanding notes in full. As a result, the conduit lender has the right to foreclose on the collateral at any time in its discretion. As of September 2, 2010, the conduit lender has elected not to exercise such right. We expect the conduit lender to continue to require repayment of the outstanding notes from collections on the financed loans, until the outstanding notes are paid in full, if possible. See Note 10, "Liabilities and Unused Lines of Credit—Education Loan Warehouse Facility," in the notes to our consolidated financial statements included in Item 8 of this annual report for additional information.
80
At June 30, 2010, we had $6.1 million available for borrowing under an unused line of credit with the Federal Home Loan Bank of Boston. There were no borrowings outstanding under this line of credit at June 30, 2010 or June 30, 2009.
We entered into two ten-year 6% fixed notes payable agreements with TERI in June 2001 to fund the acquisition of TERI's loan processing operations and loan database. As a result of the TERI Reorganization, we have not made any scheduled payments on the notes outstanding since April 2008. The outstanding principal balance of the notes payable at June 30, 2010 was $3.0 million. As of September 2, 2010, we expect amounts outstanding under the notes to be offset against our claims against TERI's bankruptcy estate.
We have future cash obligations under long-term operating and capital leases for office space and office equipment. The table below summarizes our future payments under contractual obligations as of June 30, 2010, excluding obligations to TERI and borrowings under the education loan warehouse facility described above:
| |
Contractual obligations | |||||||||
|---|---|---|---|---|---|---|---|---|---|---|
Fiscal years ending June 30,
|
Capital leases |
Operating leases |
Total | |||||||
| |
(dollars in thousands) |
|||||||||
2011 |
$ | 1,418 | $ | 10,330 | $ | 11,748 | ||||
2012 |
— | 9,312 | 9,312 | |||||||
2013 |
— | 7,375 | 7,375 | |||||||
2014 |
— | 5,897 | 5,897 | |||||||
2015 (none thereafter) |
— | 350 | 350 | |||||||
Total |
$ | 1,418 | $ | 33,264 | $ | 34,682 | ||||
As of September 2, 2010, we were in discussions to amend the lease relating to our Medford, Massachusetts location to, among other things, reduce the rented space by approximately 60,000 square feet by April 1, 2011 and extend the term of the lease to March 31, 2017. The table above does not reflect any changes to the terms of the lease in effect as of September 2, 2010.
Off-Balance Sheet Arrangements
We offer outsourcing services in connection with private education loan programs, from program design through securitization of the loans. We have structured and facilitated the securitization of private education loans for our clients through a series of bankruptcy remote, special purpose trusts.
The principal uses of these trusts have been to generate sources of liquidity for our clients' and Union Federal's assets sold into such trusts and make available more funds to students and colleges. See "—Executive Summary—Application of Critical Accounting Policies and Estimates—Consolidation" above for a discussion of our determination to not consolidate these securitization trusts as of June 30, 2010 and the impact that newly issued accounting pronouncements that we have not yet adopted as of that date will have on our determination to consolidate these trusts.
Inflation
Inflation was not a material factor in either revenue or operating expenses during the periods presented.
Item 7A. Quantitative and Qualitative Disclosures about Market Risk
In the ordinary course of business, we are subject to interest-rate risk and credit risk. Interest-rate risk applies to all of our interest-bearing assets and liabilities, as well as service receivables. Credit risk is primarily related to private education loans held for sale, service receivables, mortgage loans, cash equivalents and investments.
81
Interest-Rate Risk
The interest-rate characteristics of our interest-bearing assets are driven by the nature, volume and duration of our interest-bearing liabilities. Generally, our interest-bearing liabilities are either variable-rate instruments or are of a short duration and are subject to frequent repricing at maturity.
Less than 3% of our fixed-rate customer deposits at Union Federal have maturities in excess of twelve months from June 30, 2010. Approximately 84% of the deposits have variable interest rates or fixed interest rates with maturities of six months or less from June 30, 2010. Deposit pricing is subject to weekly examination by a committee of senior managers from Union Federal and FMD's Finance and Risk and Compliance Departments. The committee considers competitors' pricing, inflows and outflows of deposit balances and Union Federal's funding requirements to make pricing decisions on the desired volume of deposits in each given duration and product type.
The frequent repricing of our liabilities drives our investment decisions. All of our private education loans, and approximately 65% of our mortgage loans, have variable interest rates. Interest rates on private education loans are based on the one-month LIBOR rate. Excess cash is primarily invested in money market funds, federal funds sold, time deposits with original maturities of less than one year and U.S. federal agency mortgage-backed securities.
The matching of the interest-rate characteristics and duration of assets and liabilities mitigates interest-rate risk with respect to net interest revenue. However, we are still subject to interest-rate risk because as interest rates decline, the spreads between our assets and liabilities narrow and net interest income may decline.
The fair value of private education loans held for sale and our service receivables will fluctuate due to variances in prepayments and discount rates, as well as the multi-year forward estimates of LIBOR, which is the reference rate for the loan assets and assumed borrowings assumptions used in our cash flow model. We frequently monitor these assumptions and their effect on the estimated fair value of these assets. We believe that we have adequately addressed interest-rate risks in our cash flow models.
Credit Risk
We manage cash, cash equivalents and investment assets conservatively. The primary objective of our investment policy is the preservation of capital. Therefore, cash, cash equivalents, short-term investments and investments held for sale are placed with the Federal Reserve, or invested in federal funds sold, money market funds, deposits at highly rated institutions and government agency mortgage-backed securities.
Union Federal offers conventional conforming and non-conforming fixed- and variable-rate first and second residential mortgage loans, as well as commercial real estate loans. We base our loan underwriting criteria primarily on credit score, consumer credit file information and collateral characteristics. All mortgage loans are underwritten such that they are saleable to institutional investors. Union Federal does not offer high loan-to-value second mortgages, option adjustable rate mortgages or sub-prime mortgage products.
Our assumptions regarding defaults and recoveries of securitized loans affect the expected timing of cash payments to us in respect of additional structural advisory fees, asset servicing fees and residual cash flows and our estimates of their fair value. See "Management's Discussion and Analysis of Financial Condition and Results of Operations—Executive Summary—Application of Critical Accounting Policies and Estimates" included in Item 7 of this annual report. We believe that we have adequately addressed credit risks in our cash flow models.
82
Item 8. Financial Statements and Supplementary Data
FINANCIAL STATEMENTS
REPORT OF INDEPENDENT REGISTERED PUBLIC ACCOUNTING FIRM
The Board of Directors and Stockholders
The First Marblehead Corporation:
We have audited the accompanying consolidated balance sheets of The First Marblehead Corporation and subsidiaries (the "Company") as of June 30, 2010 and 2009, and the related consolidated statements of operations, changes in stockholders' equity, and cash flows for each of the years in the three-year period ended June 30, 2010. These consolidated financial statements are the responsibility of the Company's management. Our responsibility is to express an opinion on these consolidated financial statements based on our audits.
We conducted our audits in accordance with the standards of the Public Company Accounting Oversight Board (United States). Those standards require that we plan and perform the audit to obtain reasonable assurance about whether the financial statements are free of material misstatement. An audit includes examining, on a test basis, evidence supporting the amounts and disclosures in the financial statements. An audit also includes assessing the accounting principles used and significant estimates made by management, as well as evaluating the overall financial statement presentation. We believe that our audits provide a reasonable basis for our opinion.
In our opinion, the consolidated financial statements referred to above present fairly, in all material respects, the financial position of the Company as of June 30, 2010 and 2009, and the results of their operations and their cash flows for each of the years in the three-year period ended June 30, 2010, in conformity with U.S. generally accepted accounting principles.
We also have audited, in accordance with the standards of the Public Company Accounting Oversight Board (United States), the Company's internal control over financial reporting as of June 30, 2010, based on criteria established in Internal Control—Integrated Framework issued by the Committee of Sponsoring Organizations of the Treadway Commission (COSO), and our report dated September 2, 2010 expressed an unqualified opinion on the effectiveness of the Company's internal control over financial reporting.
/s/ KPMG LLP
Boston,
Massachusetts
September 2, 2010
83
THE FIRST MARBLEHEAD CORPORATION AND SUBSIDIARIES
CONSOLIDATED BALANCE SHEETS
June 30, 2010 and 2009
(dollars and shares in
thousands, except per share amounts)
| |
2010 | 2009 | |||||||
|---|---|---|---|---|---|---|---|---|---|
ASSETS |
|||||||||
Cash and cash equivalents |
$ | 330,073 | $ | 158,770 | |||||
Federal funds sold |
2,000 | 14,326 | |||||||
Short-term investments, at cost |
50,000 | — | |||||||
Investments held for sale, at fair value |
4,471 | 8,450 | |||||||
Education loans held for sale |
107,434 | 350,960 | |||||||
Service receivables: |
|||||||||
Additional structural advisory fees |
34,676 | 55,130 | |||||||
Asset servicing fees |
5,780 | 2,385 | |||||||
Residuals |
12,823 | 9,960 | |||||||
Total service receivables |
53,279 | 67,475 | |||||||
Property and equipment, net |
8,086 | 19,929 | |||||||
Intangible assets, net |
1,194 | 1,931 | |||||||
Loans held to maturity, net |
8,573 | 9,515 | |||||||
Income taxes receivable |
17,560 | 166,410 | |||||||
Net deferred tax asset |
41,915 | 13,124 | |||||||
Other assets |
8,785 | 10,440 | |||||||
Total assets |
$ | 633,370 | $ | 821,330 | |||||
LIABILITIES AND STOCKHOLDERS' EQUITY |
|||||||||
Liabilities: |
|||||||||
Deposits |
$ | 108,732 | $ | 154,462 | |||||
Education loan warehouse facility |
218,059 | 230,137 | |||||||
Accounts payable and accrued expenses |
30,235 | 21,512 | |||||||
Other liabilities |
6,529 | 9,754 | |||||||
Total liabilities |
363,555 | 415,865 | |||||||
Commitments and contingencies |
|||||||||
Stockholders' equity: |
|||||||||
Preferred stock, par value $0.01 per share; 20,000 shares authorized; 133 shares issued and outstanding |
1 | 1 | |||||||
Common stock, par value $0.01 per share; 250,000 shares authorized; 108,975 and 106,768 shares issued, respectively; 100,736 and 99,125 shares outstanding, respectively |
1,090 | 1,068 | |||||||
Additional paid-in capital |
443,290 | 431,461 | |||||||
Retained earnings |
11,389 | 156,913 | |||||||
Treasury stock, 8,239 and 7,643 shares, respectively, at cost |
(186,218 | ) | (184,246 | ) | |||||
Accumulated other comprehensive income |
263 | 268 | |||||||
Total stockholders' equity |
269,815 | 405,465 | |||||||
Total liabilities and stockholders' equity |
$ | 633,370 | $ | 821,330 | |||||
See accompanying notes to consolidated financial statements.
84
THE FIRST MARBLEHEAD CORPORATION AND SUBSIDIARIES
CONSOLIDATED STATEMENTS OF OPERATIONS
Fiscal years ended June 30, 2010, 2009 and 2008
(dollars and shares in thousands, except per share amounts)
| |
2010 | 2009 | 2008 | ||||||||||
|---|---|---|---|---|---|---|---|---|---|---|---|---|---|
Service revenues: |
|||||||||||||
Additional structural advisory fees: |
|||||||||||||
Trust updates |
$ | (19,825 | ) | $ | (57,157 | ) | $ | (44,106 | ) | ||||
New securitizations |
— | — | 24,304 | ||||||||||
Up-front structural advisory fees |
— | — | 179,106 | ||||||||||
Total additional structural advisory fees |
(19,825 | ) | (57,157 | ) | 159,304 | ||||||||
Asset servicing fees: |
|||||||||||||
Fee income |
6,901 | 2,350 | — | ||||||||||
Fee updates |
(3,506 | ) | 35 | — | |||||||||
Total asset servicing fees |
3,395 | 2,385 | — | ||||||||||
Residuals: |
|||||||||||||
Trust updates |
2,863 | (283,295 | ) | (488,832 | ) | ||||||||
New securitizations |
— | — | 116,972 | ||||||||||
Total residuals |
2,863 | (283,295 | ) | (371,860 | ) | ||||||||
Administrative and other fees |
19,967 | 22,958 | 158,525 | ||||||||||
Total service revenues |
6,400 | (315,109 | ) | (54,031 | ) | ||||||||
Net interest income |
9,871 | 25,103 | 25,622 | ||||||||||
Total revenues |
16,271 | (290,006 | ) | (28,409 | ) | ||||||||
Non-interest expenses: |
|||||||||||||
Compensation and benefits |
43,096 | 42,232 | 96,735 | ||||||||||
General and administrative expenses |
58,064 | 80,438 | 254,439 | ||||||||||
Losses on education loans held for sale |
130,955 | 138,163 | 7,373 | ||||||||||
Total non-interest expenses |
232,115 | 260,833 | 358,547 | ||||||||||
Loss before income taxes |
(215,844 | ) | (550,839 | ) | (386,956 | ) | |||||||
Income tax benefit |
(70,320 | ) | (187,819 | ) | (151,880 | ) | |||||||
Net loss |
$ | (145,524 | ) | $ | (363,020 | ) | $ | (235,076 | ) | ||||
Net loss per share: |
|||||||||||||
Basic |
$ | (1.46 | ) | $ | (3.66 | ) | $ | (2.46 | ) | ||||
Diluted |
(1.46 | ) | (3.66 | ) | (2.46 | ) | |||||||
Cash dividends declared per share |
— | — | 0.395 | ||||||||||
Weighted-average shares outstanding: |
|||||||||||||
Basic |
99,537 | 99,081 | 95,732 | ||||||||||
Diluted |
99,537 | 99,081 | 95,732 | ||||||||||
See accompanying notes to consolidated financial statements.
85
THE FIRST MARBLEHEAD CORPORATION AND SUBSIDIARIES
CONSOLIDATED STATEMENTS OF CHANGES IN STOCKHOLDERS' EQUITY
Fiscal years ended June 30, 2010, 2009 and 2008
(dollars and shares in thousands, except per share amounts)
| |
Non-voting convertible preferred stock issued |
Common stock | |
|
|
|
||||||||||||||||||||||||||
|---|---|---|---|---|---|---|---|---|---|---|---|---|---|---|---|---|---|---|---|---|---|---|---|---|---|---|---|---|---|---|---|---|
| |
|
|
Accumulated other comprehensive income, net of tax |
|
||||||||||||||||||||||||||||
| |
Issued | In treasury | |
|
|
|||||||||||||||||||||||||||
| |
Additional paid-in capital |
Retained earnings |
Total stockholders' equity |
|||||||||||||||||||||||||||||
| |
Shares | Amount | Shares | Amount | Shares | Amount | ||||||||||||||||||||||||||
Balance at June 30, 2007 |
— | $ | — | 100,874 | $ | 1,009 | (7,532 | ) | $ | (183,070 | ) | $ | 232,664 | $ | 791,953 | $ | 64 | $ | 842,620 | |||||||||||||
Comprehensive income (loss): |
||||||||||||||||||||||||||||||||
Net loss |
— | — | — | — | — | — | — | (235,076 | ) | — | (235,076 | ) | ||||||||||||||||||||
Accumulated other comprehensive income, net |
— | — | — | — | — | — | — | — | 45 | 45 | ||||||||||||||||||||||
Total comprehensive loss |
— | — | — | — | — | — | — | (235,076 | ) | 45 | (235,031 | ) | ||||||||||||||||||||
Issuance of preferred stock |
60 | 59,800 | — | — | — | — | (208 | ) | — | — | 59,592 | |||||||||||||||||||||
Conversion of preferred stock to common stock |
(60 | ) | (59,800 | ) | 5,320 | 54 | — | — | 59,746 | — | — | — | ||||||||||||||||||||
Options exercised |
— | — | 5 | — | — | — | 17 | — | — | 17 | ||||||||||||||||||||||
Stock issuance through employee stock purchase plan |
— | — | 45 | — | — | — | 883 | — | — | 883 | ||||||||||||||||||||||
Net stock issuance from vesting of stock units |
— | — | 212 | 2 | (38 | ) | (923 | ) | (2 | ) | — | — | (923 | ) | ||||||||||||||||||
Stock-based compensation |
— | — | — | — | — | — | 7,015 | — | — | 7,015 | ||||||||||||||||||||||
Tax benefit from stock-based compensation |
— | — | — | — | — | — | 383 | — | — | 383 | ||||||||||||||||||||||
Cash dividends declared ($0.395 per share) |
— | — | — | — | — | — | — | (36,944 | ) | — | (36,944 | ) | ||||||||||||||||||||
Balance at June 30, 2008 |
— | — | 106,456 | 1,065 | (7,570 | ) | (183,993 | ) | 300,498 | 519,933 | 109 | 637,612 | ||||||||||||||||||||
Comprehensive income (loss): |
||||||||||||||||||||||||||||||||
Net loss |
— | — | — | — | — | — | — | (363,020 | ) | — | (363,020 | ) | ||||||||||||||||||||
Accumulated other comprehensive income, net |
— | — | — | — | — | — | — | — | 159 | 159 | ||||||||||||||||||||||
Total comprehensive loss |
— | — | — | — | — | — | — | (363,020 | ) | 159 | (362,861 | ) | ||||||||||||||||||||
Issuance of preferred stock |
133 | 1 | — | — | — | — | 125,857 | — | — | 125,858 | ||||||||||||||||||||||
Net stock issuance from vesting of stock units |
— | — | 312 | 3 | (73 | ) | (253 | ) | (3 | ) | — | — | (253 | ) | ||||||||||||||||||
Stock-based compensation |
— | — | — | — | — | — | 7,285 | — | — | 7,285 | ||||||||||||||||||||||
Tax expense from stock-based compensation |
— | — | — | — | — | — | (2,176 | ) | — | — | (2,176 | ) | ||||||||||||||||||||
Balance at June 30, 2009 |
133 | 1 | 106,768 | 1,068 | (7,643 | ) | (184,246 | ) | 431,461 | 156,913 | 268 | 405,465 | ||||||||||||||||||||
Comprehensive loss: |
||||||||||||||||||||||||||||||||
Net loss |
— | — | — | — | — | — | — | (145,524 | ) | — | (145,524 | ) | ||||||||||||||||||||
Accumulated other comprehensive loss, net |
— | — | — | — | — | — | — | — | (5 | ) | (5 | ) | ||||||||||||||||||||
Total comprehensive loss |
— | — | — | — | — | — | — | (145,524 | ) | (5 | ) | (145,529 | ) | |||||||||||||||||||
Options exercised |
— | — | 6 | — | — | — | 4 | — | — | 4 | ||||||||||||||||||||||
Stock issuance from vesting of stock units |
— | — | 2,201 | 22 | (596 | ) | (1,972 | ) | (22 | ) | — | — | (1,972 | ) | ||||||||||||||||||
Stock-based compensation |
— | — | — | — | — | — | 13,013 | — | — | 13,013 | ||||||||||||||||||||||
Tax expense from stock-based compensation |
— | — | — | — | — | — | (1,166 | ) | — | — | (1,166 | ) | ||||||||||||||||||||
Balance at June 30, 2010 |
133 | $ | 1 | 108,975 | $ | 1,090 | (8,239 | ) | $ | (186,218 | ) | $ | 443,290 | $ | 11,389 | $ | 263 | $ | 269,815 | |||||||||||||
See accompanying notes to consolidated financial statements.
86
THE FIRST MARBLEHEAD CORPORATION AND SUBSIDIARIES
CONSOLIDATED STATEMENTS OF CASH FLOWS
Fiscal years ended June 30, 2010, 2009 and 2008
(dollars in thousands)
| |
2010 | 2009 | 2008 | ||||||||||
|---|---|---|---|---|---|---|---|---|---|---|---|---|---|
Cash flows from operating activities: |
|||||||||||||
Net loss |
$ | (145,524 | ) | $ | (363,020 | ) | $ | (235,076 | ) | ||||
Adjustments to reconcile net loss to net cash provided by (used in) operating activities: |
|||||||||||||
Depreciation and amortization |
13,359 | 17,800 | 19,633 | ||||||||||
Deferred tax benefit |
(28,791 | ) | (23,509 | ) | (237,363 | ) | |||||||
Stock-based compensation |
13,013 | 7,285 | 7,015 | ||||||||||
Losses on education loans held for sale |
130,955 | 138,163 | 7,373 | ||||||||||
Proceeds from the sale of education loans |
121,585 | — | — | ||||||||||
Proceeds from TERI to settle obligations on Union Federal's loans held for sale |
— | 30,046 | — | ||||||||||
Additional structural advisory fee distributions |
629 | 1,555 | — | ||||||||||
Other non-cash charges |
123 | 3,815 | 5,235 | ||||||||||
Changes in assets/liabilities: |
|||||||||||||
Education loans held for sale |
(9,799 | ) | (21,845 | ) | (480,234 | ) | |||||||
Additional structural advisory fees |
19,825 | 57,157 | 19,802 | ||||||||||
Asset servicing fees |
(3,395 | ) | (2,385 | ) | — | ||||||||
Residuals |
(2,863 | ) | 283,295 | 371,860 | |||||||||
Income taxes receivable |
148,850 | (166,410 | ) | 49,345 | |||||||||
Other assets |
1,655 | 12,821 | 23,001 | ||||||||||
Accounts payable and accrued expenses and other liabilities |
8,880 | (31,045 | ) | (6,671 | ) | ||||||||
Net cash provided by (used in) operating activities |
268,502 | (56,277 | ) | (456,080 | ) | ||||||||
Cash flows from investing activities: |
|||||||||||||
Net change in federal funds sold |
12,326 | 65,889 | (69,881 | ) | |||||||||
Purchases of short-term investments |
(75,000 | ) | — | — | |||||||||
Proceeds from maturities of short-term investments |
25,000 | — | — | ||||||||||
Purchases of investments held for sale |
— | (33,600 | ) | (33,300 | ) | ||||||||
Proceeds from maturities and dispositions of investments held for sale |
3,974 | 95,938 | 91,366 | ||||||||||
Purchases of other long-term assets |
(902 | ) | (2,137 | ) | (9,342 | ) | |||||||
Net change in loans held to maturity |
1,727 | 1,239 | 573 | ||||||||||
Net cash (used in) provided by investing activities |
(32,875 | ) | 127,329 | (20,584 | ) | ||||||||
Cash flows from financing activities: |
|||||||||||||
Net change in deposits |
(45,730 | ) | (89,651 | ) | 190,590 | ||||||||
(Payments for) proceeds from education loan warehouse facility |
(12,078 | ) | (12,762 | ) | 242,899 | ||||||||
Payments for capital leases and other long-term obligations |
(3,382 | ) | (3,578 | ) | (5,490 | ) | |||||||
Tax (expense) benefit from stock-based compensation |
(1,166 | ) | (2,176 | ) | 383 | ||||||||
Issuances of common stock, net |
4 | — | 900 | ||||||||||
Issuance of non-voting convertible preferred stock, net |
— | 125,858 | 59,592 | ||||||||||
Repurchase of common stock |
(1,972 | ) | (253 | ) | (923 | ) | |||||||
Cash dividends on common stock and cash paid in lieu of fractional shares |
— | — | (36,944 | ) | |||||||||
Net cash (used in) provided by financing activities |
(64,324 | ) | 17,438 | 451,007 | |||||||||
Net increase (decrease) in cash and cash equivalents |
171,303 | 88,490 | (25,657 | ) | |||||||||
Cash and cash equivalents, beginning of year |
158,770 | 70,280 | 95,937 | ||||||||||
Cash and cash equivalents, end of year |
$ | 330,073 | $ | 158,770 | $ | 70,280 | |||||||
Supplemental disclosures of cash flow information: |
|||||||||||||
Interest paid |
$ | 8,053 | $ | 16,151 | $ | 16,237 | |||||||
Income taxes paid |
112 | 41,622 | 51,772 | ||||||||||
Supplemental disclosure of non-cash activities: |
|||||||||||||
Reclassification of education loans held for sale to held to maturity |
$ | 785 | $ | — | $ | — | |||||||
Acquisition of property and equipment through capital leases |
— | — | 7,478 | ||||||||||
Conversion of series A non-voting convertible preferred stock to common stock |
— | — | 59,800 | ||||||||||
Reclassification of mortgages from held for sale to held to maturity |
— | — | 11,327 | ||||||||||
See accompanying notes to consolidated financial statements.
87
THE FIRST MARBLEHEAD CORPORATION AND SUBSIDIARIES
NOTES TO CONSOLIDATED FINANCIAL STATEMENTS
June 30, 2010, 2009 and 2008
(1) Nature of Business
Unless otherwise indicated or unless the context of the discussion requires otherwise, all references in these notes to consolidated financial statements to "we", "us", "our" or similar references mean The First Marblehead Corporation (FMD) and its subsidiaries on a consolidated basis. All references in these notes to consolidated financial statements to "FMD" means The First Marblehead Corporation on a standalone basis.
We offer outsourcing services to national and regional financial and educational institutions for designing and implementing private education loan programs. These school-certified loan programs are designed to be marketed through educational institutions or to prospective student borrowers and their families directly and to generate portfolios intended to be held by the originating lender or financed in the capital markets. We offer a fully integrated suite of services through our Monogram product, as well as certain services on a stand alone, fee-for-service basis. In addition, we provide administrative and other services to securitization trusts that we facilitated, asset servicing to the third-party owner of certain of those securitization trusts (NCSLT Trusts), as well as portfolio management services.
Our bank subsidiary, Union Federal Savings Bank (Union Federal), is a federally chartered thrift that offers residential and commercial mortgage loans, and retail savings, money market and time deposit products. As a result of our ownership of Union Federal, we are a savings and loan holding company subject to regulation, supervision and examination by the U.S. Office of Thrift Supervision (OTS). During the second quarter of fiscal 2010, we announced that we had begun exploring strategic alternatives for Union Federal. As of September 2, 2010, we were actively considering those alternatives, including a potential sale.
Substantially all of our financial results have been derived from our services relating to private education loans (education loans), which are considered to be in a single industry segment for financial reporting purposes.
Historically, the driver of our results of operations and financial condition was the volume of education loans for which we provided outsourcing services from loan origination through securitization. In addition, asset-backed securitizations were our sole source of permanent financing for our clients' education loan programs, and substantially all of our income was derived from securitizations. Securitization refers to the technique of pooling loans and selling them to a special purpose, bankruptcy remote entity, typically a trust, which issues notes backed by those loans to investors. In the past, we offered our clients a fully integrated suite of outsourcing services, but we did not charge separate fees for many of those services. Although we provided those various services without charging a separate fee, or at "cost" in the case of loan processing services, we generally entered into agreements with the lender clients giving us the exclusive right to securitize the education loans that they did not intend to hold. For our past securitization services, we are entitled to receive additional structural advisory fees from the trusts over time and, in the case of certain trusts, residual cash flows.
Business Trends, Uncertainties and Outlook
We have not accessed the securitization market since September 2007 as a result of market disruptions that began in the second quarter of fiscal 2008, continued through fiscal 2009 and, to a lesser extent, persisted as of June 30, 2010. General economic conditions in the United States have
88
THE FIRST MARBLEHEAD CORPORATION AND SUBSIDIARIES
NOTES TO CONSOLIDATED FINANCIAL STATEMENTS (Continued)
June 30, 2010, 2009 and 2008
(1) Nature of Business (Continued)
deteriorated and not fully recovered over this time period. Our business has been and continues to be materially adversely impacted by these conditions.
In addition, credit performance of consumer-related loans generally, as well as our education loan portfolios and those held by the various securitization trusts that we facilitated, were adversely affected by general economic conditions in the United States, including increased unemployment rates. The interest rate, economic and credit environments may continue to have a material negative effect on the estimated value of our service receivables.
Our lender clients previously had the opportunity to mitigate their credit risk through a loan repayment guaranty by The Education Resources Institute, Inc. (TERI). TERI guaranteed the education loans held by the NCSLT Trusts, and we historically received reimbursement from TERI for outsourced loan processing services we performed on TERI's behalf. In April 2008, TERI filed a voluntary petition for relief (TERI Reorganization) under Chapter 11 of the United States Bankruptcy Code (Bankruptcy Code). As a result of capital market disruptions and the TERI Reorganization, many clients elected to terminate some or all of their agreements with us, which resulted in a significant reduction in our facilitated loan volumes during fiscal 2009 and fiscal 2010 compared to prior fiscal years. The TERI Reorganization, together with capital markets dislocations, has had, and will likely continue to have, a material adverse effect on the securitization trusts' ability to realize guaranty obligations of TERI, the valuation of our receivables from the securitization trusts for past services and our ability to realize fully the cost reimbursement obligations of TERI.
As a result of economic conditions, we took several measures in fiscal 2010 and fiscal 2009 to adjust our business model:
- •
- During the fourth quarter of fiscal 2010, we entered into loan program agreements with SunTrust Bank and Kinecta Federal
Credit Union. Pursuant to the agreements, we will perform a range of services in support of school-certified education loan programs to be funded by these lenders, including, as applicable, loan
origination, portfolio management and other services. We have invested or will invest specified amounts of capital as a credit enhancement feature for these loan programs, and we expect to generate
ongoing monthly revenue through the maturity of the program loans. This revenue model is consistent with our objective of improving our cash flows and reducing our dependence on the credit and capital
markets. See Note 22, "Subsequent Events—Monogram Loan Programs," for more information.
- •
- In April 2010, we restructured the education loan warehouse facility of UFSB Private Loan SPV, LLC (UFSB-SPV), a wholly owned subsidiary of Union Federal at that time. The facility previously served as a source of interim financing for education loan programs that had been funded by Union Federal. The restructuring involved the substitution of FMD for Union Federal as master servicer under the indenture, the assumption by FMD of certain potential contingent liabilities of Union Federal under the facility, subject to a cap, and the indirect contribution by FMD of $6.5 million in cash and current education loans with an outstanding principal and interest balance of approximately $6.9 million, and a fair value of $3.1 million, to the facility. In exchange, the third-party conduit lender released Union Federal and UFSB-SPV from certain potential contingent liabilities, permitted the transfer of the membership interests of UFSB-SPV from Union Federal to a non-bank subsidiary of FMD and made certain concessions with
89
THE FIRST MARBLEHEAD CORPORATION AND SUBSIDIARIES
NOTES TO CONSOLIDATED FINANCIAL STATEMENTS (Continued)
June 30, 2010, 2009 and 2008
(1) Nature of Business (Continued)
- •
- In March 2010, the OTS terminated a supervisory agreement (Supervisory Agreement) with FMD and an order (Order) to cease
and desist with Union Federal. The Supervisory Agreement required FMD, among other things, to maintain a deposit at Union Federal in the amount of $30.0 million and maintain Union Federal's
regulatory capital ratios at specified levels. The Order required Union Federal, among other things, to reduce by December 31, 2009 the concentration of education loans to Tier 1 capital
(as defined in the regulations) plus allowances for loan losses below 50%. See Note 21, "Union Federal Regulatory Matters—Supervisory Agreement and Order to Cease and Desist," for
more information.
- •
- In October 2009, Union Federal sold approximately 88% of its portfolio of education loans held for sale, which excluded
loans held by UFSB-SPV, for gross proceeds of $121.6 million. As a result of the sale, Union Federal achieved the loan concentration reduction imposed by the OTS, and FMD was
refunded a deposit in the amount of $30.0 million that FMD had been required to maintain at Union Federal. In November 2009, Union Federal sold the remainder of its portfolio of education loans
held for sale, excluding loans held by UFSB-SPV, to a newly formed statutory trust owned by a subsidiary of FMD. See Note 5, "Education Loans Held for Sale," for more information.
- •
- In October 2009, we received tax refunds of $176.6 million related to operating losses for fiscal 2009 and the sale
of the trust certificate (Trust Certificate), of NC Residuals Owners Trust, which held our residual interests in the NCSLT Trusts. We sold the Trust Certificate in fiscal 2009. See Note 19,
"Income Taxes," for more information. In addition to the tax refund generated, the sale of the Trust Certificate is expected to eliminate certain future tax liabilities, which would have had a
material negative effect on our financial condition and liquidity. As a result of the sale, we are no longer entitled to receive residual cash flows from the NCSLT Trusts, although we continue to have
rights to additional structural advisory fees and asset servicing fees from the NCSLT Trusts, as well as additional structural advisory fees and residuals from certain trusts other than the NCSLT
Trusts. See Note 6, "Service Receivables and Related Revenues," for more information.
- •
- During the first quarter of fiscal 2010, we favorably resolved certain securities litigation, including dismissals of a
consolidated class action lawsuit and state and federal shareholder derivative lawsuits. No compensation in any form passed directly or indirectly from any defendant to any plaintiff or any of
plaintiffs' attorneys in any of these actions. In November 2009, we recouped $1.0 million in legal expenses pursuant to our directors and officers liability insurance policy.
- •
- In August 2008, we received $132.7 million in gross proceeds from an equity financing, which improved our liquidity position. See Note 13, "Stockholders' Equity—Preferred Stock," for more information.
respect to the interest rate and fees applicable to the facility. We believe that the restructuring will be viewed favorably by potential purchasers as we consider our strategic alternatives with respect to Union Federal. See Note 10, "Liabilities and Unused Lines of Credit—Education Loan Warehouse Facility," for more information.
90
THE FIRST MARBLEHEAD CORPORATION AND SUBSIDIARIES
NOTES TO CONSOLIDATED FINANCIAL STATEMENTS (Continued)
June 30, 2010, 2009 and 2008
(1) Nature of Business (Continued)
- •
- We greatly reduced our annual cash expenditure requirements through reductions in headcount, consolidation of office space and other cost saving initiatives that began in fiscal 2008 and continued through fiscal 2010. See Note 18, "General and Administrative Expenses," for more information.
We believe that our Monogram product will provide us with an opportunity to structure, process and originate education loans and that the two loan program agreements we have entered into are a significant step in our return to the education lending marketplace. We also believe that conditions in capital markets generally continued to improve during fiscal 2010, potentially creating additional flexibility with regard to the financing of education loans. We continue to believe, as of September 2, 2010, however, that the structure and economics of any financing transaction will be less favorable than our past securitizations, with possibly lower revenues and additional cash requirements on our part.
Our near term financial performance and future growth depend in large part on our ability to successfully market our Monogram product and transition to more fee-based revenues while growing and diversifying our client base. We are uncertain as to the degree of market acceptance our Monogram product will have, particularly in the current economic environment where many lenders continue to evaluate their education lending business models.
Servicing Concentration
As of June 30, 2010, there were six loan servicers providing services to trusts that we facilitated, including processing deferment and forbearance requests, sending out account statements and accrual notices, responding to borrower inquiries and collecting and crediting payments received from borrowers. As of June 30, 2010, Pennsylvania Higher Education Assistance Agency (PHEAA) serviced a significant majority of the loans for which we facilitated origination. PHEAA also operates under the name American Education Services.
(2) Significant Accounting Policies
Use of Estimates
The preparation of consolidated financial statements in accordance with U.S. generally accepted accounting principles requires management to make estimates, judgments and assumptions that affect the reported amounts of assets and liabilities and the disclosure of contingent assets and liabilities at the date of the financial statements, and the reported amounts of revenues and expenses during the reporting period. We base our estimates and judgments on historical experience, economic conditions and on various other factors. Actual results may differ from these estimates under varying assumptions or conditions. On an ongoing basis, we evaluate our estimates and judgments, particularly as they relate to accounting policies that we believe are most important to the portrayal of our financial condition and results of operations. Material estimates that are particularly susceptible to change relate to the recognition of service revenues and the valuation of our service receivables and our portfolio of education loans held for sale.
91
THE FIRST MARBLEHEAD CORPORATION AND SUBSIDIARIES
NOTES TO CONSOLIDATED FINANCIAL STATEMENTS (Continued)
June 30, 2010, 2009 and 2008
(2) Significant Accounting Policies (Continued)
(a) Cash and Cash Equivalents
All highly liquid debt instruments with original maturities of three months or less on the date of purchase, and all funds invested in money market funds are considered cash equivalents. Cash and cash equivalents are carried at cost, which approximates fair value.
(b) Investments
Investments with original maturities greater than three months and remaining maturities of less than one year at the date of purchase are classified as short-term investments and are carried at cost, which approximates fair value.
Investments in marketable debt securities are classified as either available for sale, trading or held to maturity. Available-for-sale investments are carried at fair value with net unrealized gains and losses recorded in other comprehensive income, a component of stockholders' equity. Trading securities are securities held in anticipation of short-term market movements, and are carried at fair value with net unrealized gains and losses recorded in the statement of operations. Investments are classified as held to maturity when we have both the ability and intent to hold the securities until maturity. Held-to-maturity investments are carried at amortized cost.
(c) Loans Held for Sale
Education loans held for sale and the related interest receivable are carried at the lower of cost or fair value. Fair value is evaluated on a quarterly basis. When available, fair value is based on quoted market values. In the absence of readily determined market values, fair value is estimated by management based on the present value of expected future cash flows from the education loans held for sale. These estimates are based on historical and third-party data, macroeconomic indicators and our industry experience with assumptions for, among other things, default rates, recovery rates on defaulted loans, prepayment rates and a discount rate commensurate with the risks involved. If readily determined market values became available, or if actual performance were to vary appreciably from management's estimates, the fair value of the education loans would need to be further adjusted, which could result in material differences from the recorded carrying amounts. We record changes in the carrying value of education loans held for sale and the related interest receivable in the statement of operations.
(d) Property and Equipment
Leasehold improvements, computers, software and other equipment are recorded at cost less accumulated depreciation and amortization. Depreciation and amortization are recorded in general and administrative expenses and are calculated using the straight-line method over the estimated useful lives of the assets or the remaining terms of the lease, if shorter. Maintenance and repairs are charged to general and administrative expense as incurred, while major leasehold improvements are capitalized and amortized over the lesser of their estimated useful life or the remaining terms of the lease.
Costs related to internal-use software development projects are capitalized if the software is expected to yield long-term operational benefits, such as operational efficiencies and/or incremental revenue streams.
92
THE FIRST MARBLEHEAD CORPORATION AND SUBSIDIARIES
NOTES TO CONSOLIDATED FINANCIAL STATEMENTS (Continued)
June 30, 2010, 2009 and 2008
(2) Significant Accounting Policies (Continued)
(e) Loans Held to Maturity
Loans are classified as held to maturity when we have both the intent and ability to hold the loans through maturity. Loan origination fees, net of certain direct organization costs, are deferred and recognized as an adjustment of the related loan yield using the interest method. If a mortgage loan is delinquent by greater than 90 days, the accrual of interest income on that loan is discontinued until the loan is brought current or paid. If an education loan is delinquent by greater than 90 days, the accrual of interest income on that loan is discontinued until the loan is brought current or paid or defaults. Past due status is based on contractual terms. An allowance for loan losses is established through a charge to non-interest expense. When management believes that the collection of a loan's principal balance is unlikely, the principal amount is charged to the allowance. Recoveries are credited to the allowance as amounts are recovered. Interest accrual is resumed on loans that become current.
(f) Fair Value of Financial Instruments
The Accounting Standards Codification (ASC) 820-10, Fair Value Measurements and Disclosures, of the Financial Accounting Standards Board (FASB), permits, but does not require, entities to measure many financial instruments and certain other items not specifically identified in other topics of the ASC, such as available-for-sale investments, at fair value. We have not elected to measure additional assets and liabilities at fair value.
Fair value is defined as the price that would be received in the sale of an asset, or paid to transfer a liability, in an orderly transaction between market participants at the measurement date. A three-level valuation hierarchy is used to qualify fair value measurements based upon the transparency of inputs to the valuation of an asset or liability as of the measurement date:
Level 1. Inputs to the valuation methodology are quoted prices (unadjusted) for identical assets or liabilities in active markets. Level 1 assets and liabilities include debt and equity securities and derivative financial instruments actively traded on exchanges, as well as U.S. Treasury securities and U.S. Government and agency mortgage-backed securities that are actively traded in highly liquid over-the-counter markets.
Level 2. Model inputs are observable inputs, other than Level 1 prices, such as quoted prices for similar assets and liabilities in active markets, quoted prices for identical or similar assets or liabilities in markets that are not active, and inputs that are observable or can be corroborated, either directly or indirectly, for substantially the full term of the financial instrument. Level 2 assets and liabilities include debt instruments that are traded less frequently than exchange traded securities and derivative instruments, for which the model inputs are observable in the market or can be corroborated by market observable data. Examples in this category are less frequently traded mortgage-backed securities, corporate debt securities and derivative contracts.
Level 3. Inputs to the valuation methodology are unobservable but significant to the fair value measurement. Examples in this category include interests in loans held for sale, certain securitized financial assets or certain private equity investments.
Fair value is applied to eligible assets based on quoted market prices, where available. For financial instruments for which quotes from recent exchange transactions are not available, fair value is
93
THE FIRST MARBLEHEAD CORPORATION AND SUBSIDIARIES
NOTES TO CONSOLIDATED FINANCIAL STATEMENTS (Continued)
June 30, 2010, 2009 and 2008
(2) Significant Accounting Policies (Continued)
based on discounted cash flow analysis and comparisons to similar instruments. Discounted cash flow analysis is dependent upon estimated future cash flows and the level of interest rates.
The methods used for current fair value calculations of Level 2 and Level 3 assets and liabilities may not be indicative of net realizable value or reflective of future fair values. If readily determined market values became available, or if actual performance were to vary appreciably from assumptions used, assumptions may need to be adjusted, which could result in material differences from the recorded carrying amounts. We believe our methods of determining fair value are appropriate and consistent with other market participants. However, the use of different methodologies or application of different assumptions to value certain financial instruments could result in a different estimate of fair value.
(g) Revenue Recognition
Additional Structural Advisory Fees. We are entitled to additional structural advisory fees for structuring and facilitating the securitization of the education loans held by various securitization trusts we facilitated, principally the NCSLT Trusts. We are entitled to receive these fees over time, based on the payment priorities established in the trusts' indentures. We generally become entitled to receive these additional fees, plus interest, once the parity ratio of trust assets to trust liabilities reaches a stipulated level, which ranges from 103.0% to 105.5%, or after all noteholders have been paid in full. The indentures relating to certain of the securitization trusts specify circumstances (Trigger Events) upon the occurrence of which payments that would otherwise be due with respect to additional structural advisory fees and residuals would instead be directed to the holders of the notes issued by the trusts until the condition causing the Trigger Event ceases to exist or all notes and related interest are paid in full.
Additional structural advisory fee receivables are carried at fair value. In the absence of readily determined market values, we update our estimates of the fair value of additional structural advisory fee receivables on a quarterly basis, based on the present value of expected future cash flows. Our estimates reflect assumptions for discount rates commensurate with the risks involved and trust performance assumptions, including estimated operational expenses, the expected annual rate and timing of education loan defaults and recoveries, macroeconomic factors, the annual rate and timing of education loan prepayments, the trend of contractual and market interest rates over the life of the loan pools, including the forward London Interbank Offered Rate (LIBOR), the cost of funding outstanding auction rate notes, the existence of Trigger Events and TERI's obligation and ability to pay default claims and its use of recoveries to replenish the segregated reserve accounts pledged to the NCSLT Trusts to secure its guaranty obligations (Pledged Accounts). See Note 12, "Commitments and Contingencies—TERI Reorganization," for more information regarding TERI's obligation to pay default claims. These assumptions are based on historical and third-party data, macroeconomic indicators and our industry experience.
If readily determined market values became available or if actual performance were to vary appreciably from assumptions used, assumptions may need to be adjusted, which could result in material differences from the recorded carrying amounts. Changes to the fair value of these receivables are recorded in the statement of operations as additional structural advisory fees—trust updates.
94
THE FIRST MARBLEHEAD CORPORATION AND SUBSIDIARIES
NOTES TO CONSOLIDATED FINANCIAL STATEMENTS (Continued)
June 30, 2010, 2009 and 2008
(2) Significant Accounting Policies (Continued)
Residuals. Residuals associated with any securitization trusts that we facilitated are typically junior in priority to the rights of the holders of the asset-backed securities (ABS) issued in the securitizations and any additional structural advisory fees. As a result, residual interests are comparable to equity securities and, as such, are carried at fair value on the balance sheet. For those trusts in which we retain a residual interest, fair value is estimated by management using the same assumptions used for additional structural advisory fee receivables, with the exception of the discount rate, which is higher, commensurate with the risks involved. Changes in the fair value during the period are included in the statement of operations as residuals—trust updates.
Asset Servicing Fees. In connection with the sale of the Trust Certificate, we entered into an asset services agreement (Asset Services Agreement) with the third-party purchaser of the Trust Certificate effective as of March 31, 2009. Pursuant to the terms of the Asset Services Agreement, we are entitled to asset servicing fees from the third-party purchaser for services provided to support its ownership of residual interests in the NCSLT Trusts. The services we provide include analysis and valuation optimization and services related to funding strategy, among others. As compensation for our services, we are entitled to a monthly asset servicing fee based on the aggregate outstanding principal balance of the loans owned by the NCLST Trusts. Our receipt of the fees, however, is contingent upon distributions available to the third-party purchaser of the Trust Certificate. Under no circumstance will we receive cash for our asset servicing fees until residual cash flows are distributed from the NCSLT Trusts.
If the third-party purchaser terminates the Asset Services Agreement without cause prior to 2019, it is required to pay a termination fee in addition to the receivables recorded as of the date of termination. The amount of the termination fee varies based on the year of termination; however, in all cases, the termination fee exceeds the receivables balance currently recorded. After December 31, 2019, we would not be entitled to a termination fee. In addition, if the third-party purchaser sells the Trust Certificate, the Asset Services Agreement is required to be transferred to the new owner. As such, we believe that receipt of our fees will come from either the residual distributions themselves or, in the case of termination, from the termination fee and, therefore, it is appropriate to record such receivable and recognize the related revenues.
In determining the appropriate accounting for our asset servicing fees, we relied on the revenue recognition guidance in ASC 605-10-25-1, Revenue Recognition—Revenue and Gains, which provides that revenue is recognizable when goods or services have been exchanged for cash or claims to cash, and an entity has substantially accomplished what it must do to be entitled to the benefits represented by the revenues. In addition, we considered the criteria enumerated in Staff Accounting Bulletin No. 104, Revenue Recognition, in our determination of revenue recognition:
- •
- An arrangement exists between the third-party purchaser and us, as evidenced by the contract;
- •
- Services have been provided in accordance with the arrangement;
- •
- The asset servicing fees are fixed and determinable as a percentage of the aggregate outstanding principal balance of the
education loans owned by the NCSLT Trusts; and
- •
- Collectability is reasonably assured through the residual cash flows of the NCSLT Trusts or the termination fee under the Asset Services Agreement, as described above.
95
THE FIRST MARBLEHEAD CORPORATION AND SUBSIDIARIES
NOTES TO CONSOLIDATED FINANCIAL STATEMENTS (Continued)
June 30, 2010, 2009 and 2008
(2) Significant Accounting Policies (Continued)
The amount of revenue recognized as fee income is equal to the estimated net present value of the receivable generated from services performed during the period. We discount the value of the asset servicing fees using a discount rate commensurate with similar receivables. In accordance with ASC 835-30-05, Interest—Imputation of Interest, we have presumed that a portion of the asset servicing fees received will represent interest compensation until cash distributions are actually received. Changes in the net present value of asset servicing fee receivables are recognized as fee updates in the statement of operations.
Administrative and Other Fees. Administrative fees are received from the securitization trusts for services performed in administering them, including their daily management, coordination of loan servicers and reporting information to the parties related to the securitizations. The fees are based upon a percentage of the outstanding principal balance of the loan pools of each of the trusts. The fees vary with each separate securitization and are recognized in service revenue when earned, as administrative services are provided.
During the fourth quarter of fiscal 2009, we began receiving fees from certain securitization trusts under a special servicing agreement. These fees are paid by the securitization trusts for the performance by us of default prevention services and management of education loan collections. Such fees are based, in part, upon the reimbursement of expenses, and are recognized as the expenses are incurred.
Other fees are earned on a stand-alone, fee-for-service basis and are considered earned in the period in which the service was provided, or in the case of loan originations, at the time the funds are disbursed or as the applications are processed, in accordance with contractual terms.
Net Interest Income. Interest income and interest expense are recognized using the effective interest method.
(h) Stock-based compensation
We record compensation expense equal to the estimated fair value on the grant date of stock options granted to purchase common stock, on a straight-line basis over the options' vesting period. We record compensation expense for equity-based awards other than options based on the timing of vesting.
We use a Black-Scholes option pricing model to determine the fair value of options granted. The fair values of equity-based awards other than options, such as restricted stock units (RSUs), are based on the price of our common stock on the date of grant.
(i) Income Taxes
In determining a provision for income taxes, the estimated annual effective tax rate is based on expected annual income, statutory tax rates and tax planning opportunities available to us in the various jurisdictions in which we operate. The estimated annual effective tax rate also includes our best estimate of the ultimate outcome of tax audits.
96
THE FIRST MARBLEHEAD CORPORATION AND SUBSIDIARIES
NOTES TO CONSOLIDATED FINANCIAL STATEMENTS (Continued)
June 30, 2010, 2009 and 2008
(2) Significant Accounting Policies (Continued)
The asset and liability method of accounting is utilized for recognition of income taxes. Under the asset and liability method, deferred tax assets and liabilities are recognized in connection with the tax effects of temporary differences between the financial statement carrying amounts of existing assets and liabilities and their respective tax bases and operating loss carry backs and carry forwards. Deferred tax assets and liabilities are measured using enacted tax rates expected to apply to taxable income in the years in which those temporary differences are expected to be recovered or settled. The effect of a change in tax rates on deferred tax assets and liabilities is recognized as tax expense (benefit) in the period that includes the enactment date. A deferred tax asset valuation allowance is established if it is considered more likely than not that all or a portion of the deferred tax assets will not be realized.
(j) Net Loss Per Share
Basic net loss per share is computed by dividing net loss by the basic weighted average number of shares of common stock outstanding for the periods presented. Diluted net income per share is computed by dividing net income by basic weighted average shares and, if dilutive, common stock equivalent shares outstanding during the period. To the extent income available to stockholders is a loss, all common stock equivalents are assumed to be anti-dilutive, and are excluded from diluted weighted average shares outstanding. Common stock equivalent shares outstanding are determined in accordance with the treasury stock method. Common stock equivalents consist of shares issuable upon the exercise of outstanding stock options, conversion of preferred stock to common stock and the vesting of RSUs.
(k) Consolidation
Our consolidated financial statements include the accounts of FMD and its subsidiaries, after eliminating inter-company accounts and transactions. We have not consolidated the financial results of the securitization trusts purchasing loans that we facilitated.
At June 30, 2010 and 2009, each of the securitization trusts created after January 31, 2003, has met the criteria to be a qualified special purpose entity (QSPE) as defined by ASC 860-40, Transfers and Servicing—Transfers to Qualifying Special Purpose Entities (ASC 860-40). Accordingly, we did not consolidate these existing securitization trusts in our financial statements. In addition, the securitization trusts created prior to January 31, 2003 in which we hold a variable interest that could result in our being considered the primary beneficiary of such trusts have been amended in order for them to be considered QSPEs.
Effective July 1, 2010, we adopted Accounting Standards Update (ASU) 2009-16, Transfers and Servicing (Topic 860)—Accounting for Transfers of Financial Assets (ASU 2009-16), and ASU 2009-17, Consolidations (Topic 810)—Improvements to Financial Reporting by Enterprises Involved With Variable Interest Entities (ASU 2009-17). Prior to their codification, ASU 2009-16 was referred to as Financial Accounting Standard 166, Accounting for Transfers of Financial Assets, an Amendment of FASB Statement 140, and ASU 2009-17 was referred to as Financials Accounting Standard 167, Amendments to FASB Interpretation No. 46(R).
97
THE FIRST MARBLEHEAD CORPORATION AND SUBSIDIARIES
NOTES TO CONSOLIDATED FINANCIAL STATEMENTS (Continued)
June 30, 2010, 2009 and 2008
(2) Significant Accounting Policies (Continued)
ASU 2009-16 removes the concept of a QSPE from ASC 860-40 and removes the exemption from consolidation for QSPEs from ASC 810-10, Consolidation (ASC 810-10). ASU 2009-17 updates ASC 810-10 to require that certain types of enterprises perform analyses to determine if they are the primary beneficiary of a variable interest entity. A primary beneficiary of a variable interest entity is the enterprise that has both of the following characteristics:
- •
- The power to direct the activities of a variable interest entity that most significantly impact the entity's economic
performance; and
- •
- The obligation to absorb losses of the entity that could potentially be significant to the variable interest entity or the right to receive benefits from the entity that could potentially be significant to the variable interest entity.
In addition, ASU 2009-17 requires us to continuously reassess whether consolidation of variable interest entities is appropriate, as opposed to the trigger-based assessment allowed under previous guidance. As a result, we may be required to consolidate or deconsolidate variable interest entities on a quarterly basis, which may lead to volatility in our financial results and make comparisons of results between time periods more challenging.
Effective July 1, 2010, we consolidated 14 securitization trusts that we previously facilitated and deconsolidated UFSB-SPV. Assets and liabilities of the entities consolidated were measured as if they had been consolidated at the time we became the primary beneficiary. All intercompany transactions are eliminated. Profits and losses of the consolidated variable interest entities are allocated to non-controlling interests based on the percentage ownership of voting interests, before the effect of intercompany elimination entries. ASU 2009-17 has been applied through a cumulative-effect adjustment to the opening balance of retained earnings at the effective date.
At the effective date of consolidation, we recorded a net increase in total assets and total liabilities of approximately $8.0 billion, and $8.8 billion, respectively, and a net decrease in total stockholders' equity of approximately $800 million (comprised of an increase in FMD stockholders' equity of approximately $60 million recorded as an adjustment to opening retained earnings more than offset by a non-controlling interest deficit of approximately $860 million). Included in these amounts were the following adjustments:
- •
- Consolidation of approximately $8.2 billion of held-to-maturity securitized loan
receivables, at amortized cost;
- •
- Consolidation of approximately $9.0 billion of non-recourse debt issued by the trusts to third-party
investors;
- •
- Reversal of additional structural advisory fee and residual interest receivables totaling $38.7 million, previously
recorded as due from the 14 asset securitization trusts consolidated; and
- •
- Deconsolidation of UFSB-SPV with assets of $108.4 million and liabilities of $225.0 million, and reversal of $45.9 million in deferred tax assets associated with the unrealized losses of UFSB-SPV on education loans held for sale.
After adoption of ASU 2009-16 and ASU 2009-17, our results of operations will no longer reflect securitization-related income, trust updates or administrative fees from the 14 securitization trusts.
98
THE FIRST MARBLEHEAD CORPORATION AND SUBSIDIARIES
NOTES TO CONSOLIDATED FINANCIAL STATEMENTS (Continued)
June 30, 2010, 2009 and 2008
(2) Significant Accounting Policies (Continued)
Instead, we will recognize interest income associated with securitized loan receivables in the same line item as interest income from non-securitized assets, as well as a provision for loan losses, and we will recognize interest expense associated with debt issued by the trusts to third-party investors on the same line item as other interest-bearing liabilities of FMD. On a consolidated basis, we will not record any revaluation gains or losses related to the additional structural advisory fee and residual interest receivables due from the 14 securitization trusts, but we continue to recognize revaluation gains and losses on receivables from securitization trusts that were not consolidated. The effect of the consolidation will be reflected in our results for the first quarter of fiscal 2011 ending September 30, 2010.
(l) New Accounting Pronouncements
ASU 2009-16 and ASU 2009-17, as described in "—Consolidation" above, are the only new accounting pronouncements issued, but not yet effective, that we expect will have a material impact to our financial statements when adopted. No recently effective accounting pronouncements have had a material impact on our financial statements.
(3) Cash and Cash Equivalents
The following table summarizes our cash and cash equivalents:
| |
June 30, | ||||||
|---|---|---|---|---|---|---|---|
| |
2010 | 2009 | |||||
| |
(dollars in thousands) |
||||||
Cash equivalents (money market funds) |
$ | 217,076 | $ | 142,723 | |||
Interest-bearing deposits with the Federal Reserve Bank |
92,545 | — | |||||
Interest-bearing deposits with other banks |
15,285 | 11,550 | |||||
Non-interest-bearing deposits with banks |
5,167 | 4,497 | |||||
Total cash and cash equivalents |
$ | 330,073 | $ | 158,770 | |||
Cash and cash equivalents of Union Federal of $115.1 million at June 30, 2010 are not available for dividends without prior approval from the OTS. Cash collected on delinquent and defaulted loans on behalf of the securitization trusts is deposited in segregated accounts for the eventual payment to the trusts. Cash held by UFSB-SPV is only available to the creditors of UFSB-SPV.
Included in cash equivalents is an investment in a money market fund for which the investment advisor is the institutional money management firm, Milestone Capital Management, LLC (MCM), a wholly-owned subsidiary of Milestone Group Partners. MCM receives fees for services it performs from the money market fund. Members of the immediate family of one of FMD's directors owned approximately 65% of Milestone Group Partners as of June 30, 2010, making MCM a related party. At June 30, 2010 and June 30, 2009, $30.0 million and $60.0 million of our holdings in money market funds, respectively, were invested in funds managed by MCM.
99
THE FIRST MARBLEHEAD CORPORATION AND SUBSIDIARIES
NOTES TO CONSOLIDATED FINANCIAL STATEMENTS (Continued)
June 30, 2010, 2009 and 2008
(4) Short-Term Investments and Investments Held for Sale
Short-term investments of $50.0 million at June 30, 2010 included certificates of deposit with highly rated financial institutions, carried at cost.
Available for sale investments consisted of mortgage-backed federal agency securities held by Union Federal, with gross unrealized gains of $263 thousand and $268 thousand at June 30, 2010 and 2009, respectively, recognized in other comprehensive income, a component of stockholders' equity.
(5) Education Loans Held for Sale
All education loans held for sale have variable rates. The following table reflects the carrying value of education loans held for sale:
| |
June 30, | |||||||
|---|---|---|---|---|---|---|---|---|
| |
2010 | 2009 | ||||||
| |
(dollars in thousands) |
|||||||
Principal and interest |
$ | 273,409 | $ | 526,542 | ||||
Fair value adjustment |
(165,975 | ) | (175,582 | ) | ||||
Net carrying value |
$ | 107,434 | $ | 350,960 | ||||
Principal and interest: |
||||||||
Pledged as collateral under education loan warehouse facility |
$ | 273,409 | $ | 261,923 | ||||
Delinquent (>90 days past due) |
4,410 | 10,619 | ||||||
In default (>180 days past due) |
46,660 | 21,818 | ||||||
| |
Fiscal years ended June 30, | |||||||||
|---|---|---|---|---|---|---|---|---|---|---|
| |
2010 | 2009 | 2008 | |||||||
| |
(dollars in thousands) |
|||||||||
Net carrying value, beginning of period |
$ | 350,960 | $ | 497,324 | $ | 24,463 | ||||
Losses on education loans held for sale |
(130,955 | ) | (138,163 | ) | (7,373 | ) | ||||
Cash receipts from TERI recorded as a reduction in fair value(1) |
— | (30,046 | ) | — | ||||||
Proceeds from the sale of education loans |
(121,585 | ) | — | — | ||||||
Reclassification of education loans from held for sale to held to maturity |
(785 | ) | — | — | ||||||
Net adjustment to reconcile net loss to cash (provided by) used in operating activities(2) |
9,799 | 21,845 | 480,234 | |||||||
Net carrying value, end of period |
$ | 107,434 | $ | 350,960 | $ | 497,324 | ||||
- (1)
- During
fiscal 2009, we received $30.0 million of segregated reserves held by TERI in settlement of Union Federal's claims in the TERI Reorganization,
which we recorded as a decrease to the fair value of loans held for sale.
- (2)
- Represents cash used for loans originated and non-cash accruals for interest income capitalized on loans in deferment, less aggregate principal and interest payments received.
100
THE FIRST MARBLEHEAD CORPORATION AND SUBSIDIARIES
NOTES TO CONSOLIDATED FINANCIAL STATEMENTS (Continued)
June 30, 2010, 2009 and 2008
(5) Education Loans Held for Sale (Continued)
At June 30, 2010, education loans held for sale consisted solely of an education loan portfolio held by UFSB-SPV. The assets of UFSB-SPV are pledged as collateral to the indenture trustee, for the benefit of the third-party conduit lender under the education loan warehouse facility (conduit lender). Loans used to secure the facility are subject to call provisions by the administrator of the indenture; therefore, we do not have the ability to hold those loans to maturity, and we have classified them as held for sale. The conduit lender's recourse to us is limited to the assets pledged as collateral.
At June 30, 2009, education loans held for sale included education loan portfolios held by both Union Federal and UFSB-SPV. During fiscal 2010 as part of a risk reduction plan agreed upon with the OTS, we took measures to decrease Union Federal's education loan portfolio concentration. In October 2009, Union Federal completed a sale of all education loans that it directly held and that were less than 31 days delinquent. The sale of these loans, which had an aggregate outstanding principal and accrued interest balance of approximately $233.8 million, resulted in proceeds to Union Federal of $121.6 million. Following the sale, the purchaser bears the risk of future performance of the loans, including risk of future default, except as otherwise set forth in the loan purchase and sale agreement. The sale did not include loans held by UFSB-SPV.
In November 2009, Union Federal sold the remainder of its portfolio of education loans held for sale, excluding loans held by UFSB-SPV, to a newly formed statutory trust owned by a subsidiary of FMD. Union Federal received proceeds of $3.9 million from the sale.
During the fourth quarter of fiscal 2010, we completed a restructuring of UFSB-SPV's education loan warehouse facility. On April 16, 2010, in connection with the restructuring of the facility, FMD indirectly contributed cash of $6.5 million and loans with a fair value of $3.1 million from the newly formed statutory trust owned by a subsidiary of FMD to UFSB-SPV. These loans serve as collateral for the debt outstanding under the facility.
See Note 8, "Loans Held to Maturity," for additional information on the loans reclassified as held to maturity and Note 10, "Liabilities and Unused Lines of Credit—Education Loan Warehouse Facility," for additional information about the restructuring of the education loan warehouse facility.
(6) Service Receivables and Related Revenues
Additional structural advisory fees and residual receivables represent the estimated fair value of service receivables expected to be collected over the life of the various separate securitization trusts that have purchased education loans facilitated by us, with no further service obligations on our part. Asset servicing fee receivables represent the estimated fair value of service revenues earned as of the balance sheet date from the purchaser of the Trust Certificate.
101
THE FIRST MARBLEHEAD CORPORATION AND SUBSIDIARIES
NOTES TO CONSOLIDATED FINANCIAL STATEMENTS (Continued)
June 30, 2010, 2009 and 2008
(6) Service Receivables and Related Revenues (Continued)
(a) Additional Structural Advisory Fee Receivables
The following table summarizes changes in the estimated fair value of our additional structural advisory fee receivables:
| |
Fiscal years ended June 30, | ||||||||||||
|---|---|---|---|---|---|---|---|---|---|---|---|---|---|
| |
2010 | 2009 | 2008 | ||||||||||
| |
(dollars in thousands) |
||||||||||||
Fair value at beginning of period |
$ | 55,130 | $ | 113,842 | $ | 133,644 | |||||||
Additions from new securitizations |
— | — | 24,304 | ||||||||||
Cash received from trust distributions |
(629 | ) | (1,555 | ) | — | ||||||||
Trust updates: |
|||||||||||||
Passage of time—fair value accretion |
6,194 | 9,362 | 10,258 | ||||||||||
Increase in timing and average default rate |
(42,081 | ) | (11,262 | ) | (2,910 | ) | |||||||
Decrease (increase) in average prepayment rate |
25,338 | 3,127 | (3,168 | ) | |||||||||
Increase in discount rate assumption |
(9,803 | ) | (23,022 | ) | (41,555 | ) | |||||||
Decrease in forward LIBOR curve |
(2,305 | ) | (12,517 | ) | (5,442 | ) | |||||||
Increase in auction rate notes spread |
— | (13,087 | ) | (140 | ) | ||||||||
Decrease in recovery assumption |
— | (9,416 | ) | — | |||||||||
Other factors, net |
2,832 | (342 | ) | (1,149 | ) | ||||||||
Net change from trust updates |
(19,825 | ) | (57,157 | ) | (44,106 | ) | |||||||
Fair value at end of period |
$ | 34,676 | $ | 55,130 | $ | 113,842 | |||||||
At June 30, 2010 and 2009, additional structural advisory fee receivables were primarily due from the NCSLT Trusts. At June 30, 2010 and 2009, the aggregate outstanding principal balance of the debt issued by the NCSLT Trusts was $12.10 billion and $12.77 billion, respectively. The principal underlying assets in the NCSLT Trusts were TERI-guaranteed education loans, of which approximately 23.2% were in deferment, 4.7% were in forbearance and 72.1% were in repayment status as of June 30, 2010. Approximately 91.2% of the loans in repayment status as of June 30, 2010 were current, 4.5% were between 31 and 90 days past due, 2.3% were between 91 and 180 days past due, and 2.0% were greater than 180 days past due. All borrowers who are current in making repayments, even if the original amount of such repayments has been reduced pursuant to a temporarily modified payment plan, are considered current and in repayment status. As of June 30, 2010, the cumulative gross default rate with regard to loans in, and loans that have previously been in, repayment status in the NCSLT Trusts was 14.5%.
102
THE FIRST MARBLEHEAD CORPORATION AND SUBSIDIARIES
NOTES TO CONSOLIDATED FINANCIAL STATEMENTS (Continued)
June 30, 2010, 2009 and 2008
(6) Service Receivables and Related Revenues (Continued)
(b) Residual Interest Receivables
The following table summarizes the changes in the estimated fair value of our residual receivables:
| |
Fiscal years ended June 30, | ||||||||||||
|---|---|---|---|---|---|---|---|---|---|---|---|---|---|
| |
2010 | 2009 | 2008 | ||||||||||
| |
(dollars in thousands) |
||||||||||||
Fair value at beginning of period |
$ | 9,960 | $ | 293,255 | $ | 665,115 | |||||||
Additions from new securitizations |
— | — | 116,972 | ||||||||||
Trust updates: |
|||||||||||||
Passage of time—fair value accretion |
1,828 | 20,453 | 75,070 | ||||||||||
Decrease (increase) in discount rate assumption |
1,176 | (82,571 | ) | (129,169 | ) | ||||||||
Increase in timing and average default rate |
(353 | ) | (50,108 | ) | (49,929 | ) | |||||||
Increase (decrease) in forward LIBOR curve |
160 | (22,009 | ) | (17,590 | ) | ||||||||
Increase in auction rate notes spread |
— | (31,779 | ) | (93,813 | ) | ||||||||
Decrease (increase) in average prepayment rate |
— | 11,336 | (34,765 | ) | |||||||||
Decrease to reflect disposition(1) |
— | (134,481 | ) | — | |||||||||
TERI's inability to pay claims |
— | — | (219,553 | ) | |||||||||
Increase in trust expenses |
— | — | (9,026 | ) | |||||||||
Other factors, net |
52 | 5,864 | (10,057 | ) | |||||||||
Net change from trust updates |
2,863 | (283,295 | ) | (488,832 | ) | ||||||||
Fair value at end of period |
$ | 12,823 | $ | 9,960 | $ | 293,255 | |||||||
- (1)
- On
March 31, 2009, NC Residuals Owners Trust was formed by the statutory conversion of our wholly-owned subsidiary, GATE Holdings, Inc. As a
result of the conversion, we became the sole legal and beneficial owner of the Trust Certificate. NC Residuals Owners Trust, together with its wholly-owned subsidiary, owned certain certificates of
beneficial ownership interests (Residuals) of the NCSLT Trusts. The NCSLT Trusts are the holders of substantially all TERI-guaranteed loans facilitated by us.
Effective March 31, 2009, we entered into, among other agreements, a purchase agreement (Purchase Agreement) with VCG Owners Trust, a newly formed statutory trust (Purchaser), and VCG Securities, LLC (Vanquish Investor). The Purchaser and Vanquish Investor are affiliates of Vanquish Capital Management LLC.
Pursuant to the Purchase Agreement, we transferred the Trust Certificate to the Purchaser effective as of March 31, 2009, and we recorded a decrease in the carrying value of our residual receivables of $134.5 million. As a result, the Purchaser became the indirect owner of the Residuals that were formerly owned by us indirectly through NC Residuals Owners Trust. In consideration for the sale, the Purchaser and Vanquish Investor agreed to bear all future federal and state tax liabilities associated with the Residuals.
103
THE FIRST MARBLEHEAD CORPORATION AND SUBSIDIARIES
NOTES TO CONSOLIDATED FINANCIAL STATEMENTS (Continued)
June 30, 2010, 2009 and 2008
(6) Service Receivables and Related Revenues (Continued)
(c) Asset Servicing Fee Receivables
In connection with the sale of the Residuals discussed above, we entered into an Asset Services Agreement and a data sharing and license agreement with the Purchaser, also effective March 31, 2009. Pursuant to the Asset Services Agreement, we have agreed to provide certain asset servicing to the Purchaser to support the Purchaser's ownership of the Residuals, including, among others, analysis and valuation optimization services and services relating to funding strategy. As compensation for services, we are entitled to an asset servicing fee, calculated as a percentage of the aggregate outstanding principal balance of loans outstanding in the trusts. Although this fee is earned monthly, our right to receive the fee is contingent on distributions made to the holders of the Residuals. Distributions made by each of the NCSLT Trusts will be allocated as follows:
- •
- commencing with the first calendar month in which residual cash flows are paid, and for each payment date during the next
60 calendar months from that date, we will receive 60.0% of the residual cash flows;
- •
- for each payment date after that, we will receive 40.0% of residual cash flows until all earned but unpaid asset servicing
fees are paid in full; and
- •
- thereafter, once all earned but unpaid fees have been received, we will receive our monthly fee, paid in full.
We will not receive any asset servicing fees until the Purchaser has begun to receive residual cash flows.
During fiscal 2010, our asset servicing fees earned, reported as fee income, reflected a full year of earnings, while the Asset Services Agreement was only in effect for one fiscal quarter in fiscal 2009. Fee updates for fiscal 2010 were a loss of $3.5 million in fiscal 2010, reflecting changes in the volume and timing of projected cash flows available to the Residual holders of the NCSLT Trusts for the payment of such fees. See "—Performance Assumptions Overview" below for changes in performance assumptions. Fee updates in fiscal 2009 reflected accretion for the passage of time.
(d) Performance Assumption Overview
During the third quarter of fiscal 2010, we completed initial enhancements to the financial models that we use to estimate the fair value of our service receivables. The enhancements provided for the inclusion of certain prospective macroeconomic factors in our performance assumptions for those education loans securitized in the NCSLT Trusts.
Risk Segments. During the third quarter of fiscal 2010, we retroactively scored loans held by the NCSLT Trusts using our proprietary risk score modeling, origination data and additional credit bureau data made available following origination. We then divided loans into three risk segments, with loans in Segment 1 expected to perform better than loans in Segment 2, and loans in Segment 2 expected to
104
THE FIRST MARBLEHEAD CORPORATION AND SUBSIDIARIES
NOTES TO CONSOLIDATED FINANCIAL STATEMENTS (Continued)
June 30, 2010, 2009 and 2008
(6) Service Receivables and Related Revenues (Continued)
perform better than loans in Segment 3. The table below identifies performance assumptions for each segment, as well as the percentage of the NCSLT Trust portfolios in each segment.
| |
June 30, 2010 | ||||||||||
|---|---|---|---|---|---|---|---|---|---|---|---|
NCSLT Portfolio
|
Segment 1 | Segment 2 | Segment 3 | ||||||||
Distribution by original loan amount |
25.5 | % | 27.0 | % | 47.5 | % | |||||
Distribution by total outstanding loan amount(1): |
|||||||||||
Not in repayment(2) |
4.3 | 6.7 | 16.9 | ||||||||
In repayment |
18.5 | 20.5 | 33.1 | ||||||||
Total by segment |
22.8 | 27.2 | 50.0 | ||||||||
Gross default rate(3) |
9.7 | 19.6 | 48.8 | ||||||||
Recovery rate(3) |
40.0 | 40.0 | 40.0 | ||||||||
Net default rate(3) |
5.8 | 11.8 | 29.3 | ||||||||
Prepayment rate(4) |
6.9 | 4.9 | 3.1 | ||||||||
- (1)
- Outstanding
aggregate principal and capitalized interest balance as of June 30, 2010.
- (2)
- Loans
"not in repayment" include loans in deferment or forbearance status as of June 30, 2010.
- (3)
- Using
projected defaults, net defaults and recoveries over the lives of the trusts as a percentage of original outstanding aggregate principal and accrued
interest balance.
- (4)
- Amount presented is the weighted average conditional prepayment rate (CPR) over the lives of the trusts. The CPR is an estimate of the likelihood that a loan will be prepaid during a period given that it has not previously defaulted or been repaid in full.
The table below identifies our overall assumptions as of June 30, 2009 and 2008:
| |
June 30, | Year over year change |
||||||||
|---|---|---|---|---|---|---|---|---|---|---|
| |
2009 | 2008 | 2009 - 2008 | |||||||
Gross default rate |
19.0 | % | 14.8 | % | 4.2 | % | ||||
Net default rate |
11.4 | 7.7 | 3.7 | |||||||
Recovery rate |
40.0 | 48.0 | (8.0 | ) | ||||||
Prepayment rate |
8.0 | 8.4 | (0.4 | ) | ||||||
Year-end discount rate assumptions for fiscal 2010, 2009 and 2008 were as follows:
| |
|
|
|
Year over year change | |||||||||||||||
|---|---|---|---|---|---|---|---|---|---|---|---|---|---|---|---|---|---|---|---|
| |
June 30, | ||||||||||||||||||
| |
2010 - 2009 | 2009 - 2008 | 2008 - 2007 | ||||||||||||||||
| |
2010 | 2009 | 2008 | ||||||||||||||||
Additional structural advisory fee receivables |
14.0 | % | 12.5 | % | 9.7 | % | 1.5 | % | 2.8 | % | 2.7 | % | |||||||
Asset servicing fee and residual receivables |
16.0 | 17.0 | 14.9 | (1.0 | ) | 2.1 | 3.1 | ||||||||||||
105
THE FIRST MARBLEHEAD CORPORATION AND SUBSIDIARIES
NOTES TO CONSOLIDATED FINANCIAL STATEMENTS (Continued)
June 30, 2010, 2009 and 2008
(6) Service Receivables and Related Revenues (Continued)
Default and Recovery Rates. During fiscal 2010, we reduced the carrying value of additional structural advisory fee receivables by $42.1 million as a result of higher assumed default rates, with no change to recovery rates. The change in our default assumptions had the effect of delaying the projected timing of our receipt and amount of cash flows available for asset servicing fees. As a result, we decreased asset servicing fee receivables by $3.5 million for fiscal 2010. Our residual receivables, which decreased by $353 thousand during fiscal 2010, were less affected by the change in default rates in light of our sale of the Trust Certificate in fiscal 2009.
During fiscal 2009, we increased our gross default rate assumption from 14.8% to 19.0%, reflecting general economic conditions and actual loss experience of the trusts. In addition, we reduced our assumed recovery rate from 48.0% to 40.0%, and we lengthened the recovery timetable we used from nine to 15 years as a result of a refinement to the methodology for determining the endpoint default rate, as well as the actual timing of recoveries. The higher gross default rates resulted in decreases in the estimated fair values of our additional structural advisory fee and residual receivables of $11.3 million and $50.1 million, respectively, during fiscal 2009. The change in rate and timing of recoveries reduced the estimated fair value of additional structural advisory fees by $9.4 million, but did not have a material impact on residual receivables because the change was made in the fourth quarter, subsequent to the sale of the Trust Certificate.
During fiscal 2008, the higher projected gross default rate resulted from weakening general economic conditions. The gross default rate increased by 5.4% during fiscal 2008 to 14.8%, reducing the fair value of additional structural advisory fee and residual receivables by $2.9 million and $49.9 million, respectively. The increase in the recovery rate from 40.0% to 48.0% did not have a material impact.
Prepayment Rates. In general, prepayment rates have been in decline since March 2008. Our financial model enhancements incorporate certain prospective macroeconomic factors in determining prepayment assumptions. As a result of those macroeconomic factors, including the interest rate environment and economic conditions such as unemployment rates, prepayments are expected to be lower and slower than previously projected and, therefore, we increased the value of our structural advisory fee receivables by $25.3 million during fiscal 2010. Changes to prepayment rates did not significantly affect the fair value of our residual or asset servicing fee receivables.
During fiscal 2009, in response to a historically low prepayment rate, we decreased our assumed prepayment rate by 0.4%, which resulted in an increase to additional structural advisory fee receivables of $3.1 million and an increase to the residual receivables of $11.3 million prior to the sale of the Trust Certificate.
During fiscal 2008, prepayment rates increased by 0.4% due to higher prepayment activity experienced by the trusts during that period. As a result, we recorded decreases in the estimated fair value of our additional structural advisory fee and residual receivables of $3.2 million and $34.8 million, respectively.
Discount Rate—Additional Structural Advisory Fees. Until the third quarter of fiscal 2010, the discount rate that we used to estimate the fair value of our additional structural advisory fees was based on the 10-year U.S. Treasury Bond rate plus a risk premium. In determining the risk premium,
106
THE FIRST MARBLEHEAD CORPORATION AND SUBSIDIARIES
NOTES TO CONSOLIDATED FINANCIAL STATEMENTS (Continued)
June 30, 2010, 2009 and 2008
(6) Service Receivables and Related Revenues (Continued)
we considered factors such as yields on B-rated instruments, the level of available cash flows from residual interests that support the additional structural advisory fees, as well as the weighted-average life of the additional structural advisory fee receivables.
Beginning in the third quarter of fiscal 2010, we utilized a discount rate of 14.0% in determining the fair value of our additional structural advisory fee receivables. The change from an index-based discount rate to a rate of 14.0% reflects a reduction in the amount of residual interest cash flows available to support the cash flows available for additional structural advisory fees, as well as the lengthening of the weighted-average life of our additional structural advisory fee receivables. The combination of these factors led us to determine that additional structural advisory fee receivables are more analogous to longer-term financial instruments than 10-year debt instruments and, therefore, a higher discount rate is appropriate. The 14.0% discount rate used for additional structural advisory fees reflects market data made available to us on spreads on federally guaranteed loans and education loans, as well as rates used in the much broader ABS market and is 2.0% less than the 16.0% used for residual receivables, reflecting the seniority of our additional structural advisory fees in our cash flow waterfall of the securitization trusts. The increase in the discount rate resulted in a $9.8 million decrease in the value of additional structural advisory fee receivables for fiscal 2010.
During fiscal 2009, we increased the discount rate spread over the 10-year U.S. Treasury Bond rate by 3.2%, to 9.0%. In increasing the discount rate, we considered, among other things, overall significant widening in spreads in the ABS marketplace, as well as increases in indicative spreads on subordinate education loan securities. The 10-year U.S. Treasury Bond rate decreased by 0.4% during the same period, to 3.5% at June 30, 2009. As a result, we applied a discount rate of 12.5% for purposes of estimating the fair value of our additional structural advisory fees. The increase in the discount rate during fiscal 2009 resulted in a decrease of $23.0 million in the estimated fair value of additional structural advisory fee receivables.
During fiscal 2008, we increased the discount rate spread over the 10-year U.S. Treasury Bond rate from 2.0% to 5.8%. The 10-year U.S. Treasury Note rate decreased by 1.1% during the same period resulting in a discount rate of 9.7% up 2.7% from June 30, 2007, in response to the deterioration in the market for structured and corporate debt. The effect of the increase to the discount rate was a decrease of $41.6 million in the estimated fair value of additional structural advisory fee receivables during fiscal 2008.
Discount Rate—Asset Servicing Fees and Residuals. In determining an appropriate discount rate for purposes of estimating the fair value of our asset servicing fee and residual receivables, we consider a number of factors, including market data made available to us on spreads on federally guaranteed loans and education loans, as well as rates used in the much broader ABS market. We also evaluate yield curves for corporate subordinated debt with maturities similar to the weighted-average life of our residuals.
We applied a discount rate of 16.0% during fiscal 2010, which was a decrease of 1.0%, from 17.0%, at the prior year-end. As a result, there was an increase in residual receivables of $1.2 million during fiscal 2010 due to changes in the discount rate and no material change to our asset servicing fee receivable.
107
THE FIRST MARBLEHEAD CORPORATION AND SUBSIDIARIES
NOTES TO CONSOLIDATED FINANCIAL STATEMENTS (Continued)
June 30, 2010, 2009 and 2008
(6) Service Receivables and Related Revenues (Continued)
During fiscal 2009, we increased the discount rate from 14.9% to 17.0%, which resulted in decreases in the estimated fair value of our residual receivables of $82.6 million. The increase over the fiscal year was in response to the deterioration of the ABS market and revised assumptions about TERI's ability to pay claims.
During fiscal 2008, we increased the discount rate used for estimating for residual receivables by 3.1% to 14.9% in response to deteriorating market conditions. The higher discount rate resulted in a reduction to the estimated fair value of residual receivables of $129.2 million.
Forward LIBOR Curve. Fluctuations in interest rates, specifically LIBOR, which is the underlying rate for most of the trusts' assets and liabilities, can have a significant impact on the cash flows generated by each trust. The forward LIBOR curve is a market observable input obtained from an independent third party. Changes in the forward LIBOR curve can have a significant impact on the principal balances of the education loans (especially early in a loan's life when interest is capitalizing on loans in deferment), which affects the overall net interest margin the trust can generate, and can impact our additional structural advisory fee receivables as the majority of accrued but unpaid fees bear interest at LIBOR plus 1.5%. In addition, certain trusts have issued a tranche of ABS that bears a fixed interest rate. A decrease in the forward LIBOR curve may result in a reduced spread on the fixed interest-rate tranche, which, in turn, decreases the estimated fair value of our service receivables.
For the fiscal year ended June 30, 2010, the forward LIBOR curve shifted downward from the prior year-end, reducing the value of the additional structural advisory fee receivables by $2.3 million, with no material impact to residual receivables.
During fiscal 2009, large decreases in the forward LIBOR curve resulted in decreases in the estimated fair value of additional structural advisory fee and residual receivables of $12.5 million and $22.0 million, respectively. Similarly, during fiscal 2008, decreases in the forward LIBOR curve resulted in decreases in the estimated fair value of additional structural advisory fee and residual receivables of $5.4 million and $17.6 million, respectively.
Auction Rate Note Interest Rates. Prior to fiscal 2009, we facilitated five trusts that issued auction rate notes to finance, in whole or in part, the purchase of education loans. Interest rates for the auction rate notes are determined from time to time at auction; however, during fiscal 2010 and fiscal 2009, failed auctions occurred or persisted with respect to auction rate notes issued by each of the five trusts. In the second quarter of fiscal 2009, the ratings assigned to the auction rate notes of these trusts were downgraded due to failed auctions, deterioration in trust performance and the downgrade of the insurance financial strength rating assigned to the credit enhancement provider for certain auction rate notes. As a result, the auction rate notes bear interest at a maximum spread over one-month LIBOR as specified in the indentures, based on the ratings then assigned to the notes. Increases in the interest expense of the trusts reduced the estimated fair value of our additional structural advisory fees and residual receivables and delayed the timing of receipt of additional structural advisory fees. As a result, during the second quarter of fiscal 2009, we decreased the estimated fair value of our additional structural advisory fees by $13.1 million and our residual receivables by $31.8 million. We did not make any further adjustments during fiscal 2009. During fiscal 2010, we have assumed that the notes would continue to bear interest at the contractual maximum spread.
108
THE FIRST MARBLEHEAD CORPORATION AND SUBSIDIARIES
NOTES TO CONSOLIDATED FINANCIAL STATEMENTS (Continued)
June 30, 2010, 2009 and 2008
(6) Service Receivables and Related Revenues (Continued)
TERI's Obligation to Pay Claims. During fiscal 2008, we reduced the carrying value of our residual receivables in response to the TERI Reorganization and our assumption that TERI would not be able to honor its guaranty obligations to the NCSLT Trusts beyond the amounts available in the Pledged Accounts, assuming that all recoveries on defaulted loans would be used to replenish such Pledged Accounts. The change in our assumptions with regard to TERI's ability to pay claims resulted in a decrease of $219.6 million in the estimated fair value of our residual receivables during fiscal 2008. No changes were made to our assumptions regarding TERI's ability to pay claims during fiscal 2009. During fiscal 2010, we updated our assumptions regarding TERI's obligation to pay claims based on the Plan of Reorganization presented for creditor approval in April 2010. The updated assumptions did not have a material effect on the estimated value of our additional structural advisory fee or asset servicing fee receivables. The Modified Plan of Reorganization, which was filed in August 2010, changes certain aspects of the settlements offered to the NCSLT Trusts compared to the settlements offered by the Plan of Reorganization. As of September 2, 2010, we did not expect those changes to have a material effect on the estimated fair value of our service receivables. As of September 2, 2010, the voting and confirmation process for the Modified Plan of Reorganization had not commenced and the Modified Plan of Reorganization remains subject to change.
Sensitivity Analysis
Increases in our estimates of defaults, prepayments and discount rates, as well as decreases in default recovery rates and the multi-year forward estimates of LIBOR, would have a negative effect on the value of our additional structural advisory fees, as well as our asset servicing fee receivables and our education loans held for sale.
The following table illustrates the anticipated impact on the fair value of additional structural advisory fee receivables that would occur for changes in loan performance and discount rate assumptions at June 30, 2010. We used variations of 10% and 20%, up and down, except for the forward LIBOR rates, which are based on variations of 1% and 2%, from the assumptions used at June 30, 2010. We also assumed that the Plan of Reorganization, including terms applicable to the NCSLT Trusts, would be confirmed by the United States Bankruptcy Court for the District of Massachusetts (Bankruptcy Court). Changes to the Plan of Reorganization, such that the NCLST Trusts were to receive less defaulted loans or less recoveries on defaulted loans, would have an additional negative effect on the value of our receivables.
The sensitivities presented below are hypothetical and should be used with caution. The effect of each change in assumption must be calculated independently, holding all other assumptions constant. Because the key assumptions may not in fact be independent, the net effect of simultaneous adverse
109
THE FIRST MARBLEHEAD CORPORATION AND SUBSIDIARIES
NOTES TO CONSOLIDATED FINANCIAL STATEMENTS (Continued)
June 30, 2010, 2009 and 2008
(6) Service Receivables and Related Revenues (Continued)
changes in key assumptions may differ materially from the sum of the individual effects calculated below. For a description of risk segments, see "—Risk Segments" above.
| |
Change in assumption |
Management assumptions and receivables balance at June 30, 2010 |
Change in assumption |
||||||||||||||
|---|---|---|---|---|---|---|---|---|---|---|---|---|---|---|---|---|---|
Structural advisory fees
|
Down 20% | Down 10% | Up 10% | Up 20% | |||||||||||||
| |
(dollars in thousands) |
||||||||||||||||
Default rate: |
|||||||||||||||||
Management assumptions(1): |
|||||||||||||||||
Segment 1 |
8.8 | % | 9.2 | % | 9.7 | % | 10.1 | % | 10.6 | % | |||||||
Segment 2 |
17.8 | 18.7 | 19.6 | 20.5 | 21.4 | ||||||||||||
Segment 3 |
45.2 | 47.1 | 48.8 | 50.5 | 52.2 | ||||||||||||
Total structural advisory fees |
$ | 37,338 | $ | 35,999 | $ | 34,676 | $ | 33,177 | $ | 27,834 | |||||||
Change in receivables balance |
7.7 | % | 3.8 | % | (4.3 | )% | (19.7 | )% | |||||||||
Default recovery rate: |
|||||||||||||||||
Management assumption |
32.0 | % | 36.0 | % | 40.0 | % | 44.0 | % | 48.0 | % | |||||||
Total structural advisory fees |
$ | 30,471 | $ | 33,242 | $ | 34,676 | $ | 35,732 | $ | 36,699 | |||||||
Change in receivables balance |
(12.1 | )% | (4.1 | )% | 3.0 | % | 5.8 | % | |||||||||
Annual prepayment rate: |
|||||||||||||||||
Management assumption: |
|||||||||||||||||
Segment 1 |
5.5 | % | 6.2 | % | 6.9 | % | 7.6 | % | 8.3 | % | |||||||
Segment 2 |
3.9 | 4.4 | 4.9 | 5.4 | 5.9 | ||||||||||||
Segment 3 |
2.5 | 2.8 | 3.1 | 3.4 | 3.7 | ||||||||||||
Total structural advisory fees |
$ | 35,390 | $ | 35,038 | $ | 34,676 | $ | 34,299 | $ | 33,915 | |||||||
Change in receivables balance |
2.1 | % | 1.0 | % | (1.1 | )% | (2.2 | )% | |||||||||
Discount rate: |
|||||||||||||||||
Management assumption |
11.2 | % | 12.6 | % | 14.0 | % | 15.4 | % | 16.8 | % | |||||||
Total structural advisory fees |
$ | 53,054 | $ | 42,859 | $ | 34,676 | $ | 28,101 | $ | 22,815 | |||||||
Change in receivables balance |
53.0 | % | 23.6 | % | (19.0 | )% | (34.2 | )% | |||||||||
| |
Change in assumption |
|
Change in assumption |
||||||||||||||
|---|---|---|---|---|---|---|---|---|---|---|---|---|---|---|---|---|---|
| |
Receivables balance |
||||||||||||||||
| |
Down 2% | Down 1% | Up 1% | Up 2% | |||||||||||||
| |
(dollars in thousands) |
||||||||||||||||
Forward LIBOR rates: |
|||||||||||||||||
Total structural advisory fees |
$ | 28,117 | $ | 31,134 | $ | 34,676 | $ | 38,608 | $ | 39,060 | |||||||
Change in receivables balance |
(18.9 | )% | (10.2 | )% | 11.3 | % | 12.6 | % | |||||||||
- (1)
- The percentage change in assumptions applies to future conditional default rates in the portfolio after taking into account actual defaults occurring in the portfolio through June 30, 2010. As a result, application of the nominal 10% or 20% variation results in a change in the management assumption that is less than 10% or 20% of the default rate.
110
THE FIRST MARBLEHEAD CORPORATION AND SUBSIDIARIES
NOTES TO CONSOLIDATED FINANCIAL STATEMENTS (Continued)
June 30, 2010, 2009 and 2008
(7) Property and Equipment
| |
June 30, | |
||||||
|---|---|---|---|---|---|---|---|---|
| |
2010 | 2009 | Useful life | |||||
| |
(dollars in thousands) |
|
||||||
Equipment |
$ | 9,603 | $ | 18,409 | 3 - 5 years | |||
Software |
34,670 | 34,287 | 3 years | |||||
Software under development |
167 | 1,017 | ||||||
Leasehold improvements |
12,180 | 12,692 | lesser of 5 years or lease term | |||||
Capital leases (equipment, furniture and fixtures) |
18,627 | 18,682 | lease term | |||||
Furniture and fixtures |
2,335 | 2,493 | 5 - 7 years | |||||
|
77,582 | 87,580 | ||||||
Less accumulated depreciation and amortization |
(69,496 | ) | (67,651 | ) | ||||
Total property and equipment, net |
$ | 8,086 | $ | 19,929 | ||||
We lease office space and equipment under non-cancelable operating leases expiring at various times through April 2014. Gross rent expense under operating leases, for the periods ended June 30, 2010, 2009 and 2008 was approximately $11.6 million, $8.7 million and $13.0 million, respectively. Rent expense was reduced by sublease revenue of $2.5 million, $2.8 million and $933 thousand for the years ended June 30, 2010, 2009 and 2008, respectively.
The future minimum lease payments required under capital and operating leases for each of the five fiscal years subsequent to June 30, 2010 and thereafter are as follows:
Fiscal years ending June 30,
|
Capital leases |
Operating leases |
|||||
|---|---|---|---|---|---|---|---|
| |
(dollars in thousands) |
||||||
2011 |
$ | 1,418 | $ | 10,330 | |||
2012 |
— | 9,312 | |||||
2013 |
— | 7,375 | |||||
2014 |
— | 5,897 | |||||
2015 (none thereafter) |
— | 350 | |||||
Total minimum lease payments |
1,418 | $ | 33,264 | ||||
Less amounts representing interest |
(22 | ) | |||||
Present value of future minimum lease payments, all current |
$ | 1,396 | |||||
111
THE FIRST MARBLEHEAD CORPORATION AND SUBSIDIARIES
NOTES TO CONSOLIDATED FINANCIAL STATEMENTS (Continued)
June 30, 2010, 2009 and 2008
(7) Property and Equipment (Continued)
We are entitled to receive amounts under non-cancelable subleases of office space that extend through the four fiscal years subsequent to June 30, 2010, as follows:
Fiscal years ending June 30,
|
Sublease payments |
|||
|---|---|---|---|---|
| |
(dollars in thousands) |
|||
2011 |
$ | 2,539 | ||
2012 |
2,614 | |||
2013 |
2,635 | |||
2014 (none thereafter) |
2,199 | |||
Total |
$ | 9,987 | ||
(8) Loans Held to Maturity
We hold portfolios of education loans and mortgage loans to maturity. The following table provides information on the carrying values, and implicit credit quality, of these portfolios:
| |
June 30, | |||||||
|---|---|---|---|---|---|---|---|---|
| |
2010 | 2009 | ||||||
| |
(dollars in thousands) |
|||||||
Education loans held to maturity: |
||||||||
Principal and interest |
$ | 26,277 | $ | — | ||||
Net carrying value |
413 | — | ||||||
Mortgage loans held to maturity: |
||||||||
Principal and interest |
$ | 8,546 | $ | 10,085 | ||||
Net carrying value |
8,160 | 9,515 | ||||||
Principal and interest: |
||||||||
Outstanding on education loans on non-accrual status |
$ | 24,529 | $ | — | ||||
Outstanding on mortgage loans on non-accrual status |
1,245 | 1,418 | ||||||
We do not have any loans greater than 90 days past due that are accruing interest.
112
THE FIRST MARBLEHEAD CORPORATION AND SUBSIDIARIES
NOTES TO CONSOLIDATED FINANCIAL STATEMENTS (Continued)
June 30, 2010, 2009 and 2008
(9) Deposits
The following table summarizes our deposits held by Union Federal:
| |
June 30, | ||||||||||||||||||
|---|---|---|---|---|---|---|---|---|---|---|---|---|---|---|---|---|---|---|---|
| |
2010 | 2009 | |||||||||||||||||
| |
Year-end amount |
Annual average balance |
Weighted- average rate |
Year-end amount |
Annual average balance |
Weighted- average rate |
|||||||||||||
| |
(dollars in thousands) |
||||||||||||||||||
Deposits: |
|||||||||||||||||||
Time and savings deposits |
$ | 73,046 | $ | 93,545 | 1.53 | % | $ | 103,653 | (1) | $ | 130,183 | 2.98 | % | ||||||
Money market accounts |
35,650 | 45,053 | 1.45 | 49,045 | 48,076 | 2.95 | |||||||||||||
Non-interest bearing deposits |
36 | 852 | — | 1,764 | 3,482 | — | |||||||||||||
|
$ | 108,732 | $ | 154,462 | |||||||||||||||
- (1)
- Time deposits at June 30, 2009 included brokered deposits of $25.0 million.
At June 30, 2010, time deposits with maturities greater than one year were $2.4 million.
(10) Liabilities and Unused Lines of Credit
(a) Education Loan Warehouse Facility
In July 2007, UFSB-SPV, a subsidiary of Union Federal at that time, entered into a $300.0 million education loan warehouse facility with a third-party conduit lender. The facility served as a source of interim financing for education loan programs initially funded by Union Federal. UFSB-SPV used advances under the facility to fund the purchase of education loans from Union Federal. To secure its repayment obligations, UFSB-SPV granted a security interest to the conduit lender in certain collateral, including the purchased education loans and related interest and cash collected in connection with the loans. Neither FMD nor Union Federal is a borrower or co-borrower under the facility, and the facility was structured to generally limit the conduit lender's recourse to the assets of UFSB-SPV. Selected balance sheet information of UFSB-SPV is as follows:
| |
June 30, | ||||||
|---|---|---|---|---|---|---|---|
| |
2010 | 2009 | |||||
| |
(dollars in thousands) |
||||||
Outstanding principal and interest of the collateral |
$ | 273,409 | $ | 261,923 | |||
Estimated fair value of the collateral (cash and education loans held for sale) |
108,447 | 169,090 | |||||
Education loan warehouse facility borrowings |
218,059 | 230,137 | |||||
The TERI Reorganization, and subsequent TERI ratings downgrades, resulted in events of termination under the indenture relating to the facility. As a result, the facility termination date was declared and UFSB-SPV is no longer eligible for further borrowings under the facility. All outstanding borrowings under the facility became due on July 14, 2010. The assets of UFSB-SPV consist almost entirely of the purchased education loans, however, and such assets have an estimated fair value below the amount outstanding under the facility. UFSB-SPV continues to apply principal and interest
113
THE FIRST MARBLEHEAD CORPORATION AND SUBSIDIARIES
NOTES TO CONSOLIDATED FINANCIAL STATEMENTS (Continued)
June 30, 2010, 2009 and 2008
(10) Liabilities and Unused Lines of Credit (Continued)
payments received on the education loans to repay amounts outstanding under the facility. The conduit lender may foreclose on the collateral at any time.
In April 2008, under a letter agreement, we agreed that UFSB-SPV would pay higher fees to the conduit lender in consideration for acknowledgement by the conduit lender that the interest on the notes issued under the facility would not increase to an alternative default rate set forth in the indenture unless and until the conduit lender delivered further notice. In April 2009, the conduit lender delivered notice to us and, as a result, the interest rate on the outstanding notes increased to prime plus 2.0%, beginning in the fourth quarter of fiscal 2009. UFSB-SPV paid lower program fees as a result of such election.
In April 2009, Union Federal sold substantially all of its economic interest in UFSB-SPV to a newly formed subsidiary of FMD. Union Federal received $2.9 million in consideration for the sale and granted FMD its voting and management rights with respect to UFSB-SPV.
In April 2010, we entered into agreements relating to the restructuring of the education loan warehouse facility of UFSB-SPV. As a result of the restructuring:
- •
- FMD assumed certain potential contingent liabilities of Union Federal, subject to a dollar cap, under the indenture
relating to the facility;
- •
- FMD replaced Union Federal as the master servicer under the indenture;
- •
- indirectly contributed $6.5 million in cash, and education loans with an outstanding balance of approximately
$6.9 million, and a fair value of $3.1 million, to UFSB-SPV;
- •
- First Marblehead Education Resources, Inc. (FMER), a subsidiary of FMD, was engaged as a special servicer for the
loans held by UFSB-SPV, administering and overseeing the activities of third-party collection agencies with respect to the collection of delinquent and defaulted loans held by
UFSB-SPV, and will be paid a fee for these services equal to reimbursement of costs;
- •
- The interest rate on outstanding advances under the facility decreased from prime plus 2.0% to (a) cost of funds
(as specified in the indenture relating to the facility) plus 0.5% until April 16, 2011 and (b) cost of funds (as specified in the indenture relating to the facility) plus 3.0%
thereafter;
- •
- All program fees were eliminated; and
- •
- The conduit lender released certain potential contingent liabilities of Union Federal and UFSB-SPV and permitted Union Federal to transfer the membership interests of UFSB-SPV to a non-bank subsidiary of FMD.
The restructuring agreements were accounted for as a troubled debt restructuring in accordance with ASC 470-60, Debt-Troubled Debt Restructurings by Debtors. No gain or loss was recorded at the effective date of the restructuring agreements, and the revised interest rate is being applied to the carrying amount of the debt subsequent to the effective date.
114
THE FIRST MARBLEHEAD CORPORATION AND SUBSIDIARIES
NOTES TO CONSOLIDATED FINANCIAL STATEMENTS (Continued)
June 30, 2010, 2009 and 2008
(10) Liabilities and Unused Lines of Credit (Continued)
(b) Unused Lines of Credit
On October 15, 2009, Union Federal terminated a borrower-in-custody collateral pledge with the Federal Reserve Bank discount window due to the sale of approximately 88% of its education loan portfolio in October 2009. At June 30, 2010, we had $6.1 million available for borrowing under an unused line of credit with the Federal Home Loan Bank of Boston. There were no borrowings outstanding at June 30, 2010. As a requirement under the line of credit, we own $505 thousand of Federal Home Loan Bank stock included in other assets in the balance sheet.
(11) Fair Value of Financial Instruments
A financial instrument's categorization within the valuation hierarchy is based upon the lowest level of input that is significant to the fair value measurement. The following is a description of the valuation methodologies used for instruments measured at fair value, as well as the general classification of such instruments pursuant to the valuation hierarchy.
Cash equivalents consist of money market funds with available quoted market prices on active markets that we classify as Level 1 of the valuation hierarchy.
Investments held for sale are federal agency mortgage-backed securities that are marked to market using pricing from an independent third party and are classified as Level 2 in the hierarchy.
Market prices are not available for education loans held for sale, additional structural advisory fee receivables, asset servicing fee receivables or residual receivables. See Note 6, "Service Receivables and Related Revenues," for a description of significant observable and unobservable inputs used to develop the estimated fair values of service revenue receivables. These assets are classified within Level 3 of the valuation hierarchy.
The following table presents the financial instruments carried at fair value, by consolidated balance sheet caption, in accordance with the valuation hierarchy described above on a recurring and nonrecurring basis:
| |
June 30, 2010 | June 30, 2009 | |||||||||||||||||||||||
|---|---|---|---|---|---|---|---|---|---|---|---|---|---|---|---|---|---|---|---|---|---|---|---|---|---|
Assets measured at fair value on a recurring and nonrecurring basis: |
Level 1 | Level 2 | Level 3 | Total carrying value |
Level 1 | Level 2 | Level 3 | Total carrying value |
|||||||||||||||||
| |
(dollars in thousands) |
(dollars in thousands) |
|||||||||||||||||||||||
Recurring: |
|||||||||||||||||||||||||
Cash equivalents |
$ | 217,076 | $ | — | $ | — | $ | 217,076 | $ | 142,723 | $ | — | $ | — | $ | 142,723 | |||||||||
Investments held for sale |
— | 4,471 | — | 4,471 | — | 8,450 | — | 8,450 | |||||||||||||||||
Additional structural advisory fees |
— | — | 34,676 | 34,676 | — | — | 55,130 | 55,130 | |||||||||||||||||
Asset servicing fees |
— | — | 5,780 | 5,780 | — | — | 2,385 | 2,385 | |||||||||||||||||
Residuals |
— | — | 12,823 | 12,823 | — | — | 9,960 | 9,960 | |||||||||||||||||
Non-recurring |
|||||||||||||||||||||||||
Education loans held for sale |
— | — | 107,434 | 107,434 | — | — | 350,960 | 350,960 | |||||||||||||||||
Total assets |
$ | 217,076 | $ | 4,471 | $ | 160,713 | $ | 382,260 | $ | 142,723 | $ | 8,450 | $ | 418,435 | $ | 569,608 | |||||||||
115
THE FIRST MARBLEHEAD CORPORATION AND SUBSIDIARIES
NOTES TO CONSOLIDATED FINANCIAL STATEMENTS (Continued)
June 30, 2010, 2009 and 2008
(11) Fair Value of Financial Instruments (Continued)
The following table presents activity related to our financial assets categorized as Level 3 of the valuation hierarchy, valued on a recurring basis, for the fiscal years ended June 30, 2010 and 2009. All losses recorded during the periods presented relate to assets still held at the balance sheet date, with the exception of the Trust Certificate sold effective March 31, 2009. The residuals evidenced by the Trust Certificate had a carrying value of $134.5 million on the effective date of sale. No cash was received from this sale. There have been no transfers in or out of Level 3 of the hierarchy, nor between Levels 1 and 2, for the periods presented.
| |
Fiscal years ended June 30, | |||||||||||||||||||||||||
|---|---|---|---|---|---|---|---|---|---|---|---|---|---|---|---|---|---|---|---|---|---|---|---|---|---|---|
| |
2010 | 2009 | ||||||||||||||||||||||||
| |
Fair Value, July 1, 2009 |
Realized and Unrealized Gains (Losses), Recorded in Service Revenues |
Settlements | Fair Value, June 30, 2010 |
Fair Value, July 1, 2008 |
Realized and Unrealized Gains (Losses), Recorded in Service Revenues |
Settlements | Fair Value, June 30, 2009 |
||||||||||||||||||
| |
(dollars in thousands) |
|||||||||||||||||||||||||
Assets: |
||||||||||||||||||||||||||
Additional structural advisory fees |
$ | 55,130 | $ | (19,825 | ) | $ | (629 | ) | $ | 34,676 | $ | 113,842 | $ | (57,157 | ) | $ | (1,555 | ) | $ | 55,130 | ||||||
Asset servicing fees |
2,385 | 3,395 | — | 5,780 | — | 2,385 | — | 2,385 | ||||||||||||||||||
Residuals |
9,960 | 2,863 | — | 12,823 | 293,255 | (283,295 | ) | — | 9,960 | |||||||||||||||||
Total assets: |
$ | 67,475 | $ | (13,567 | ) | $ | (629 | ) | $ | 53,279 | $ | 407,097 | $ | (338,067 | ) | $ | (1,555 | ) | $ | 67,475 | ||||||
Fair value estimates for financial instruments not carried at fair value in our consolidated balance sheet are generally subjective in nature, and are made as of a specific point in time based on the characteristics of the financial instruments and relevant market information. We have elected not to apply the fair value provisions available under ASC 820-10, Fair Value Measurements and Disclosures, to these assets and liabilities. Disclosure of fair value estimates is not required for certain items, such as premises and equipment, intangible assets and income tax assets and liabilities.
The short duration of many of our assets and liabilities result in a significant number of financial instruments for which fair value equals or closely approximates the value reported in our consolidated balance sheet. We believe that the carrying values of short-term investments, federal funds sold and deposits approximate fair value due to their short duration. The fair values of education and mortgage loans held to maturity are not materially different from their carrying values.
UFSB-SPV's liability under the education loan warehouse facility of $218.1 million and $230.1 million at June 30, 2010 and 2009, respectively, is recorded in our balance sheet at the value of outstanding principal and interest. We believe that the fair value of the education loan warehouse facility is limited to the fair value of eligible assets used as collateral, in light of the structure of the facility. The estimated fair value of such assets was $108.4 million and $169.1 million at June 30, 2010 and 2009, respectively.
116
THE FIRST MARBLEHEAD CORPORATION AND SUBSIDIARIES
NOTES TO CONSOLIDATED FINANCIAL STATEMENTS (Continued)
June 30, 2010, 2009 and 2008
(12) Commitments and Contingencies
(a) TERI Reorganization
TERI is a private, not-for-profit Massachusetts organization as described under section 501(c)(3) of the Internal Revenue Code. In its role as guarantor in the education lending market, TERI agreed to reimburse lenders or securitization trusts for unpaid principal and interest on defaulted loans. Historically, TERI was the exclusive third-party provider of borrower default guarantees for our clients' education loans. On April 7, 2008, TERI filed a voluntary petition for reorganization under Chapter 11 of the Bankruptcy Code (TERI Reorganization).
As a result of the automatic stay under the Bankruptcy Code, TERI ceased purchasing defaulted loans, including defaulted loans from the NCSLT Trusts, in April 2008. Beginning in July 2008, TERI resumed paying its obligations under the guaranty agreements with respect to defaulted loans from the NCLST Trusts, but only using cash in the Pledged Account established for the benefit of the specific trust that owned the defaulted loan. Funds in the Pledged Accounts of certain trusts have been exhausted, or are expected to be exhausted in the near term, at which point such trust will have a general unsecured claim against TERI.
In June 2008, the Bankruptcy Court granted parties rights to challenge the NCSLT Trusts' security interests in the collateral other than funds in the Pledged Accounts. In January 2009, the official committee of unsecured creditors (Creditors Committee) filed an adversary complaint in the Bankruptcy Court against the owner trustee and indenture trustee of 17 NCSLT Trusts, and against our subsidiary First Marblehead Data Services, Inc. (FMDS) as administrator of such trusts. The complaint generally alleged that the security interests granted by TERI to the NCSLT Trusts, excluding the security interests in the Pledged Accounts, were unperfected or may otherwise be avoided under the Bankruptcy Code. In particular, the complaint alleged that the NCSLT Trusts did not have enforceable rights to future recoveries on defaulted loans owned by TERI with an aggregate principal and accrued interest balance of more than $598.0 million as of June 30, 2010, or in amounts owed or transferred by TERI to Pledged Accounts after the filing of TERI's petition for reorganization totaling more than $47.0 million as of June 30, 2010. In February 2009, pending resolution of the issues raised previously in the Creditors Committee's complaint, the NCSLT Trusts generally suspended the transfer of defaulted loans to TERI and generally suspended requests for default claim payments from amounts in the Pledged Accounts.
The Plan of Reorganization included a proposed settlement of the adversary complaint, as well as other provisions that would affect the claims of the NCSLT Trusts. Each of the NCSLT Trusts voted, or were deemed to have voted, in favor of the Plan of Reorganization in April 2010, thereby electing to accept settlement of the adversary proceeding and their respective claims. The Bankruptcy Court subsequently made findings at the confirmation hearing that the Plan of Reorganization met the requirements for confirmation under the Bankruptcy Code. Following such hearing, however, TERI and the Creditors Committee filed a motion to modify the Plan of Reorganization. In July 2010, the Bankruptcy Court denied the motion and also vacated the earlier findings that the Plan of Reorganization met the requirements for confirmation. The Bankruptcy Court ordered TERI and the Creditors Committee to file a fifth amended plan of reorganization prior to August 28, 2010, unless they could negotiate acceptable changes to the Plan of Reorganization.
117
THE FIRST MARBLEHEAD CORPORATION AND SUBSIDIARIES
NOTES TO CONSOLIDATED FINANCIAL STATEMENTS (Continued)
June 30, 2010, 2009 and 2008
(12) Commitments and Contingencies (Continued)
On August 26, 2010, TERI and the Creditors Committee filed a second joint motion to modify the Plan of Reorganization (Modified Plan of Reorganization), approve revised disclosure materials and approve procedures by which creditors who previously voted on the Plan of Reorganization would have the opportunity to change their vote with respect to the Modified Plan of Reorganization. Each of FMD and FMER abstained from voting on the Plan of Reorganization and will not be eligible to vote with respect to the Modified Plan of Reorganization. FMD and FMER expect any objections to their respective unsecured claims against TERI to be resolved through litigation in the Bankruptcy Court unless a negotiated settlement is reached prior to litigation. In October 2008, we filed proofs of claim against TERI alleging damages and other claims in the aggregate contingent amount of $87.0 million, including a general unsecured claim of $16.0 million with regard to processing fees from TERI that were due but unpaid as of the Petition Date and claims for damages stemming from TERI's rejection of contracts with us. We do not have any receivables recorded on our balance sheet from TERI at June 30, 2010. Any amounts recovered from TERI or liabilities to TERI forgiven will be recorded as a gain in the period in which they are realized.
On August 31, 2010, the Bankruptcy Court approved the disclosure materials and solicitation procedures, subject to entry of a formal order, and the solicitation of votes on the Modified Plan of Reorganization is expected to commence on or about September 13, 2010. As of September 2, 2010, the terms of the Modified Plan of Reorganization remain subject to change. The terms of the Modified Plan of Reorganization are summarized in "—Status of TERI Plan of Reorganization" below.
(b) Performance Guaranty
In connection with the sale by Union Federal of an education loan portfolio in October 2009, FMD delivered a performance guaranty (Performance Guaranty) pursuant to which FMD guarantees the performance by Union Federal of its obligations and agreements under the loan purchase and sale agreement relating to the transaction. The Performance Guaranty provides that FMD will be released from its obligations, without any action of the purchaser, upon (1) any merger or consolidation of Union Federal into another entity as a result of which a majority of the capital stock of Union Federal is converted into or exchanged for the right to receive cash, securities or other property or (2) a sale of all or substantially all of the assets of Union Federal, in either case after which transaction Union Federal is no longer a subsidiary of FMD. We are not aware of any contingencies existing at the balance sheet date that are both probable and estimable for which we would record a reserve, nor can we estimate a range of possible losses at this time.
(c) Assumption of Potential Contingent Liabilities of Union Federal
In April 2010, FMD and certain of its subsidiaries entered into agreements relating to the restructuring of the education loan warehouse facility (Facility) of UFSB-SPV. In connection with the restructuring, the conduit lender released any and all potential claims against Union Federal and UFSB-SPV pursuant to the indenture relating to the Facility based upon events arising prior to April 16, 2010, to the extent such claims would exceed $20.0 million in the aggregate (Liability Cap). Neither Union Federal nor UFSB-SPV would have any liability until the conduit lender's aggregate losses exceeded $3.5 million (Deductible), at which point Union Federal and UFSB-SPV would only be liable for amounts above the Deductible up to the Liability Cap. Neither the Liability Cap nor the
118
THE FIRST MARBLEHEAD CORPORATION AND SUBSIDIARIES
NOTES TO CONSOLIDATED FINANCIAL STATEMENTS (Continued)
June 30, 2010, 2009 and 2008
(12) Commitments and Contingencies (Continued)
Deductible would apply, however, in cases of fraud, willful misconduct, gross negligence or third-party claims by or on behalf of borrowers against the conduit lender based on loan origination errors. In addition, the release is not deemed a waiver of rights previously reserved but not exercised by the conduit lender, except as specifically released pursuant to a settlement agreement.
FMD assumed any remaining contingent liability of Union Federal and its affiliates, other than UFSB-SPV, under the Facility arising prior to April 16, 2010, subject to the Liability Cap discussed above. In addition, FMD assumed any contingent liability of Union Federal under the Facility arising prior to April 16, 2010 based on fraud, willful misconduct, gross negligence, third-party claims by or on behalf of borrowers against the conduit lender based on loan origination errors or rights not otherwise released by the conduit lender. We are not aware of any contingencies existing at the balance sheet date that are both probable and estimable for which we would record a reserve, nor can we estimate a range of possible losses at this time.
(d) Agreements with Lender Clients
Under the terms of loan purchase agreements entered into with lender clients prior to fiscal 2010, we generally had an obligation to use our best efforts to facilitate the purchase of the client's TERI-guaranteed education loans during a specified loan purchase period. The length of the loan purchase period varied by client and generally ranged from 195 days to 555 days following final loan disbursement. Under the terms of certain of our loan purchase agreements, if we failed to facilitate a purchase in breach of our obligations, our liability would be limited to liquidated damages of one percent of the total principal amount of the loans as to which the loan purchase period had expired. Those loan purchase agreements that limited our liability to liquidated damages generally provided that our obligation to close a securitization was subject to the condition that no "market disruption event" had occurred. Under certain of these loan purchase agreements, the TERI Reorganization constituted a "market disruption event," suspending our contractual obligation to close a securitization. Any liquidated damages would have been due at expiration of the relevant loan purchase period, which would not have occurred for a period of time after the market disruption event ceased. We expect TERI to reject its guaranty agreements in the context of the TERI Reorganization, pursuant to the Modified Plan of Reorganization or a successor plan. As of September 2, 2010, however, the Bankruptcy Court had not entered an order confirming the Modified Plan of Reorganization or any such successor plan. The rejection of TERI's guaranty agreements would terminate our purchase obligations under our outstanding loan purchase agreements. No amounts were accrued in the financial statements with respect to potential liabilities under these loan purchase agreements.
(13) Stockholders' Equity
(a) Preferred Stock
In December 2007, FMD entered into an investment agreement (Investment Agreement) with GS Parthenon A, L.P. and GS Parthenon B, L.P., affiliates of GS Capital Partners. Pursuant to the Investment Agreement, we issued 132,701 shares of newly designated Series B Non-Voting Convertible Preferred Stock, $0.01 par value per share (Series B Preferred Stock), at a purchase price of $1 thousand per share. The Series B Preferred Stock is convertible, at the option of the holders. The number of common shares issuable upon conversion is equal to the initial purchase price of the
119
THE FIRST MARBLEHEAD CORPORATION AND SUBSIDIARIES
NOTES TO CONSOLIDATED FINANCIAL STATEMENTS (Continued)
June 30, 2010, 2009 and 2008
(13) Stockholders' Equity (Continued)
Series B Preferred Stock, divided by the conversion price of $15.00 per share. At June 30, 2010, the Series B Preferred Stock issued and outstanding is convertible into 8,846,733 shares of common stock. Dividends would be paid on the Series B Preferred Stock when, as and if, and in the same amounts (on an as-converted basis), declared on our common stock. Upon liquidation, dissolution or winding up of FMD, holders of Series B Preferred Stock would have the right to receive an amount equal to $0.01 per share of Series B Preferred Stock, plus the amount of any declared but unpaid dividends thereon. After payment of this amount, holders of the Series B Preferred Stock would be entitled to participate (on an as-converted basis) with common stock in the distribution of remaining assets.
(b) 2003 Employee Stock Purchase Plan
In 2003, our Board of Directors and stockholders approved the 2003 employee stock purchase plan (ESPP). A total of 600,000 shares of common stock were authorized for issuance under the ESPP. The ESPP permitted eligible employees to purchase shares of our common stock at the lower of 85% of its fair market value at the beginning or at the end of each offering period. Participation was voluntary. Under the ESPP, 45,000 shares were issued during fiscal 2008. In April 2008, our Board of Directors, which administers the ESPP, terminated the offering period that began on January 1, 2008 and indefinitely suspended the ESPP. As a result, no shares were issued in fiscal 2010 or fiscal 2009 under the ESPP. At June 30, 2010, 406,000 shares were available for future purchase under the ESPP.
(c) Treasury Stock
Our Board of Directors has authorized the repurchase of up to 10,000,000 shares of common stock. As of June 30, 2010, we had repurchased an aggregate of 1,169,100 shares under this program at an average price, excluding commissions, of $36.17 per share. Shares repurchased under this program are generally bought in open market transactions. We did not repurchase any shares of common stock pursuant to this program during fiscal 2010 or fiscal 2009. Future repurchases pursuant to this program may require regulatory approval.
Treasury stock was $186.2 million (8,239,000 shares) and $184.2 million (7,643,000 shares) at June 30, 2010 and 2009, respectively. The increase in shares is a result of common stock withheld from employees to satisfy statutory minimum withholding obligations as equity compensation awards vest.
(14) Administrative and Other Fees
Administrative and other fees recognized in fiscal 2010 relate primarily to default prevention and trust administration services provided to the trusts we facilitated.
In fiscal 2009 and fiscal 2008, administrative and other fees included fees received from TERI of $3.0 million and $126.5 million, respectively, related to loan origination, customer service, default processing, default prevention and administrative services provided under a master servicing agreement. We recognized TERI's reimbursement of our expenses for these services as revenue. In June 2008, in the context of the TERI Reorganization, the Bankruptcy Court entered an order approving a motion by TERI to reject the master servicing agreement effective as of May 31, 2008, but provided for a transition services agreement between TERI and us with a term through September 29, 2008. We do not expect to receive material processing fees from TERI in the future. In addition, we have filed a
120
THE FIRST MARBLEHEAD CORPORATION AND SUBSIDIARIES
NOTES TO CONSOLIDATED FINANCIAL STATEMENTS (Continued)
June 30, 2010, 2009 and 2008
(14) Administrative and Other Fees (Continued)
general unsecured claim with regard to $16.0 million of processing fees not recognized in the statement of operations that were due from TERI, but unpaid as of the filing of TERI's bankruptcy petition.
(15) Net Interest Revenue
The following table reflects the components of net interest income:
| |
Fiscal years ended June 30, | ||||||||||
|---|---|---|---|---|---|---|---|---|---|---|---|
| |
2010 | 2009 | 2008 | ||||||||
| |
(dollars in thousands) |
||||||||||
Interest income |
|||||||||||
Cash and cash equivalents |
$ | 598 | $ | 970 | $ | 3,697 | |||||
Federal funds sold |
3 | 469 | 1,761 | ||||||||
Short-term investments |
201 | — | — | ||||||||
Investments held for sale |
328 | 1,582 | 4,233 | ||||||||
Education loans held for sale |
20,974 | 38,646 | 32,656 | ||||||||
Loans held to maturity |
925 | 575 | 758 | ||||||||
Total interest income |
23,029 | 42,242 | 43,105 | ||||||||
Interest expense |
|||||||||||
Time and savings account deposits |
1,429 | 3,885 | 7,262 | ||||||||
Money market account deposits |
651 | 1,419 | 240 | ||||||||
Warehouse line of credit |
10,403 | 10,993 | 9,250 | ||||||||
Other short-term borrowings |
— | 128 | — | ||||||||
Other interest-bearing liabilities |
675 | 714 | 731 | ||||||||
Total interest expense |
13,158 | 17,139 | 17,483 | ||||||||
Net interest income |
$ | 9,871 | $ | 25,103 | $ | 25,622 | |||||
(16) Stock-Based Compensation
Stock-based compensation expense was $13.0 million, $7.3 million and $7.0 million for fiscal 2010, 2009 and 2008, respectively. Total tax expense recognized for stock compensation was $1.2 million and $2.2 million for fiscal 2010 and fiscal 2009, respectively. We recognized a tax benefit of $383 thousand in fiscal 2008. As of June 30, 2010, there was $16.9 million of total unrecognized compensation cost related to non-vested share-based compensation arrangements. That cost is expected to be recognized over a weighted-average period of approximately three years.
(a) Stockholder Approved Plans
We have stock awards outstanding under three stock-based incentive compensation plans, each approved by both our Board of Directors and stockholders in 1996 (1996 Plan), 2002 (2002 Plan) and 2003 (2003 Plan).
Under the 1996 Plan, we granted either incentive stock options (pursuant to Section 422 of the Internal Revenue Code) or non-statutory stock options to our officers and employees, and
121
THE FIRST MARBLEHEAD CORPORATION AND SUBSIDIARIES
NOTES TO CONSOLIDATED FINANCIAL STATEMENTS (Continued)
June 30, 2010, 2009 and 2008
(16) Stock-Based Compensation (Continued)
non-statutory stock options to consultants. The 1996 Plan expired as of June 30, 2010. As of June 30, 2010, 600 shares of common stock were issuable upon exercise of awards granted under the 1996 Plan.
Under the 2002 Plan, we granted non-statutory stock options to non-employee members of our Board of Directors. In 2006, our Board of Directors suspended new awards under the 2002 Plan. As of June 30, 2010, 102,000 shares of common stock were issuable upon exercise of awards granted under the 2002 Plan.
Under the 2003 Plan, our Board of Directors, or one or more sub-committees of our Board of Directors, may grant options or other stock based awards to employees, directors, consultants or advisors. As of June 30, 2010, 8,050,000 shares of common stock had been reserved for issuance under the 2003 Plan, and approximately 2,444,000 shares of common stock were issuable upon the exercise or vesting of awards granted under the 2003 Plan. At June 30, 2010, approximately 2,901,000 shares were available for future grant. We typically issue new shares of common stock as opposed to using treasury shares.
(b) Stock Options
The following table summarizes information about stock options outstanding at June 30, 2010:
Exercise prices
|
Number outstanding |
Weighted-average remaining contractual term |
Weighted-average exercise price |
Number exercisable |
|||||||||
|---|---|---|---|---|---|---|---|---|---|---|---|---|---|
| |
(shares in thousands) |
||||||||||||
$3.33 |
19 | 2.21 | $ | 3.33 | 19 | ||||||||
$6.00(1) |
2,000 | 8.13 | 6.00 | 500 | |||||||||
$8.10 - $10.00 |
30 | 3.19 | 8.48 | 30 | |||||||||
$12.00(1) |
2,000 | 8.13 | 12.00 | 2,000 | |||||||||
$16.00(1) |
2,000 | 8.13 | 16.00 | 2,000 | |||||||||
$19.04 |
24 | 5.22 | 19.04 | 24 | |||||||||
$32.97 |
30 | 4.22 | 32.97 | 30 | |||||||||
$3.33 - $32.97 |
6,103 | 8.06 | 11.43 | 4,603 | |||||||||
- (1)
- These options were not issued under any of our existing stockholder-approved incentive plans. Our Board of Directors elected Daniel Meyers as President and Chief Executive Officer and as a member of our Board of Directors, effective September 1, 2008. In connection with the election, our Board of Directors and a subcommittee of our Compensation Committee of our Board of Directors approved the grant in August 2008 (Grant Date) of stock options to Mr. Meyers to purchase (a) 2,000,000 shares of our common stock, at an exercise price of $6.00 per share, 25% of which vested and became exercisable in August 2009, with the remainder to vest and become exercisable in three equal installments on each of the second, third and fourth anniversaries of the Grant Date ($6.00 Stock Options); (b) 2,000,000 shares of our common stock, at an exercise price of $12.00 per share, that vested and became exercisable in full on November 30, 2008; and (c) 2,000,000 shares of our common stock, at an exercise price of $16.00 per share, that vested and became exercisable in full on November 30, 2008. Any unvested stock options will vest and become
122
THE FIRST MARBLEHEAD CORPORATION AND SUBSIDIARIES
NOTES TO CONSOLIDATED FINANCIAL STATEMENTS (Continued)
June 30, 2010, 2009 and 2008
(16) Stock-Based Compensation (Continued)
exercisable in full (1) if the closing sale price of our common stock is at least 150% of the exercise price of the applicable option for a period of five consecutive trading days (assuming the trading on each day is not less than 90% of the average daily trading volume for the prior three months prior to such five day period), (2) in the event of Mr. Meyers's death or disability, as defined in the applicable option agreement or (3) in the event that Mr. Meyers' employment is terminated by us without Cause, as defined in the applicable option agreement, or by Mr. Meyers with Good Reason, as defined in the applicable option agreement. In addition, subject to certain conditions set forth in the option agreement, the $6.00 Stock Options may be exercised beginning 90 days after the Grant Date prior to vesting, provided that the unvested shares issued will be held in escrow by us and will be subject to a repurchase option by us. Each of the stock options will expire ten years from the Grant Date.
The options exercisable at June 30, 2010 have no intrinsic value as the exercise price (weighted average of $13.20) is above market price. The weighted-average remaining contractual term of options exercisable is eight years. Options expire a maximum of ten years from the grant date.
The following table presents stock option activity for the fiscal years ended June 30, 2010, 2009 and 2008:
| |
Number of options |
Weighted- average exercise price per share |
||||||
|---|---|---|---|---|---|---|---|---|
| |
(shares in thousands) |
|||||||
Outstanding options at June 30, 2007 |
236 | $ | 11.08 | |||||
Exercised (aggregate intrinsic value of $142 thousand) |
(5 | ) | 3.33 | |||||
Forfeited |
(8 | ) | 3.33 | |||||
Outstanding options at June 30, 2008 |
223 | 11.53 | ||||||
Granted(1) |
6,000 | 11.33 | ||||||
Forfeited |
(114 | ) | 7.03 | |||||
Outstanding options at June 30, 2009 |
6,109 | 11.42 | ||||||
Exercised (aggregate intrinsic value of $13 thousand) |
(6 | ) | 0.67 | |||||
Outstanding options at June 30, 2010 |
6,103 | 11.43 | ||||||
- (1)
- The following inputs were used to estimate the fair value of options granted to Mr. Meyers during fiscal 2009: dividend yield of 0.0%, expected volatility of 75.0%, risk-free interest rate of 3.31% and expected option lives of six years.
123
THE FIRST MARBLEHEAD CORPORATION AND SUBSIDIARIES
NOTES TO CONSOLIDATED FINANCIAL STATEMENTS (Continued)
June 30, 2010, 2009 and 2008
(16) Stock-Based Compensation (Continued)
(c) Stock Units
Each stock unit, including both RSUs and director stock units, represents a contingent right to receive one share of our common stock upon vesting. Shares in respect of vested stock units are issued as soon as practicable after each vesting date.
Pursuant to a directors' compensation program under the 2003 Plan, non-employee members of our Board of Directors are entitled to stock units for their service. Stock units granted to non-employee directors are fully vested immediately. For fiscal 2009 and 2008, each director received 3,000 stock units on the date of his initial election to our Board of Directors and an annual grant of 3,000 stock units on September 20 of each year if the non-employee director had then served as a member of our Board of Directors for at least 180 days. In May 2010, the director compensation program was amended to provide for the grant of 10,000 stock units upon initial election to our Board of Directors and an annual grant of 10,000 stock units on September 20 of each year, if the non-employee director has then served on our Board of Directors for at least 180 days. During fiscal 2010, 2009 and 2008, 38,000 stock units, 21,000 stock units and 21,000 stock units were granted to non-employee members of our Board of Directors.
RSUs may be granted to employees and outside consultants. During fiscal 2010, approximately 4,331,000 RSUs were granted to employees and consultants, including executive officers, of which approximately 2,000,000 vested at the grant date, with the remainder to vest over the next three to four years. No RSUs were granted to employees in fiscal 2009. During fiscal 2008, 367,000 RSUs were granted to employees, which generally vested over four to five years.
The following table presents stock unit activity, including both RSUs and director stock units, for the fiscal years ended June 30, 2010, 2009 and 2008:
| |
Number of stock units |
Weighted- average grant date fair value per share |
||||||
|---|---|---|---|---|---|---|---|---|
| |
(shares in thousands) |
|||||||
Outstanding stock units at June 30, 2007 |
841 | $ | 27.79 | |||||
Granted |
388 | 33.15 | ||||||
Common stock issued at vest date |
(212 | ) | 42.14 | |||||
Forfeited |
(295 | ) | 38.08 | |||||
Outstanding stock units at June 30, 2008 |
722 | 28.86 | ||||||
Granted |
21 | 3.30 | ||||||
Common stock issued at vest date |
(312 | ) | 24.00 | |||||
Forfeited |
(151 | ) | 33.07 | |||||
Outstanding stock units at June 30, 2009 |
280 | 30.07 | ||||||
Granted |
4,369 | 3.02 | ||||||
Common stock issued at vest date |
(2,201 | ) | 4.91 | |||||
Forfeited |
(4 | ) | 12.25 | |||||
Outstanding stock units at June 30, 2010 |
2,444 | 4.41 | ||||||
124
THE FIRST MARBLEHEAD CORPORATION AND SUBSIDIARIES
NOTES TO CONSOLIDATED FINANCIAL STATEMENTS (Continued)
June 30, 2010, 2009 and 2008
(17) Defined Contribution Plans
We sponsor a 401(k) retirement savings plan for the benefit of all full time employees. Eligible employees can join the plan after three months of employment. Investment decisions are made by individual employees. At our option, we can contribute to the plan for the benefit of employees. Employee and employer contributions vest immediately. We made contributions of $0.9 million, $1.1 million and $2.8 million during the fiscal years ended June 30, 2010, 2009 and 2008, respectively.
(18) General and Administrative Expenses
The following table reflects components of general and administrative expenses:
| |
Fiscal years ended June 30, | ||||||||||
|---|---|---|---|---|---|---|---|---|---|---|---|
| |
2010 | 2009 | 2008 | ||||||||
| |
(dollars in thousands) |
||||||||||
General and administrative expenses: |
|||||||||||
Depreciation and amortization |
$ | 13,359 | $ | 17,800 | $ | 19,633 | |||||
Third-party services |
20,587 | 29,991 | 66,652 | ||||||||
Occupancy and equipment |
17,078 | 16,699 | 28,752 | ||||||||
Marketing |
80 | 3,482 | 100,754 | ||||||||
Other |
6,960 | 12,466 | 38,648 | ||||||||
Total |
$ | 58,064 | $ | 80,438 | $ | 254,439 | |||||
Other expenses included goodwill impairment losses of $1.7 million and $3.2 million in fiscal 2009 and fiscal 2008, respectively. Depreciation and amortization expense included amortization of intangibles of $737 thousand, $775 thousand and $868 thousand in fiscal 2010, 2009 and 2008, respectively.
Included in other expenses in fiscal 2010 and fiscal 2009 are fees of $796 thousand and $523 thousand, respectively, paid to Sextant Holdings, LLC (Sextant), under a time-sharing agreement for business-related use of a private aircraft. Under the time sharing agreement, the fees may not exceed the actual expenses of each specific flight as authorized by federal aviation regulations. The sole manager and member of Sextant is Daniel Meyers, our Chief Executive Officer, President and Chairman of the Board. Fees paid to Sextant are capped by our Board of Directors at $1.0 million per year.
(19) Income Taxes
We are subject to U.S. federal income tax, as well as income tax in multiple U.S. state and local jurisdictions. During April 2010, the Internal Revenue Service commenced an audit of our tax returns for fiscal years 2007, 2008 and 2009. We cannot predict the timing or outcome of the audit at this time. Our state income tax returns for the year ended June 30, 2004, and state and federal income tax returns for the years ended June 30, 2005 and 2006, remain subject to examination.
Income tax benefit for fiscal 2010 was $70.3 million. Income tax benefit for fiscal 2009 was $187.8 million. The lower overall benefit in fiscal 2010 is a result of lower pre-tax losses during fiscal 2010. During fiscal 2010, our effective tax rate, or the income tax benefit as a percentage of pre-tax loss, decreased to 32.6% from an effective tax rate of 34.1% for fiscal 2009.
125
THE FIRST MARBLEHEAD CORPORATION AND SUBSIDIARIES
NOTES TO CONSOLIDATED FINANCIAL STATEMENTS (Continued)
June 30, 2010, 2009 and 2008
(19) Income Taxes (Continued)
The following table reflects components of income tax expense (benefit) attributable to income from operations:
| |
Fiscal years ended June 30, | |||||||||||
|---|---|---|---|---|---|---|---|---|---|---|---|---|
| |
2010 | 2009 | 2008 | |||||||||
| |
(dollars in thousands) |
|||||||||||
Current: |
||||||||||||
Federal |
$ | (43,533 | ) | $ | (177,807 | ) | $ | 72,550 | ||||
State |
2,004 | 13,497 | 12,933 | |||||||||
Total current tax expense (benefit) |
(41,529 | ) | (164,310 | ) | 85,483 | |||||||
Deferred: |
||||||||||||
Federal |
(24,695 | ) | (15,353 | ) | (199,976 | ) | ||||||
State |
(4,096 | ) | (8,156 | ) | (37,387 | ) | ||||||
Total deferred tax benefit |
(28,791 | ) | (23,509 | ) | (237,363 | ) | ||||||
Income tax benefit |
$ | (70,320 | ) | $ | (187,819 | ) | $ | (151,880 | ) | |||
As a result of the sale of the Trust Certificate, effective March 31, 2009, as well as our operating losses for fiscal 2009, we recorded income tax receivables during fiscal 2009 for federal and state income taxes paid on prior taxable income. During fiscal 2010, we received a total of $189.3 million in federal and state income tax refunds related to our income tax receivables.
The following table reconciles the expected federal income tax expense (benefit) (computed by applying the federal statutory tax rate to income (loss) before taxes) to recorded income tax expense (benefit):
| |
Fiscal years ended June 30, | ||||||||||
|---|---|---|---|---|---|---|---|---|---|---|---|
| |
2010 | 2009 | 2008 | ||||||||
| |
(dollars in thousands) |
||||||||||
Computed federal tax benefit |
$ | (75,545 | ) | $ | (192,794 | ) | $ | (135,435 | ) | ||
State tax, net of federal benefit |
(1,360 | ) | 3,472 | (15,895 | ) | ||||||
Non-deductible compensation |
3,275 | 913 | 297 | ||||||||
Other |
3,310 | 590 | (847 | ) | |||||||
Income tax benefit |
$ | (70,320 | ) | $ | (187,819 | ) | $ | (151,880 | ) | ||
126
THE FIRST MARBLEHEAD CORPORATION AND SUBSIDIARIES
NOTES TO CONSOLIDATED FINANCIAL STATEMENTS (Continued)
June 30, 2010, 2009 and 2008
(19) Income Taxes (Continued)