Attached files
| file | filename |
|---|---|
| 8-K - Silicon Graphics International Corp | creditsuisse8-k.htm |
1 SGI Investor Presentation Credit Suisse Small and Mid Cap Conference September 27, 2011 NASDAQ:SGI
2©2011 SGI Legal Notice Safe Harbor Cautionary Statement This presentation contains forward-looking statements, including statements regarding management’s expectations about the markets, business, products, operating plans and financial performance of Silicon Graphics International Corp. (“SGI”) as of September 27, 2011. Statements containing words such as "will," "expect," "believe," and "intend," and other statements in the future tense, are forward-looking statements. Any statements contained in this presentation that are not statements of historical fact may be deemed forward-looking statements. Actual outcomes and results may differ materially from the expectations expressed or implied in these statements due to a number of risks and uncertainties, including, but not limited to: SGI operates in a very competitive market which may cause pricing pressure and impair our market penetration; SGI has extensive international business activities which create risks from complex international operations, foreign currency exposure and changing legal, regulatory, political or economic conditions, including SGI’s operations in Japan, which may be negatively affected by earthquakes and other natural disasters, as well as ongoing power supply disruptions following the March 2011 earthquake and tsunami; uncertainty arising from SGI’s increased dependence on business with U.S. Government entities; failure of our customers to accept new products; and economic conditions impacting the purchasing decisions of SGI’s customers. Detailed information about these and other risks and uncertainties that could affect SGI’s business, financial condition and results of operations is set forth in SGI’s Annual Report on Form 10-K under the caption “Risks Factors,” which was filed with the Securities and Exchange Commission on August 29, 2011, as updated by the subsequent filings with the SEC made by SGI, all of which are available at www.sec.gov. Accordingly, you are cautioned not to place undue reliance on forward-looking statements. This presentation is as of September 27, 2011, and the continued posting or availability of this presentation does not imply that forward-looking statements continue to be true as of any later date. We expressly disclaim any obligation to update or alter our forward-looking statements, whether, as a result of new information, future events or otherwise, except where required by law. The SGI logos and SGI product names used or referenced herein are either registered trademarks or trademarks of Silicon Graphics International Corp. or one of its subsidiaries. All other trademarks, trade names, service marks and logos referenced herein belong to their respective holders. Any and all copyright or other proprietary notices that appear herein, together with this Legal Notice, must be retained on this presentation. Non-GAAP Reconciliation All non-GAAP financial measures contained in this presentation are reconciled to GAAP on slides 11 to 13 of this presentation.
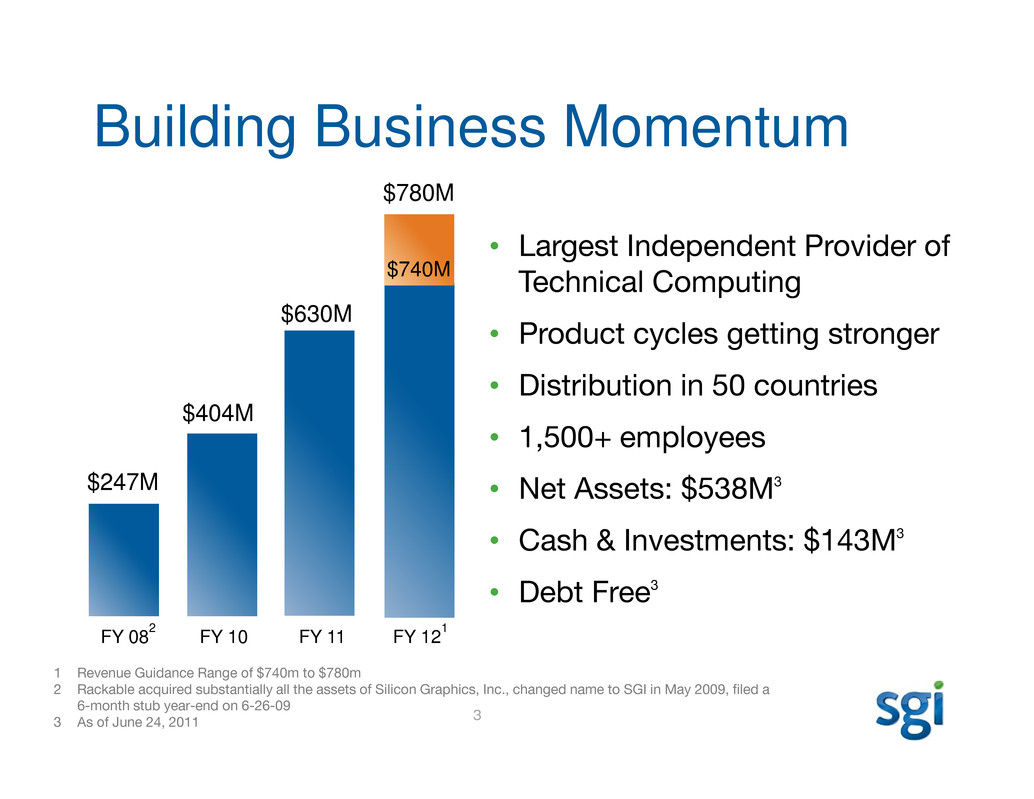
3 Building Business Momentum • Largest Independent Provider of Technical Computing • Product cycles getting stronger • Distribution in 50 countries • 1,500+ employees • Net Assets: $538M3 • Cash & Investments: $143M3 • Debt Free3 $780M $630M $404M $247M FY 082 FY 10 FY 11 FY 121 1 Revenue Guidance Range of $740m to $780m 2 Rackable acquired substantially all the assets of Silicon Graphics, Inc., changed name to SGI in May 2009, filed a 6-month stub year-end on 6-26-09 3 As of June 24, 2011 $740M
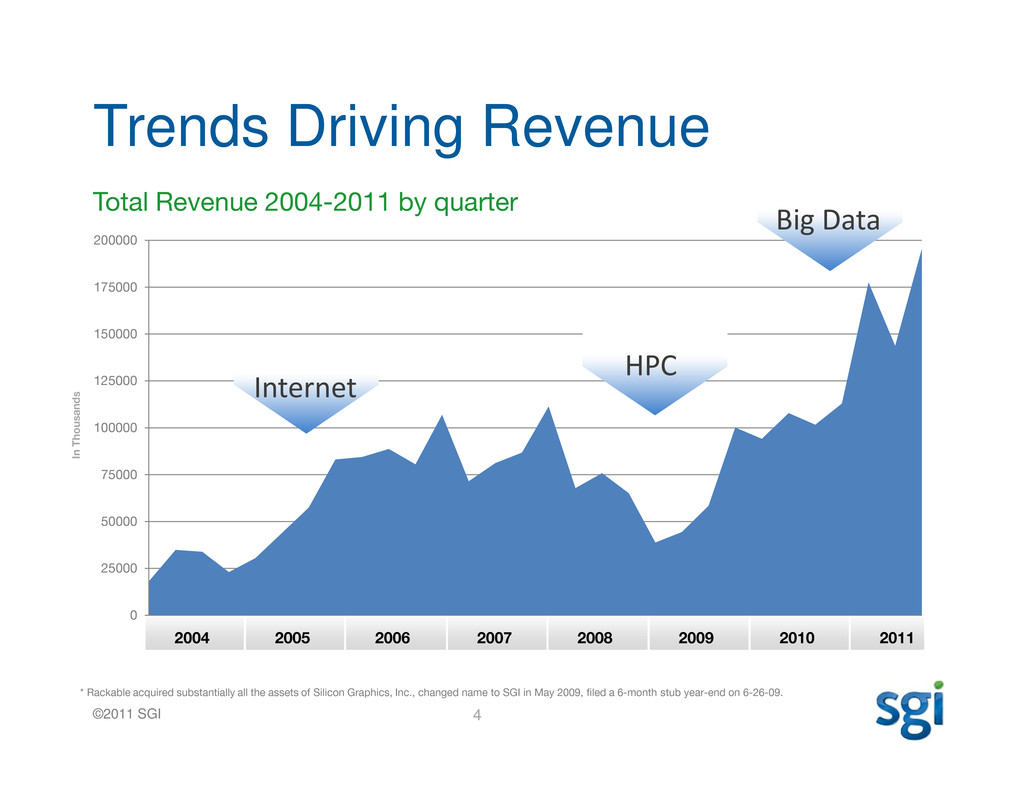
4©2011 SGI Total Revenue 2004-2011 by quarter 0 25000 50000 75000 100000 125000 150000 175000 200000 I n T h o u s a n d s HPC Internet * Rackable acquired substantially all the assets of Silicon Graphics, Inc., changed name to SGI in May 2009, filed a 6-month stub year-end on 6-26-09. Trends Driving Revenue Big Data 2004 2005 2006 2007 2008 2009 2010 2011
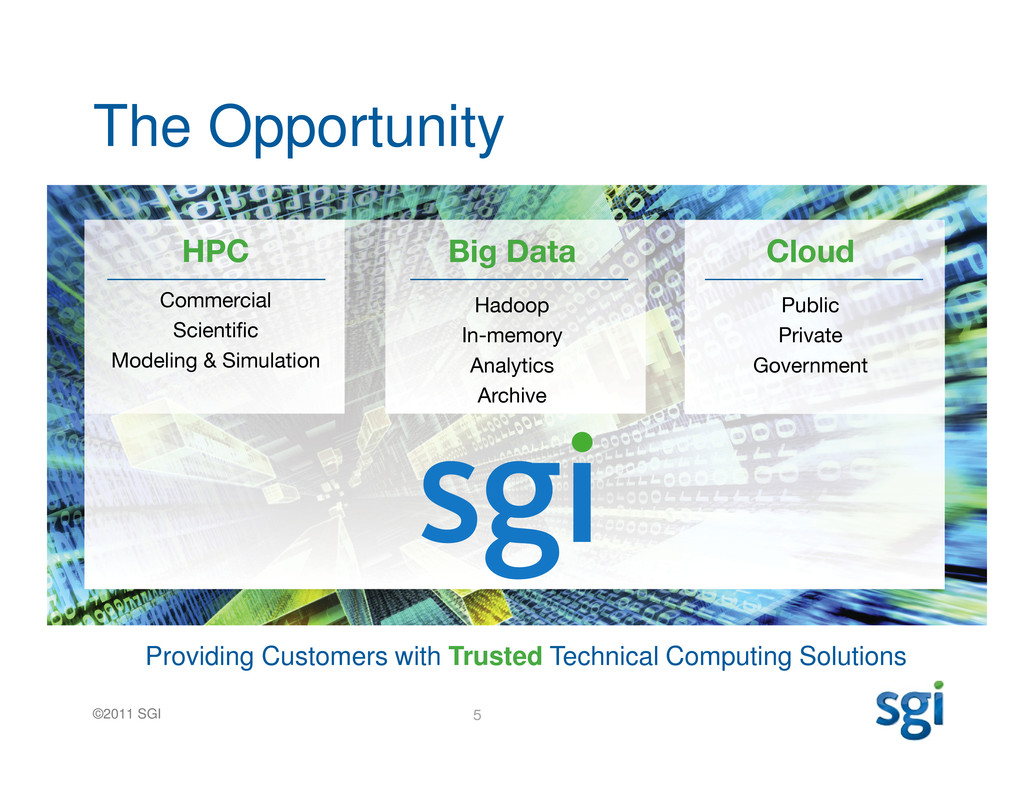
5©2011 SGI The Opportunity HPC Commercial Scientific Modeling & Simulation Cloud Public Private Government Big Data Hadoop In-memory Analytics Archive Providing Customers with Trusted Technical Computing Solutions
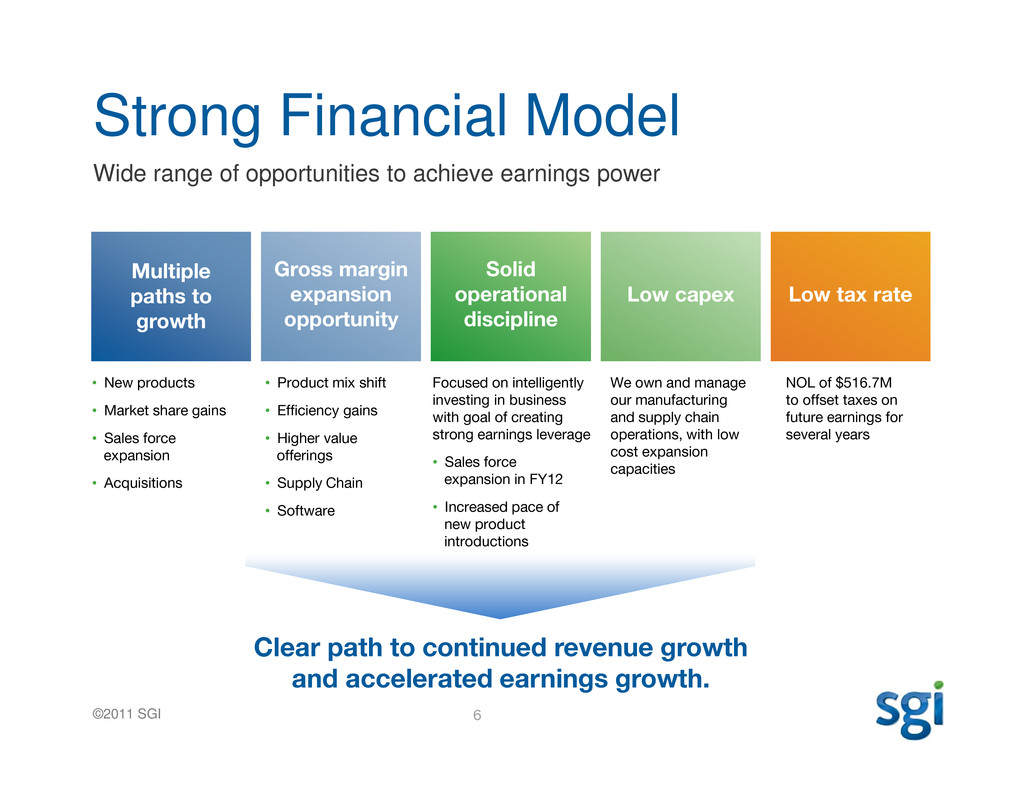
6©2011 SGI Gross margin expansion opportunity Solid operational discipline Low capex Low tax rate Strong Financial Model Wide range of opportunities to achieve earnings power Clear path to continued revenue growth and accelerated earnings growth. • New products • Market share gains • Sales force expansion • Acquisitions • Product mix shift • Efficiency gains • Higher value offerings • Supply Chain • Software Focused on intelligently investing in business with goal of creating strong earnings leverage • Sales force expansion in FY12 • Increased pace of new product introductions We own and manage our manufacturing and supply chain operations, with low cost expansion capacities NOL of $516.7M to offset taxes on future earnings for several years Multiple paths to growth
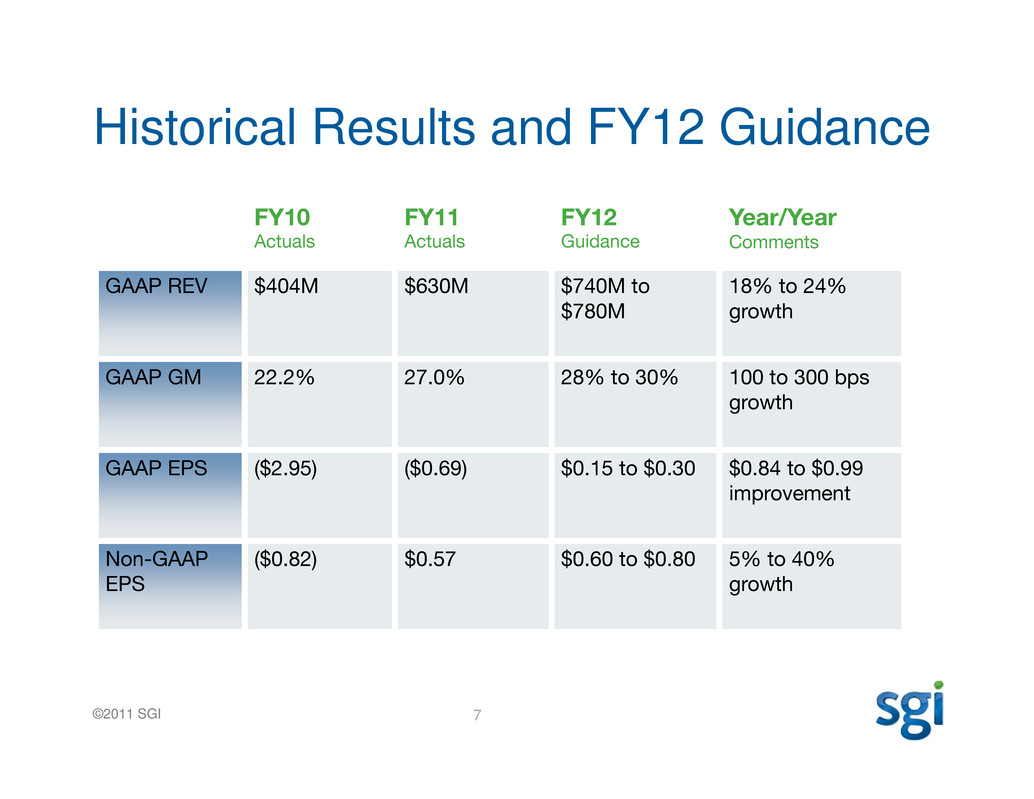
7©2011 SGI FY10 Actuals FY11 Actuals FY12 Guidance Year/Year Comments GAAP REV $404M $630M $740M to $780M 18% to 24% growth GAAP GM 22.2% 27.0% 28% to 30% 100 to 300 bps growth GAAP EPS ($2.95) ($0.69) $0.15 to $0.30 $0.84 to $0.99 improvement Non-GAAP EPS ($0.82) $0.57 $0.60 to $0.80 5% to 40% growth Historical Results and FY12 Guidance
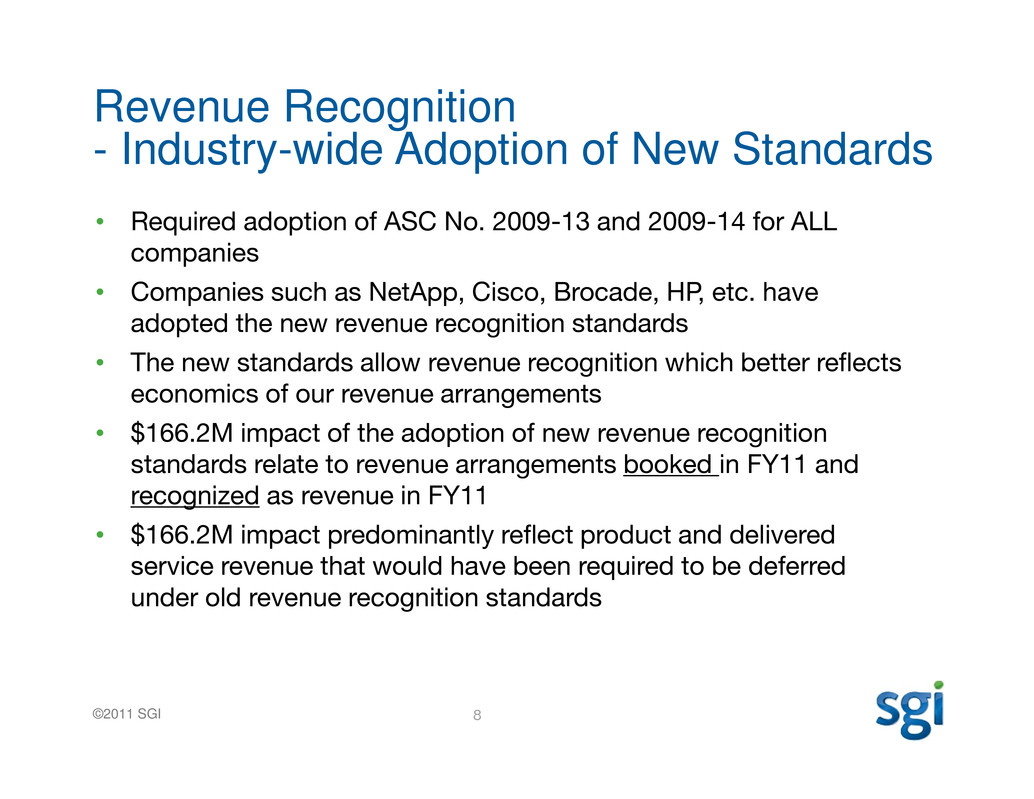
8©2011 SGI Revenue Recognition - Industry-wide Adoption of New Standards • Required adoption of ASC No. 2009-13 and 2009-14 for ALL companies • Companies such as NetApp, Cisco, Brocade, HP, etc. have adopted the new revenue recognition standards • The new standards allow revenue recognition which better reflects economics of our revenue arrangements • $166.2M impact of the adoption of new revenue recognition standards relate to revenue arrangements booked in FY11 and recognized as revenue in FY11 • $166.2M impact predominantly reflect product and delivered service revenue that would have been required to be deferred under old revenue recognition standards
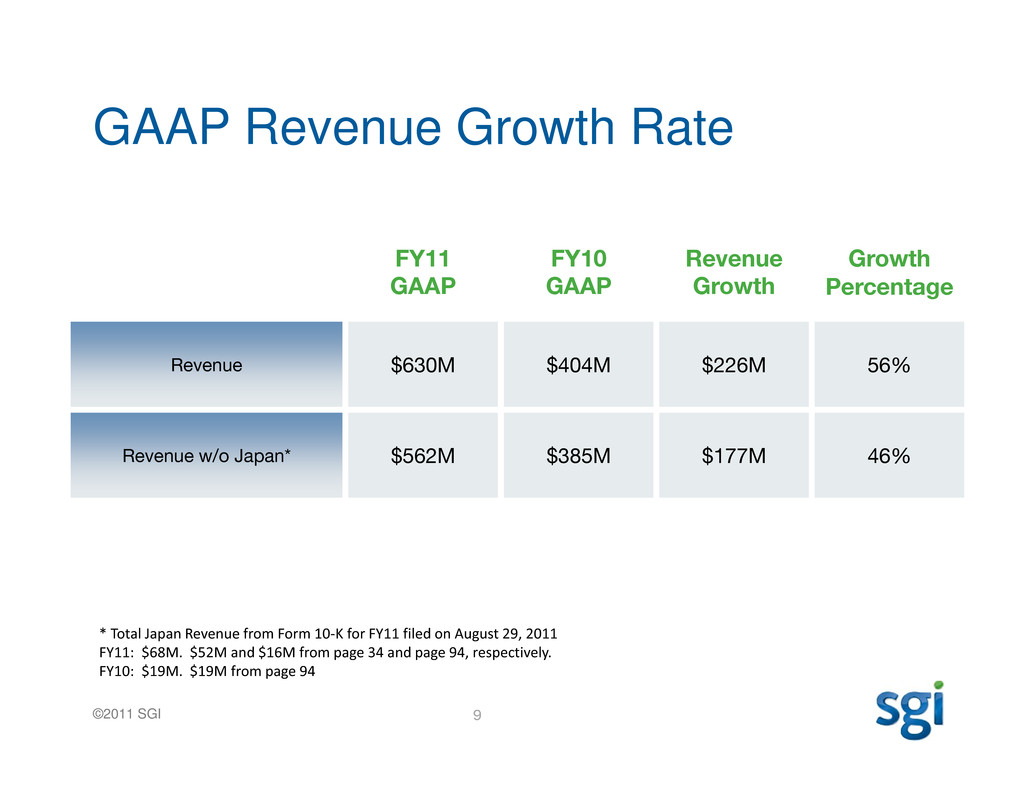
9©2011 SGI FY11 GAAP FY10 GAAP Revenue Growth Growth Percentage Revenue $630M $404M $226M 56% Revenue w/o Japan* $562M $385M $177M 46% GAAP Revenue Growth Rate * Total Japan Revenue from Form 10-K for FY11 filed on August 29, 2011 FY11: $68M. $52M and $16M from page 34 and page 94, respectively. FY10: $19M. $19M from page 94
10©2011 SGI Appendix
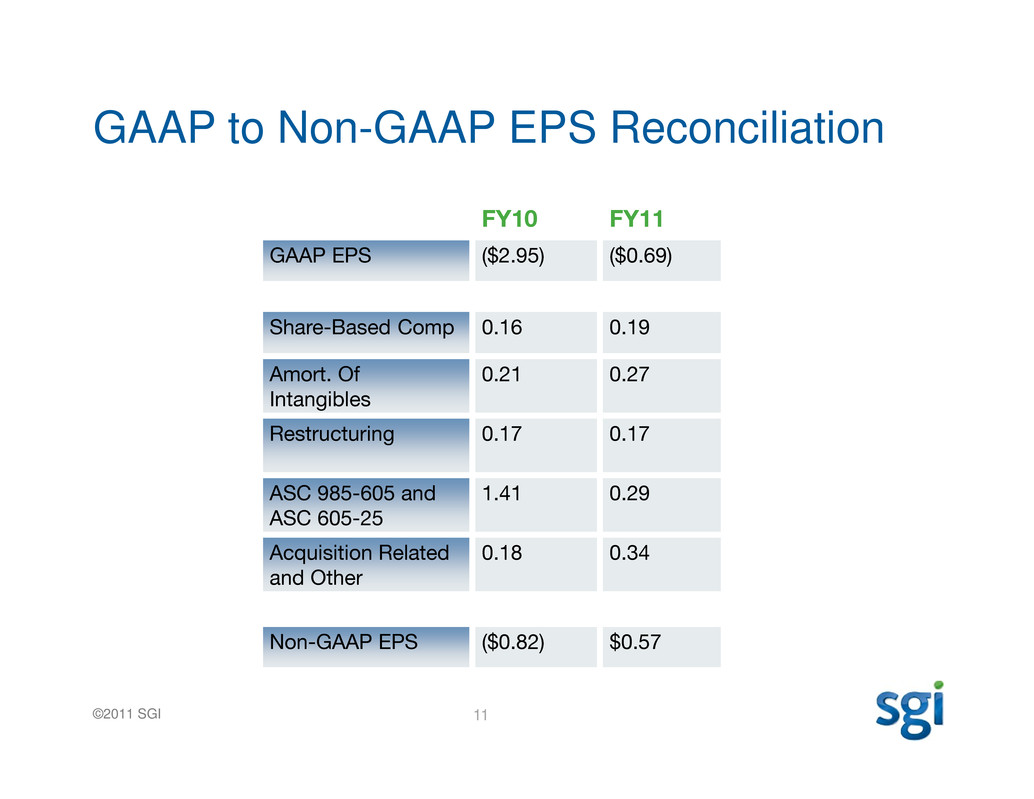
11©2011 SGI FY10 FY11 GAAP EPS ($2.95) ($0.69) Share-Based Comp 0.16 0.19 Amort. Of Intangibles 0.21 0.27 Restructuring 0.17 0.17 ASC 985-605 and ASC 605-25 1.41 0.29 Acquisition Related and Other 0.18 0.34 Non-GAAP EPS ($0.82) $0.57 GAAP to Non-GAAP EPS Reconciliation
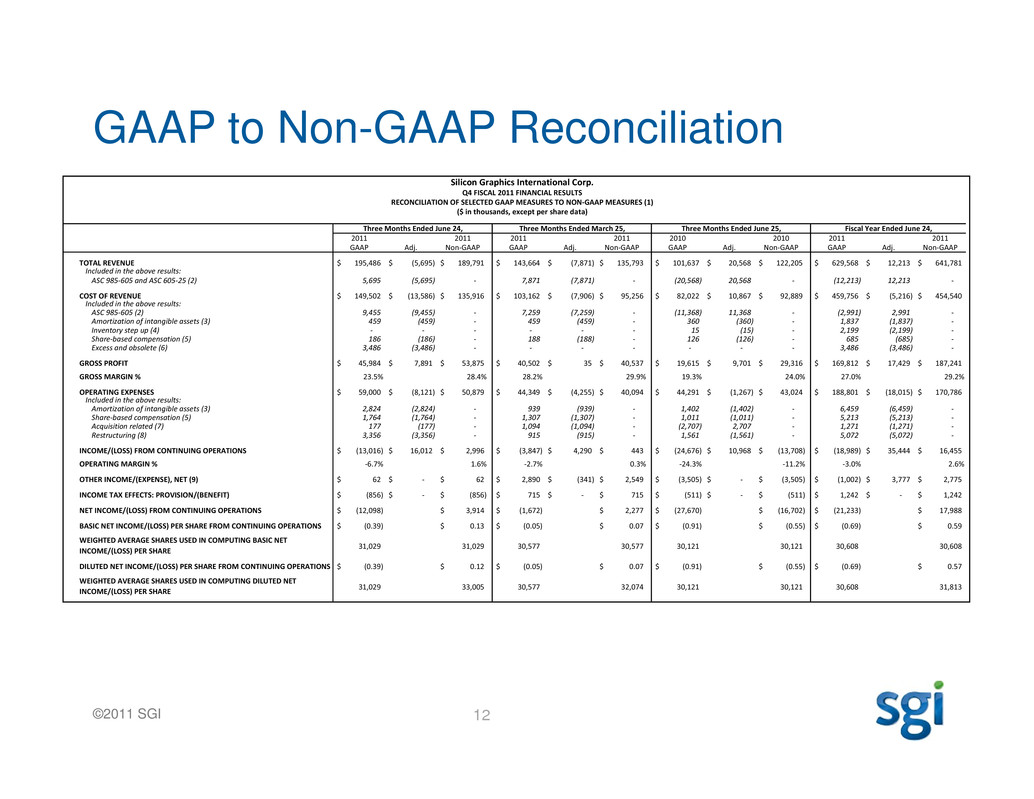
12©2011 SGI GAAP to Non-GAAP Reconciliation Silicon Graphics International Corp. Q4 FISCAL 2011 FINANCIAL RESULTS RECONCILIATION OF SELECTED GAAP MEASURES TO NON-GAAP MEASURES (1) ($ in thousands, except per share data) Three Months Ended June 24, Three Months Ended March 25, Three Months Ended June 25, Fiscal Year Ended June 24, 2011 2011 2011 2011 2010 2010 2011 2011 GAAP Adj. Non-GAAP GAAP Adj. Non-GAAP GAAP Adj. Non-GAAP GAAP Adj. Non-GAAP TOTAL REVENUE 195,486$ (5,695)$ 189,791$ 143,664$ (7,871)$ 135,793$ 101,637$ 20,568$ 122,205$ 629,568$ 12,213$ 641,781$ Included in the above results: ASC 985-605 and ASC 605-25 (2) 5,695 (5,695) - 7,871 (7,871) - (20,568) 20,568 - (12,213) 12,213 - COST OF REVENUE 149,502$ (13,586)$ 135,916$ 103,162$ (7,906)$ 95,256$ 82,022$ 10,867$ 92,889$ 459,756$ (5,216)$ 454,540$ Included in the above results: ASC 985-605 (2) 9,455 (9,455) - 7,259 (7,259) - (11,368) 11,368 - (2,991) 2,991 - Amortization of intangible assets (3) 459 (459) - 459 (459) - 360 (360) - 1,837 (1,837) - Inventory step up (4) - - - - - - 15 (15) - 2,199 (2,199) - Share-based compensation (5) 186 (186) - 188 (188) - 126 (126) - 685 (685) - Excess and obsolete (6) 3,486 (3,486) - - - - - - - 3,486 (3,486) - GROSS PROFIT 45,984$ 7,891$ 53,875$ 40,502$ 35$ 40,537$ 19,615$ 9,701$ 29,316$ 169,812$ 17,429$ 187,241$ GROSS MARGIN % 23.5% 28.4% 28.2% 29.9% 19.3% 24.0% 27.0% 29.2% OPERATING EXPENSES 59,000$ (8,121)$ 50,879$ 44,349$ (4,255)$ 40,094$ 44,291$ (1,267)$ 43,024$ 188,801$ (18,015)$ 170,786$ Included in the above results: Amortization of intangible assets (3) 2,824 (2,824) - 939 (939) - 1,402 (1,402) - 6,459 (6,459) - Share-based compensation (5) 1,764 (1,764) - 1,307 (1,307) - 1,011 (1,011) - 5,213 (5,213) - Acquisition related (7) 177 (177) - 1,094 (1,094) - (2,707) 2,707 - 1,271 (1,271) - Restructuring (8) 3,356 (3,356) - 915 (915) - 1,561 (1,561) - 5,072 (5,072) - INCOME/(LOSS) FROM CONTINUING OPERATIONS (13,016)$ 16,012$ 2,996$ (3,847)$ 4,290$ 443$ (24,676)$ 10,968$ (13,708)$ (18,989)$ 35,444$ 16,455$ OPERATING MARGIN % -6.7% 1.6% -2.7% 0.3% -24.3% -11.2% -3.0% 2.6% OTHER INCOME/(EXPENSE), NET (9) 62$ -$ 62$ 2,890$ (341)$ 2,549$ (3,505)$ -$ (3,505)$ (1,002)$ 3,777$ 2,775$ INCOME TAX EFFECTS: PROVISION/(BENEFIT) (856)$ -$ (856)$ 715$ -$ 715$ (511)$ -$ (511)$ 1,242$ -$ 1,242$ NET INCOME/(LOSS) FROM CONTINUING OPERATIONS (12,098)$ 3,914$ (1,672)$ 2,277$ (27,670)$ (16,702)$ (21,233)$ 17,988$ BASIC NET INCOME/(LOSS) PER SHARE FROM CONTINUING OPERATIONS (0.39)$ 0.13$ (0.05)$ 0.07$ (0.91)$ (0.55)$ (0.69)$ 0.59$ WEIGHTED AVERAGE SHARES USED IN COMPUTING BASIC NET INCOME/(LOSS) PER SHARE 31,029 31,029 30,577 30,577 30,121 30,121 30,608 30,608 DILUTED NET INCOME/(LOSS) PER SHARE FROM CONTINUING OPERATIONS (0.39)$ 0.12$ (0.05)$ 0.07$ (0.91)$ (0.55)$ (0.69)$ 0.57$ WEIGHTED AVERAGE SHARES USED IN COMPUTING DILUTED NET INCOME/(LOSS) PER SHARE 31,029 33,005 30,577 32,074 30,121 30,121 30,608 31,813
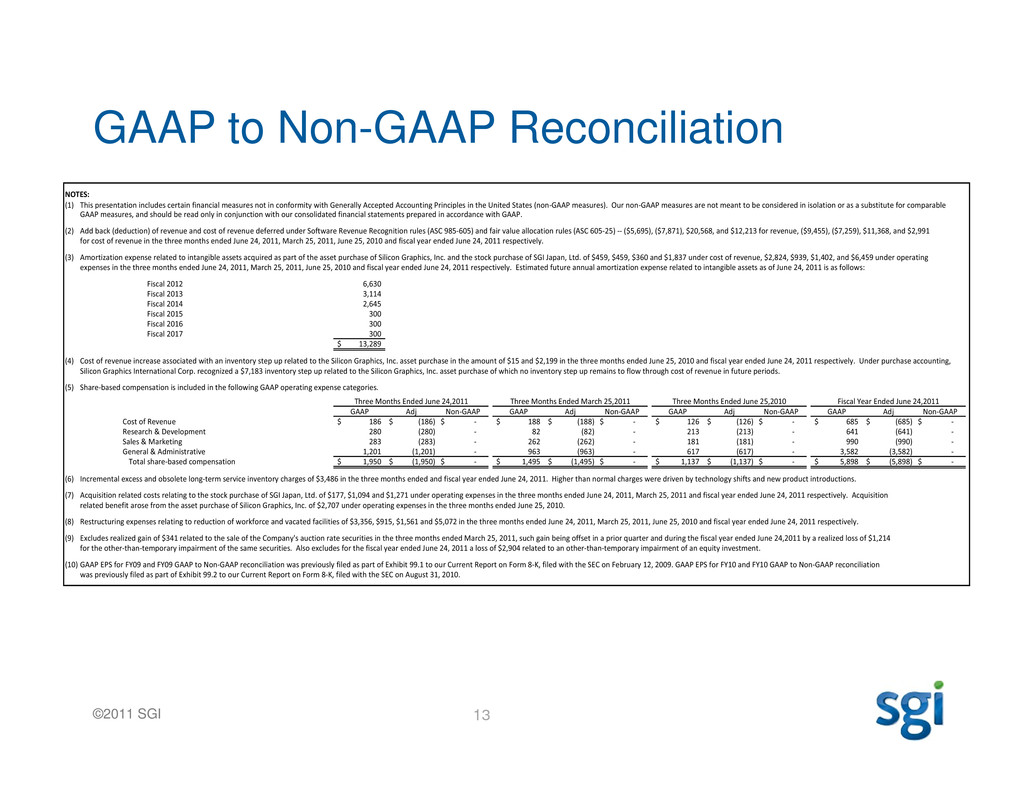
13©2011 SGI GAAP to Non-GAAP Reconciliation NOTES: (1) This presentation includes certain financial measures not in conformity with Generally Accepted Accounting Principles in the United States (non-GAAP measures). Our non-GAAP measures are not meant to be considered in isolation or as a substitute for comparable GAAP measures, and should be read only in conjunction with our consolidated financial statements prepared in accordance with GAAP. (2) Add back (deduction) of revenue and cost of revenue deferred under Software Revenue Recognition rules (ASC 985-605) and fair value allocation rules (ASC 605-25) -- ($5,695), ($7,871), $20,568, and $12,213 for revenue, ($9,455), ($7,259), $11,368, and $2,991 for cost of revenue in the three months ended June 24, 2011, March 25, 2011, June 25, 2010 and fiscal year ended June 24, 2011 respectively. (3) Amortization expense related to intangible assets acquired as part of the asset purchase of Silicon Graphics, Inc. and the stock purchase of SGI Japan, Ltd. of $459, $459, $360 and $1,837 under cost of revenue, $2,824, $939, $1,402, and $6,459 under operating expenses in the three months ended June 24, 2011, March 25, 2011, June 25, 2010 and fiscal year ended June 24, 2011 respectively. Estimated future annual amortization expense related to intangible assets as of June 24, 2011 is as follows: Fiscal 2012 6,630 Fiscal 2013 3,114 Fiscal 2014 2,645 Fiscal 2015 300 Fiscal 2016 300 Fiscal 2017 300 13,289$ (4) Cost of revenue increase associated with an inventory step up related to the Silicon Graphics, Inc. asset purchase in the amount of $15 and $2,199 in the three months ended June 25, 2010 and fiscal year ended June 24, 2011 respectively. Under purchase accounting, Silicon Graphics International Corp. recognized a $7,183 inventory step up related to the Silicon Graphics, Inc. asset purchase of which no inventory step up remains to flow through cost of revenue in future periods. (5) Share-based compensation is included in the following GAAP operating expense categories. Three Months Ended June 24,2011 Three Months Ended March 25,2011 Three Months Ended June 25,2010 Fiscal Year Ended June 24,2011 GAAP Adj Non-GAAP GAAP Adj Non-GAAP GAAP Adj Non-GAAP GAAP Adj Non-GAAP Cost of Revenue 186$ (186)$ -$ 188$ (188)$ -$ 126$ (126)$ -$ 685$ (685)$ -$ Research & Development 280 (280) - 82 (82) - 213 (213) - 641 (641) - Sales & Marketing 283 (283) - 262 (262) - 181 (181) - 990 (990) - General & Administrative 1,201 (1,201) - 963 (963) - 617 (617) - 3,582 (3,582) - Total share-based compensation 1,950$ (1,950)$ -$ 1,495$ (1,495)$ -$ 1,137$ (1,137)$ -$ 5,898$ (5,898)$ -$ (6) Incremental excess and obsolete long-term service inventory charges of $3,486 in the three months ended and fiscal year ended June 24, 2011. Higher than normal charges were driven by technology shifts and new product introductions. (7) Acquisition related costs relating to the stock purchase of SGI Japan, Ltd. of $177, $1,094 and $1,271 under operating expenses in the three months ended June 24, 2011, March 25, 2011 and fiscal year ended June 24, 2011 respectively. Acquisition related benefit arose from the asset purchase of Silicon Graphics, Inc. of $2,707 under operating expenses in the three months ended June 25, 2010. (8) Restructuring expenses relating to reduction of workforce and vacated facilities of $3,356, $915, $1,561 and $5,072 in the three months ended June 24, 2011, March 25, 2011, June 25, 2010 and fiscal year ended June 24, 2011 respectively. (9) Excludes realized gain of $341 related to the sale of the Company's auction rate securities in the three months ended March 25, 2011, such gain being offset in a prior quarter and during the fiscal year ended June 24,2011 by a realized loss of $1,214 for the other-than-temporary impairment of the same securities. Also excludes for the fiscal year ended June 24, 2011 a loss of $2,904 related to an other-than-temporary impairment of an equity investment. (10) GAAP EPS for FY09 and FY09 GAAP to Non-GAAP reconciliation was previously filed as part of Exhibit 99.1 to our Current Report on Form 8-K, filed with the SEC on February 12, 2009. GAAP EPS for FY10 and FY10 GAAP to Non-GAAP reconciliation was previously filed as part of Exhibit 99.2 to our Current Report on Form 8-K, filed with the SEC on August 31, 2010.
14©2011 SGI
