Attached files
| file | filename |
|---|---|
| 8-K - 8-K - KAPSTONE PAPER & PACKAGING CORP | a11-27044_18k.htm |
Exhibit 99.1
|
|
September 2011 WELL POSITIONED TO PROSPER Financial Officer Matt Kaplan President and Chief Operating Officer Andrea K. Tarbox Vice President and Chief Financial Officer |

|
|
2 FORWARD LOOKING STATEMENTS The information in this presentation and statements made during this presentation may contain certain forward-looking statements within the meaning of federal securities laws. These statements reflect management’s expectations regarding future events and operating performance. These forward-looking statements involve a number of risks and uncertainties. A list of the factors that could cause actual results to differ materially from those expressed in, or underlying, any forward-looking statements can be found in the Company’s filings with the Securities and Exchange Commission, such as its annual and quarterly reports. The Company disclaims any obligation to revise or update such statements to reflect the occurrence of events after the date of this presentation. This presentation refers to non-U.S. GAAP financial information. For a reconciliation to U.S. GAAP financial measures, please refer to the appendix. Forward-Looking Statements Non-GAAP Financial Measures Risk Factors 2 |
|
|
3 KAPSTONE TODAY 3 |
|
|
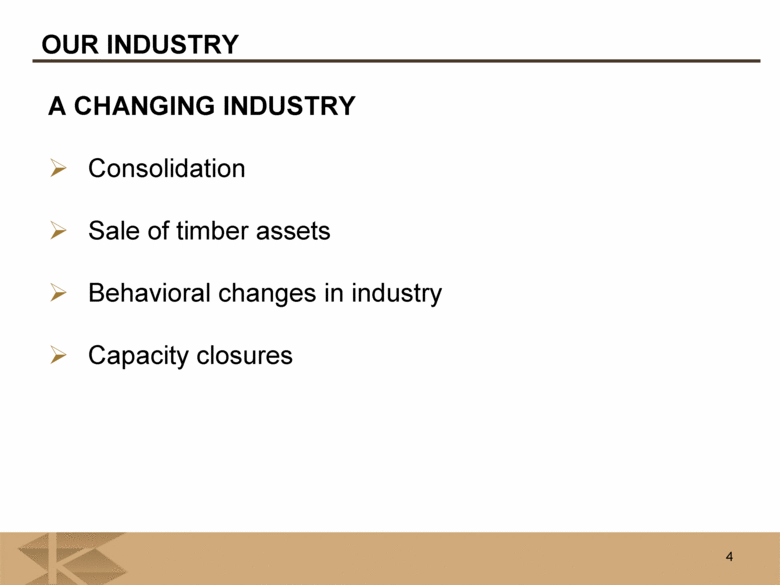
4 OUR INDUSTRY A CHANGING INDUSTRY Consolidation Sale of timber assets Behavioral changes in industry Capacity closures |
|
|
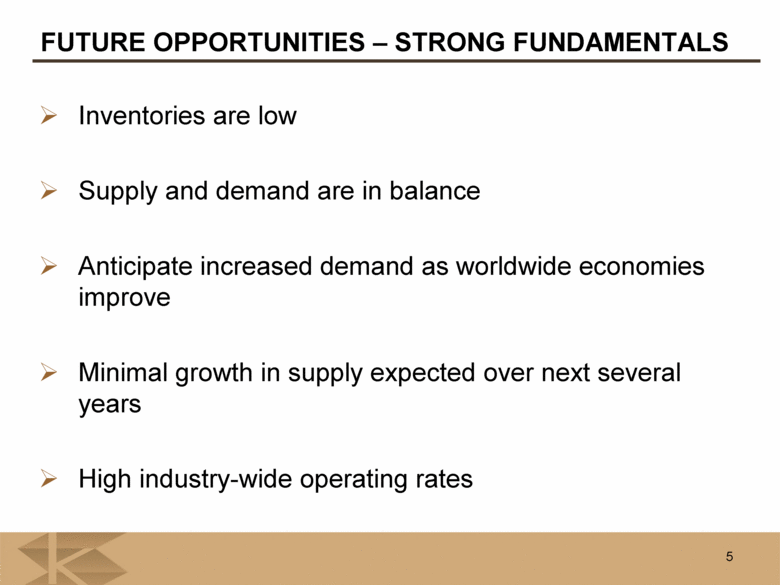
Inventories are low Supply and demand are in balance Anticipate increased demand as worldwide economies improve Minimal growth in supply expected over next several years High industry-wide operating rates FUTURE OPPORTUNITIES – STRONG FUNDAMENTALS 5 |
|
|
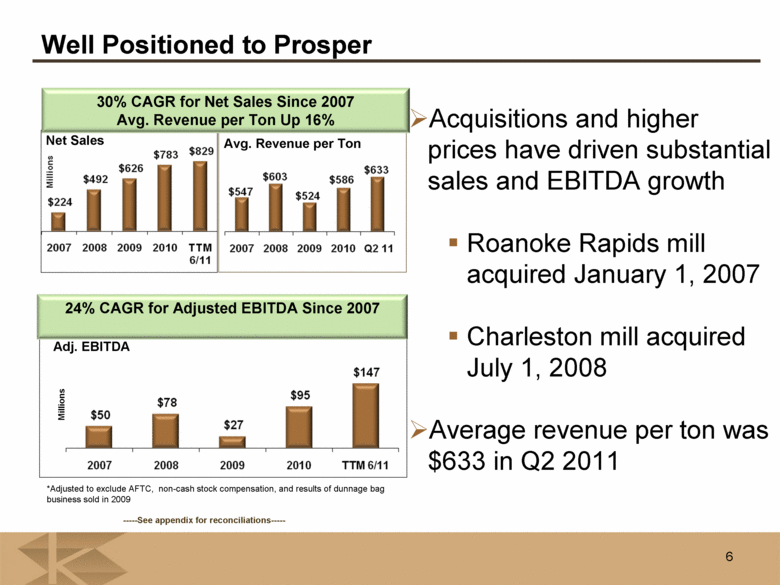
6 Well Positioned to Prosper Avg. Revenue per Ton 24% CAGR for Adjusted EBITDA Since 2007 30% CAGR for Net Sales Since 2007 Avg. Revenue per Ton Up 16% Net Sales Adj. EBITDA -----See appendix for reconciliations----- Millions Acquisitions and higher prices have driven substantial sales and EBITDA growth Roanoke Rapids mill acquired January 1, 2007 Charleston mill acquired July 1, 2008 Average revenue per ton was $633 in Q2 2011 *Adjusted to exclude AFTC, non-cash stock compensation, and results of dunnage bag business sold in 2009 |
|
|
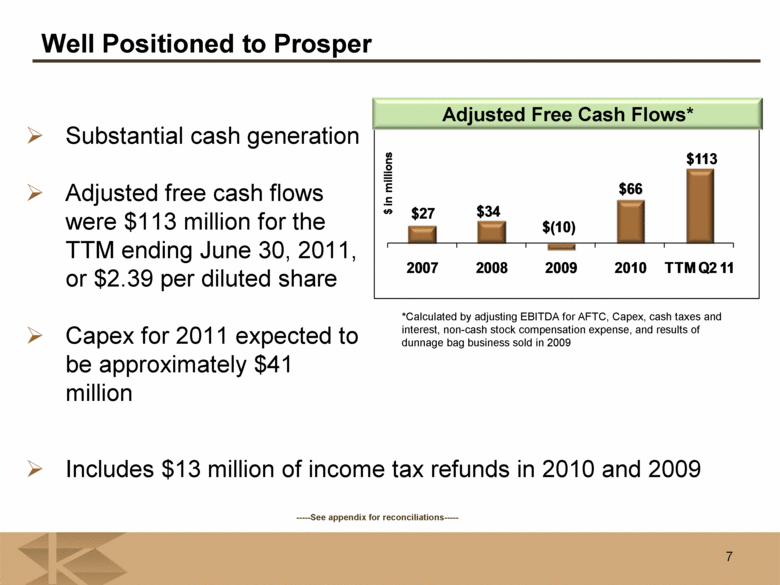
Substantial cash generation Adjusted free cash flows were $113 million for the TTM ending June 30, 2011, or $2.39 per diluted share Capex for 2011 expected to be approximately $41 million *Calculated by adjusting EBITDA for AFTC, Capex, cash taxes and interest, non-cash stock compensation expense, and results of dunnage bag business sold in 2009 Includes $13 million of income tax refunds in 2010 and 2009 Adjusted Free Cash Flows* 7 Well Positioned to Prosper -----See appendix for reconciliations----- $27 $34 $(10) $66 $113 2007 2008 2009 2010 TTM Q2 11 $ in millions |
|
|
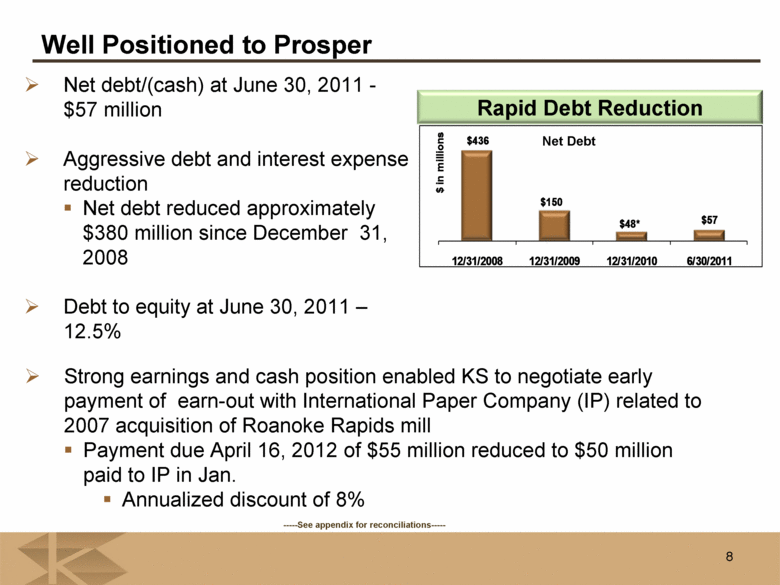
8 Net debt/(cash) at June 30, 2011 - $57 million Aggressive debt and interest expense reduction Net debt reduced approximately $380 million since December 31, 2008 Debt to equity at June 30, 2011 – 12.5% Rapid Debt Reduction Strong earnings and cash position enabled KS to negotiate early payment of earn-out with International Paper Company (IP) related to 2007 acquisition of Roanoke Rapids mill Payment due April 16, 2012 of $55 million reduced to $50 million paid to IP in Jan. Annualized discount of 8% Net Debt Well Positioned to Prosper -----See appendix for reconciliations----- $436 $150 $48* $57 12/31/2008 12/31/2009 12/31/2010 6/30/2011 $ in millions |
|
|
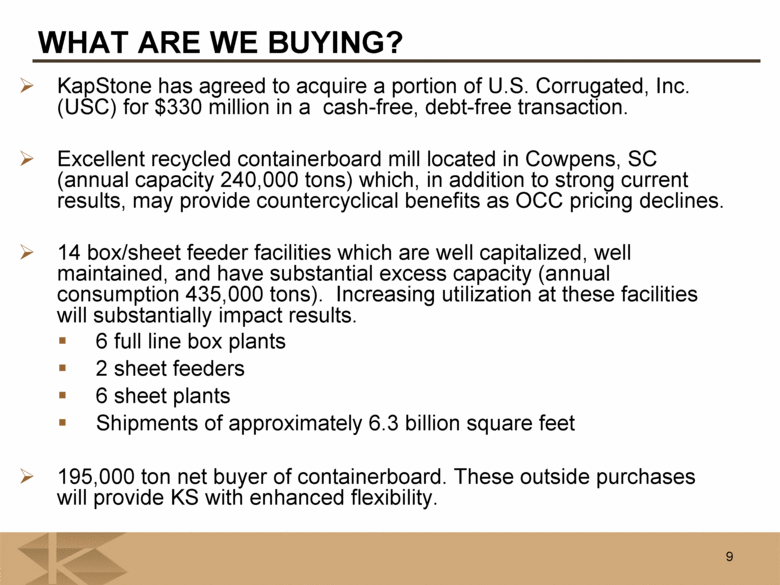
9 WHAT ARE WE BUYING? KapStone has agreed to acquire a portion of U.S. Corrugated, Inc. (USC) for $330 million in a cash-free, debt-free transaction. Excellent recycled containerboard mill located in Cowpens, SC (annual capacity 240,000 tons) which, in addition to strong current results, may provide countercyclical benefits as OCC pricing declines. 14 box/sheet feeder facilities which are well capitalized, well maintained, and have substantial excess capacity (annual consumption 435,000 tons). Increasing utilization at these facilities will substantially impact results. 6 full line box plants 2 sheet feeders 6 sheet plants Shipments of approximately 6.3 billion square feet 195,000 ton net buyer of containerboard. These outside purchases will provide KS with enhanced flexibility. 9 |
|
|
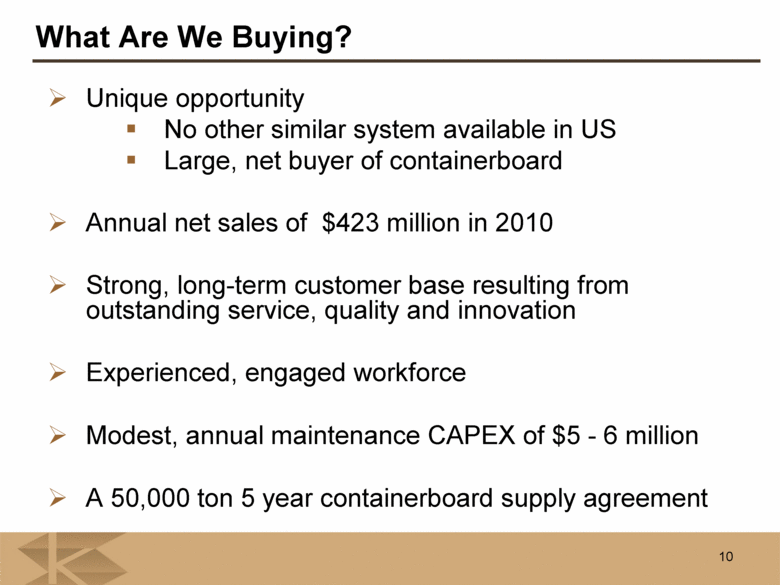
10 Unique opportunity No other similar system available in US Large, net buyer of containerboard Annual net sales of $423 million in 2010 Strong, long-term customer base resulting from outstanding service, quality and innovation Experienced, engaged workforce Modest, annual maintenance CAPEX of $5 - 6 million A 50,000 ton 5 year containerboard supply agreement 10 What Are We Buying? |
|
|
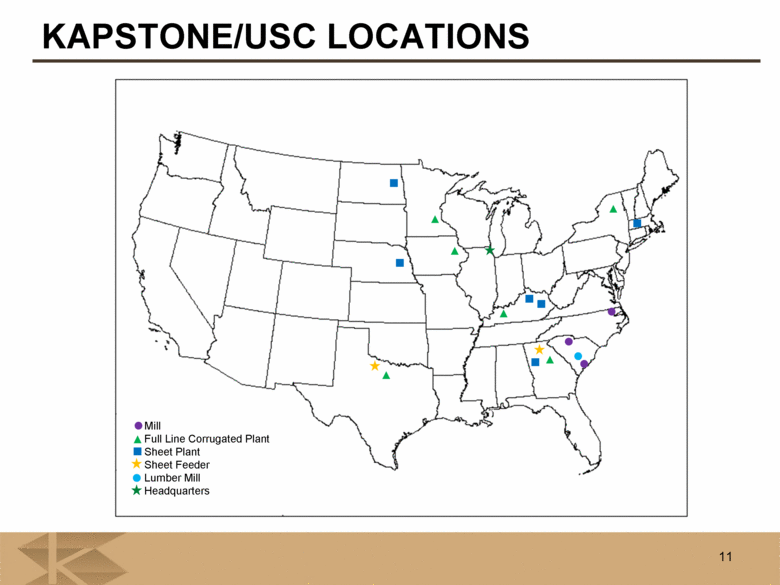
KAPSTONE/USC LOCATIONS Mill Full Line Corrugated Plant Sheet Plant Sheet Feeder Lumber Mill Headquarters 11 |
|
|
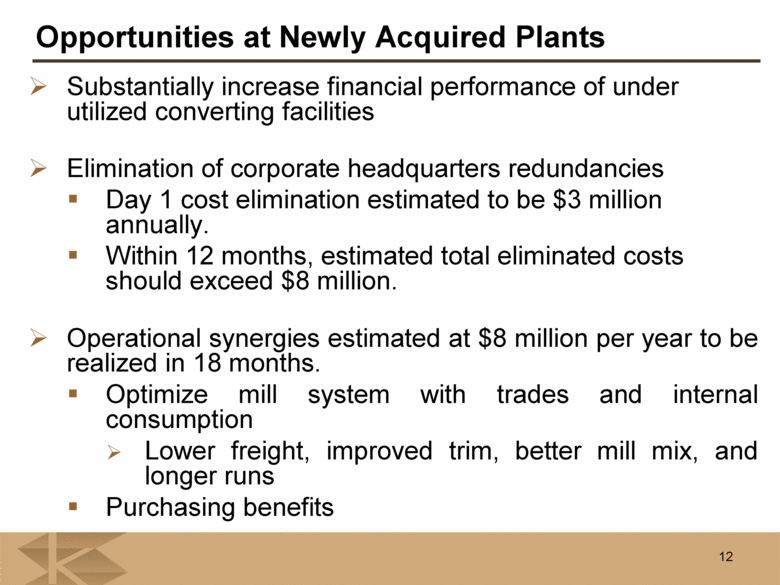
12 Substantially increase financial performance of under utilized converting facilities Elimination of corporate headquarters redundancies Day 1 cost elimination estimated to be $3 million annually. Within 12 months, estimated total eliminated costs should exceed $8 million. Operational synergies estimated at $8 million per year to be realized in 18 months. Optimize mill system with trades and internal consumption Lower freight, improved trim, better mill mix, and longer runs Purchasing benefits 12 Opportunities at Newly Acquired Plants |
|
|
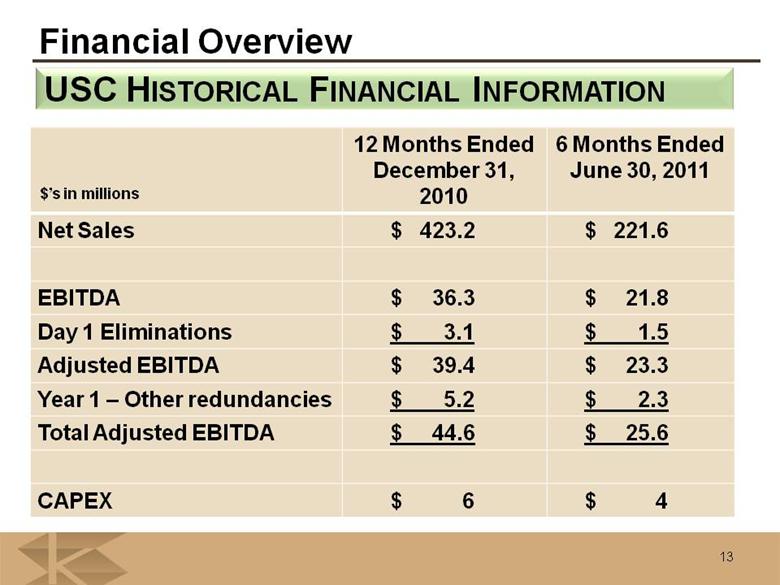
13 USC HISTORICAL FINANCIAL INFORMATION 13 12 Months Ended December 31, 2010 6 Months Ended June 30, 2011 Net Sales $ 423.2 $ 221.6 EBITDA $ 36.3 $ 21.8 Day 1 Eliminations $ 3.1 $ 1.5 Adjusted EBITDA $ 39.4 $ 23.3 Year 1 – Other redundancies $ 5.2 $ 2.3 Total Adjusted EBITDA $ 44.6 $ 25.6 CAPEX $ 6 $ 4 $’s in millions Financial Overview |
|
|
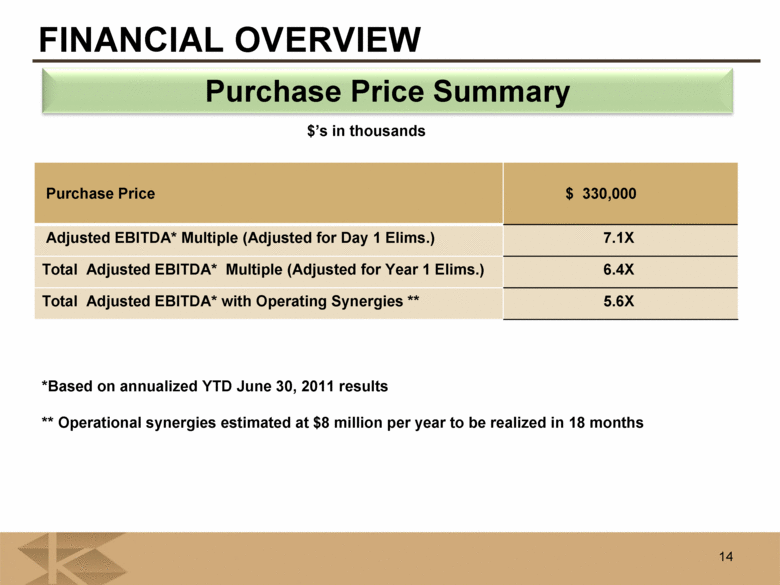
14 14 Purchase Price $ 330,000 Adjusted EBITDA* Multiple (Adjusted for Day 1 Elims.) 7.1X Total Adjusted EBITDA* Multiple (Adjusted for Year 1 Elims.) 6.4X Total Adjusted EBITDA* with Operating Synergies ** 5.6X Purchase Price Summary *Based on annualized YTD June 30, 2011 results ** Operational synergies estimated at $8 million per year to be realized in 18 months $’s in thousands FINANCIAL OVERVIEW |
|
|
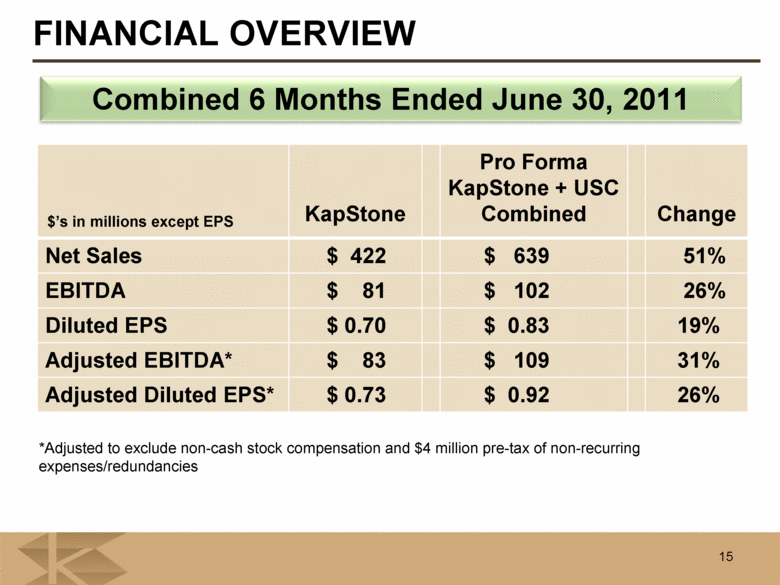
15 FINANCIAL OVERVIEW 15 Combined 6 Months Ended June 30, 2011 KapStone Pro Forma KapStone + USC Combined Change Net Sales $ 422 $ 639 51% EBITDA $ 81 $ 102 26% Diluted EPS $ 0.70 $ 0.83 19% Adjusted EBITDA* $ 83 $ 109 31% Adjusted Diluted EPS* $ 0.73 $ 0.92 26% $’s in millions except EPS *Adjusted to exclude non-cash stock compensation and $4 million pre-tax of non-recurring expenses/redundancies |
|
|
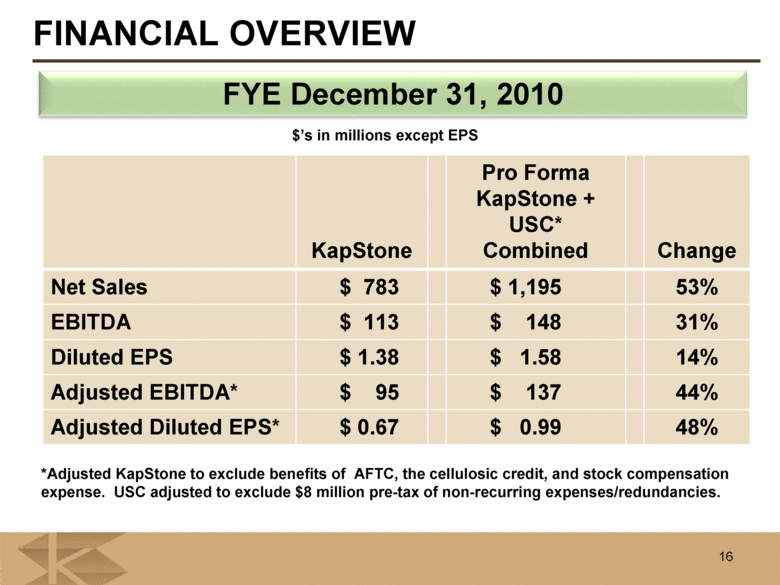
16 FINANCIAL OVERVIEW 16 FYE December 31, 2010 KapStone Pro Forma KapStone + USC* Combined Change Net Sales $ 783 $ 1,195 53% EBITDA $ 113 $ 148 31% Diluted EPS $ 1.38 $ 1.58 14% Adjusted EBITDA* $ 95 $ 137 44% Adjusted Diluted EPS* $ 0.67 $ 0.99 48% $’s in millions except EPS *Adjusted KapStone to exclude benefits of AFTC, the cellulosic credit, and stock compensation expense. USC adjusted to exclude $8 million pre-tax of non-recurring expenses/redundancies. |
|
|
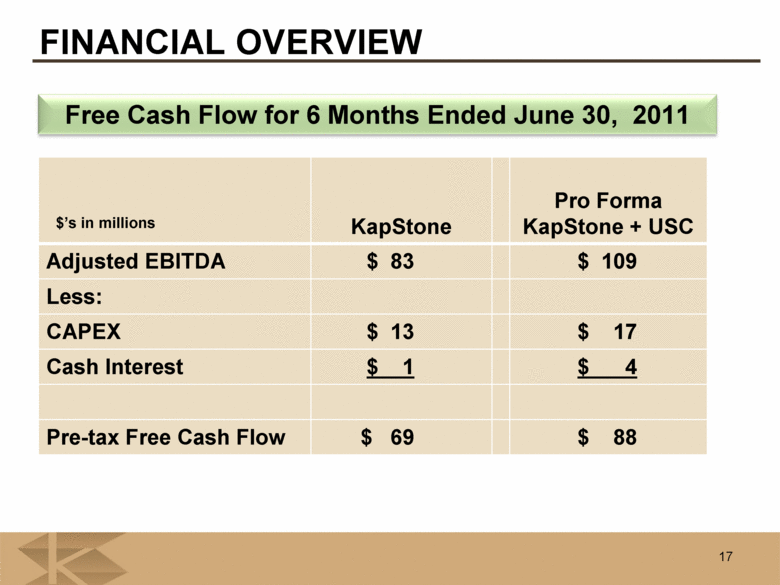
17 17 Free Cash Flow for 6 Months Ended June 30, 2011 KapStone Pro Forma KapStone + USC Adjusted EBITDA $ 83 $ 109 Less: CAPEX $ 13 $ 17 Cash Interest $ 1 $ 4 Pre-tax Free Cash Flow $ 69 $ 88 $’s in millions FINANCIAL OVERVIEW |
|
|
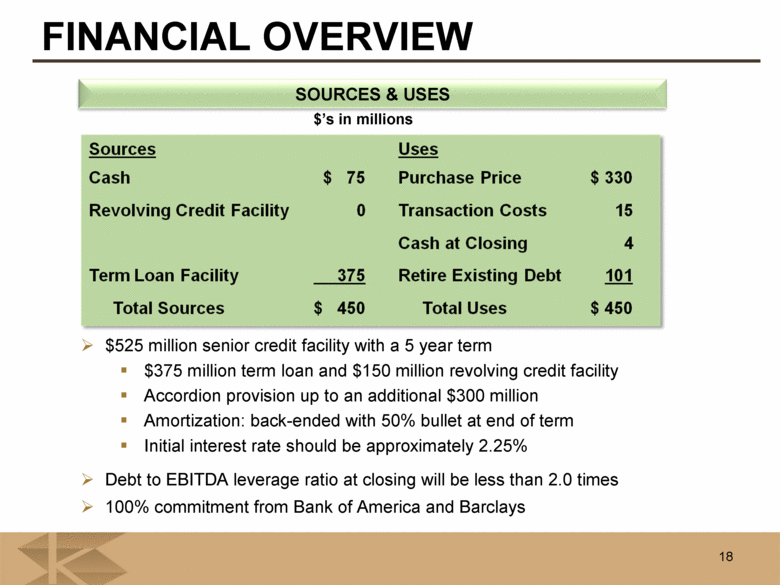
18 FINANCIAL OVERVIEW 18 $525 million senior credit facility with a 5 year term $375 million term loan and $150 million revolving credit facility Accordion provision up to an additional $300 million Amortization: back-ended with 50% bullet at end of term Initial interest rate should be approximately 2.25% Debt to EBITDA leverage ratio at closing will be less than 2.0 times 100% commitment from Bank of America and Barclays $’s in millions SOURCES & USES |
|
|
19 ACQUISITION RATIONALE Accretive Day 1 Increases exposure to highly desirable containerboard segment Substantial profit improvement opportunities Improve converting results by selling excess capacity Eliminate corporate headquarters redundancies Capture operational synergies Building on positive momentum Mitigates risk of costly mill downtime during slow demand periods as a result of large outside purchases and substantially lower downtime costs at Cowpens, SC mill (recycled mill) 19 |
|
|
20 ACQUISITION RATIONALE Unique, one of a kind opportunity Provides an alternative, logical, lower cost, and lower risk growth path while we continue to pursue sensible mill properties High combined company free cash flow should result in rapid deleveraging Improves risk profile of the company 20 |
|
|
21 THE “NEW, TRANSFORMED” KAPSTONE 21 Increased exposure to highly desirable containerboard segment Significant opportunity to grow revenue and profits by increasing utilization of converting facilities Addition of 2 product lines, corrugated medium and boxes Purchaser of 195 thousand tons of containerboard 2010 combined net sales of approximately $1.2 billion Enhanced profitability throughout the economic cycle as the risk of costly lack of order downtime is mitigated Modest leverage ratio Day 1 with opportunity to quickly de-lever due to strong free cash flow Alternative, logical growth path in addition to purchasing mill assets Ability to grow in the future due to Strong Day 1 balance sheet |

|
|
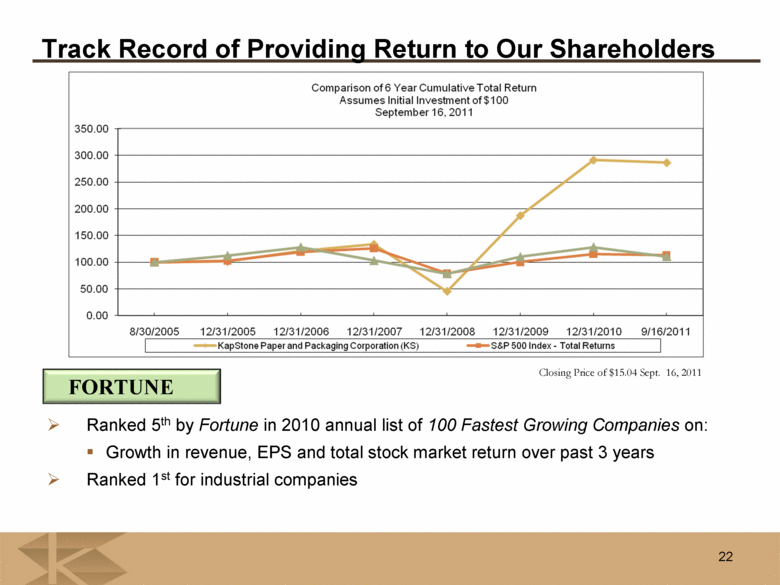
22 Track Record of Providing Return to Our Shareholders Closing Price of $15.04 Sept. 16, 2011 Ranked 5th by Fortune in 2010 annual list of 100 Fastest Growing Companies on: Growth in revenue, EPS and total stock market return over past 3 years Ranked 1st for industrial companies FORTUNE |
|
|
Appendix |
|
|
24 A UNIQUE BEGINNING In April 2005, KapStone was founded as a Special Purpose Acquisition Corp. Management team consisted of two paper and packaging industry veterans, Roger Stone and Matt Kaplan Successful record of managing paper and packaging assets History of identifying and acquiring assets at attractive valuations Outstanding long-term reputation in the credit markets Proven track record of growing shareholder value Collectively are largest stakeholders in stock $120 million raised in IPO Focus on paper, packaging, and forest products industries |
|
|
25 Growth of Business In January 2007, KapStone acquired IP’s Kraft Papers Business for $151 million Purchase price multiple of 3.3 times based on 2007 EBITDA including 2 contingent earn-out payments subsequently earned: $4 million paid in 2009 $50 million pre-paid in Jan. 2011 at 8% annualized discount In July 2008, KapStone acquired MWV’s Charleston Kraft Division for $471 million Purchase price multiple of 5.8 times based on 2007 adjusted EBITDA OUR FACILITIES |

|
|
26 OUR FACILITIES Presently the company consists of: Two highly efficient and cost effective paper mills Capable of producing approximately 1.3 million tons of various paper grades annually We also own a saw mill in close proximity to our Charleston mill Locations Both mills well located for domestic and export distribution Access to abundant, high quality, low cost wood. Quality leader across product lines Moderate annual maintenance CAPEX of $25 to $30 million |

|
|
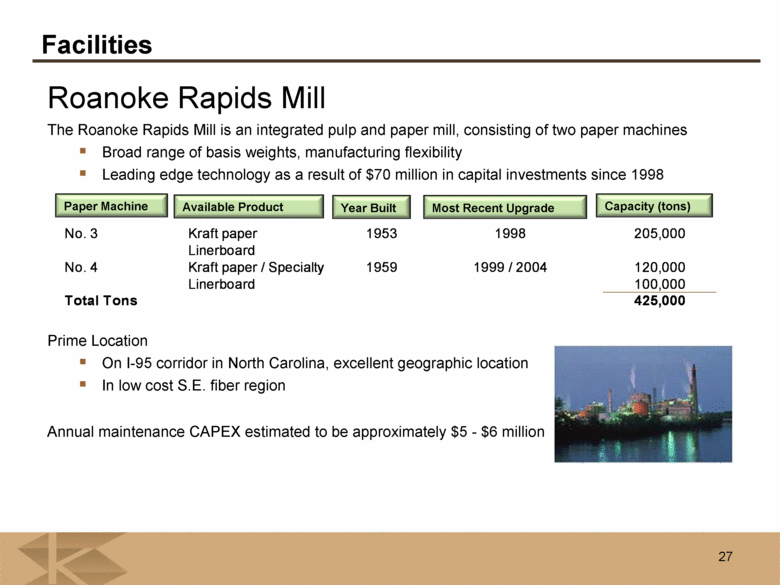
Roanoke Rapids Mill The Roanoke Rapids Mill is an integrated pulp and paper mill, consisting of two paper machines Broad range of basis weights, manufacturing flexibility Leading edge technology as a result of $70 million in capital investments since 1998 Prime Location On I-95 corridor in North Carolina, excellent geographic location In low cost S.E. fiber region Annual maintenance CAPEX estimated to be approximately $5 - $6 million 27 Facilities Paper Machine Available Product Year Built Most Recent Upgrade Capacity (tons) No. 3 Kraft paper 1953 1998 205,000 Linerboard No. 4 Kraft paper / Specialty 1959 1999 / 2004 120,000 Linerboard 100,000 Total Tons 425,000 |
|
|
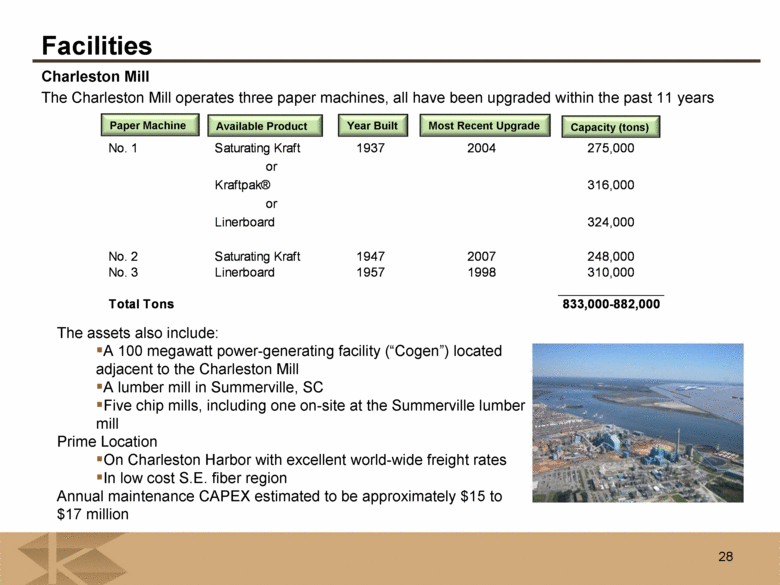
Charleston Mill The Charleston Mill operates three paper machines, all have been upgraded within the past 11 years 28 Facilities Paper Machine Available Product Year Built Most Recent Upgrade Capacity (tons) The assets also include: A 100 megawatt power-generating facility (“Cogen”) located adjacent to the Charleston Mill A lumber mill in Summerville, SC Five chip mills, including one on-site at the Summerville lumber mill Prime Location On Charleston Harbor with excellent world-wide freight rates In low cost S.E. fiber region Annual maintenance CAPEX estimated to be approximately $15 to $17 million No. 1 Saturating Kraft 1937 2004 275,000 or Kraftpak® 316,000 or Linerboard 324,000 No. 2 Saturating Kraft 1947 2007 248,000 No. 3 Linerboard 1957 1998 310,000 Total Tons 833,000-882,000 |
|
|
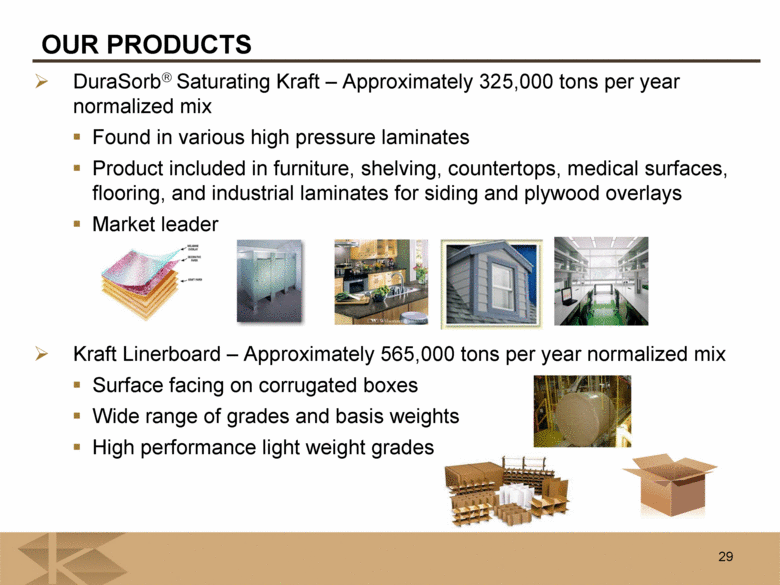
29 OUR PRODUCTS DuraSorb® Saturating Kraft – Approximately 325,000 tons per year normalized mix Found in various high pressure laminates Product included in furniture, shelving, countertops, medical surfaces, flooring, and industrial laminates for siding and plywood overlays Market leader Kraft Linerboard – Approximately 565,000 tons per year normalized mix Surface facing on corrugated boxes Wide range of grades and basis weights High performance light weight grades |
|
|
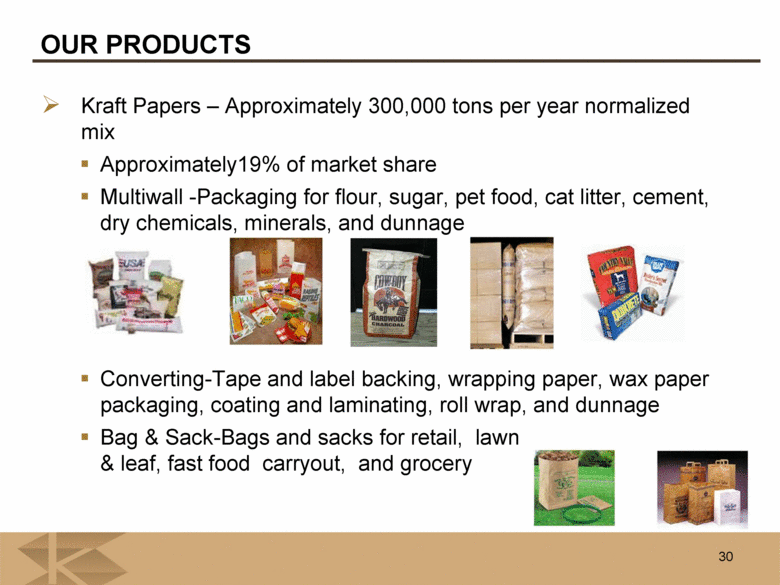
30 OUR PRODUCTS Kraft Papers – Approximately 300,000 tons per year normalized mix Approximately19% of market share Multiwall -Packaging for flour, sugar, pet food, cat litter, cement, dry chemicals, minerals, and dunnage Converting-Tape and label backing, wrapping paper, wax paper packaging, coating and laminating, roll wrap, and dunnage Bag & Sack-Bags and sacks for retail, lawn & leaf, fast food carryout, and grocery |
|
|
31 OUR PRODUCTS Kraftpak ® – Approximately 110,000 tons per year normalized mix A virgin fiber, unbleached, uncoated folding carton board Uses include beverage, gift boxes, take out cartons, retail food, and quick serve cartons Strong position in niche market |

|
|
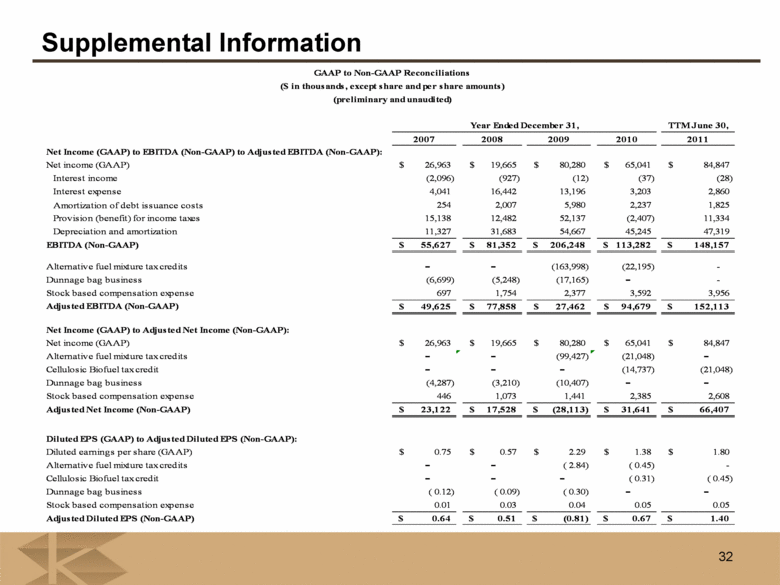
32 Supplemental Information TTM June 30, 2007 2008 2009 2010 2011 Net Income (GAAP) to EBITDA (Non-GAAP) to Adjusted EBITDA (Non-GAAP): Net income (GAAP) 26,963 $ 19,665 $ 80,280 $ 65,041 $ 84,847 $ Interest income (2,096) (927) (12) (37) (28) Interest expense 4,041 16,442 13,196 3,203 2,860 Amortization of debt issuance costs 254 2,007 5,980 2,237 1,825 Provision (benefit) for income taxes 15,138 12,482 52,137 (2,407) 11,334 Depreciation and amortization 11,327 31,683 54,667 45,245 47,319 EBITDA (Non-GAAP) 55,627 $ 81,352 $ 206,248 $ 113,282 $ 148,157 $ Alternative fuel mixture tax credits - - (163,998) (22,195) - Dunnage bag business (6,699) (5,248) (17,165) - - Stock based compensation expense 697 1,754 2,377 3,592 3,956 Adjusted EBITDA (Non-GAAP) 49,625 $ 77,858 $ 27,462 $ 94,679 $ 152,113 $ Net Income (GAAP) to Adjusted Net Income (Non-GAAP): Net income (GAAP) 26,963 $ 19,665 $ 80,280 $ 65,041 $ 84,847 $ Alternative fuel mixture tax credits - - (99,427) (21,048) - Cellulosic Biofuel tax credit - - - (14,737) (21,048) Dunnage bag business (4,287) (3,210) (10,407) - - Stock based compensation expense 446 1,073 1,441 2,385 2,608 Adjusted Net Income (Non-GAAP) 23,122 $ 17,528 $ (28,113) $ 31,641 $ 66,407 $ Diluted EPS (GAAP) to Adjusted Diluted EPS (Non-GAAP): Diluted earnings per share (GAAP) 0.75 $ 0.57 $ 2.29 $ 1.38 $ 1.80 $ Alternative fuel mixture tax credits - - ( 2.84) ( 0.45) - Cellulosic Biofuel tax credit - - - ( 0.31) ( 0.45) Dunnage bag business ( 0.12) ( 0.09) ( 0.30) - - Stock based compensation expense 0.01 0.03 0.04 0.05 0.05 Adjusted Diluted EPS (Non-GAAP) 0.64 $ 0.51 $ (0.81) $ 0.67 $ 1.40 $ Year Ended December 31, GAAP to Non-GAAP Reconciliations ($ in thousands, except share and per share amounts) (preliminary and unaudited) |
|
|
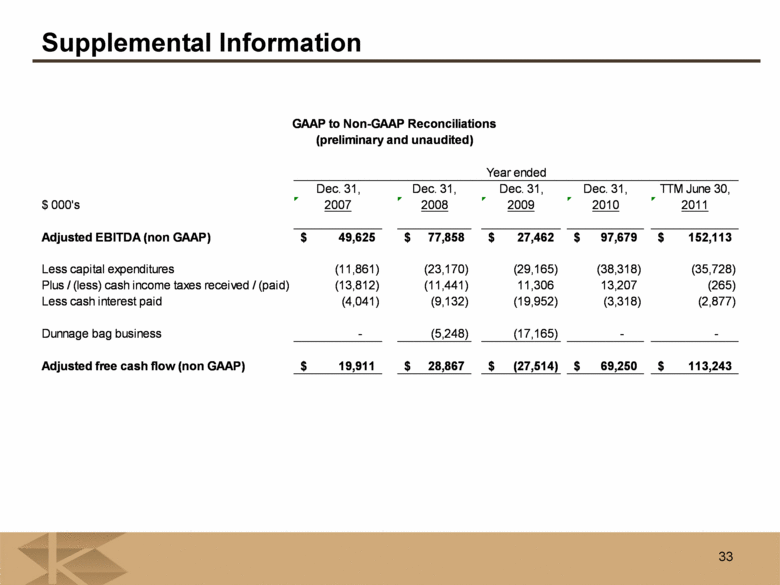
33 Supplemental Information Dec. 31, Dec. 31, Dec. 31, Dec. 31, TTM June 30, $ 000's 2007 2008 2009 2010 2011 Adjusted EBITDA (non GAAP) 49,625 $ 77,858 $ 27,462 $ 97,679 $ 152,113 $ Less capital expenditures (11,861) (23,170) (29,165) (38,318) (35,728) Plus / (less) cash income taxes received / (paid) (13,812) (11,441) 11,306 13,207 (265) Less cash interest paid (4,041) (9,132) (19,952) (3,318) (2,877) Dunnage bag business - (5,248) (17,165) - - Adjusted free cash flow (non GAAP) 19,911 $ 28,867 $ (27,514) $ 69,250 $ 113,243 $ Year ended (preliminary and unaudited) GAAP to Non-GAAP Reconciliations |