Attached files
| file | filename |
|---|---|
| 8-K - FORM 8-K - VERIFONE SYSTEMS, INC. | d8k.htm |
 Financial Results for the Quarter
Ended July 31, 2011
1
1
Exhibit 99.1 |
 Today’s
discussion
may
include
“forward-looking
statements”
within
the
meaning
of
the
Private
Securities
Litigation
Reform
Act
of
1995.
Such
statements relate to future events and expectations and involve known
and unknown risks and uncertainties. VeriFone’s actual results or
actions may differ materially from those projected in the forward-looking
statements. For a summary of the specific risk factors that could cause
results to differ materially from those expressed in the forward-looking
statements, please refer to VeriFone’s filings with the Securities and
Exchange Commission, including its annual report on Form 10-K and
quarterly reports on Form 10-Q. VeriFone is under no obligation to, and
expressly disclaims any obligation to, update or alter its
forward-looking statements, whether as a result of new information,
future events, changes in assumptions or otherwise.
2
2
F
O
R
W
A
R
D
-
L
O
O
K
I
N
G
S
T
A
T
E
M
E
N
T
S |
 N
O
N
-
G
A
A
P
F
I
N
A
N
C
I
A
L
M
E
A
S
U
R
E
S
With respect to any Non-GAAP financial measures presented in the
information, reconciliations of Non-GAAP to GAAP financial
measures may be found in VeriFone’s quarterly earnings release as
filed with the Securities and Exchange Commission as well as the
Appendix to these slides. Management uses Non-GAAP financial
measures only in addition to and in conjunction with results
presented in accordance with GAAP. Management believes that
these Non-GAAP financial measures help it to evaluate VeriFone’s
performance and to compare VeriFone’s current results with those
for
prior
periods
as
well
as
with
the
results
of
peer
companies.
These
Non-GAAP financial measures contain limitations and should be
considered as a supplement to, and not as a substitute for, or
superior to, disclosures made in accordance with GAAP.
3
3 |
 N
O
N
-
G
A
A
P
P
R
O
F
I
T
&
L
O
S
S
O
V
E
R
V
I
E
W *
4
4
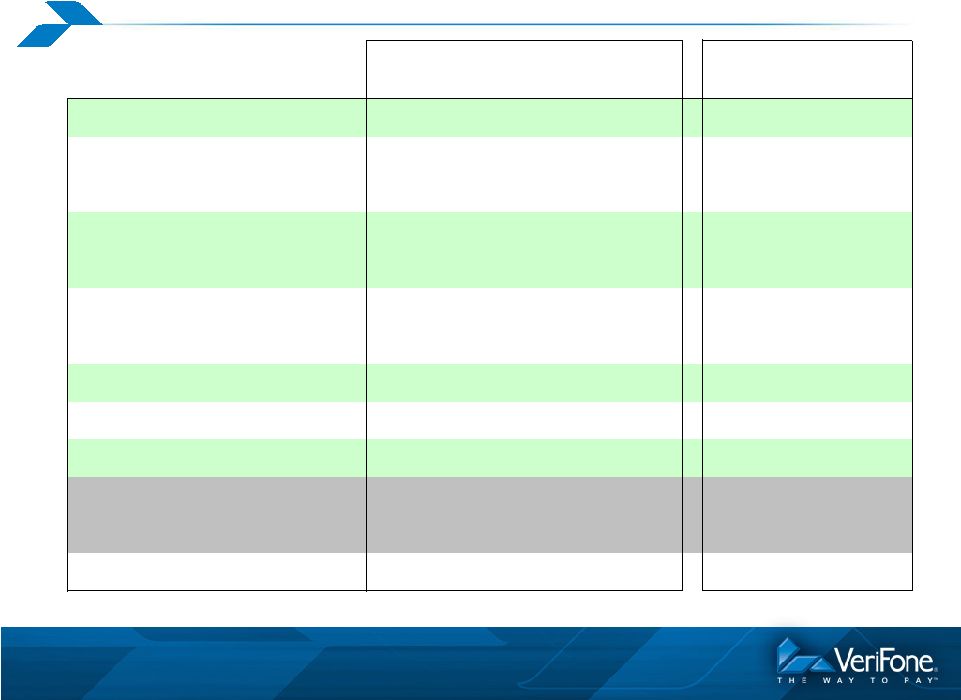
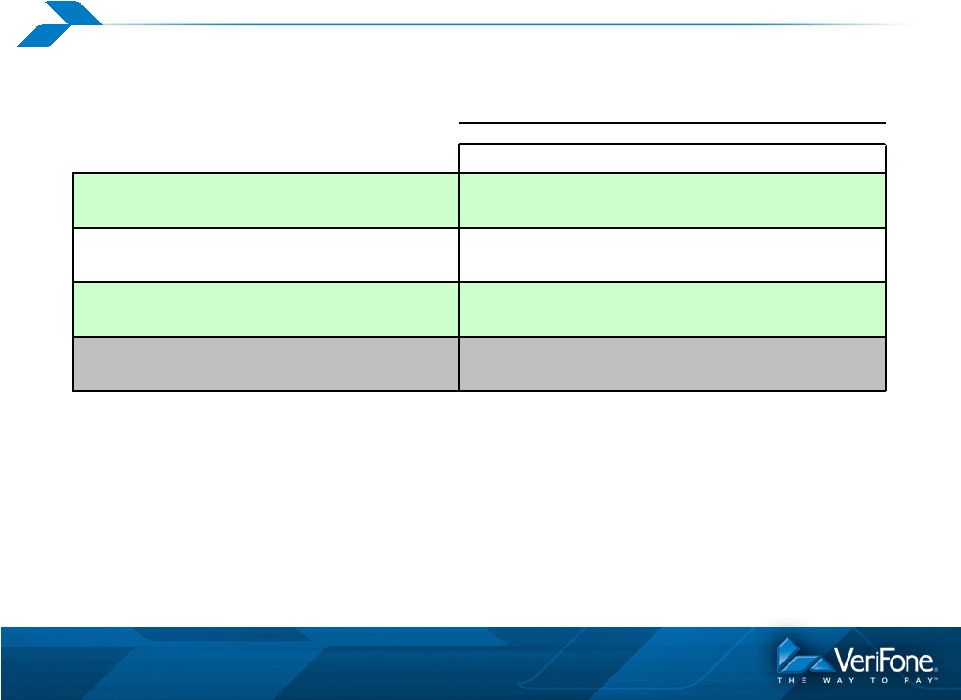
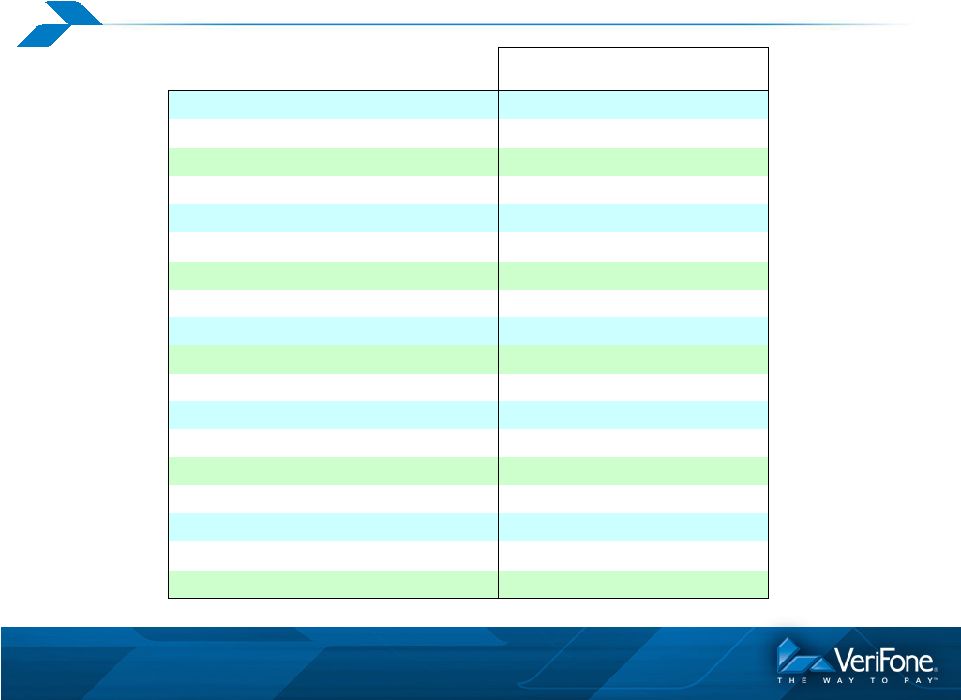
* A reconciliation of our GAAP to Non-GAAP profit & loss can be found on
slides 14 and 15 ($ in thousands, except EPS)
Q310
Q211
Q311
% SEQ
Inc(Dec)
% YoY
Inc(Dec)
Revenue
261,455
292,776
317,155
8.3%
21.3%
Gross Margin
101,005
127,191
135,037
6.2%
33.7%
Gross Margin %
38.6%
43.4%
42.6%
Operating Expense
58,298
71,034
74,321
4.6%
27.5%
Operating Expense %
22.3%
24.3%
23.4%
Operating Profit
42,707
56,157
60,716
8.1%
42.2%
Operating Margin %
16.3%
19.2%
19.1%
Net Interest and Other
(2,803)
(2,527)
(3,139)
24.2%
12.0%
Pre-tax Profit
39,904
53,630
57,577
7.4%
44.3%
Taxes
7,981
10,726
11,515
7.4%
44.3%
Net Income
31,923
42,904
46,062
7.4%
44.3%
Net Income %
12.2%
14.7%
14.5%
EPS
0.36
0.46
0.49
6.5%
36.1%
Q311 |
 N
O
N
-
G
A
A
P
R
E
V
E
N
U
E
P
R
O
F
I
L
E *
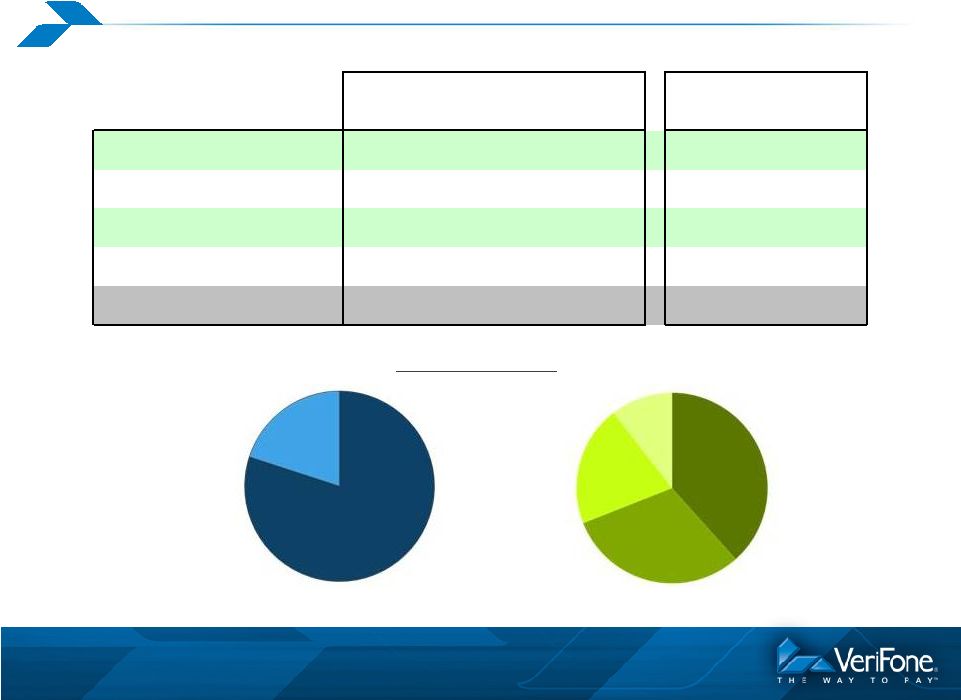
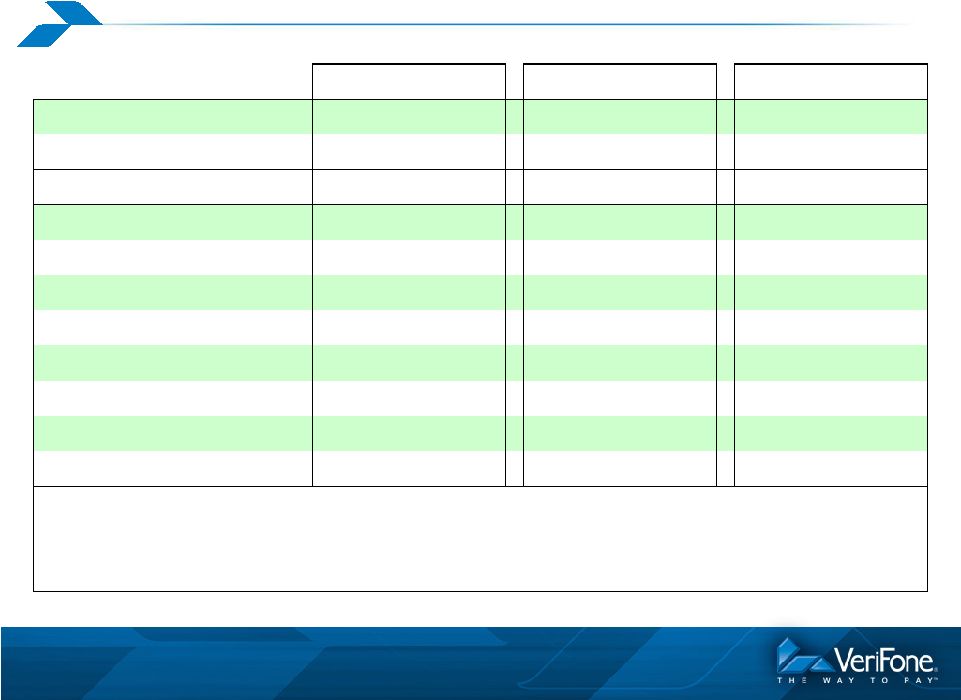
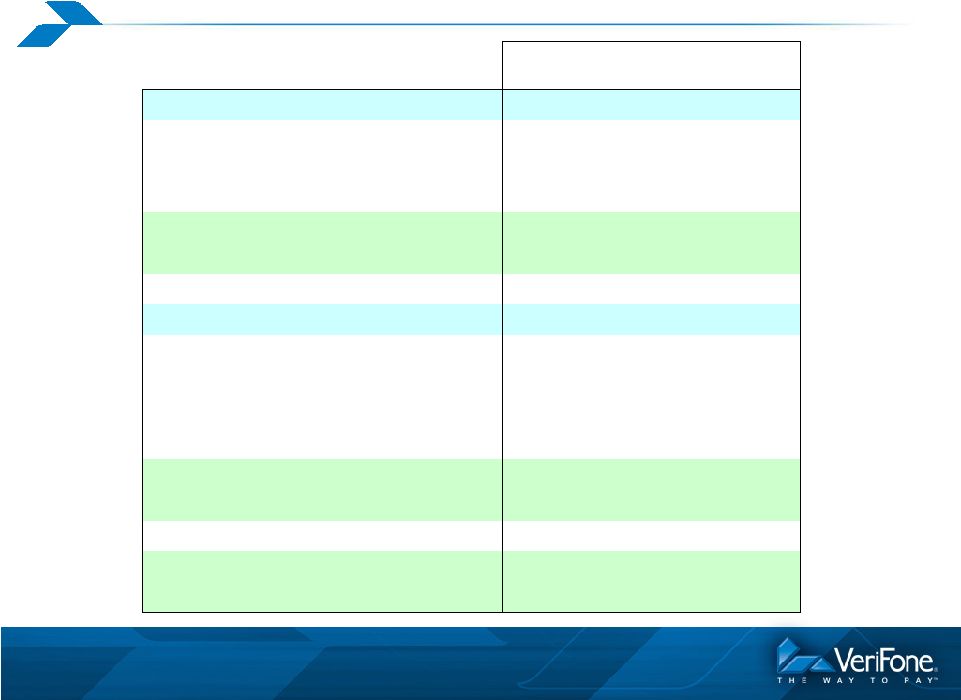
Services
20.0%
System
Solutions
80.0%
Q311 Revenue
LAC
20.5%
NA
38.4%
Asia
10.5%
Europe
30.6%
5
5
* A reconciliation of our GAAP to Non-GAAP revenue can be found on slide
16 ($ in thousands)
Q310
Q211
Q311
% SEQ
Inc(Dec)
% YoY
Inc(Dec)
North America
123,211
120,628
121,836
1.0%
-1.1%
Europe
62,120
93,697
97,206
3.7%
56.5%
Latin America
52,806
56,217
64,961
15.6%
23.0%
Asia
23,318
22,234
33,152
49.1%
42.2%
Total
261,455
292,776
317,155
8.3%
21.3%
Q311 |
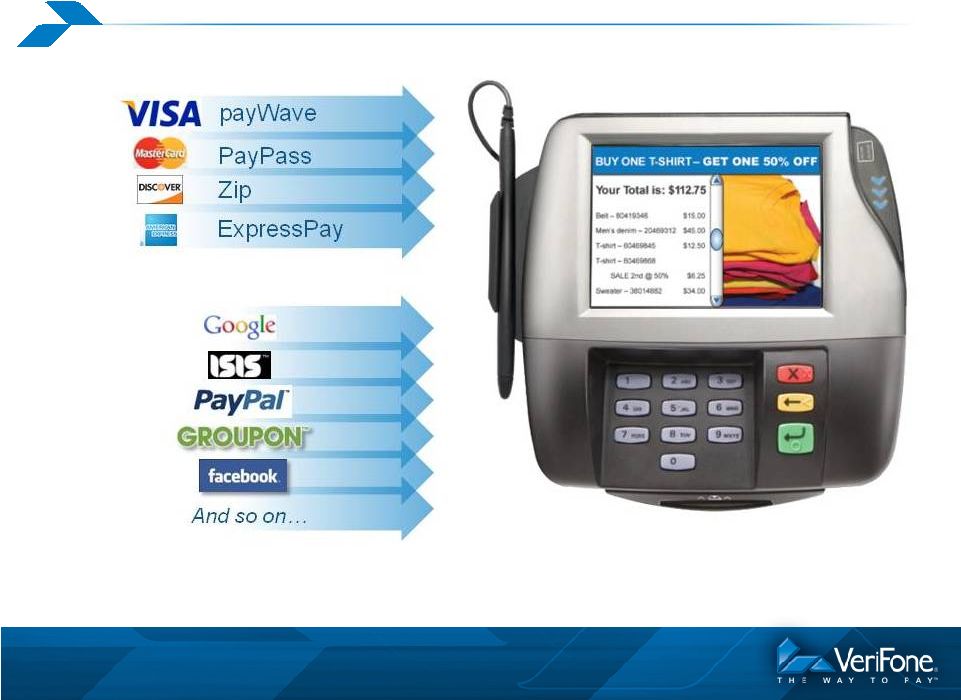 M
A
N
A
G
I
N
G
M
U
L
T
I
P
L
E
N
E
W
S
E
R
V
I
C
E
S
A
T
C
H
E
C
K
O
U
T
…
while continuing to run existing
electronic payment methods.
Cards
6
6
Wallets |
 F
F
I
I
N
N
A
A
N
N
C
C
I
I
A
A
L
L
R
R
E
E
S
S
U
U
L
L
T
T
S
S
A
A
N
N
D
D
G
G
U
U
I
I
D
D
A
A
N
N
C
C
E
E
7
7 |
 N
O
N
-
G
A
A
P
G
R
O
S
S
M
A
R
G
I
N
*
8
8
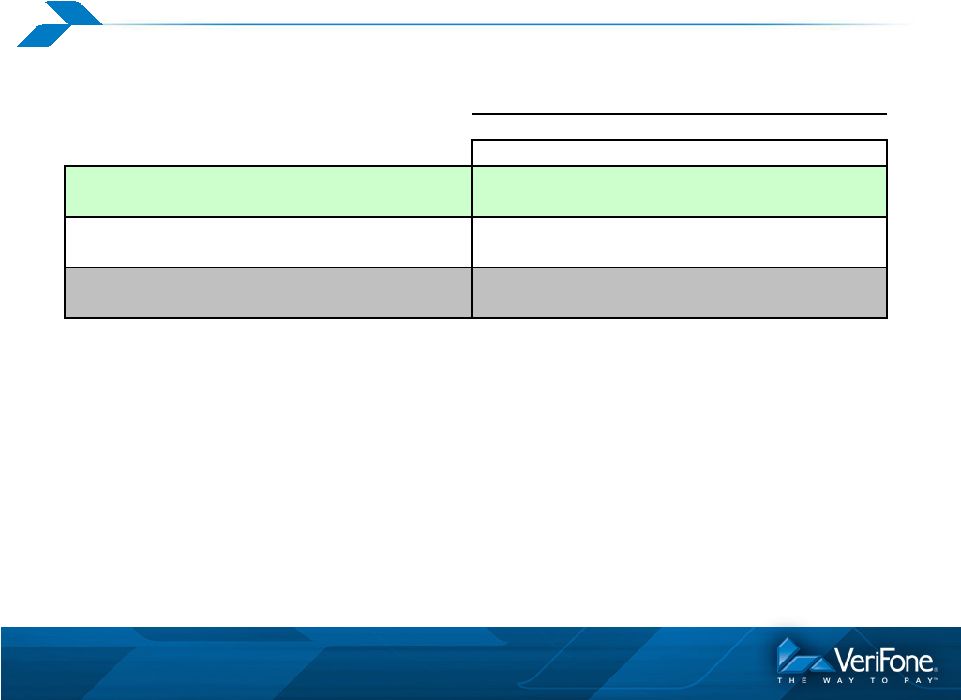
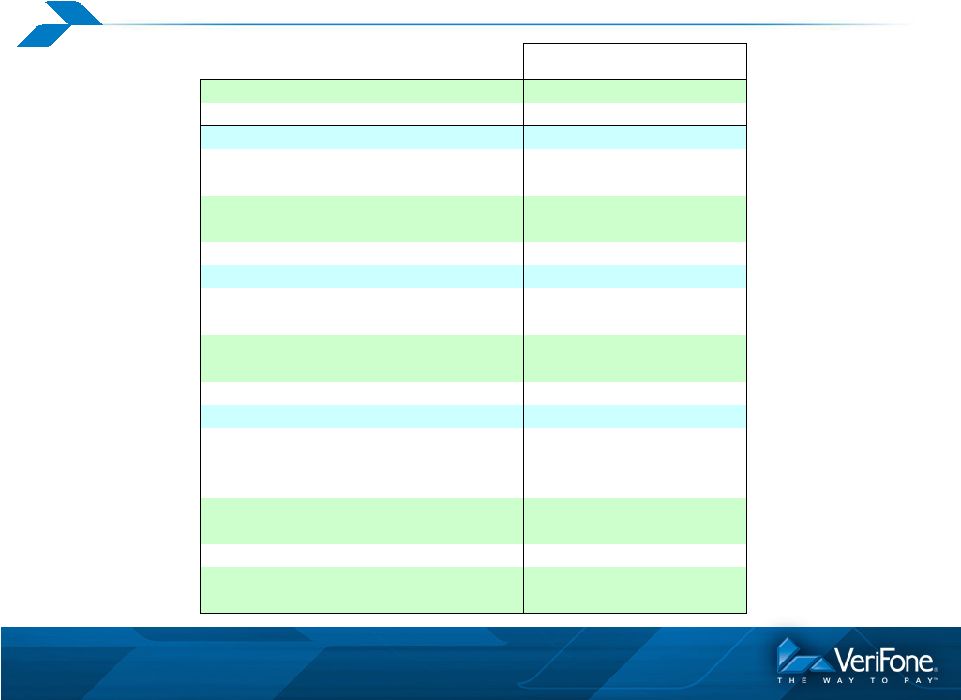
* A reconciliation of our GAAP to Non-GAAP gross margin can be found on slide
17 Q310
Q211
Q311
System Solutions
37.4%
43.2%
41.8%
Services
44.3%
44.5%
45.7%
Total
38.6%
43.4%
42.6%
% of Revenue |
 N
O
N
-
G
A
A
P
O
P
E
R
A
T
I
N
G
E
X
P
E
N
S
E
S
*
9
9
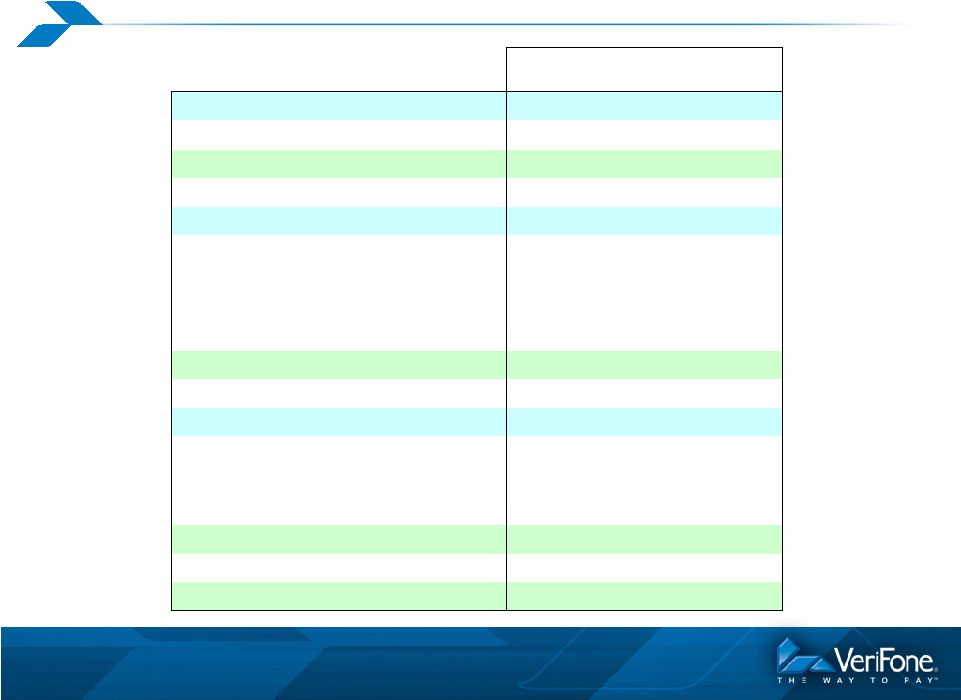
* A reconciliation of our GAAP to Non-GAAP operating expenses can be found on
slide 18 Q310
Q211
Q311
Research and Development
7.0%
8.4%
8.3%
Sales and Marketing
8.4%
9.4%
8.9%
G&A
6.9%
6.5%
6.2%
Total
22.3%
24.3%
23.4%
% of Revenue |
 C
A
S
H
F
L
O
W
A
N
D
B
A
L
A
N
C
E
S
H
E
E
T
10
10
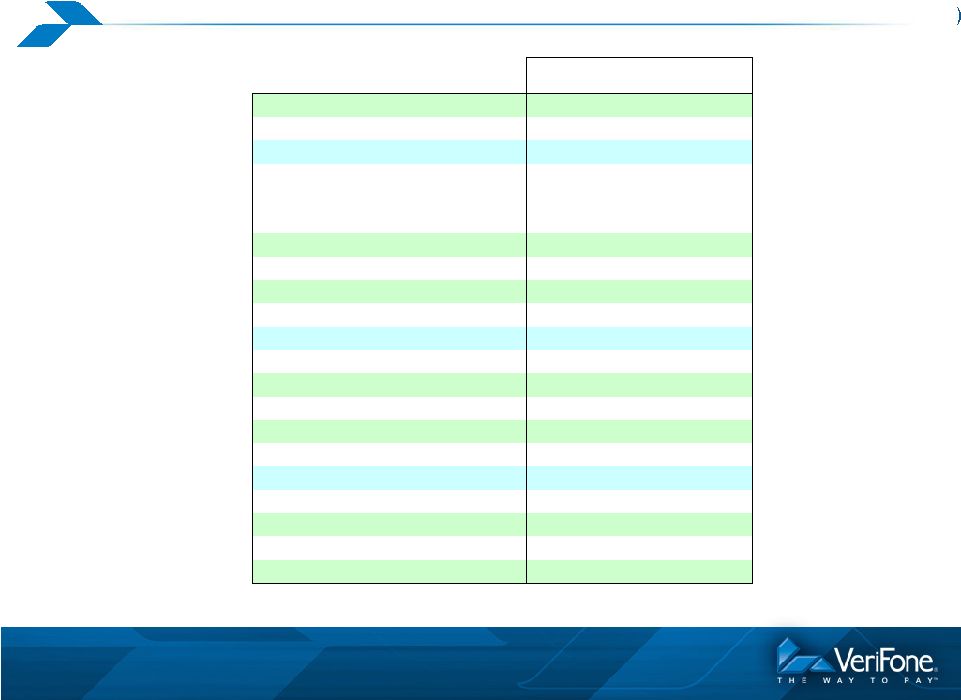
($ in thousands, except Days)
$
$
$
Cash Flow from Operations before
Changes in Working Capital
36,662
46,454
44,786
Cash Flow from Operations
25,994
38,422
52,823
Key Balance Sheet Items:
Cash
400,462
531,542
584,200
Accounts Receivables, net
137,705
49
208,373
66
221,028
65
Accounts Receivables Reserves
(4,671)
(5,333)
(5,450)
Inventories, net
111,415
62
106,411
59
109,861
54
Inventories Reserves
(22,332)
(28,270)
(28,434)
Accounts Payable
71,252
40
93,367
51
104,238
52
Deferred Revenue, net
71,981
82,232
84,538
Note: Accounts Receivable Days Sales Outstanding is
calculated based on Gross Accounts Receivable Net of Reserve for Product
Returns. Days in Inventory is calculated as Average Net Inventory divided by
Total Cost of Goods Sold. Days in Accounts Payable is calculated as Accounts
Payable divided by Total Cost of Goods Sold. Q311
Days
Q211
Days
Q310
Days |
 G
U
I
D
A
N
C
E
•
For the fourth quarter ending October 31, 2011, VeriFone expects
Non-GAAP net revenues to be between $395 million and $400
million. Non-GAAP net income per share is projected to be in the
range of $0.49 to $0.50.
•
For the full year of fiscal 2011, VeriFone expects Non-GAAP net
revenues to be between $1,289 million and $1,294 million.
Non-GAAP net income per share is projected to be in the range of
$1.88 to $1.89 for the same time period.
11
11 |
 Q
Q
&
&
A
A
S
S
E
E
S
S
S
S
I
I
O
O
N
N
12
12 |
 A
A
P
P
P
P
E
E
N
N
D
D
I
I
X
X
13
13 |
 R
E
C
O
N
C
I
L
I
A
T
I
O
N
O
F
G
A
A
P
T
O
N
O
N
-
G
A
A
P
P
R
O
F
I
T
&
L
O
S
S
(
P
A
G
E
1
)
14
14
($ in thousands, except Share Count and EPS)
Q310
Q211
Q311
GAAP Net Revenue
261,455
292,446
316,951
Amortization of step-down in Deferred revenue on
Acquisition
0
330
204
Non-GAAP Net Revenue
261,455
292,776
317,155
GAAP Gross Margin
95,495
122,585
131,612
Amortization of step-down in Deferred revenue on
Acquisition
0
330
204
Stock-based Compensation
312
392
433
Acquisition Related and Restructuring Costs
74
719
101
Amortization of Purchased Intangible Assets
5,124
3,165
2,687
Non-GAAP Gross Margin
101,005
127,191
135,037
GAAP Operating Expense
67,904
85,247
90,863
Stock-based Compensation
(5,150)
(8,924)
(7,917)
Acquisition Related and Restructuring Costs
(912)
(3,624)
(6,645)
Amortization of Purchased Intangible Assets
(3,544)
(1,665)
(1,980)
Non-GAAP Operating Expense
58,298
71,034
74,321
Non-GAAP Operating Profit
42,707
56,157
60,716 |
 R
E
C
O
N
C
I
L
I
A
T
I
O
N
O
F
G
A
A
P
T
O
N
O
N
-
G
A
A
P
P
R
O
F
I
T
&
L
O
S
S
(
P
A
G
E
2
15
15
($ in thousands, except Share Count and EPS)
Q310
Q211
Q311
Non-GAAP Operating Profit (from page 1)
42,707
56,157
60,716
GAAP Net Interest and Other
(5,657)
(9,052)
(1,330)
Acquisition Related Costs and Interest Charges
(823)
2,763
(574)
Non-Cash Interest Expense
3,677
3,762
3,961
Non-Operating Gains
0
0
(5,196)
Non-GAAP Net Interest and Other
(2,803)
(2,527)
(3,139)
Non-GAAP Pre-tax Profit
39,904
53,630
57,577
GAAP Provision for (Benefit from) Income Taxes
3,396
3,086
13,072
Income Tax Effect of Non-GAAP Exclusions
4,586
7,640
(1,557)
Non-GAAP Provision for Income Taxes
7,982
10,726
11,515
Non-GAAP Net Income
31,922
42,904
46,062
GAAP Share count
87,671
93,434
93,322
Hedged Shares
0
(387)
(31)
Non-GAAP Share Count
87,671
93,047
93,291
Non-GAAP EPS
0.36
0.46
0.49 |
 R
E
C
O
N
C
I
L
I
A
T
I
O
N
O
F
G
A
A
P
T
O
N
O
N
-
G
A
A
P
R
E
V
E
N
U
E
16
16
($ in thousands)
Q310
Q211
Q311
GAAP Net Revenue: North America
123,211
120,734
121,807
Amortization of step-down in Deferred revenue on
Acquisition
0
(106)
29
Non-GAAP Net Revenue: North America
123,211
120,628
121,836
GAAP Net Revenue: Europe
62,120
93,263
97,032
Amortization of step-down in Deferred revenue on
Acquisition
0
434
174
Non-GAAP Net Revenue: Europe
62,120
93,697
97,206
GAAP Net Revenue: Latin America
52,806
56,217
64,961
Non-GAAP Net Revenue: Latin America
52,806
56,217
64,961
GAAP Net Revenue: Asia
23,318
22,232
33,151
Amortization of step-down in Deferred revenue on
Acquisition
0
2
1
Non-GAAP Net Revenue: Asia
23,318
22,234
33,152
GAAP Net Revenue
261,455
292,446
316,951
Amortization of step-down in Deferred revenue on
Acquisition
0
330
204
Non-GAAP Net Revenue
261,455
292,776
317,155 |
 R
E
C
O
N
C
I
L
I
A
T
I
O
N
O
F
G
A
A
P
T
O
N
O
N
-
G
A
A
P
G
R
O
S
S
M
A
R
G
I
N
17
17
($ in thousands, except Gross Margin Percentage)
Q310
Q211
Q311
GAAP Gross Margin -
System Solutions
74,761
97,738
103,038
Stock-based Compensation
307
351
380
Acquisition Related and Restructuring Costs
76
586
134
Amortization of Purchased Intangible Assets
4,455
2,937
2,483
Non-GAAP
Gross
Margin
-
System
Solutions
79,599
101,612
106,035
Non-GAAP
Gross
Margin
%
-
System
Solutions
37.4%
43.2%
41.8%
GAAP
Gross
Margin
-
Services
20,734
24,847
28,574
Amortization
of
step-down
in
Deferred
revenue
on
Acquisition
0
330
204
Stock-based Compensation
5
41
53
Acquisition Related and Restructuring Costs
(2)
133
(33)
Amortization of Purchased Intangible Assets
669
228
204
Non-GAAP
Gross
Margin
-
Services
21,406
25,579
29,002
Non-GAAP
Gross
Margin
%
-
Services
44.3%
44.5%
45.7%
Total Non-GAAP Gross Margin
101,005
127,191
135,037
Total Non-GAAP Gross Margin %
38.6%
43.4%
42.6% |
 R
E
C
O
N
C
I
L
I
A
T
I
O
N
O
F
G
A
A
P
T
O
N
O
N
-
G
A
A
P
O
P
E
R
A
T
I
N
G
E
X
P
E
N
S
E
S
18
18
($ in thousands, except Percentage)
Q310
Q211
Q311
Non-GAAP Net Revenue
261,455
292,776
317,155
GAAP R&D
18,888
25,402
27,457
Stock-based Compensation
(659)
(939)
(1,001)
Acquisition Related and Restructuring Costs
10
(7)
(12)
Non-GAAP R&D
18,239
24,456
26,444
Non-GAAP R&D as % of Revenue
7.0%
8.4%
8.3%
GAAP S&M
24,145
31,139
32,769
Stock-based Compensation
(2,201)
(3,550)
(3,330)
Acquisition Related and Restructuring Costs
(10)
(93)
(1,096)
Non-GAAP S&M: % of Revenue
21,934
27,496
28,343
Non-GAAP S&M as % of Revenue
8.4%
9.4%
8.9%
GAAP G&A
24,871
28,706
30,637
Stock-based Compensation
(2,290)
(4,435)
(3,586)
Acquisition Related and Restructuring Costs
(912)
(3,524)
(5,537)
Amortization of Purchased Intangible Assets
(3,544)
(1,665)
(1,980)
Non-GAAP G&A
18,125
19,082
19,534
Non-GAAP G&A as % of Revenue
6.9%
6.5%
6.2%
Total Non-GAAP Operating Expenses
58,298
71,034
74,321
Total Non-GAAP Operating Expenses as % of Revenue
22.3%
24.3%
23.4% |
 Financial Results for the Quarter
Ended July 31, 2011
19
19 |