Attached files
| file | filename |
|---|---|
| EX-31.1 - EXHIBIT 31.1 - VERIFONE SYSTEMS, INC. | pay10k103115ex311.htm |
| EX-31.2 - EXHIBIT 31.2 - VERIFONE SYSTEMS, INC. | pay10k103115ex312.htm |
| EX-21.1 - EXHIBIT 21.1 - VERIFONE SYSTEMS, INC. | pay10k103115ex211.htm |
| EX-32.1 - EXHIBIT 32.1 - VERIFONE SYSTEMS, INC. | pay10k103115ex321.htm |
| EX-23.1 - EXHIBIT 23.1 - VERIFONE SYSTEMS, INC. | pay10k103115ex231.htm |
| EX-10.25 - EXHIBIT 10.25 - VERIFONE SYSTEMS, INC. | verifone_directorxdeferred.htm |
| XML - IDEA: XBRL DOCUMENT - VERIFONE SYSTEMS, INC. | R9999.htm |
UNITED STATES
SECURITIES AND EXCHANGE COMMISSION
Washington, D.C. 20549
___________________________________________________
Form 10-K
___________________________________________________
(Mark One)
þ | ANNUAL REPORT PURSUANT TO SECTION 13 OR 15(d) OF THE SECURITIES EXCHANGE ACT OF 1934 |
For the fiscal year ended October 31, 2015 | |
OR
¨ | TRANSITION REPORT PURSUANT TO SECTION 13 OR 15(d) OF THE SECURITIES EXCHANGE ACT OF 1934 |
For the transition period from to | |
Commission file number 001-32465
____________________________________________________
VERIFONE SYSTEMS, INC.
(Exact name of Registrant as Specified in its Charter)
____________________________________________________
DELAWARE | 04-3692546 | |
(State or Other Jurisdiction of Incorporation or Organization) | (I.R.S. Employer Identification No.) | |
88 West Plumeria Drive, | 95134 | |
San Jose, CA (Address of Principal Executive Offices) | (Zip Code) | |
(408) 232-7800 | ||
(Registrant’s Telephone Number, Including Area Code) | ||
____________________________________________________
Securities registered pursuant to Section 12(b) of the Act:
Title of Each Class | Name of Each Exchange on Which Registered | |
Common Stock, $0.01 par value | New York Stock Exchange | |
Securities registered pursuant to Section 12(g) of the Act:
None.
_________________________
Indicate by check mark if the registrant is a well-known seasoned issuer, as defined in Rule 405 of the Securities Act.
Act. Yes þ No ¨
Indicate by check mark if the registrant is not required to file reports pursuant to Section 13 or Section 15(d) of the Act.
Act. Yes ¨ No þ
Indicate by check mark whether the registrant (1) has filed all reports required to be filed by Section 13 or 15(d) of the Securities Exchange Act of 1934 during the preceding 12 months (or for such shorter period that the registrant was required to file such reports), and (2) has been subject to such filing requirements for the past 90 days. Yes þ No ¨
Indicate by check mark whether the registrant has submitted electronically and posted on its corporate Web site, if any, every Interactive Data File required to be submitted and posted pursuant to Rule 405 of Regulation S-T (§232.405 of this chapter) during the preceding 12 months (or for such shorter period that the registrant was required to submit and post such files). Yes þ No ¨
Indicate by check mark if disclosure of delinquent filers pursuant to Item 405 of Regulation S-K is not contained herein, and will not be contained, to the best of registrant’s knowledge, in definitive proxy or information statements incorporated by reference in Part III of this Form 10-K, or any amendment to this Form 10-K. þ
Indicate by check mark whether the registrant is a large accelerated filer, an accelerated filer, a non-accelerated filer, or a smaller reporting company. See the definitions of “large accelerated filer,” “accelerated filer” and “smaller reporting company” in Rule 12b-2 of the Exchange Act. (Check one):
Large accelerated filer þ | Accelerated filer ¨ | Non-accelerated filer ¨ | Smaller reporting company ¨ | |||
(Do not check if a smaller reporting company) | ||||||
Indicate by check mark whether the registrant is a shell company (as defined in Rule 12b-2 of the Act). Yes ¨ No þ
As of April 30, 2015, the aggregate market value of the common stock of the registrant held by non-affiliates was approximately $2.62 billion based on the closing sale price as reported on the New York Stock Exchange.
The number of shares outstanding of each of the issuer's classes of common stock, as of the close of business on November 30, 2015:
Class | Number of shares | ||||
Common Stock, $0.01 par value per share | 111,706,821 | ||||
DOCUMENTS INCORPORATED BY REFERENCE
As noted herein, the information called for by Part III is incorporated by reference to specified portions of the Registrant's definitive proxy statement to be filed in conjunction with the Registrant's 2016 Annual Meeting of Stockholders, which is expected to be filed not later than 120 days after the Registrant's fiscal year ended October 31, 2015.
VERIFONE SYSTEMS, INC.
2015 ANNUAL REPORT ON FORM 10-K
INDEX
PART I. | ||
Item 1. | ||
Item 1A. | ||
Item 1B. | ||
Item 2. | ||
Item 3. | ||
Item 4. | ||
PART II. | ||
Item 5. | ||
Item 6. | ||
Item 7. | ||
Item 7A. | ||
Item 8. | ||
Item 9. | ||
Item 9A. | ||
Item 9B. | ||
PART III. | ||
Item 10. | ||
Item 11. | ||
Item 12. | ||
Item 13. | ||
Item 14. | ||
PART IV. | ||
Item 15. | ||
2
FORWARD LOOKING STATEMENTS
This Annual Report on Form 10-K and certain information incorporated by reference herein contain forward-looking statements within the meaning of the Private Securities Litigation Reform Act of 1995, Section 27A of the Securities Act of 1933, and Section 21E of the Securities Exchange Act of 1934. Many of the forward-looking statements are located in “Management’s Discussion and Analysis of Financial Condition and Results of Operations.” Forward-looking statements relate to future events or our future financial performance based on certain assumptions. In some cases, you can identify forward-looking statements by words such as “may,” “should,” “expect,” “plan,” “intend,” “anticipate,” “believe,” “estimate,” “predict,” “potential,” or “continue,” the negative of such terms, or comparable terminology. Actual events or results may differ materially from those expressed or implied in these forward-looking statements.
Forward-looking statements are not guarantees of future results, events, levels of activity, performance, or achievements. Moreover, neither we nor any other person assumes responsibility for the accuracy and completeness of the forward-looking statements. These statements involve known and unknown risks, uncertainties, and other factors that may cause our actual results, levels of activity, performance, or achievements to be materially different from any future results, levels of activity, performance, or achievements expressed or implied by these forward-looking statements. In evaluating these statements, you should specifically consider various factors, including the risks outlined in Item 1A, Risk Factors, in this Annual Report on Form 10-K, and elsewhere in this report, including our disclosures of Critical Accounting Policies and Estimates in Item 7, our disclosures in Item 7A, Quantitative and Qualitative Disclosures About Market Risk, as well as in our Consolidated Financial Statements and related notes. We are under no duty to update any of the forward-looking statements after the date of this Annual Report on Form 10-K to conform such statements to actual results or to changes in expectations. We assume no obligation to revise or update any forward-looking statements for any reason, except as required by law.
In this Annual Report on Form 10-K, each of the terms “Verifone,” “Company,” “us,” “we,” and “our” refers to VeriFone Systems, Inc. and its consolidated subsidiaries.
3
PART I
ITEM 1. | BUSINESS |
Our Company
VeriFone is a global leader in secure electronic payment solutions at the point of sale (“POS”). For over 30 years, we have designed, manufactured, marketed and supplied a broad range of innovative payment solutions and complementary services that enable secure electronic payment transactions and value-added services at the POS. Our solutions and services enable merchants to address their payment acceptance complexities, enrich the interaction between merchant and consumers, and increase merchant revenues.
Key industries in which we operate include financial services, retail, petroleum, restaurant, hospitality, taxi, transportation, and healthcare.
VeriFone, Inc., our principal operating subsidiary, was incorporated in 1981. Shortly afterward, we introduced the first check verification and credit authorization device utilized by merchants in a commercial setting. In 1984, we introduced the first mass market electronic payment system intended to replace manual credit card authorization devices for small merchants. VeriFone, Inc. operated as a publicly-traded company from 1990 until it was acquired in 1997 by Hewlett-Packard, which operated it as a division. In July 2001, HP sold VeriFone, Inc. to Gores Technology Group, LLC, a privately held acquisition and investment management firm. In July 2002, VeriFone, Inc. was recapitalized and VeriFone Systems, Inc. (formerly known as VeriFone Holdings, Inc.), a Delaware corporation, was organized as a holding company for VeriFone, Inc. In connection with the recapitalization, certain investment funds affiliated with GTCR Golder Rauner, LLC, a private equity firm, became our majority stockholders. VeriFone completed its initial public offering on May 4, 2005. In June 2009, the GTCR-affiliated funds ceased to be beneficial owners of 5% or more of our outstanding common stock.
Our business has grown through both organic growth and strategic acquisitions. In August 2011, we acquired the non-U.S. business of Hypercom Corporation ("Hypercom"), a provider of electronic payment solutions and value-added services at the POS, which expanded our geographic reach and business for our EMEA and Asia-Pacific segments (as defined below). In December 2011, we acquired Electronic Transaction Group Nordic Holding AB ("ETG"), a Swedish company operating the Point International business ("Point"), which was previously one of our distributors, which expanded our presence primarily in the Nordics and augmented our EMEA services business. Other acquisitions in recent years include our December 2010 acquisition of certain assets and liabilities of Gemalto N.V.'s e-payment terminals and systems business unit with operations in South Africa, India and parts of the Middle East as well as certain vertical markets; our June 2011 acquisition of Destiny Electronic Commerce (Proprietary) Limited (which traded as CSC), our South Africa-based distributor, whose business included value-added services and end-to-end estate management services and tools for Sub-Saharan Africa and the Indian Ocean Islands; and our May 2013 acquisition of EFTPOS New Zealand Limited, which holds the switching and terminal business of ANZ Bank New Zealand Limited, and April 2013 acquisition of Sektor Payments Limited, which was our main distributor in New Zealand. In addition, we completed a number of smaller acquisitions over the past several years targeting complementary products, services and technologies.
We are headquartered in San Jose, California and operate in more than 150 countries worldwide, with a direct presence in approximately 40 countries.
Our Business Strategy
We seek to provide innovative payment and payment-enabled solutions and services to facilitate trade and commerce on a worldwide basis. Our solutions and services offerings are trusted by clients globally to enhance payment security and regulatory and industry standards compliance, facilitate terminal management and enable consumer interactions at the point of sale in both developed and emerging markets throughout the world. We have one of the leading electronic payment solutions brands and are one of the largest providers of electronic payment solutions worldwide.
4
We are committed to designing reliable and secure payment terminal solutions that incorporate leading edge technology to meet client needs. Our terminal solutions provide flexibility to support a wide range of client deployment and connectivity preferences and payment types. Our solutions enable payment and commerce in a variety of environments, including traditional multilane and countertop implementations, self-service or unattended environments, in-vehicle and portable deployments, as well as for mobile commerce. We also seek to connect our terminal solutions back to our network, so we can leverage a connected network of terminals in order to offer customers additional value added services.
Services are an increasingly important part of our business strategy. We offer a wide portfolio of services, ranging from traditional terminal related support services, Payment-as-a-Service solutions and commerce enablement offerings that are complementary to our payment solutions and designed to facilitate commerce opportunities for merchants. Our traditional services include professional services related to installation and deployment, helpdesk support, training, equipment repair and maintenance, and software post-contract support. Our Payment-as-a-Service solutions offer clients terminal management services and gateway solutions that enable more efficient routing of transactions, multi-channel acceptance and processing, and payment value-added services. We provide flexibility in deployment options, allowing our solutions to accommodate varying client needs. For example, in the U.S., our Payment-as-a-Service offering incorporates terminals with a simplified certification process, along with end-to-end encryption to reduce the complexity and costs of Payment Card Industry, or PCI, standards compliance. Continued innovation and expansion of our Payment-as-a-Service solutions are important elements of our strategy. Increasingly, we deploy Payment-as-a-Service solutions for clients whose electronic payment devices are connected directly to our gateway, simplifying payment operations for merchants and providing additional payment-enabled functionality, such as advertising, couponing, loyalty programs and data analytics services.
Our commerce enablement solutions leverage our terminals and media platforms to engage consumers at the point of sale through value-added applications such as loyalty and couponing applications, targeted offers and real-time reward redemptions. Consumer engagement at the point of sale provides opportunities to increase brand awareness and potential for merchants to grow sales. For example, we partnered to launch an American Express award point redemption program for our in-taxi payment solutions. We are developing a commerce enablement platform that links smart terminals, digital media screens, and technology gateways in order to provide our clients with integrated tools to enhance and enrich the commerce experience at the point of sale. We continue to invest in integrated media capabilities, such as our VNET media platform deployed at gas dispensers and in taxis and our PAYMedia/LiftRetail services for basket-level targeting of media content at convenience stores. These platforms leverage our secure payment terminals and solutions to help merchants increase consumer interaction at the point of sale.
We believe continued innovation in terminal solutions, strategic expansion of our Payment-as-a-Service solution in key markets, including both developed and emerging markets, and investment in our commerce enablement solutions are important components of our business strategy. We intend to focus on our Payment-as-a-Service solution as a key driver of growth in markets such as the Nordic countries and certain other parts of Europe, Australia and New Zealand, and the U.S. and Mexico, including emphasis on growing the number of devices connected to our gateways. Our strategy to expand our commerce enablement reach includes strategic investments that grow our network of digital media screens, including screens at the pump and inside the convenience store, as well as partnerships that enable us and our partners to offer our end merchant customers additional value added services beyond payment acceptance. For example, in August 2014, we entered into a global partnership with Gilbarco Veeder-Root, a leading global petroleum dispenser provider, which provided additional media screens that we are incorporating into our network. In connection with the partnership, we also acquired Outcast Media, Gilbarco's forecourt media business which provides media-enabled solutions at the pump.
5
Our Business Organization
We manage our business primarily on a geographic basis. Accordingly, we determined our operating segments, which are generally based on our geographic markets and client location, to be North America, Latin America, EMEA, and Asia-Pacific. The North America segment consists of our operations in the U.S. and Canada. The Latin America segment consists of our operations in South America, Central America, Mexico, and the Caribbean. The EMEA segment consists of our operations in Europe, Russia, the Middle East, and Africa. The Asia-Pacific segment consists of our operations in Australia, New Zealand, China, India, and throughout the rest of Greater Asia, including other Asia-Pacific Rim countries. For segment and geographic information, see Item 7, Management’s Discussion and Analysis of Financial Condition and Results of Operations - Segment Results of Operations, and Note 13, Segment and Geographic Information, in the Notes to Consolidated Financial Statements of this Annual Report on Form 10-K.
Our Industry Trends
The electronic payment solutions industry encompasses systems, software, and services that enable the acceptance and processing of electronic payments for goods and services, enable commerce and provide other value-added functionality at the POS. The electronic payment system is an important part of the payment processing infrastructure, serving as the interface between consumers and merchants at the POS, as well as the link between the consumer transaction at the POS and the payment transaction processing infrastructure.
The global payments industry has continued to move towards electronic payment transactions. Consumer habits have continued to shift to higher volumes of non-cash transactions with demand for additional payment options. In developed markets, such as the U.S., the continued shift to electronic payments is characterized by an increasing volume of transactions, including an increase in volume of low value card transactions, through multiple payment forms. Our industry continues to move toward advanced payment technologies and methods, and has also seen the emergence of new market entrants, including outside the traditional POS providers. Certain regions, such as parts of Eastern Europe, Latin America, and Asia, currently have relatively low rates of electronic payments, but are experiencing a growing number of such transactions. The adoption of electronic payments in emerging markets is driven primarily by economic growth, infrastructure development, expanding presence of Internet connectivity and support from governments seeking to modernize their economies and to encourage electronic payment transactions as a means of driving commerce and improving tax collection. In some emerging markets, the trend toward non-cash transactions is driving the need for innovative solutions to address access barriers to large populations of consumers who are not using or able to use the banking and financial systems.
Security continues to be a driving factor in our industry. Payment transaction security will need to become increasingly more sophisticated as security threats become more sophisticated, as new payment methods, especially mobile payments, are introduced, and as payment transaction volumes increase. Further, new payment types and platforms make payment transactions more operationally complex and thus exacerbate security concerns and increase the need for security solutions. In the last few years, a number of U.S. retailers and banks have reported customer or client data breaches and other fraudulent activities, which have heightened awareness of data security and increased demand for security solutions in payments systems, including accelerating the adoption by several large retailers of EMV, a Europay, MasterCard and Visa chip based card acceptance payment method (“EMV”), which has already become the payment standard in other countries. In addition to offering products that are independently certified to meet security standards, we provide secure commerce architecture as well as transaction encryption and tokenization services to facilitate an end-to-end security solution for payments. Our security solutions must continue to evolve to meet changing needs and threats.
6
We anticipate that the industry will see growing demand for mobile and portable point of sale solutions. In recent years, the increased use of wireless Internet connectivity driven by expanded network coverage, faster communication speeds and reduced costs has driven demand for compact, easy-to-use, and reliable mobile point of sale, or mPOS, payment solutions. We expect rising demand for mPOS devices including increasing utilization of smartphones and tablets based on the Apple iOS, Google Android, and Microsoft Windows operating systems to conduct payment transactions and to enable new mobile retailing solutions for merchants. Wireless portable devices and mobile devices, such as smartphones and tablets, are also increasingly being used as multi-purpose hardware and integrated software platforms that are being adopted for commerce, payments, and complementary applications, and tablet-based POS systems are becoming more common as all-in-one merchant management systems.
Portable and mobile devices may have shorter technology refresh cycles than traditional electronic payment devices. In particular, major telecommunications carriers around the world are phasing out their 2G/GPRS networks in favor of faster and more advanced technologies, such as 3G or later-generation networks.
We expect continued advancement in payment technologies driven by demand for payment solutions that accommodate different payment methods, such as EMV and near field communications, or NFC, and across multiple channels while maintaining a consistent consumer experience. The payments industry has seen the continued advancement in technologies, with the emergence of new payment methods, such as contactless, NFC, and mobile cloud-based payments, including card not present options. In the U.S., we have seen acceleration in adoption of EMV by larger retailers. We believe that security concerns driven by a number of recent high-profile security breaches at major retailers and banks, as well as the EMV liability shift which pushes card fraud liability to the merchant, will continue to drive demand for EMV solutions in the U.S. The release of Apple Pay in the U.S., whereby consumers are able to use their smartphones to make payments by tapping their phones on POS terminal, such as ours, has increased visibility into NFC which may spur more adoption of NFC, particularly as NFC transactions are considered EMV compliant. We are also working with PayPal and Samsung to increase the acceptance of their digital wallets at large retailers across the U.S. through our NFC-enabled devices.
Overall, merchants are striving to enrich the consumer experience and to accommodate consumer expectations for payment flexibility by offering a variety of payment options and other value-added services at the POS. Merchants increasingly seek more sophisticated tools integrated with payment systems that enable a consistent and seamless experience for consumers across multiple delivery channels, both online and offline. We expect this trend to create a need for a single platform that can support different payment options and delivery channels, and that is offered on a managed service basis to reduce risk and time to market. With the continued emergence of new and innovative technologies, our markets have become increasingly complex, which has in turn driven increasing interest in merchants to outsource managed services solutions such as terminal estate management, gateway transaction services, and payment systems implementation and management.
We expect merchants to increasingly seek to have rich and dynamic interactions with consumers. In addition to enabling multi-payment acceptance options for consumers, customized relevant content at the POS, such as promotions, offers, coupons, merchandise suggestions and loyalty programs, offer a means to enrich the consumer experience, particularly in retail and hospitality environments. The time between the initiation and completion of a transaction on a media-enabled payment solution provides merchants the opportunity to engage with consumers. Furthermore, incorporation of emerging technologies, such as Bluetooth low energy, or BLE, and beacons into payment solutions provides consumers with a more personalized experience, while merchants benefit from enhanced ways to engage customers in the store and to streamline the consumer shopping experience across channels.
7
We expect clients in more price sensitive markets to expect more options for lower cost payments solutions. In more price sensitive markets, which tend to be high growth markets such as China and Brazil, more clients have sought lower cost payment solution options, in many cases including the flexibility for the client to forgo certain features and enhancements but nevertheless have a leading edge payment solution. This trend has increased competition and pricing pressures in these markets as clients place less emphasis on branding and added features and enhancements that may otherwise differentiate competing products, and rely primarily on pricing for purchase decisions. While pricing has become a key factor, clients nevertheless seek payment solutions with certain innovative technological features, such as contactless or portability options, and mobile payment solutions that leverage the connectivity of smartphones and tablets, and therefore solutions providers must continue to innovate to address specific market needs while maintaining lower costs.
We expect compliance requirements and regulatory mandates applicable to our industry will continue to expand. Compliance requirements include government regulations related to the prevention of identity theft, as well as operating regulation safeguards issued by the credit and debit card associations. The Payment Card Industry Security Standards Council (“PCI SSC”) oversees and unifies industry standards, known as PCI standards, to enhance payment card data security and serve as a framework for the safe handling of cardholder information. These standards continually evolve to become more stringent and increasingly dependent on complex measures to protect all payment related data. Compliance requirements and regulatory mandates continue to evolve to accommodate new payment types and related security concerns.
Our products and solutions generally must be certified against applicable payment industry requirements and mandates. The continual evolution of industry security standards drives recertification and replacement of electronic payment systems. In addition to meeting the PCI standards, additional governmental regulations over payment card data security may apply and require separate local certifications in certain non-U.S. countries, such as Australia, China, and Brazil. Certain other countries also have their own set of compliance and certification requirements for payment card data security, including Germany, the United Kingdom, and the Netherlands. Furthermore, in order for our products to be allowed to connect to payment networks, we must obtain certification of the relevant products and solutions with card associations, financial institutions, and payment processors and comply with local government and telecommunications regulations. Some of these certification processes may take up to twelve months to complete. See Item 1, Business-Industry Standards and Government Regulations, for a more detailed description of these standards and regulations.
Products and Services
Our System Solutions
Our system solutions consist of point of sale electronic payment devices that run our unique operating systems, security and encryption software, and certified payment software, and that are designed to suit our clients' needs in a variety of environments, including traditional multilane and countertop implementations, self-service and unattended environments, in-vehicle and portable deployments, as well as mobile commerce. Our system solutions can securely process a wide range of payment types including signature and PIN-based debit cards, credit cards, NFC/contactless/radio frequency identification cards, or RFID cards, smart cards, pre-paid gift and other stored-value cards, electronic bill payment, signature capture and electronic benefits transfer, or EBT. Our unique architecture enables multiple value-added applications, including third-party applications, such as gift card and loyalty card programs, healthcare insurance eligibility, and time and attendance tracking, and allows these services to reside on the same system without requiring recertification upon the addition of new applications. With our newest line of Verifone Engage payment solutions, we will be able to deliver richer media and more complex commerce enablement services on our payment terminals to our merchant clients.
8
Countertop and PIN pads
Designed with merchant and consumer needs in mind, our suite of countertop solutions incorporate compact design, easy installation and consumer-friendly features. Our countertop solutions accept a wide variety of payment options including contactless, NFC, mobile wallets, and EMV, and support a range of applications, such as pre-paid products, including gift cards and loyalty programs. We also supply secure PIN pads that support credit and debit card, EBT, EMV, and other PIN-based transactions, and include multiple connectivity options and NFC capability. Our countertop solutions support a wide range of certified applications that are either built into electronic payment systems or connect to electronic cash registers, or ECRs, and POS systems.
Multimedia
Our multimedia consumer facing POS devices, such as those offered under our MX solutions brand, are designed to allow merchants, particularly in the multi-lane retail environment, to engage in direct consumer interaction through customized multimedia content, in-store promotions, digital offers, and other value-added services using a POS device, to enrich the customer experience while enabling new merchant revenue opportunities. These products offer features that are important to servicing customers in a multi-lane retail environment, such as user-friendly interfaces, ECR compatibility, durable key pads and signature capture functionality. Our solutions also support these same features in self-service market segments such as taxis, parking lots/garages, ticketing machines, vending machines, gas pumps, self-checkouts, and quick service restaurants.
Portable and Mobile
Our portable payment devices consist of small, portable, handheld devices that enable merchants to accept electronic payments wherever wireless connectivity is available, and our mobile solutions offer secure mobile payment capabilities for all segments of the mobile point of sale, or mPOS, environment, from large retailers to small merchants, and include devices that attach to, and interface with, iOS, Android or Windows-based smartphones and tablets, enabling these devices to be used as a secure payment device by merchants. Increasingly, clients look for portable options whether to enable electronic payments in new environments or to augment traditional POS environments. Our portable and mobile devices are designed to meet these needs, offering PCI compliant solutions that securely accept a variety of payment types, and providing merchants with increased flexibility to enrich the overall consumer experience whether in or out of the traditional bricks and mortar store location. We expect that market demand for portable and mobile options will continue to grow, particularly in developing countries where wireless and mobile telecommunications networks are being deployed at a much faster rate than wireline networks. We have deployed our portable and mobile solutions in a number of merchant environments, including for retail, restaurant, hospitality, transportation, and delivery businesses where merchants and consumers desire portability but demand secure payment systems to reduce fraud and identity theft.
Petroleum
Our family of products for petroleum companies consists of integrated electronic payment systems that combine electronic payment processing, fuel dispensing, and ECR functions, as well as secure payment systems that integrate with leading petroleum pump controllers. These products, which include our Secure PumpPay devices and related software, are designed to meet the needs of petroleum company operations, where rapid consumer turnaround, easy pump control, and accurate record keeping are imperative. Our products allow our petroleum clients to manage fuel dispensing and control, and enable “pay at the pump” functionality, cashiering, store management, inventory management, and accounting for goods and services at the POS. In addition, our PAYmedia service enables digital content, including paid advertising and couponing, at the petroleum forecourt using our VNET media platform on the color screen of our Secure PumpPAY units. The enablement of media at the forecourt offers opportunities for merchants to further engage consumers at the point of sale and provides additional commerce opportunities for the retail operator.
9
Unattended and Self-Service
Our unattended and self-service payment solutions are designed to enable payment transactions in self-service, high-transaction volume environments, such as vending machines, on-street parking meters, petroleum pumps, ticketing machines and store kiosks, as well as public transportation environments, including buses and rail lines. Our public transportation solutions enable contactless and NFC-enabled fare payments, while other unattended and self-service solutions include versions to accept a range of payment options, including mobile wallets, magnetic stripe, EMV chipcard or NFC or other contactless payment schemes.
Network Access Solutions
Our network access solutions are designed and customized to support the unique requirements of the electronic payments industry by providing the networking hardware technology and communications infrastructure necessary to achieve connectivity within the POS environment. Our Integrated Enterprise Networks ("IENs") are designed to reduce operating costs, protect investments in current legacy networks and work on a wide range of standard network technologies and protocols. Our Intelligent Network Access Controller ("IntelliNAC") is an intelligent networking device that provides a wide range of digital and analog interfaces, line and data concentration, protocol conversion and transaction routing, among other features. IntelliNAC is offered with IntelliView, an enterprise-level solution that provides the networking tools needed to manage POS solutions, such as remote downloads, and centralizes network management for reporting and monitoring.
Our Services
We continue to invest in developing a broad portfolio of services complementary to our systems solutions and designed to meet a wide range of merchant and partner needs, including removing complexity from payments, increasing ease of use, adding value by enriching the consumer experience at the POS and helping our clients grow their businesses and strengthen their relationships with consumers. Services are an important part of our business and revenues, accounting for approximately 34.5% of our total net revenues in our fiscal year ended October 31, 2015. Our services offerings include our Payment-as-a-Service solutions, managed services and terminal management solutions, payment-enabled media, in-taxi payment solutions, security solutions, and other value-added services at the POS. We also offer a host of support services, including software development, installation and deployment, warranty, post-sale support, repairs, and training.
Payment-as-a-Service
Our Payment-as-a-Service payment system management solution is hosted and managed by us and offered as a subscription-based model that provides clients with the flexibility to outsource a select set of payment operation services and solutions to be managed by us. Our range of services and solutions includes terminal services such as terminal rental and related installation, deployment, on-site terminal servicing, and hardware repair services, as well as gateway services such as transaction routing, transaction acceptance processing, transaction reporting, remote device management, and payment value-added services using the client’s choice of processor. The solution serves as a platform for deployment of additional value-added programs. Further, the hosted service covers 24x7 support, encrypted transactions, integration of new payment methods, ongoing EMV maintenance, merchant support, and PCI compliance, with the aim of reducing operational complexity and costs for clients. Clients also have the option to enable processing of payment types across different channels of a merchant’s business, including credit and debit card payments, online payments for e-commerce applications and mobile platforms. Clients can select full service or other options that meet their immediate business needs, and adjust their subscription service packages to more advanced features and functions as their business grows or as the payment industry evolves. Currently, the Payment-as-a-Service model is implemented primarily in our EMEA segment and, to a lesser extent, in our Asia-Pacific, North America, and Latin America segments. We anticipate that outsourcing of payment operations may become more attractive to clients as payment complexity and cost of payment operations increase.
10
Managed Services and Terminal Management Solutions
In addition to our Payment-as-a-Service solution, we offer a range of other managed services to provide our clients with managed services tools that accommodate their business needs and plans. Our managed services include secure web-based transaction processing that is consolidated across payment types, cloud-based remote loading of supported devices with updates for base files and firmware, software and applications, and estate management, including remote key loading, capabilities to remotely activate contactless, NFC and EMV payment methods, and consolidated reporting and analytics. PAYware Connect, our cloud-based hosted payment solution, consolidates all payment transactions through our payment gateway and enables merchants to process from any internet-connected PC through a single portal. PAYware Connect uses our proprietary VeriShield Total Protect for end-to-end transaction encryption and tokenization and is certified by all of the major payment processing networks. Our VX Direct managed solution combines our VX device with the latest payment applications, automatic updates, security protection with VeriShield Total Protect, and estate management capabilities. Our terminal management solution, VHQ, enables efficient management of an entire estate of devices with minimal on-site intervention, and is targeted to retailers, financial institutions, processors with helpdesk operations, and device maintenance companies. VHQ, which is available for a variety of environments, including retail, healthcare, transit, quick service restaurants and financial services, connects the devices within a merchant's estate to back office operations, enabling remote deployment of software to POS terminals, centralized estate tracking, monitoring and diagnostics, and consolidated information collection and management reports. Our limo, livery, and taxi fleet management solution provides tools for fleets installed with our POS devices, including real-time vehicle and trip/fare activity monitoring, computerized dispatch, vehicle tracking and faster card processing.
These managed solutions are offered globally to retailers, acquirers and merchants in the restaurant and hospitality markets who can host the solution on their own servers, but are also available as part of a total payments solution hosted by us.
Payment-Enabled Media
Our payment-enabled media solutions seek to leverage customer engagement at the POS, in taxis, at petroleum dispensers, and in petroleum convenience stores. Our PAYmedia solution is a media content management tool that enables delivery of digital media, including media content of interest to customers, relevant advertisement, and promotions and merchant loyalty programs, through our media-enabled POS devices. PAYmedia has been implemented on our MX devices, including in taxis, in conjunction with our Secure PumpPay devices in petroleum dispensers, and through our LiftRetail platform connected to a merchant’s ECR. In addition to delivery of special offers and couponing, our LiftRetail platform is an interactive platform that accommodates loyalty program enrollment and touch screen capabilities so that a customer can immediately scan additional merchandise for purchase. Production, management and delivery of media content can be managed by merchants or outsourced to us.
In conjunction with our in-taxi payment and Secure PumpPay POS devices, we offer digital media content such as local news, weather, traffic, and public service messages, as well as paid advertising, through our VNET media platform. Delivery of the media content may be targeted to a particular geographic location or time of day to optimize customer engagement. Certain of our taxi leasing arrangements for advertising cover the rights to place advertisement on taxi tops or elsewhere on a taxi such as on the trunk or with wraps on the exterior of the taxi. For our VNET platform and other media content on taxis, we typically are engaged by advertisers through ad agencies for display of their advertisements, and we generally do not create or design third-party media content.
In-Taxi Payment Solutions
We provide an integrated suite of hardware, software and services to the taxi industry to enable electronic payment of taxi fares. In-taxi equipment we provide includes our secure electronic payment devices, GPS navigation, wireless communications, and fleet management services. In addition to traditional payment methods, in October 2013, we launched a program in New York City that provides riders the option to pay their taxi fare with their American Express membership reward points. All payment transactions made through our in-taxi electronic payment devices are sent wirelessly through our secure payment gateway and we generally earn a per transaction service fee.
11
Our taxi payment solutions are currently deployed in multiple U.S. cities, including New York City, Philadelphia, Boston, Chicago, Las Vegas, Miami, Baltimore, Washington D.C., and Fort Lauderdale, as well as certain cities in Europe.
Security Solutions
Our security solutions offer clients tools to secure payment transaction data. We have expanded the implementation options of our Secure Commerce Architecture, which directs encrypted payment data from the terminal directly to the processor, thereby eliminating the transfer of payment data through the merchant POS system and simplifying the EMV certification burden. VeriShield Total Protect provides end-to-end encryption coupled with server-based tokenization to securely protect data from the point of capture, whether transmitted from a card or mobile device, to the processor, and tokenizes card data for use post-authorization to eliminate cardholder data from POS applications, networks and servers. In the U.S., the majority of the leading acquirers have selected our end-to-end encryption technology. VeriShield Remote Key enables merchants to remotely and securely manage key injection into PIN pad devices as needed, including as part of scheduled maintenance, in response to changing compliance standards, and in response to suspected security breaches. Our VeriShield Retain file authentication software is designed to secure a merchant’s terminal estate against unauthorized third parties executing software on the payment devices. Our VeriFone Secure Data solution allows applications with access to our secure reading and exchange of data compliant encryption library to enable point-to-point encryption capabilities.
Server-based Payment Processing Software and Middleware
Our server-based software allows merchants to integrate advanced payment functionality into PC-based and other retail systems seamlessly. These products handle the business logic steps related to an electronic payment transaction (credit, debit, gift, and loyalty), including collection of payment-related information from the consumer and merchant, and communication with payment processors for authorization and settlement. These solutions also enable the functionality of peripherals that connect to PC-based electronic payment systems, including consumer-facing products such as secure PIN pads and signature capture devices. Our PAYware software product line, consisting of server-based, enterprise payment software solutions, now includes card acceptance and merchant acquiring solutions, POS integration software, value-added payment solutions, and card management systems.
Support Services
We offer a suite of support services, including installation, deployment, standard or customized training, and application development and delivery solutions. We support our installed base by providing payment system 24-hour helpdesk support, consulting, training, repair and/or replacement, asset tracking, and reporting. We also offer customized service programs for specific vertical markets in addition to standardized service plans, per incident repair services and annual software maintenance on some of our licensed software products.
We offer professional services for customized application development and delivery solutions. We also provide specific project management services for turn-key application implementations. We also offer client education programs as well as consulting services regarding selection of product and payment methodologies and strategies such as debit implementation. We believe that our client services are distinguished by our ability to perform large-scale customizations for clients quickly and efficiently.
Our payment devices generally carry a standard one-year warranty. For repairs of defective devices covered by such warranties, we either repair or replace the devices at no charge to the client, except for certain shipping and related costs. For repairs of defective devices not covered by such warranty, we offer repair services in many countries or clients may use our authorized service centers to repair the device.
12
Libraries and Development Tools
We make a broad portfolio of application libraries and development tools available to our large community of internal and third-party application developers, including certain pre-certified software libraries that can be integrated into third-party applications without the need for further card brand certifications. We provide a set of application libraries, or programming modules such as smart card interfaces, contactless card and NFC phone interfaces, and communications drivers with defined programming interfaces that facilitate the implementation of our multi-application system solutions. Further, we maintain application compatibility, including use of standardized application programming interfaces, also known as APIs, and service calls, designed to facilitate the migration of applications to future system solutions.
We also provide developer tool kits that contain industry standard visual development environments (C/C++) along with platform-specific compilers and debuggers. We provide a broad range of support services for our application development communities, including developer training, a dedicated developers' support team, and VeriFone DevNet, an online developers' portal that provides registered developers access to libraries, tools, programming guides, and technical support. Our libraries, developer tool kits, training, and support systems facilitate the rapid growth in deployment of third-party, value-added applications for our system solutions.
We believe that this growing portfolio of value-added applications increases the attractiveness of our solutions to global financial institutions and payment processors by adding services beyond payment transaction processing. We seek to encourage innovation on our terminal platform and intend to encourage continued development of applications for our system solutions.
Customers
Globally, our clients consist primarily of financial institutions, payment processors, large retailers, petroleum companies, transportation companies, government organizations, healthcare companies and quick service restaurants. In our North America and EMEA segments, we also sell our in-taxi payments solution to taxi fleets and advertising space to advertisers and media companies. We also sell directly to smaller merchants and retailers under our Payment-as-a-Service model, primarily in our EMEA segment. We also sell through third party partners, such as banks and acquirers, system integrators, and independent sales organizations, and channel partners that distribute and resell our products.
The percentage of net revenues from our ten largest clients is as follows:
Years Ended October 31 | ||||||||
2015 | 2014 | 2013 | ||||||
Percentage of net revenues from our ten largest clients | 20.2 | % | 22.7 | % | 21.8 | % | ||
Historically, we have experienced fluctuations of orders from clients based on the timing of client technology refresh cycles and/or client capital expenditure decisions, which typically drive larger volume orders. Timing of such cycles from larger clients, such as large retailers and processors could cause our net revenues and results of operations to vary from period to period. In addition, the timing of adoption of new technologies, such as EMV in the U.S., and timing of releases of regulatory and industry standards, such as PCI standards, as well as releases of new product introductions can significantly impact net revenues, cost of net revenues and operating expenses. Net revenues from both direct clients and our third-party distributors may decline pending an upcoming standards change or in anticipation of a standards change or new product introduction. However, neither historical patterns of net revenues nor timing of net revenues related to releases of new standards or products should be considered reliable indicators of our future net revenues, results of operations or financial performance.
13
Sales and Marketing
We sell our products worldwide through our direct sales force and through third-party distributors and partners. Internationally, we rely on distributors to represent us in countries or geographies where we do not have a direct presence. In recent years, we have expanded the number of countries where we have a direct presence, in part through our acquisitions. As we continue to focus on services, we expect a shift to more direct sales and support personnel.
Our sales personnel consist of sales representatives, business development personnel, sales engineers, and customer service representatives with specific vertical market expertise. Our sales teams are supported by client services, manufacturing, product development, and marketing teams to deliver products and services that meet the needs of our diverse client base. Our marketing personnel include product marketing personnel, account managers, program marketing personnel, and corporate communications and public relations personnel.
As of October 31, 2015, we had 1,045 sales and marketing employees, representing approximately 19.2% of our total workforce.
Competition
The markets for our System Solutions and Services are highly competitive. We compete based on various factors, including product functions and features, product availability and certifications, pricing, product quality and reliability, design innovation, interoperability with third-party systems, service offerings, support, and brand reputation. We continue to experience intense competition in all of our operating segments from traditional POS terminal providers for both systems solutions and services. In certain more price sensitive markets, typically high growth markets such as China and Brazil, we have seen some competitors introduce increasingly aggressive pricing for terminal solutions. We also see new companies entering our markets, including entrants offering some form of mobile-device based payment option. Some of our competitors may be more established, benefit from greater local recognition in particular countries, and have greater resources within those countries than we do. Finally, certain of our distributor partners may also offer similar services that we strive to offer to our end merchants.
Competition from manufacturers, distributors, or providers of products and services similar to or competitive with our System Solutions or Services could result in lower market share, price reductions, reduced margins, or could render our solutions obsolete. Some smaller local electronic payment terminal vendors, particularly in our Asia-Pacific and Latin America segments, have also introduced pricing pressures in their markets by offering substantially lower prices. In addition, a number of the financial institutions and payment processors to whom we market our products typically adopt a dual vendor approach for the supply of their POS terminals.
We expect to continue to experience significant competition in the future. We compete globally with suppliers, manufacturers, and distributors of electronic payment systems and services as well as suppliers of ECRs that provide built-in electronic payment capabilities and producers of software that facilitates electronic payments over the Internet. Our primary competitors in these markets for POS terminals and services include Ingenico S.A., PAX Technology, Ltd., Bambora Group, SZZT Electronics Co. Ltd., Equinox Payments, CyberNet Inc., and Spire Payments Ltd. We also compete with Gilbarco, Inc., International Business Machines Corporation, NCR Corporation, Oracle Corporation, and Wayne, A GE Energy Business. In addition, we face vigorous competition from smaller companies that have been able to develop strong local or regional customer bases.
As we focus on specialty services and increase our emphasis on mobile and full service solutions, as well as on small to medium sized enterprises, we face new competitors, including those who in the past targeted merchants that were not traditionally our clients or those who offer competing technologies, such as mobile-based payment dongles or electronic wallets. We believe these competitors are targeting merchants that are our clients.
14
Most of our clients are large, sophisticated organizations that have significant purchasing power and seek innovative solutions from trusted brands. We believe that we benefit from a number of competitive advantages gained through our more than 30-year history. These advantages include our globally trusted brand name, large installed base, significant involvement in the development of industry standards, security infrastructure, global operating scale, customizable platforms, and investment in research and development. Additionally, we compete primarily on the basis of the following additional key factors: end-to-end system solutions, industry leading security, product certifications, value-added applications and advanced product features, advanced communications modularity, reliability, supply chain scale and flexibility, and low total cost of ownership.
We expect competition in our industry will be largely driven by the requirements to respond to increasingly complex and evolving technology, industry certifications, and security standards and requirements, as well as market demands for innovative and flexible payment solution options. We also see the prospect of continued consolidation among suppliers of electronic payment systems as they seek inorganic ways to enhance their capability to carry out research and development and seek other efficiencies, such as in procurement and manufacturing. The rapid technological and other changes in the payments industry have led to increased competition from new technologies and competitors both within and outside our traditional industry.
Research and Development
Our R&D activities include design and development of our hardware products and unique operating systems, development of new solutions and applications, attaining applicable certifications and approvals required for our products and solutions, and ensuring compatibility and interoperability between our solutions and those of third parties. We work with our clients to develop system solutions that address existing and anticipated end-user needs. Our development activities are distributed globally and managed primarily from the U.S. Our regional application development centers provide customization and adaptation to meet the needs of clients in local markets.
During fiscal years 2014 and 2015, as part of our transformation initiatives, we developed plans to consolidate our global R&D sites for hardware and software development, and initiated standardization and consolidation efforts for our gateways, hardware platforms, and software application architecture.
As of October 31, 2015, we had 1,677 R&D employees, representing approximately 30.8% of our total workforce. For the total amounts of our R&D expenses for the fiscal years ended October 31, 2015, 2014, and 2013, see our Consolidated Statements of Operations of this Annual Report on Form 10-K.
Industry Standards and Government Regulations
In order to offer products that connect to payment networks, electronic payment system providers must certify their products and services with card associations, financial institutions, and payment processors, as well as comply with government and telecommunications company regulations.
The following are key standards and requirements that apply to our industry:
Security Standards
Industry and government security standards are implemented to ensure the integrity of the electronic payment process and protect the privacy of consumers using electronic payment systems. We design our product security architecture to meet the requirements of those countries that have the more stringent and specific security requirements, such as Australia, Brazil, Canada, Germany, the Netherlands, New Zealand, Singapore, Sweden, Switzerland, and the United Kingdom.
15
Card Association Standards
Payment Card Industry Security Standards. Formed in 2006, the PCI SSC develops standards and supporting materials that enhance payment card data security and serve as a framework for the safe handling of cardholder information. The following are the PCI SSC principal standards applicable to our industry:
• | PCI Data Security Standard (“PCI DSS”) provides a specifications framework for the payment card data security process, including prevention, detection, and appropriate reaction to security incidents. |
• | PIN Transaction Security (“PTS”) provides vendors and manufacturers with the requirements for all personal identification number ("PIN") terminals, including POS devices, encrypting PIN pads, and unattended payment terminals. |
• | Payment Application Data Security Standard (“PA-DSS”) provides a set of standards to help software vendors and others develop secure payment applications. |
• | Point-to-Point Encryption (“P2PE”) provides a set of requirements for vendors, assessors, and point-to-point encryption solution providers to validate their solutions. P2PE certified solutions may help a merchant reduce the scope of their PCI DSS assessments when using a validated P2PE solution for account data acceptance and processing. |
EMV Standards. EMV standards are intended to address the growing need for transaction security and interoperability, and are designed to ensure global smart card interoperability across all electronic payment systems. To ensure adherence to this standard, specific certifications are required for all electronic payment systems and their application software. We maintain EMV certifications across our applicable product lines. EMV has already been adopted in many countries outside the U.S., and the adoption of EMV in the U.S. commenced in 2015 and is expected to continue for next several years, in part as card associations seek to incentivize adoption of EMV.
Contactless and NFC System Standards. The major card associations have each established a brand around contactless payment, for example, PayPass for MasterCard, Visa payWave and Visa Wave for Visa, ExpressPay for American Express, ZIP for Discover Financial Services, and J/speedy for JCB. Each contactless payment brand has a complete set of specifications, certification requirements and a highly controlled testing and approval process. In addition to EMVCo standards, there are also regional specification and certification and other payment scheme requirements for contactless such as PBOC in China, CEPAS in Singapore, Interac Flash in Canada, Geldkarte in Germany, and Carte Bancaire in France.
MasterCard PTS and TQM Program. The MasterCard PTS program identifies and addresses stability and security of communications between Internet-enabled POS terminals and the acquirer host system using authentication/encryption protocols approved by MasterCard ensuring transaction data integrity. We have successfully achieved VX product-line compliance with the MasterCard PTS security specification regarding security of Internet connected payment systems. As of May 2010, the MasterCard PTS program was subsumed into a PCI SSC PTS 3.x program known as the Open Protocols module. The Open Protocols module addresses POS devices that are Internet, WIFI, or GPRS enabled to make sure they are secure. The MasterCard PTS program compliance applies to several of our Internet-enabled products including the VX Evolution series payment systems. The MasterCard TQM (Terminal Quality Management) program was created in 2003 to help ensure the quality and reliability of EMV compliant terminals worldwide. MasterCard's TQM program validates the entire life cycle of the product, from design to manufacturing and deployment, and is in addition to the EMV Level 1 certification. We maintain TQM approval across all EMV Level 1 approved products deployed with EMV applications. The TQM program is now extended to contactless payment systems and is a requirement for achieving a full PayPass approval with MasterCard.
16
Payment Processor/Financial Institution Requirements
U.S. payment processors have two types of certification levels: (1) Class B certification, which ensures that an electronic payment system adheres to the payment processor's basic functional and network requirements; and (2) Class A certification, which adds another stipulation that the processor actively supports the electronic payment system on its internal helpdesk systems. Attainment of Class A certification, which may take up to twelve months, requires working with each payment processor to pass extensive functional and end-user testing and to establish the help desk related infrastructure necessary to provide Class A support. Attaining Class A certifications increases the number of payment processors that may actively sell and deploy a particular electronic payment system.
Other Regulatory Authorities
Our products must comply with government regulations, including those imposed by the U.S. Federal Communications Commission (the "FCC") and similar telecommunications authorities worldwide regarding emissions, radiation, safety, and connections with telephone lines and radio networks. Our products must also comply with recommendations of quasi-regulatory authorities and of standards-setting committees. Our electronic payment systems have been certified as compliant with a large number of national requirements, including those of the FCC and Underwriters Laboratory in the U.S. and similar local requirements in other countries. In addition, wireless network service providers mandate certain standards and certifications applicable to connected devices and systems that operate on their networks. Our wireless electronic payment systems have been certified by certain leading wireless carrier networks around the world.
We are also subject to various other legal and regulatory requirements related to the manufacture and sale of our products, such as the U.S. regulations which require us to implement a management system to evaluate and report on the existence of conflict minerals originating in the Democratic Republic of the Congo in our supply chain, the European Union ("EU") directive that places restrictions on the use of hazardous substances ("RoHS" and "RoHS2") in electronic equipment, the EU directive on Waste Electrical and Electronic Equipment ("WEEE"), the EU's Registration, Evaluation, Authorization and Restriction of Chemicals (REACH), and the environmental regulations promulgated by China's Ministry of Information Industry ("China RoHS"). RoHS and RoHS2 set a framework for producers' obligations in relation to manufacturing (including the amounts of named hazardous substances contained in products sold) and WEEE sets a framework for treatment, labeling, recovery, and recycling of electronic products in the European Union. REACH imposes chemicals regulation and controls including requirements for registration of chemicals on the EU market.
Foreign Operations
For our fiscal years ended October 31, 2015 and 2014, our international net revenues accounted for 60.5% and 72.0%, respectively, of our total net revenues. Margins on our sales of products in foreign countries and on sales of our products generally, which include components sourced from foreign suppliers, can be adversely affected by foreign currency exchange rate fluctuations and by international trade regulations, including tariffs and other applicable duties. See “Foreign Currency Transaction Risk” under Item 7A, Quantitative and Qualitative Disclosures About Market Risk in this Annual Report on Form 10-K. In certain regions outside the U.S., we rely on third-party distributors to market and sell our products in accordance with our policies for promotional efforts and maintenance of adequate technical expertise with respect to our products, and with our requirements for compliance with applicable laws, including for example, trade regulations applicable to our products and anti-corruption laws. Although we generally have contractual relationships with these third parties, if such third parties do not comply with our requirements, we face potential liability, harm to our brand reputation, and disruptions to our business, which could have a material adverse effect on our results of operations.
17
We outsource our product manufacturing to various suppliers in the Electronic Manufacturing Services ("EMS") industry. Our primary EMS providers are located in China, Singapore, Malaysia, Brazil, Germany, and Romania. For several of our product lines, we directly ship from our EMS providers to our clients in various countries around the world. Substantially all of our products contain key components that are obtained from foreign sources. These concentrations in external and foreign sources of supply present risks of interruption for reasons beyond our control, including political and other uncertainties. See “Manufacturing Agreements” under Item 7, Management’s Discussion and Analysis of Financial Condition and Results of Operations, in this Annual Report on Form 10-K.
See also Item 1A, Risk Factors, in this Annual Report on Form 10-K for additional discussion about the risks that we face related to our foreign operations.
Proprietary Rights
We rely primarily on copyrights, trademarks, patent filings, and trade secret laws to establish and maintain our proprietary rights in our technology and products. We maintain a patent incentive program and patent committee, which encourages and rewards employees to present inventions for patent application and filings.
As of October 31, 2015, we held 350 patents and 88 patent applications filed with various patent offices in 44 jurisdictions throughout the world, including the U.S., Canada, the United Kingdom, the European Union, China, Israel, Italy, India, Australia, Japan, Germany, France, Ireland, Hong Kong, Taiwan, Brazil, and South Africa, among other countries. These patents and patent applications include utility patents, utility models and designs acquired in connection with our acquisitions. We believe that the duration of our patents is adequate relative to the expected lives of our products which generally are expected to be shorter than the terms of our patents due to continual technical innovations in our industry.
We use the VeriFone name and logo globally as an important part of the branding of our company and our products, and we register these trademarks in the key jurisdictions where we do business, including the U.S. and the EU. As of October 31, 2015, we held trademark registration in 23 jurisdictions (including registration in the European Union that covers a number of country level registrations we had previously filed) for the "VERIFONE" trademark and in 32 jurisdictions (including registration in the EU that covers a number of country level registrations we had previously filed) for the VERIFONE trademark including our ribbon logo. A new VERIFONE logo was filed in the U.S. and was recently published for Oppositions (on September 2015). We currently hold trademark registration in the U.S. and a variety of other countries for our product names and other marks.
We generally have not registered copyrights in our software and other written works. Instead, we have relied upon common law copyright, customer license agreements, and other forms of protection. We use non-disclosure agreements and license agreements to protect software and other written materials as copyrighted and/or trade secrets.
In the U.S. and other countries, prior to 2001, our predecessor held patents relating to a variety of POS technology and related inventions, which expire in accordance with the applicable law in the country where filed. In 2001, as part of the divestiture of VeriFone, Inc. from HP, VeriFone, Inc. and HP entered into a technology agreement whereby HP retained ownership of most of the patents owned or applied for by VeriFone prior to the date of divestiture. The technology agreement grants VeriFone a perpetual, non-exclusive license to use any of the patented technology retained by HP at no charge.
Employees
As of October 31, 2015, we had approximately 5,400 employees worldwide. We have collective bargaining agreements with our employees in France, Spain, Italy, Sweden, and Brazil. Our employees in France and Germany are represented by works councils that have the right to certain information and to participate in certain operational decisions affecting the represented employees, such as relocation of office facilities, compensation and benefits, and working hours. We have not experienced any work stoppages, and we believe that we have good employee relations and relationships with the collective bargaining groups and works councils.
18
Executive Officers
Our executive officers and their ages as of December 18, 2015 are as follows:
Name | Age | Position | ||
Alok Bhanot | 47 | Executive Vice President, Engineering & Chief Technology Officer | ||
Paul Galant | 47 | Chief Executive Officer | ||
Albert Liu | 43 | Executive Vice President, Corporate Development & General Counsel | ||
Glen Robson | 47 | Executive Vice President, Terminal Solutions | ||
Marc Rothman | 51 | Executive Vice President and Chief Financial Officer | ||
Alok Bhanot. Mr. Bhanot has served as our Executive Vice President, Engineering and Chief Technology Officer since December 2, 2013. Prior to joining VeriFone, from June 2013 to November 2013, Mr. Bhanot served as an advisor of Walmart Labs, a unit of Walmart Global e-Commerce, and, from February 2011 to June 2013, as the founder and Chief Executive Officer of Inkiru, Inc., a provider of business intelligence/analytics technology, before it was acquired by Walmart in June 2013. Prior to that, from July 2010 to January 2011, Mr. Bhanot served as the Chief Technology Officer for Rent The Runway, Inc., a company that sells and rents women’s fashion products online, and, from April 2009 to June 2010, Executive Vice President for Cooliris, Inc., a software developer of photo viewing applications. From May 2007 to March 2009, Mr. Bhanot served as Vice President, Risk Technology of PayPal and, from January 2006 to March 2009, Vice President, Corporate Architecture of eBay, Inc. Before joining eBay, Inc., from January 2000 to March 2002, Mr. Bhanot served as the Chief Technology Officer of Gradience, Inc., a market data analytics provider. Mr. Bhanot graduated from University of Roorkee (Indian Institute of Technology) with a Bachelor’s degree in Mechanical Engineering.
Paul Galant. Mr. Galant has served as our Chief Executive Office and a director since October 1, 2013. Prior to joining VeriFone, Mr. Galant served as the Chief Executive Officer of Citigroup Inc.'s Enterprise Payments business since 2010. In this role, Mr. Galant oversaw the design, marketing and implementation of global business-to-consumer and consumer-to-business digital payments solutions. From 2009, Mr. Galant served as Chief Executive Officer of Citi Cards, heading Citigroup's North American and International Credit Cards business. From 2007 to 2009, Mr. Galant served as Chief Executive Officer of Citi Transaction Services, a division of Citi's Institutional Clients Group. From 2002 to 2007, Mr. Galant was the Global Head of the Cash Management business, one of the largest processors of payments globally. Mr. Galant joined Citigroup, a multinational financial services corporation, in 2000. Prior to joining Citigroup, Mr. Galant held positions at Donaldson, Lufkin & Jenrette, Smith Barney, and Credit Suisse. Mr. Galant holds a Bachelor's degree from Cornell University where he graduated a Phillip Merrill Scholar.
Albert Liu. Mr. Liu serves as our Executive Vice President, Corporate Development and General Counsel. Mr. Liu joined VeriFone in October 2008, as Senior Vice President, General Counsel and Corporate Secretary, and was named Executive Vice President, Corporate Development in August 2011. In his capacity Mr. Liu also serves as Chief Compliance Officer. Prior to joining VeriFone, he was Vice President, Legal and Corporate Development, and Company Secretary for NETGEAR, Inc., a provider of networking solutions, since October 2004. Mr. Liu also previously served as General Counsel, Director of Human Resources and Secretary of Turnstone Systems, Inc., a supplier of digital subscriber line testing equipment and General Counsel and Secretary for Yipes Enterprise Services, a provider of Ethernet connectivity services. Mr. Liu began practicing law with the firm of Sullivan & Cromwell in New York, advising clients on all aspects of corporate and securities law, leading public and private securities offerings, and negotiating and finalizing venture capital investments and contracts. Before entering the legal field, he was a software engineer at Tandem Computers. He holds dual degrees in Computer Science and Political Science from Stanford University, and a J.D (magna cum laude) from the University of California, Hastings College of the Law. He is a member of the State Bar of California.
19
Glen Robson. Mr. Robson has served as our Executive Vice President, Terminal Solutions since January 2015. Prior to joining Verifone, Mr. Robson spent 10 years with Dell, Inc. leading its engineering organizations, has served as General Manager and Vice President for Dell's SMB and Consumer Product Group and most recently as Chief Technology Officer for Dell’s Client's Product Group. Prior to Dell, Mr. Robson held various engineering management positions at Sun Microsystems. Mr. Robson holds a Bachelor of Arts in Public Policy from the University of Northumbria and a Masters of Science in Computer Science from the University of Kent.
Marc E. Rothman. Mr. Rothman has served as our Executive Vice President and Chief Financial Officer since February 4, 2013. Prior to joining VeriFone, Mr. Rothman served as the Chief Financial Officer of Motorola Mobility, Inc., where he oversaw global financial strategy, financial analysis and reporting, regulatory financial compliance, restructuring activities, and mergers and acquisitions, including involvement in Motorola Mobility's spin-off transaction from its former parent company, Motorola, Inc., as well as the sale of the company to Google in May 2012. At Motorola, he also held a number of senior finance leadership positions across the company, including serving as chief financial officer in several of its business segments (Public Safety, Networks and Enterprise, and Mobile Devices). Mr. Rothman joined Motorola, Inc. through the acquisition of General Instrument in 2000, and at that time he was vice president and corporate controller. He began his career at Deloitte & Touche LLP. Mr. Rothman is a Certified Public Accountant (inactive) in the State of California and graduated from Richard Stockton College with a Bachelor's degree in Business.
Available Information
Our website is located at www.verifone.com. Our Annual Report on Form 10-K, Quarterly Reports on Form 10-Q, Current Reports on Form 8-K and any amendments to these reports filed or furnished pursuant to Section 13(a) or 15(d) of the Securities Exchange Act of 1934 are available free of charge on our website as soon as reasonably practicable after such reports are filed with or furnished to the Securities and Exchange Commission. The reports are also available on the SEC’s website at www.sec.gov. Information contained on our website is not incorporated into this Annual Report on Form 10-K, and any references to our website are intended to be inactive textual references only.
20
ITEM 1A. | RISK FACTORS |
The risks set forth below include risks related to our business and operations, market, economic and political conditions, our legal and regulatory environment, and our capital structure, and may adversely affect our business, financial condition, results of operations and cash flows. In addition to the risks set forth below and the factors affecting specific business operations identified with the description of these operations elsewhere in this report, there may also be risks of which we are currently not aware, or that we currently regard as immaterial based on the information available to us, that later prove to be or become material.
Risks Related to Our Business
If we do not continually enhance our existing solutions and develop and market new solutions and enhancements responsive to technological advancements and customer or end user demand in a timely manner or at all, our net revenues and income will be adversely affected.
The market for electronic payment systems is characterized by:
• | rapid technological advancements; |
• | frequent product introductions and enhancements; |
• | local certification requirements and product customizations; |
• | evolving industry and government performance and security standards and regulatory requirements; |
• | introductions of competitive products, including products that customers may perceive as having better functions and features, and alternative payment solutions, such as mobile payments and processing, at the POS; and |
• | rapidly changing customer and end user preferences or requirements. |
In addition, our competitors have been increasingly aggressive in introducing products and lowering prices. Because of these factors, we must continually enhance our existing solutions and develop and market new solutions, and we must anticipate and respond timely to these industry, customer and regulatory changes in order to remain competitive, all of which have become increasingly challenging as competition intensifies. If we cannot develop new solutions or enhancements to our existing solutions that satisfy customer or end user demand, or if our new solutions or enhancements do not meet local certification requirements or experience delays in the certification process or meet resistance from clients or merchants or are inhibited by third parties’ intellectual property rights, we will not be able to timely and adequately respond to competitive challenges and technological advancements, and our net revenues and results of operations will be adversely affected. These efforts require management attention and significant investment in research and development as well as increased costs of manufacturing and distributing our system solutions, and ultimately may not be successful. We may not necessarily be able to increase or maintain prices to account for these costs, which will negatively impact our profitability, cash flows and results of operations. Our business has been in the past and continues to be adversely affected by our failure to timely obtain local certifications in some markets for certain of our products.
We cannot be sure that we will successfully and timely complete the development and introduction of new solutions or enhancements or that our new solutions will satisfy customer or end user demand or be accepted in the marketplace. If we fail in either case, we may lose market share to existing or new competitors and competing technologies, our solutions could become obsolete and our net revenues, income and profitability will suffer.
21
We continue to experience significant and increasing levels of competition from existing and new competitors and a variety of technologies.
The markets for our system solutions and services are highly competitive and rapidly evolving, and we have been and expect to continue to be subject to significant and increasing competition from existing and new competitors and a variety of technologies. Traditionally, we have competed with other large manufacturers and distributors of electronic POS payment solutions, suppliers of cash registers that provide built-in electronic payment capabilities and producers of software that facilitates electronic payment over the Internet. In certain areas, we also compete with smaller companies that have been able to develop strong local or regional customer bases. We compete with companies that are more established, benefit from greater name recognition in particular countries, and have greater resources within those countries than we do. In addition, some of these competitors compete with aggressive pricing. We face downward pressures on prices in many markets. For example, price competition is increasingly intense for us in countries such as China, Brazil, Russia and India from both global and local competitors. In addition, pricing is increasingly an important factor in our ability to penetrate new markets. Any decrease in our selling prices in order to remain competitive in these markets could negatively impact our net revenues, gross margins and results of operations.
We also face competition from alternative payment solutions, such as mobile device-based card payment and processing solutions that offer customers the ability to pay on mobile devices through a variety of payment methods. Some of these alternative solutions enable payment and processing at the POS without use of traditional payment terminals, such as those we manufacture and sell. In addition, some of these alternative solutions are offered by companies that are significantly larger than we are. Competition from these alternative solutions could reduce demand for our traditional payment terminals and our services offerings and have an adverse effect on our results of operations.
As discussed in “If we are unsuccessful in executing on our implementation of the Payment-as-a-Service model and obtaining and maintaining customer acceptance of our service offerings, our net revenues, income and profitability will be adversely affected”, the competitive environment for services offerings is complex and very different in each market and, in some markets, our competitors include certain of our customers that distribute our terminals. Some of our competitors may offer more services, have better name recognition in that market or have a longer or more established relationship with customers in that market than we do. Some of our competitors also control other products and services that are important to our success, including e-commerce and omni-channel platforms.
We expect to continue to experience significant and increasing competition. Our net revenues, income and profitability will be negatively impacted if we do not effectively compete with existing competitors and new market entrants. If we cannot develop and offer, in a timely and cost-effective manner, technological features our customers desire or offer alternative solutions that align with shifts to payment on devices other than the traditional POS terminal, we may lose customers and market share, experience price reductions and/or reduced margins, or, in some cases, cease to participate in the market at all. Furthermore, as we respond to changes in the competitive environment, we may, from time to time, make pricing, product offering or service decisions or acquisitions that may lead to dissatisfaction among our customers and partners and harm our revenues and/or profitability.
22
Security is vital to our customers and end users, and breaches in the security of our solutions could adversely affect our reputation and results of operations.
We operate in an industry that makes us a target of cyber- and other attacks on our systems as well as at our payment solutions. Our business involves the collection, transmission, storage and use of proprietary data or personally-identifying information of our customers, business partners and employees, as well as, in certain cases, end-users of our products or services. We rely on electronic networks, computers, systems, including our gateways, and programs to run our business and operations and, as a result, are exposed to risks of third-party security breaches, employee error, malfeasance, or other irregularities or compromises on our systems which could result in the loss or misappropriation of sensitive data, corruption of business data or other disruption to our operations. As we expand our solutions and services, we may handle increasing volumes of sensitive data, in which case we would expect to increasingly become a target of security breach attempts. We have devoted significant resources to security measures, processes and technologies to protect and secure our networks and systems, but they cannot provide absolute security, especially in light of rapid advances in computer capabilities and cryptography. For example, an increasing number of companies have disclosed breaches of their security systems, some of which have involved sophisticated and highly targeted attacks on their network infrastructure. Because the techniques used to breach security safeguards change frequently, may be difficult to detect for a long period of time and often are not recognized until launched against a target. Certain efforts may also be state sponsored and supported by significant financial and technological resources and therefore may be even more difficult to detect. As a result, we may be unable to anticipate these techniques or to implement adequate preventative measures.
In addition, overall payment network security depends upon a number of factors outside our control, including the merchant or service provider network environment in which our systems are installed, the merchant's or service provider's adherence to security protocols in the installation, use and operation of our solutions and implementation of and adherence to compliant security processes and practices for its network. Even if there is no compromise to our solutions, any security breach or compromise in any part of a merchant's or service provider's network could result in negative media and/or reputational harm to us, or other costs or damages to us, all of which could have a material adverse impact on our results of operations.
We have in the past experienced and may in the future experience security breaches related to unauthorized access to sensitive customer information. If the security of our solutions is compromised, our reputation and marketplace acceptance of our solutions will be adversely affected, which would cause our business to suffer. We may also be subject to damages claims, lost sales, fines or lawsuits, which could adversely affect our results of operations. Furthermore, the costs associated with preventing breaches in the security of our solutions, such as investment in technology and related personnel and costs associated with the testing and verification of the security of our solutions, could adversely impact our financial condition and results of operations. Additionally, our insurance policies carry low coverage limits, which may not be adequate to reimburse us for losses caused by security breaches and we may not be able to fully collect, if at all, under these insurance policies.
Our quarterly operating results may fluctuate significantly as a result of factors outside of our control, which could cause the market price of our stock to decline.
We expect our net revenues and operating results to vary from quarter to quarter. As a consequence, our operating results in any single quarter may not meet the expectations of securities analysts and investors, which could cause the price of our stock to decline. Factors that may affect our operating results include:
• | the type, timing, and size of orders and shipments; |
• | delays in the implementation, including obtaining certifications, delivery and customer acceptance of our products and services, which may impact the timing of our recognition, and amount, of net revenues; |
• | delays in customer purchases in anticipation of product or service enhancements or due to uncertainty in economic conditions; |
• | demand for and acceptance of our new offerings; |
• | changes in competitive conditions, including from traditional payment solution providers and from alternative payment solution providers; |
23
• | the rate at which we transition customers to our services model; |
• | decisions by our distributors and other customers relating to the overall channel inventories of our products held in a particular quarter; |
• | concentration in certain of our customer bases; |
• | changes in economic or market conditions, such as fluctuations in foreign currency exchange rates; |
• | variations in product and service mix and cost during any period; |
• | development of new customer and distributor relationships or new types of customers, penetration of new markets and maintenance and enhancement of existing relationships with customers, distributors and strategic partners, as well as the mix of customers in a particular quarter; |
• | component supply, manufacturing, or distribution difficulties; |
• | timing of commencement, execution, or completion of major product or service implementation projects; |
• | timing of governmental, statutory and industry association requirements, such as PCI compliance deadlines or EMV adoption in the U.S. or elsewhere; |
• | the relative geographic mix of net revenues; |
• | the fixed nature of many of our expenses; |
• | changes in credit card interchange and assessment fees, which are set by the credit card networks and are a component of the cost of providing some of our product offerings, including the Payment-as-a-Service solution and in-taxi payments solutions; |
• | the introduction of new or stricter laws and regulations in jurisdictions where we operate, such as data protection and privacy laws and regulations, laws and regulations covering hazardous substances, or employment laws and regulations, that may cause us to incur additional compliance or implementation costs and/or costs to alter our business operations; |
• | the introduction of new laws and regulations, or changes in implementation of existing laws and regulations, in jurisdictions where we operate that may create uncertainty regarding the business operations of our customers or distributors, which may in turn lead to deferred or reduced orders from our customers or distributors; and |
• | business and operational disruptions or delays caused by political, social or economic instability and unrest, such as the ongoing significant civil, political and economic disturbances in Russia, Turkey, Ukraine and the surrounding areas as well as the political and military conditions in Israel and the Palestinian territories. |
No single factor above is dominant, and any of the foregoing factors could have an adverse effect on our operating results.
In addition, we have experienced in the past and may continue to experience periodic variations in sales in our key vertical and geographical markets. In particular, differences in relative growth rates among our businesses in the U.S. and other regions may cause significant fluctuation in our quarterly operating results, especially our quarterly gross profit margins, because net revenues generated from international markets tend to carry lower margins. Furthermore, adoption of standards such as EMV in the United States, could cause revenues to increase but it may not be possible to sustain or increase those revenues in future period. These periodic variations occur throughout the year and may lead to fluctuations in our quarterly operating results depending on the impact of any given market during that quarter and could lead to volatility in our stock price.
We may suffer losses due to fraudulent activities.
We are expanding our service solutions offerings. Some of our service solutions offerings include our gateway services for credit card transactions. We may be subject to losses in the provision of such services in the event of fraudulent activities or errors in connection with such transactions. As we expand such service solutions offerings, we may increasingly become a target of fraudulent activities and our exposure to the risk of losses from such activities may increase, which may adversely impact our business, results of operations and financial condition. Further, the occurrence of fraud perpetrated on our solutions may result in negative publicity and user sentiment which could harm our brand and reputation and impair our ability to retain or attract users of our solutions.
24
A majority of our net revenues are generated outside the U.S.; accordingly, fluctuations in currency exchange rates may adversely affect our results of operations.
A substantial portion of our business consists of sales made to customers outside the U.S. For example, during the fiscal year ended October 31, 2015, 60.5% of our net revenues were generated outside of the U.S. A portion of the net revenues we receive from such sales is denominated in currencies other than the U.S. dollar, primarily the Euro, the Brazilian real, the British Pound, the Chinese renminbi and the Swedish Krona. Additionally, portions of our cost of net revenues and our other operating expenses are incurred by our international operations and denominated in local currencies, primarily the Euro, the Brazilian real, the British Pound, and the Swedish Krona. Our net revenues, cost of net revenues and operating expenses denominated in the Euro and the Swedish Krona have increased with the Point and Hypercom acquisitions. Fluctuations in the value of these net revenues, costs and expenses as measured in U.S. dollars have historically affected our results of operations, and adverse currency exchange rate fluctuations may have a material impact in the future. Further, changes in exchange rates that strengthen the U.S. dollar could increase the price of our U.S. dollar-denominated products in the local currencies of the foreign markets we serve, making our products relatively more expensive than products that are denominated in local currencies, which could lead to a reduction in our sales and profitability in those markets. For example, in recent periods, the U.S. dollar has strengthened, in some cases significantly, against certain major currencies in which we transact, such as the Euro, the Brazilian real, and the Argentina Peso, impacting negatively our results of operations. In addition, our balance sheet contains monetary assets and liabilities denominated in currencies other than the U.S. dollar, such as cash, intercompany balances, trade receivables and payables, and fluctuations in the exchange rates for these currencies could adversely affect our results of operations.
We have entered into foreign exchange forward contracts intended to hedge a portion of our balance sheet exposure to adverse fluctuations in exchange rates. These hedging arrangements can be costly and may not always be effective, particularly in the event of imprecise forecasts of non-U.S. dollar denominated assets and liabilities. In addition, we may be unable to hedge currency risk for some transactions due to cost or because of a high level of uncertainty or the inability to reasonably estimate our foreign exchange exposures. For some currencies in which we do business, hedging instruments may not be available on any terms.
We have also effectively priced our system solutions products in U.S. dollars in certain countries. Additionally, our efforts to effectively price products in U.S. dollars may have disadvantages as they may affect demand for our products if the local currency strengthens relative to the U.S. dollar. We could be adversely affected when the U.S. dollar strengthens relative to the local currency between the time of a sale and the time we receive payment, which would be collected in the devalued local currency. Accordingly, if there is an adverse movement in one or more exchange rates, we might suffer significant losses and our results of operations may otherwise be adversely affected. Uncertainty in global market conditions has resulted in and may continue to cause significant volatility in foreign currency exchange rates which could increase these risks. As our international operations expand, our exposure to these risks also increases.
25
We intend to continue to expand our operations internationally, and our results of operations could suffer if we are unable to manage our international expansion effectively.
The percentage of our net revenues generated outside of the U.S. is significant and may increase over time. In particular, our acquisition of Point significantly increased our business in the Nordic regions and elsewhere in Northern Europe and our acquisition of Hypercom significantly increased our business in the EMEA region and Asia. Part of our strategy is to expand our penetration in existing foreign markets and to enter new foreign markets, particularly emerging markets where we expect to see growth in electronic payments and related services. Our ability to penetrate some international markets may be limited due to different technical standards, protocols or product requirements. For example, we have lost market share and business in China because we have not been able to provide products and solutions that meet the requirements of the Chinese market. Expansion of our international operations will require significant management attention and financial resources. Certain emerging markets, including those in the Middle East and Africa, may require longer lead times to develop distribution channels, may involve distribution channels with greater business and operational risk due to their relatively shorter operating histories, may be dependent upon the timing and success of local electronic payments initiatives and related infrastructure investments in such markets, as well as require additional time and effort to obtain product certifications and gain market acceptance for our products. Our international net revenues will depend on our success in a number of areas, including:
• | securing commercial relationships to help establish or increase our presence in new and existing international markets; |
• | hiring and training personnel capable of marketing, installing and integrating our solutions, supporting customers, and effectively managing operations in foreign countries; |
• | adapting our solutions to meet local requirements and regulations, and to target the specific needs and preferences of foreign customers, which may differ from our traditional customer base in the markets we currently serve; |
• | building our brand name and awareness of our services in new and existing international markets; |
• | enhancing our business infrastructure to enable us to efficiently manage the higher costs of operating across a larger span of geographic regions and international jurisdictions; and |
• | implementing effective systems, procedures, and controls to monitor and manage our operations across our international markets. |
As discussed more extensively under “If we fail to address the challenges and risks associated with international operations, including those through expansion and acquisitions, we may encounter difficulties implementing our strategy, which could impede our growth or harm our operating results”, if we cannot effectively manage our international expansion, our results of operations could suffer.
If we fail to address the challenges and risks associated with international operations, including those through expansion and acquisitions, we may encounter difficulties implementing our strategy, which could impede our growth or harm our operating results.
We are subject to risks and costs associated with operating in foreign countries which could negatively impact our results of operations or cash flows. In addition, if we are not able to effectively manage these risks, our strategy of international expansion will be negatively impacted.
Our international operations expose us to a number of risks, including:
• | multiple, changing, and often inconsistent enforcement of laws and regulations; |
• | local regulatory or industry imposed requirements, including security or other certification requirements; |
• | competition from existing market participants, including strong global or local competitors that may have a longer history in and greater familiarity with the international markets we enter; |
• | tariffs and trade barriers, including the imposition of new or enforcement of existing import restrictions in jurisdictions in which we do business; |
26
• | higher costs and complexities of compliance with international and U.S. laws and regulations such as import and trade regulations and embargoes, trade sanctions, export requirements and local tax laws; |
• | laws and business practices that may favor local competitors; |
• | restrictions on the repatriation of funds, including remittance of dividends by foreign subsidiaries, foreign currency exchange restrictions, and currency exchange rate fluctuations; |
• | less favorable payment terms and increased difficulty in collecting accounts receivable and developing payment histories that support collectability of accounts receivable and revenue recognition; |
• | different and/or more stringent labor laws and practices, such as the mandated use of workers' councils and labor unions, or laws that provide for broader definitions of employer/employee relationships; |
• | different and/or more stringent data protection, privacy and other laws; |
• | antitrust and competition regulations; |
• | changes or instability in a specific country's or region's political or economic conditions; and |
• | greater difficulty in safeguarding intellectual property, including in areas such as China, India, Russia, and Latin America. |
Many of these factors typically become more prevalent during periods of economic stress, such as the ongoing weakness in the economies of the euro zone countries and Latin America countries and volatility in global financial markets that have caused declines in the value of the euro and other currencies impacted by the European sovereign debt crisis, or disruptive events such as natural or man-made disasters or military or terrorist actions. The occurrence or persistence of weakened global economic conditions in one or more regions where we do business may exacerbate certain of these risks. Additionally, these risks and costs associated with operating in foreign countries are heightened with respect to our international expansion into emerging or developing markets, which, for example, tend to experience more economic and political instability or have less developed or sophisticated distribution channels.
We are subject to foreign currency risk including that from economic and political instability which can lead to significant and unpredictable volatility in currency rates, including as a result of significant currency devaluations, which may negatively impact our net revenues, gross margins, results of operations and financial position. Although we engage in some hedging of our foreign currency exposures, we do not hedge all such exposures and our hedging arrangements may not always be effective. The uncertainty with respect to the ability of certain European countries to continue to service their sovereign debt obligations and the related European financial restructuring efforts may cause the value of the Euro to fluctuate. The current political situation in Ukraine, the sanctions imposed against Russia by certain European nations and the U.S., and Russia's response to these sanctions may further increase the economic uncertainty in the affected regions and lead to further fluctuation in the value of foreign currencies, such as the Euro and Russian ruble, used in these regions. See “A majority of our net revenues are generated outside the U.S.; accordingly, fluctuations in currency exchange rates may adversely affect our results of operations” and Part II, Item 7A, Quantitative and Qualitative Disclosures About Market Risk--Foreign Currency Transaction Risk in this Annual Report on Form 10-K.
27
In addition, compliance with foreign and U.S. laws and regulations, including changes and additions to such laws and regulations, that are applicable to our international operations is complex and may increase our cost of doing business in international jurisdictions. Our international operations could expose us to fines and penalties if we fail to comply with these regulations. These laws and regulations include import and export requirements, trade restrictions and embargoes, exchange control regulations, data privacy requirements, labor laws, tax laws, anti-competition regulations, U.S. laws such as the Foreign Corrupt Practices Act, and local laws prohibiting corrupt payments to governmental officials and other improper payments or inducements, such as the U.K. Bribery Act. Although we have implemented policies, procedures and training designed to ensure compliance with these laws and regulations, there can be no assurance that our employees, contractors, distributors, suppliers and agents will not take actions in violation of our policies, particularly as we expand our operations through organic growth and acquisitions, including acquisitions of businesses that were not previously subject to and may not have familiarity with U.S. and other laws and regulations applicable to us or compliance policies similar to ours. For example, as described under the caption “Disclosures of Iranian Activities under Section 13(r) of the Securities Exchange Act of 1934” in Part I, Item 1, Business, of our Annual Report on Form 10-K filed with the SEC for the fiscal year ended October 31, 2013, in early 2013, we submitted a voluntary disclosure to the U.S. Department of Treasury's Office of Foreign Assets Control in connection with certain unauthorized activities by employees of one of our non-U.S. subsidiaries that involved potential violations of sanctions regulations. Any violations of sanctions or export control regulations or other laws could subject us to civil or criminal penalties, including the imposition of substantial fines and interest or prohibitions on our ability to offer our products and services to one or more countries, and could also materially damage our reputation, our brand, our international expansion efforts and our business, and negatively impact our operating results.
Our international operations tend to carry solutions with lower average selling prices, may be subject to greater downward pressure on prices in some markets and may be associated with higher costs and lower gross margins, which may promote volatility in our results of operations and may adversely impact future growth in our earnings.
Our international sales of system solutions tend to carry lower average selling prices and therefore have lower gross margins than our sales in the U.S. We also face increasing downward pressure on prices in certain international markets such as China, where competition from local low-cost and global competitors has increased significantly, Brazil, where competition has intensified, and India where we continue to work to expand our business. In these and certain other markets, some customers increasingly seek lower-cost solutions suited to their markets that may have similar, different, and in some cases, better features and functionality. In addition, the costs associated with international trade may be higher as a result of the importation costs, duties and trade requirements or other import or export control laws and regulations imposed by some jurisdictions where we do business. As a result, any improvement in our results of operations from our international expansion will likely not be as favorable or profitable as an expansion of similar magnitude in the U.S. In addition, we are unable to predict for any future period our proportion of net revenues that will result from international sales versus sales in the U.S. Variations in this proportion from period to period may lead to volatility in our results of operations and may adversely impact future growth in our earnings.
28
Macroeconomic conditions and economic volatility have in the past and could in future periods materially and adversely affect our business and results of operations.
Our operations and performance depend significantly on global and regional economic conditions. For example, the current continued and prolonged weak macro-economic conditions in Europe and in some euro zone countries have resulted in a slowdown, and in some cases deferrals, of orders by customers, which has adversely impacted our business, financial condition and results of operations. Similarly, the significant slowdown and volatility in the U.S. and international economy and financial markets which began in the latter half of 2008 resulted in reduced demand for our products and adversely affected our business, financial condition and results of operations. The lower-than-expected growth rates in certain emerging market economies in which we operate have also had an adverse effect on our results of operations in these regions. More recently, the decreases in oil prices have resulted in, and may continue to result in, decline in demand and overall weaker market conditions in countries heavily dependent on oil revenues, such as Russia, Venezuela, Mexico, and the Middle East. In particular, the slowdown and volatility in the global markets resulted in softer demand in the financial and retail sectors, pricing pressures and more conservative purchasing decisions by customers, including a tendency toward lower-priced products and lower volume of purchases. In some countries where we do business, the weakened economy has resulted in economic instability which has had negative effects, including a decrease in purchasing power due to currency devaluations. If these weak macro-economic conditions continue or if any economic recovery remains slow and fragile or is not sustained, our net revenues, business, financial condition and results of operations could be adversely impacted.
We expect certain markets where we conduct business, including parts of Europe, to continue to experience weakened or uncertain economic conditions in the near term, and some of our customers, prospective customers, suppliers, distributors and partners will continue to be negatively impacted by the continued global weakness in the economy. We cannot predict the extent and duration of the negative impact that global and regional economic volatility may have on our business, operating results and financial condition. There is no assurance that governments and central banks will take actions to further stimulate the economy or that any such actions will have positive or lasting impacts. Existing stimulus measures may also be withdrawn or reduced, introducing greater economic uncertainty or volatility. Further, conditions such as political situations or terrorist actions in other parts of the world, such as Ukraine and parts of Asia, the continued uncertainty related to economic conditions in the U.S., including the continuing implementation of the so-called “budget sequestration”, any potential, additional congressional actions regarding the national debt ceiling and federal budget deficit, the potential effect of any future federal government shutdown, and additional taxes related to changes in the health care law, as well as continued high unemployment rates in the U.S. and some other regions, may negatively impact global economic conditions, including corporate and consumer spending, and liquidity of capital markets. Continued volatility in market conditions, such as fluctuations in foreign currency rates relative to the U.S. dollar, makes it difficult to forecast our financial guidance and/or to meet such guidance. If we fail to meet our financial guidance or the expectations of investment analysts or investors in any period, the market price of our stock could decline.
29
Sanctions against Russia, and Russia's response to those sanctions, including the imposition of sanctions by Russia, could materially adversely affect our business, results of operations and financial condition.
In March 2014, the Crimean region of Ukraine was annexed by Russia. In response, other nations, including the U.S., have imposed or are considering imposing, economic sanctions on Russia. Recently, concerns related to the political and military conditions in the region have prompted stringent restrictions by the U.S. and EU, and increasing levels of economic sanctions, targeting certain Russian companies in the finance, energy and defense industries and additional Russian nationals, as well as imposing restrictions on trading and access to capital markets. In response, Russia announced its own trading sanctions against nations that implemented or supported the anti-Russia sanctions, including the U.S. and some European Union nations. Russia has also recently announced potential sanctions against Turkey in response to a military incident between Turkey and Russia in November 2015. A portion of our net revenues are from Russia and its surrounding areas, including Ukraine and Turkey. Economic sanctions imposed by the U.S., the European Union, Russia, Turkey or the world community may result in serious economic challenges in Ukraine, Turkey, Russia and the surrounding areas, and imposition of trade restrictions may delay or prevent shipment of products to or services performed in those countries, which could have an adverse effect on our results of operations. In addition, to the extent it is more difficult for some of our customers to obtain financing or access U.S. dollar currency, due to restrictions on access to international capital markets as a result of the sanctions, our customers' ability to pay could be adversely affected, which could have a material adverse impact on our business, cash flows, results of operations and financial condition. Further, current and any future retaliatory measures by Russia in response to anti-Russia sanctions could adversely affect European and Middle East economic conditions, which could in turn affect our business in Europe, Turkey and elsewhere. Accordingly, sanctions against or by Russia and the responses to sanctions, including potential responses by Turkey to sanctions imposed by Russia, could have a material adverse effect on our business, results of operation and financial condition.
Our solutions may have defects or experience field failures that could delay sales, harm our brand, increase costs and result in product recalls and additional warranty and other expense.
We offer complex solutions that are susceptible to undetected hardware and software errors or failures. Our solutions may experience failures when first introduced, as new versions or enhancements are released, or at any time during their lifecycle. Despite our testing procedures and controls over manufacturing quality, errors may be found in our products. Field failure may result from usage with third-party issued payment cards, for example, if such usage generates excess electrostatic discharge. Defects may also arise from third-party components that are incorporated into our products, such as hardware modules, chipsets, wireless modules or battery cells. Our customers may also run third-party software applications on our electronic payment systems. Errors in such third-party applications could adversely affect the performance of our solutions or cause the loss of data. Any product recalls or delays in implementation of our products as a result of, or perceived to be resulting from, our errors or failures could result in the loss of customers, fines incurred by our customers due to failure to comply with payment system rules for which we may be obligated to compensate our customers, loss of or delays in market acceptance of our solutions, diversion of the attention of our research and development personnel from product development efforts and harm to our credibility and relationships with our customers, adversely affect our business and reputation, and increase our product costs which could negatively impact our margins, profitability, and results of operations. Any significant returns or warranty claims for any of our products, including products from acquisitions, could result in significant additional costs to us, such as costs to implement modifications to correct defects, recall and replace products, and defend against litigation related to defective products or related property damage or personal injury, and could adversely affect our results of operations.
Identifying and correcting defects can be time-consuming, costly and in some circumstances extremely difficult. It may take several months to correct software errors, and even longer for hardware defects. The delays in correcting product defects could exacerbate the adverse impact product defects or failures may have on our business, results of operations, financial condition and reputation.
30
Disruptions in our services could reduce our net revenues, increase costs, harm our reputation and result in loss of customers.
The performance of our services may from time to time be disrupted due to equipment malfunctions, technical performance failures, and connection problems, among other things, including disruptions caused by factors outside our control, such as telecommunication network failures. Service disruptions may result in our customers' inability to process transactions using our terminals or gateways and lead to loss of net revenues for us. We may have to spend resources to detect and fix defects that caused such disruptions, and we cannot assure you that we will be able to detect and fix all such defects. In addition, we may be required to reimburse or indemnify our customers for losses and fines or penalties due to such service disruptions. Our brand may be harmed by service disruptions and we may lose customers to our competitors, which could result in financial or reputational harm to our business.
Changes to our management and strategic business plan and restructuring activities may cause uncertainty regarding the future of our business, and may adversely impact employee hiring and retention, our stock price, our customer relationships, and our results of operations and financial condition.
We have experienced, and may experience in the future, changes in our management team. In 2013, the Board appointed Mr. Paul Galant as our CEO and Mr. Marc E. Rothman as our new CFO. Further, during 2013, 2014 and 2015, we announced certain other sales, technology, marketing, human resources, and operations management changes. During this time of transition, our new executive leadership and our continuing executives have been designing and implementing changes to our strategic business plans, in order to better position the company for strategic growth and long-term profitability. In addition, we have initiated certain restructuring activities in accordance with our approved restructuring plans, reducing the number of employees and contractors in certain areas and reassigning certain employee duties, and consolidating excess facilities. Our management changes, changes to our strategic business plan, and restructuring activities, as well as the potential for additional changes or activities in the future, may introduce uncertainty regarding our business prospects and may result in disruption of our business and our customer relationships. In addition, these changes and measures could distract our employees, decrease employee morale, result in failure in meeting operational targets due to the loss of employees and make it more difficult to retain and hire new talent, increase our expenses in terms of severance payments and facility exit costs, both of which could be significant, expose us to increased risk of legal claims by terminated employees, and harm our reputation. These changes and activities could also increase the volatility of our stock price. If we are unable to mitigate these or other similar risks, our business, results of operations, and financial condition may be adversely affected.
We may not successfully implement our transformation initiatives or fully realize the anticipated benefits from our restructuring efforts.
We are in the process of implementing a number of strategic, transformation initiatives intended to redefine our global product management process and portfolio, re-engineer our research and development function and improve our cost structure. As part of these transformation initiatives, in the second and third quarters of fiscal year 2014, and the third quarter of fiscal 2015, our management approved restructuring plans to better align our business organization, operations and product lines to achieve long-term sustainable growth and value, including through workforce reduction and facility consolidations. We cannot assure you that we will be able to successfully implement our transformation initiatives. Further, our ability to achieve the anticipated benefits, including the anticipated levels of cost savings and efficiency, of such transformation initiatives and the restructuring plans within expected timeframes is subject to many estimates and assumptions, which are, in turn, subject to significant economic, market, competitive and other uncertainties, some of which are beyond our control. Further restructuring or reorganization activities may also be required in the future beyond what is currently planned, which could further enhance the risks associated with these activities. There is no assurance that we will successfully implement, or fully realize the anticipated positive impact of, our transformation initiatives and the restructuring plans, in the timeframes we desire or at all.
31
If we are unsuccessful in executing on our implementation of the Payment-as-a-Service model and obtaining and maintaining customer acceptance of our service offerings, our net revenues, income and profitability will be adversely affected.
A central part of our strategic plan is to increase services offerings so that we can derive higher overall net revenues and margins, develop deeper relationships with our customers and drive more predictable financial results. Following our acquisition of Point, we have been implementing Point's Payment-as-a-Service model in multiple jurisdictions. Implementing a new services model is difficult and involves management focus, upfront local infrastructure and capital costs and other resources that could otherwise be utilized in research and development of other hardware and software product offerings, and the build-out of local service and support teams. In addition, the competitive environment for services is very different in each market, and the bundle of services being offered must be customized to compete effectively. Markets may take longer to adopt a Payment-as-a-Service model than we anticipate or may choose not to adopt this model at all. We may also be competing against others, including certain of our customers that distribute our terminals, who already offer similar services. Continued weakness in the global economy may also negatively impact our ability to implement our Payment-as-a-Service model within the time frames we desire and to achieve the benefits we anticipate. If we are unsuccessful in executing on our implementation of the Payment-as-a-Service model and obtaining and maintaining customer acceptance of our service offerings or are unable to implement the model while also maintaining focus on other key areas of our business or if we are unable to maintain the expected level of margins associated with these service offerings, we may not be able to generate sufficient returns on our investments in the services business and our net revenues, income and profitability will be adversely affected.
We have experienced rapid and significant growth in our operations in recent years, and if we cannot manage our expanded operations and also effectively execute on our business strategy, our results of operations will suffer.
We have experienced rapid and significant growth in our operations in recent years, both organically and from acquisitions. If we cannot manage our expanded operations to align with our business strategy, which includes maintaining streamlined and efficient operations while effectively meeting the needs of our broader customer base, managing a competitive portfolio of products, and growing our payment services globally in a cost-effective manner, our results of operations will suffer. In particular, we may not be able to attain desired cost-efficiencies and remain competitive, and any measures we may need to undertake to further align our operations with our business strategy may be costly and could adversely impact our results of operations. If we are unable to successfully execute on our business strategy, our results of operations may also be adversely affected. Furthermore, we cannot be sure that we have made adequate allowances for the costs and risks associated with supporting our expanded operations. Any delay in implementing, or transitioning to, new or enhanced systems, procedures, processes or controls to adequately support our expanded operations, including our expansion into a number of additional international markets, including emerging markets, and our growth in payment services globally may adversely affect our ability to meet customer requirements, manage our product inventory, and record and report financial and management information on a timely and accurate basis.
32
From time to time, we engage in acquisitions, divestitures, and other strategic transactions that involve numerous enterprise risks and could disrupt our ongoing business and harm our results of operations. We may not be able to address these risks without substantial expense, delay or other operational or financial problems, and may not realize the expected benefits of our acquisitions.
In pursuing our business strategy, we, from time to time, conduct discussions, evaluate opportunities, and complete acquisitions or strategic investments in related businesses, technologies, or products.
The integration of our acquisitions, particularly those that are international in scope, is complex, time-consuming and expensive, and has disrupted, and may continue to disrupt, our business or divert the attention of our management. Achieving the expected benefits of our acquisitions depends in large part on our successful integration of the acquired businesses' operations and personnel with our own in a timely and efficient manner. We cannot ensure that all of our integration efforts will be completed as quickly as expected or that our past or future acquisitions will achieve any of the expected benefits. These challenges and risks, which are heightened due to the number, size and varying scope of our recently completed acquisitions, include, but are not limited to:
• | the need to integrate the operations, business systems, and personnel of the acquired business, technology or product, including coordinating the efforts of the sales operations, in a cost-effective manner; |
• | the challenge of managing acquired lines of business, particularly those lines of business with which we have limited operational experience; |
• | the need to integrate or migrate the information technology infrastructures of acquired operations into our information technology systems and resources in an effective and timely manner; |
• | the need to migrate our acquired businesses to our common enterprise resource planning information system and integrating all operations, sales, accounting, human resources and administrative activities for the combined company, all in a cost-effective and timely manner; |
• | the need to coordinate research and development and support activities across our existing and newly acquired products and services in a cost-effective manner; |
• | the challenges of incorporating acquired technologies, products and service offerings into our next generation of products and solutions in an effective and timely manner; |
• | the potential disruption of our ongoing business, including the diversion of management attention to issues related to integration and administration; |
• | entering markets in which we have limited prior experience; |
• | in the case of international acquisitions, the need to integrate operations across different jurisdictions, cultures and languages and to address the particular economic, foreign currency, political, legal, compliance and regulatory risks, including with respect to countries where we previously had limited operations; |
• | the possible inability to realize the desired financial and strategic benefits from any or all of our acquisitions or investments in the time frame expected, or at all; |
• | the loss of all or part of our investment; |
• | the loss of customers and partners of acquired businesses; |
• | the failure to retain employees from acquired businesses; |
• | the need to integrate each company's accounting, legal, management, information, human resource and other administrative systems to enable effective management, and the lack of control if such integration is delayed or unsuccessful; |
• | the need to implement controls, procedures and policies appropriate for a larger public company at companies that prior to acquisition had lacked such controls, procedures and policies; |
• | the risk that increasing complexity inherent in operating a larger global business and managing a broader range of solutions and service offerings may impact the effectiveness of our internal controls and adversely affect our financial reporting processes; |
• | the failure to adequately identify or assess the magnitude of certain liabilities, shortcomings or other circumstances prior to acquiring a company, which could result in unexpected litigation, unanticipated liabilities, additional costs, unfavorable accounting treatment or other adverse effects; and |
33
• | the dependency on the retention and performance of key management and employees of acquired businesses for the day-to-day management and future operating results of these businesses. |
Our operating results or financial condition may be adversely impacted by pre-existing claims or liabilities, both known and unknown, of these acquired companies, including claims from current or former customers, terminated employees or other third parties; pre-existing contractual relationships of an acquired company that may contain unfavorable terms or that have unfavorable revenue recognition or accounting treatment; and intellectual property claims or disputes. In addition, the integration process may strain the combined company's financial and managerial controls and reporting systems and procedures and may result in the diversion of management and financial resources from the combined company's core business objectives. There can be no assurance that we will successfully integrate our businesses or that we will realize the anticipated benefits of the acquisitions after we complete our integration efforts.
These risks are heightened and more prevalent in acquisitions of larger businesses or in businesses involving geographies or business lines in which we may have less experience. Future acquisitions and investments could also result in substantial cash expenditures, potentially dilutive issuances of our equity securities and incurrence of additional debt, contingent liabilities and amortization expenses related to other intangible assets that could adversely affect our business, operating results, and financial condition.
We may not be able to attract, integrate, manage, and retain qualified personnel.
Our success depends to a significant degree upon the continued contributions of our key senior management, engineering, sales and marketing, supply chain, and other specialized personnel, many of whom would be difficult to replace. In addition, our future success depends on our ability to attract, integrate, manage, and retain highly skilled employees throughout our business. Competition for some of these personnel is intense, and in the past we have had difficulty hiring, in our desired time frame and in our desired markets, employees that have the specific qualifications required for a particular position. In particular, we may be unsuccessful in attracting and retaining personnel as a result of the workforce reduction measures we have implemented or may implement in the future. To help attract, retain and motivate qualified personnel, we use share-based incentive awards, such as employee stock options and restricted stock units. If the value of such stock awards does not appreciate as measured by the performance of the price of our common stock, or if our share-based compensation otherwise ceases to be viewed as a valuable benefit, our ability to attract, retain and motivate personnel could be weakened. The loss of the services of any of our key personnel, the inability to attract or retain qualified personnel in the future, or delays in hiring required personnel, particularly engineers and sales personnel, could make it difficult for us to manage our business and meet key objectives, such as timely product introductions, and our business and profitability may suffer.
34
We depend on distributors and resellers to sell a significant portion of our solutions. If we do not effectively manage our relationships with them, our net revenues and results of operations could suffer.
We sell a significant portion of our solutions through third-party resellers such as independent distributors, ISOs, value-added resellers, and payment processors. We depend on their active marketing and sales efforts. These resellers also provide after-sales support and related services to end user customers, and generally have valuable knowledge and experience with the customer base in the territories they serve. These resellers also provide critical services of developing and supporting the software applications to run on our various electronic payment systems and, internationally, in obtaining requisite certifications in the markets in which they are active. Accordingly, the pace at which we are able to introduce new solutions in markets in which these resellers are active depends in part on the resources they dedicate to these tasks. Moreover, our arrangements with these resellers typically do not prevent them from selling products of other companies, including our competitors, and such resellers may elect to market our competitors' products and services in preference to our system solutions. In addition, we may offer similar services as those offered by certain of our resellers as we introduce our Payment-as-a-Service offerings. If one or more of our major resellers terminate or otherwise adversely change their relationship with us, we may be unsuccessful in replacing such relationship. The loss of any of our major resellers could impair our ability to sell our solutions and result in lower net revenues and income. It could also be time-consuming and expensive to replicate, either directly or through other resellers, the certifications and the applications developed by these resellers.
In addition, orders from our distributors and resellers depend on their sales volumes and inventory management decisions. We have experienced, and may in future periods experience, a significant decrease in our net revenues based on the timing of orders from our distributors, which generally varies based on distributor decisions on managing inventory levels, desired product mix and timing of new product introductions. Declines or deferrals of orders could materially and adversely affect our net revenues, operating results and cash flows.
We depend on a limited number of customers, including distributors and resellers, for a large percentage of our net revenues. If we do not effectively manage our relationships with them, our net revenues and operating results could suffer.
A significant percentage of our net revenues is attributable to a limited number of customers, including distributors and ISOs. If we are not able to adequately and timely respond to demands for new or additional products or features from any of our large customers, that customer may decide to reduce its order or not to purchase from us at all, which could have a material adverse effect on our business and results of operations. Our net revenues are dependent in part on the timing of purchases by our large customers. If any of our large customers significantly reduces or delays purchases from us or if we are required to sell products to them at reduced prices or on other terms less favorable to us, our net revenues, profitability, cash flows and net income could be materially and adversely affected.
35
Timing for orders for our products and services can be back-end weighted within the fiscal quarter, which can make our net revenues difficult to predict and can negatively impact our business and results of operations.
The timing of our customer orders and related net revenues are often back-end weighted, meaning that during a particular fiscal quarter, a substantial portion of sales orders may be received, substantial product may be shipped, and substantial revenue may be recognized in the last month of the fiscal quarter. Timing of customer orders and related net revenues often become more back-end weighted during economic downturns or periods of uncertainty, as well as in markets where there is uncertainty related to acceptance and/or implementation of our products, such as that related to changes or potential changes in regulations or other local requirements that impact deployment of our products. These effects can also be exacerbated in markets where we depend on a limited number of customers, and where one or a few customers' decisions can have a significant impact on our results of operations in the fiscal quarter. Such back-end loading can also adversely affect our business and results of operations due to a number of additional factors including the following:
• | the manufacturing processes at our third-party contract manufacturers could become concentrated in a shorter time period. This concentration of manufacturing could increase manufacturing costs, such as costs associated with the expediting of orders, and negatively impact our gross margins. The risk of higher levels of obsolete or excess inventory write-offs would also increase if we were to hold higher inventory levels to counteract this effect; |
• | the higher concentration of orders may make it difficult to accurately forecast component requirements and, as a result, we could experience a shortage of the components needed for production, possibly delaying shipments and causing lost orders; |
• | if we are unable to fill orders at the end of a quarter, shipments may be delayed. This could cause us to fail to meet our revenue and operating profit expectations for a particular quarter and could increase the fluctuation of quarterly results if shipments are delayed from one fiscal quarter to the next or orders are canceled by customers; and |
• | in order to fulfill orders at the end of a quarter, we may be forced to deliver our products using air freight which would result in increased distribution costs. |
These factors can cause our net revenues to fluctuate and be difficult to predict in any given fiscal quarter. Any failure to meet our or analysts' revenue or operating profit expectations for a particular quarter could cause the market price of our stock to decline.
36
If we do not accurately forecast customer demand and effectively manage our product mix and inventory levels, we may lose sales from having too few or the wrong mix of products or incur costs associated with excess inventory.
If we inaccurately forecast demand for our products, we could end up with either excess or insufficient inventory to satisfy demand. This problem is exacerbated because our products are offered in a number of different configurations and with a variety of optional features, and we generally receive a significant volume of customer orders towards the end of each fiscal quarter which leaves us little room to adjust inventory mix to match demand, as discussed under “Timing for orders for our products and services can be back-end weighted within the fiscal quarter, which can make our net revenues difficult to predict and can negatively impact our business and results of operations.” During the transition from an existing product to a new replacement product, we must accurately predict the demand for the existing and the new product. Furthermore, introducing new products into our current markets or existing products into new markets involves the uncertainty of whether the market will adopt our product in the volumes and time frames that we anticipate or at all. Our inability to properly manage our inventory levels could lead to increased expenses associated with writing off excessive or obsolete inventory, additional shipping costs to meet immediate demand and a corresponding decline in gross margins, or lost sales. If we do not accurately predict demand, we could also incur increased expenses associated with binding commitments to certain third-party contract manufacturers and suppliers which would negatively impact our gross margins and operating results. For example, as of October 31, 2015, the amount of purchase commitments issued to contract manufacturers and component suppliers totaled approximately $178.4 million. Of this amount, $10.4 million has been recorded in Accruals and other current liabilities in our Consolidated Balance Sheets because these commitments are not expected to have future value to us. For additional information regarding our commitments to third-party manufacturers and suppliers, see Note 12, Commitments and Contingencies, in the Notes to Consolidated Financial Statements of this Quarterly Report on Form 10-Q. During times of economic uncertainty, such as the global economic recession that continues to impact certain parts of Europe, it becomes more difficult to accurately forecast demand and manage our inventory levels. Deteriorating market conditions have in the past and can in future periods cause us to incur additional costs associated with excess and obsolete inventory, scrap, and excess inventory held by our contract manufacturers.
We may accumulate excess or obsolete inventory that could result in unanticipated price reductions and write-downs and adversely affect our financial condition.
In formulating our solutions, we have focused our efforts on providing our customers with solutions that have high levels of functionality, which requires us to develop and incorporate new and evolving technologies. This approach tends to increase the risk of obsolescence for products and components we hold in inventory and may compound the difficulties posed by other factors that affect our inventory levels, including the following:
• | maintaining significant inventory of components that are in limited supply; |
• | buying components in bulk for better pricing; |
• | entering into purchase commitments based on early estimates of quantities for longer lead time components; |
• | responding to the unpredictable demand for products; |
• | cancellation of customer orders; |
• | responding to customer requests for quick delivery schedules; and |
• | timing of end-of-life decisions regarding products. |
The accumulation of excess or obsolete inventory has in the past resulted in and may in future periods result in price reductions and inventory write-downs and scrap, which could, sometimes materially, adversely affect our business, results of operations and financial condition. For example, as a result of the expiration of PCI 1.3 standards in April 2014, we can no longer sell our products that are only compliant with PCI 1.3 or earlier standards except under limited circumstances, primarily as one-for-one in-kind replacements of devices for repair and replacement. For the fiscal year ended October 31, 2013, we incurred costs for obsolete inventory, scrap, and purchase commitments for excess components at contract manufacturers of $26.5 million, an increase of $13.7 million compared to those for the fiscal year ended October 31, 2012, due to lower-than-anticipated system solutions sales volumes and potential obsolescence because of the PCI 1.3 standard expiration.
37
We are exposed to credit risk with some of our customers and to credit exposures and currency controls in certain markets, which could result in material losses.
A significant portion of our net revenues are on an open credit basis, with typical payment terms of up to 60 days in the U.S. and longer in some international markets due to local customs or conditions. In the past, there have been bankruptcies among our customer base. Credit risks may be higher and collections may be more difficult to enforce in emerging markets where we conduct business, including for example where the market for our products and solutions is still developing and their acceptance uncertain, and future losses, if incurred, could harm our business and have a material adverse effect on our operating results and financial condition. Also, certain customers that are invoiced in U.S. dollars, such as those based in Venezuela and Nigeria and other countries whose economies are significantly impacted by the price of oil, have experienced, and may continue to experience, difficulties in obtaining U.S. dollars due to local currency controls, and therefore may not be able to remit timely payment to us. Additionally, instability or uncertainty in global or regional economic, political or military conditions may make it more difficult for some customers to obtain financing or access U.S. dollar currency, and their ability to pay could be adversely impacted, which in turn could have a material adverse impact on our business, cash flows, operating results and financial condition.
We depend upon third parties to manufacture our systems and to supply the components necessary to manufacture our products, and in some cases we are dependent upon sole source suppliers to manufacture our systems.
We utilize a limited number of third parties to manufacture our hardware products pursuant to our specifications and rely upon these contract manufacturers to produce and deliver products on a timely basis and at an acceptable cost or to otherwise meet our product demands. Further, a material portion of these third-party manufacturing activities are concentrated in China. Disruptions to the business, financial stability or operations, including due to strikes, labor disputes or other disruptions to the workforce, of these contract manufacturers, or to their ability to produce the products we require in accordance with our and our customers' requirements, and particularly disruptions to the manufacturing operations in China including due to geological disruptions such as earthquakes, could significantly affect our ability to fulfill customer demand on a timely basis which could materially harm our net revenues and results of operations. Substantially all of our manufacturing is currently handled by our third-party contract manufacturers and our dependency on our third-party contract manufacturers could exacerbate these risks.
Components such as application specific integrated circuits, or ASICs, microprocessors, wireless modules, modems, and printer mechanisms that are necessary to manufacture and assemble our systems are sourced either directly by us or on our behalf by our contract manufacturers from a variety of component suppliers selected by us. Certain of the components are specifically customized for use in our products and are obtained from sole source suppliers on a purchase order basis. Disruptions to the business, financial stability or operations, including due to strikes, labor disputes or other disruptions to the workforce, of our suppliers, and particularly sole source suppliers, or to the distribution and transportation of our products may also impact the availability of components to us in the quantities or within the timeframe we require. Any prolonged component shortage could materially and adversely affect our business and results of operations. Component shortages have resulted in increased costs for certain components and continued cost increases could negatively impact our gross margins and profitability. If our suppliers are unable or unwilling to deliver the quantities that we require within the timeframe that we require, we would be faced with a shortage of components. We also experience from time to time an increase in the lead time for delivery of some of our key components. We may not be able to find alternative sources in a timely manner if suppliers of our key components become unwilling or unable to provide us with adequate supplies of these key components when we need them or if they increase their prices. If we are unable to obtain sufficient key required components, or to develop alternative sources if and as required in the future, or to replace our component and factory tooling for our products in a timely manner if they are damaged or destroyed, we could experience delays or reductions in product shipments. This could harm our relationships with our customers and cause our net revenues to decline. Even if we are able to secure alternative sources or replace our tooling in a timely manner, our costs could increase. Any of these events could adversely affect our results of operations.
38
Shipments of electronic payment systems may be delayed by factors outside of our control, which can harm our reputation and our relationships with our customers.
The shipment of payment systems requires us or our manufacturers, distributors, or other agents to obtain customs or other government certifications and approvals, and, on occasion, to submit to physical inspection of our systems in transit. Failure to satisfy these requirements, and the very process of trying to satisfy them, can lead to lengthy delays in the delivery of our solutions to our direct or indirect customers. Because we depend upon third-party carriers for the timely delivery of our products we may face delays in delivery due to reasons outside our control. Delays and unreliable delivery by us may harm our reputation in the industry and our relationships with our customers and result in canceled orders, any of which could adversely affect our results of operations and business.
We may be subject to additional impairment charges due to potential declines in the fair value of our assets.
As a result of our acquisitions, particularly that of Lipman in November 2006, Hypercom in August 2011 and Point in December 2011, we have recorded significant goodwill and intangible assets on our balance sheet. We test goodwill and intangible assets for impairment on a periodic basis as required, and whenever events or changes in circumstances indicate that the carrying value may not be recoverable. The events or changes that could require us to test our goodwill and intangible assets for impairment include a reduction in our stock price and market capitalization and changes in our estimated future cash flows or changes in rates of growth in our industry or in any of our reporting units or lines of business.
We performed our annual review for potential indicators of impairment during the fourth fiscal quarter of fiscal year 2015, and concluded that there was no indicator of impairment at October 31, 2015. We will continue to evaluate the carrying value of our goodwill and intangible assets. The process of evaluating the potential impairment of goodwill and intangible assets is subjective and requires significant judgment at many points during the analysis. Our evaluation of potential impairment of goodwill could be negatively affected by a variety of factors, including declines in our stock price, failure to meet our internal forecasts, and weakening of macroeconomic conditions or significant changes in management structure or business strategies. If we determine in the future that there is potential further impairment in any of our reporting units, we may be required to record additional charges to earnings, which could materially and adversely affect our financial results and could also materially and adversely affect our business. See Note 9, Goodwill and Purchased Intangible Assets, in the Notes to Consolidated Financial Statements and Part II, Item 7, Management's Discussion and Analysis of Financial Condition and Results of Operations - Critical Accounting Policies and Estimates -- Goodwill, of this Annual Report on Form 10-K for the fiscal year ended October 31, 2015 for additional information related to impairment of goodwill and intangible assets.
We have operations in Israel and therefore our results of operations may be adversely affected by political or economic instability or military operations in or around Israel.
We have offices and personnel in Israel. Therefore, political, economic, and military conditions in Israel directly affect our operations. The outcome of peace efforts between Israel and its Arab neighbors remains uncertain. Any armed conflicts, such as the recent military conflict in the Gaza Strip, or further political instability in the region is likely to negatively affect business conditions and materially harm our results of operations. Furthermore, several countries continue to restrict or ban business with Israel, Israeli companies and companies with significant Israeli operations. These restrictive laws and policies may seriously limit our ability to make sales in those countries.
In addition, many employees in Israel are obligated to perform between 30 to 40 days of military reserve duty annually and are subject to being called for active duty under emergency circumstances. If a military conflict arises, these individuals could be required to serve in the military for extended periods of time. Our operations in Israel could be disrupted by the absence for a significant period of one or more key employees or a significant number of other employees due to military service. Any disruption in our operations in Israel could materially and adversely affect our business.
39
Force majeure events, such as terrorist attacks, other acts of violence or war and political instability may adversely affect us.
Terrorist attacks, war, and international political instability may disrupt our ability to generate net revenues. Such events may negatively affect our ability to maintain net revenues and to develop new business relationships. Because a substantial and growing part of our net revenues is derived from sales and services to customers outside of the U.S. and we have our electronic payment systems manufactured outside the U.S., terrorist attacks, war, and international political instability anywhere may decrease international demand for our products and inhibit customer development opportunities abroad, disrupt our supply chain, and impair our ability to deliver our electronic payment systems, which could materially and adversely affect our net revenues or results of operations. Economic and political instability, particularly in the Middle East or OPEC member countries, may also disrupt the production or supply of fuel which could increase our costs related to shipment and distribution of our products. Any of these events may also disrupt global financial markets and precipitate a decline in the price of our stock. See also "Sanctions against Russia, and Russia's response to those sanctions, including the imposition of sanctions by Russia, could materially adversely affect our business, results of operations and financial condition" and "We have operations in Israel and therefore our results of operations may be adversely affected by political or economic instability or military operations in or around Israel."
Natural or man-made disasters, business interruptions and health epidemics could delay our ability to receive or ship our products or provide our services, or otherwise disrupt our business.
Our worldwide operations could be subject to earthquakes, power shortages, telecommunications failures, water shortages, tsunamis, floods, hurricanes, typhoons, fires, extreme weather conditions, health epidemics, and other natural or man-made disasters or business interruptions. The occurrence of any of these business disruptions could seriously harm our business, our revenue and financial condition, and increase our costs and expenses. If our or our manufacturers' facilities are damaged or destroyed, we would be unable to distribute our products or provide our services on a timely basis, which could harm our business. Our corporate headquarters, and a portion of our research and development activities, are located in California, and other critical business operations and some of our suppliers are located in California and Asia, near major earthquake faults. Certain key servers and information systems as well as a shared services center are located in Florida, which has in the past experienced major hurricanes and similar extreme weather. Any disruption of our operations in these areas could materially affect our operations and harm our business. In addition, we increasingly rely on our computer systems and servers to conduct our business. For example, much of our order fulfillment process is automated and the order information is stored on our servers. If our computer systems and servers are impaired or cease functioning, even for a short period, our ability to serve our customers and fulfill orders would be disrupted, our reputation could be damaged and our net revenues could be materially and adversely affected. Moreover, if our computer information systems or communication systems, or those of our vendors or customers, are subject to hacker attacks or other disruptions, our business could suffer. Although we have established and tested back-up systems and facilities to run our critical business operations in case of a business interruption, all of our systems and facilities are not yet fully redundant or fully tested. We are still in the process of formalizing a comprehensive disaster recovery plan and continue to rely on regional disaster recovery plans in some cases. In addition, our back-up operations may be inadequate under certain circumstances and our business interruption insurance may not be enough to compensate us for any losses that we may incur, which could adversely affect our business, results of operations and financial condition, as well as harm our reputation, and could cause our stock price to decline significantly.
40
Risks Related to Our Legal and Regulatory Environment
Our results of operations will suffer if we cannot comply with industry and government regulations and standards, or if changing standards do not continue to drive upgrade cycles.
Our system solutions must meet industry standards imposed by payment systems standards setting organizations such as EMVCo LLC, credit card associations such as Visa, MasterCard, and other credit card associations and standard setting organizations such as PCI SSC, Intermec and the U.K. Cards Association and other local organizations. New standards are continually being adopted or proposed as a result of worldwide anti-fraud initiatives, encryption of cardholder data, the increasing need for system compatibility and technology developments such as wireless and wireline IP communication. Our solutions also must comply with government regulations, including those imposed by telecommunications authorities and independent standards groups worldwide regarding emissions, radiation, and connections with telecommunications and radio networks, as well as data privacy laws and regulations which regulate the collection, compilation, aggregation, sharing or use of consumer information. We cannot be sure that we will be able to design our solutions to comply with future standards or regulations on a timely basis, if at all. Compliance with these standards could increase the cost of developing or producing our solutions. New products designed to meet any new standards need to be introduced to the market and ordinarily need to be certified by the credit card associations and our customers and, in some cases, local certification bodies, before being purchased. These certification processes are costly and time consuming and increase the amount of time it takes to introduce new products and sell our products. Our business has been in the past and continues to be adversely affected by our failure to timely obtain local certifications in some markets for certain of our products. Moreover, certain uses of our products may subject us to additional regulations and licensing requirements. For example, use of our products in taxis requires additional licensing and may subject us to certain taxi business regulations in the various jurisdictions we operate in. Various aspects of our services business also are or may be subject to additional regulations and licensing requirements as we expand into new areas. Our business, net revenues and financial condition could be adversely affected if we cannot comply with new or existing industry standards, or obtain or retain necessary regulatory approval or certifications in a timely fashion, or if compliance results in increasing costs of our products. Selling products that are non-compliant may result in fines against us or our customers, which we may be liable to pay. In addition, even if our products are designed to be compliant, compliance with certain security standards is determined based on the merchant's or service provider's network environment in which our systems are installed and, therefore, is dependent upon a number of additional factors such as proper installation of the components of the environment including our systems, compliance of software and system components provided by other vendors, implementation of compliant security processes and business practices and adherence to such processes and practices. Our business and financial condition, as well as our reputation and market share, could be adversely affected if we do not comply with new or existing industry standards and regulations, or obtain or retain necessary regulatory approval or certifications in a timely fashion, or if compliance results in increasing costs of our products.
On the other hand, our business also benefits from changes in industry standards and government regulations as well as technological changes, which are large drivers of customer upgrade cycles. For example, if EMV standards are required in the U.S., as currently anticipated, we expect that our business could benefit as customers move to upgrade their systems. Nevertheless, if these or other standards are not implemented on the timeline we expect, or at all, or if they are implemented but we cannot deliver products that comply with these standards in a timely manner or at all, our business will suffer. If customers do not continue to upgrade their terminals due to technological changes or changes in standards or government regulations, demand for our offerings could reach a saturation point, which would adversely affect our results of operations.
41
Changes in laws and regulations of privacy and protection of user data could adversely affect our business.
We are subject to data privacy and protection laws and regulations that apply to the collection, transmission, storage and use of proprietary information and personally-identifying information. The regulatory environment surrounding information security and data privacy varies from jurisdiction to jurisdiction and is constantly evolving and increasingly demanding. The restrictions imposed by such laws continue to develop and may require us to incur substantial costs, adopt additional compliance measures, such as notification requirements and corrective actions in the event of a security breach, and/or change our current or planned business models. For example, in the U.S., legislation is pending regarding restrictions on the use of geolocation information collected by mobile devices without consumer consent. If adopted, such legislation or any other restrictions imposed on use of location-based information or geolocation tracking could impact our implementation of mobile-based payments solutions that utilize such information or technology.
If our current security measures and data protection policies and controls are found to be non-compliant with relevant laws or regulations in any jurisdiction where we conduct business, we may be subject to penalties and fines, and may need to expend significant resources to implement additional data protection measures. In addition, we may be required to modify the features and functionality of our system solutions offerings in a way that is less attractive to customers.
We are party to a number of lawsuits and tax assessments and we may be named in additional litigation and assessments, all of which are likely to require significant management time and attention and expenses and may result in unfavorable outcomes that could have a material adverse effect on our business, financial condition, results of operations and cash flows.
We are currently a party in several litigation proceedings. If any of these proceedings are resolved adversely to us, this could have a material adverse effect on our business, financial condition, results of operations or cash flows. For example, in connection with the restatement of our historical interim financial statements during fiscal year 2007, a number of securities class action complaints were filed against us and certain of our officers, and purported derivative actions were also filed against certain of our current and former directors and officers. As described in Part I, Item 3, Legal Proceedings, of our Annual Report on Form 10-K for the fiscal year ended October 31, 2014, we settled with the plaintiffs in the securities class action case caption In re VeriFone Holdings, Inc. Securities Litigation for a total of $95.0 million. In fiscal year 2013, we recorded a total expense of $61.2 million for this securities class action, which represents the amount of the settlement that was not covered by insurance.
We are also subject to a number of pending tax assessment matters, particularly in Brazil where such assessments can be difficult to defend and result in substantial losses. Further, our operating results or financial condition may also be adversely impacted by claims or liabilities that we assume from an acquired company or that are otherwise related to an acquisition. For example, in connection with our acquisition of Hypercom, we have, except for certain matters related to the businesses divested by Hypercom, generally assumed all of Hypercom's litigation proceedings and tax assessments, and may also be liable for certain matters arising after closing of the Hypercom divestitures but related to pre-closing operations.
We also are subject to the risk of additional litigation and regulatory proceedings or actions in connection with the restatement of our financial statements. We have responded to inquiries and provided information and documents related to the restatement to the SEC, the U.S. Department of Justice, the New York Stock Exchange, and the Chicago Board Options Exchange. We were the subject of a Wells Notice from the SEC stating that the staff of the SEC's Division of Enforcement intends to recommend that the SEC bring a civil injunctive action against us, alleging violations of the federal securities laws arising from the restatement, which we settled in November 2009. Although we have settled this matter with the SEC, additional regulatory inquiries may also be commenced by other U.S. federal, state or foreign regulatory agencies. In addition, we may in the future be subject to additional litigation or other proceedings or actions arising in relation to the restatement of our historical interim financial statements.
Furthermore, we are, and in the future may be, involved in various litigation and regulatory matters, such as commercial disputes and labor and employment claims, that arise in the ordinary course of business.
42
Our insurance policies may not cover certain claims that are filed against us or may not be sufficient to cover all of our costs for defending such actions or paying any damages in the event of an unfavorable outcome. In addition, we may be obligated to indemnify (and advance legal expenses to) both current and former officers, employees and directors in connection with the securities class action and derivative action matters. Although we currently hold insurance policies for the benefit of our directors and officers, such insurance coverage may not be sufficient in some or all of these matters. Furthermore, our insurance carriers may seek to deny coverage in some or all of these matters, in which case we may have to fund the indemnification amounts owed to such directors and officers ourselves. Because we have a number of pending litigation matters, these amounts may be material.
The amount of time and resources required to resolve these lawsuits is unpredictable, and defending ourselves is likely to divert management's attention from the day-to-day operations of our business, which could adversely affect our business, financial condition, and results of operations. We have in the past incurred and expect to continue to incur significant expenses in connection with these matters. Many members of our senior management team and our Board of Directors have devoted and may be required to devote additional time to our pending litigation matters. Certain of these individuals are named defendants in the litigation related to the restatement actions. If our senior management is unable to devote sufficient time in the future to developing and pursuing our strategic business initiatives and running ongoing business operations, there may be a material adverse effect on our business, financial condition and results of operations.
The outcome of litigation and tax assessments is inherently difficult to predict. If any such litigation or tax assessment is resolved adversely to us (whether as a result of a court judgment or a decision by us to settle litigation to avoid the distraction, expense and inherent risks of continued litigation), this could have a material adverse effect on our business, financial condition, results of operations and cash flows. Furthermore, even when we are able to reasonably estimate the probable loss and thus record an accrual for such probable and reasonably estimable loss contingency, the accrual may change due to new developments or changes in our estimates or the amount of our liability could exceed the accrual. For a description of our material pending litigation, see Part I, Item 3, Legal Proceedings, of this Annual Report on Form 10-K.
Our business may suffer if we are sued for infringing the intellectual property rights of third parties, or if we are unable to obtain rights to third-party intellectual property on which we depend.
Third parties have in the past asserted and may in the future assert claims that our products and services infringe their proprietary rights. Such infringement claims, even if meritless, may cause us to incur significant costs in defending against or settling those claims, whether directly or as a result of indemnification obligations. We may be required to discontinue using and selling any infringing technology and services, to expend resources to develop non-infringing technology or to purchase licenses or pay royalties for other technology. Similarly, we depend on our ability to license intellectual property from third parties. The third parties from whom we license technology may become unwilling to license to us on acceptable terms intellectual property that is necessary to our business. In addition, we may be unable to acquire licenses for other technology necessary for our business on reasonable commercial terms or at all. As a result, we may be unable to continue to offer the solutions and services upon which our business depends.
43
We have received, and have currently pending, third-party infringement claims and may receive additional notices of claims of infringement in the future. As we expand into other payment technologies and as competition in this area increases, it is possible that the rate at which third parties bring claims will increase. Infringement claims may cause us to incur significant costs in defending against those claims or to settle claims to avoid costly or protracted litigation even if we believe those claims are without merit. For example, in March 2008, Cardsoft, Inc. and Cardsoft (Assignment for the Benefit of Creditors), LLC commenced an infringement action against us and others in the Eastern District of Texas, Marshall Division. In June 2012, a jury issued a verdict against us and awarded Cardsoft infringement damages and royalties of $15.4 million, and the District Court subsequently confirmed the jury's verdict in its judgment against us and also granted Cardsoft pre-judgment interest, post-judgment interest and certain costs. Infringement claims are expensive and time consuming to defend against, regardless of the merits or ultimate outcome. Although we believe Cardsoft's claims are without merit and have received a favorable ruling on appeal, we have had to expend substantial time and funds to defend these claims over several years, and have had to divert R&D personnel time to complete a redesign of products following the jury's finding of infringement. Similar claims may result in additional protracted and costly litigation. There can be no assurance that we will prevail in any such actions or that any license required under any such patent or other intellectual property would be made available on commercially acceptable terms, if at all. An unfavorable outcome in any such litigation could result in a significant judgment of damages against us, which could materially and adversely impact our operating results, financial condition and cash flows. See Note 12, Commitments and Contingencies, in the Notes to Consolidated Financial Statements of this Annual Report on Form 10-K.
Our proprietary technology is difficult to protect and unauthorized use of our proprietary technology by third parties may impair our ability to compete effectively.
We may not be able to protect our proprietary technology, which could enable competitors to develop services that compete with our own. We rely on patent, copyright, trademark, and trade secret laws, as well as confidentiality, licensing and other contractual arrangements to establish and protect the proprietary aspects of our solutions. Institution of legal proceedings to enforce our intellectual property rights could be costly and divert the efforts and attention of our management and technical personnel from other business operations. In addition, there can be no assurance that such proceedings would be determined in our favor. We do not have patent protection for certain important aspects of our current solutions. The laws of some countries in which we sell our solutions and services may not protect software and intellectual property rights to the same extent as the laws in the U.S. If we are unable to prevent misappropriation of our proprietary technology, competitors or others may be able to use and adapt such technology, which could diminish our competitive advantage and cause us to lose customers to competitors.
Our business and results of operations may be adversely affected if we do not comply with legal and regulatory requirements that apply to our products, including environmental laws and regulations that regulate substances contained in our products.
We may be subject to various other legal and regulatory requirements related to the manufacture and sale of our products, such as a European Union directive that places restrictions on the use of hazardous substances (RoHS and RoHS2) in electronic equipment, a European Union directive on WEEE, the European Union's REACH, and the environmental regulations promulgated by China RoHS. RoHS and RoHS2 sets a framework for producers' obligations in relation to manufacturing (including the amounts of named hazardous substances contained in products sold) and WEEE sets a framework for treatment, labeling, recovery, and recycling of electronic products in the European Union which may require us to alter the manufacturing of the physical devices that include our solutions and/or require active steps to promote recycling of materials and components. REACH imposes chemicals regulation and controls including requirements for registration of chemicals on the European Union market. In addition, similar legislation could be enacted in other jurisdictions, including in the U.S. where many states have already enacted state-level programs and requirements for recycling of certain electronic goods. In addition, climate change legislation in the U.S. is a significant topic of discussion and may generate federal or other regulatory responses in the near future. If we do not comply with environmental law and regulations, we may suffer a loss of revenue, be unable to sell in certain markets or countries, be subject to penalties and enforced fees, and/or suffer a competitive disadvantage. Customers may impose certain requirements or levels of compliance due to these regulations and programs that may increase our costs of doing business. Furthermore, the costs to comply with RoHS, RoHS2, WEEE, REACH and China RoHS, or with current and future environmental and worker health and safety laws may have a material adverse effect on our business, results of operations and financial condition.
44
In 2012, the SEC adopted rules pursuant to Section 1502 of the Dodd-Frank Wall Street Reform and Consumer Protection Act requiring disclosure of the use of certain minerals that are mined from the Democratic Republic of Congo and adjoining countries. We filed our most recent report under the disclosure requirement in June 2015 for the 2014 calendar year. Because our supply chain is complex, in preparation of such report, we were dependent on the implementation of diligence procedures we put in place to determine the sources of conflict minerals that may be used or are necessary to the production of our products and, if applicable, potential changes to products, processes or sources of supply in response to the findings resulting from such verification activities, as well as information provided by many of our suppliers. To the extent the information we received from our suppliers is inaccurate or inadequate or our processes in obtaining such information do not satisfy the SEC's diligence requirements, we may be unable to sufficiently verify the origins of conflict minerals used in our products and could face reputational risks. In addition, we have incurred and expect to continue to incur costs associated with complying with these disclosure requirements, including for conducting diligence procedures. Moreover, these rules could adversely affect the sourcing, supply and pricing of materials used in our products, particularly if the number of suppliers offering minerals identified as “conflict minerals” that are sourced from locations other than the Democratic Republic of Congo and adjoining countries is limited. We may also suffer reputational harm if we determine that certain of our products contain minerals not determined to be conflict-free yet are unable to alter our products, processes or sources of supply to avoid such materials.
Changes in our effective tax rate could adversely affect our results of operations.
Our effective tax rate could be adversely affected by a number of factors, including shifts in the mix of pretax profits and losses by tax jurisdiction, loss or cessation of tax holidays or other tax benefits, our ability to generate tax credits, our ability to utilize net operating loss carryforwards, the tax impact of nondeductible compensation, and changes in accounting rules, tax laws and regulations, and related interpretations, in the jurisdictions in which we operate. The U.S., countries in the European Union and other countries where we do business have been considering changes in tax laws applicable to multinational corporations. These potential changes in tax laws could have an adverse effect on our effective tax rate.
We are subject to ongoing tax audits in various jurisdictions. Although we regularly assess the likely outcomes of such audits in order to determine the appropriateness of our tax provision, such assessments involve significant judgment and there can be no assurance that we will accurately predict the outcomes of these audits, and the actual outcomes of these audits could have a material impact on our net income or financial condition. We have not provided for U.S. federal and state income taxes or foreign withholding taxes that may result from future remittances of undistributed earnings of our foreign subsidiaries. Any changes to these factors could have an adverse effect on our results of operations.
We have previously received tax benefits related to our operations in Israel and Singapore. Our subsidiary in Israel (formerly Lipman) previously received tax benefits under Israeli law for capital investments that were designated as “Approved Enterprises” through October 31, 2009. To the extent that these prior year earnings are distributed or deemed distributed, our Israeli subsidiary could be required to remit corporate income tax on these earnings at the applicable rate, between 12.5% and 36.25%. In addition, our subsidiary in Singapore previously received tax benefits under the Singapore Pioneer Tax Holiday provision (the “Tax Holiday”) which expired on October 31, 2012. Our effective tax rate could be adversely affected to the extent that tax authorities in Singapore challenge our Tax Holiday.
45
The value of our deferred tax assets may not be realizable to the extent our future profits are less than we have projected and we may be required to record valuation allowances against previously-booked deferred tax assets, which may have a material adverse effect on our results of operations and our financial condition.
Our income tax expense includes deferred income taxes arising from temporary differences between the financial reporting and tax bases of assets and liabilities, capital loss carry-forwards and net operating losses. We evaluate the realizability of our deferred income tax assets and assess the need for a valuation allowance on an ongoing basis. In evaluating our deferred income tax assets, we consider whether it is more likely than not that the deferred income tax assets will be realized. The ultimate realization of our deferred income tax assets depends upon generating sufficient future taxable income during the periods in which our temporary differences become deductible and before our capital loss carry-forwards and net operating losses expire. Our assessment of the realizability of our deferred income tax assets requires significant judgment. If we fail to achieve our projections or if we need to lower our projections, we may not have sufficient evidence of our ability to realize our deferred tax assets, and we may need to increase our valuation allowance. For example, for the fiscal year ended October 31, 2013 we recorded a $245.0 million valuation allowance against a significant portion of our deferred tax assets, primarily in the U.S., because our three year cumulative U.S. pretax losses raised uncertainty about the likelihood of realization of those deferred tax assets. For further information regarding this valuation allowance, see Note 6, Income Taxes, in the Notes to Consolidated Financial Statements of our Annual Report on Form 10-K for the fiscal year ended October 31, 2015. There is no assurance that we will not record a valuation allowance in future periods against previously-booked deferred tax assets. Any increase in the valuation allowance would result in additional income tax expense which could have a material adverse effect on our results of operations and financial condition.
Our internal processes and control over financial reporting have in prior periods been deemed inadequate.
In certain prior periods we reported material weaknesses in our internal control over financial reporting, which we have remedied. These material weaknesses in our internal control over financial reporting contributed to our need to restate previously reported interim financial information for each of the first three quarters of our fiscal year ended October 31, 2007, and to the delays in the filing of our Annual Report on Form 10-K for fiscal year 2007. We also were unable to file our quarterly reports on Form 10-Q for our fiscal quarters ended January 31, 2008 and April 30, 2008 on a timely basis.
Although we have implemented improved controls and remedied these material weaknesses, these controls may not be sufficient to detect or prevent errors in financial reporting in future periods and will require continued enhancement to accommodate our rapid growth in operations both organically and from acquisitions. We may hire additional employees and may also engage additional consultants in these and other key areas. Competition for qualified financial control and accounting professionals in the geographic areas in which we operate is intense and there can be no assurance that we will be able to hire and retain these individuals.
Our business could be adversely impacted if we have deficiencies in our disclosure controls and procedures or internal control over financial reporting.
The design and effectiveness of our disclosure controls and procedures and internal control over financial reporting may not prevent all errors, misstatements or misrepresentations. While management continually reviews the effectiveness of our disclosure controls and procedures and internal control over financial reporting, there can be no guarantee that our internal control over financial reporting will be effective in accomplishing all control objectives all of the time. Deficiencies, including any material weakness, in our internal control over financial reporting that may occur in the future could result in misstatements of our results of operations, restatements of our financial statements, a decline in the price of our securities, or otherwise materially adversely affect our business, reputation, results of operations, financial condition or liquidity.
46
Risks Related to Our Capital Structure
Our secured credit facility contains restrictive and financial covenants. If we are unable to comply with these covenants, we will be in default. A default could result in the acceleration of our outstanding indebtedness, which would have an adverse effect on our business and stock price.
We have senior secured credit facilities pursuant to a credit agreement as described in Note 10, Financings, in the Notes to Consolidated Financial Statements to this Annual Report on Form 10-K, with outstanding loan balances of $814.0 million as of October 31, 2015.
The 2011 Credit Agreement contains customary covenants that require maintenance of certain specified financial ratios and restricts the ability of certain of our subsidiaries to make certain distributions with respect to their capital stock, prepay other debt, encumber their assets, incur additional indebtedness, make capital expenditures above specified levels, engage in certain business combinations, or undertake various other corporate activities. Therefore, as a practical matter, these covenants restrict our ability to engage in or benefit from such activities. Further, VeriFone, Inc. must limit its leverage ratio and maintain its interest coverage ratio at or above specified thresholds. In addition, we have, in order to secure our repayment obligations under the 2011 Credit Agreement, pledged a substantial amount of our assets and properties. This pledge may reduce our operating flexibility because it restricts our ability to dispose of these secured assets or engage in other transactions that may be beneficial to us.
If we are unable to comply with the covenants in the 2011 Credit Agreement, we will be in default, which could result in the acceleration of our outstanding indebtedness. If acceleration occurs, we may not be able to repay our debt and we may not be able to borrow sufficient additional funds to refinance our debt. In addition, under the terms of the 2011 Credit Agreement, increases in our leverage ratio could result in increased interest rates and, therefore, higher debt service costs. If we were to default in performance under the 2011 Credit Agreement, we may pursue an amendment or waiver from our lenders, but there can be no assurance that the lenders would grant such an amendment or waiver and, in light of current credit market conditions, any such amendment or waiver requested is likely to be on terms, including additional fees, as well as increased interest rates and other more stringent terms and conditions that would be materially disadvantageous to us.
See Note 10, Financings, in the Notes to Consolidated Financial Statements of this Annual Report on Form 10-K for additional information regarding the 2011 Credit Agreement.
Our indebtedness and debt service obligations under our 2011 Credit Agreement are substantial and may adversely affect our cash flow, cash position, and stock price.
Our outstanding indebtedness and debt service obligations are substantial. As of October 31, 2015, we had total indebtedness outstanding of $814.0 million related to the 2011 Credit Agreement, payable in quarterly installments through July 8, 2021. Outstanding amounts may be subject to mandatory prepayment with the proceeds of certain asset sales and debt issuances and, for certain of the loan balances, from a portion of annual excess cash flows (as determined in the 2011 Credit Agreement) depending on our total net leverage ratio. See Note 10, Financings, in the Notes to Consolidated Financial Statements of our Annual Report on Form 10-K for the fiscal year ended October 31, 2015 for a schedule of the principal payments due under our financings.
47
We intend to fulfill our debt service obligations from existing cash and cash from operations. A substantial portion of our cash balances and cash generated from operations are held by our foreign subsidiaries. If we decide to distribute or use such cash and cash equivalents outside those foreign jurisdictions, including a distribution to the U.S. we may be subject to additional taxes or costs. In the future, if we are unable to generate or raise additional cash sufficient to meet our debt service obligations and need to use more of our existing cash than planned or to liquidate investments in order to fund these obligations, we may have to delay or curtail the development and/or the sales and marketing of new payment systems and reduce the amount of expected cash flow available for other purposes, including capital expenditures, investments, acquisitions and dividends. If we are unable to generate sufficient cash flows or other sources of liquidity to meet our debt service requirements, our lenders may declare a default on the 2011 Credit Agreement which could result in the termination of commitments under the 2011 Credit Agreement, the declaration that all outstanding loans are immediately due and payable in whole or in part, and the requirement of cash collateral deposits in respect of outstanding letters of credit.
Interest rates applicable to our debt are expected to fluctuate based on economic and market factors that are beyond our control. In particular, all of the outstanding debt under the 2011 Credit Agreement has a floating interest rate. Although we have entered into a swap arrangement that converts the floating interest rate to a fixed interest rate for a substantial portion of the principal amount under the 2011 Credit Agreement through March 2018, any significant increase in market interest rates, and in particular the short-term LIBOR rates, could result in a significant increase in interest expense on the portion of our debt not covered by such swap arrangement and during periods after the expiration of such swap arrangement, which could negatively impact our net income and cash flows.
Our indebtedness could have significant additional negative consequences, including, without limitation:
• | increasing our vulnerability to general adverse economic conditions; |
• | limiting our ability to obtain additional financing on acceptable terms; and |
• | placing us at a possible competitive disadvantage to less-leveraged competitors and competitors that have better access to capital resources. |
The conditions of the U.S. and international capital markets may have an adverse effect on other financial transactions.
Deterioration in the U.S. and international capital markets has in the past had an adverse effect on certain of our financial transactions. If financial institutions that have extended credit commitments to us, including under the 2011 Credit Agreement, or have entered into hedge, insurance or similar transactions with us, are adversely affected by the conditions of the U.S. and international capital markets, they may become unable to fund borrowings under their credit commitments to us or otherwise fulfill their obligations under the relevant transactions, which could have a material and adverse impact on our financial condition and our ability to borrow additional funds, if needed, for working capital, capital expenditures, acquisitions, and other corporate purposes.
48
Some provisions of our certificate of incorporation and bylaws may delay or prevent transactions that many stockholders may favor.
Some provisions of our certificate of incorporation and bylaws may have the effect of delaying, discouraging or preventing a merger or acquisition that our stockholders may consider favorable, including transactions in which stockholders might receive a premium for their shares. These provisions include:
• | authorization of the issuance of “blank check” preferred stock without the need for action by stockholders; |
• | the amendment of our organizational documents only by the affirmative vote of the holders of two-thirds of the shares of our capital stock entitled to vote at an election of directors; |
• | provision that any vacancy on the board of directors, however occurring, including a vacancy resulting from an enlargement of the board, may only be filled by vote of the directors then in office; |
• | inability of stockholders to call special meetings of stockholders; and |
• | advance notice requirements for board nominations and proposing matters to be acted on by stockholders at annual stockholder meetings. |
Our share price has been volatile and we expect that the price of our stock may continue to fluctuate substantially.
Our stock price has fluctuated substantially since our initial public offering in 2005, for example, due to the announcement of our restatement of certain financial statements in December 2007, during the recent turmoil in the worldwide financial markets, and due to the announcement of our preliminary results for the first fiscal quarter of 2013. In addition to fluctuations related to company-specific factors, broad market and industry factors may adversely affect the market price of our stock, regardless of our actual operating performance. Factors that could cause fluctuations in our stock price may include, among other things:
• | actual or anticipated variations in quarterly operating results; |
• | changes in our financial guidance or financial estimates by any securities analysts who might cover our stock, or our failure to meet our financial guidance or the estimates made by securities analysts; |
• | uncertainty about current global or regional economic conditions; |
• | changes in the market valuations of other companies operating in our industry; |
• | the rate at which we return capital to our shareholders; |
• | announcements by us or our competitors related to significant acquisitions, strategic partnerships, or divestitures; |
• | business disruptions, costs and future events related to shareholder activism; |
• | additions or departures of key personnel; and |
• | sales or purchases of our stock, including sales or purchases of our stock by our directors and officers or by significant stockholders. |
49
ITEM 1B. | UNRESOLVED STAFF COMMENTS |
None.
ITEM 2. PROPERTIES
Our headquarters are located in San Jose, California. We have material warehouse and distribution facilities located in the U.S., Brazil, France, and Australia.
In the U.S., we maintain material sales and administrative offices and research facilities in Clearwater, Florida; Rocklin, California; Alpharetta, Georgia; and Long Island City, New York. Outside the U.S., we maintain material sales and administrative offices and research facilities in Brazil, France, the United Kingdom, Israel, India, Singapore, Sweden, New Zealand, Denmark, the Philippines, China, Finland, Taiwan, Norway, Germany, Australia, and Poland. In addition to these material locations, we also have smaller offices globally.
We own the office buildings at two of our locations, while the rest of our locations are leased. We are using substantially all of our currently available productive space to develop, store, market, sell, and distribute our products and services. We believe our facilities are in good operating condition, suitable for their respective uses, and adequate for our current needs.
Approximate Square Footage | ||
Location | ||
North America | 538,710 | |
Latin America | 120,858 | |
EMEA | 568,663 | |
Asia-Pacific | 271,715 | |
Total | 1,499,946 | |
ITEM 3. LEGAL PROCEEDINGS
Information with respect to legal proceedings may be found in Note 12, Commitments and Contingencies, in the Notes to Consolidated Financial Statements of this Annual Report on Form 10-K, which section is incorporated herein by reference.
ITEM 4.MINE SAFETY DISCLOSURES
Not applicable.
50
PART II
ITEM 5. | MARKET FOR REGISTRANT’S COMMON EQUITY, RELATED STOCKHOLDER MATTERS AND ISSUER PURCHASES OF EQUITY SECURITIES |
Our common stock has been quoted on the New York Stock Exchange ("NYSE") under the symbol PAY since April 29, 2005. Prior to that time, there was no public market for our stock.
The following table sets forth for the indicated periods, the high and low sale prices of our common stock.
Fiscal Year 2015 Quarter Ended | Fiscal Year 2014 Quarter Ended | ||||||||||||||||||||||||||||||
Oct. 31 2015 | Jul. 31 2015 | Apr. 30 2015 | Jan. 31 2015 | Oct. 31 2014 | Jul. 31 2014 | Apr. 30 2014 | Jan. 31 2014 | ||||||||||||||||||||||||
High | $ | 33.34 | $ | 38.93 | $ | 36.51 | $ | 38.38 | $ | 37.53 | $ | 37.19 | $ | 34.85 | $ | 29.96 | |||||||||||||||
Low | $ | 26.20 | $ | 31.80 | $ | 31.38 | $ | 31.13 | $ | 29.16 | $ | 31.75 | $ | 27.77 | $ | 22.41 | |||||||||||||||
The closing sale price of our common stock on the NYSE was $28.68 and $30.14 on November 30, 2015 and October 31, 2015, respectively. As of November 30, 2015, there were 88 stockholders of record. Because many shares of our common stock are held by brokers and other institutions on behalf of stockholders, we are unable to estimate the total number of stockholders represented by these holders of record.
Dividend Policy
We have not declared or paid cash dividends on our capital stock since our common stock has been listed on the NYSE. We do not expect to pay any cash dividends for the foreseeable future. We currently intend to retain any future earnings to finance our operations, growth and stock repurchases, and to repay our debt. Any future determination to pay cash dividends will be at the discretion of our Board of Directors, and will be dependent on earnings, financial condition, operating results, capital requirements, any contractual restrictions, and other factors that our Board of Directors deems relevant. In addition, our amended and restated credit agreement contains limitations on the ability of our principal operating subsidiary, VeriFone, Inc., to declare and pay cash dividends. Because we conduct our business through our subsidiaries, as a practical matter these restrictions similarly limit our ability to pay dividends on our common stock.
51
Purchases of Equity Securities by the Issuer and Affiliated Purchasers
Share repurchase activity during the three months ended October 31, 2015 was as follows (in thousands, except number of shares and per share amounts):
Periods | Total Number of Shares Purchased | Average Price Paid per Share | Total Number of Shares Purchased as Part of Publicly Announced Plans or Programs | Approximate Dollar Value of Shares that May Yet be Purchased Under the Plans or Programs (1) | ||||||||||
August 1, 2015 to August 31, 2015: | ||||||||||||||
Open market and privately negotiated purchases | — | — | — | |||||||||||
September 1, 2015 to September 30, 2015: | ||||||||||||||
Open market and privately negotiated purchases | 882,385 | $ | 26.97 | 882,385 | ||||||||||
October 1, 2015 to October 31, 2015: | ||||||||||||||
Open market and privately negotiated purchases | 1,789,431 | $ | 29.50 | 1,789,431 | ||||||||||
Total | 2,671,816 | $ | 28.66 | 2,671,816 | $ | 123,422 | ||||||||
(1) | In September 2015, the Company’s Board of Directors authorized a program to repurchase up to $200.0 million of the Company's common stock, with no expiration from the date of authorization. Shares may be repurchased from time to time in the open market, private purchases, through forward, derivative, accelerated repurchase or automatic repurchase transactions or otherwise. Certain of our share repurchases have been and may from time to time be effected through Exchange Act Rule 10b5-1 repurchase plans. Under the Company's stock repurchase program, shares repurchased are recorded as an adjustment of par value and Accumulated Deficit. The timing and actual amount of the share repurchases will depend on several factors including price, capital availability, regulatory requirements, alternative investment opportunities, including mergers and acquisitions, market conditions and other factors. We are not obligated to repurchase any specific number of shares under the program and the repurchase program may be modified, suspended, or discontinued at any time. |
Securities Authorized for Issuance Under Equity Compensation Plans
Information with respect to Securities Authorized for Issuance Under Equity Compensation may be found in Item 12, Security Ownership of Certain Beneficial Owners and Management, and Related Stockholder Matters, of this Annual Report on Form 10-K, which section is incorporated herein by reference.
52
Performance Graph
The following graph and table compares the performance of an investment in our common stock over the period of November 1, 2010 through October 31, 2015, beginning with an investment at the closing market price on October 31, 2010, and thereafter, based on the closing price of our common stock on the market, with the S&P 500 Index and the S&P North American Technology Index ("SPGSTI"). The graph and table assume $100 was invested on the start date at the price indicated, and that dividends, if any, were reinvested on the date of payment without payment of any commissions. The performance shown in the graph and table represents past performance, and should not be considered an indication of future performance.
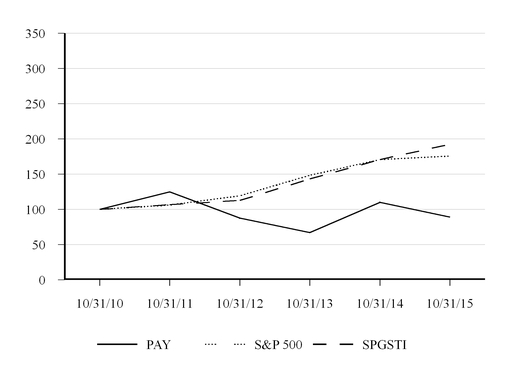
October 31, 2010 | October 31, 2011 | October 31, 2012 | October 31, 2013 | October 31, 2014 | October 31, 2015 | ||||||||||||||||||
VeriFone Systems, Inc. | $ | 100.00 | $ | 124.77 | $ | 87.61 | $ | 66.98 | $ | 110.14 | $ | 89.09 | |||||||||||
S&P 500 Index | $ | 100.00 | $ | 105.92 | $ | 119.34 | $ | 148.45 | $ | 170.55 | $ | 175.73 | |||||||||||
S&P North American Technology Index | $ | 100.00 | $ | 106.71 | $ | 112.68 | $ | 143.16 | $ | 170.68 | $ | 192.44 | |||||||||||
The information provided above under the heading “Performance Graph” shall not be considered “filed” for purposes of Section 18 of the Securities Exchange Act of 1934 or incorporated by reference in any filing under the Securities Act of 1933 or the Securities Exchange Act of 1934.
53
ITEM 6. | SELECTED FINANCIAL DATA |
The following selected consolidated financial data should be read in conjunction with our Consolidated Financial Statements and the accompanying notes appearing in Item 8, Financial Statements and Supplementary Data, and Item 7, Management’s Discussion and Analysis of Financial Condition and Results of Operations, included elsewhere in this Annual Report on Form 10-K. The selected data in this section is not intended to replace our Consolidated Statements of Operations and Consolidated Balance Sheets.
Years Ended October 31, | |||||||||||||||||||
2015 (1)(2) | 2014 (1)(3)(4) | 2013 (5)(6) | 2012 (7) | 2011 (8) | |||||||||||||||
(In thousands, except per share data) | |||||||||||||||||||
Consolidated Statements of Operations Data: | |||||||||||||||||||
Net revenues | $ | 2,000,457 | $ | 1,868,874 | $ | 1,702,221 | $ | 1,865,971 | $ | 1,303,866 | |||||||||
Operating income (loss) | $ | 106,991 | $ | 5,885 | $ | (66,354 | ) | $ | 147,545 | $ | 105,710 | ||||||||
Net income (loss) attributable to VeriFone Systems, Inc. stockholders | $ | 79,097 | $ | (38,130 | ) | $ | (296,055 | ) | $ | 65,033 | $ | 282,404 | |||||||
Net income (loss) per share attributable to VeriFone Systems, Inc. stockholders: | |||||||||||||||||||
Basic | $ | 0.69 | $ | (0.34 | ) | $ | (2.73 | ) | $ | 0.61 | $ | 3.06 | |||||||
Diluted | $ | 0.68 | $ | (0.34 | ) | $ | (2.73 | ) | $ | 0.59 | $ | 2.92 | |||||||
As of October 31, | |||||||||||||||||||
2015 (2) | 2014 (4)(5) | 2013 (6) | 2012 (7) | 2011 (8) | |||||||||||||||
(In thousands) | |||||||||||||||||||
Consolidated Balance Sheets Data: | |||||||||||||||||||
Cash and cash equivalents | $ | 208,870 | $ | 250,187 | $ | 268,220 | $ | 454,072 | $ | 594,562 | |||||||||
Total assets | $ | 2,473,062 | $ | 2,681,514 | $ | 2,965,295 | $ | 3,444,638 | $ | 2,307,404 | |||||||||
Current and long-term debt and capital leases | $ | 799,329 | $ | 868,415 | $ | 1,011,756 | $ | 1,275,720 | $ | 481,062 | |||||||||
(1) | In fiscal year 2015 and 2014 we recorded $8.8 million and $18.1 million restructuring charges, respectively, as part of cost optimization and corporate transformation initiatives. For further information, see Note 11, Restructurings, in the Notes to Consolidated Financial Statements of this Annual Report on Form 10-K. |
(2) | In fiscal year 2015 we recorded a $16.1 million tax benefit as a result of releasing a portion of our valuation allowance against certain non-U.S. foreign deferred tax assets. For further information, see Note 6, Income Taxes, in the Notes to Consolidated Financial Statements of this Annual Report on Form 10-K. |
(3) | In fiscal year 2014 we released a $19.9 million litigation loss contingency expense, plus estimated potential ongoing royalties and interest, related to a favorable ruling in a patent infringement litigation captioned Cardsoft, Inc. and Cardsoft (Assignment for the Benefit of Creditors), LLC v. VeriFone Holdings, Inc. et al. For further information, see Note 12, Commitments and Contingencies, in the Notes to Consolidated Financial Statements of this Annual Report on Form 10-K. |
(4) | In fiscal year 2014 we made early payments against, and then amended and restated the 2011 Credit Agreement. As part of the amendment and restatement, amounts borrowed, together with cash on hand, were used to repay the $938.6 million outstanding balance on the credit agreement as well as the costs associated with the amendment and restatement. In connection with these transactions we expensed $4.1 million of debt amendment costs and accelerated $5.2 million of interest expense on previously capitalized debt issuance costs associated with extinguished debt. For further information, see Note 10, Financings, in the Notes to Consolidated Financial Statements of this Annual Report on Form 10-K. |
54
(5) | In fiscal year 2013 we recorded a $64.4 million litigation loss contingency expense primarily related to the then pending securities class action captioned, In re VeriFone Holdings, Inc. Securities Litigation, and the related Israel class action. In fiscal year 2014 we paid $61.2 million into an escrow account to fund the uninsured portion of the settlement in this securities class action. For further information, see Note 12, Commitments and Contingencies, in the Notes to Consolidated Financial Statements of this Annual Report on Form 10-K. |
(6) | In fiscal year 2013 we recorded a $245.0 million valuation allowance against a significant portion of our deferred tax assets. For further information, see Note 6, Income Taxes, in the Notes to Consolidated Financial Statements of this Annual Report on Form 10-K. |
(7) | In fiscal year 2012 we entered into the 2011 Credit Agreement and borrowed $1.45 billion. The proceeds were used to acquire Point for $1.02 billion and, along with the available cash, pay off $496.0 million of prior debt. |
(8) | In fiscal year 2011 we recorded a $210.5 million tax benefit as a result of recognizing a portion of our deferred tax assets in the United States. |
55
ITEM 7. | MANAGEMENT’S DISCUSSION AND ANALYSIS OF FINANCIAL CONDITION AND RESULTS OF OPERATIONS |
This section and other parts of this Annual Report on Form 10-K and certain information incorporated by reference herein contain forward-looking statements that involve risks and uncertainties. In some cases, forward-looking statements can be identified by words such as "may," "should, "expect," "plan," "intend," "anticipate," "believe," "estimate," "predict," "potential," or "continue," the negative of such terms, or comparable terminology. Such forward-looking statements are based on current expectations, estimates, and projections about our industry, and management's beliefs and assumptions, and do not reflect the potential impact of any mergers, acquisitions, or other business combinations or divestitures that have not been completed. Forward-looking statements are not guarantees of future performance, and our actual results may differ materially from the results expressed or implied in the forward-looking statements. Factors that might cause such differences include, but are not limited to, those discussed in Item 1A, Risk Factors, and elsewhere in this report, including our disclosures of Critical Accounting Policies and Estimates in Item 7, our disclosures in Item 7A, Quantitative and Qualitative Disclosures About Market Risk, as well as in our Consolidated Financial Statements and accompanying notes included elsewhere in this Form 10-K. We are under no duty to update any of the forward-looking statements after the date of this Annual Report on Form 10-K to conform such statements to actual results or to changes in expectations. We assume no obligation to revise or update any forward-looking statements for any reason, except as required by law.
Our Management's Discussion and Analysis of Financial Condition and Results of Operations is provided in addition to our Consolidated Financial Statements and accompanying notes to assist readers in understanding our results of operations, financial condition, and cash flows. This section is organized as follows:
Overview: Discussion of our business and overall financial results, and other highlights related to our results of operations for the periods presented.
Results of Operations:
• | Consolidated Results of Operations: An analysis and discussion of our financial results comparing our consolidated results of operations for the fiscal year ended October 31, 2015 to the fiscal year ended October 31, 2014, and the fiscal year ended October 31, 2014 to the fiscal year ended October 31, 2013. |
• | Segment Results of Operations: An analysis and discussion of our financial results comparing the results of operations for each of our four reportable segments, North America, Latin America, EMEA, and Asia-Pacific, for the fiscal year ended October 31, 2015 to the fiscal year ended October 31, 2014, and the fiscal year ended October 31, 2014 to the fiscal year ended October 31, 2013. |
Financial Outlook: A discussion of our expectations regarding certain trends that may affect our financial condition and results of operations.
Liquidity and Capital Resources: An analysis of changes in our balance sheets and cash flows, and discussion of our financial condition and potential sources of liquidity.
Contractual Obligations and Off-Balance Sheet Arrangements: Disclosures related to our contractual obligations, contingent liabilities, commitments, and off-balance-sheet arrangements, as of October 31, 2015.
Critical Accounting Policies and Estimates: A discussion of the accounting policies and estimates that we believe are most important to understanding the assumptions and judgments incorporated in our reported financial results and forecasts, as well as recent accounting pronouncements that have had or are expected to have a material impact on our results of operations.
56
Overview
Our Business
We are a global leader in secure electronic payment solutions at the point of sale (“POS”). We provide expertise, solutions and services that add value at the POS and enable innovative forms of commerce. For over 30 years, we have been a leader in designing, manufacturing, marketing and supplying a broad range of innovative payment solutions and complementary services that enable secure electronic payment transactions and value-added services at the POS. We focus on delivering increasingly innovative POS payment capabilities, value-added services that increase merchant revenues and enhance the consumer experience and solutions that enrich the interaction between merchants and consumers. Key industries in which we operate include financial services, retail, petroleum, restaurant, hospitality, taxi, transportation, and healthcare.
We operate in four business segments: North America, Latin America, EMEA, and Asia-Pacific. Our North America segment includes our operations in the U.S. and Canada. Our Latin America segment includes our operations in South America, Central America, Mexico, and the Caribbean. Our EMEA segment includes our operations in Europe, Russia, the Middle East, and Africa. Our Asia-Pacific segment includes our operations in Australia, New Zealand, China, India, and throughout the rest of Greater Asia, including other Asia-Pacific Rim countries. We determine our operating segments based on the discrete financial information used by our Chief Executive Officer, who is our chief operating decision maker, to assess performance, allocate resources, and make decisions regarding VeriFone's operations. As a result of new Company leadership and related changes in the structure of our internal organization during July 2015, we realigned our operating segments in fiscal year 2015. All prior period amounts reported by segment have been reclassified to conform to the current presentation. Our Chief Executive Officer is evaluating using global product line financial information to manage the business in the future. If our Chief Executive Officer is provided different financial information to assess performance, allocate resources and make decisions regarding VeriFone's operations, we will reassess our operating segment presentation.
The markets in which we operate are highly competitive. We compete based on various factors, including product functions and features, pricing, product quality and reliability, design innovation, interoperability with third-party systems and brand reputation. We also compete based on product availability and certifications, as well as service offerings and support. We continue to experience intense competition in all of our operating segments from traditional POS terminal providers and we also see new companies entering our markets, including entrants offering various forms of mobile device based payment options. In certain markets, such as China and Brazil, we see customers requiring a choice of offerings for a lower cost. This trend has increased competition and pricing pressures. Our competitors are introducing increasingly aggressive pricing in these markets and clients are relying more on pricing for their purchase decisions.
Our Sources of Revenue
Sales of our point of sale electronic payment devices and systems continue to be a significant source of revenues. These system solutions consist of point of sale electronic payment devices that run our unique operating systems, security and encryption software, and certified payment software, and that are designed to suit our clients' needs in a variety of environments, including traditional multilane and countertop implementations, self-service and unattended environments, in-vehicle and portable deployments, as well as mobile commerce. Our system solutions can securely process a wide range of payment types including signature and PIN-based debit cards, credit cards, NFC/contactless/radio frequency identification cards, or RFID cards, smart cards, pre-paid gift and other stored-value cards, electronic bill payment, signature capture and electronic benefits transfer, or EBT. Our unique architecture enables multiple value-added applications, including third-party applications, such as gift card and loyalty card programs, healthcare insurance eligibility, and time and attendance tracking, and allows these applications to reside on the same system without requiring recertification upon the addition of new applications. With our newest line of Verifone Engage payment solutions, we will be able to deliver richer media and more complex commerce enablement services on our payment terminals to our merchant clients. Security continues to be an important factor for our clients and we have experienced increasing demand for Europay, MasterCard and Visa, or "EMV", capable terminal solutions.
57
We continue to invest in developing a broad portfolio of service solutions complementary to our systems solutions and designed to meet a wide range of merchant and partner needs, including removing complexity from payments, increasing ease of use, adding value by enriching the consumer experience at the POS and helping our clients grow their businesses and strengthen their relationships with consumers. Services are an important part of our business and revenues, accounting for approximately 34.5% of our total net revenues in the fiscal year ended October 31, 2015. Our service offerings include our Payment-as-a-Service solutions, managed services and terminal management solutions, payment-enabled media, in-taxi payment solutions, security solutions, and other value-added services at the point of sale. We also offer a host of support services, including software development, installation and deployment, warranty, post-sale support, repairs, and training.
Timing of Revenue
The timing of our customer orders may cause our revenue to vary from period to period. Specifically, revenues recognized in our fiscal quarters can vary significantly when larger customers or our distributors delay orders due to regulatory and industry standards compliance, budget considerations, product feature availability, dual vendor sourcing requirements, technology refresh cycles, economic conditions or other concerns that impact their business or purchasing decisions. For example, the timing of customer orders is often impacted by the timing of technology refreshes or the timing of completed product certifications by a particular customer or in a particular market. Customer purchases have also been impacted by regulatory factors such as new or pending banking regulations and government initiatives to drive cashless transactions.
In addition, revenues can be back-end weighted when we receive sales orders and deliver a higher proportion of our System solutions toward the end of our fiscal quarters. This variability and back-end weighting of orders may adversely affect our results of operations in a number of ways, and could negatively impact revenues and profits. First, the product mix of orders may not align with manufacturing forecasts, which could result in a shortage of the components needed for production. Second, existing manufacturing capacity may not be sufficient to deliver the desired volume of orders in a concentrated time when they are received. Third, back-end weighted demand could negatively impact gross margins through higher labor, delivery, and other manufacturing and distribution costs. If, on the other hand, we were to seek to manage the fulfillment of back-end weighted orders through holding increased inventory levels, we would risk higher inventory obsolescence charges if our sales fall short of our expectations.
Because our revenue recognition depends on, among other things, the timing of product shipments, decisions we make about product shipments, particularly toward the end of a fiscal quarter, may impact our reported revenues. The timing of product shipments may depend on a number of factors, including costs of air shipments if required, the delivery date requested by customers, and our operating capacity to fill orders and ship products, as well as our own long and short-term business planning and supply chain management. These factors may affect timing of shipments and consequently revenues recognized for a particular period.
Significant Matters
Transformation Initiatives
During December 2013 we launched a transformation program that focuses on three initiatives: portfolio management, research and development re-engineering, and cost optimization. Savings from the cost optimization initiatives are being re-invested in the company as we focus on our future product road map and efforts to improve product quality and time-to-market. As part of this transformation program, our management has approved restructuring plans reducing headcount and consolidating facilities and data centers, that we expect to cost over $30.0 million.
Restructuring expense since these plans were approved total $27.5 million, of which $8.8 million was incurred during the fiscal year 2015. We expect to incur approximately $5.0 million of restructuring charges during fiscal year 2016 as a result of these plans. See Note 11, Restructurings, in the Notes to Consolidated Financial Statements of this Annual Report on Form 10-K for further information on these restructuring plans.
58
Stock Repurchase Program
In September 2015, our Board of Directors authorized a program to repurchase shares of our common stock with an aggregate value of up to $200.0 million, with no expiration from the date of authorization. During fiscal year ended 2015, we repurchased 2.7 million shares of our common stock on the open market at an average repurchased price of $28.66 per share, and as of October 31, 2015, there was approximately $123.4 million remaining available for stock repurchases.
Pursuant to this program, shares may be repurchased from time to time in the open market, private purchases, through forward, derivative, accelerated repurchase or automatic repurchase transactions or otherwise. The timing and actual amount of the share repurchases will depend on several factors including price, capital availability, regulatory requirements, alternative investment opportunities, including mergers and acquisitions, market conditions and other factors. We are not obligated to repurchase any specific number of shares under the program and the repurchase program may be modified, suspended or discontinued at any time. See Purchases of Equity Securities by the Issuer and Affiliated Purchasers in Item 5 of this Annual Report on Form 10-K and Note 5, Stock Repurchase Program, in the Notes to Consolidated Financial Statements of this Annual Report on Form 10-K for additional information regarding this stock repurchase program.
Business Combinations
During fiscal year 2015, we completed five business combinations for consideration totaling $29.6 million, including $22.1 million of cash paid on the acquisition dates, $5.7 million in future consideration and contingent consideration with a fair value of $1.8 million at the acquisition dates. During fiscal year 2014, we completed one business combination for contingent consideration with an $11.6 million fair value at the acquisition date. Each acquisition was accounted for using the acquisition method of accounting, and was included in our Results of Operations from the respective acquisition dates. These acquisitions were completed to augment our existing service offerings. Revenues from these acquisitions were not material.
During November 2015, we entered into an agreement to acquire InterCard AG, a leading Payment-as-a-Service provider in Germany, for consideration totaling 85.0 million Euro (approximately $92.4 million at the foreign exchange rate as of November 6, 2015). This acquisition will expand our Payment-as-a-Service solutions in Europe. We expect this transaction to close during the first quarter of fiscal year 2016. See Note 14, Subsequent Events, in the Notes to Consolidated Financial Statements of this Annual Report on Form 10-K for additional information regarding the acquisition.
59
Financial Results Highlights
Overall
• | Our consolidated total net revenues for the fiscal year ended October 31, 2015 were $2.0 billion, compared to $1.9 billion for the fiscal year ended October 31, 2014, up 7.0% year over year. |
• | Our consolidated total net revenues for the fiscal year ended October 31, 2015 reflected a $161.6 million unfavorable foreign currency impact compared to the fiscal year ended October 31, 2014. |
• | Operating income for the fiscal year ended October 31, 2015 was $107.0 million compared to $5.9 million for the fiscal year ended October 31, 2014. |
• | Net cash provided by operating activities for the fiscal year ended October 31, 2015 totaled $249.3 million. |
Segment Revenues
The following chart summarizes our total net revenues by segment for the fiscal years 2015, 2014, and 2013 (in millions), as well as our System solutions and Services net revenues in each segment as a percentage of total net revenues for that segment in each period:
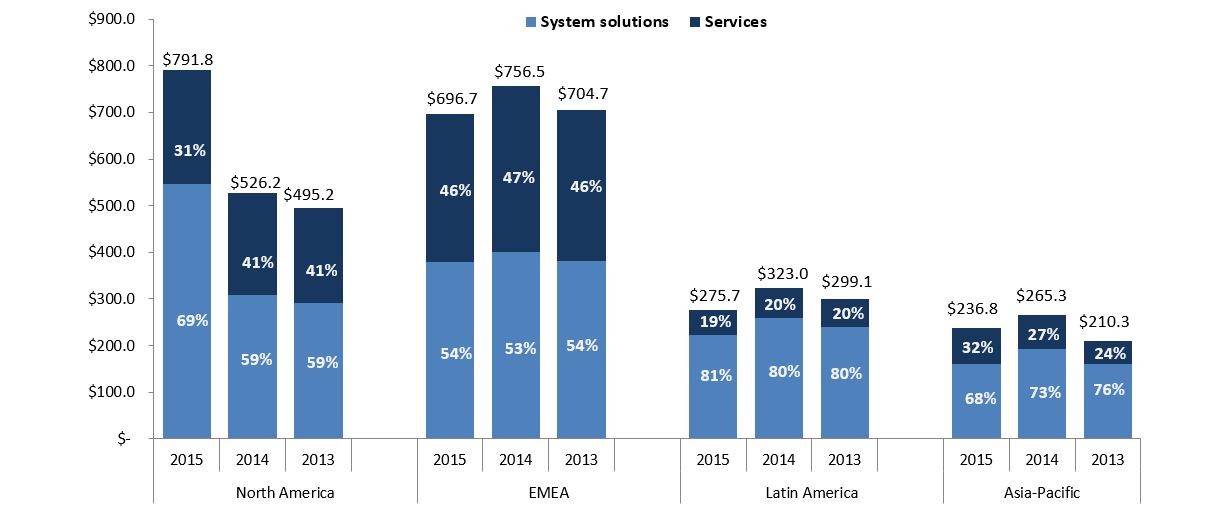
60
Consolidated Results of Operations
Years Ended October 31, | |||||||||||||||||
2015 | % of Net revenues (1) | 2014 | % of Net revenues (1) | 2013 | % of Net revenues (1) | ||||||||||||
(in thousands, except percentages) | |||||||||||||||||
Net revenues: | |||||||||||||||||
System solutions | $ | 1,309,628 | 65.5% | $ | 1,162,226 | 62.2% | $ | 1,068,444 | 62.8% | ||||||||
Services | 690,829 | 34.5% | 706,648 | 37.8% | 633,777 | 37.2% | |||||||||||
Total net revenues | 2,000,457 | 100.0% | 1,868,874 | 100.0% | 1,702,221 | 100.0% | |||||||||||
Gross margin: | |||||||||||||||||
System solutions | 535,812 | 40.9% | 429,183 | 36.9% | 373,185 | 34.9% | |||||||||||
Services | 290,171 | 42.0% | 295,534 | 41.8% | 272,004 | 42.9% | |||||||||||
Total gross margin | 825,983 | 41.3% | 724,717 | 38.8% | 645,189 | 37.9% | |||||||||||
Operating expenses: | |||||||||||||||||
Research and development | 201,630 | 10.1% | 203,737 | 10.9% | 173,318 | 10.2% | |||||||||||
Sales and marketing | 227,470 | 11.4% | 217,453 | 11.6% | 196,594 | 11.5% | |||||||||||
General and administrative | 206,187 | 10.3% | 208,694 | 11.2% | 181,100 | 10.6% | |||||||||||
Litigation settlement and loss contingency expense (benefit) | 1,213 | 0.1% | (8,632 | ) | (0.5)% | 64,371 | 3.8% | ||||||||||
Amortization of purchased intangible assets | 82,492 | 4.1% | 97,580 | 5.2% | 96,160 | 5.6% | |||||||||||
Total operating expenses | 718,992 | 35.9% | 718,832 | 38.5% | 711,543 | 41.8% | |||||||||||
Operating income (loss) | 106,991 | 5.3% | 5,885 | 0.3% | (66,354 | ) | (3.9)% | ||||||||||
Interest expense, net | (31,455 | ) | (1.6)% | (42,472 | ) | (2.3)% | (44,344 | ) | (2.6)% | ||||||||
Other income (expense), net | (2,588 | ) | (0.1)% | (3,297 | ) | (0.2)% | 3,740 | 0.2% | |||||||||
Income (loss) before income taxes | 72,948 | 3.6% | (39,884 | ) | (2.1)% | (106,958 | ) | (6.3)% | |||||||||
Income tax provision (benefit) | (7,409 | ) | (0.4)% | (3,442 | ) | (0.2)% | 188,043 | 11.0% | |||||||||
Consolidated net income (loss) | $ | 80,357 | 4.0% | $ | (36,442 | ) | (1.9)% | $ | (295,001 | ) | (17.3)% | ||||||
(1) System solutions and Services gross margin as a percentage of total net revenues is computed as a percentage of the corresponding System solutions and Services net revenues.
Fiscal Year 2015 compared to Fiscal Year 2014
System solutions net revenues for the fiscal year ended October 31, 2015 were $1.31 billion, compared to $1.16 billion for the fiscal year ended October 31, 2014, up $147.4 million or 12.7%, primarily as a result of increased System solutions net revenues in our North America segment, driven by increased demand for EMV capable products and market share gains due to new product releases. These increases were partially offset by a decrease in System solutions net revenues in our Latin America, EMEA and Asia-Pacific segments due to unfavorable foreign currency impact, as well as continued pricing pressures and increased competition. During the fiscal year ended October 31, 2015, System solutions net revenues declined due to an $86.0 million unfavorable impact from foreign currency fluctuations. See further discussions under Segment Results of Operations below.
Services net revenues for the fiscal year ended October 31, 2015 were $690.8 million, compared to $706.6 million for the fiscal year ended October 31, 2014, down $15.8 million or 2.2%, due primarily to a $75.6 million unfavorable impact from foreign currency fluctuations, which was partially offset by increased Services net revenues associated with increased System solutions net revenues. Geographically, the change is primarily due to a decrease in EMEA and Latin America Services net revenues, which was partially offset by increases in Services net revenues in North America and Asia-Pacific. See further discussion under Segment Results of Operations below.
61
Total gross margin for the fiscal year ended October 31, 2015 was $826.0 million or 41.3% of total net revenues, compared to $724.7 million, or 38.8% of total net revenues, for the fiscal year ended October 31, 2014, up $101.3 million or 2.5 percentage points. Gross margin in dollars increased due primarily to the increase in North America total net revenues and cost reductions as a result of our transformation initiatives, partially offset by an unfavorable impact from foreign currency fluctuations in other geographies. Gross margin as a percentage of total net revenues increased due primarily to changes in product and geographic mix, offset by pricing pressures in Asia-Pacific and, to some extent, in EMEA. Our System solutions cost of net revenues is primarily denominated in U.S dollars.
Research and development for the fiscal year ended October 31, 2015 was $201.6 million compared to $203.7 million for the fiscal year ended October 31, 2014, down $2.1 million or 1.0%, due primarily to a $10.4 million reduction in personnel related costs as a result of our transformation initiatives, partially offset by a $7.2 million increase in outside contractor costs. Outside contractor costs increased due to our investment in additional specialized resources to focus on global platform development efforts and shortening our product development life-cycle and time to market.
Sales and marketing for the fiscal year ended October 31, 2015 was $227.5 million, compared to $217.5 million for the fiscal year ended October 31, 2014, up $10.0 million or 4.6%, due primarily to variable personnel related costs associated with increased revenue.
General and administrative for the fiscal year ended October 31, 2015 was $206.2 million compared to $208.7 million for the fiscal year ended October 31, 2014, down $2.5 million or 1.2%, due primarily to additional restructuring and debt amendment costs incurred during the fiscal year ended October 31, 2014 that did not recur.
Amortization of purchased intangible assets for the fiscal year ended October 31, 2015 was $82.5 million compared to $97.6 million for the fiscal year ended October 31, 2014, down $15.1 million or 15.5%, due primarily to the devaluation of Swedish krona, the Euro, and Danish krone against the U.S. dollar year over year.
Interest expense, net for the fiscal year ended October 31, 2015 was $31.5 million compared to $42.5 million for the fiscal year ended October 31, 2014, down $11.0 million or 25.9%, due primarily to lower loan balances and lower interest rates on our debt during the fiscal year ended October 31, 2015 and accelerated amortization of debt issuance costs as a result of the amendment and restatement of the 2011 Credit Agreement during the fiscal year ended October 31, 2014 that did not recur.
Income tax provision (benefit) for the fiscal year ended October 31, 2015 was a $7.4 million benefit, compared to a $3.4 million income tax benefit for the fiscal year ended October 31, 2014, a $4.0 million change. The income tax benefit for the fiscal year ended October 31, 2015 was due primarily to a change in our valuation allowance assessment against certain non-U.S. deferred tax assets offset by foreign taxes. The tax benefit for the fiscal year ended October 31, 2014 was primarily related to tax benefits from statutory tax rate changes in certain foreign countries, and decreases in prior year unrecognized tax benefits.
62
Fiscal Year 2014 compared to Fiscal Year 2013
System solutions net revenues for the fiscal year ended October 31, 2014 were $1.16 billion, compared to $1.07 billion for the fiscal year ended October 31, 2013, up $93.8 million or 8.8%, due to increases in all our segments primarily driven by timing of customer purchase decisions, technology refreshes by some of our large customers and government sponsored initiatives to expand cashless payments in some regions. System solutions net revenues increased by $37.0 million in our North America and Latin America segments, $20.5 million in EMEA, and $33.5 million in Asia-Pacific. See further discussion under Segment Results of Operations below.
Services net revenues for the fiscal year ended October 31, 2014 were $706.6 million, compared to $633.8 million for the fiscal year ended October 31, 2013, up $72.9 million or 11.5%, primarily as a result of growth in Services net revenues in all of our segments as discussed further under Segment Results of Operations below. Of this increase, $24.0 million was due to our fiscal year 2013 acquisitions.
Total gross margin for the fiscal year ended October 31, 2014 was $724.7 million, or 38.8% of total net revenues, compared to $645.2 million, or 37.9% of total net revenues, for the fiscal year ended October 31, 2013, up $79.5 million or 0.9 percentage point. Gross margin in dollars increased primarily due to the increase in total net revenues. In addition, gross margin in dollars increased in fiscal year 2014 due to a $14.7 million decrease in costs for obsolete inventory, scrap, and purchase commitments for excess components at contract manufacturers. Gross margin in percentage of total net revenues increased primarily due to changes in customer and product mix, partially offset by pricing pressures.
Research and development for the fiscal year ended October 31, 2014 was $203.7 million compared to $173.3 million for the fiscal year ended October 31, 2013, up $30.4 million or 17.6%, primarily due to an increase in personnel and outside contractor expense as we increased investment in corporate research and development, including re-investment of savings from transformation initiatives, as we continued to focus on our future product road map, platform development efforts and shortening of our product development life-cycle and time to market. The increase includes a $5.6 million increase in restructuring expense.
Sales and marketing for the fiscal year ended October 31, 2014 was $217.5 million, compared to $196.6 million for the fiscal year ended October 31, 2013, up $20.9 million or 10.6%, primarily due to additional investment in resources associated with the expansion of our Services offerings into new geographies and enhanced client service. The increase includes restructuring expense totaling $4.7 million.
General and administrative for the fiscal year ended October 31, 2014 was $208.7 million compared to $181.1 million for the fiscal year ended October 31, 2013, up $27.6 million or 15.2%, primarily due to costs of our transformation initiatives. The increase includes $11.2 million of increased professional service fees, a $7.3 million increase in personnel related expenses, a $4.7 million of restructuring expense, and a $3.6 million increase in debt amendment costs.
Litigation settlement and loss contingency expense (benefit) for the fiscal year ended October 31, 2014 was a benefit of $8.6 million due to the $17.6 million litigation loss contingency benefit related to a favorable ruling in a patent infringement litigation captioned Cardsoft, Inc. and Cardsoft (Assignment for the Benefit of Creditors), LLC v. VeriFone Holdings, Inc. et al. during October 2014, which was partially offset by a $9.0 million accrual related to the settlement in the then pending action captioned, Creative Mobile Technologies, LLC v. VeriFone Systems, Inc. et al. during April 2014. Litigation settlement and loss contingency expense for the fiscal year ended October 31, 2013 was $64.4 million primarily due to the net accruals related to the then pending securities class action captioned, In re VeriFone Holdings, Inc. Securities Litigation, and the related Israel class action. See Note 12, Commitments and Contingencies, in the Notes to Consolidated Financial Statements of this Annual Report on Form 10-K for disclosures related to our legal proceedings.
Amortization of purchased intangible assets for the fiscal year ended October 31, 2014 was $97.6 million compared to $96.2 million for the fiscal year ended October 31, 2013, up only $1.4 million or 1.5%, primarily because we did not enter into significant new acquisitions in fiscal year 2014 or 2013.
63
Interest, net for the fiscal year ended October 31, 2014 was $42.5 million compared to $44.3 million for the fiscal year ended October 31, 2013, down $1.9 million or 4.2%, primarily due to a reduction in interest expense due to lower loan balances and lower interest rates during fiscal year 2014, which was partially offset by $5.2 million of accelerated amortization of debt issuance costs related to the amendment and restatement of the 2011 Credit Agreement.
Other income (expense), net for the fiscal year ended October 31, 2014 was a net other expense of $3.3 million compared to a net other income of $3.7 million for the fiscal year ended October 31, 2013, a change of $7.0 million. The Other expense, net, incurred during the fiscal year ended October 31, 2014 is primarily related to accruals associated with certain Brazilian federal tax assessments that we enrolled in the Brazilian Federal Tax Amnesty Program during December 2013. See further discussion in Note 12, Commitments and Contingencies, in the Notes to Consolidated Financial Statements of this Annual Report on Form 10-K. The Other income, net, during the fiscal year ended October 31, 2013 is primarily related to the gain on the divestiture of certain assets and business operations related to our SAIL mobile payment product.
Income tax provision (benefit) was a $3.4 million benefit for the fiscal year ended October 31, 2014, compared to an $188.0 million income tax provision for the fiscal year ended October 31, 2013, a $191.5 million change. The income tax provision for the fiscal year ended October 31, 2013 was primarily due to a $245.0 million valuation allowance against a significant portion of our deferred tax assets, primarily in the U.S., due to uncertainty about the likelihood of realization partially offset by $10.1 million tax benefit related to the statutory tax rates impact on deferred taxes.
64
Segment Results of Operations
Net revenues and operating income of each segment reflect net revenues and expenses that are directly attributable to that segment. Net revenues and expenses not allocated to segment net revenues and segment operating income include amortization of purchased intangible assets, fair value decrease (step-down) in deferred revenue at acquisition, corporate inventory reserves, asset impairments, restructuring expenses, stock-based compensation, litigation settlement and loss contingency expense (benefit), as well as other corporate research and development, sales and marketing, and general and administrative expenses not directly attributable to a segment.
North America Net Revenues and Operating Income
Our North America segment includes our operations in the U.S. and Canada. North America customers are diverse, and include traditional and specialty merchants, financial institutions, payment processors, and distributors, among others. North America net revenues are heavily impacted by regulatory restrictions and the timing of customer purchase decisions. Customer decisions to adopt new technology are influenced by factors such as the timing or expected timing of new standards and regulations, new product releases and certifications of those products, and increased competition. In addition, the timing of purchasing decisions and size of orders from customers can significantly impact North America net revenues from period to period. For example, our net revenues can increase in periods when larger financial institutions or tier 1 retailers undertake an upgrade or other change, and decrease in periods when such projects are completed. Our business transactions in North America are denominated predominately in U.S. dollars.
Years Ended October 31, | ||||||||||||||||||||
2015 | % of Net revenues | 2014 | % of Net revenues | 2013 | % of Net revenues | |||||||||||||||
(in thousands, except percentages) | ||||||||||||||||||||
Net revenues: | ||||||||||||||||||||
System solutions | $ | 546,860 | 69.1 | % | $ | 309,099 | 58.7 | % | $ | 290,510 | 58.7 | % | ||||||||
Services | 244,904 | 30.9 | % | 217,077 | 41.3 | % | 204,634 | 41.3 | % | |||||||||||
Total net revenues | $ | 791,764 | 100.0 | % | $ | 526,176 | 100.0 | % | $ | 495,144 | 100.0 | % | ||||||||
Operating income | $ | 290,934 | 36.7 | % | $ | 157,689 | 30.0 | % | $ | 152,875 | 30.9 | % | ||||||||
Fiscal Year 2015 compared to Fiscal Year 2014
System solutions net revenues for the fiscal year ended October 31, 2015 were $546.9 million, compared to $309.1 million for the fiscal year ended October 31, 2014, up $237.8 million or 76.9%. System solutions net revenues increased by $176.9 million primarily as a result of more purchases by several of our large customers as they rolled out new terminals with EMV capabilities, as well as increasing adoption of these products by small and medium businesses. In addition, system solutions net revenues increased by $57.8 million, due primarily to existing customers upgrading to other new products and increased share in the petroleum market.
Services net revenues for the fiscal year ended October 31, 2015 were $244.9 million compared to $217.1 million for the fiscal year ended October 31, 2014, up $27.8 million or 12.8%, due primarily to a $14.4 million increase from our taxi and media solutions businesses. The remaining increase is primarily attributable to increases in security solutions offerings and deployment related services associated with increased System solutions net revenues.
65
Operating income for the fiscal year ended October 31, 2015 was $290.9 million or 36.7% of total net revenues, compared to $157.7 million or 30.0% of total net revenues for the fiscal year ended October 31, 2014, up $133.2 million or 6.7 percentage points. Operating income in dollars increased due primarily to the increase in total net revenues, with operating expenses remaining relatively comparable year over year. Operating income as a percentage of total net revenues increased due primarily to changes in customer mix and growth in sales of higher margin newer products during the fiscal year ended October 31, 2015, as well as the benefit of relatively comparable operating expenses.
66
Fiscal Year 2014 compared to Fiscal Year 2013
System solutions net revenues for the fiscal year ended October 31, 2014 were $309.1 million compared to $290.5 million for the fiscal year ended October 31, 2013, up $18.6 million or 6.4%. System solutions net revenues in North America increased primarily because some of our large customers and new customers rolled out next generation terminals with EMV capabilities in late fiscal year 2014. Systems solutions net revenues were negatively impacted by continued pricing pressures in the region.
Services net revenues for the fiscal year ended October 31, 2014 were $217.1 million compared to $204.6 million for the fiscal year ended October 31, 2013, up $12.5 million or 6.1%, primarily due to an increase from our taxi solutions business as a result of a larger installed base and increased transaction volumes.
Operating income for the fiscal year ended October 31, 2014 was $157.7 million or 30.0% of total net revenues, compared to $152.9 million or 30.9% of total net revenues for the fiscal year ended October 31, 2013, up $4.8 million and down 0.9 percentage points, primarily due to the increase in total net revenues.
67
EMEA Net Revenues and Operating Income
Our EMEA segment is comprised of our operations in Europe, Russia, the Middle East, and Africa. Our EMEA customers include financial institutions, retailers, distributors, and individual merchants. Services net revenues in this segment relate primarily to Payment-as-a-Service solutions. Net revenues in this segment are primarily influenced by factors such as macroeconomic and political conditions, standards and regulations, competition, and the timing of our new product releases and certifications of those products and the timing of customer orders. In addition, in some markets, net revenues are dependent on the timing of local electronic payments initiatives that may create demand for our products and solutions. Our business transactions in EMEA are denominated predominately in U.S. dollars, Euros, British pounds, and Swedish kronor.
Years Ended October 31, | ||||||||||||||||||||
2015 | % of Net revenues | 2014 | % of Net revenues | 2013 | % of Net revenues | |||||||||||||||
(in thousands, except percentages) | ||||||||||||||||||||
Net revenues: | ||||||||||||||||||||
System solutions | $ | 378,410 | 54.3 | % | $ | 401,176 | 53.0 | % | $ | 380,667 | 54.0 | % | ||||||||
Services | 318,743 | 45.7 | % | 355,365 | 47.0 | % | 323,990 | 46.0 | % | |||||||||||
Total net revenues | $ | 697,153 | 100.0 | % | $ | 756,541 | 100.0 | % | $ | 704,657 | 100.0 | % | ||||||||
Operating income | $ | 191,412 | 27.5 | % | $ | 208,294 | 27.5 | % | $ | 188,443 | 26.7 | % | ||||||||
Fiscal Year 2015 compared to Fiscal Year 2014
System solutions net revenues for the fiscal year ended October 31, 2015 were $378.4 million, compared to $401.2 million for the fiscal year ended October 31, 2014, down $22.8 million or 5.7%, due primarily to a $36.8 million unfavorable foreign currency impact related to the devaluation of the Euro, British pound, and Swedish krona against the U.S. dollar year over year.
Geographically, System solutions net revenues decreased $42.0 million in Russia due to a significant decrease in demand as a result of ongoing economic weakness and the devaluation of the Russian ruble against the U.S. dollar. The decrease was partially offset by a $19.2 million increase in the rest of EMEA despite the foreign currency headwinds. This increase in the rest of EMEA was due primarily to more purchases by retail customers, banking customers, and some of our large distributors mainly as a result of increased demand by their customers who were upgrading to new products or expanding their terminal base.
Services net revenues for the fiscal year ended October 31, 2015 were $318.7 million compared to $355.4 million for the fiscal year ended October 31, 2014, down $36.7 million or 10.3%, due primarily to unfavorable foreign currency impact related to the devaluation of the Euro, Swedish krona, and Norwegian krone against the U.S. dollar year over year.
Operating income for the fiscal year ended October 31, 2015 was $191.4 million or 27.5% of total net revenues, compared to $208.3 million or 27.5% of total net revenues, for the fiscal year ended October 31, 2014, down $16.9 million. Operating income in dollars decreased due primarily to the decrease in total net revenues. Operating income as a percentage of total net revenues remained relatively comparable year over year, as the decrease in operating income due to unfavorable impact from foreign currency fluctuations was offset by favorable impact from the decrease in operating expenses as a result of our transformation initiatives.
68
Fiscal Year 2014 compared to Fiscal Year 2013
System solutions net revenues for the fiscal year ended October 31, 2014 were $401.2 million compared to $380.7 million for the fiscal year ended October 31, 2013, up $20.5 million or 5.4%, primarily due to a $27.6 million increase in the Middle East and Africa, which was primarily due to the expansion of a government sponsored initiative to drive cashless payments in Nigeria in fiscal year 2014. System solutions net revenues increased by $13.0 million in Europe due to increased purchases by some of our large distributors primarily as a result of increased demand by their customers who were upgrading to new products with desired functionality or expanding their terminal base. These increases were partially offset by a $20.1 million decrease in the rest of EMEA primarily as a result of lower purchases in Russia due to changes in local banking regulations that impacted demand in the first half of fiscal year 2014. In addition, System solutions net revenues were negatively impacted in certain countries of this region by competitive pressures.
Services net revenues for the fiscal year ended October 31, 2014 were $355.4 million compared to $324.0 million for the fiscal year ended October 31, 2013, up $31.4 million or 9.7%, which is primarily due to increased adoption of our services offerings, primarily our Payment-as-a-Service solutions.
Foreign currency fluctuations had an $8.2 million favorable impact on total net revenues in EMEA for the fiscal year ended October 31, 2014, primarily due to an increase in the value of the Euro as compared to the U.S. dollar year over year.
Operating income for the fiscal year ended October 31, 2014 was $208.3 million or 27.5% of total net revenues, compared to $188.4 million, or 26.7% of total net revenues, for the fiscal year ended October 31, 2013, up $19.9 million or 0.8 percentage points, primarily due to increase in total net revenues and changes in product mix. The increase in operating income as a percentage of total net revenues is primarily due to growth in Services net revenues that had relatively higher margins.
69
Latin America Net Revenues and Operating Income
Our Latin America segment includes our operations in South America, Central America, Mexico, and the Caribbean. Latin America customers include payment processors, financial institutions, and distributors, among others. Latin America net revenues are dependent upon a limited number of customers and regulatory restrictions. Net revenues in this segment are primarily influenced by factors such as foreign currency fluctuations, macroeconomic and political conditions, standards and regulations, and the timing of our new product releases and certifications of those products, competition, and the timing of customer orders. In particular, the timing of purchasing decisions and size of orders from customers, as well as increasing competitive pressures, can significantly impact Latin America net revenues from period to period. For example, our net revenues can increase in periods when large customers undertake an upgrade or other change, and decrease in periods when such projects are completed. Our business transactions in Latin America are denominated predominately in Brazilian reais and U.S. dollars.
Years Ended October 31, | ||||||||||||||||||||
2015 | % of Net revenues | 2014 | % of Net revenues | 2013 | % of Net revenues | |||||||||||||||
(in thousands, except percentages) | ||||||||||||||||||||
Net revenues: | ||||||||||||||||||||
System solutions | $ | 223,760 | 81.2 | % | $ | 258,578 | 80.1 | % | $ | 240,191 | 80.3 | % | ||||||||
Services | 51,946 | 18.8 | % | 64,409 | 19.9 | % | 58,926 | 19.7 | % | |||||||||||
Total net revenues | $ | 275,706 | 100.0 | % | $ | 322,987 | 100.0 | % | $ | 299,117 | 100.0 | % | ||||||||
Operating income | $ | 55,294 | 20.1 | % | $ | 61,388 | 19.0 | % | $ | 66,324 | 22.2 | % | ||||||||
Fiscal Year 2015 compared to Fiscal Year 2014
System solutions net revenues for the fiscal year ended October 31, 2015 were $223.8 million, compared to $258.6 million for the fiscal year ended October 31, 2014, down $34.8 million or 13.5%. System solutions net revenues decreased by $49.6 million in Brazil during the fiscal year ended October 31, 2015, primarily as a result of a $29.4 million unfavorable foreign currency impact due to a decrease in the value of the Brazilian real as compared to the U.S. dollar year over year. The remaining decreases in Brazil System solutions net revenues were due to continued competition and pricing pressures, economic weakness, as well as the timing of purchase decisions by large customers, which were influenced by the timing of ongoing tender processes and the availability of our products having the functionality required for those tenders. This decrease was offset by a $14.8 million increase in System solutions net revenue in the rest of Latin America due primarily to the timing of purchase decisions by some of our customers in those geographies.
Services net revenues for the fiscal year ended October 31, 2015 were $51.9 million compared to $64.4 million for the fiscal year ended October 31, 2014, down $12.5 million or 19.4%, due primarily to a $14.4 million unfavorable impact from foreign currency fluctuations.
Operating income for the fiscal year ended October 31, 2015 was $55.3 million or 20.1% of total net revenues, compared to $61.4 million or 19.0% of total net revenues, for the fiscal year ended October 31, 2014, down $6.1 million and up 1.1 percentage points. Operating income in dollars decreased due primarily to the decrease in total net revenues, with operating expenses remaining relatively comparable year over year. Operating income as a percentage of total net revenues increased due primarily to changes in customer mix.
70
Fiscal Year 2014 compared to Fiscal Year 2013
System solutions net revenues for the fiscal year ended October 31, 2014 were $258.6 million compared to $240.2 million for the fiscal year ended October 31, 2013, up $18.4 million or 7.7%. System solutions net revenues experienced a $39.0 million increase in Brazil and a $20.6 million increase in the rest of Latin America, due to the timing of purchase decisions by our customers, which were primarily driven by the timing of technology refreshes and continued growth in that market. Latin America System solutions net revenues also experienced a $21.0 million unfavorable foreign currency impact, primarily due to a decrease in the value of the Brazilian real as compared to the U.S. dollar year over year.
Services net revenues for the fiscal year ended October 31, 2014 were $64.4 million compared to $58.9 million for the fiscal year ended October 31, 2013, up $5.5 million or 9.3%, primarily due to increased transaction volumes of terminals replaced for customers.
Operating income for the fiscal year ended October 31, 2014 was $61.4 million or 19.0% of total net revenues, compared to $66.3 million or 22.2% of total net revenues for the fiscal year ended October 31, 2013, down $4.9 million or 3.2 percentage points, primarily due to changes in product and customer mix as well as pricing pressures throughout the region.
71
Asia-Pacific Net Revenues and Operating Income
Our Asia-Pacific segment consists of our operations in Australia, New Zealand, China, India, and throughout the rest of Greater Asia, including other Asia-Pacific Rim countries. Our Asia-Pacific customers are comprised primarily of financial institutions, distributors, and individual merchants. Our Asia-Pacific business is relatively concentrated in terms of customer base and, as a result, our net revenues may vary significantly from period to period. Asia-Pacific net revenues are impacted by standards and regulations, the timing of our new product releases and certifications of those products in the various regulatory environments, as well as increasing competitive pressure, particularly in some markets, such as China, India, and the rest of Greater Asia, where competing vendors are offering terminals at substantially lower prices. Asia-Pacific business transactions are denominated predominately in U.S. dollars, Australian dollars, and Chinese renminbi.
Years Ended October 31, | ||||||||||||||||||||
2015 | % of Net revenues | 2014 | % of Net revenues | 2013 | % of Net revenues | |||||||||||||||
(in thousands, except percentages) | ||||||||||||||||||||
Net revenues: | ||||||||||||||||||||
System solutions | $ | 160,599 | 67.8 | % | $ | 193,373 | 72.9 | % | $ | 159,902 | 76.0 | % | ||||||||
Services | 76,228 | 32.2 | % | 71,911 | 27.1 | % | 50,431 | 24.0 | % | |||||||||||
Total net revenues | $ | 236,827 | 100.0 | % | $ | 265,284 | 100.0 | % | $ | 210,333 | 100.0 | % | ||||||||
Operating income | $ | 35,769 | 15.1 | % | $ | 57,151 | 21.5 | % | $ | 38,569 | 18.3 | % | ||||||||
Fiscal Year 2015 compared to Fiscal Year 2014
System solutions net revenues for the fiscal year ended October 31, 2015 were $160.6 million, compared to $193.4 million for the fiscal year ended October 31, 2014, down $32.8 million or 17.0%. System solutions net revenues decreased in China by $24.9 million due primarily to lower demand as increased competitive forces are driving customers to base their purchase decisions primarily on price, and we have not yet released a lower cost suite of products that provides a choice of offerings to meet customer preferences in that market. System solutions net revenues also decreased in the rest of Greater Asia by $27.9 million due to timing of purchase decisions by some of our large customers and increased competitive pressure. These decreases were partially offset by a $20.0 million increase in System solutions net revenues due to increased demand in Australia and India as some of our large banking customers upgraded and expanded the terminal base at their merchant customers.
Asia-Pacific System solutions net revenues for the fiscal year ended October 31, 2015 reflect a $13.0 million unfavorable foreign currency impact compared to the fiscal year ended October 31, 2014, primarily related to the devaluation of the Australian Dollar against the U.S. dollar year over year.
Services net revenues for the fiscal year ended October 31, 2015 were $76.2 million compared to $71.9 million for the fiscal year ended October 31, 2014, up $4.3 million or 6.0%, due primarily to growth in our services offerings in the region, which were partially offset by a $10.5 million unfavorable impact from foreign currency fluctuations.
Operating income for the fiscal year ended October 31, 2015 was $35.8 million or 15.1% of total net revenues, compared to $57.2 million or 21.5% of total net revenues for the fiscal year ended October 31, 2014, down $21.4 million or 6.4 percentage points. Operating income in dollars decreased due primarily to the decrease in total net revenues. Operating income as a percentage of total net revenues decreased due primarily to changes in customer mix as well as pricing pressure during the fiscal year ended October 31, 2015.
72
Fiscal Year 2014 compared to Fiscal Year 2013
System solutions net revenues for the fiscal year ended October 31, 2014 were $193.4 million compared to $159.9 million for the fiscal year ended October 31, 2013, up $33.5 million or 20.9%. System solutions net revenues increased $19.2 million in Australia and New Zealand, primarily due to increased demand from some of our large banking customers in Australia upgrading and expanding terminals at their merchant customers. System solutions net revenues also increased by $14.3 million, primarily from the addition of a large new channel partner for the region. We continued to experience competition and pricing pressures in this segment.
Services net revenues for the fiscal year ended October 31, 2014 were $71.9 million compared to $50.4 million for the fiscal year ended October 31, 2013, up $21.5 million or 42.6%, primarily due to Services net revenues from the EFTPOS New Zealand Limited business that we acquired on May 31, 2013.
Foreign currency fluctuations had a $6.7 million unfavorable impact on total net revenues in Asia-Pacific for the fiscal year ended October 31, 2014, primarily due to a decrease in the value of the Australian dollar as compared to the U.S. dollar year over year.
Operating income for the fiscal year ended October 31, 2014 was $57.2 million or 21.5% of total net revenues, compared to $38.6 million or 18.3% of total net revenues for the fiscal year ended October 31, 2013, up $18.6 million or 3.2 percentage points. The increase in operating income in dollars was primarily due to an increase in total net revenues. The increase in operating income as a percentage of total net revenues is primarily due to the acquisition of EFTPOS New Zealand Limited during fiscal year 2013.
73
Financial Outlook
We expect the timing and amount of overall revenue growth to continue to be impacted by factors such as macroeconomic conditions, the timing of new product releases and certifications, the timing of our customers' technology refresh cycles, increased competition and pricing pressures, changes in distribution and distributor inventory levels, and continued uncertain political conditions in certain markets.
As a result of our global customer base, we expect that our net revenues will continue to be impacted by macroeconomic conditions such as foreign currency fluctuations, economic sanctions and other trade restrictions, and changing global oil prices, particularly in certain markets such as Argentina, Russia, the Middle East, and Africa. We expect that continued uncertain political conditions in certain markets will have a negative impact on our ability to do business or operate at a desired level.
We expect the timing of new product releases to continue to have a significant impact on our net revenues. Net revenues can vary significantly when larger customers or distributors cancel or delay orders due to changes in regulatory and industry standards, budget considerations, product feature availability, dual vendor sourcing requirements, technology refresh cycles, economic conditions or other concerns that impact their business or purchasing decisions. Also, demand for electronic payment systems may eventually reach a saturation point, at which time customers might slow or end expansion projects. We expect to generate additional net revenues in the U.S. related to the continued adoption of EMV standards in the future, particularly by small and medium businesses, and increased desire for mobile payment devices, although the timing of any related revenues will depend on the timing of decisions by merchants. We expect growth in emerging markets as economic conditions improve and those markets make efforts to modernize to cashless payment systems.
We expect that the markets in which we conduct our business will remain highly competitive, characterized by changing technologies, evolving industry standards and government regulations that may favor one product or technology over others, and increased demand for new functionality, premium services, mobility, and security. In particular, we expect that there will be continued demand for lower priced products in certain emerging markets, such as China and India. We expect the pricing pressures and/or aggressive pricing by competitors may have significant impact on our net revenues in the future. Market disruptions caused by new technologies, the entry of new competitors, mobile order and pay, the presence of strong local competition, consolidations among our customers and competitors, changes in regulatory requirements, timing of electronic payments initiatives that create demand for our products in emerging markets, new technology entrants, and other factors, can introduce volatility into our business.
We continue to focus on expanding our Services offerings globally. We are investing in select markets in order to expand our Payment-as-a-Service solutions into new countries and to improve the functionality of our Payment-as-a-Service solutions in existing markets. We also continue to invest in digital media expansion and on commerce enablement solutions, using our consumer-facing point of sale terminals to offer services complementary to our payment solutions that facilitate commerce between merchants and consumers. We expect continued growth in Services net revenues as a result of these efforts. As we transition to service oriented arrangements, we may experience a shift in the timing of System solutions net revenues as revenue recognition will depend on when all of our performance obligations are complete.
As part of our transformation initiatives, we continue to focus on research and development activities and expect to continue at current spend levels as we focus on platform development efforts and gateway consolidation in order to increase standardization, and shorten our product development life-cycle and time to market.
We plan to continue efforts to improve our cost structure and streamline all aspects of our business, including consolidating and upgrading some of our global suppliers. In connection with our transformation efforts, we have approved restructuring plans under which we have reduced headcount and closed facilities. We expect to incur additional costs under these plans and expect that these plans may generate ongoing savings which will continue to be reinvested into growth initiatives as part of our transformation program. Spending may increase further depending on the costs of any future restructuring plans, costs associated with new acquisitions or ongoing integration of past acquisitions, and costs related to resolving legal and tax matters.
74
Liquidity and Capital Resources
Our primary liquidity and capital resource needs are to finance working capital, pay for contractual commitments, service our debt, and make capital expenditures and investments. As of October 31, 2015, our primary sources of liquidity were $208.9 million of cash and cash equivalents, as well as amounts available to us under the revolving loan that is part of our 2011 Credit Agreement.
Cash and cash equivalents as of October 31, 2015 included $151.3 million held by our foreign subsidiaries. If we decide to distribute or use the cash and cash equivalents held by our foreign subsidiaries outside those foreign jurisdictions, including a distribution to the U.S., we may be subject to additional taxes or costs, or face regulatory restrictions on the amount of cash that can be distributed out of some countries.
We also held $7.0 million in restricted cash as of October 31, 2015, which was mainly comprised of pledged deposits.
As of October 31, 2015, our outstanding borrowings consisted of a $562.5 million term A loan, $197.5 million term B loan and $54.0 million drawn against a revolving loan commitment. In addition, $446.0 million was available for draw on the revolving loan commitment, subject to covenant requirements. See Note 10, Financings, in the Notes to Consolidated Financial Statements of this Annual Report on Form 10-K for additional information regarding our borrowings. We were in compliance with all financial covenants under our credit agreement as of October 31, 2015.
On January 8, 2015, we entered into a number of interest rate swap agreements to effectively convert $500.0 million of the term A loan from a floating rate to a 1.20% fixed rate plus applicable margin commencing April 1, 2015. The principal amount under the term A loan covered by these interest rate swap agreements will decrease to $450.0 million from April 1, 2017 through August 31, 2017, and $400.0 million from September 1, 2017 through March 31, 2018. See Note 8, Financial Instruments, in the Notes to Consolidated Financial Statements of this Annual Report on Form 10-K for additional information regarding the swap agreements.
In September 2015, our Board of Directors authorized a program to repurchase shares of our common stock with an aggregate value of up to $200.0 million, with no expiration from the date of authorization. During fiscal year 2015 we repurchased 2.7 million shares of our common stock on the open market with an average repurchase price of $28.66 per share, and as of October 31, 2015, there was approximately $123.4 million remaining available for stock repurchases. The timing and actual amount of the share repurchases will depend on several factors including price, capital availability, regulatory requirements, alternative investment opportunities, including mergers and acquisitions, market conditions and other factors. We are not obligated to repurchase any specific number of shares under the program and the repurchase program may be modified, suspended or discontinued at any time.
As part of our cost optimization and corporate transformation initiatives, which began in December 2013, during fiscal year 2014 and 2015 we approved restructuring plans under which we made cash payments totaling $10.2 million during the fiscal year ended October 31, 2015. We expect to make additional cash payments totaling approximately $10.0 million under these plans in fiscal year 2016, and may approve additional restructuring plans as our transformation initiatives continue.
Our future capital requirements may vary significantly from prior periods as well as from those capital requirements we have currently planned. These requirements will depend on a number of factors, including operating factors such as our terms and payment experience with customers, the timing of annual recurring billings in some markets, the resolution of any legal proceedings against us or settlement of litigation in an amount in excess of our insurance coverage, costs related to acquisitions, restructuring expenses, stock repurchases and investments we may make in infrastructure, product or market development, or to expand our revenue generating asset base as well as timing and availability of financing. Based upon our current level of operations, we believe that we have the financial resources to meet our business requirements for the next year, including capital expenditures, working capital requirements, future strategic investments, including the acquisition of InterCard AG during Q1 FY-16, and debt servicing costs, stock repurchases and to maintain compliance with our financial covenants.
75
Bank Guarantees
We have issued bank guarantees with maturities ranging from two months to six years to certain of our customers and vendors as required in some countries to support certain performance obligations under our service or other agreements with those parties. As of October 31, 2015, the maximum amount that may become payable under these guarantees was $11.3 million, of which $1.4 million was collateralized by restricted cash deposits.
Letters of Credit
We provide standby letters of credit in the ordinary course of business to third parties as required. As of October 31, 2015, the maximum amounts that may become payable under these letters of credit was $3.7 million, of which $1.0 million was collateralized by restricted cash deposits.
Statement of Cash Flows
The net increase (decrease) in cash and cash equivalents are summarized in the following table (in thousands):
Years Ended October 31, | |||||||||||||||||||
2015 | Change | 2014 | Change | 2013 | |||||||||||||||
Net cash provided by (used in): | |||||||||||||||||||
Operating activities | $ | 249,287 | $ | 50,220 | $ | 199,067 | $ | (37,403 | ) | $ | 236,470 | ||||||||
Investing activities | (128,449 | ) | (50,556 | ) | (77,893 | ) | 66,837 | (144,730 | ) | ||||||||||
Financing activities | (133,558 | ) | (5,487 | ) | (128,071 | ) | 149,361 | (277,432 | ) | ||||||||||
Effect of foreign currency exchange rate changes on cash and cash equivalents | (28,597 | ) | (17,461 | ) | (11,136 | ) | (10,976 | ) | (160 | ) | |||||||||
Net increase (decrease) in cash and cash equivalents | $ | (41,317 | ) | $ | (23,284 | ) | $ | (18,033 | ) | $ | 167,819 | $ | (185,852 | ) | |||||
Fiscal Year 2015 vs. Fiscal Year 2014
Operating Activities
Net cash provided by operating activities for the fiscal year ended October 31, 2015 was $249.3 million, up $50.2 million from$199.1 million in cash provided during the fiscal year ended October 31, 2014. Net cash provided by operating activities before changes in operating assets and liabilities increased $56.4 million in the fiscal year ended October 31, 2015 compared to the fiscal year ended October 31, 2014 due primarily to increased total net revenues, partially offset by decreased depreciation and amortization expense, net. This increased cash was partially used for operating assets and liabilities.
During the fiscal year ended October 31, 2015, we used $25.9 million additional cash for inventory and $27.1 million for prepaid expenses and other assets. Additionally, the increases in total net revenues resulted in a $45.9 million increase in cash used for accounts receivable. These reductions in operating cash flows were offset by $106.2 million decreased spending for other current and long-term liabilities due primarily to payment of $61.2 million as settlement for the securities class action litigation in fiscal year ended October 31, 2014 that did not recur during the fiscal year ended October 31, 2015.
76
Investing Activities
Net cash used in investing activities for the fiscal year ended October 31, 2015 was $128.4 million, compared to $77.9 million for the fiscal year ended October 31, 2014, up $50.6 million, due primarily to $22.1 million in payments for acquisition of businesses and increased capital expenditures of $21.5 million during the fiscal year ended October 31, 2015 as we invested in additional revenue generating assets to support our services businesses.
Financing Activities
Net cash used in financing activities for the fiscal year ended October 31, 2015 was $133.6 million, compared to $128.1 million of cash used for the fiscal year ended October 31, 2014, up $5.5 million, due primarily to stock repurchases totaling $70.1 million and a $22.1 million decrease in proceeds from employee stock option exercises, which were partially offset by an $88.1 million decrease in net payments with respect to our credit agreements as we made less borrowings and repayments during the fiscal year ended October 31, 2015.
Fiscal Year 2014 vs. Fiscal Year 2013
Operating Activities
Net cash provided by operating activities for the fiscal year ended October 31, 2014 was $199.1 million, compared to $236.5 million cash provided during the fiscal year ended October 31, 2013, down $37.4 million primarily due to a $61.2 million payment during fiscal year 2014 related to the securities class action litigation settlement that had been accrued during fiscal year 2013, which was partially offset by the benefit from increased operating margins due to increased net revenues.
Investing Activities
Net cash used in investing activities for the fiscal year ended October 31, 2014 was $77.9 million, compared to $144.7 million for the fiscal year ended October 31, 2013 down $66.8 million as we made no significant cash acquisition payments during the fiscal year ended October 31, 2014, compared to $75.9 million paid for acquisitions in fiscal year 2013.
Financing Activities
Net cash used in financing activities for the fiscal year ended October 31, 2014 was $128.1 million, compared to $277.4 million for the fiscal year ended October 31, 2013, down $149.4 million, primarily due to a $114.5 million decrease in net payments with respect to our credit agreements as we made fewer discretionary payments in fiscal year 2014, and a $24.3 million increase in proceeds from employee stock option exercises.
77
Contractual Obligations
The following table summarizes our contractual obligations as of October 31, 2015 (in thousands):
Years Ended October 31, | |||||||||||||||||||||||||||
2016 | 2017 | 2018 | 2019 | 2020 | Thereafter | Total | |||||||||||||||||||||
Amended and restated 2011 credit agreement (1) | $ | 59,976 | $ | 81,581 | $ | 80,191 | $ | 477,801 | $ | 8,633 | $ | 194,063 | $ | 902,245 | |||||||||||||
Capital lease obligations and other loans | 60 | 37 | 37 | 37 | 37 | 301 | 509 | ||||||||||||||||||||
Operating leases (2) | 45,443 | 39,514 | 23,288 | 21,065 | 16,480 | 14,939 | 160,729 | ||||||||||||||||||||
Brazilian federal tax amnesty obligations | 308 | — | — | — | — | 85 | 393 | ||||||||||||||||||||
Minimum purchase obligations | 178,437 | — | — | — | — | — | 178,437 | ||||||||||||||||||||
Total | $ | 284,224 | $ | 121,132 | $ | 103,516 | $ | 498,903 | $ | 25,150 | $ | 209,388 | $ | 1,242,313 | |||||||||||||
(1) | Contractual obligations for the amended and restated 2011 credit agreement include interest calculated using the rate in effect as of October 31, 2015 applied to the expected outstanding debt balance considering the minimum principal payments due each year. |
(2) | Operating leases include $89.4 million of minimum contractual obligations on leases for our taxi solutions business where payments are based upon the number of operational taxicabs with our advertising displays as of October 31, 2015. |
As of October 31, 2015, the amount payable for unrecognized tax benefits was $35.9 million, including accrued interest and penalties, none of which is expected to be paid within one year. This amount is included in Other long-term liabilities in our Consolidated Balance Sheets as of October 31, 2015. We are unable to make a reasonably reliable estimate as to when cash settlement with the applicable taxing authorities may occur; therefore, such amounts are not included in the above contractual obligations table.
We expect that we will be able to fund our remaining obligations and commitments with future cash flows from our ongoing operations, and our $208.9 million of cash and cash equivalents held as of October 31, 2015. To the extent we are unable to fund these obligations and commitments with existing cash and cash flows from operations, we can draw upon amounts available under our amended and restated credit agreement or future debt or equity financings.
Off-Balance Sheet Arrangements
We have no off-balance sheet arrangements, as defined in Item 303(a)(4)(ii) of Regulation S-K.
78
Critical Accounting Polices and Estimates
General
Management's Discussion and Analysis of Financial Condition and Results of Operations is based upon our Consolidated Financial Statements, which have been prepared in accordance with U.S. GAAP. Our significant accounting policies are more fully described in Note 1, Principles of Consolidation and Summary of Significant Accounting Policies, in the Notes to Consolidated Financial Statements of this Annual Report on Form 10-K. On an ongoing basis, we evaluate our critical accounting policies and estimates. We base our estimates on historical experience and on various other assumptions that we believe to be reasonable under the circumstances, the results of which form the basis for our judgments about the carrying values of assets and liabilities that are not readily apparent from other sources. Actual results may differ from these estimates under different assumptions or conditions. An accounting policy is deemed to be critical if it requires an accounting estimate to be made based on assumptions about matters that are highly uncertain at the time the estimate is made, and if different estimates that reasonably could have been used, or changes in the accounting estimates that are reasonably likely to occur periodically, could materially impact our Consolidated Financial Statements. We believe that the following discussion addresses our most critical accounting policies.
Goodwill
We review the goodwill of our reporting units for impairment annually on August 1 and whenever events or changes in circumstances indicate its carrying amount may not be recoverable. When assessing goodwill for impairment, we have the option to first assess qualitative factors to determine whether the existence of events or circumstances leads to a determination that it is more likely than not that the fair value of a reporting unit is less than its carrying amount. If, after assessing the totality of events or circumstances, we determine it is more likely than not that the fair value of a reporting unit is less than its carrying amount, then we perform a two-step impairment test. If we conclude otherwise, then no further action is taken. We also have the option to bypass the qualitative assessment and only perform a quantitative assessment, which is the first step of the two-step impairment test. In the two-step impairment test, we measure the recoverability of goodwill by comparing a reporting unit's carrying amount, including goodwill, to the estimated fair value of the reporting unit.
We generally select the income approach, specifically the discounted cash flow ("DCF") method, to determine the fair value of each reporting unit. The DCF method calculates fair value by discounting estimated after-tax cash flows to a present value, using a risk-adjusted discount rate. We believe this method is the most meaningful in conducting our goodwill assessments because we believe it most appropriately measures our income-producing assets.
In applying the income approach to our accounting for goodwill, we make certain assumptions as to the amount and timing of future expected cash flows, terminal value growth rates, and appropriate discount rates. The amount and timing of future cash flows used in our DCF analysis is based on our most recent long-term forecasts and the expected future financial performance of each reporting unit, including projections of net revenues, costs of net revenues, operating expenses, income taxes, working capital requirements, and capital expenditures. A terminal value growth rate is used to calculate the value of the cash flows beyond the last projected period in our DCF analysis. The terminal value growth rate reflects our best estimates for stable, perpetual growth of our reporting units. We use the weighted average cost of capital ("WACC") as a basis for determining the discount rates to apply to our reporting units' future expected cash flows.
In addition, we make judgments and assumptions in allocating shared assets and liabilities to determine the carrying values for each of our reporting units. Different judgments or assumptions could result in different carrying values.
79
Income Taxes
Deferred tax assets and liabilities are recognized for the expected tax consequences of temporary differences between the tax bases of assets and liabilities and their reported amounts using enacted tax rates in effect for the year the differences are expected to reverse. In evaluating our ability to recover our deferred tax assets we consider all available positive and negative evidence including our past operating results, the existence of cumulative losses in past fiscal years, and our forecast of future taxable income in the jurisdictions in which we have operations.
We have placed a valuation allowance on the U.S. deferred tax assets and certain non-U.S. deferred tax assets, because realization of these tax benefits through future taxable income does not meet the more-likely-than-not threshold. We intend to maintain the valuation allowances until sufficient positive evidence exists to support the reversal of the valuation allowances. An increase in the valuation allowance would result in additional tax expense in the period in which the increase is recognized. We make estimates and judgments about our future taxable income that are based on assumptions that are consistent with our plans and estimates. Should the actual amounts differ from the estimates, the amount of the valuation allowance could be materially impacted.
We must make certain estimates and judgments in determining income tax expense for financial statement purposes. These estimates and judgments occur in the calculation of tax credits and deductions, and in the calculation of certain tax assets and liabilities, which arise from differences in the timing of recognition of revenue and expense for tax and financial statement purposes, as well as the interest and penalties relating to these uncertain tax positions. Significant changes to these estimates may result in an increase or decrease to our tax provision in a subsequent period.
The calculation of our tax liabilities involves dealing with uncertainties in the application of complex tax laws. Our estimate for the potential outcome of any uncertain tax issue is based on detailed facts and circumstances of each issue. Resolution of these uncertainties in a manner inconsistent with our expectations could have a material impact on our results of operations and financial condition.
During December 2014 the Internal Revenue Service issued a Notice of Proposed Adjustment indicating the denial of our worthless stock deduction, related to the insolvency of one of our UK subsidiaries, recorded on our 2010 tax return. Additionally, during the fourth quarter of fiscal 2014, the Israel Tax Authority issued a tax assessment for 2008 or 2009 claiming there was a business restructuring that resulted in a transfer of some functions, assets and risks from Israel to the U.S. parent company treated as an equity sale. We are appealing the tax assessment and believe the Israel Tax Authority’s assessment position is without merit. If these matters are litigated and the Internal Revenue Service or Israel Tax Authority are able to successfully sustain their positions, our results of operations and financial condition could be materially and adversely affected. See further discussion in Note 6, Income Taxes, in the Notes to Consolidated Financial Statements of this Annual Report on Form 10-K.
We recognize liabilities for uncertain tax positions based on a two-step process. The first step is to evaluate the tax position for recognition by determining if the weight of available evidence indicates that it is more likely than not that the position will be sustained on audit, including resolution of related appeals or litigation processes, if any. The second step requires us to estimate and measure the tax benefit as the largest amount that is more than 50% likely to be realized upon ultimate settlement. It is inherently difficult and subjective to estimate such amounts, as this requires us to determine the probability of various possible outcomes. We re-evaluate these uncertain tax positions on a quarterly basis. This evaluation is based on factors including, but not limited to, changes in facts or circumstances, changes in tax law, effectively settled issues under audit, and new audit activity. Such a change in recognition or measurement would result in the recognition of a tax benefit or an additional charge to the tax provision in the period.
80
Revenue Recognition
While the majority of our sales transactions contain standard business terms and conditions, there are some transactions that contain non-standard business terms and conditions, and, as a result, significant contract interpretation is sometimes required to determine whether an arrangement exists and what is included in the arrangement. In addition, our revenue recognition policy requires an assessment as to whether collection is probable, which inherently requires us to evaluate the creditworthiness of our customers.
We enter into arrangements with customers that include multiple deliverables. Significant judgment is required to determine the appropriate accounting for multiple element arrangements including: (1) whether elements represent separate deliverables; (2) the estimated selling price ("ESP") for each deliverable; (3) the arrangement consideration to be allocated among the deliverables; (4) when to recognize net revenues on the deliverables; and (5) whether undelivered elements are essential to the functionality of delivered elements. Further, our determination of ESP involves assessing factors such as the cost to produce the deliverable, the anticipated margin on that deliverable, the economic conditions and trends, the selling price and profit margin for similar parts, and our ongoing pricing strategy and policies.
Stock-Based Compensation
We account for stock-based employee compensation plans using fair value recognition and measurement principles, and recognize compensation over the requisite service period for awards expected to vest. The estimation of stock awards that will ultimately vest requires judgment, and to the extent actual results differ from our estimates, such amounts will be recorded in the period the awards are forfeited. In valuing stock-based awards, significant judgment is required in determining the expected volatility and the expected term individuals will hold their stock-based awards prior to exercising. Expected volatility of the stock is based on a blend of factors, such as the implied volatility of our options and the historical volatility of our own stock. The expected term of options granted is derived from the historical actual term of option grants and an estimate of future exercises during the remaining contractual period of the option. In the future, our expected volatility and expected term may change, which could substantially change the grant-date fair value of future awards of stock options and ultimately the expense we record.
Warranty Costs
We accrue for estimated warranty obligations at the time that revenue is recognized, and base those accruals on an estimate of future warranty costs for the delivered product. Our warranty obligation generally extends from one to three years from the date of shipment. We estimate such obligations based on the size of the installed base of products subject to warranty protection, historical and projected warranty claim rates, historical and projected costs associated with claims, and knowledge of specific product failures that are outside of our typical experience. Our estimates and judgments are affected by actual product failure rates and actual costs to repair. These estimates and judgments are more subjective for new product introductions as these estimates and judgments are based on our experience for similar products because we do not yet have actual history or experience for new products.
From time to time we encounter situations where our costs of warranty on a product vary significantly from expectations due to factors including defective parts, defective workmanship, or other unanticipated environmental or usage patterns. When encountered, a specific reserve is established for these situations on a case-by-case basis, and best available estimates are used to quantify the potential exposure.
Business Combinations
We are required to estimate the fair values assigned to assets acquired and liabilities assumed of acquired companies. Such valuations require management to make significant estimates and assumptions, especially with respect to intangible assets.
81
Critical estimates in valuing intangible assets include but are not limited to: future expected cash flows from customer contracts, customer lists, distribution agreements, acquired developed technologies, and patents; expected costs to complete development of in process research and development into commercially viable products and estimating the cash flows from those projects when completed; brand awareness and market position, as well as assumptions about the period of time the brand will continue to be used in our product portfolio; customer attrition rates and discount rates.
Future expected cash flow to be generated from an acquired business is estimated based on the current financial performance of the business, then adjusted for expected market participant synergies that can be realized, the expected timing of future cash flows of all of the acquired business' products and services, the expected customer attrition rates, and the future growth rates. The higher the projected cash flows, the higher the value of intangible assets.
Discount rates reflect the nature of our investment and the perceived risk of the underlying cash flows.
Allowance for doubtful accounts
We maintain an allowance for doubtful accounts for estimated losses resulting from the inability of our customers to pay their invoices to us in full. We regularly review the adequacy of our allowance for doubtful accounts, considering the size of each customer's accounts receivable balance, their expected ability to pay, aging of their accounts receivable balances, and our collection history with them. An appropriate provision is made taking into account these factors. The level of reserves for our customer accounts receivable fluctuates depending upon all of the factors mentioned above, and could change significantly if our customers' financial condition changes or the economy in general deteriorates.
Inventory Valuation and Liability for Purchase Commitments with Contract Manufacturers and Suppliers
The valuation of inventories requires us to determine obsolete or excess inventory, and inventory that is not of salable quality. The determination of obsolete or excess inventories requires us to estimate the future demand for our products within specific time horizons, generally six months. If our demand forecast for specific products is greater than actual demand and we fail to reduce manufacturing output accordingly, we could be required to record additional inventory write-offs, which would have a negative impact on our gross margin percentage.
We review the adequacy of our inventory valuation on a quarterly basis. For production inventory, our methodology involves an assessment of the marketability of the product based on a combination of shipment history and future demand. We then evaluate the inventory found to be in excess and take appropriate write-downs to reflect the risk of obsolescence. Our evaluation depends on the accuracy of our sales estimates. If actual demand was substantially lower than estimated, additional inventory write-downs for excess or obsolete inventories may be required.
We record accruals for estimated cancellation fees related to orders placed with our suppliers that have been canceled or are expected to be canceled. Consistent with industry practice, we acquire inventory through a combination of purchase orders, supplier contracts, and open orders based on projected demand information. These commitments typically cover our requirements for periods ranging from one to five months. If there is an abrupt and substantial decline in demand for one or more of our products or an unanticipated change in technological requirements for any of our products, we may be required to record additional accruals for cancellation fees that would negatively affect our results of operations in the period when the cancellation fees are identified and recorded.
82
Long-Lived Assets
We make judgments about the recoverability of long-lived assets, including fixed assets and purchased finite-lived intangible assets whenever events or changes in circumstances indicate that an impairment may exist. Each period we evaluate the estimated remaining useful lives of long-lived assets and whether events or changes in circumstances warrant a revision to the remaining periods of depreciation or amortization. If circumstances arise that indicate an impairment may exist, we use an estimate of the undiscounted value of expected future operating cash flows to determine whether the long-lived assets are impaired. If the aggregate undiscounted cash flows are less than the carrying amount of the assets, the resulting impairment charge to be recorded is calculated based on the excess of the carrying amount of the assets over the fair value of such assets, with the fair value generally determined using the DCF method. Application of the DCF method for long-lived assets requires judgment and market participant assumptions related to the amount and timing of future expected cash flows, terminal value growth rates, and appropriate discount rates. Different judgments or assumptions could result in materially different fair value estimates.
Contingencies and Litigation
The outcome of litigation is inherently uncertain and subject to numerous factors outside of our control. Significant judgment is required when we assess the likelihood of any adverse judgments or outcomes to a potential claim or legal proceeding, as well as potential ranges of probable losses, and when the outcomes of the claims or proceedings are probable and reasonably estimable. A determination of the amount of accrued liabilities required, if any, for these contingencies is made after the analysis of each matter. Because of uncertainties related to these matters, we base our estimates on the information available at the time. As additional information becomes available, we reassess the potential liability related to pending claims and litigation, and may revise our estimates. Any revisions in the estimates of potential liabilities could have a material impact on our results of operations and financial position.
Recent Accounting Pronouncements
Information with respect to recent accounting pronouncements may be found in Note 1, Principles of Consolidation and Summary of Significant Accounting Policies, in the Notes to Consolidated Financial Statements of this Annual Report on Form 10-K, which section is incorporated herein by reference. We do not expect the pronouncements adopted during fiscal year 2015 to have a material impact on our consolidated financial position or results of operations in future periods. We are currently evaluating the impact that adoption of ASU 2014-09, Revenue from Contracts with Customers, will have on our future consolidated financial position and results of operations.
83
ITEM 7A.QUANTITATIVE AND QUALITATIVE DISCLOSURES ABOUT MARKET RISK
We are exposed to market risk related to changes in interest rates and foreign currency exchange rates. These exposures may change over time as business practices evolve, and could have a material adverse impact on our financial results.
Interest Rate Risk
We are exposed to interest rate risk related to our borrowings. These borrowings generally bear interest based upon the one-month LIBOR rate. As of October 31, 2015, a 100 basis point increase in interest rates on our borrowings subject to variable interest rate fluctuations would increase our interest expense by approximately $6.2 million annually.
We have outstanding a number of interest rate swap agreements to effectively convert $500.0 million of the term A loan from a floating rate to a 1.20% fixed rate plus applicable margin. The interest rate swaps qualify for hedge accounting treatment as cash flow hedges and are effective through March 31, 2018. The principal amount under the term A loan covered by the new interest rate swap agreements will decrease to $450.0 million from April 1, 2017 through August 31, 2017, and $400.0 million from September 1, 2017 through March 31, 2018.
We generally hold most of our cash in non-interest bearing bank accounts. However, some of the funds are placed in overnight and short-term instruments, which would earn more interest income if market interest rates rise and less interest income if market interest rates fall.
Foreign Currency Transaction Risk
Customers outside the U.S. account for a substantial majority of our sales. A substantial portion of the net revenues we generate from international sales is denominated in currencies other than the U.S. dollar, particularly the Euro, Brazilian real, Swedish krona, Australian dollar, and British pound. Additionally, portions of our cost of net revenues and operating expenses are incurred by our international operations and are denominated in currencies other than the U.S. dollar. For consolidated reporting, net revenues and expenses denominated in currencies other than the U.S. dollar, which we refer to as Income Statement Exposures, are translated to the U.S. dollar at average currency exchange rates for the period. Thus, even if foreign operating results were stable, fluctuating currency rates may produce volatile reported results. We have from time to time made efforts to mitigate Income Statement Exposures by hedging with currency derivatives. As of October 31, 2015 and 2014, we had no derivatives related to Income Statement Exposures that were designated as cash flow hedges. We may in the future use foreign exchange forward contracts or other derivatives to hedge Income Statement Exposures, depending upon the risks of the exposures, the costs of hedging, and other considerations. However, hedges of Income Statement Exposures will only mitigate a portion of our risk and only for a short period.
The balance sheets of our subsidiaries may have monetary assets and liabilities denominated in currencies other than the primary currency of such business, which we refer to as Balance Sheet Exposures. For example, Balance Sheet Exposures would include Canadian dollar receivables held in a subsidiary where the Canadian dollar is not the primary currency, such as our U.S. business, or U.S. dollar payables held by our U.K. subsidiary. As exchange rates fluctuate, Balance Sheet Exposures generate foreign currency transaction gains and losses, which are included in Other income (expense), net in our Consolidated Statements of Operations. Most Balance Sheet Exposures will settle in a currency other than the functional currency in the foreseeable future or convert from a foreign currency to a local currency in the foreseeable future, at which time the impact of rate fluctuations will be realized and we will receive or dispense more or less cash than the value originally recorded. We refer to such exposures as Near-Term Balance Sheet Exposures. Some Balance Sheet Exposures may not be settled in the foreseeable future in management's estimation and thus the cash impact of their currency gains or losses is not expected to be realized in the foreseeable future.
84
We have in the past and expect to continue to enter into foreign exchange forward contracts to mitigate the risk of Near-Term Balance Sheet Exposures. Our objective is to have gains or losses from the foreign exchange forward contracts largely offset the losses or gains of the Near-Term Balance Sheet Exposures. On a monthly basis, we recognize the gains or losses based on the changes in fair value of these contracts in Other income (expense), net in our Consolidated Statements of Operations. In some instances, we may seek to hedge transactions that are expected to become Near-Term Balance Sheet Exposures in the very short-term, generally within one month. We do not use foreign exchange forward contracts or other derivatives for speculative or trading purposes.
Our outstanding foreign exchange forward contracts as of October 31, 2015 are presented in the table below (in thousands). The fair market value of the contracts represents the difference between the spot currency rate at October 31, 2015 and the contracted rate. All of these forward contracts mature within 30 days of October 31, 2015.
Currency | Local Currency Contract Amount | Currency | Contracted Amount | Fair Market Value at October 31, 2015 | |||||||||
Contracts to (buy) sell non-USD currencies: | |||||||||||||
Argentine peso | ARS | (110,000 | ) | USD | 10,466 | $ | (195 | ) | |||||
Australian dollar | AUD | (25,000 | ) | USD | 17,809 | (26 | ) | ||||||
Brazilian real | BRL | (8,000 | ) | USD | 2,026 | (21 | ) | ||||||
British Pound | GBP | (14,000 | ) | USD | 21,453 | (6 | ) | ||||||
Canadian dollar | CAD | (13,000 | ) | USD | 9,874 | (35 | ) | ||||||
Chinese renminbi | CNY | 15,000 | USD | (2,349 | ) | (2 | ) | ||||||
Danish krone | DKK | (102,000 | ) | USD | 15,150 | 8 | |||||||
Euro | EUR | (61,000 | ) | USD | 67,544 | 1 | |||||||
Indian rupee | INR | 150,000 | USD | (2,289 | ) | 11 | |||||||
Mexican peso | MXN | (80,000 | ) | USD | 4,838 | (15 | ) | ||||||
New Zealand dollar | NZD | (36,000 | ) | USD | 24,158 | 27 | |||||||
Polish zloty | PLN | (10,000 | ) | USD | 2,580 | — | |||||||
South African rand | ZAR | (40,000 | ) | USD | 2,935 | (4 | ) | ||||||
South Korean won | KRW | (3,000,000 | ) | USD | 2,639 | (11 | ) | ||||||
Swedish Krona | SEK | 215,000 | USD | (25,581 | ) | (48 | ) | ||||||
Turkish Lira | TRY | (23,000 | ) | USD | 7,877 | (6 | ) | ||||||
Total fair market value | $ | (322 | ) | ||||||||||
As of October 31, 2015, our Balance Sheet Exposures amounted to $272.3 million. These Balance Sheet Exposures were partially offset by foreign exchange forward contracts with a notional amount of $219.6 million. Based on our net exposures as of October 31, 2015, a 10% fluctuation in currency exchange rates would result in a gain or loss of approximately $5.1 million.
As of October 31, 2015, we had one Balance Sheet Exposure not expected to be paid in the near term, an Israeli shekel payable equivalent to $46.1 million. Excluding this exposure from the Israeli subsidiary's net liability exposure of $43.7 million results in a $2.4 million net asset position. Deducting the $41.3 million absolute value difference from our total Balance Sheet Exposures of $272.3 million results in a total Near-Term Balance Sheet Exposure of $231.0 million. A 10% movement in currency exchange rates would result in a gain or loss of approximately $1.0 million that we would expect to be realized in the foreseeable future.
85
Our efforts to mitigate the risk of foreign currency fluctuations in our Balance Sheet Exposures through the use of foreign exchange forward contracts may not always be effective in protecting us against currency exchange rate fluctuations, particularly in the event of imprecise forecasts of non-functional currency denominated assets and liabilities. In addition, at times we have not fully offset our Balance Sheet Exposures for reasons such as the high cost of hedging certain currencies, leaving us at risk for foreign exchange gains and losses on amounts not offset by forward contracts. Furthermore, historically we have not consistently hedged our Income Statement Exposures. Accordingly, if there were an adverse movement in exchange rates, we might suffer significant losses.
86
ITEM 8.FINANCIAL STATEMENTS AND SUPPLEMENTARY DATA
INDEX TO CONSOLIDATED FINANCIAL STATEMENTS
87
REPORT OF INDEPENDENT REGISTERED PUBLIC ACCOUNTING FIRM
The Board of Directors and Stockholders of VeriFone Systems, Inc.
We have audited the accompanying consolidated balance sheets of VeriFone Systems, Inc. as of October 31, 2015 and 2014, and the related consolidated statements of operations, comprehensive loss, equity, and cash flows for each of the three years in the period ended October 31, 2015. These financial statements are the responsibility of the Company's management. Our responsibility is to express an opinion on these financial statements based on our audits.
We conducted our audits in accordance with the standards of the Public Company Accounting Oversight Board (United States). Those standards require that we plan and perform the audit to obtain reasonable assurance about whether the financial statements are free of material misstatement. An audit includes examining, on a test basis, evidence supporting the amounts and disclosures in the financial statements. An audit also includes assessing the accounting principles used and significant estimates made by management, as well as evaluating the overall financial statement presentation. We believe that our audits provide a reasonable basis for our opinion.
In our opinion, the financial statements referred to above present fairly, in all material respects, the consolidated financial position of VeriFone Systems, Inc. at October 31, 2015 and 2014, and the consolidated results of its operations and its cash flows for each of the three years in the period ended October 31, 2015, in conformity with U.S. generally accepted accounting principles.
We also have audited, in accordance with the standards of the Public Company Accounting Oversight Board (United States), VeriFone Systems, Inc.'s internal control over financial reporting as of October 31, 2015, based on criteria established in Internal Control - Integrated Framework issued by the Committee of Sponsoring Organizations of the Treadway Commission (2013 framework) and our report dated December 18, 2015 expressed an unqualified opinion thereon.
/s/ Ernst & Young LLP
San Jose, California
December 18, 2015
88
REPORT OF INDEPENDENT REGISTERED PUBLIC ACCOUNTING FIRM
The Board of Directors and Stockholders of VeriFone Systems, Inc.
We have audited VeriFone Systems, Inc.'s internal control over financial reporting as of October 31, 2015, based on criteria established in Internal Control - Integrated Framework issued by the Committee of Sponsoring Organizations of the Treadway Commission (2013 framework) (the COSO criteria). VeriFone Systems, Inc.'s management is responsible for maintaining effective internal control over financial reporting, and for its assessment of the effectiveness of internal control over financial reporting included in the accompanying Management's Report on Internal Control over Financial Reporting. Our responsibility is to express an opinion on the company's internal control over financial reporting based on our audit.
We conducted our audit in accordance with the standards of the Public Company Accounting Oversight Board (United States). Those standards require that we plan and perform the audit to obtain reasonable assurance about whether effective internal control over financial reporting was maintained in all material respects. Our audit included obtaining an understanding of internal control over financial reporting, assessing the risk that a material weakness exists, testing and evaluating the design and operating effectiveness of internal control based on the assessed risk, and performing such other procedures as we considered necessary in the circumstances. We believe that our audit provides a reasonable basis for our opinion.
A company's internal control over financial reporting is a process designed to provide reasonable assurance regarding the reliability of financial reporting and the preparation of financial statements for external purposes in accordance with generally accepted accounting principles. A company's internal control over financial reporting includes those policies and procedures that (1) pertain to the maintenance of records that, in reasonable detail, accurately and fairly reflect the transactions and dispositions of the assets of the company; (2) provide reasonable assurance that transactions are recorded as necessary to permit preparation of financial statements in accordance with generally accepted accounting principles, and that receipts and expenditures of the company are being made only in accordance with authorizations of management and directors of the company; and (3) provide reasonable assurance regarding prevention or timely detection of unauthorized acquisition, use, or disposition of the company's assets that could have a material effect on the financial statements.
Because of its inherent limitations, internal control over financial reporting may not prevent or detect misstatements. Also, projections of any evaluation of effectiveness to future periods are subject to the risk that controls may become inadequate because of changes in conditions, or that the degree of compliance with the policies or procedures may deteriorate.
In our opinion, VeriFone Systems, Inc. maintained, in all material respects, effective internal control over financial reporting as of October 31, 2015, based on the COSO criteria.
We also have audited, in accordance with the standards of the Public Company Accounting Oversight Board (United States), the consolidated balance sheets of VeriFone Systems, Inc. as of October 31, 2015 and 2014, and the related consolidated statements of operations, comprehensive loss, equity, and cash flows for each of the three years in the period ended October 31, 2015 and our report dated December 18, 2015 expressed an unqualified opinion thereon.
/s/ Ernst & Young LLP
San Jose, California
December 18, 2015
89
VERIFONE SYSTEMS, INC.
CONSOLIDATED STATEMENTS OF OPERATIONS
Years Ended October 31, | |||||||||||
2015 | 2014 | 2013 | |||||||||
(In thousands, except per share data) | |||||||||||
Net revenues: | |||||||||||
System solutions | $ | 1,309,628 | $ | 1,162,226 | $ | 1,068,444 | |||||
Services | 690,829 | 706,648 | 633,777 | ||||||||
Total net revenues | 2,000,457 | 1,868,874 | 1,702,221 | ||||||||
Cost of net revenues: | |||||||||||
System solutions | 773,816 | 733,043 | 695,259 | ||||||||
Services | 400,658 | 411,114 | 361,773 | ||||||||
Total cost of net revenues | 1,174,474 | 1,144,157 | 1,057,032 | ||||||||
Total gross margin | 825,983 | 724,717 | 645,189 | ||||||||
Operating expenses: | |||||||||||
Research and development | 201,630 | 203,737 | 173,318 | ||||||||
Sales and marketing | 227,470 | 217,453 | 196,594 | ||||||||
General and administrative | 206,187 | 208,694 | 181,100 | ||||||||
Litigation settlement and loss contingency expense (benefit) | 1,213 | (8,632 | ) | 64,371 | |||||||
Amortization of purchased intangible assets | 82,492 | 97,580 | 96,160 | ||||||||
Total operating expenses | 718,992 | 718,832 | 711,543 | ||||||||
Operating income (loss) | 106,991 | 5,885 | (66,354 | ) | |||||||
Interest expense, net | (31,455 | ) | (42,472 | ) | (44,344 | ) | |||||
Other income (expense), net | (2,588 | ) | (3,297 | ) | 3,740 | ||||||
Income (loss) before income taxes | 72,948 | (39,884 | ) | (106,958 | ) | ||||||
Income tax provision (benefit) | (7,409 | ) | (3,442 | ) | 188,043 | ||||||
Consolidated net income (loss) | 80,357 | (36,442 | ) | (295,001 | ) | ||||||
Net income attributable to noncontrolling interests | (1,260 | ) | (1,688 | ) | (1,054 | ) | |||||
Net income (loss) attributable to VeriFone Systems, Inc. stockholders | $ | 79,097 | $ | (38,130 | ) | $ | (296,055 | ) | |||
Net income (loss) per share attributable to VeriFone Systems, Inc. stockholders: | |||||||||||
Basic | $ | 0.69 | $ | (0.34 | ) | $ | (2.73 | ) | |||
Diluted | $ | 0.68 | $ | (0.34 | ) | $ | (2.73 | ) | |||
Weighted average number of shares used in computing net income (loss) per share attributable to VeriFone Systems, Inc. stockholders: | |||||||||||
Basic | 114,044 | 111,586 | 108,609 | ||||||||
Diluted | 115,934 | 111,586 | 108,609 | ||||||||
The accompanying notes are an integral part of these consolidated financial statements.
90
VERIFONE SYSTEMS, INC.
CONSOLIDATED STATEMENTS OF COMPREHENSIVE LOSS
Years Ended October 31, | |||||||||||
2015 | 2014 | 2013 | |||||||||
(In thousands) | |||||||||||
Consolidated net income (loss) | $ | 80,357 | $ | (36,442 | ) | $ | (295,001 | ) | |||
Other comprehensive income (loss): | |||||||||||
Foreign currency translation adjustments | (183,895 | ) | (121,068 | ) | 46,358 | ||||||
Unrealized gain (loss) on derivatives designated as cash flow hedges | |||||||||||
Change in unrealized gain (loss) on derivatives designated as cash flow hedges, net of tax | (7,830 | ) | 4,088 | 2,618 | |||||||
Amounts reclassified from Accumulated other comprehensive income (loss), net of tax | 4,141 | (2,794 | ) | (1,958 | ) | ||||||
Net change in unrealized gain (loss) on derivatives designated as cash flow hedges | (3,689 | ) | 1,294 | 660 | |||||||
Net change in other | 93 | 97 | 219 | ||||||||
Other comprehensive income (loss) | (187,491 | ) | (119,677 | ) | 47,237 | ||||||
Total comprehensive loss | (107,134 | ) | (156,119 | ) | (247,764 | ) | |||||
Less: net income attributable to noncontrolling interests | (1,260 | ) | (1,688 | ) | (1,054 | ) | |||||
Comprehensive loss attributable to VeriFone Systems, Inc. stockholders | $ | (108,394 | ) | $ | (157,807 | ) | $ | (248,818 | ) | ||
The accompanying notes are an integral part of these consolidated financial statements.
91
VERIFONE SYSTEMS, INC.
CONSOLIDATED BALANCE SHEETS
October 31, | |||||||
2015 | 2014 | ||||||
(In thousands, except par value) | |||||||
ASSETS | |||||||
Current assets: | |||||||
Cash and cash equivalents | $ | 208,870 | $ | 250,187 | |||
Accounts receivable, net of allowances of $8,752 and $9,880, respectively | 361,988 | 305,500 | |||||
Inventories | 129,716 | 124,275 | |||||
Prepaid expenses and other current assets | 81,690 | 78,427 | |||||
Total current assets | 782,264 | 758,389 | |||||
Fixed assets, net | 190,965 | 177,753 | |||||
Purchased intangible assets, net | 317,517 | 457,595 | |||||
Goodwill | 1,084,031 | 1,185,892 | |||||
Long-term deferred tax assets, net | 35,896 | 51,265 | |||||
Other long-term assets | 62,389 | 50,620 | |||||
Total assets | $ | 2,473,062 | $ | 2,681,514 | |||
LIABILITIES AND EQUITY | |||||||
Current liabilities: | |||||||
Accounts payable | $ | 189,354 | $ | 161,226 | |||
Accruals and other current liabilities | 229,900 | 206,572 | |||||
Deferred revenue, net | 82,899 | 92,075 | |||||
Short-term debt | 39,088 | 31,792 | |||||
Total current liabilities | 541,241 | 491,665 | |||||
Long-term deferred revenue, net | 55,322 | 50,968 | |||||
Long-term deferred tax liabilities, net | 102,921 | 130,494 | |||||
Long-term debt | 760,241 | 836,623 | |||||
Other long-term liabilities | 78,896 | 101,092 | |||||
Total liabilities | 1,538,621 | 1,610,842 | |||||
Commitments and contingencies | |||||||
Redeemable noncontrolling interest in subsidiary | — | 774 | |||||
Stockholders’ equity: | |||||||
Preferred stock: $0.01 par value, 10,000 shares authorized, no shares issued and outstanding | — | — | |||||
Common stock: $0.01 par value, 200,000 shares authorized, 112,684 and 113,314 shares issued and outstanding as of October 31, 2015 and 2014, respectively | 1,125 | 1,133 | |||||
Additional paid-in capital | 1,726,416 | 1,675,695 | |||||
Accumulated deficit | (535,716 | ) | (538,208 | ) | |||
Accumulated other comprehensive loss | (292,321 | ) | (104,830 | ) | |||
Total VeriFone Systems, Inc. stockholders’ equity | 899,504 | 1,033,790 | |||||
Noncontrolling interests in subsidiaries | 34,937 | 36,108 | |||||
Total equity | 934,441 | 1,069,898 | |||||
Total liabilities and equity | $ | 2,473,062 | $ | 2,681,514 | |||
The accompanying notes are an integral part of these consolidated financial statements.
92
VERIFONE SYSTEMS, INC.
CONSOLIDATED STATEMENTS OF EQUITY
Common Stock Voting | Additional Paid-in Capital | Accumulated Deficit | Accumulated Other Comprehensive Income (Loss) | Total Stockholders' Equity | Non-controlling interest in subsidiaries | Total Equity | ||||||||||||||||||||||||
Shares | Amount | |||||||||||||||||||||||||||||
(In thousands) | ||||||||||||||||||||||||||||||
Balance as of October 31, 2012 | 108,074 | $ | 1,081 | $ | 1,543,127 | $ | (204,023 | ) | $ | (32,390 | ) | $ | 1,307,795 | $ | 36,821 | $ | 1,344,616 | |||||||||||||
Issuance of common stock, net of issuance costs | 2,230 | 22 | 11,103 | — | — | 11,125 | — | 11,125 | ||||||||||||||||||||||
Tax payments related to restricted stock units | — | — | (3,823 | ) | — | — | (3,823 | ) | — | (3,823 | ) | |||||||||||||||||||
Treasury shares retired | (144 | ) | (1 | ) | — | — | — | (1 | ) | — | (1 | ) | ||||||||||||||||||
Stock-based compensation expense | — | — | 48,851 | — | — | 48,851 | — | 48,851 | ||||||||||||||||||||||
Tax effects of stock-based compensation | — | — | (523 | ) | — | — | (523 | ) | — | (523 | ) | |||||||||||||||||||
Dividends paid to noncontrolling interests shareholders | — | — | — | — | — | — | (1,690 | ) | (1,690 | ) | ||||||||||||||||||||
Total comprehensive income (loss) | — | — | — | (296,055 | ) | 47,237 | (248,818 | ) | 1,324 | (247,494 | ) | |||||||||||||||||||
Balance as of October 31, 2013 | 110,160 | 1,102 | 1,598,735 | (500,078 | ) | 14,847 | 1,114,606 | 36,455 | 1,151,061 | |||||||||||||||||||||
Issuance of common stock, net of issuance costs | 3,154 | 31 | 35,722 | — | — | 35,753 | — | 35,753 | ||||||||||||||||||||||
Tax payments related to restricted stock units | — | — | (12,907 | ) | — | — | (12,907 | ) | — | (12,907 | ) | |||||||||||||||||||
Stock-based compensation expense | — | — | 53,897 | — | — | 53,897 | — | 53,897 | ||||||||||||||||||||||
Tax effects of stock-based compensation | — | — | 248 | — | — | 248 | — | 248 | ||||||||||||||||||||||
Dividends paid to noncontrolling interests shareholders | — | — | — | — | — | — | (1,854 | ) | (1,854 | ) | ||||||||||||||||||||
Total comprehensive income (loss) | — | — | — | (38,130 | ) | (119,677 | ) | (157,807 | ) | 1,507 | (156,300 | ) | ||||||||||||||||||
Balance as of October 31, 2014 | 113,314 | 1,133 | 1,675,695 | (538,208 | ) | (104,830 | ) | 1,033,790 | 36,108 | 1,069,898 | ||||||||||||||||||||
Issuance of common stock, net of issuance costs | 1,828 | 19 | 12,885 | — | — | 12,904 | — | 12,904 | ||||||||||||||||||||||
Tax payments related to restricted stock units | — | — | (4,571 | ) | — | — | (4,571 | ) | — | (4,571 | ) | |||||||||||||||||||
Stock-based compensation expense | — | — | 42,253 | — | — | 42,253 | — | 42,253 | ||||||||||||||||||||||
Tax effects of stock-based compensation | — | — | (268 | ) | — | — | (268 | ) | — | (268 | ) | |||||||||||||||||||
Stock repurchases | (2,458 | ) | (27 | ) | — | (76,605 | ) | — | (76,632 | ) | — | (76,632 | ) | |||||||||||||||||
Adjustment on redemption of noncontrolling interest | — | — | 422 | — | — | 422 | — | 422 | ||||||||||||||||||||||
Dividends paid to noncontrolling interests shareholders | — | — | — | — | — | — | (2,412 | ) | (2,412 | ) | ||||||||||||||||||||
Total comprehensive income (loss) | — | — | — | 79,097 | (187,491 | ) | (108,394 | ) | 1,241 | (107,153 | ) | |||||||||||||||||||
Balance as of October 31, 2015 | 112,684 | $ | 1,125 | $ | 1,726,416 | $ | (535,716 | ) | $ | (292,321 | ) | $ | 899,504 | $ | 34,937 | $ | 934,441 | |||||||||||||
The accompanying notes are an integral part of these consolidated financial statements.
93
VERIFONE SYSTEMS, INC.
CONSOLIDATED STATEMENTS OF CASH FLOWS
Years Ended October 31, | |||||||||||
2015 | 2014 | 2013 | |||||||||
(In thousands) | |||||||||||
Cash flows from operating activities | |||||||||||
Consolidated net income (loss) | $ | 80,357 | $ | (36,442 | ) | $ | (295,001 | ) | |||
Adjustments to reconcile consolidated net income (loss) to net cash provided by operating activities: | |||||||||||
Depreciation and amortization, net | 169,400 | 213,641 | 207,798 | ||||||||
Stock-based compensation expense | 42,253 | 53,897 | 48,851 | ||||||||
Deferred income taxes, net | (31,574 | ) | (37,975 | ) | 142,904 | ||||||
Write-off of debt issuance cost upon extinguishment | — | 7,153 | — | ||||||||
Other | 13,050 | 16,811 | 5,107 | ||||||||
Net cash provided by operating activities before changes in operating assets and liabilities | 273,486 | 217,085 | 109,659 | ||||||||
Changes in operating assets and liabilities: | |||||||||||
Accounts receivable, net | (75,432 | ) | (29,518 | ) | 84,299 | ||||||
Inventories | (16,415 | ) | 9,454 | 26,784 | |||||||
Prepaid expenses and other assets | (16,934 | ) | 10,154 | (8,462 | ) | ||||||
Accounts payable | 41,206 | 47,389 | (77,004 | ) | |||||||
Deferred revenue, net | 12,707 | 20,042 | 22 | ||||||||
Other current and long-term liabilities | 30,669 | (75,539 | ) | 101,172 | |||||||
Net change in operating assets and liabilities | (24,199 | ) | (18,018 | ) | 126,811 | ||||||
Net cash provided by operating activities | 249,287 | 199,067 | 236,470 | ||||||||
Cash flows from investing activities | |||||||||||
Capital expenditures | (106,492 | ) | (85,011 | ) | (77,535 | ) | |||||
Acquisition of businesses, net of cash and cash equivalents acquired | (22,072 | ) | — | (75,908 | ) | ||||||
Other investing activities, net | 115 | 7,118 | 8,713 | ||||||||
Net cash used in investing activities | (128,449 | ) | (77,893 | ) | (144,730 | ) | |||||
Cash flows from financing activities | |||||||||||
Proceeds from debt, net of issuance costs | 125,000 | 1,099,434 | 123,174 | ||||||||
Repayments of debt | (198,289 | ) | (1,260,794 | ) | (399,043 | ) | |||||
Proceeds from issuance of common stock through employee equity incentive plans | 13,269 | 35,384 | 11,126 | ||||||||
Payments of acquisition-related contingent consideration | (739 | ) | (524 | ) | (10,999 | ) | |||||
Stock repurchases | (70,134 | ) | — | — | |||||||
Other financing activities, net | (2,665 | ) | (1,571 | ) | (1,690 | ) | |||||
Net cash used in financing activities | (133,558 | ) | (128,071 | ) | (277,432 | ) | |||||
Effect of foreign currency exchange rate changes on cash and cash equivalents | (28,597 | ) | (11,136 | ) | (160 | ) | |||||
Net decrease in cash and cash equivalents | (41,317 | ) | (18,033 | ) | (185,852 | ) | |||||
Cash and cash equivalents, beginning of period | 250,187 | 268,220 | 454,072 | ||||||||
Cash and cash equivalents, end of period | $ | 208,870 | $ | 250,187 | $ | 268,220 | |||||
Supplemental disclosures of cash flow information | |||||||||||
Cash paid for interest | $ | 27,301 | $ | 32,253 | $ | 37,383 | |||||
Cash paid for income taxes | $ | 20,529 | $ | 27,333 | $ | 26,454 | |||||
The accompanying notes are an integral part of these consolidated financial statements.
94
VERIFONE SYSTEMS, INC.
NOTES TO CONSOLIDATED FINANCIAL STATEMENTS
Note 1. Principles of Consolidation and Summary of Significant Accounting Policies
Business Description
We are a leading global provider of secure electronic payment solutions at the point of sale. We provide expertise, solutions, and services that add value at the point of sale. We focus on delivering value to our customers at the point of sale where merchant and consumer requirements drive increasingly innovative point of sale payment capabilities, value-added services that increase merchant revenues, and consumer experience solutions that enrich the interaction between merchant and consumers. Today we are an industry leader in multi-application payment systems deployments. Key industries in which we operate include financial services, retail, petroleum, restaurant, hospitality, taxi, transportation, and healthcare.
VeriFone Systems, Inc. was incorporated in the state of Delaware on June 13, 2002 in order to acquire VeriFone, Inc. on July 1, 2002. VeriFone, Inc. was incorporated in 1981 and became our principal operating subsidiary on July 1, 2002. Effective May 18, 2010, we changed our corporate name from VeriFone Holdings, Inc. to VeriFone Systems, Inc. Shares of VeriFone Systems, Inc. are listed on the New York Stock Exchange under the trading symbol PAY.
Basis of Presentation
The accompanying Consolidated Financial Statements include the accounts of VeriFone Systems, Inc. ("VeriFone") and our wholly-owned and majority-owned subsidiaries. Amounts pertaining to the noncontrolling ownership interests held by third parties in the operating results and financial position of our majority-owned subsidiaries are reported as noncontrolling interests. All intercompany accounts and transactions have been eliminated. The Consolidated Financial Statements also include the results of companies acquired by us from the date of each acquisition.
We have four operating segments: North America, Latin America, EMEA, and Asia-Pacific. Our North America segment is defined as our operations in the U.S. and Canada. Our Latin America segment is defined as our operations in South America, Central America, Mexico, and the Caribbean. Our EMEA segment is defined as our operations in Europe, Russia, the Middle East, and Africa. Our Asia-Pacific segment is defined as our operations in Australia, New Zealand, China, India, and throughout the rest of Greater Asia, including other Asia-Pacific Rim countries. Our reportable segments are the same as our operating segments. We determine our operating segments based on the discrete financial information used by our Chief Executive Officer, who is our chief operating decision maker, to assess performance, allocate resources, and make decisions regarding VeriFone's operations. As a result of new Company leadership and related changes in the structure of our internal organization, during July 2015 we realigned our operating segments in fiscal year 2015. All prior period amounts reported by segment have been reclassified to conform to the current presentation. Our Chief Executive Officer is evaluating using global product line financial information to manage the business in the future. If our Chief Executive Officer is provided different financial information to assess performance, allocate resources and make decisions regarding VeriFone's operations, we will reassess our operating segment presentation.
Certain prior period amounts reported in our Consolidated Financial Statements and notes thereto have been reclassified to conform to the current period presentation, with no impact on previously reported operating results or financial position. For example, as a result of adopting new accounting pronouncements, we have reclassified debt issuance costs, as well as deferred tax assets and liabilities, in our Consolidated Balance Sheet as of October 31, 2014.
95
Use of Estimates
The preparation of financial statements in conformity with U.S. GAAP requires us to make estimates and assumptions about future events that affect the amounts reported in our Consolidated Financial Statements and accompanying notes. We evaluate our estimates on an ongoing basis when updated information related to such estimates becomes available. We base our estimates on historical experience and information available to us at the time these estimates are made. Actual results could differ materially from these estimates.
Significant Accounting Policies
Foreign Currency
We determine the functional currency for VeriFone and our subsidiaries by reviewing the currencies in which their respective operating activities occur. For our subsidiaries whose functional currencies are not the U.S. Dollar, we generally translate assets and liabilities using exchange rates in effect as of the applicable balance sheet dates. Revenue and expenses for these subsidiaries are translated using average rates which approximate those in effect during the period. Foreign currency translation gains and losses are included in stockholders' equity as a component of Accumulated other comprehensive loss in our Consolidated Balance Sheets.
Monetary assets and liabilities denominated in currencies other than the functional currency of that subsidiary are remeasured to the functional currency using exchange rates in effect as of the applicable balance sheet dates, and nonmonetary assets and liabilities are remeasured using historical rates. Gains and losses from these remeasurements are recorded as Other income (expense), net in our Consolidated Statements of Operations.
Revenue Recognition
System solutions net revenues include net revenues from the sale of products and associated perpetual software licenses and accessories. Services net revenues include net revenues from services such as our "All-in-One" payment services, installation, customer support, repair services related to our System solutions, transaction processing, custom software development, and extended warranties, as well as from advertising in and on taxis and displays at petroleum dispensers, and leases of our products.
We recognize revenues net of sales taxes and value-added taxes when title and risk of loss have passed to the customer and all of the following criteria are met: (i) there is persuasive evidence that an arrangement exists; (ii) delivery of the products or services has occurred; (iii) the selling price is fixed or determinable; and (iv) collection is reasonably assured and not contingent upon future performance.
Net revenues from sales to end-users, resellers, value-added resellers, and distributors are generally recognized upon shipment of the product. End-users, resellers, value-added resellers, and distributors generally have no rights of return, stock rotation rights, or price protection.
We recognize revenue from operating lease arrangements over the term of the applicable lease arrangements. Net revenues from operating lease arrangements represent less than 10% of our total net revenues and are classified as Services net revenues.
Net revenues from services obligations to be provided over a period of time are initially deferred and then recognized on a straight-line basis over the period during which the services are provided. Net revenues from services billed on a per incident basis are recognized as the services are rendered. Net revenues from fees for payment services are recognized when the payment services are complete. Advertising revenues are recognized as the related services are performed.
96
We periodically enter into software development contracts with our customers that we recognize as net revenues on a completed contract basis. During the period of performance of such contracts, billings and costs are accumulated on the balance sheet, but no profit is recorded before completion or substantial completion of the project or milestone. We generally use customers' acceptance as the specific criteria to determine when such contracts are substantially completed. Provisions for losses on software development contracts are recorded in the period they become evident. Net revenues from software development contracts comprise less than 1% of our total net revenues.
Revenue Recognition for Multiple-Element Arrangements
When an arrangement includes multiple deliverables, we allocate the arrangement consideration to each deliverable qualifying as a separate unit of accounting based on its relative selling price at the inception of the arrangement. We determine the relative selling price based on the estimated selling price ("ESP") using vendor specific objective evidence ("VSOE"), if it exists, and otherwise third-party evidence ("TPE"). If neither VSOE nor TPE exists for a unit of accounting, we use best estimated selling price ("BESP").
VSOE is limited to the price charged when the same or similar product or service is sold separately. We define VSOE as substantial standalone transactions that are priced within a narrow range, as defined by us. In addition, we consider the geographies in which the products or services are sold, as well as the class of customers to which the products or services are sold. If a product or service is seldom sold separately, it is unlikely that we can determine VSOE for the product or service.
TPE is determined based on the prices charged by our competitors for a similar deliverable when sold separately to similarly situated customers. As our products and services contain a significant level of differentiation compared to our competitors' products, comparable prices are generally not available.
When we are unable to establish selling price using VSOE or TPE, we use BESP when allocating the arrangement consideration. BESP is the price at which management estimates that we would enter into a transaction with the customer if the product or service was to be sold by us regularly on a standalone basis. Our determination of BESP involves a weighting of several factors based on the specific facts and circumstances of the arrangement. The factors we consider include the geographies in which the products or services are sold, the anticipated gross margin on that deliverable, the cost to produce the deliverable, economic conditions and market trends, the selling price and gross margin for similar deliverables, and our ongoing pricing strategy and policies.
We analyze ESP at least annually or on a more frequent basis if a significant change in our business necessitates a more timely analysis or if we experience significant variances in our selling prices.
In multiple element arrangements that include software, we first evaluate if a tangible product includes software. If a tangible product includes software and if both the tangible product and software components function together to deliver the tangible product's essential functionality, then we will treat the entire product as a non-software element. If the arrangement is deemed to have a software element, we first allocate the total arrangement consideration between the software group of elements as a whole and the non-software elements as a whole based on their relative selling prices, and then to the elements within those groups based on the applicable guidance.
Shipping and Handling Costs
Shipping and handling costs incurred for delivery to customers are expensed as incurred, and are included in Cost of net revenues in our Consolidated Statements of Operations. In those instances where we bill shipping and handling costs to customers, the amounts billed are classified as Net revenues in our Consolidated Statements of Operations.
97
Warranty Costs
We accrue for estimated warranty obligations when revenue is recognized based on an estimate of future warranty costs for delivered products. Such estimates are based on historical experience and expectations of future costs. At least annually or whenever circumstances warrant, we evaluate and adjust the accrued warranty costs to the extent actual warranty costs vary from the original estimates. Our warranty period typically extends from one to three years from the date of shipment. Actual warranty costs may differ materially from management's estimates.
Costs associated with maintenance contracts, including extended warranty contracts, are expensed when they are incurred.
Stock-Based Compensation
We measure stock-based compensation cost at the grant date, based on the estimated fair value of the award and the estimated number of shares we ultimately expect will vest. Stock-based compensation cost is recognized as expense on a straight-line basis over the requisite service period. Cash flows resulting from the tax benefits due to tax deductions in excess of the compensation cost recognized for those awards are classified as financing cash flows.
Advertising Costs
Advertising costs are expensed as incurred, and were immaterial for all periods presented in our Consolidated Statements of Operations.
Research and Software Development Costs
Research and development costs are generally expensed when incurred.
Software development costs incurred to develop software products for resale, including the costs of software components of our products, are subject to capitalization beginning when a product's technological feasibility has been established and ending when a software or product is available for general release to customers. Capitalized costs of software for resale are amortized on a straight-line basis over the estimated life of the software or associated product, generally three to five years, commencing when the respective software or product is available to customers.
Software development costs for internal use software are subject to capitalization during the application development stage, beginning when a project, that will result in additional functionality, is approved and ending when the software is put into productive use. Capitalized internal use software costs are amortized on a straight-line basis over the estimated life of the software, generally three to six years, commencing when the respective software is put into productive use.
Amortization related to capitalized software development costs totaled $5.5 million, $4.6 million, and $3.3 million for the fiscal years ended October 31, 2015, 2014, and 2013, respectively. Unamortized capitalized software development costs totaled $35.5 million and $23.3 million as of October 31, 2015 and 2014, respectively, and are recorded as a component of Other long-term assets in our Consolidated Balance Sheets.
Restructuring
The determination of when we accrue for employee involuntary termination benefits depends on whether the termination benefits are provided under a one-time benefit arrangement or under an on-going benefit arrangement. We record charges for one-time benefit arrangements in accordance with ASC 420 Exit or Disposal Cost Obligations and charges for on-going benefit arrangements in accordance with ASC 712 Nonretirement Postemployment Benefits.
98
We recognize a liability for costs associated with the closure of facilities when the liability is incurred. We measure these liabilities at fair value. Costs to terminate a contract before the end of its term are recognized when we terminate the contract in accordance with the contract terms. Costs that will continue to be incurred under a contract for its remaining term without economic benefit are recognized at the facility cease-use date.
Income Taxes
Deferred tax assets and liabilities are recognized for the expected tax consequences of temporary differences between the tax bases of assets and liabilities, and their reported amounts using enacted tax rates in effect for the year the differences are expected to reverse. In evaluating our ability to recover our deferred tax assets management considers all available positive and negative evidence including the past operating results, the existence of cumulative losses in past fiscal years, and the forecasted future taxable income in the jurisdictions in which we have operations.
We have established valuation allowances on U.S. deferred tax assets and certain non-U.S. deferred tax assets because realization of these tax benefits through future taxable income is not more likely than not as of October 31, 2015 and 2014. We intend to maintain the valuation allowances until sufficient positive evidence exists to support the reversal of the valuation allowances. An increase in the valuation allowance would result in additional tax expense in such period. We make estimates and judgments about our future taxable income that are based on assumptions that are consistent with our plans and estimates. Should the actual amounts differ from the estimates, the amount of the valuation allowance could be materially impacted.
We must make certain estimates and judgments in determining income tax expense for financial statement purposes. These estimates and judgments occur in the calculation of tax credits and deductions, and in the calculation of certain tax assets and liabilities, which arise from differences in the timing of recognition of revenue and expense for tax and financial statement purposes, as well as the interest and penalties relating to these uncertain tax positions. Significant changes to these estimates may result in an increase or decrease to our tax provision in a subsequent period.
The calculation of our tax liabilities involves dealing with uncertainties in the application of complex tax laws. Our estimate for the potential outcome of any uncertain tax issue is based on detailed facts and circumstances of each issue. Resolution of these uncertainties in a manner inconsistent with our expectations could have a material impact on our results of operations and financial condition.
In addition, the calculation of our tax liabilities involves dealing with uncertainties in the application of complex tax regulations. We recognize liabilities for uncertain tax positions based on a two-step process. The first step is to evaluate the tax position for recognition by determining if the weight of available evidence indicates that it is more likely than not that the position will be sustained on audit, including resolution of related appeals or litigation processes, if any. The second step requires us to estimate and measure the tax benefit as the largest amount that is more than 50% likely of being realized upon ultimate settlement. It is inherently difficult and subjective to estimate such amounts, as this requires us to determine the probability of various possible outcomes. We reevaluate these uncertain tax positions on a quarterly basis. This evaluation is based on factors including, but not limited to, changes in facts or circumstances, changes in tax law, effectively settled issues under audit, and new audit activity. Such a change in recognition or measurement would result in the recognition of a tax benefit or an additional charge to the tax provision in the period.
Cash and Cash Equivalents
Cash and cash equivalents consist of cash, money market funds, and time deposits with maturities of three months or less when purchased.
99
Allowance for doubtful accounts
An allowance for doubtful accounts is established with respect to those amounts that we determine to be doubtful of collection using specific identification of doubtful accounts and an aging of receivables analysis based on invoice due dates. Actual collection losses may differ materially from management's estimates. Uncollectible receivables are written off against the allowance for doubtful accounts when all efforts to collect them have been exhausted. Accounts receivable payment terms are generally between net 30 to 60 days, unless special payment terms are arranged.
Inventories
Inventories are stated at the lower of standard cost and net realizable value. We compute inventory cost using standard costs, primarily on a FIFO method. Standard costs approximate actual costs, including materials, manufacturing costs, in-bound freight costs, and inbound-related supply chain costs. We regularly monitor inventory quantities on hand and committed orders with contract manufacturers, and record write-downs for excess and obsolete inventories based primarily on the shipment history and our estimated forecast of product demand. Such write-downs establish a new cost basis of accounting for the related inventory.
Consigned inventories from our contract manufacturers where title has not been transferred to us are excluded from our inventories. In certain circumstances, we are obligated to prepay deposits to our contract manufacturers based on a percentage of the value of the inventories consigned to us, and after a certain period of time has elapsed, we may be required to prepay the full amount if we have not taken title to the inventory. Prepayments for consigned inventory are included in Prepaid expenses and other current assets in our Consolidated Balance Sheets.
Generally, we take title to consigned inventories when we ship to our customers, and record the full cost of the inventories as Cost of net revenues at that time. We must purchase the consigned inventories from our contract manufacturers after a certain agreed-upon period of time, ranging from 30 days to one year. Consigned inventories are included in our calculation of minimum order commitments from our contract manufacturers.
Fair Value Measurements
Our financial assets and liabilities consist principally of cash, accounts receivable, accounts payable, debt, foreign exchange forward contracts, interest rate swaps, and contingent consideration payable. We measure and record certain of our financial assets and liabilities at fair value on a recurring basis. The estimated fair values of cash, accounts receivable, and accounts payable approximate their carrying value. The estimated fair value of our debt approximates the carrying value because the interest rate on such debt adjusts to market rates on a periodic basis. Foreign exchange forward contracts, interest rate swaps, and contingent consideration payable are recorded at estimated fair value.
We define fair value as the price that would be received from selling an asset or paid to transfer a liability in an orderly transaction between market participants at the measurement date. When estimating fair value, we consider the principal or most advantageous market in which we would transact, and we consider assumptions that market participants would use in pricing the asset or liability, such as inherent risk, transfer restrictions, credit risk, and risk of non-performance.
In measuring fair value, we follow a three-level hierarchy based on the inputs used:
Level 1 — Observable inputs that reflect unadjusted quoted prices for identical assets or liabilities in active markets.
Level 2 — Other inputs that are directly or indirectly observable in the marketplace, such as similar instruments in an active
market, or computations using, among other inputs, forward pricing curves, credit default spreads, or the Black-Scholes-Merton valuation model.
Level 3 — Unobservable inputs that are supported by little or no market activity.
100
Our non-financial assets, such as goodwill, purchased intangible assets, and property, plant and equipment are carried at cost until there are indicators of impairment, and are recorded at fair value only when an impairment charge is recognized.
Derivative Financial Instruments
We use derivative financial instruments to manage certain exposures to foreign currency exchange rate and interest rate risks. Our primary objective in holding derivatives is to reduce the volatility of earnings and cash flows associated with changes in foreign currency exchange rates and interest rates.
We do not use derivative financial instruments for speculative or trading purposes, nor do we hold or issue leveraged derivative financial instruments. Our derivative financial instruments do not include a right of offset, and we do not offset derivative financial assets against derivative financial liabilities.
Our derivative financial instruments consist primarily of foreign exchange forward contracts, which we use to hedge certain existing and anticipated foreign currency denominated transactions, and interest rate swaps, which we use to hedge a portion of the variability in cash flows related to our interest payments. We recognize the estimated fair value of our outstanding derivative financial instruments on our Consolidated Balance Sheets at the end of each reporting period as either assets or liabilities. Foreign exchange forward contracts generally mature within 90 days of inception. The interest rate swaps will mature on March 31, 2018.
Gains and losses arising from the effective portion of derivative financial instruments that are designated as cash flow hedges are recorded in Accumulated other comprehensive income (loss), and are subsequently reclassified into earnings in the period or periods during which the underlying transactions affect earnings. Gains and losses on derivative financial instruments representing either hedge ineffectiveness or hedge components excluded from the assessment of effectiveness are recognized in Other income (expense), net or Interest expense, net, respectively.
We formally document relationships between hedging instruments and associated hedged items, and formally assess hedge effectiveness, both at hedge inception and on an ongoing basis. When an anticipated transaction is no longer likely to occur, the corresponding derivative instrument is ineffective as a hedge, and changes in fair value of the instrument are recognized in Other income (expense), net.
Derivative financial instruments that are not designated as hedging instruments predominantly consist of foreign exchange forward contracts used to hedge foreign currency-denominated inter-company receivables and payables exposures arising from product sales and loans from one of our entities to another. Gains and losses arising from changes in the fair values of derivative financial instruments that are not designated as hedging instruments are recognized in Other income (expense), net.
Long-Lived Assets
Fixed assets are stated at cost, net of accumulated depreciation and amortization. Fixed assets are depreciated on a straight-line basis over the estimated useful lives of the assets, generally ranging from three to ten years, except buildings which are depreciated from 40 to 50 years. Leasehold improvements are depreciated over the lesser of the lease term or the estimated useful life of the asset.
Revenue generating assets are comprised of tangible assets that we have placed at third party locations for the purpose of generating revenues, such as in taxi cabs, at gas stations, and at merchant locations, under rental or service based arrangements. Revenue generating assets are stated at cost, net of accumulated depreciation, and are generally depreciated on a straight-line basis over the estimated useful lives of the assets, generally five years. Payments to acquire revenue generating assets are included in Capital expenditures within cash flows from investing activities on our Consolidated Statements of Cash Flows.
101
Equipment under capital leases is recorded at the lesser of the present value of the minimum lease payments at the beginning of the lease term or the fair value of such equipment. Leased equipment is amortized on a straight-line basis over the shorter of the lease term or the estimated useful life of such equipment.
Purchased intangible assets that have finite useful lives are amortized on a straight-line basis over their estimated period of benefit, generally ranging from one to 20 years.
If the estimated period of benefit for any of our long-lived assets is determined to have changed, we amortize the remaining net book values over the revised period of benefit.
We periodically evaluate whether changes have occurred that would render our long-lived assets not recoverable. If such circumstances arise, we use an estimate of the undiscounted value of expected future operating cash flows to determine whether the long-lived assets are impaired. If the aggregate undiscounted cash flows are less than the carrying amount of the assets, the resulting impairment charge to be recorded is calculated based on the excess of the carrying amount of the assets over the fair value of such assets, with the fair value generally determined based on an estimate of discounted future cash flows.
Goodwill
Goodwill is measured as the excess of consideration transferred and the net of the acquisition date fair value of assets acquired and liabilities assumed in a business acquisition. Goodwill is not amortized for accounting purposes.
We review the goodwill allocated to each of our reporting units for possible impairment annually on August 1 and whenever events or changes in circumstances indicate its carrying amount may not be recoverable. When assessing goodwill for impairment, we have the option to first assess qualitative factors to determine whether the existence of events or circumstances leads to a determination that it is more likely than not that the fair value of a reporting unit is less than its carrying amount. If, after assessing the totality of events or circumstances, we determine it is more likely than not that the fair value of a reporting unit is less than its carrying amount, then we perform a two-step impairment test. If, we conclude otherwise, then no further action is taken. We also have the option to bypass the qualitative assessment and only perform a quantitative assessment, which is the first step of the two-step impairment test. In the two-step impairment test, we measure the recoverability of goodwill by comparing a reporting unit's carrying amount, including goodwill, to the estimated fair value of the reporting unit.
In assessing the qualitative factors, we assess relevant events and circumstances that may impact the fair value and the carrying amount of the reporting unit. The identification of relevant events and circumstances, and how these may impact a reporting unit's fair value or carrying amount involve significant judgments and assumptions. The judgment and assumptions include the identification of macroeconomic conditions, industry, and market considerations, cost factors, overall financial performance, VeriFone-specific events, and share price trends, and making the assessment as to whether each relevant factor will impact the impairment test positively or negatively and the magnitude of any such impact.
The carrying amount of each reporting unit is determined based upon the assignment of our assets and liabilities, including existing goodwill and other intangible assets, to the identified reporting units. Where an acquisition benefits only one reporting unit, we allocate, as of the acquisition date, all goodwill for that acquisition to the reporting unit that will benefit. Where we have had an acquisition that benefited more than one reporting unit, we have assigned the goodwill to our reporting units as of the acquisition date such that the goodwill assigned to a reporting unit is the excess of the fair value of the acquired business, or portion thereof, to be included in that reporting unit over the fair value of the individual assets acquired and liabilities assumed that are assigned to the reporting unit.
102
The estimated fair value of the reporting units is determined using the income approach. The income approach focuses on the income-producing capability of an asset, measuring the current value of the asset by calculating the present value of its future economic benefits such as cash earnings, cost savings, tax deductions, and proceeds from disposition. Value indications are developed by discounting expected cash flows to their present value at a rate of return that incorporates the risk-free rate for the use of funds, the expected rate of inflation, and risks associated with the particular investment. Cash flow projections are based on management's estimates of revenue growth rates and operating margins, taking into consideration industry and market conditions. The discount rate used is based on the weighted-average cost of capital adjusted for the relevant risk associated with business-specific characteristics and the uncertainty related to the business's ability to execute on the projected cash flows.
In order to assess the reasonableness of the calculated fair values of its reporting units, we compare the sum of the reporting units' fair values to our market capitalization and calculate an implied control premium (the excess of the sum of the reporting units' fair values over the market capitalization). We evaluate the reasonableness of the premium over market capitalization by first quantifying certain controlling market participants' synergies included in the income approach. We then supplement this step by comparing the implied premiums for each reporting unit to the premiums implied by recent comparable transactions. If the implied control premium is not reasonable in light of these recent transactions, we will reevaluate our fair value estimates of the reporting units by adjusting the discount rates or other assumptions.
If the carrying amount of a reporting unit is in excess of its fair value, an impairment may exist, and we must perform the second step of the impairment analysis to measure the amount of the impairment loss, by allocating the reporting unit's fair value to its assets and liabilities other than goodwill, comparing the carrying amount of the goodwill to the resulting implied fair value of the goodwill, and recording an impairment charge for any excess.
Debt Issuance Costs and Original Issue Discounts
Costs incurred in connection with the issuance of new debt are generally capitalized and amounts paid in connection with the modification of existing debt are generally expensed as incurred. Capitalizable debt issuance costs paid to third parties and original issue discounts paid to creditors, net of amortization, are offset against the associated Short-term and Long-term debt on our Consolidated Balance Sheets.
Amortization expense on capitalized debt issuance costs and original issue discounts related to loans with fixed payment terms is calculated using the effective interest method over the term of the associated loans. Amortization expense on capitalized debt issuance costs and original issue discounts related to revolving loans are calculated using the straight-line method over the term of the revolving loan commitment. Amortization expense is recorded in Interest expense, net in our Consolidated Statements of Operations. When debt is extinguished prior to the maturity date, any remaining associated debt issuance costs or original issue discounts are expensed to Interest expense, net in our Consolidated Statements of Operations.
Business Combinations
In a business combination, we recognize separately from goodwill the assets acquired and the liabilities assumed. While we use our best estimates and assumptions to accurately value assets acquired and liabilities assumed at the acquisition date, our estimates are inherently uncertain and subject to adjustment. As a result, during the measurement period, which may be up to one year from the acquisition date, we record adjustments to the assets acquired and liabilities assumed, with the corresponding offset to goodwill.
For a given acquisition, we generally identify certain pre-acquisition contingencies as of the acquisition date, and may extend our review and evaluation of these pre-acquisition contingencies throughout the measurement period in order to obtain sufficient information to assess whether we include these contingencies as a part of the purchase price allocation and, if so, to determine the estimated amounts.
103
If we determine that a pre-acquisition non-income tax related contingency is probable in nature and estimable as of the acquisition date, we record our best estimate for such contingency as a part of the preliminary purchase price allocation. We often continue to gather related information and evaluate our pre-acquisition contingencies throughout the measurement period and if we make changes to the amounts recorded or if we identify additional pre-acquisition contingencies during the measurement period, such amounts will be recorded in the period in which they are identified.
In addition, uncertain tax positions and tax-related valuation allowances assumed in connection with a business combination are initially estimated as of the acquisition date. We reevaluate these items quarterly with any adjustments to our preliminary estimates being recorded to goodwill provided that we are within the measurement period, and we continue to collect information in order to determine their estimated values. Subsequent to the measurement period or our final determination of the tax allowance’s or contingency’s estimated value, changes to these uncertain tax positions and tax-related valuation allowances will affect our Income tax provision (benefit) in our Consolidated Statements of Operations and could have a material impact on our results of operations and financial position.
Acquisition-related costs are expensed as incurred.
Concentrations of Credit Risk
Cash is placed on deposit in major financial institutions around the world. Some of these deposits may be in excess of insured limits. We believe that the financial institutions that hold our cash are financially sound and, accordingly, minimal credit risk exists with respect to these balances.
We invest cash not required for use in operations in high credit quality securities based on our investment policy. The investment policy has limits based on credit quality, investment concentration, investment type, and maturity that we believe reduce the risk of loss. Investments are of a short-term nature and include investments in money market funds and time deposits.
Our derivative financial instruments expose us to credit risk to the extent that the counterparties may be unable to meet the terms of the agreement when we have an unrealized gain on the instrument. We believe the counterparties for our outstanding contracts are large, financially sound institutions, and thus we do not anticipate nonperformance by these counterparties. However, given the high debt levels of many countries and institutions worldwide, the failure of the counterparties is possible. We have not experienced any investment losses due to institutional failure or bankruptcy.
Our accounts receivable are derived from sales to a large number of direct customers, resellers, and distributors globally. We perform ongoing evaluations of our customers' financial condition and limit the amount of credit extended when deemed necessary, but generally require no collateral. As of October 31, 2015 and 2014 no single customer accounted for more than 10% of our total Accounts receivable, net. For fiscal years 2015, 2014, and 2013 no single customer accounted for more than 10% of our total Net revenues.
We utilize a limited number of third parties to manufacture our products, and rely upon these contract manufacturers to produce and deliver products on a timely basis and at an acceptable cost. Furthermore, a majority of our manufacturing activities are concentrated in China and Brazil. As a result, disruptions to the business or operations of the contract manufacturers or to their ability to produce the required products in a timely manner, and particularly disruptions to the manufacturing facilities located in China and Brazil, could significantly impact our business and operations. In addition, a number of components that are necessary to manufacture and assemble our systems are specifically customized for use in our products and are obtained from sole source suppliers on a purchase order basis. Because of the customized nature of these components and the limited number of available suppliers, if we were to experience a supply disruption, it would be difficult and costly to find alternative sources in a timely manner.
104
Recent Accounting Pronouncements
During July 2013, the FASB issued ASU 2013-11, Presentation of an Unrecognized Tax Benefit When a Net Operating Loss Carryforward, a Similar Tax Loss, or a Tax Credit Carryforward Exists. ASU 2013-11 provides presentation requirements for unrecognized tax benefits when a net operating loss carryforward, a similar tax loss or a tax credit carryforward exists and would likely be settled as a reduction of such tax attributes. We adopted ASU 2013-11 effective November 1, 2014 prospectively. Adoption resulted in a $24.2 million reduction of Deferred tax assets and Other long-term liabilities in our Consolidated Balance Sheets at November 1, 2014, because the payable amount of unrecognized tax benefits is presented net against Deferred tax assets. Adoption had no impact on our results of operations.
During May 2014, the FASB issued ASU 2014-09, Revenue from Contracts with Customers, which provides new guidance on the recognition of revenue and states that an entity should recognize revenue to depict the transfer of promised goods or services to customers in an amount that reflects the consideration to which the entity expects to be entitled in exchange for those goods or services. The standard was originally effective for annual reporting periods beginning after December 15, 2016, including interim periods within that reporting period. On July 9, 2015, the FASB deferred the effective date to annual reporting periods beginning after December 15, 2017, including interim periods within that reporting period. Early adoption is permitted as of the original effective date. We are currently evaluating our adoption timing, the transition method we will use and the impact of this new pronouncement on our consolidated financial position and results of operations.
During April 2015, the FASB issued ASU 2015-03, Simplifying the Presentation of Debt Issuance Costs and during August 2015, the FASB issued ASU 2015-15, Presentation and Subsequent Measurement of Debt Issuance Costs Associated with Line-of-Credit Arrangements. ASU 2015-03 requires that debt issuance costs related to a recognized debt liability are presented in the balance sheet as a direct deduction from the carrying amount of that debt liability. ASU 2015-15 clarifies that the SEC staff would not object to an entity deferring and presenting debt issuance costs as an asset and subsequently amortizing the deferred debt issuance costs ratably over the term of the line-of-credit arrangement, regardless of whether there are any outstanding borrowings on the line-of-credit arrangement. We early adopted ASU 2015-03 effective October 31, 2015 retrospectively. Adoption resulted in a $0.3 million decrease in Prepaid expenses and other current assets with a corresponding decrease in Short-term debt in our Consolidated Balance Sheets at both October 31, 2015 and October 2014, and a $11.1 million and $14.4 million decrease in Other long-term assets with a corresponding decrease in Long-term debt in our Consolidated Balance Sheets at October 31, 2015 and October 31, 2014, respectively. Adoption had no impact on our results of operations.
During July 2015, the FASB issued ASU 2015-11, Simplifying the Measurement of Inventory, which simplifies the measurement of inventory by measuring inventory at the lower of cost and net realizable value. Net realizable value is defined as the estimated selling price in the ordinary course of business, less reasonably predictable costs of completion, disposal and transportation. ASU 2015-11 is effective for fiscal years beginning after December 15, 2016, including interim periods within those fiscal years. Early adoption is permitted for any interim and annual financial statements that have not yet been issued. We early adopted ASU 2015-11 effective August 1, 2015 prospectively. Adoption had no impact on our results of operations.
During September 2015, the FASB issued ASU 2015-16, Simplifying the Accounting for Measurement-Period Adjustments, which requires that an acquirer recognize and disclose adjustments to provisional amounts that are identified during an acquisition measurement period in the reporting period in which the adjustment amounts are determined. ASU 2015-16 is effective for fiscal years beginning after December 15, 2015, including interim periods within those fiscal years. Early adoption is permitted for any interim and annual financial statements that have not yet been issued. We early adopted ASU 2015-16 effective October 31, 2015. Adoption had no impact on our consolidated financial position, or results of operations.
105
During November 2015, the FASB issued ASU 2015-17, Balance Sheet Classification of Deferred Taxes, which simplifies the presentation of deferred income taxes. ASU 2015-17 provides presentation requirements to classify deferred tax assets and liabilities as noncurrent in a classified statement of financial position. The standard is effective for fiscal years beginning after December 15, 2016, including interim periods within that reporting period. Early adoption is permitted for any interim and annual financial statements that have not yet been issued. We early adopted ASU 2015-17 effective October 31, 2015, retrospectively. Adoption resulted in a $16.7 million and $26.8 million decrease in Prepaid expenses and other current assets, a $2.6 million and $0.4 million decrease in Other current liabilities, a $2.9 million and $20.9 million increase in Long-term deferred tax assets, net, and a $11.2 million and $5.6 million decrease in Long-term deferred tax liabilities, net in our Consolidated Balance Sheets at October 31, 2015 and October 31, 2014, respectively. Adoption had no impact on our results of operations.
Note 2. Business Combinations
Fiscal Year 2015 Acquisitions
In fiscal year 2015, we completed five business combinations for consideration totaling $29.6 million, including $22.1 million of cash paid on acquisition date, $5.7 million in future consideration and contingent consideration with a fair value of $1.8 million at the acquisition dates. Each acquisition was accounted for using the acquisition method of accounting. These acquisitions were completed to augment our existing service offerings. Purchased intangible assets totaled $9.0 million related to developed and core technology, $2.8 million related to customer relationships, and $0.5 million related to other intangible assets. Goodwill from these acquisitions totaled $16.6 million and was substantially assigned to our North America reportable segment. Goodwill totaling $5.1 million will be deductible for income tax purposes.
Fiscal Year 2014 Acquisitions
In fiscal year 2014, we completed one business combination for contingent consideration with an $11.6 million fair value at the acquisition date. This acquisition was completed to augment our existing media service offerings. Purchased intangible assets, which principally related to customer relationships, totaled $4.8 million. Goodwill related to this acquisition totaled $6.8 million, was assigned to our North America reportable segment, and was deductible for income tax purposes.
Fiscal Year 2013 Acquisitions
In fiscal year 2013, we completed seven business combinations for consideration totaling $78.3 million in cash. Each acquisition was accounted for using the acquisition method of accounting. These acquisitions were completed to augment our existing service offerings and expand our distribution services into New Zealand. Purchased intangible assets totaled $31.2 million and consisted primarily of customer relationships valued at $25.3 million, which will be amortized over their estimated useful lives of two to nine years. Goodwill from these acquisitions totaled $43.5 million and represents the expected benefits of combining the acquisitions' operations with our operations, as well as the assembled workforce. Goodwill was substantially assigned to our Asia-Pacific reportable segment and is not deductible for income tax purposes.
Note 3. Net Income (Loss) per Share of Common Stock
Basic net income (loss) per share of common stock is computed by dividing net income (loss) attributable to VeriFone Systems, Inc. stockholders by the weighted average number of shares of common stock outstanding for the period. Diluted net income (loss) per share of common stock is computed using the weighted average number of shares of common stock outstanding plus the effect of common stock equivalents, unless the common stock equivalents are anti-dilutive. The potential dilutive shares of our common stock resulting from assumed exercises of equity related instruments are determined using the treasury stock method. Under the treasury stock method, an increase in the fair market value of our common stock will result in a greater number of dilutive securities.
106
The following table presents the computation of net income (loss) per share of common stock (in thousands, except per share data):
Years Ended October 31, | |||||||||||
2015 | 2014 | 2013 | |||||||||
Basic and diluted net income (loss) per share attributable to VeriFone Systems, Inc. stockholders: | |||||||||||
Numerator: | |||||||||||
Net income (loss) attributable to VeriFone Systems, Inc. stockholders | $ | 79,097 | $ | (38,130 | ) | $ | (296,055 | ) | |||
Denominator: | |||||||||||
Weighted average shares attributable to VeriFone Systems, Inc. stockholders - basic | 114,044 | 111,586 | 108,609 | ||||||||
Weighted average effect of dilutive securities: | |||||||||||
Stock options, RSUs and RSAs | 1,890 | — | — | ||||||||
Weighted average shares attributable to VeriFone Systems, Inc. stockholders - diluted | 115,934 | 111,586 | 108,609 | ||||||||
Net income (loss) per share attributable to VeriFone Systems, Inc. stockholders: | |||||||||||
Basic | $ | 0.69 | $ | (0.34 | ) | $ | (2.73 | ) | |||
Diluted | $ | 0.68 | $ | (0.34 | ) | $ | (2.73 | ) | |||
For the fiscal years ended October 31, 2015, 2014 and 2013, equity incentive awards representing 1.5 million, 7.6 million, and 6.3 million shares of common stock, respectively, were excluded from the calculation of weighted average shares for diluted net income (loss) per share as they were anti-dilutive. Anti-dilutive awards, which include stock options, RSUs and RSAs, could impact future calculations of diluted net income per share if the fair market value of our common stock increases.
Warrants to purchase 7.2 million shares of our common stock were outstanding at October 31, 2013 and expired unexercised in equal amounts on each trading day from December 19, 2013 to February 3, 2014. The warrants were anti-dilutive in the fiscal years ended October 31, 2014 and 2013 because the warrants' $62.356 exercise price was greater than the average share price of our common stock during those periods.
Note 4. Employee Benefit Plans
Retirement and Post-employment Plans
We maintain defined contribution retirement plans in certain countries, including a 401(k) plan for our U.S. employees. During fiscal years 2015, 2014, and 2013, we contributed $13.9 million, $15.4 million, and $13.5 million, respectively, to these plans.
We have defined benefit pension plans, as required by local laws, for our employees in certain countries, primarily Germany, France, and Taiwan, and non-retirement post-employment benefit plans for our employees in certain other countries, primarily Israel. These plans are not considered material to our financial position or results of operations.
Equity Incentive Plans
We have granted stock awards, including stock options, restricted stock units ("RSUs") and restricted stock awards ("RSAs") pursuant to stockholder-approved equity incentive plans. Our stock awards include vesting provisions that are based on either time, performance or market conditions. Shares issued to employees upon the exercise or vesting of equity incentive awards are issued from authorized unissued common stock.
107
2006 Equity Incentive Plan
In March 2006, our stockholders approved the 2006 Equity Incentive Plan for our officers, directors, employees, and consultants. Under this equity incentive plan, we have granted stock options, RSUs, and RSAs. Stock option awards are granted with an exercise price equal to the market price of our common stock at the date of grant, and have a maximum term of seven years. Awards under this plan are generally time-based awards with vesting over a period of 1 to 4 years from the date of grant, or performance-based awards with vesting based on achievement of specified criteria over a period of 1 to 3 years from the date of grant. The vesting conditions of all awards were set by the compensation committee of the Board of Directors at the time of the grant.
As of October 31, 2015, 9.8 million shares remained available for future grants under this plan. For purposes of the number of shares issuable under this plan, any awards granted as stock options are counted as one share for every award granted; RSUs or RSAs granted on or after June 29, 2011 are counted as 2.0 shares for every RSU or RSA granted; and RSUs or RSAs granted prior to June 29, 2011 are counted as 1.75 shares for every RSU or RSA granted.
Other Equity Incentive Plans
Stock options remain outstanding under several other equity incentive plans, including plans assumed in connection with our acquisitions of Hypercom and Lipman. We no longer grant stock options under any of these plans.
Equity Incentive Plan Activity
The following table provides a summary of stock option activity for the fiscal year ended October 31, 2015:
Number of Shares (thousands) | Weighted Average Exercise Price (per share) | Weighted Average Remaining Contractual Term (Years) | Aggregate Intrinsic Value (thousands) | |||||||||
Outstanding at beginning of period | 4,475 | $ | 26.58 | |||||||||
Granted | 44 | $ | 34.58 | |||||||||
Exercised | (771 | ) | $ | 16.71 | ||||||||
Canceled | (57 | ) | $ | 36.14 | ||||||||
Expired | (98 | ) | $ | 44.63 | ||||||||
Outstanding at end of period | 3,593 | $ | 28.15 | 3.28 | $ | 21,486 | ||||||
Vested or expected to vest at October 31, 2015 | 3,526 | $ | 28.22 | 3.25 | $ | 21,074 | ||||||
Exercisable at October 31, 2015 | 2,895 | $ | 28.68 | 2.92 | $ | 17,766 | ||||||
The weighted-average grant-date fair value per share for stock options granted during the fiscal years ended October 31, 2015, 2014, and 2013 was $13.44, $10.76, and $9.25, respectively. The total intrinsic value of options exercised during the fiscal years ended October 31, 2015, 2014, and 2013 was $14.5 million, $32.4 million, and $15.2 million, respectively.
108
The following table provides a summary of RSU and RSA activity for the fiscal year ended October 31, 2015 (in thousands):
Number of Shares | Aggregate Intrinsic Value | |||||
Outstanding at beginning of period | 3,124 | |||||
Granted | 1,847 | |||||
Vested | (1,193 | ) | ||||
Canceled | (454 | ) | ||||
Outstanding at end of period | 3,324 | $ | 100,179 | |||
Vested or expected to vest at October 31, 2015 | 2,848 | $ | 85,826 | |||
Vested and deferred at October 31, 2015 | 97 | $ | 2,936 | |||
During the fiscal year ended October 31, 2015 we granted 1.6 million RSUs with time-based vesting conditions and 0.2 million RSUs with performance-based vesting conditions contingent upon meeting certain financial and operational targets.
The weighted-average grant-date fair value per share for RSUs granted during the years ended October 31, 2015, 2014, and 2013 was $36.14, $34.93, and $21.81, respectively. The weighted-average grant-date fair value per share for RSAs granted during the fiscal year ended October 31, 2013 was $21.81. There were no RSAs granted during the fiscal years ended October 31, 2015 and 2014.
The total fair value of RSUs and RSAs that vested during the fiscal years ended October 31, 2015, 2014, and 2013 was $39.6 million, $53.4 million, and $26.1 million, respectively.
109
Equity Incentive Award Valuation
The grant date fair value of RSUs and RSAs that have time or performance based vesting conditions contingent upon meeting financial and operational targets are equal to the closing market price of our common stock on the grant date.
We estimate the grant date fair value of RSUs that have market based vesting conditions using the Monte Carlo simulation method, using the following weighted-average assumptions:
Years Ended October 31, | ||||||||
2015 | 2014 | 2013 | ||||||
Expected term (in years) | 3.0 | 3.0 | 3.0 | |||||
Risk-free interest rate | 1.1 | % | 1.0 | % | 0.7 | % | ||
Expected dividend rate | 0.0 | % | 0.0 | % | 0.0 | % | ||
Expected stock price volatility | 52.7 | % | 54.5 | % | 56.2 | % | ||
We estimate the grant-date fair value of stock options using the Black-Scholes-Merton valuation model, using the following weighted-average assumptions:
Years Ended October 31, | ||||||||
2015 | 2014 | 2013 | ||||||
Expected term (in years) | 3.5 | 3.4 | 3.5 | |||||
Risk-free interest rate | 1.0 | % | 1.1 | % | 0.9 | % | ||
Expected dividend rate | 0.0 | % | 0.0 | % | 0.0 | % | ||
Expected stock price volatility | 52.7 | % | 54.9 | % | 54.4 | % | ||
The assumptions used to value our awards are determined as follows:
• | The expected term of options is derived from the historical actual term of previous grants and an estimate of future exercises during the remaining contractual period of the awards, and represents the period of time that awards granted are expected to be outstanding. |
• | The average risk-free interest rate is based on the U.S. Treasury zero-coupon issues with a remaining term equal to the expected term of the awards. |
• | The dividend yield assumption is based on our dividend history and future expectations of dividend payouts. |
• | The expected stock price volatility considers the historical volatility of common stock and traded stock options for the expected term of the awards, and is adjusted for volatility related to non-recurring and unusual factors. |
To determine expected stock price volatility for awards issued during fiscal years 2015, 2014, and 2013, we weighted the historical volatility of our common stock at 95% and the implied volatility of our traded stock options at 5%. We placed the greatest weighting on the historic volatility of our common stock because we believe that, in general, it is representative of our expected volatility. We included the implied volatility of our traded stock options to capture market expectations regarding our stock price. We accorded less weighting to our implied volatility because there is a relatively low volume of trades and the terms of the traded options are shorter than the expected term of our share awards.
Stock-Based Compensation Expense
The following table presents the stock-based compensation expense recognized in our Consolidated Statements of Operations (in thousands):
110
Years Ended October 31, | |||||||||||
2015 | 2014 | 2013 | |||||||||
Cost of net revenues | $ | 2,548 | $ | 1,994 | $ | 2,450 | |||||
Research and development | 6,669 | 10,720 | 6,116 | ||||||||
Sales and marketing | 16,219 | 19,151 | 16,660 | ||||||||
General and administrative | 16,817 | 22,032 | 23,625 | ||||||||
Total stock-based compensation expense | $ | 42,253 | $ | 53,897 | $ | 48,851 | |||||
Our computation of stock-based compensation expense includes an estimate of award forfeitures based on historical experience. We record compensation expense only for those awards that are expected to vest.
As of October 31, 2015, total unrecognized stock-based compensation expense was $5.9 million related to unvested stock options and $71.6 million related to unvested RSUs. These amounts are expected to be recognized over the remaining weighted-average vesting periods of 1.7 years for stock options and 2.6 years for RSUs.
Note 5. Stock Repurchase Program
In September 2015, our Board of Directors authorized a program to repurchase shares of our common stock with an aggregate value of up to $200.0 million, with no expiration from the date of authorization. Shares may be repurchased from time to time in the open market, private purchases, through forward, derivative, accelerated repurchase or automatic repurchase transactions or otherwise. Certain of our share repurchases have been and may from time to time be effected through Exchange Act Rule 10b5-1 repurchase plans. The timing and actual amount of the share repurchases will depend on several factors including price, capital availability, regulatory requirements, alternative investment opportunities, including mergers and acquisitions, market conditions and other factors. We are not obligated to repurchase any specific number of shares under the program and the repurchase program may be modified, suspended or discontinued at any time.
During fiscal year ended October 31, 2015, we repurchased 2.7 million shares of our common stock on the open market at an average repurchase price of $28.66 per share. As of October 31, 2015, there was approximately $123.4 million remaining available for stock repurchases under the current program.
Note 6. Income Taxes
Income (loss) before income taxes consisted of the following (in thousands):
Years Ended October 31, | |||||||||||
2015 | 2014 | 2013 | |||||||||
United States | $ | 69,458 | $ | (89,764 | ) | $ | (92,243 | ) | |||
Foreign | 3,490 | 49,880 | (14,715 | ) | |||||||
Income (loss) before income taxes | $ | 72,948 | $ | (39,884 | ) | $ | (106,958 | ) | |||
111
The provision for (benefit from) income taxes consisted of the following (in thousands):
Years Ended October 31, | |||||||||||
2015 | 2014 | 2013 | |||||||||
Current: | |||||||||||
Federal | $ | 1,965 | $ | 6,568 | $ | 2,164 | |||||
State | 206 | 351 | 376 | ||||||||
Foreign | 21,664 | 25,306 | 32,694 | ||||||||
Total current provision for income taxes | 23,835 | 32,225 | 35,234 | ||||||||
Deferred: | |||||||||||
Federal | (306 | ) | (395 | ) | 176,190 | ||||||
State | (44 | ) | (18 | ) | 15,346 | ||||||
Foreign | (30,894 | ) | (35,254 | ) | (38,727 | ) | |||||
Total deferred provision for (benefit from) income taxes | (31,244 | ) | (35,667 | ) | 152,809 | ||||||
Income tax provision (benefit) | $ | (7,409 | ) | $ | (3,442 | ) | $ | 188,043 | |||
The income tax provision for the fiscal year ended October 31, 2013 was primarily attributable to establishing a valuation allowance against U.S. federal and state deferred tax assets, as well as certain other foreign deferred tax assets.
A reconciliation of taxes computed at the federal statutory income tax rate to the provision for (benefit from) income taxes is as follows (in thousands):
Years Ended October 31, | |||||||||||
2015 | 2014 | 2013 | |||||||||
Provision for (benefit from) income taxes computed at the federal statutory rate | $ | 25,532 | $ | (13,960 | ) | $ | (37,379 | ) | |||
State income tax, net of federal tax benefit | 469 | 210 | 15,616 | ||||||||
Foreign income taxes at other than U.S. rates | (2,544 | ) | (22,726 | ) | (9,963 | ) | |||||
Valuation allowance, net | (31,065 | ) | 41,096 | 226,318 | |||||||
Impact of tax rate changes | 485 | (4,279 | ) | (10,147 | ) | ||||||
Investment write-off | — | (9,612 | ) | — | |||||||
Unrealized inter-company profits | 409 | 5,559 | 3,596 | ||||||||
Foreign exchange | (2,692 | ) | (832 | ) | 2,186 | ||||||
Stock compensation | 1,516 | 1,244 | 18 | ||||||||
Research Credit | (1,662 | ) | (577 | ) | (1,719 | ) | |||||
Other | 2,143 | 435 | (483 | ) | |||||||
Income tax provision (benefit) | $ | (7,409 | ) | $ | (3,442 | ) | $ | 188,043 | |||
112
Deferred income taxes reflect the net tax effects of temporary differences between the carrying amounts of assets and liabilities for financial reporting purposes and the amounts used for income tax purposes. The significant components of our deferred tax assets and liabilities were as follows (in thousands):
October 31, | |||||||
2015 | 2014 | ||||||
Deferred tax assets: | |||||||
Loss carry forwards | $ | 121,717 | $ | 149,166 | |||
Basis differences in deductible goodwill and purchased intangibles | 66,296 | 79,430 | |||||
Foreign tax credit carry forwards | 10,962 | 93,183 | |||||
Foreign taxes on basis differences | 55,113 | 58,633 | |||||
Accrued expenses and reserves | 32,733 | 53,361 | |||||
Deferred revenue | 35,653 | 38,978 | |||||
Stock based compensation | 20,770 | 20,697 | |||||
Unrealized foreign currency losses (gains) | 23,074 | 12,966 | |||||
Inventories | 6,959 | 9,718 | |||||
Other deferred tax assets | 24,883 | 24,079 | |||||
Total deferred tax assets | 398,160 | 540,211 | |||||
Valuation allowance | (332,289 | ) | (451,275 | ) | |||
Deferred tax liabilities: | |||||||
Basis differences on purchased intangibles | (62,549 | ) | (97,632 | ) | |||
Basis differences in investments in foreign subsidiaries | (56,763 | ) | (57,731 | ) | |||
Other deferred tax liabilities | (13,583 | ) | (12,802 | ) | |||
Total deferred tax liabilities | (132,895 | ) | (168,165 | ) | |||
Net deferred tax assets (liabilities) | $ | (67,024 | ) | $ | (79,229 | ) | |
Other deferred tax assets and liabilities are comprised primarily of the tax effects of depreciation, research and development credit carryforwards, basis differences on purchased inventory and amortized debt issuance costs.
The realization of deferred tax assets is dependent primarily on generating sufficient U.S. and foreign taxable income in future fiscal years. We regularly assess the need for a valuation allowance against deferred tax assets. In making that assessment, we consider both positive and negative evidence related to the likelihood of realization of the deferred tax assets to determine, based on the weight of available evidence, whether it is more-likely-than-not that some or all of the deferred tax assets will not be realized. In evaluating the need for a valuation allowance, we consider the cumulative loss in the U.S. as a significant piece of negative evidence. Therefore, in fiscal 2013, we established a $245.0 million valuation allowance against a significant portion of our deferred tax assets, including U.S. federal and state deferred tax assets, as well as certain other foreign deferred tax assets.
During fiscal 2015 the $119.0 million reduction in valuation allowance was primarily due to the reduction of foreign tax credit carryforwards for the contemplated conversion to foreign tax deductions for purposes of offsetting unrecognized tax benefits related to the adoption of ASU 2013-11 and the utilization of loss carryforwards in the U.S. Additionally, we released $16.1 million of valuation allowance against certain non-U.S. foreign deferred tax assets due to cumulative income in the jurisdiction and expected continued profitability. We will continue to assess the realizability of the deferred tax assets in each of the applicable jurisdictions going forward and adjust the valuation allowance accordingly. We intend to maintain the valuation allowances until sufficient positive evidence exists to support the reversal of the valuation allowances.
113
The tax loss carry forwards as of October 31, 2015 were related primarily to tax losses of $350.8 million in the U.S., $121.8 million in Ireland, $32.0 million in Brazil, $17.0 million in the United Kingdom, $13.7 million in Norway, $2.2 million in Sweden, and $59.8 million in various other non-U.S. countries. Approximately $206.8 million of foreign tax losses may be carried forward indefinitely. The remaining approximately $390.1 million of tax losses is subject to limited carry forward terms of 5 to 20 years.
The excess tax benefits associated with stock option exercises are recorded directly to stockholders' equity only when realized. As a result, the excess tax benefits included in net operating loss carryforwards at October 31, 2015 is $135.0 million.
The U.S. net operating loss carryforward includes acquired net operating losses of $188.7 million. The utilization of the U.S. and the acquired net operating losses may be restricted due to change in ownership provisions of Section 382 of the Internal Revenue Code.
As of October 31, 2015, we have recorded U.S. foreign tax credit carry forwards of $96.2 million which will expire at various dates beginning in 2016, if not utilized. In addition we have recorded U.S. research and development tax credit carry forwards of $14.4 million which will expire at various dates beginning in 2019, if not utilized.
We recognize deferred tax liabilities associated with outside basis differences on investments in foreign subsidiaries unless the difference is considered essentially permanent in duration. As of October 31, 2015, we have recorded a deferred tax liability of $56.8 million associated with $139.9 million of taxable outside basis differences which are not considered permanently reinvested. We have not recorded deferred taxes on approximately $749.6 million of undistributed earnings as they are considered permanently reinvested. As of October 31, 2015, the determination of the unrecorded deferred tax liability related to these earnings is not practicable. If circumstances change and it becomes apparent that some or all of the undistributed earnings will not be invested indefinitely, or will be remitted in the foreseeable future, an additional deferred tax liability will be recorded for some or all of the outside basis difference.
U.S. Internal Revenue Service Tax Audit Assessment
We are currently under audit by the U.S. Internal Revenue Service for fiscal years 2005 through 2010 related to our five year net operating loss carry back for fiscal year 2010. We have received a Notice of Proposed Adjustment indicating the denial of our worthless stock deduction of $154.3 million, related to the insolvency of one of our UK subsidiaries, recorded on our 2010 tax return. The impact of the Notice of Proposed Adjustment is the denial of the loss carryback to 2005 and 2006 which resulted in an approximately $25.0 million cash refund and the disallowance of approximately $29.0 million of future tax benefits residing in the NOL carryover which are offset with a valuation allowance. We filed our protest to the Notice of Proposed Assessment in April 2015 and believe the Internal Revenue Service position for the denial is without merit.
Israel Tax Audit Assessment
We are currently under audit by the Israel Tax Authority for fiscal years 2008 through 2013. The Israel Tax Authority has issued a tax assessment claiming there was a business restructuring that resulted in a transfer of some functions, assets and risks from Israel to the U.S. parent company that the Israel Tax Authority claims was an equity sale of 1.36 billion Israeli new shekels (approximately $353.2 million at the foreign exchange rate as of October 31, 2015). The Israel Tax Authority is alleging that the claim applies alternatively to fiscal years 2008 or 2009. These claims result in a tax liability and deficiency penalty assessment in the range of 558.3 million Israeli new shekels (approximately $144.6 million at the foreign exchange rate as of October 31, 2015), if the claim was assessed for fiscal year 2009, to 648.0 million Israeli new shekels (approximately $167.8 million at the foreign exchange rate as of October 31, 2015), if the claim was assessed for fiscal year 2008, including interest and the required Israeli price index adjustments (referred to as the linkage differentials) through October 31, 2015.
We filed our objection to the tax assessment in January 2015 and believe the Israel Tax Authority assessment position is without merit. We have agreed with the Israel Tax Authority to repay our $69.0 million intercompany loan from Israel to the extent of the amount of a final agreed tax assessment, if any.
114
We have certain other foreign subsidiaries under audit by foreign tax authorities, including India for fiscal years 2006 to 2014, and Turkey for fiscal year 2013. Although we believe we appropriately have provided for income taxes for the years subject to audit, the India, Israel, Turkey and U.S. taxing authorities may adopt different interpretations. We have not yet received any final determinations with respect to these audits. We have accrued tax liabilities associated with these audits. With few exceptions, we are no longer subject to tax examination for periods prior to 2006.
The aggregate changes in the balance of gross unrecognized tax benefits were as follows (in thousands):
Years Ended October 31, | |||||||||||
2015 | 2014 | 2013 | |||||||||
Balance at beginning of period | $ | 111,002 | $ | 114,528 | $ | 95,399 | |||||
Lapse of statute of limitations | (501 | ) | (2,072 | ) | (690 | ) | |||||
Increases in balances related to tax positions taken during prior periods | 2,988 | 358 | 1,096 | ||||||||
Decreases in balances related to tax positions taken during prior periods | (3,615 | ) | (2,551 | ) | (812 | ) | |||||
Increases in balances related to tax positions taken during current period | 1,246 | 739 | 19,535 | ||||||||
Settlements | (556 | ) | — | — | |||||||
Balance at end of period | $ | 110,564 | $ | 111,002 | $ | 114,528 | |||||
The total gross unrecognized tax benefits, if recognized, will affect our effective tax rate. The amount of unrecognized tax benefits could be reduced upon closure of tax examinations or if the statute of limitations on certain tax filings expires without assessment from the tax authorities. We believe that it is reasonably possible that there could be an immaterial reduction in unrecognized tax benefits due to statute of limitation expirations in multiple tax jurisdictions during the next 12 months. Interest and penalties accrued on these uncertain tax positions will also be released upon the expiration of statutes of limitations. Interest and penalties recognized in each statement of operations were not material. As of October 31, 2015 we have accrued $6.1 million for the payment of interest and penalties related to unrecognized tax benefits.
Note 7. Balance Sheet and Statement of Operations Details
Cash and Cash Equivalents
As of October 31, 2015 and October 31, 2014, Prepaid expenses and other current assets included $4.8 million and $6.2 million, respectively, of restricted cash. As of October 31, 2015 and October 31, 2014, Other long-term assets included $2.2 million and $2.6 million, respectively, of restricted cash. Restricted cash was mainly comprised of pledged deposits as of October 31, 2015 and October 31, 2014.
115
Allowance for doubtful accounts
Activity related to the allowance for doubtful accounts consisted of the following (in thousands):
Years Ended October 31, | |||||||||||
2015 | 2014 | 2013 | |||||||||
Balance at beginning of period | $ | 8,510 | $ | 10,463 | $ | 6,872 | |||||
Charges to bad debt expense | 2,329 | 2,339 | 4,673 | ||||||||
Write-offs, recoveries, and adjustments | (2,935 | ) | (4,292 | ) | (1,082 | ) | |||||
Balance at end of period | $ | 7,904 | $ | 8,510 | $ | 10,463 | |||||
Inventories
Inventories consisted of the following (in thousands):
October 31, | |||||||
2015 | 2014 | ||||||
Raw materials | $ | 30,297 | $ | 36,264 | |||
Work-in-process | 2,588 | 1,662 | |||||
Finished goods | 96,831 | 86,349 | |||||
Total inventories | $ | 129,716 | $ | 124,275 | |||
Prepaid Expenses and Other Current Assets
Prepaid expenses and other current assets consisted of the following (in thousands):
October 31, | |||||||
2015 | 2014 | ||||||
Prepaid expenses | $ | 46,024 | $ | 43,862 | |||
Prepaid taxes | 15,223 | 15,676 | |||||
Other current assets | 20,443 | 18,889 | |||||
Total prepaid expenses and other current assets | $ | 81,690 | $ | 78,427 | |||
Other current assets were comprised primarily of prepaid credit card, restricted cash, and short term deferred cost of net revenues.
116
Fixed Assets, Net
Fixed assets, net consisted of the following (in thousands):
October 31, | |||||||||
Estimated Useful Life (Years) | 2015 | 2014 | |||||||
Revenue generating assets | 5 | $ | 191,337 | $ | 173,611 | ||||
Computer hardware and software | 3-5 | 96,711 | 90,750 | ||||||
Machinery and equipment | 3-10 | 51,136 | 53,214 | ||||||
Leasehold improvements | Lesser of the term of the lease or the estimated useful life | 27,927 | 24,955 | ||||||
Office equipment, furniture, and fixtures | 3-5 | 17,606 | 14,504 | ||||||
Buildings | 40-50 | 6,652 | 6,736 | ||||||
Total depreciable fixed assets, at cost | 391,369 | 363,770 | |||||||
Accumulated depreciation | (213,526 | ) | (195,148 | ) | |||||
Depreciable fixed assets, net | 177,843 | 168,622 | |||||||
Construction in progress | 11,923 | 7,922 | |||||||
Land | 1,199 | 1,209 | |||||||
Total fixed assets, net | $ | 190,965 | $ | 177,753 | |||||
Total depreciation expense for the fiscal years ended October 31, 2015, 2014, and 2013 was $58.7 million, $59.7 million, and $54.8 million, respectively.
Accruals and Other Current Liabilities
Accruals and other current liabilities consisted of the following (in thousands):
October 31, | |||||||
2015 | 2014 | ||||||
Accrued expenses | $ | 85,973 | $ | 72,250 | |||
Accrued compensation | 69,174 | 66,281 | |||||
Accrued legal loss contingencies, including interest (Note 12) | 5,741 | 5,728 | |||||
Other current liabilities | 69,012 | 62,313 | |||||
Total accruals and other current liabilities | $ | 229,900 | $ | 206,572 | |||
Other current liabilities were comprised primarily of accrued warranty, sales and value-added taxes payable, taxi fee transactions, income taxes payable, and accrued restructurings.
Accrued Warranty
Activity related to accrued warranty for the fiscal years ended October 31, 2015 and 2014 consisted of the following (in thousands):
October 31, | |||||||
2015 | 2014 | ||||||
Balance at beginning of period | $ | 15,411 | $ | 13,352 | |||
Warranty charged to Cost of net revenues | 17,611 | 14,700 | |||||
Utilization of warranty accrual | (14,983 | ) | (12,282 | ) | |||
Other | (1,719 | ) | (359 | ) | |||
Balance at end of period | 16,320 | 15,411 | |||||
Less: current portion | (13,527 | ) | (13,816 | ) | |||
Long-term portion | $ | 2,793 | $ | 1,595 | |||
117
Deferred Revenue, Net
Deferred revenue, net of related costs consisted of the following (in thousands):
October 31, | |||||||
2015 | 2014 | ||||||
Deferred revenue | $ | 157,747 | $ | 168,712 | |||
Deferred cost of revenue | (19,526 | ) | (25,669 | ) | |||
Deferred revenue, net | 138,221 | 143,043 | |||||
Less: current portion | (82,899 | ) | (92,075 | ) | |||
Long-term portion | $ | 55,322 | $ | 50,968 | |||
Other Long-Term Liabilities
Other long-term liabilities consisted of the following (in thousands):
October 31, | |||||||
2015 | 2014 | ||||||
Unrecognized tax benefits liability, net | $ | 35,860 | $ | 62,228 | |||
Contingent consideration payable | 10,776 | 11,185 | |||||
Other long-term liabilities | 32,260 | 27,679 | |||||
Total other long-term liabilities | $ | 78,896 | $ | 101,092 | |||
Adoption of ASU 2013-11 effective November 1, 2014 resulted in a $24.2 million reduction in Unrecognized tax benefits liability, net, at November 1, 2014, because some of the unrecognized tax benefits are presented net against Deferred tax assets after adoption. As of October 31, 2015, the $35.9 million Unrecognized tax benefits liability, net, includes accrued interest and penalties, none of which is expected to be paid within one year. We are unable to make a reasonably reliable estimate as to when cash settlement with a taxing authority may occur.
118
Accumulated Other Comprehensive Income (Loss)
Activity related to Accumulated other comprehensive income (loss) consisted of the following (in thousands):
Foreign currency translation adjustments | Unrealized loss on derivatives designated as cash flow hedges (1) | Other (2) | Total | |||||||||||||
Balance at October 31, 2013 | $ | 18,301 | $ | (2,014 | ) | $ | (1,440 | ) | $ | 14,847 | ||||||
Gains (losses) before reclassifications, net of tax | (121,068 | ) | 4,088 | 393 | (116,587 | ) | ||||||||||
Amounts reclassified from Accumulated other comprehensive income (loss), net of tax | — | (2,794 | ) | (296 | ) | (3,090 | ) | |||||||||
Other comprehensive gain (loss) | (121,068 | ) | 1,294 | 97 | (119,677 | ) | ||||||||||
Balance at October 31, 2014 | (102,767 | ) | (720 | ) | (1,343 | ) | (104,830 | ) | ||||||||
Gains (losses) before reclassifications, net of tax | (183,895 | ) | (7,830 | ) | — | (191,725 | ) | |||||||||
Amounts reclassified from Accumulated other comprehensive income (loss), net of tax | — | 4,141 | 93 | 4,234 | ||||||||||||
Other comprehensive gain (loss) | (183,895 | ) | (3,689 | ) | 93 | (187,491 | ) | |||||||||
Balance at October 31, 2015 | $ | (286,662 | ) | $ | (4,409 | ) | $ | (1,250 | ) | $ | (292,321 | ) | ||||
(1) Amounts reclassified from Accumulated other comprehensive income (loss), net of tax, were recorded in Interest expense, net in the Consolidated Statements of Operations. The related tax impacts were insignificant.
(2) Amounts reclassified from Accumulated other comprehensive income (loss), net of tax, were recorded in General and administrative expenses in the Consolidated Statements of Operations. The related tax impacts were insignificant.
Note 8. Financial Instruments
Fair Value Measurements
Assets and Liabilities Measured and Recorded at Fair Value on a Recurring Basis
Our financial assets and liabilities consist principally of cash, accounts receivable, accounts payable, debt, foreign exchange forward contracts, interest rate swaps, and contingent consideration payable. We measure and record certain of our financial assets and liabilities at fair value on a recurring basis. The estimated fair value of cash, accounts receivable, and accounts payable approximates their carrying value. The estimated fair value of our debt approximates the carrying value because the interest rate on such debt adjusts to market rates on a periodic basis. Foreign exchange forward contracts, interest rate swaps, and contingent consideration payable are recorded at estimated fair value.
119
The following tables present our significant assets and liabilities that are measured at fair value on a recurring basis and their classification within the fair value hierarchy (in thousands). There were no transfers between levels of fair value hierarchy in the fiscal year ended October 31, 2015 and the fiscal year ended October 31, 2014.
October 31, 2015 | October 31, 2014 | ||||||||||||||||||||||||||||||
Carrying Value | Level 1 | Level 2 | Level 3 | Carrying Value | Level 1 | Level 2 | Level 3 | ||||||||||||||||||||||||
Assets | |||||||||||||||||||||||||||||||
Other current and long-term assets: | |||||||||||||||||||||||||||||||
Derivative financial instruments | $ | 53 | $ | — | $ | 53 | $ | — | $ | 195 | $ | — | $ | 195 | $ | — | |||||||||||||||
Total assets measured and recorded at fair value | $ | 53 | $ | — | $ | 53 | $ | — | $ | 195 | $ | — | $ | 195 | $ | — | |||||||||||||||
Liabilities | |||||||||||||||||||||||||||||||
Other current and long-term liabilities: | |||||||||||||||||||||||||||||||
Contingent consideration payable | $ | 12,786 | $ | — | $ | — | $ | 12,786 | $ | 11,824 | $ | — | $ | — | $ | 11,824 | |||||||||||||||
Derivative financial instruments | 4,784 | — | 4,784 | — | 1,315 | — | 1,315 | — | |||||||||||||||||||||||
Total liabilities measured and recorded at fair value | $ | 17,570 | $ | — | $ | 4,784 | $ | 12,786 | $ | 13,139 | $ | — | $ | 1,315 | $ | 11,824 | |||||||||||||||
Fair Value of Contingent Consideration Payable
The following table presents changes in our contingent consideration payable which is categorized in Level 3 of the fair value hierarchy (in thousands):
October 31, | |||||||
2015 | 2014 | ||||||
Balance at beginning of period | $ | 11,824 | $ | 66 | |||
Additions | 1,781 | 11,605 | |||||
Payments | (485 | ) | (174 | ) | |||
Changes in estimates, included in Other income (expense), net | (2,474 | ) | (105 | ) | |||
Interest expense, net | 2,140 | 432 | |||||
Balance at end of period | $ | 12,786 | $ | 11,824 | |||
Contingent consideration payable is comprised substantially of amounts payable for acquired media contracts. The contingent consideration payable is classified as Level 3 because we use significant unobservable inputs to determine the expected payments and an appropriate discount rate to calculate the fair value. The significant unobservable inputs we use include our estimate of the future net revenues we expect to generate from the acquired media contracts, the probability of achieving those revenues, and the revenue share rate for a media contract. The discount rate used to determine the fair value of the contingent consideration payable is 18.5%. The maximum liability on contingent consideration payable is indeterminate because it is based on future revenues generated from the acquired business. We evaluate changes in the assumptions used to calculate the fair value of contingent consideration payable at the end of each period.
120
Derivative Financial Instruments
Interest Rate Swap Agreements Designated as Cash Flow Hedges
We use interest rate swap agreements to hedge the variability in cash flows related to interest payments. On March 23, 2012, we entered into a number of interest rate swap agreements to effectively convert $500.0 million of the term A loan from a floating rate to a 0.71% fixed rate plus applicable margin through March 31, 2015. On January 8, 2015, we entered into a number of new interest rate swap agreements to effectively convert $500.0 million of the term A loan from a floating rate to a 1.20% fixed rate plus applicable margin effective April 1, 2015, after the expiration of the original swap agreements. The principal amount under the term A loan covered by the new interest rate swap agreements will decrease to $450.0 million from April 1, 2017 through August 31, 2017, and $400.0 million from September 1, 2017 through March 31, 2018. The swap agreements expire March 31, 2018.
The interest rate swaps qualify for hedge accounting treatment as cash flow hedges. The notional amounts of interest rate swap agreements outstanding as of October 31, 2015 and October 31, 2014 were each $500.0 million.
Gains and losses arising from the effective portion of interest rate swap agreements are recorded in Accumulated other comprehensive loss, and are subsequently reclassified into earnings in the period or periods during which the underlying transactions affect earnings. As of October 31, 2015, the estimated net derivative loss related to our cash flow hedges included in Accumulated other comprehensive loss that will be reclassified into earnings in the next 12 months is $4.4 million.
Foreign Exchange Forward Contracts Not Designated as Hedging Instruments
We arrange and maintain foreign exchange forward contracts so as to yield gains or losses to offset changes in foreign currency denominated assets or liabilities due to changes in foreign exchange rates, with the objective to mitigate the volatility associated with foreign currency transaction gains or losses. Our foreign currency exposures are predominantly inter-company receivables and payables arising from product sales and loans from one of our entities to another. Our foreign exchange forward contracts generally mature within 90 days. The notional amounts of such contracts outstanding as of October 31, 2015 and October 31, 2014 were $219.6 million and $241.1 million, respectively.
We recognized the following gains (losses) on foreign exchange forward contracts not designated as cash flow hedges (in thousands):
Years Ended October 31, | |||||||||||
2015 | 2014 | 2013 | |||||||||
Gains (losses) recognized in Other income (expense), net in our Consolidated Statements of Operations | $ | 17,113 | $ | (2,661 | ) | $ | (5,214 | ) | |||
121
Note 9. Goodwill and Purchased Intangible Assets
Goodwill
Activity related to goodwill consisted of the following (in thousands):
October 31, | |||||||
2015 | 2014 | ||||||
Balance at beginning of period | $ | 1,185,892 | $ | 1,252,472 | |||
Acquisitions | 16,640 | 6,834 | |||||
Other adjustments | — | (885 | ) | ||||
Currency translation adjustments | (118,501 | ) | (72,529 | ) | |||
Balance at end of period | $ | 1,084,031 | $ | 1,185,892 | |||
During the fourth quarter of fiscal years 2015, 2014, and 2013, we completed our annual impairment assessments and, based on a quantitative analysis, concluded that goodwill was not impaired in any of these years.
Purchased Intangible Assets, Net
Purchased Intangible assets, net consisted of the following (in thousands):
October 31, 2015 | October 31, 2014 | ||||||||||||||||||||||
Gross Carrying Amount | Accumulated Amortization | Net Carrying Amount | Gross Carrying Amount | Accumulated Amortization | Net Carrying Amount | ||||||||||||||||||
Customer relationships | $ | 591,930 | $ | (298,812 | ) | $ | 293,118 | $ | 673,081 | $ | (255,161 | ) | $ | 417,920 | |||||||||
Other | 115,143 | (90,744 | ) | 24,399 | 128,935 | (89,260 | ) | 39,675 | |||||||||||||||
Total | $ | 707,073 | $ | (389,556 | ) | $ | 317,517 | $ | 802,016 | $ | (344,421 | ) | $ | 457,595 | |||||||||
Other intangible assets, net, were comprised primarily of developed and core technology and trade name.
When intangibles reach the end of their useful lives, gross carrying amount and accumulated amortization are offset. During fiscal year 2015, we offset $10.4 million of Gross carrying amount and Accumulated amortization of intangible assets related to developed and core technology, $3.3 million related to customer relationships, and $0.2 million related to other intangible assets, because they reached the end of their useful lives.
Activity related to purchased intangible assets during the fiscal year 2015 also includes a $93.5 million currency translation adjustment to Gross carrying amount and a $41.9 million currency translation adjustment to Accumulated amortization.
Amortization of purchased intangible assets was allocated as follows (in thousands):
Years Ended October 31, | |||||||||||
2015 | 2014 | 2013 | |||||||||
Included in Cost of net revenues | $ | 18,307 | $ | 42,682 | $ | 44,739 | |||||
Included in Operating expenses | 82,492 | 97,580 | 96,160 | ||||||||
Total amortization of purchased intangible assets | $ | 100,799 | $ | 140,262 | $ | 140,899 | |||||
122
Total future amortization expense for purchased intangible assets that have finite lives, based on our existing intangible assets and their current estimated useful lives as of October 31, 2015, is estimated as follows (in thousands):
Cost of Net Revenues | Operating Expenses | Total | |||||||||
Years Ended October 31: | |||||||||||
2016 | $ | 12,228 | $ | 75,159 | $ | 87,387 | |||||
2017 | 4,182 | 52,147 | 56,329 | ||||||||
2018 | 2,051 | 49,460 | 51,511 | ||||||||
2019 | 758 | 46,198 | 46,956 | ||||||||
2020 | 189 | 31,262 | 31,451 | ||||||||
Thereafter | 965 | 42,918 | 43,883 | ||||||||
Total future amortization expense | $ | 20,373 | $ | 297,144 | $ | 317,517 | |||||
Note 10. Financings
Amounts outstanding under our financing arrangements consisted of the following (in thousands):
October 31, | |||||||
2015 | 2014 | ||||||
2011 Credit Agreement | |||||||
Term A loan | $ | 562,500 | $ | 592,500 | |||
Term B loan | 197,500 | 199,500 | |||||
Revolving loan | 54,000 | 95,000 | |||||
Other | 342 | 706 | |||||
Total principal payments due | 814,342 | 887,706 | |||||
Less: original issue discount and debt issuance cost | (15,013 | ) | (19,291 | ) | |||
Total amounts outstanding | 799,329 | 868,415 | |||||
Less: current portion | (39,088 | ) | (31,792 | ) | |||
Long-term portion | $ | 760,241 | $ | 836,623 | |||
2011 Credit Agreement
On December 28, 2011, we entered into a credit agreement, which initially consisted of a $918.5 million term A Loan, $231.5 million term B Loan, and $350.0 million revolving loan commitment. On October 15, 2012, we entered into a credit extension amendment of this credit agreement consisting of $109.5 million add-on term A Loans and $75.5 million add-on revolving loan commitment increase. On July 19, 2013 we entered into a second credit extension amendment of this credit agreement, which extended from November 1, 2013 to November 1, 2014 the date on which the required total leverage ratio declined from 3.75 to 3.50, and revised the definition of cash on hand used in calculating the total leverage ratio. As a condition to the effectiveness of the second amendment, on July 19, 2013 we prepaid the term A Loan in the aggregate principal amount of $20.0 million and the term B Loan in the aggregate principal amount of $50.0 million. On December 24, 2013, we repaid the entire $48.4 million balance due on the outstanding term B Loan. This payment was partially funded through $47.0 million in additional borrowings under the revolving loan.
On July 8, 2014, we entered into an amendment and restatement agreement, which amended and restated the credit agreement to extend the maturity dates, provide more favorable interest rates, and make certain changes to the covenants and other terms.
123
As part of the amendment and restatement, the outstanding loan balances were repaid in full, and new debt was issued.
The amended and restated credit agreement provides for an aggregate amount of up to$1.3 billion of debt consisting of a $600.0 million term A loan, $200.0 million term B loan and $500.0 million revolving loan commitment. The initial amounts borrowed, together with cash on hand, were used to repay the $938.6 million of outstanding balances due under the original credit agreement as well as $13.2 million of costs associated with the amendment and restatement. No penalties were due in connection with such repayments.
Borrowings under the amended and restated credit agreement bear interest at a “Base Rate” or “Eurodollar Rate”, at our option, plus an applicable margin based on certain financial ratios, determined and payable quarterly. In addition, we pay an undrawn commitment fee on the unused portion of the revolving loan ranging from 0.25% to 0.50% per annum, depending on our leverage ratio.
The outstanding principal balance of the term A loan is required to be repaid in quarterly installments of the following percentages of the original balance outstanding under the term A loan: 1.25% for each quarter from the quarter ending September 30, 2014 through the quarter ending June 30, 2016; 2.50% for each quarter from the quarter ending September 30, 2016 through the quarter ending June 30, 2019, with the balance being due at maturity on July 8, 2019. The outstanding principal balance of the term B loan is required to be repaid in equal quarterly installments of 0.25% of the original balance outstanding under the term B loan, with the balance being due at maturity on July 8, 2021. The revolving loan terminates on July 8, 2019. Outstanding amounts may also be subject to mandatory repayment with the proceeds of certain asset sales, and debt issuances, and, in the case of the term B loan only, from a portion of annual excess cash flows depending on our total leverage ratio, as defined under the agreement.
Additional terms of the amended and restated credit agreement require compliance with financial covenants that require us to maintain financial ratios related to interest coverage and financial leverage. We were in compliance with these financial covenants as of October 31, 2015. The amended and restated credit agreement also contains representations and warranties, affirmative covenants, negative covenants, financial covenants and conditions that are customarily required for similar financings including the following, among others:
• | A restriction on incurring additional indebtedness, subject to specified permitted debt; |
• | A restriction on creating certain liens, subject to specified exceptions; |
• | A restriction on mergers and consolidations, subject to specified exceptions; |
• | A restriction on asset dispositions, subject to specified exceptions for ordinary course and other transactions; |
• | A restriction on certain investments, subject to certain exceptions and a suspension if we achieve certain credit ratings; |
• | A restriction on the payment of dividends, subject to specified exceptions; and |
• | A restriction on entering into certain transactions with affiliates, subject to specified exceptions. |
Borrowings under the amended and restated credit agreement are guaranteed by certain of our wholly owned domestic subsidiaries and secured by a first priority lien and security interest in certain of our assets, subject to customary exceptions.
The interest rate of each of the term A loan and the revolving loan is currently one month LIBOR plus the applicable margin, and the interest rate of the term B loan is the higher of one month LIBOR or 0.75%, plus the applicable margin. As of October 31, 2015, we elected the "Eurodollar Rate" margin option for our borrowings and the interest margins were 1.75% for the term A loan and the revolving loan, and 2.75% for term B loan. Accordingly as of October 31, 2015, the interest rate was 1.94% for the term A loan and the revolving loan and 3.5% for the term B loan. As of October 31, 2015, the commitment fee for the unused portion of the revolving loan was 0.30% per annum, payable quarterly in arrears, and the amount available to draw under the revolving loan was $446.0 million.
The repayment of outstanding debt as part of the amendment and restatement was deemed an extinguishment of $153.5 million of outstanding debt. As a result, during July 2014, we expensed $5.2 million of previously capitalized debt issuance costs to Interest expense in our Consolidated Statements of Operations.
We have outstanding a number of interest rate swap agreements to effectively convert $500.0 million of the term A loan from a floating rate to a 1.20% fixed rate plus applicable margin. The interest rate swaps qualify for hedge accounting treatment as cash flow hedges and are effective through March 31, 2018. The principal amount under the term A loan covered by the new interest rate swap agreements will decrease to $450.0 million from April 1, 2017 through August 31, 2017, and $400.0 million from September 1, 2017 through March 31, 2018.
124
Principal Payments
Principal payments due under our financing arrangements over the next five years are as follows (in thousands):
Amounts | |||
Years Ending October 31: | |||
2016 | $ | 39,532 | |
2017 | 62,018 | ||
2018 | 62,019 | ||
2019 | 461,019 | ||
2020 | 2,019 | ||
Thereafter | 187,735 | ||
Total | $ | 814,342 | |
Note 11. Restructurings
As part of cost optimization and corporate transformation initiatives, during fiscal year 2014 our management approved, committed to and initiated restructuring plans to reduce headcount, and consolidate facilities and data centers. These plans were substantially completed at the end of fiscal year 2015. In addition, during July 2015, our management approved, committed to and initiated another restructuring plan to further reduce headcount and consolidate operations as part of these transformation initiatives. The July 2015 Plan is expected to be substantially complete by the end of fiscal year 2016.
Activity related to our restructuring plans consisted of the following (in thousands):
Restructuring Plans | |||||||||||||||||||||||
April 2014 Plan | June 2014 Plan | July 2015 Plan | |||||||||||||||||||||
Employee Involuntary Termination Benefits | Facilities Related Costs | Employee Involuntary Termination Benefits | Facilities Related Costs | Employee Involuntary Termination Benefits | Total | ||||||||||||||||||
Balance at October 31, 2013 | $ | — | $ | 581 | $ | — | $ | — | $ | — | $ | 581 | |||||||||||
Charges | 5,597 | 1,295 | 11,999 | 821 | — | 19,712 | |||||||||||||||||
Cash payments | (4,887 | ) | (211 | ) | (5,835 | ) | (372 | ) | — | (11,305 | ) | ||||||||||||
Other adjustments | (391 | ) | (471 | ) | (664 | ) | (50 | ) | — | (1,576 | ) | ||||||||||||
Balance at October 31, 2014 | $ | 319 | $ | 1,194 | $ | 5,500 | $ | 399 | $ | — | $ | 7,412 | |||||||||||
Charges, net of adjustments | (69 | ) | 537 | 884 | 82 | 7,343 | 8,777 | ||||||||||||||||
Cash payments | (250 | ) | (1,866 | ) | (5,357 | ) | (476 | ) | (2,253 | ) | (10,202 | ) | |||||||||||
Other | — | 135 | — | — | 135 | ||||||||||||||||||
Balance at October 31, 2015 | $ | — | $ | — | $ | 1,027 | $ | 5 | $ | 5,090 | $ | 6,122 | |||||||||||
Cumulative costs to date | $ | 5,140 | $ | 1,967 | $ | 12,223 | $ | 853 | $ | 7,343 | $ | 27,526 | |||||||||||
The following table presents the restructuring expense recognized in our Consolidated Statements of Operations (in thousands):
Years Ended October 31, | |||||||||||
2015 | 2014 | 2013 | |||||||||
Cost of net revenues | $ | 348 | $ | 2,847 | $ | — | |||||
Research and development | 3,496 | 5,925 | 323 | ||||||||
Sales and marketing | 2,723 | 4,685 | — | ||||||||
General and administrative | 2,210 | 4,679 | — | ||||||||
Total restructuring expense | $ | 8,777 | $ | 18,136 | $ | 323 | |||||
125
Note 12. Commitments and Contingencies
Commitments
Leases
We lease certain facilities under non-cancelable operating leases that contain free rent periods, leasehold improvement rebates or rent escalation clauses. Rent expense under these leases is recorded on a straight-line basis over the lease term. We are committed to pay a portion of the related actual operating expenses under some of these lease agreements, and those operating expenses are not included in the table below. The difference between amounts paid and rent expense is recorded as deferred rent. The short-term and long-term portions are included in Accruals and other current liabilities and Other long-term liabilities, respectively, in our Consolidated Balance Sheets.
In connection with our taxi solutions business, we enter into operating lease arrangements for the right to place advertising in or on taxicabs. In general, these lease arrangements are non-cancelable for terms ranging from three to eight years, require us to pay minimum lease amounts based on the types and locations of the advertising displays in or on the taxicabs, and are subject to fee escalation clauses. Based upon the number of operational taxicabs with our advertising displays at October 31, 2015, we had total lease commitments of $89.4 million relating to such lease arrangements, which are included in the future minimum lease payments in the table below.
Future minimum lease payments under these leases as of October 31, 2015 were as follows (in thousands):
Minimum Lease Payments | |||
Years Ending October 31: | |||
2016 | $ | 45,443 | |
2017 | 39,514 | ||
2018 | 23,288 | ||
2019 | 21,065 | ||
2020 | 16,480 | ||
Thereafter | 14,939 | ||
Total | $ | 160,729 | |
Rent expense consisted of the following (in thousands):
Years Ended October 31, | |||||||||||
2015 | 2014 | 2013 | |||||||||
Rent expense for non-cancelable taxi operating leases | $ | 35,297 | $ | 36,413 | $ | 31,211 | |||||
Facility and other rent expense | 26,885 | 29,521 | 29,185 | ||||||||
Total rent expense | $ | 62,182 | $ | 65,934 | $ | 60,396 | |||||
126
Manufacturing Agreements
We work on a purchase order basis with our contract manufacturers, which are located in China, Singapore, Malaysia, Brazil, Germany, and Romania, and component suppliers located throughout the world, to supply nearly all of our finished goods inventories, spare parts, and accessories. We provide each such supplier with a purchase order to cover the manufacturing requirements, which generally constitutes a binding commitment by us to purchase materials and finished goods produced by the manufacturer as specified in the purchase order. Most of these purchase orders are considered to be non-cancelable and are expected to be paid within one year of the issuance date. As of October 31, 2015, the amount of purchase commitments issued to contract manufacturers and component suppliers totaled approximately $178.4 million. Of this amount, $10.4 million has been recorded in Accruals and other current liabilities in our Consolidated Balance Sheets because these commitments are not expected to have future value to us.
Bank Guarantees
We have issued bank guarantees with maturities ranging from two months to six years to certain of our customers and vendors as required in some countries to support certain performance obligations under our service or other agreements with those parties. As of October 31, 2015, the maximum amount that may become payable under these guarantees was $11.3 million, of which $1.4 million was collateralized by restricted cash deposits.
Letters of Credit
We provide standby letters of credit in the ordinary course of business to third parties as required. As of October 31, 2015, the maximum amounts that may become payable under these letters of credit was $3.7 million, of which $1.0 million was collateralized by restricted cash deposits.
Contingencies
We evaluate the circumstances regarding outstanding and potential litigation and other contingencies on a quarterly basis to determine whether there is at least a reasonable possibility that a loss exists requiring accrual or disclosure, and if so, whether an estimate of the possible loss or range of loss can be made, or whether such an estimate cannot be made. When a loss is probable and reasonably estimable, we accrue for such amount based on our estimate of the probable loss considering information available at the time. When a loss is reasonably possible, we disclose the estimated possible loss or range of loss in excess of amounts accrued if material. Except as otherwise disclosed below, we do not believe that material losses were probable or that there was a reasonable possibility that a material loss may have been incurred with respect to the matters disclosed.
Brazilian Tax Assessments
State Value-Added Tax
The Brazilian subsidiary we acquired as part of our acquisition of Hypercom in August 2011 received an unfavorable administrative decision on a tax enforcement action against it filed by the São Paulo State Revenue Department for collection of state sales taxes related to purported sales of software for the 1998 and 1999 tax years. In 2004, an appeal against this unfavorable administrative decision was filed in a judicial proceeding. The first level decision in the judicial proceeding was issued in our favor. The São Paulo State Revenue Department filed an appeal of this decision. The second level administrative decision ordered that the case be returned to the lower court in order to allow the production of further evidence. Based on our current understanding of the underlying facts of this matter, we believe it is reasonably possible that we may receive an unfavorable decision in this proceeding. The tax assessment including estimated interest through October 31, 2015 for this matter totals approximately 8.6 million Brazilian reais (approximately $2.2 million at the foreign exchange rate as of October 31, 2015). As of October 31, 2015, we have not accrued for this matter.
127
Federal Tax Assessments
Brazilian Federal Tax Amnesty
In December 2013, without admitting any fault or liability, we elected to enroll certain of our pending Brazilian tax assessments in the Brazilian Federal Tax Amnesty Program created by Law n. 11.941/2009 in 2009 and reopened for enrollment from October 2013 to December 2013, known as the "REFIS Amnesty.” The REFIS Amnesty is a program administered by the Brazilian tax authorities and allows entities charged with tax assessments that fall within the program’s scope to voluntarily settle such assessments with certain discounts applied to the amounts due. After conducting an evaluation of our existing Brazilian federal tax assessments and the terms offered by the REFIS Amnesty, we determined to voluntarily settle a number of our pending assessments.
Tax assessment matters that fall within the REFIS Amnesty's scope are generally listed in the program's web-based portal for enrollment. Although no formal acceptance by the tax authorities is issued at the time of our enrollment of a matter, we expect the tax authorities to confirm our enrollment as they complete their process to formally consolidate the matters we enrolled in the REFIS Amnesty. In connection with our enrollment of the tax assessments into the REFIS Amnesty, we were required to forgo any further legal defense or proceedings with respect to the merits of such assessments. In exchange, the enrolled assessments were closed and we were granted discounts on our payment of the related accrued interest and penalties and are able to pay under an installment plan, subject to our compliance with the terms of the program. For certain assessments, existing net operating loss carryforwards, or net operating losses, may be used to satisfy a portion of the settlement obligation. Under the terms of the REFIS Amnesty, our right to fund the settlement through the installment payment plan would be canceled after three instances of our not timely paying the installment amounts as scheduled, in which case the full amounts of the original tax debts, including interest and penalties without the benefit of discount, would become immediately due and payable. We have included the terms and amounts below for those assessments that we have placed into the REFIS Amnesty.
Federal Tax Assessments related to Brazilian Subsidiaries from Lipman Acquisition
Two of our Brazilian subsidiaries that were acquired as a part of the November 2006 acquisition of Lipman Electronic Engineering Ltd. (“Lipman”) were notified of assessments regarding Brazilian customs penalties that relate to alleged infractions in the importation of goods. The assessments were issued by the Federal Revenue Department in the City of Vitória, the City of São Paulo, and the City of Itajai. In each of these cases, the tax authorities allege that the structure used for the importation of goods was simulated with the objective of evading taxes levied on the importation by under-invoicing the imported goods. The tax authorities allege that the simulation was created through an interposition of parties and that the real sellers and buyers of the imported goods were hidden. In February 2013, the São Paulo assessment was canceled following a favorable second level decision that was not appealed.
In the Vitória tax assessment, the fines were reduced from 4.7 million Brazilian reais (approximately $1.2 million at the foreign exchange rate as of October 31, 2015) to 1.5 million Brazilian reais (approximately $380,000 at the foreign exchange rate as of October 31, 2015) on a first level administrative decision on January 26, 2007. Both we and the tax authorities filed appeals of the first level administrative decision. In this appeal, we argued that the tax authorities did not have enough evidence to determine that the import transactions were indeed fraudulent and that, even if there were some irregularities in such importations, they could not be deemed to be our responsibility since all the transactions were performed by the third-party importer of the goods. On June 30, 2010, the Taxpayers Administrative Council of Tax Appeals decided to reinstate the original claim amount of 4.7 million Brazilian reais (approximately $1.2 million at the foreign exchange rate as of October 31, 2015) against us. On February 27, 2013, the Taxpayers Administrative Council of Tax Appeals issued its formal ruling reinstating the original claim amount. On May 31, 2013, we filed a motion to clarify such ruling, which is pending a decision.
In the Itajai tax assessment, we were notified on January 18, 2008, of a first level administrative decision rendered that maintained the total fine of 2.0 million Brazilian reais (approximately $510,000 at the foreign exchange rate as of October 31, 2015) as imposed, excluding interest. On May 27, 2008, we appealed the first level administrative decision to the Taxpayers Council. This matter is pending second level decision.
128
In December 2013, we sought to enroll the entire amount of tax liabilities in dispute for both the Vitória and Itajai assessments in the REFIS Amnesty. However, because we are named as a jointly-liable party rather than as the primary defendant in these matters, these assessments were not listed in the REFIS Amnesty web-based portal as available for election under the REFIS Amnesty. We believe these matters qualify for inclusion in the REFIS Amnesty and have filed the required notifications to our local tax office and commenced payments to indicate our decision to enroll these matters in the REFIS Amnesty. We expect the tax authorities' confirmation that these matters have been included in the REFIS Amnesty once they complete their procedures to consolidate the enrolled assessments. We elected to make the amnesty payments for these matters in monthly installments over a 30-month period for total payments, inclusive of interest and penalties, of 7.6 million Brazilian reais (approximately $2.0 million at the foreign exchange rate as of October 31, 2015). We accrued the full amount of the payments, plus estimated interest, under the REFIS Amnesty for these matters in December 2013 when we enrolled in the program, and made our first payment on December 26, 2013. As of October 31, 2015, we have remaining installment payments totaling 1.2 million Brazilian reais (approximately $310,000 at the foreign exchange rate as of October 31, 2015).
We had previously accrued the estimated liability for both the Vitória and Itajai assessments. Based on our understanding of the underlying facts of these matters, we believe it is probable we may receive an unfavorable decision for each of these assessments unless we are able to resolve these matters through the REFIS Amnesty. Upon confirmation of acceptance of these matters into the REFIS Amnesty, we will reduce our accrued liabilities related to these matters to reflect the discounted amounts due under the REFIS Amnesty. As of October 31, 2015, we have accruals totaling 12.3 million Brazilian reais (approximately $3.2 million at the foreign exchange rate as of October 31, 2015).
Federal Tax Assessments related to Brazilian Subsidiary from Hypercom Acquisition
The Brazilian subsidiary we acquired as part of our acquisition of Hypercom in August 2011 is the subject of outstanding tax assessments by the federal tax authorities alleging unpaid IRPJ, CSL, COFINS and PIS taxes from 2002 and 2003. The 2002 assessments are the subject of an administrative proceeding and the 2003 assessments are the subject of a civil enforcement action. Three of the four claims for the 2002 assessments were previously settled prior to our acquisition of Hypercom. The first level administrative court issued an unfavorable decision for the remaining claim related to the 2002 tax assessments. Our appeal to the Administrative Tax Appeals Council was denied in December 2013. With respect to the 2003 tax assessments, we received a partially favorable ruling, and our appeal for the remaining assessments is pending decision in the civil courts. In December 2013, we elected to enroll the tax liability for the remaining 2002 assessment in dispute and the portion of the 2003 assessments for which we received an unfavorable ruling in the REFIS Amnesty.
For the 2002 assessment, we applied available net operating losses, to the extent permitted, toward the interest and penalties portion of the settlement obligation under the REFIS Amnesty. For the remaining balance, we elected to make the amnesty payments in monthly installments over a 90-month period for total payments of 2.2 million Brazilian reais (approximately $570,000 at the foreign exchange rate as of October 31, 2015). We accrued the full amount of the payments, plus estimated interest, under the REFIS Amnesty for this matter in December 2013 when we enrolled in the program, and made our first payment on December 26, 2013. In the first quarter of fiscal year 2015, based on new provisions made available under the REFIS Amnesty, we elected to pay all remaining outstanding amounts due under the REFIS Amnesty in relation to the 2002 assessment, and settled such payments using cash and additional available net operating losses.
129
For the 2003 assessments, we applied available net operating losses, to the extent permitted, toward the interest and penalties portion of the settlement obligation under the REFIS Amnesty. At the time we initially appealed the 2003 assessments to the civil courts, we were required to make a deposit of 2.8 million Brazilian reais (approximately $730,000 at the foreign exchange rate as of October 31, 2015) to the court in order to perfect our appeal. In light of our enrollment of certain of the 2003 assessments in the REFIS Amnesty, we have notified the civil court of our enrollment and requested the release of the portion of the deposit for the assessments enrolled in the REFIS Amnesty, which totals 680,000 Brazilian reais (approximately $170,000 at the foreign exchange rate as of October 31, 2015). Once approved by the court, the released funds will be applied against the settlement obligation under the REFIS Amnesty. Approximately 2.2 million Brazilian reais (approximately $560,000 at the foreign exchange rate as of October 31, 2015) will remain deposited in connection with the 2003 assessments that will continue in the civil courts and which deposits will be released to the prevailing party after resolution of the underlying assessments.
Excluding the assessments that have been enrolled in the REFIS Amnesty for this matter, which have been accrued as described above, and excluding the net operating losses still at issue, the remaining assessments approximately 3.6 million Brazilian reais (approximately $920,000 at the foreign exchange rate as of October 31, 2015), including estimated penalties and interest, as of October 31, 2015. Based on our current understanding of the underlying facts of this matter, we believe it is reasonably possible we may receive an unfavorable decision related to these remaining assessments.
We also elected to enroll a number of outstanding tax offset requests that were previously applied for by the Brazilian subsidiary we acquired as part of our acquisition of Hypercom in August 2011 in the REFIS Amnesty. These outstanding tax offset requests relate to different tax debts, primarily for IRPJ, PIS and COFINS for past tax years, and total approximately 2.5 million Brazilian reais (approximately $650,000 at the foreign exchange rate as of October 31, 2015), including estimated penalties and interest. We applied available net operating losses toward the interest and penalties portion of the settlement obligation under the REFIS Amnesty. For the remaining balance, we elected to make the amnesty payments in monthly installments over a 90-month period for total payments of 1.3 million Brazilian reais (approximately $340,000 at the foreign exchange rate as of October 31, 2015). We accrued the full amount of the payments, plus estimated interest, under the REFIS Amnesty for these matters in December 2013 when we enrolled in the program, and made our first payment on December 26, 2013. After further review, the tax authorities agreed with our positions in certain of these cases and reduced our liabilities under the REFIS Amnesty. In the first quarter of fiscal year 2015, based on new provisions made available under the REFIS Amnesty, we elected to pay all remaining outstanding amounts due under the REFIS Amnesty in relation to the remaining tax offset requests, and settled such payments using cash and additional available net operating losses.
130
Municipality Services Tax Assessments
In December 2009, one of the Brazilian subsidiaries that was acquired as part of the Lipman acquisition was notified of a tax assessment regarding alleged nonpayment of tax on services rendered for the period from September 2004 to December 2004. This assessment was issued by the municipality of São Paulo (the "municipality"), and asserts a services tax deficiency and related penalties totaling 875,000 Brazilian reais (approximately $230,000 at the foreign exchange rate as of October 31, 2015), excluding interest. The municipality claims that the Brazilian subsidiary rendered certain services within the municipality of São Paulo but simulated that those services were rendered in another city. At the end of December 2010 the municipality issued further tax assessments alleging the same claims for 2005 through June 2007. These additional subsequent claims assert services tax deficiencies and related penalties totaling 5.9 million Brazilian reais (approximately $1.5 million at the foreign exchange rate as of October 31, 2015), excluding interest. We received unfavorable decisions from the administrative courts, which ruled to maintain the tax assessments for each of these matters. No further grounds of appeal are available to us for these assessments within the administrative courts. In October 2012, as a result of the decision at the administrative level, the tax authorities filed an enforcement action in the civil courts to collect on the services tax assessments amounts awarded by the administrative court, and seeking other related costs and fees. On March 6, 2013, we filed our defensive claims in the civil courts in response to the tax authorities' enforcement action. In February 2013 the tax authorities filed an additional enforcement action in the civil courts to collect on the penalties related to the services tax assessments amounts awarded by the administrative courts. Based on our understanding of the underlying facts of this matter and our evaluation of the potential outcome at the judicial level, we believe it is reasonably possible that our Brazilian subsidiary will be required to pay some amount of the alleged tax assessments and penalties related to these matters, as well as amounts of interest and certain costs and fees imposed by the court related thereto. As of October 31, 2015, the amount of the alleged tax assessments and penalties related to these matters was approximately 21.5 million Brazilian reais (approximately $5.5 million at the foreign exchange rate as of October 31, 2015), including interest, costs and fees related thereto.
The Brazilian subsidiary we acquired as part of our acquisition of Hypercom in August 2011 received an unfavorable administrative decision on a tax enforcement action against it filed by the municipality of Curitiba for collection of alleged services tax deficiency. An appeal against this unfavorable administrative decision was filed in a judicial proceeding and currently the case is pending the municipality of Curitiba's compliance with the writ of summons. As of October 31, 2015, the underlying assessment, including estimated interest, was approximately 5.1 million Brazilian reais (approximately $1.3 million at the foreign exchange rate as of October 31, 2015). Based on our current understanding of the underlying facts of this matter, we believe it is reasonably possible that we may receive an unfavorable decision in this proceeding.
Patent Infringement
Cardsoft, Inc. et al v. VeriFone Holdings, Inc., VeriFone, Inc., Hypercom Corporation, et al.
On March 6, 2008, Cardsoft, Inc. and Cardsoft (Assignment for the Benefit of Creditors), LLC (collectively, “Cardsoft”) commenced an action in the United States District Court for the Eastern District of Texas, Marshall Division, against us and Hypercom Corporation, among others, alleging infringement of U.S. Patents No. 6,934,945 and No. 7,302,683 purportedly owned by Cardsoft. Cardsoft sought, in its complaint, a judgment of infringement, an injunction against further infringement, damages, interest and attorneys' fees. On June 8, 2012, the jury returned an unfavorable verdict finding that Cardsoft's patents were valid and were infringed by the accused VeriFone and Hypercom devices, and further determined that a royalty rate of $3 per unit should be applied. Accordingly, the jury awarded Cardsoft infringement damages and royalties of approximately $15.4 million covering past sales of the accused devices by VeriFone and Hypercom. The jury concluded there was no willful infringement by either VeriFone or Hypercom.
131
Following the jury's verdict, we determined that it was probable we would incur a loss on this litigation based on the jury's verdict and the status of the litigation proceedings at that time. Accordingly, we accrued for the full amount of the jury's verdict plus estimated pre-judgment interest and, effective from July 31, 2012, we began accruing estimated ongoing royalties of $3 per unit of accused device to Cost of net revenues. During the fiscal quarter ended October 31, 2012, we completed redesigns of the terminals subject to the jury's verdict specifically to address the Cardsoft allegations, and implemented such redesigns in the U.S. We further obtained the legal opinion of independent intellectual property counsel that our terminals, as redesigned, do not infringe the Cardsoft patents-in-suit. We concluded based on the procedures taken and legal reviews obtained, that it was not probable that an ongoing royalty based on the jury's verdict applies to our terminals as redesigned, and ceased accruing an ongoing royalty.
On October 30, 2013, the District Court issued judgment upholding the jury's verdict that the patent was valid and infringed. The judgment confirmed the jury's award of infringement damages and royalties of approximately $15.4 million covering past sales of the VeriFone and Hypercom accused devices, plus pre-judgment interest, post-judgment interest and costs. The court also ruled that an ongoing royalty should be applied for sales of the accused devices after the verdict date and ordered the parties to mediate on the issue of an ongoing royalty rate. The parties participated in mediation but were unable to reach a resolution. In March 2014, Cardsoft filed a motion requesting the court to set an ongoing royalty rate. We opposed, arguing (among other things) that no ongoing royalty applies in light of our redesigns of the products subject to the District Court's infringement ruling.
We appealed the District Court's judgment to the U.S. Court of Appeals for the Federal Circuit. On October 17, 2014, a three-judge panel of the Federal Circuit issued a unanimous opinion in our favor. The Federal Circuit ruling reversed the District Court's judgment and, further, concluded that our products did not infringe the Cardsoft patents as a matter of law. As a result, the District Court's finding of infringement and order of past and ongoing royalties, as well as related interest and costs, have been reversed. Previously, based on our assessment and the status of this matter before the District Court, we had accrued a total estimated loss of approximately $20.0 million, including estimated pre-judgment interest, potential ongoing royalties and statutory post-judgment interest related to this litigation. As a result of the Federal Circuit's favorable opinion reversing the District Court's judgment and ruling that our products do not infringe as a matter of law, in October 2014, we reversed the total estimated loss previously accrued.
On December 22, 2014, the Federal Circuit denied Cardsoft's petition for rehearing by the panel and hearing en banc, and issued its mandate on December 29, 2014. On March 23, 2015, Cardsoft filed a petition for certiorari with the U.S. Supreme Court, requesting the Court to grant its petition, vacate the Federal Circuit's decision and remand for the Federal Circuit to review using a more deferential standard of review of the District Court’s claim construction. On June 29, 2015, the U.S. Supreme Court granted Cardsoft’s petition, vacated the Federal Circuit's decision and remanded the case to the Federal Circuit for reconsideration under a more deferential standard of review of the District Court’s claim construction. On August 24, 2015, both parties submitted briefs regarding this more deferential standard of review and its applicability to the case.
Cardsoft has also filed motions before the District Court claiming that it was entitled to a new trial to allege infringement under the doctrine of equivalents and seeking to reopen the case before the District Court. We have opposed these motions and have filed a cross motion to dismiss this matter in its entirety. The District Court has not yet scheduled a hearing date on these motions.
On December 2, 2015, the Federal Circuit again granted judgment in our favor of no infringement as a matter of law. Although there remains the possibility CardSoft may file another petition for certiorari with the U.S. Supreme Court and although certain related proceedings are still pending in the District Court, we no longer believe this matter could have a material adverse effect on our business, financial condition, results of operations, or cash flows.
132
Class Action and Derivative Lawsuits
In re VeriFone Holdings, Inc. Shareholder Derivative Litigation Proceedings
Beginning on December 13, 2007, several actions were filed against certain current and former directors and officers derivatively on our behalf. These derivative lawsuits were filed in: (1) the U.S. District Court for the Northern District of California, as In re VeriFone Holdings, Inc. Shareholder Derivative Litigation, Lead Case No. C 07-6347 MHP, which consolidates King v. Bergeron, et al. (Case No. 07-CV-6347), Hilborn v. VeriFone Holdings, Inc., et al. (Case No. 08-CV-1132), Patel v. Bergeron, et al. (Case No. 08-CV-1133), and Lemmond, et al. v. VeriFone Holdings, Inc., et al. (Case No. 08-CV-1301); and (2) the Superior Court of California, County of Santa Clara, as In re VeriFone Holdings, Inc. Derivative Litigation, Lead Case No. 1-07-CV-100980, which consolidates Catholic Medical Mission Board v. Bergeron, et al. (Case No. 1-07-CV-100980) and Carpel v. Bergeron, et al. (Case No. 1-07-CV-101449). We prevailed in our motion to dismiss the federal derivative claims before the U.S. District Court for the Northern District of California and, on November 28, 2011, in ruling on lead plaintiff's appeal against the district court's judgment dismissing lead plaintiff's derivative claims, the Ninth Circuit issued judgment affirming the dismissal of lead plaintiff's complaint against us. The time period for the lead plaintiff to appeal the Ninth Circuit's judgment has expired.
On October 31, 2008, the state derivative plaintiffs filed their consolidated derivative complaint in the Superior Court of California, County of Santa Clara naming us as a nominal defendant and bringing claims for insider selling, breach of fiduciary duty, unjust enrichment, waste of corporate assets and aiding and abetting breach of fiduciary duty against certain of our current and former officers and directors and our largest stockholder as of October 31, 2008, GTCR Golder Rauner LLC. On February 18, 2009, plaintiff Catholic Medical Mission Board voluntarily dismissed itself from the action. In November 2008, we filed a motion to stay the state court action pending resolution of the parallel federal actions, and the parties agreed by stipulation to delay briefing on the motion to stay until after the issue of demand futility was resolved in the federal derivative case. On June 2, 2011, the court entered a stipulated order requiring the parties to submit a case status report on August 1, 2011 and periodically thereafter. The parties submitted status reports to the court through February 1, 2013 as requested by the court. On January 30, 2013, counsel for plaintiff informed us that Mr. Carpel, the nominal plaintiff, had sold his shares in the company and therefore no longer had standing to maintain a derivative action against us. On February 15, 2013, plaintiff filed a motion for leave to publish notice to our stockholders seeking a new nominal plaintiff. On May 10, 2013, the court adopted its tentative order granting the motion to publish notice, which was formally entered on May 17, 2013. Under the terms of the order, the parties were ordered to publish notice of the potential dismissal of the action and any qualifying shareholder who wishes to intervene must notify the court within ninety days from the formal entry of the order. Otherwise, the action will be dismissed. On August 14, 2013, counsel for the former nominal plaintiff, Mr. Carpel, filed a notice of intent to substitute a new nominal plaintiff, Joel Gerber, into the action. On September 16, 2013, counsel for former plaintiff Carpel filed a motion to substitute a new plaintiff, Joel Gerber, into the action. On October 16, 2013, the court granted the motion and deemed the amended complaint filed as of the same date. Our demurrer to the amended complaint was filed on April 7, 2014. On May 23, 2014, plaintiff filed a statement of non-opposition to our demurrer and filed a motion to stay the action to allow plaintiff to make a demand on our current Board of Directors. We filed our opposition to the motion to stay on June 18, 2014 and plaintiff filed his reply on July 25, 2014.
On December 3, 2014, the Court issued an order sustaining our demurrer and granting plaintiff's motion to stay. Plaintiff made a demand on the Board of Directors on December 23, 2014.
On June 11, 2015, the parties entered into a stipulation of settlement, pursuant to which we agreed to implement certain non-monetary corporate governance reforms and to provide support for plaintiff’s request for attorneys’ fees. On December 9, 2015, the Court entered an order and final judgment approving the settlement. The deadline for us to implement the non-monetary corporate governance reforms will be August 5, 2016, unless an appeal is timely filed.
133
Israel Securities Class Actions
On January 27, 2008, a class action complaint was filed against us in the Central District Court in Tel Aviv, Israel on behalf of purchasers of our stock on the Tel Aviv Stock Exchange. The complaint sought compensation for damages allegedly incurred by the class of plaintiffs due to the publication of erroneous financial reports. We filed a motion to stay the action, in light of the proceedings already filed in the U.S., on March 31, 2008. A hearing on the motion was held on May 25, 2008. Further briefing in support of the stay motion, specifically with regard to the threshold issue of applicable law, was submitted on June 24, 2008. On September 11, 2008, the Israeli District Court ruled in our favor, holding that U.S. law would apply in determining our liability. On October 7, 2008, plaintiffs filed a motion for leave to appeal the Israeli District Court's ruling to the Israeli Supreme Court. Our response to plaintiffs' appeal motion was filed on January 18, 2009. The Israeli District Court stayed its proceedings until the Israeli Supreme Court rules on plaintiffs' motion for leave to appeal. On January 27, 2010, after a hearing before the Israeli Supreme Court, the court dismissed the plaintiffs' motion for leave to appeal and addressed the case back to the Israeli District Court. The Israeli Supreme Court instructed the Israeli District Court to rule whether the Israel class action should be stayed, under the assumption that the applicable law is U.S. law. Plaintiffs subsequently filed an application for reconsideration of the Israeli District Court's ruling that U.S. law is the applicable law. Following a hearing on plaintiffs' application, on April 12, 2010, the parties agreed to stay the proceedings pending resolution of the U.S. securities class action, without prejudice to plaintiffs' right to appeal the Israeli District Court's decision regarding the applicable law to the Israeli Supreme Court. On May 25, 2010, plaintiff filed a motion for leave to appeal the decision regarding the applicable law with the Israeli Supreme Court. In August 2010, plaintiff filed an application to the Israeli Supreme Court arguing that the U.S. Supreme Court's decision in Morrison et al. v. National Australia Bank Ltd., 561 U.S. 247, 130 S. Ct. 2869 (2010), may affect the outcome of the appeal currently pending before the Court and requesting that this authority be added to the Court's record. Plaintiff concurrently filed an application with the Israeli District Court asking that court to reverse its decision regarding the applicability of U.S. law to the Israel class action, as well as to cancel its decision to stay the Israeli proceedings in favor of the U.S. class action in light of the U.S. Supreme Court's decision in Morrison. On August 25, 2011, the Israeli District Court issued a decision denying plaintiff's application and reaffirming its ruling that the law applicable to the Israel class action is U.S. law. The Israeli District Court also ordered that further proceedings in the case be stayed pending the decision on appeal in the U.S. class action.
On November 13, 2011, plaintiff filed an amended application for leave to appeal addressing the Israeli District Court's ruling. We filed an amended response on December 28, 2011. On January 1, 2012, the Israeli Supreme Court ordered consideration of the application by three justices. On July 2, 2012, the Israeli Supreme Court ordered us to file an updated notice on the status of the proceedings in the U.S. securities class action then pending in the U.S. Court of Appeals for the Ninth Circuit by October 1, 2012. On October 11, 2012, we filed an updated status notice in the Israeli Supreme Court on the proceedings in the U.S. securities class action pending at the time in the U.S. Court of Appeals for the Ninth Circuit. On January 9, 2013, the Israeli Supreme Court held a further hearing on the status of the appeal in the U.S. Court of Appeals for the Ninth Circuit and recommended that the parties meet and confer regarding the inclusion of the Israeli plaintiffs in the federal class action pending in the U.S. On February 10, 2013, the Israeli Supreme Court issued an order staying the case pursuant to the joint notice submitted to the court by the parties on February 4, 2013. The plaintiff and putative class members in this action are included in the stipulated settlement of the federal securities class action, In re VeriFone Holdings, Inc., disclosed above unless an individual plaintiff opts out. Following the February 25, 2014 judgment and orders by the U.S. court, in April 2014, the parties in the Israel class action filed a joint motion requesting that the Israeli Supreme Court renew the proceedings on appeal concerning the determination of the applicable law. A hearing was held on June 23, 2014 concerning whether the Israel class action should proceed in light of the settlement in the U.S. class action. On June 29, 2014, the plaintiff filed a supplemental pleading at the court’s request. We filed our reply pleading on August 19, 2014, and plaintiff filed a further response pleading on September 4, 2014. On April 2, 2015, the Israeli Supreme Court ruled that the Israeli class action is estopped by the U.S. class action settlement and dismissed the case.
On May 13, 2015, a new class action complaint was filed against us in Israel alleging similar claims as the dismissed Israeli class action, and alleging that Israeli shareholders were deprived of due process in the U.S. class action settlement proceedings. We are opposing the new class action on substantially the same grounds on which the previous case was dismissed.
134
On June 29, 2015, the plaintiff in the 2008 Israel Securities Class Action filed a motion for award of compensation and attorneys’ fees based on the amount of settlement compensation received by Israelis in the U.S. class action. We are opposing that motion.
In re VeriFone Securities Litigation
On March 7, 2013, a putative securities class action was filed in the U.S. District Court for the Northern District of California against us, certain of our former officers and one of our current officers and alleged claims in connection with our February 20, 2013 announcement of preliminary financial results for the fiscal quarter ended January 31, 2013. The action, captioned Sanders v. VeriFone Systems, Inc. et al., Case No. C 13-1038, and subsequently re-captioned In re VeriFone Securities Litigation, was initially brought on behalf of a putative class of purchasers of VeriFone securities between December 14, 2011 and February 19, 2013 and asserted claims under the Securities Exchange Act Sections 10(b) and 20(a) and SEC Rule 10b-5 for securities fraud and control person liability. The claims were based on allegations that we and the individual defendants made false or misleading public statements regarding our business, operations, and financial controls during the putative class period. The complaint sought unspecified monetary damages and other relief. Two additional class actions related to the same matter (Laborers Local 235 Benefit Funds v. VeriFone Systems, Inc. et al., Case No. CV 13-1676 and Bland v. VeriFone Systems, Inc. et al., Case No. CV 13-1853) were filed in April 2013. On May 6, 2013, several putative plaintiffs and plaintiffs' law firms filed motions to consolidate these three securities class actions and requesting appointment as lead plaintiff and lead counsel, respectively. The plaintiffs in Laborers Local 235 Benefit Funds v. VeriFone Systems, Inc. et al. and Bland v. VeriFone Systems, Inc. et al. voluntarily dismissed their respective actions, without prejudice, on July 10, 2013 and July 17, 2013, respectively, and filed motions to be appointed lead plaintiff in the action previously captioned Sanders v. VeriFone Systems, Inc. et al. On October 7, 2013, the court entered an order appointing the Selz Funds as lead plaintiffs and appointing Gold Bennett Cera & Sidener LLP as lead counsel. Lead plaintiffs' first amended complaint was filed on December 16, 2013. The first amended complaint expanded the putative class period to December 14, 2011 and February 20, 2013, inclusive, and removed the current officer who was named in the original complaint from the action. We filed our motion to dismiss the amended complaint on February 14, 2014, lead plaintiffs filed their opposition on April 15, 2014 and we filed our reply on May 16, 2014. On May 27, 2014, the court took the motion to dismiss under submission without oral argument. On August 8, 2014, the court dismissed the amended complaint, with leave to amend. Lead plaintiffs filed their second amended complaint on October 7, 2014. We filed a motion to dismiss the second amended complaint on December 8, 2014. Lead plaintiffs filed their opposition and we filed our reply. The court has taken the motion under submission without a hearing.
Dolled v. Bergeron et al.
On April 19, 2013, a derivative action, Dolled v. Bergeron et al., Case No. 113-CV-245056, was filed in the Superior Court of California, County of Santa Clara in connection with our February 20, 2013 announcement of preliminary financial results for the fiscal quarter ended January 31, 2013. The action, brought derivatively on behalf of VeriFone, names VeriFone as a nominal defendant and brings claims for insider selling, breach of fiduciary duty and unjust enrichment variously against certain of our current and former officers and directors. The complaint seeks unspecified monetary damages, restitution and disgorgement of profits and compensation paid to defendants, injunctive relief directing us to reform its corporate governance, and payment of the plaintiff's costs and attorneys' fees. On May 30, 2013, the court entered the parties' stipulation and proposed order, which appointed plaintiff and plaintiff's counsel as lead plaintiff and lead counsel, respectively, in the consolidated action, captioned In re VeriFone Systems, Inc. Derivative Litigation. The next case management conference is scheduled for February 25, 2016.
135
Zoumboulakis v. McGinn et al.
On May 24, 2013, a federal derivative action, Zoumboulakis v. McGinn et al., Case No. 13-CV-02379, was filed in the U.S. District Court for the Northern District of California against certain current and former directors and officers derivatively on our behalf. The complaint, which names us as a nominal defendant, alleges breach of fiduciary duty and abuse of control and asserts claims under Section 14(a) of the Securities Exchange Act of 1934 for false or misleading financial statements and proxy statement disclosures. The complaint seeks unspecified monetary damages, including exemplary damages, restitution from defendants, injunctive relief directing us to make certain corporate governance reforms, and payment of the plaintiff's costs and attorneys' fees. On August 12, 2013, the court entered defendants' motion seeking to relate this action to the pending shareholder class action, Sanders v. VeriFone Systems, Inc. et al. On October 31, 2013, the court entered a stipulation and order setting a December 31, 2013 deadline for the filing of an amended complaint and setting a January 30, 2014 deadline for defendants to move or answer. An initial case management conference was held on January 17, 2014. On January 21, 2014, plaintiff filed an amended complaint, which removed one of our former officers from the action and added an additional former director as a defendant. The amended complaint brings claims against the defendants for breach of fiduciary duty, abuse of control, violations of Securities Exchange Act Section 14(a), and unjust enrichment. The amended complaint also brings claims for insider trading against three of the named former and current directors. We filed our motion to dismiss the amended complaint on March 7, 2014, plaintiff filed an opposition on April 23, 2014, and we filed our reply on May 16, 2014. On May 27, 2014, the court took the motion to dismiss under submission without oral argument. On August 7, 2014, the court dismissed the amended complaint, with leave to amend. Plaintiff filed a second amended complaint on October 17, 2014. We filed a motion to dismiss the second amended complaint on December 18, 2014. On December 3, 2015, the court granted our motion to dismiss, with leave to amend. Plaintiff's amended complaint is due on December 18, 2015.
If any of these class action or derivative lawsuits is resolved adversely to us, it could have a material adverse effect on our business, financial condition, results of operations, and cash flows.
Antitrust Investigation
The Competition Commission of India ("CCI") investigated certain complaints made against us alleging unfair practices based on certain provisions in our software development license arrangements in India. We cooperated with requests by the CCI in its investigation. In March 2014, the director general of the CCI investigating the allegations issued a report rejecting certain of the allegations, but also finding that certain provisions of our licenses may constitute unfair business practices. VeriFone India Sales Pvt. Ltd. filed objections to that report.
In April 2015, the CCI issued rulings directing Verifone India to cease and desist from engaging in the alleged anti-competitive conduct and imposing a penalty, the amount of which is not material to our results of operations. We have deposited 10% of this penalty amount and accrued the balance while we appeal these rulings.
On June 15, 2015, we filed appeals and interim applications to stay the CCI orders. The appellate court has granted our interim applications to stay all proceedings at least until the final appellate hearing, which is scheduled on January 19, 2016.
The CCI's rulings reserved the right to pursue additional proceedings against individuals that it deems responsible for the alleged conduct. We are unable to make any estimate of potential loss for any further proceedings the CCI may pursue but do not expect it to be material to our results of operations.
136
Other Litigation
Certain of the foregoing cases are still in the preliminary stages, and we are not able to quantify the extent of our potential liability, if any, other than as described above. Further, the outcome of litigation is inherently unpredictable and subject to significant uncertainties. If any of these matters are resolved adversely to us, this could have a material adverse effect on our business, financial condition, results of operations, and cash flows. In addition, defending these legal proceedings is likely to be costly, which may have a material adverse effect on our financial condition, results of operations and cash flows, and may divert management's attention from the day-to-day operations of our business. We are subject to various other legal proceedings related to commercial, customer, and employment matters that have arisen during the ordinary course of business. The outcome of such legal proceedings is inherently unpredictable and subject to significant uncertainties. Although there can be no assurance as to the ultimate disposition of these matters, our management has determined, based upon the information available at the date of these financial statements, including anticipated expected availability of insurance coverage, that the expected outcome of these matters, individually or in the aggregate, will not have a material adverse effect on our consolidated financial position, results of operations or cash flows.
Note 13. Segment and Geographic Information
Segment Information
Net revenues and operating income of each segment reflect net revenues and expenses that are directly attributable to that segment. Net revenues and expenses not allocated to segment net revenues and segment operating income include amortization of purchased intangible assets, fair value decrease (step-down) in deferred revenue at acquisition, corporate inventory reserves, asset impairments, restructuring expenses, stock-based compensation, litigation settlement and loss contingency expense (benefit), as well as other corporate research and development, sales and marketing, and general and administrative expenses not directly attributable to a segment. We do not separately evaluate assets by segment, and therefore assets by segment are not presented below.
The following table sets forth net revenues for our reportable segments and reconciles segment net revenues to total net revenues (in thousands):
Years Ended October 31, | |||||||||||
2015 | 2014 | 2013 | |||||||||
Segment net revenues: | |||||||||||
North America | $ | 791,764 | $ | 526,175 | $ | 495,155 | |||||
EMEA | 697,153 | 756,541 | 704,657 | ||||||||
Latin America | 275,706 | 322,988 | 299,106 | ||||||||
Asia-Pacific | 236,828 | 265,284 | 210,333 | ||||||||
Total segment net revenues | 2,001,451 | 1,870,988 | 1,709,251 | ||||||||
Net revenues not allocated to segment net revenues | (994 | ) | (2,114 | ) | (7,030 | ) | |||||
Total net revenues | $ | 2,000,457 | $ | 1,868,874 | $ | 1,702,221 | |||||
137
The following table sets forth operating income for our reportable segments and reconciles segment operating income to consolidated operating income (loss) (in thousands):
Years Ended October 31, | |||||||||||
2015 | 2014 | 2013 | |||||||||
Operating income by segment: | |||||||||||
North America | $ | 290,934 | $ | 157,689 | $ | 152,875 | |||||
EMEA | 191,412 | 208,294 | 188,443 | ||||||||
Latin America | 55,294 | 61,388 | 66,324 | ||||||||
Asia-Pacific | 35,769 | 57,151 | 38,569 | ||||||||
Total segment operating income | 573,409 | 484,522 | 446,211 | ||||||||
Items not allocated to segment operating income: | |||||||||||
Net revenues not allocated to segment net revenues | (994 | ) | (2,114 | ) | (7,030 | ) | |||||
Amortization of purchased intangible assets | (100,799 | ) | (140,262 | ) | (140,899 | ) | |||||
Stock-based compensation expense | (42,253 | ) | (53,897 | ) | (48,851 | ) | |||||
Restructuring expense | (8,777 | ) | (18,136 | ) | (323 | ) | |||||
Litigation settlement and loss contingency expense (benefit) | (1,213 | ) | 8,632 | (64,371 | ) | ||||||
Other expenses not allocated to segments | (312,382 | ) | (272,860 | ) | (251,091 | ) | |||||
Total operating income (loss) | $ | 106,991 | $ | 5,885 | $ | (66,354 | ) | ||||
Our goodwill by reportable segment was as follows (in thousands):
October 31, | |||||||
2015 | 2014 | ||||||
North America | $ | 106,641 | $ | 100,846 | |||
EMEA | 810,062 | 906,866 | |||||
Latin America | 85,797 | 90,156 | |||||
Asia-Pacific | 81,531 | 88,024 | |||||
Total goodwill | $ | 1,084,031 | $ | 1,185,892 | |||
Depreciation and amortization of fixed assets was allocated to segments as follows (in thousands):
Years Ended October 31, | |||||||||||
2015 | 2014 | 2013 | |||||||||
North America | $ | 15,493 | $ | 10,970 | $ | 6,092 | |||||
EMEA | 27,507 | 29,371 | 29,150 | ||||||||
Latin America | 1,378 | 2,148 | 1,812 | ||||||||
Asia-Pacific | 7,220 | 5,627 | 3,102 | ||||||||
Unallocated | 7,071 | 11,549 | 14,598 | ||||||||
Total depreciation and amortization expense | $ | 58,669 | $ | 59,665 | $ | 54,754 | |||||
138
Geographic Information
Our net revenues, by country with net revenues over 10% of total net revenues, were as follows (in thousands):
Years Ended October 31, | |||||||||||
2015 | 2014 | 2013 | |||||||||
United States | $ | 789,386 | $ | 522,982 | $ | 482,820 | |||||
Brazil | 137,936 | 197,472 | 151,964 | ||||||||
Other countries | 1,073,135 | 1,148,420 | 1,067,437 | ||||||||
Total net revenues | $ | 2,000,457 | $ | 1,868,874 | $ | 1,702,221 | |||||
Net revenues are allocated to countries based on the shipping destination or service delivery location of customer orders.
Fixed assets, net, by country with fixed assets over 10% of total fixed assets, were as follows (in thousands):
October 31, | |||||||
2015 | 2014 | ||||||
United States | $ | 99,961 | $ | 74,506 | |||
Other countries | 91,004 | 103,247 | |||||
Fixed assets, net | $ | 190,965 | 177,753 | ||||
Note 14. Subsequent Events
On November 6, 2015, we signed a share purchase agreement with InterCard AG, a leading Payment-as-a-Service provider in Germany to acquire all the outstanding shares of InterCard for approximately 85.0 million Euro (approximately $92.4 million at the foreign exchange rate as of November 6, 2015). We have received all required regulatory approvals and expect to close the acquisition during the quarter ending January 31, 2016. This acquisition will expand our Payment-as-a-Service solutions in Europe. The acquisition will be accounted for using the acquisition method of accounting.
139
VERIFONE SYSTEMS, INC.
Selected Quarterly Results of Operations (Unaudited)
The following selected quarterly data should be read in conjunction with our Consolidated Financial Statements and accompanying notes appearing in this Item 8, Financial Statements and Supplementary Data, and Item 7, Management’s Discussion and Analysis of Financial Condition and Results of Operations included elsewhere in this Annual Report on Form 10-K. This information has been derived from our unaudited Consolidated Financial Statements that, in our opinion, reflect all recurring adjustments necessary to fairly present our financial information when read in conjunction with our Consolidated Financial Statements and Notes. The results of operations for any quarter are not necessarily indicative of the results to be expected for any future period.
The tables below sets forth selected unaudited financial data for each quarter for the last two fiscal years (in thousands, except for per share amounts):
Year Ended October 31, 2015 | |||||||||||||||
First Quarter (1) | Second Quarter (1) | Third Quarter (1) | Fourth Quarter (1)(2) | ||||||||||||
Net revenues | $ | 486,226 | $ | 490,144 | $ | 509,940 | $ | 514,147 | |||||||
Gross margin | 199,170 | 203,903 | 206,541 | 216,369 | |||||||||||
Operating income | 23,175 | 29,716 | 20,284 | 33,816 | |||||||||||
Consolidated net income | 14,128 | 17,666 | 10,080 | 38,483 | |||||||||||
Net income attributable to VeriFone Systems, Inc. stockholders | $ | 13,848 | $ | 17,564 | $ | 9,454 | $ | 38,231 | |||||||
Basic net income per share | $ | 0.12 | $ | 0.15 | $ | 0.08 | $ | 0.33 | |||||||
Diluted net income per share | $ | 0.12 | $ | 0.15 | $ | 0.08 | $ | 0.33 | |||||||
(1) | The first, second, third, and fourth fiscal quarters of 2015 include $1.4 million, $0.1 million, $6.0 million, and $1.3 million, respectively, of restructuring charges as part of cost optimization and corporate transformation initiatives. For further information, see Note 11, Restructurings, in the Notes to Consolidated Financial Statements of this Annual Report on Form 10-K. |
(2) | In the fourth fiscal quarter of 2015 we recorded a $16.1 million tax benefit as a result of releasing a portion of our valuation allowance against certain non-U.S. foreign deferred tax assets. For further information, see Note 6, Income Taxes, in the Notes to Consolidated Financial Statements of this Annual Report on Form 10-K. |
140
Year Ended October 31, 2014 | |||||||||||||||
First Quarter | Second Quarter (4) | Third Quarter (4)(5) | Fourth Quarter (3)(4) | ||||||||||||
Net revenues | $ | 436,066 | $ | 466,417 | $ | 475,900 | $ | 490,491 | |||||||
Gross margin | 170,217 | 175,274 | 182,770 | 196,456 | |||||||||||
Operating income (loss) | (6,515 | ) | (13,548 | ) | (7,547 | ) | 33,495 | ||||||||
Consolidated net income (loss) | (16,097 | ) | (23,563 | ) | (28,107 | ) | 31,325 | ||||||||
Net income (loss) attributable to VeriFone Systems, Inc. stockholders | $ | (16,233 | ) | $ | (23,915 | ) | $ | (29,033 | ) | $ | 31,051 | ||||
Basic net income (loss) per share | $ | (0.15 | ) | $ | (0.22 | ) | $ | (0.26 | ) | $ | 0.27 | ||||
Diluted net income (loss) per share | $ | (0.15 | ) | $ | (0.22 | ) | $ | (0.26 | ) | $ | 0.27 | ||||
(3) | In the fourth fiscal quarter of 2014 we released a $19.9 million litigation loss contingency expense, plus estimated potential ongoing royalties and interest, related to a favorable ruling in a patent infringement litigation captioned Cardsoft, Inc. and Cardsoft (Assignment for the Benefit of Creditors), LLC v. VeriFone Holdings, Inc. et al. For further information, see Note 12, Commitments and Contingencies, in the Notes to Consolidated Financial Statements of this Annual Report on Form 10-K. |
(4) | The second, third, and fourth fiscal quarters of 2014 include $5.8 million, $10.8 million, and $1.5 million, respectively, of restructuring charges as part of cost optimization and corporate transformation initiatives. For further information, see Note 11, Restructurings, in the Notes to Consolidated Financial Statements of this Annual Report on Form 10-K. |
(5) | During the third fiscal quarter of 2014 we amended and restated our existing credit agreement. The initial amounts borrowed, together with cash on hand, were used to repay the $938.6 million outstanding balance on the credit agreement as well as the costs associated with the amendment and restatement. In connection with this transaction we expensed $4.1 million of debt amendment costs and accelerated $5.2 million of interest expense on previously capitalized debt issuance costs associated with extinguished debt. For further information, see Note 10, Financings, in the Notes to Consolidated Financial Statements of this Annual Report on Form 10-K. |
141
ITEM 9. | CHANGES IN AND DISAGREEMENTS WITH ACCOUNTANTS ON ACCOUNTING AND FINANCIAL DISCLOSURE |
There were no changes in or disagreements with accountants on accounting and financial disclosure during the last three fiscal years.
ITEM 9A. | CONTROLS AND PROCEDURES |
Evaluation of Disclosure Controls and Procedures
Disclosure controls are procedures that are designed to ensure that information required to be disclosed in our reports filed under the Securities Exchange Act of 1934, or the Exchange Act, such as this Annual Report on Form 10-K, is recorded, processed, summarized and reported within the time periods specified by the U.S. Securities and Exchange Commission. Based on management's evaluation (with the participation of our Chief Executive Officer and Chief Financial Officer), as of the end of the period covered by this report, our CEO and CFO have concluded that our disclosure controls and procedures (as defined in Rules 13a-15(e) and 15d-15(e) under the Securities Exchange Act of 1934, as amended), are designed to and are effective to, provide reasonable assurance that information required to be disclosed by us in reports that we file or submit under the Exchange Act is recorded, processed, summarized, and reported within the time periods specified in Securities and Exchange Commission rules and forms, and is accumulated and communicated to management, including our principal executive officer and principal financial officer, as appropriate, to allow timely decisions regarding required disclosure.
Changes in Internal Control over Financial Reporting
There were no changes to our internal control over financial reporting (as defined in Rules 13a-15(f) under the Exchange Act) that occurred during the period covered by this report that have materially affected, or are reasonably likely to materially affect, our internal control over financial reporting.
Management’s Report on Internal Control over Financial Reporting
Our management is responsible for establishing and maintaining adequate internal control over financial reporting, as defined in Exchange Act Rule 13a-15(f) to provide reasonable assurance regarding the reliability of our financial reporting and consolidated financial statements for external purposes in accordance with U.S. generally accepted accounting principles.
Management assessed our internal control over financial reporting as of October 31, 2015, the end of our fiscal year. Management based its assessment on the 2013 framework established in Internal Control-Integrated Framework issued by the Committee of Sponsoring Organizations of the Treadway Commission. Management's assessment included evaluation of elements such as the design and operating effectiveness of key financial reporting controls, process documentation, accounting policies, and our overall control environment.
Based on our assessment, management has concluded that our internal control over financial reporting was effective as of the end of the fiscal year to provide reasonable assurance regarding the reliability of financial reporting and the preparation of consolidated financial statements for external reporting purposes in accordance with U.S. generally accepted accounting principles. We reviewed the results of management's assessment with the Audit Committee of our Board of Directors.
The effectiveness of our internal control over financial reporting as of October 31, 2015 has been audited by Ernst & Young LLP, an independent registered public accounting firm, as stated in its report which is included in Item 8 of this Annual Report on Form 10-K.
142
Inherent Limitations on Effectiveness of Controls
Our management, including the CEO and CFO, does not expect that our disclosure controls or our internal control over financial reporting will prevent or detect all error and all fraud. A control system, no matter how well designed and operated, can provide only reasonable, not absolute, assurance that the control system's objectives will be met. The design of a control system must reflect the fact that there are resource constraints, and the benefits of controls must be considered relative to their costs. Further, because of the inherent limitations in all control systems, no evaluation of controls can provide absolute assurance that misstatements due to error or fraud will not occur or that all control issues and instances of fraud, if any, have been detected. The design of any system of controls is based in part on certain assumptions about the likelihood of future events, and there can be no assurance that any design will succeed in achieving its stated goals under all potential future conditions. Projections of any evaluation of the effectiveness of controls to future periods are subject to risks. Over time, controls may become inadequate because of changes in conditions or deterioration in the degree of compliance with policies or procedures. Our disclosure controls and procedures are designed to provide reasonable assurance that information required to be disclosed by us in reports that we file or submit under the Exchange Act is recorded, processed, summarized, and reported within the time periods specified in Securities and Exchange Commission rules and forms, and is accumulated and communicated to management, including our principal executive officer and principal financial officer, as appropriate, to allow timely decisions regarding required disclosure.
ITEM 9B. | OTHER INFORMATION |
None.
143
Part III
ITEM 10. | DIRECTORS, EXECUTIVE OFFICERS AND CORPORATE GOVERNANCE |
In addition to the information set forth under the caption “Executive Officers” in Part I of this Annual Report on Form 10-K, the information required by this Item is expected to be in our definitive Proxy Statement for the 2016 Annual Meeting of Stockholders (the “Proxy Statement”), which we expect to be filed within 120 days of the end of our fiscal year ended October 31, 2015 and is incorporated herein by reference.
ITEM 11. | EXECUTIVE COMPENSATION |
Information relating to our executive officer and director compensation is incorporated herein by reference to the Proxy Statement.
ITEM 12. | SECURITY OWNERSHIP OF CERTAIN BENEFICIAL OWNERS AND MANAGEMENT AND RELATED STOCKHOLDER MATTERS |
Information relating to security ownership of certain beneficial owners of our common stock and information relating to the security ownership of the registrant's management is incorporated herein by reference to the Proxy Statement.
ITEM 13. | CERTAIN RELATIONSHIPS AND RELATED TRANSACTIONS, AND DIRECTOR INDEPENDENCE |
Information relating to certain relationships and related transactions and director independence is incorporated herein by reference to the Proxy Statement.
ITEM 14. | PRINCIPAL ACCOUNTANT FEES AND SERVICES |
Information regarding principal accountant fees and services is incorporated herein by reference to the Proxy Statement.
144
Part IV
ITEM 15. | EXHIBITS, FINANCIAL STATEMENT SCHEDULES. |
The following documents are filed as part of this Annual Report on Form 10-K:
1. Consolidated Financial Statements
The consolidated financial statements required to be filed in the Annual Report on Form 10-K and other supplemental financial information required by Item 302 of Regulation S-K are included in Item 8, Financial Statements and Supplementary Data, included elsewhere in this Annual Report on Form 10-K.
2. Financial Statement Schedule
All financial statement schedules have been omitted because the required information is not present or not present in amounts sufficient to require the submission of schedules, or because the information required is included in our Consolidated Financial Statements and Notes thereto.
3. Exhibits The documents set forth below are filed herewith or incorporated by reference to the location indicated.
Exhibits
Exhibit Number | Description | |
2.1(7) | Agreement and Plan of Merger, dated as of November 17, 2010, among Hypercom Corporation, VeriFone Systems, Inc. and Honey Acquisition Company. | |
3.1(8) | Amended and Restated Certificate of Incorporation of VeriFone as amended. | |
3.2(15) | Amended and Restated Bylaws of VeriFone. | |
4.1(2) | Specimen Common Stock Certificate; reference is made to Exhibit 3.1. | |
10.1(1)+ | 2002 Securities Purchase Plan. | |
10.2(1)+ | New Founders’ Stock Option Plan. | |
10.3(2)+ | Outside Directors’ Stock Option Plan. | |
10.4(4)+ | 2005 Employee Equity Incentive Plan. | |
10.5(3)+ | Form of Indemnification Agreement. | |
10.6(13)+ | Amended and Restated VeriFone Systems, Inc. (formerly, VeriFone Holdings, Inc.) 2006 Equity Incentive Plan. | |
10.7(5)+ | Form of Amended and Restated VeriFone Bonus Plan. | |
145
Exhibit Number | Description | |
10.8(6)+ | Lipman Electronic Engineering Ltd. 2003 Stock Option Plan. | |
10.9(6)+ | Lipman Electronic Engineering Ltd. 2004 Stock Option Plan. | |
10.10(6)+ | Lipman Electronic Engineering Ltd. 2004 Share Option Plan. | |
10.11(6)+ | Amendment to Lipman Electronic Engineering Ltd. 2004 Share Option Plan. | |
10.12(6)+ | Lipman Electronic Engineering Ltd. 2006 Share Incentive Plan. | |
10.13(9) | Sale and Purchase Agreement dated November 12, 2011 by and between Point Luxembourg Holding S.À.R.L. and Electronic Transactions Group Limited, as Sellers, and VeriFone Nordic AB, as Purchaser. | |
10.14(10) | Security Agreement, dated as of December 28, 2011, by and among JPMorgan Chase Bank, N.A., in its capacity as the Collateral Agent, and the VeriFone parties. | |
10.15(10) | Pledge Agreement, dated as of December 28, 2011, by and among the VeriFone parties and JPMorgan Chase Bank, N.A., in its capacity as the Collateral Agent. | |
10.16(10) | Guaranty, dated as of December 28, 2011, executed by each of the Guarantors party thereto in favor of JPMorgan Chase Bank, N.A., in its capacity as Administrative Agent. | |
10.17(11)+ | Offer Letter between the Company and Marc E. Rothman. | |
10.18(11) | Form of Restricted Stock Unit Award Notice. | |
10.19(12)+ | Letter Agreement, dated March 11, 2013, by and among VeriFone Systems, Inc., VeriFone, Inc. and Douglas G. Bergeron. | |
10.20(15)+ | Offer Letter, dated September 15, 2013, between the Company and Paul Galant. | |
10.21(15)+ | Executive Severance Policy. | |
10.22(16) | Amendment and Restatement Agreement, dated as of July 8, 2014, to the Credit Agreement, among VeriFone Intermediate Holdings, Inc., VeriFone, Inc., the other Loan Parties party thereto, the Lender parties thereto and JPMorgan Chase Bank, N.A., as Administrative Agent and Collateral Agent. | |
10.23(17) | Offer letter, dated November 14, 2013, between the Company and Alok Bhanot. | |
146
Exhibit Number | Description | |
10.24(17) | Offer letter, dated May 8, 2014, between the Company and June Felix. | |
10.25*+ | Director Deferred Compensation Plan. | |
21.1* | List of subsidiaries of VeriFone. | |
23.1* | Consent of Independent Registered Public Accounting Firm. | |
31.1* | Certification of the Chief Executive Officer, as required by Section 302 of the Sarbanes-Oxley Act of 2002. | |
31.2* | Certification of the Chief Financial Officer, as required by Section 302 of the Sarbanes-Oxley Act of 2002. | |
32.1* | Certification of the Chief Executive Officer and the Chief Financial Officer as required by Section 906 of the Sarbanes-Oxley Act of 2002. | |
101.INS** | XBRL Instance Document | |
101.SCH** | XBRL Taxonomy Extension Schema Document | |
101.CAL** | XBRL Taxonomy Extension Calculation Linkbase Document | |
101.DEF** | XBRL Taxonomy Extension Definition Linkbase Document | |
101.LAB** | XBRL Taxonomy Extension Label Linkbase Document | |
101.PRE** | XBRL Taxonomy Extension Presentation Linkbase Document | |
* | Filed herewith. |
+ | Indicates a management contract or compensatory plan or arrangement. |
** | XBRL (eXtensible Business Reporting Language) information is furnished and not filed or a part of a registration statement or prospectus for purposes of sections 11 or 12 of the Securities Act of 1933, is deemed not filed for purposes of section 18 of the Securities Exchange Act of 1934, and otherwise is not subject to liability under these sections. |
(1) | Filed as an exhibit to Amendment No. 1 to the Registrant’s Registration Statement on Form S-1 (File No. 333-121947), filed February 23, 2005. |
(2) | Filed as an exhibit to Amendment No. 3 to the Registrant’s Registration Statement on Form S-1 (File No. 333-121947), filed April 18, 2005. |
147
(3) | Filed as an exhibit to Amendment No. 5 to the Registrant’s Registration Statement on Form S-1 (File No. 333-121947), filed April 29, 2005. |
(4) | Filed as an exhibit to the Registrant’s Registration Statement on Form S-8 (File No. 333-124545), filed May 2, 2005. |
(5) | Filed as an appendix to the Registrant’s Definitive Proxy Statement for its 2011 Annual Meeting of Stockholders, filed May 19, 2011. |
(6) | Incorporated by reference in the Registrant’s Registration Statement on Form S-8 (File No. 333-138533), filed November 9, 2006. |
(7) | Filed as an exhibit to the Registrant’s Current Report on Form 8-K, filed November 19, 2010. |
(8) | Filed as an exhibit to the Registrant's Annual Report on Form 10-K, filed December 21, 2010. |
(9) | Filed as an exhibit to the Registrant's Annual Report on Form 10-Q, filed March 9, 2012. |
(10) | Filed as an exhibit to the Registrant's Current Report on Form 8-K, filed January 4, 2012. |
(11) | Filed as an exhibit to the Registrant's Current Report on Form 8-K, filed February 4, 2013. |
(12) | Filed as an exhibit to the Registrant's Current Report on Form 8-K, filed March 15, 2013. |
(13) | Filed as an appendix to the Registrant’s Definitive Proxy Statement for its 2015 Annual Meeting of Stockholders, filed March 26, 2015. |
(14) | Filed as an exhibit to the Registrant’s Quarterly Report on Form 10-Q, filed September 5, 2013. |
(15) | Filed as an exhibit to the Registrant’s Current Report on Form 8-K, filed September 23, 2013. |
(16) | Filed as an exhibit to the Registrant’s Current Report on Form 8-K, filed July 10, 2014. |
148
SIGNATURES
Pursuant to the requirements of Section 13 or 15(d) of the Securities Exchange Act of 1934, the registrant has duly caused this report on Annual Report on Form 10-K to be signed on its behalf by the undersigned, thereunto duly authorized.
VERIFONE SYSTEMS, INC. | ||
BY: | /S/ PAUL S. GALANT | |
Paul S. Galant | ||
Chief Executive Officer | ||
December 18, 2015
Pursuant to the requirements of the Securities Exchange Act of 1934, this Annual Report on Form 10-K has been signed below by the following persons on behalf of the registrant and in the capacities and on the dates indicated:
149
Signature | Title | Date | ||
/S/ PAUL S. GALANT | Chief Executive Officer | December 18, 2015 | ||
Paul S. Galant | (principal executive officer) | |||
/s/ MARC E. ROTHMAN | Executive Vice President and Chief Financial Officer | December 18, 2015 | ||
Marc E. Rothman | (principal financial and accounting officer) | |||
/s/ ROBERT W. ALSPAUGH | Director | December 18, 2015 | ||
Robert W. Alspaugh | ||||
/s/ KAREN AUSTIN | Director | December 18, 2015 | ||
Karen Austin | ||||
/s/ ALEX W. HART | Chairman of the Board of Directors | December 18, 2015 | ||
Alex W. Hart | ||||
/s/ ROBERT B. HENSKE | Director | December 18, 2015 | ||
Robert B. Henske | ||||
/s/ WENDA HARRIS MILLARD | Director | December 18, 2015 | ||
Wenda Harris Millard | ||||
/s/ EITAN RAFF | Director | December 18, 2015 | ||
Eitan Raff | ||||
/s/ JONATHAN I. SCHWARTZ | Director | December 18, 2015 | ||
Jonathan I. Schwartz | ||||
/s/ JANE J. THOMPSON | Director | December 18, 2015 | ||
Jane J. Thompson | ||||
150