Attached files
Table of Contents
UNITED STATES
SECURITIES AND EXCHANGE COMMISSION
Washington, D.C. 20549
Form 10-K
(Mark One)
| þ | ANNUAL REPORT PURSUANT TO SECTION 13 OR 15(d) OF THE SECURITIES EXCHANGE ACT OF 1934 |
For the fiscal year ended October 31, 2009
OR
| ¨ | TRANSITION REPORT PURSUANT TO SECTION 13 OR 15(d) OF THE SECURITIES EXCHANGE ACT OF 1934 |
For the transition period from to
Commission file number 001-32465
VERIFONE HOLDINGS, INC.
(Exact name of Registrant as Specified in its Charter)
| DELAWARE | 04-3692546 | |
| (State or Other Jurisdiction of Incorporation or Organization) |
(I.R.S. Employer Identification No.) | |
| 2099 Gateway Place, Suite 600 | 95110 | |
| San Jose, CA (Address of Principal Executive Offices) |
(Zip Code) | |
(408) 232-7800
(Registrant’s Telephone Number, Including Area Code)
Securities registered pursuant to Section 12(b) of the Act:
| Title of Each Class |
Name of Each Exchange on Which Registered | |
| Common Stock, $.01 par value | New York Stock Exchange |
Securities registered pursuant to Section 12(g) of the Act:
None.
Indicate by check mark if the registrant is a well-known seasoned issuer, as defined in Rule 405 of the Securities Act. Yes þ No ¨
Indicate by check mark if the registrant is not required to file reports pursuant to Section 13 or Section 15(d) of the Act. Yes ¨ No þ
Indicate by check mark whether the registrant (1) has filed all reports required to be filed by Section 13 or 15(d) of the Securities Exchange Act of 1934 during the preceding 12 months (or for such shorter period that the registrant was required to file such reports), and (2) has been subject to such filing requirements for the past 90 days. Yes þ No ¨
Indicate by check mark whether the registrant has submitted electronically and posted on its corporate Web site, if any, every Interactive Data File required to be submitted and posted pursuant to Rule 405 of Regulation S-T (§232.405 of this chapter) during the preceding 12 months (or for such shorter period that the registrant was required to submit and post such files). Yes ¨ No ¨
Indicate by check mark if disclosure of delinquent filers pursuant to Item 405 of Regulation S-K is not contained herein, and will not be contained, to the best of registrant’s knowledge, in definitive proxy or information statements incorporated by reference in Part III of this Form 10-K, or any amendment to this Form 10-K. þ
Indicate by check mark whether the registrant is a large accelerated filer, an accelerated filer, a non-accelerated filer, or a smaller reporting company. See the definitions of “large accelerated filer,” “accelerated filer” and “smaller reporting company” in Rule 12b-2 of the Exchange Act. (Check one):
| Large accelerated filer ¨ | Accelerated filer þ | Non-accelerated filer ¨ | Smaller reporting company ¨ | |||
| (Do not check if a smaller reporting company) | ||||||
Indicate by check mark whether the registrant is a shell company (as defined in Rule 12b-2 of the Act). Yes ¨ No þ
As of April 30, 2009, the aggregate market value of the common stock of the registrant held by non-affiliates was approximately $471.9 million based on the closing sale price as reported on the New York Stock Exchange.
There were 84,633,459 shares of the registrant’s common stock issued and outstanding as of the close of business on December 15, 2009.
DOCUMENTS INCORPORATED BY REFERENCE
As noted herein, the information called for by Part III is incorporated by reference to specified portions of the Registrant’s definitive proxy statement to be filed in conjunction with the Registrant’s 2010 Annual Meeting of Stockholders, which is expected to be filed not later than 120 days after the Registrant’s fiscal year ended October 31, 2009.
Table of Contents
VERIFONE HOLDINGS, INC.
2009 ANNUAL REPORT ON FORM 10-K
| PART I. | ||||
| Item 1. |
4 | |||
| Item 1A. |
19 | |||
| Item 1B. |
36 | |||
| Item 2. |
36 | |||
| Item 3. |
37 | |||
| Item 4. |
41 | |||
| PART II. | ||||
| Item 5. |
42 | |||
| Item 6. |
44 | |||
| Item 7. |
Management’s Discussion and Analysis of Financial Condition and Results of Operations |
46 | ||
| Item 7A. |
73 | |||
| Item 8. |
76 | |||
| Item 9. |
Changes in and Disagreements with Accountants on Accounting and Financial Disclosure |
128 | ||
| Item 9A. |
128 | |||
| Item 9B. |
130 | |||
| PART III. | ||||
| Item 10. |
130 | |||
| Item 11. |
130 | |||
| Item 12. |
Security Ownership of Certain Beneficial Owners and Management and Related Stockholder Matters |
131 | ||
| Item 13. |
Certain Relationships and Related Transactions, and Director Independence |
131 | ||
| Item 14. |
131 | |||
| PART IV. | ||||
| Item 15. |
131 | |||
2
Table of Contents
FORWARD LOOKING STATEMENTS
This report and certain information incorporated by reference herein contain forward-looking statements within the meaning of the Private Securities Litigation Reform Act of 1995, Section 27A of the Securities Act of 1933, and Section 21E of the Securities Exchange Act of 1934. These statements relate to future events or our future financial performance. In some cases, you can identify forward-looking statements by terminology such as “may,” “should,” “expect,” “plan,” “intend,” “anticipate,” “believe,” “estimate,” “predict,” “potential,” or “continue,” the negative of such terms, or comparable terminology.
Actual events or results may differ materially. In evaluating these statements, you should specifically consider various factors, including the risks outlined in Item 1A-Risk Factors in this Annual Report on Form 10-K. These factors may cause our actual results to differ materially from any forward-looking statement.
Although we believe that the expectations reflected in the forward-looking statements are reasonable, we cannot guarantee future results, events, levels of activity, performance, or achievements. Moreover, neither we nor any other person assumes responsibility for the accuracy and completeness of the forward-looking statements.
These statements relate to future events or our future financial performance, and involve known and unknown risks, uncertainties, and other factors that may cause our actual results, levels of activity, performance, or achievements to be materially different from any future results, levels of activity, performance, or achievements expressed or implied by these forward-looking statements. These risks and other factors include those listed under Item 1A-Risk Factors in this Annual Report on Form 10-K, and elsewhere in this report. We are under no duty to update any of the forward-looking statements after the date of this Annual Report on Form 10-K to conform such statements to actual results or to changes in expectations.
3
Table of Contents
| ITEM 1. | BUSINESS |
We are a global leader in secure electronic payment solutions. We provide expertise, solutions, and services that add value to the point of sale with merchant-operated, consumer-facing, and self-service payment systems for the financial, retail, hospitality, petroleum, transportation, government, and healthcare vertical markets. Since 1981, we have designed and marketed system solutions that facilitate the long-term shift toward electronic payment transactions and away from cash and checks.
Our system solutions consist of point of sale electronic payment devices that run our proprietary and third-party operating systems, security and encryption software, and certified payment software as well as other third-party value-added applications. Our system solutions are able to process a wide range of payment types. They include signature and PIN-based debit cards, credit cards, contactless/radio frequency identification (“RFID”) cards and tokens, Near Field Communication (“NFC”), enabled mobile phones, smart cards, pre-paid gift and other stored-value cards, electronic bill payment, check authorization and conversion, signature capture, and electronic benefits transfer (“EBT”). Our proprietary architecture was the first to enable multiple value-added applications, such as gift card and loyalty card programs, healthcare insurance eligibility, and time and attendance tracking, to reside on the same system without requiring recertification when new applications are added to the system. We are an industry leader in multi-application payment system deployments and we believe we have the largest selection of certified value-added applications.
We design our system solutions to meet the demanding requirements of our direct and indirect customers. Our electronic payment systems are available in several modular configurations, offering our customers flexibility to support a variety of connectivity options, including wireline and wireless internet protocol (“IP”) technologies. We also offer our customers support for installed systems, consulting and project management services for system deployment, and customization of integrated software solution.
Security has become a driving factor in our business as our customers endeavor to meet ever escalating governmental requirements related to the prevention of identity theft as well as operating regulation safeguards issued by the credit and debit card associations, members of which include Visa International (“Visa”), MasterCard Worldwide (“MasterCard”), American Express, Discover Financial Services, and JCB Co., Ltd. (“JCB”). In September 2006, these card associations established the Payment Card Industry Security Standards Council (“PCI SSC”) to oversee and unify industry standards in the areas of credit card data security, referred to as the PCI-PED standard which consists of PIN-entry device security (“PED”) and the PCI Data Security Standard (“PCI-DSS”) for enterprise data security, and the Payment Application Data Security Standard (“PA-DSS”) for payment application data security. We are a leader in providing systems and software solutions that meet these standards and have upgraded or launched next generation system solutions that span our product portfolio ahead of mandated deadlines.
VeriFone recently led the development of the Secure Point of Sale (“POS”) Vendor Alliance (“SPVA”). The SPVA is a non-profit organization that works with stakeholders in the payment value chain. The SPVA is open to participation from all POS vendors engaged in developing secure payment systems, as well as other businesses that interact with these payment system vendors. To date, its membership consists of major transaction acquirers, payment technology vendors, encryption vendors and other POS companies. The SPVA is currently focused on developing standards for secure, end-to-end encryption systems and developing standards for the secure management of payment devices through their lifecycle, from manufacturing, to deployment, to operation and repair and ultimately to removal from service. The standards will likely require major upgrades to existing software and hardware infrastructure over time and will create opportunities for the secure remote management and control of millions of deployed payment systems.
Our customers are primarily financial institutions, payment processors, petroleum companies, large retailers, government organizations, and healthcare companies, as well as independent sales organizations (“ISO”). The
4
Table of Contents
functionality of our system solutions includes the capture of electronic payment data, certified transaction security, connectivity, compliance with regulatory standards and the flexibility to execute a variety of payment and non-payment applications on a single system solution.
Company History
VeriFone, Inc., our principal operating subsidiary, was incorporated in 1981. Shortly afterward, we introduced the first check verification and credit authorization device ever utilized by merchants in a commercial setting. In 1984, we introduced the first mass market electronic payment system intended to replace manual credit card authorization devices for small merchants. VeriFone, Inc. became a publicly traded company in 1990 and was acquired by Hewlett-Packard Company (“HP”) in 1997. HP operated VeriFone, Inc. as a division until July 2001, when it sold VeriFone, Inc. to Gores Technology Group, LLC, a privately held acquisition and investment management firm, in a transaction led by our Chief Executive Officer, Douglas G. Bergeron. In July 2002, Mr. Bergeron and certain investment funds affiliated with GTCR Golder Rauner, LLC, or GTCR, a private equity firm, led a recapitalization in which VeriFone Holdings, Inc. was organized as a holding company for VeriFone, Inc., and GTCR-affiliated funds became our majority stockholders. We completed our initial public offering on May 4, 2005. In June 2009, the GTCR-affiliated funds ceased to be beneficial owners of 5% or more of our outstanding common stock.
On November 1, 2006, we acquired Lipman Electronic Engineering Ltd. (“Lipman”). Prior to the acquisition, Lipman, a provider of electronic payment systems headquartered in Israel, developed, manufactured and marketed a variety of handheld, wireless and landline POS terminals, electronic cash registers, retail ATM units, PIN pads and smart card readers, as well as integrated PIN and smart card solutions. In connection with this acquisition, we issued 13,462,474 shares of our common stock and paid $347.4 million in cash in exchange for all the outstanding ordinary shares of Lipman. All options to purchase Lipman ordinary shares were exchanged for options to purchase approximately 3.4 million shares of our common stock. In addition, in accordance with the merger agreement, Lipman’s Board of Directors declared a special cash dividend of $1.50 per Lipman ordinary share, or an aggregate amount of $40.4 million. This special cash dividend was paid prior to our acquisition of Lipman. The aggregate purchase price for this acquisition was $799.3 million.
Our Industry
The electronic payment solutions industry encompasses systems, software, and services that enable the acceptance and processing of electronic payments for goods and services and provide other value-added functionality at the point of sale. The electronic payment system is an important part of the payment processing infrastructure. We believe that current industry trends, including the global shift toward electronic payment transactions and away from cash and checks, the rapid penetration of electronic payments in emerging markets as those economies modernize, the increasing proliferation of IP, connectivity and wireless communication, and an increasing focus on security to combat fraud and identity theft, will continue to drive demand for electronic payment systems.
The electronic payment system serves as the interface between consumers and merchants at the point of sale and with the payment processing infrastructure. It captures critical electronic payment data, secures the data through sophisticated encryption software and algorithms, and routes the data across a range of payment networks for processing, authorization, and settlement. Payment networks include credit card networks, such as Visa, MasterCard, and American Express, that route credit card and signature-based debit transactions, as well as electronic funds transfer (“EFT”) networks, such as STAR, Interlink, and NYCE, that route PIN-based debit transactions. In a typical electronic payment transaction, the electronic payment system first captures and secures consumer payment data from one of a variety of payment media, such as a credit or debit card, smart card, or contactless/RFID card. Consumer payment data is then routed from the electronic payment system to the appropriate payment processor and financial institution for authorization. Finally, the electronic payment system receives the authorization to complete the transaction between the merchant and consumer.
5
Table of Contents
Industry Trends
The major trend driving growth in the global payments industry has been the move towards electronic payment transactions and away from cash and checks. This trend has been accelerated by the usage of credit and debit card based payments, especially PIN-based debit. Another key driver is the growth in single application credit card solutions, which enable merchants to provide an efficient payment solution in non-traditional settings such as the emergence of pay-at-the-table in restaurants, which is capitalizing on the development of wireless communications infrastructure. The key geographic, technological, and regulatory drivers for this trend towards electronic payments are discussed below.
Rapid Penetration of Electronic Payments in Emerging Markets
Certain regions, such as Eastern Europe, Latin America, and Asia, have lower rates of electronic payments and are experiencing rapid growth. The adoption of electronic payments in these regions is driven primarily by economic growth, infrastructure development, support from governments seeking to increase value-added tax (“VAT”) and sales tax collection, and the expanding presence of IP and wireless communication networks.
IP Connectivity
Broadband connectivity provides faster transmission of transaction data at a lower cost than traditional dial up telephone connections, enabling more advanced payment and other value-added applications at the point of sale. Major telecommunications carriers have expanded their communications networks and lowered fees, which allows more merchants to utilize IP-based networks cost effectively. The faster processing and lower costs associated with IP connectivity have opened new markets for electronic payment systems, including many that have been primarily cash-only industries such as quick service restaurants (“QSRs”). New wireless electronic payment solutions are being developed to increase transaction processing speed, throughput, and mobility at the point of sale, and offer significant security benefits by enabling consumers to avoid relinquishing their payment cards. A portable device can be presented to consumers, for example, to pay-at-the-table in full-service restaurants or to pay in other environments, such as outdoor arenas, pizza delivery, farmers’ markets, and taxi cabs.
Growth of Wireless Communications
The development and increased use of wireless communications infrastructure are increasing demand for compact, easy-to-use, and reliable wireless payment solutions. The flexibility, ease of installation, and mobility of wireless make this technology an attractive and often more cost-effective alternative to traditional landline-based telecommunications.
The wireless communications industry has grown substantially in the United States and globally over the past twenty years. Cellular and Wireless Fidelity (“Wi-Fi”) communications fully support secure IP-based payment transactions. The increased speed of wireless communications, and ever-expanding coverage maps of standardized wireless data technologies such as General Packet Radio Service (“GPRS”), Bluetooth connectivity and Code Division Multiple Access (“CDMA”) makes wireless telecommunications an attractive alternative to traditional telecommunications.
Mobile technologies enable new applications for electronic payment transactions, including pay-at-the-table and pay-at-the-curb in restaurants, as well as electronic card payments in environments that once required cash payments or more expensive off-line card acceptance. These include delivery services, in-home services, taxi, and limousine credit and debit card acceptance. Mobile technologies also facilitate establishment of unattended payment stations such as ticketing and vending kiosks.
Increasing Focus on Security to Minimize Fraud and Identity Theft
Industry security standards are constantly evolving, driving recertification and replacement of electronic payment systems, particularly in Europe and the United States. In order to offer electronic payment systems that
6
Table of Contents
connect to payment networks, electronic payment system providers must certify their products and services with card associations, financial institutions, and payment processors and comply with government and telecommunications company regulations. This certification process may take up to twelve months to complete. See “Industry Standards and Government Regulations” for a more detailed description of these standards and regulations.
Storage and handling of credit card data by retailers represents a constant threat of fraud and identity theft, creating tremendous risk of financial and reputational losses.
The protection of cardholder data currently requires retailers to:
| • | Install only approved PIN-Entry Devices and replace any unapproved devices by 2010; |
| • | Upgrade or modify processing systems to ensure ALL applications that capture, manage, transmit, or store cardholder information within the enterprise are compliant with PCI-DSS and PA-DSS; |
| • | Upgrade wired/wireless networking infrastructure to monitored high-security routers/switches/hubs; |
| • | Make wholesale changes to password and other system access policies; and |
| • | Undertake costly quarterly or annual security audits by approved third-party auditors. |
The current industry-wide response to this threat is to set site security policies across all enterprise systems. This approach is difficult and costly due to the complexity of most retail Information Technology (“IT”) environments, and is unlikely to guarantee protection against data breaches. Furthermore, any system change, no matter how small, may be costly and time consuming to retailers as modification of any portion of POS system usually requires end-to-end re-certification.
A PricewaterhouseCoopers research study recently commissioned by the PCI-SSC reviewed various security technologies such as ‘end-to-end encryption’, ‘tokenization’, ‘virtual terminals’ and ‘magnetic stripe imaging’ to assess the potential to reduce the scope of PCI-DSS audits on merchants and acquirers. Of these technologies, ‘end-to-end encryption’ was identified as providing the highest reduction in audit scope and highlighted for its potential to remove usable cardholder data for the POS and processing systems.
Contactless Payments and Mobile Phone Initiated Payments based on NFC
Payments initiated via Contactless RFID and NFC technology continue to grow in popularity with trials, pilots, or rollouts taking place in all major geographies. Contactless payment credentials can be in the form of credit cards, key fobs, or other devices which use radio frequency communications between the payment credential and the point of sale system. According to the Smartcard Alliance, domestically there are over 18 million RFID-imbedded cards now in circulation and over 51,000 retail locations now able to accept contactless payments. This contactless acceptance infrastructure is not only capable of reading cards, key fobs, or token-based RFID payment media, but is also compatible with payments initiated via mobile phones using NFC technology.
Unattended Self-Service Kiosks and Outdoor Payment Systems
The growth in EuroPay, MasterCard, and Visa (“EMV”) transactions that require consumers to enter a secret PIN code has had a trickle down effect on all aspects of the payment acceptance infrastructure, including self-service market segments. Unattended applications such as automated ticketing machines, self-order kiosks, bill payment, product vending, telephone calling card top up, and self-checkout applications that historically relied on a simple magnetic stripe reader to process credit and debit payments now require complex and secure payment systems to interact with the consumer safely and securely. Due to the dramatic increase in complexities involved in developing compliant, secure, and certified payment solutions, most unattended and outdoor kiosk vendors have turned to traditional payment system vendors such as VeriFone to provide easy to integrate and pre-certified payment modules to enable the future of electronic payments in these environments.
7
Table of Contents
Products and Services
Our System Solutions
Our system solutions are available in several distinctive modular configurations, offering our customers flexibility to support a variety of consumer payment and connectivity options, including wireline and wireless IP technologies.
Countertop
Our countertop electronic payment systems accept magnetic, smart card, and contactless/RFID cards and support credit, debit, check, electronic benefits transfer, and a full range of pre-paid products, including gift cards and loyalty programs. Our countertop solutions are available under the Vx solutions and NURIT brands. These electronic payment systems incorporate high performance 32-bit Acorn RISC Machines (“ARM”) microprocessors and have product line extensions targeted at the high-end countertop broadband and wireless solutions for financial retail, multi-lane retail, hospitality, government, and health care market segments. We design our products in a modular fashion to offer a wide range of options to our customers, including the ability to deploy new technologies at minimal cost as technology standards change. Our electronic payment systems are easily integrated with a full range of optional external devices, including secure PIN pads, check imaging equipment, barcode readers, contactless/RFID readers, and biometric devices. Our secure PIN pads support credit and debit transactions, as well as a wide range of applications that are either built into electronic payment systems or connect to electronic cash registers (“ECRs”) and POS systems. In addition, we offer an array of certified software applications and application libraries that enable our countertop systems and secure PIN pads to interface with major ECR and POS systems.
Mobile/Wireless
We offer a line of wireless system solutions that support IP-based CDMA, GPRS, and Wi-Fi technologies for secure, “always on” connectivity. In addition, we have added a Bluetooth communications solution to our portfolio of wireless payment systems. We expect that market opportunities for wireless solutions will continue to be found in developing countries where wireless telecommunications networks are being deployed at a much faster rate than wireline networks. We have leveraged our wireless system expertise to enter into new markets for electronic payment solutions such as the emerging pay-at-the-table market solutions for full-service restaurants and systems for transportation and delivery segments where merchants and consumers are demanding secure payment systems to reduce fraud and identity theft.
Consumer-activated
We offer a line of products specifically designed for consumer-activated functionality at the point of sale. These products include large, easy-to-read displays, user-friendly interfaces, ECR interfaces, durable key pads, signature capture functionality, and other features that are important to serving customers in a multi-lane retail environment. For example, our signature capture devices automatically store signatures and transaction data for fast recall, and the signature image is time stamped for fraud prevention. Our consumer-activated system solutions also enable merchants to display advertising, promotional content, loyalty program information, and electronic forms in order to market products and services to consumers at the point of sale. We have extended our product portfolio to support these same features into the unattended market segments such as parking, ticketing, vending machines, gas pumps, self-checkout, and QSR markets.
Contactless
We offer a variety of contactless/NFC payment solutions across multiple product lines, specifically designed for consumer-activated transactions utilizing contactless cards, tokens, or NFC enabled mobile phones. These product solutions include integrated, modular, and stand alone contactless readers for both indoor and outdoor payment system solutions. Our contactless payment solutions are certified in accordance with industry standards
8
Table of Contents
maintained by EMVCo LLC and major card associations, including Visa, MasterCard, American Express and Discover Financial Services. In addition, we have adapted several of these contactless payment systems to include acceptance of regional contactless card solutions required by our customers.
Petroleum
Our family of products for petroleum companies consists of integrated electronic payment systems that combine card processing, fuel dispensing, and ECR functions, as well as secure payment systems for integration with leading petroleum pump controllers and systems. These products are designed to meet the needs of petroleum company operations, where rapid consumer turnaround, easy pump control, and accurate record keeping are imperative. These products allow our petroleum company customers to manage fuel dispensing and control and enable “pay at the pump” functionality, cashiering, store management, inventory management, and accounting for goods and services at the point of sale. They are compatible with a wide range of fuel pumps, allowing retail petroleum outlets to integrate our systems easily at most locations. We have recently expanded this suite of products to add a range of high security unattended devices and related software products targeted at integration with the petroleum pumps in domestic and international markets.
Server-based
Our server-based transaction products enable merchants to integrate advanced payment functionality into PC-based and other retail systems seamlessly. These products handle all of the business logic steps related to an electronic payment transaction (credit, debit, gift, and loyalty), including collection of payment-related information from the consumer and merchant, and communication with payment processors for authorization and settlement. Our products also enable the functionality of peripherals that connect to PC-based electronic payment systems, including consumer-activated products such as secure PIN pads and signature capture devices. The PayWare software product line we acquired from Trintech Group PLC in September 2006 has augmented our server-based, enterprise payment software solutions. The combined PayWare suite of products now includes card acceptance/merchant acquiring solutions (PCCharge, Payware PC, Payware Merchant, Payware Transact), POS Integration Software (Payware Link and Payware Link LE), Value Added Payment Solutions (Payware Gift and Payware Prepay) and Card Management Systems for Issuers and Acquirers (Payware CMS).
Unattended and Self-Service Payments
We offer a line of secure payment hardware and software integration modules designed to enable self-service solutions such as vending machines, ticketing kiosks, petroleum dispensers, public transportation turnstiles and buses, self-checkout, bill payment, and photo finishing kiosks to securely begin accepting magnetic stripe, EMV chipcard and/or contactless/NFC payment schemes. Our solutions leverage our widely adopted Vx and MX Solutions security architecture, developer tools and an extensive developer network enabling our global customer base to leverage existing certified payment applications or easily provide customized solutions for unique unattended environments. Designed for both indoor and outdoor use in harsh environments, these components are easily integrated with existing self-service solutions and are used to securely segregate payment processing from the system of the host device.
Cardholder Data Security
We recently introduced a powerful and unique solution to protect sensitive consumer magnetic stripe data captured from credit and debit cards at the point of sale. This solution, VeriShield Protect, encrypts consumer card data at the moment it is swiped, before it enters the retailer’s point of sale system and maintains that protection until it is outside of the merchant’s infrastructure, effectively shielding the merchant from access to detailed consumer data. VeriShield Protect employs proprietary technology designed to mask the encrypted data in a manner that does not require changes to currently installed point of sales systems and applications, making adoption of this highly secure solution simple and cost effective for merchants. VeriShield Protect aids retailers in achieving certification for data security standards set forth by the PCI SSC, also adding an additional layer of
9
Table of Contents
protection not currently mandated by performing end-to-end encryption using proven secure Tamper Resistant Security Module (TRSM) technology commonly used today to protect consumer PINs at ATMs and POS devices. VeriShield Protect is currently available on our Vx and MX Solutions product lines.
Our Services
Client Services
We support our installed base by providing payment system consulting, deployment, on-site and telephone-based installation and training, 24-hour help desk support, repairs, replacement of impaired system solutions, asset tracking, and reporting. We provide a single source of comprehensive management services providing support primarily for our own system solutions in most vertical markets. Our services address many system configurations, including local area networks, leased-line, and dial-up environments. We also offer customized service programs for specific vertical markets in addition to standardized service plans.
Customized Application Development
We provide specific project management services for large turn-key application implementations. Our project management services include all phases of implementation, including customized software development, procurement, vendor coordination, site preparation, training, installation, follow-on support, and legacy system disposal. We also offer customer education programs as well as consulting services regarding selection of product and payment methodologies and strategies such as debit implementation. We believe that our client services are distinguished by our ability to perform mass customizations for large customers quickly and efficiently.
Technology
We have developed the following core technologies that are essential to the creation, delivery, and management of our system solutions. We believe these technologies are central to our leadership position in the electronic payment solutions industry.
Platform Architecture
Our secure, multi-tasking, multi-application platform architecture consists of an ARM System-on-Chip, our proprietary operating systems, proprietary security system, multi-application support, and file authentication technology. The combination of these technologies provides an innovative memory protection and separation scheme to ensure a robust and secure operating environment, enabling the download and execution of multiple applications on an electronic payment system without the need for recertification.
Our operating environment and modular design provide a consistent and intuitive user interface for third-party applications as well as our own. We believe our platform design enables our customers to deliver and manage multi-application payment systems in a timely, secure, and cost-effective manner. We continue to enhance and extend the capabilities of our platform to meet the growing demands of our customers for secure multi-application payment systems.
Our consumer-activated and unattended payment system solutions also incorporate a commercial Linux operating system that we have customized to include security, application resources, and data communication capabilities required in these payment systems. The Linux operating system was chosen for functionality, adaptability, and robustness as well as the readily available development tools for graphical user interface and multi-media content applications.
Libraries and Development Tools
We believe that by delivering a broad portfolio of application libraries and development tools to our large community of internal and third-party application developers, we are able to significantly reduce the time to
10
Table of Contents
obtain certification for our system solutions. We provide a set of application libraries, or programming modules such as smart card interfaces, networking and wireless control protocol/internet protocol communications (“TCP/IP”) and secure socket layer (“SSL”) that have defined programming interfaces, which facilitate the timely and consistent implementation of our multi-application system solutions. Further, we maintain a high level of application compatibility across platforms, facilitating the migration of applications to future system solutions.
We also provide developer tool kits that contain industry standard visual development environments (C/C++) along with platform-specific compilers and debuggers. We provide numerous support services for our application development communities, including Developer Training, a dedicated developers’ support team, and VeriFone DevNet, an online developers’ portal that provides registered developers access to libraries, tools, programming guides, and support. Our libraries, tool kits, training, and support systems facilitate the rapid growth in deployment of third-party, value-added applications for our system solutions.
We believe that this growing portfolio of value-added applications increases the attractiveness of our solutions to global financial institutions and payment processors. In the highly competitive transaction processing market, these institutions are looking for ways to differentiate their solutions by adding additional services beyond credit and debit transaction processing. These value-added applications provide this differentiation and also provide a way to increase merchant retention and revenue for these channels.
Application Framework
Our SoftPay application framework contains a comprehensive set of pre-certified software modules enabling rapid configuration and delivery of merchant-ready applications for payment processors and financial institutions. We have configured SoftPay for use in a broad range of vertical markets including retail, restaurants, lodging, and rental services. SoftPay supports our comprehensive range of wireline and wireless IP communications options, including Ethernet, CDMA, GPRS, and Wi-Fi.
Remote Management System
Effective remote management is essential to cost effective deployment and maintenance of electronic payment systems. Our VeriCentre and NURIT Control Center systems provide broad remote management functionality for our system solutions, including software downloads, application management, remote diagnostics, and information reporting. In addition, we have developed a solution for managing the multi-media content, signature capture/storage/retrieval, and device management of our multi-media capable, consumer-activated Mx product line. Our management system licensees are responsible for the implementation, maintenance, and operation of the system. In certain markets and with certain customers, we maintain and manage the system to provide remote management services directly to customers. In addition, message management functionality allows financial institutions and payment processors to send customized text and graphics messages to any or all of their Verix, NURIT, Secura, or Mx terminal based merchants, and receive pre-formatted responses.
Customers
Our customers include financial institutions, payment processors, petroleum companies, large retailers, government organizations, and healthcare companies, as well as ISOs, which re-sell our system solutions to small merchants. In North America, for the fiscal year ended October 31, 2009, approximately 37% of our sales were via ISOs, distributors, resellers, and system integrators, approximately 58% were direct sales to petroleum companies, retailers, and government-sponsored payment processors, and the remainder were to non-government-sponsored payment processors and financial institutions. Internationally, for the fiscal year ended October 31, 2009, approximately 34% of our sales were via distributors, resellers, and system integrators and the remaining 66% were direct sales to financial institutions, payment processors, and major retailers.
11
Table of Contents
The percentage of net revenues from our ten largest customers is as follows:
| Fiscal Year Ended October 31 |
|||||||||
| 2009 | 2008 | 2007 | |||||||
| Percentage of net revenues from our ten largest customers |
31.8 | % | 32.9 | % | 30.8 | % | |||
For the fiscal years ended October 31, 2009, 2008 and 2007, no one customer accounted for more than 10% of net revenues.
Sales and Marketing
Our North American sales teams are focused specifically on financial institutions, payment processors, third-party distributors, and value-added resellers, and on specific vertical markets, such as petroleum, multi-lane retail, restaurants, bank branches, self-service kiosks, government, and healthcare. Typically, each sales team includes a general manager or managing director, account representatives, business development personnel, sales engineers, and customer service representatives with specific vertical market expertise. The sales teams are supported by client services, manufacturing, and product development teams to deliver products and services that meet the needs of our diverse customer base.
Our marketing group is responsible for product management, account management, program marketing, and corporate communications. Our product management group analyzes and identifies product and technology trends in the marketplace and works closely with our research and development group to develop new products and enhancements. Our program marketing function promotes adoption of our branded solutions through initiatives such as our Value-Added Partner (“VAP”) Program. Our corporate communications function coordinates key market messaging across regions, including public relations and go-to-market product campaigns.
As of October 31, 2009, we had 342 sales and marketing employees, representing approximately 15% of our total workforce.
Our VAP Program provides a technical, operational, and marketing environment for third-party developers to leverage our distribution channels to sell value-added applications and services. As of October 31, 2009, over 37 third-party developers, or partners, in our VAP Program have provided solutions for pre-paid cards, gift cards, and loyalty cards and age verification services, among others. Through the program, merchants obtain seamless access to value-added applications, allowing them to differentiate their offerings without a costly product development cycle.
Global Outsourcing and Manufacturing Operations
Prior to our Lipman acquisition in November 2006, we outsourced 100% of our product manufacturing to providers in the Electronic Manufacturing Services (“EMS”) industry. This work was outsourced to Jabil Circuit, Inc., Sanmina-SCI Corporation, and Inventec Appliances Corporation. We have enabled direct shipment capability for several product lines from our EMS providers to our customers in various countries around the world. NURIT branded products that were acquired as part of our Lipman acquisition are built in VeriFone’s in-house manufacturing facility located in Tel Aviv, Israel. We are currently in the process of outsourcing this in-house manufacturing to Sanmina-SCI Corporation and expect that 100% of our product manufacturing will be outsourced following the transition of the manufacturing of our NURIT products to Sanmina-SCI Corporation.
Competition
Our principal competitors in the market for electronic payment systems and services are Ingenico S.A. and Hypercom Corporation, the two other large providers of payment systems. We also compete with First Data
12
Table of Contents
Corporation, Gemalto N.V., Gilbarco, Inc., a subsidiary of Danaher Corporation, International Business Machines Corporation, MICROS Systems, Inc., NCR Corporation and Radiant Systems, Inc. We compete primarily on the basis of the following factors: trusted brand, end-to-end system solutions, product certifications, value-added applications and advanced product features, advanced communications modularity, reliability, supply chain scale/flexibility and low total cost of ownership.
We expect competition in our industry will be largely driven by the requirements to respond to increasingly complex technology, industry certifications, and security standards. We also see continued emphasis on consolidation among suppliers as evidenced by the Ingenico S.A./SAGEM Monetel merger and the acquisition by Hypercom of Thales e-Transactions, as the scale advantages related to research and development investment, volume purchasing power, and sales/technical support infrastructure continue to put pressure on smaller companies in our industry. In addition, First Data Corporation, a leading provider of payment processing services and one of our largest customers, has developed and continues to develop a series of proprietary electronic payment systems for the U.S. market.
Research and Development
We work with our customers to develop system solutions that address existing and anticipated end-user needs. Our development activities are distributed globally and managed primarily from the U.S. We utilize regional application development capabilities in locations where labor costs are lower than in the United States and where regional expertise can be leveraged for our target markets in Asia, Europe, and Latin America. Our regional application development centers provide customization and adaptation to meet the needs of customers in local markets. Our modular designs enable us to customize existing systems in order to meet customer requirements, shorten development cycles and reduce time to market.
Our research and development goals include:
| • | developing new solutions, technologies, and applications; |
| • | developing enhancements to existing product solutions, technologies and applications; |
| • | certifications of new and existing solutions in accordance with industry standards and regulations; and |
| • | ensuring compatibility and interoperability between our solutions and those of third parties. |
Our research and development expenses were $65.1 million, $75.6 million and $65.4 million for the fiscal years ended October 31, 2009, 2008, and 2007, respectively. Research and development expenses as a percentage of net revenues were 7.7%, 8.2%, and 7.2% for the fiscal years ended October 31, 2009, 2008, and 2007, respectively. As of October 31, 2009, we had 816 research and development employees representing approximately 36% of our total workforce.
Industry Standards and Government Regulations
In order to offer products that connect to payment networks, electronic payment system providers must certify their products and services with card associations, financial institutions, and payment processors, as well as comply with government and telecommunications company regulations.
We have gained an in-depth knowledge of certification requirements and processes by working closely with card associations, payment processors, security organizations, and international regulatory organizations to certify our new products. We accelerate this certification process by leveraging our platform architectures, user interface, and core technologies.
We employ a group of engineers who specialize in security design methodologies. This group is responsible for designing and integrating security measures in our system solutions and conducts early design reviews with independent security lab consultants to ensure compliance of our electronic payment system designs with worldwide security standards.
13
Table of Contents
Regulatory certifications are addressed by our compliance engineering department, which is staffed by electromagnetic compatibility (“EMC”) safety, telecommunications, and wireless carrier certification experts.
We actively participate in electronic payment industry working groups that help develop market standards. Our personnel are members of several working groups of the American National Standards Institute (“ANSI”), a private, non-profit organization that administrates and coordinates voluntary standardization in the U.S. and the Industry Standards Organization which contains working groups responsible for international security standards. They have leadership roles on subcommittees that develop standards in such areas as financial transactions, data security, smart cards, and the petroleum industry.
We also are subject to other legal and regulatory requirements, including the European Union’s (“EU”) Restriction on Hazardous Substances (“RoHS”) Directive and the European Union Directive on Waste Electrical and Electronic Equipment (“WEEE”), which are designed to restrict the use of certain hazardous substances in finished goods and require active steps to promote recycling of components to limit the total quantity of waste going to final disposal.
In March 2007, VeriFone achieved compliance with the “Administrative Measures on the Control of Pollution Caused by Electronic Information Products,” commonly referred to as China RoHS regulations, as required by China’s Ministry of Information Industry. Similar to the EU RoHS Directive, the China regulations restrict the importation into and production within China of electrical equipment containing certain hazardous materials.
We believe we have taken all necessary steps to ensure all newly finished goods shipping into EU, China, and U.S. markets were fully compliant with regional or country specific environmental legislation. We are also working diligently with local business representatives and/or customers on the various local WEEE compliance strategies, including WEEE registration, collection, reporting and recycling schemes.
We are also subject to the following standards and requirements:
Security Standards
Industry and government security standards ensure the integrity of the electronic payment process and protect the privacy of consumers using electronic payment systems. New standards are continually being adopted or proposed as a result of worldwide fraud prevention initiatives, increasing the need for new security solutions and technologies. In order for us to remain compliant with the growing variety of international requirements, we have developed a security architecture that incorporates physical, electronic, operating system, encryption, and application-level security measures. This architecture has proven successful even in countries that have particularly stringent and specific security requirements, such as Australia, Canada, Germany, the Netherlands, New Zealand, Singapore, Sweden, Switzerland and the United Kingdom.
Card Association Standards
Payment Card Industry Security Standards. In September 2006, the PCI SSC was formed by American Express, Discover Financial Services, JCB, MasterCard, and Visa. PCI SSC is responsible for developing and disseminating security specifications, validation of testing methods and security assessor training. The five founding companies participate on the policy setting Executive Committee of the PCI SSC.
In September 2006, the PCI SSC published an updated version of the PCI-DSS that represents a common set of industry tools and measurements to help ensure the safe handling of sensitive electronic transaction information. In October 2008, the PCI-DSS standard was updated and an expiration date for the previous version of this standard was set. The PCI SSC also released an updated version of the newer PA-DSS standard and set an expiration date for the original standard adopted in April 2008 by Visa under the Payment Application Best Practices (“PABP”) program. The PCI-DSS and PA-DSS standard revisions include mandates and audit requirements for retailers, merchant acquirers, and payment application developers.
14
Table of Contents
In September 2007, the PCI SSC announced that the PCI PED standard will be moved under the control of the PCI SSC. This PCI PED standard was previously maintained and updated by Visa, MasterCard, and JCB. The PCI PED specification and testing requirements have become a standard specification for the five card associations. All previous mandates and deadlines regarding PCI PED compliance will remain in effect under the PCI SSC. Further alignment with regional and national debit networks and certification bodies may occur, which would enable electronic payment system providers to certify payment technology more quickly and cost effectively. In practice, the PCI PED approval process represents a significant increase in level of security and technical complexity for PIN Entry Devices. In April 2009, the PCI SSC announced the expansion of the PCI PED requirements program to include two new types of devices, unattended payment terminals (“UPT”) and hardware security modules (“HSM”).
EMV Standards. EMV has introduced new standards to address the growing need for transaction security and interoperability. One important example is their establishment of EMVCo LLC, a smart card standards organization operated by American Express, MasterCard, Visa and JCB that has prescribed specifications for electronic payment systems to receive certifications for smart card devices and applications. The EMV standards are designed to ensure global smart card interoperability across all electronic payment systems. To ensure adherence to this standard, specific certifications are required for all electronic payment systems and their application software. We maintain EMV certifications across our applicable product lines.
Contactless System Standards. The major card associations have each established a brand around contactless payment. The brands and specifications are PayPass® for MasterCard, Visa payWave® and Visa Wave® for Visa, ExpressPay® for American Express, and ZIP® for Discover Financial Services , and J/speedy for JCB. Along with these brands, each of the card associations has developed its own specifications governing its brand’s user experience, data management, the card-to-reader protocols and in at least one case the protocol between the contactless reader and the host device. Each brand of contactless payment has a complete set of specifications, certification requirements and a very controlled testing and approval process. In order to access the specification and approval process, payment system manufacturers must become licensees of the relevant card association’s specification. Although all of the specifications are based on ISO-IEC 14443, a standard developed by the International Organization for Standardization, the application approval processes are not compatible with one another. MasterCard has assigned its PayPass® contactless implementation specifications to EMVCo LLC, which was the first step towards the creation of a common specification and certification standard for contactless payment systems. The EMVCo LLC Contactless protocol testing process has also been put in place. VeriFone actively participates in several standards bodies pursuing common standards for contactless payments, including INCITS B10, EMVCo LLC, the Smart Card Alliance and the NFC Forum.
MasterCard PTS and TQM Standard. The MasterCard POS Terminal Security (“PTS”) Program addresses stability and security of IP communications between IP-enabled POS terminals and the acquirer host system using authentication/encryption protocols approved by MasterCard ensuring transaction data integrity. The purpose of this program is threefold:
| • | provide POS vendors with security guidelines to counter the threats presented by the use of Internet/IP technologies within the POS terminal infrastructure; |
| • | specifically address network vulnerabilities within the increasingly popular IP networks; and |
| • | identify potential vulnerabilities of an end-to-end solution that may occur as a result of failing to provide confidentiality, integrity, availability, authentication, non-repudiation, and replay attack prevention on the data being transmitted over the Internet. |
We have successfully achieved Vx product-line and NURIT product-line compliance with the new MasterCard PTS security specification regarding security of IP-based systems. The MasterCard PTS program approval applies to several IP-enabled products including the Vx 510, Vx 570, Vx 610, Vx 670, and Vx 810 as well as the NURIT 8000, NURIT 8210, and NURIT 8400 payment systems. We are the first terminal vendor to achieve such a distinction across an entire product line.
15
Table of Contents
The MasterCard Terminal Quality Management (“TQM”) program was created in 2003 to “help ensure the quality and reliability of EMV compliant terminals worldwide.” MasterCard’s TQM program validates the entire lifecycle of the product, from design to manufacturing and deployment. This is a hardware quality management program, on top of the EMV Level 1 certification. It mainly involves the review and audit of the vendor’s process in the different phases of implementation, manufacturing, and distribution. At the end of the process, the product is given a quality label. MasterCard has mandated the quality label to all their member banks and has made it a pre-requisite for their Terminal Integration Process (“TIP”) since December 2003. We maintain TQM approval across all EMV Level 1 approved products deployed with EMV applications. The TQM program is now extended to Contactless payment systems and is a requirement for achieving a full PayPass Approval with MasterCard.
Payment Processor/Financial Institution Requirements
U.S. payment processors have two types of certification levels, Class A and Class B. Class B certification ensures that an electronic payment system adheres to the payment processor’s basic functional and network requirements. Class A certification adds another stipulation that the processor actively supports the electronic payment system on its internal help desk systems. Attainment of Class A certification, which may take up to twelve months, requires working with each payment processor to pass extensive functional and end-user testing and to establish the help desk related infrastructure necessary to provide Class A support. Attaining Class A certifications increases the number of payment processors that may actively sell and deploy a particular electronic payment system. We have significant experience in attaining these critical payment processor certifications and have a large portfolio of Class A certifications with major U.S. processors. In addition, several international financial institutions and payment processors have certification requirements that electronic payment systems must comply with in order to process transactions on their specific networks. We have significant direct experience and, through our international distributors, indirect experience in attaining these required certifications across the broad range of system solutions that we offer to our international customers.
Telecommunications Regulatory Authority and Carrier Requirements
Our products must comply with government regulations, including those imposed by the Federal Communications Commission and similar telecommunications authorities worldwide regarding emissions, radiation, safety, and connections with telephone lines and radio networks. Our products must also comply with recommendations of quasi-regulatory authorities and of standards-setting committees. Our electronic payment systems have been certified as compliant with a large number of national requirements, including those of the Federal Communications Commission and Underwriters Laboratory in the U.S. and similar local requirements in other countries.
In addition to national requirements for telecommunications systems, wireless network service providers mandate certain standards with which all connected devices and systems must comply in order to operate on these networks. Many wireless network carriers have their own certification process for devices to be activated and used on their networks. Our wireless electronic payment systems have been certified by leading wireless carrier networks around the world.
Proprietary Rights
We rely primarily on copyrights, trademarks, patent filings, and trade secret laws to establish and maintain our proprietary rights in our technology and products. VeriFone maintains a patent incentive program and patent committee, which encourages and rewards employees to present inventions for patent application and filings.
As of October 31, 2009, we held 33 patents and have 37 patent applications filed with various patent offices in several countries throughout the world, including the United States, Canada, the United Kingdom, the European Union, China, Israel, India, Australia, Japan, Germany, France, Ireland, Hong Kong and South Africa.
16
Table of Contents
As of October 31, 2009, we held trademark registration in approximately 30 countries for VERIFONE and in approximately 40 countries for VERIFONE including our ribbon logo. We currently hold trademark registration in the United States and a variety of other countries for our product names and other marks.
We generally have not registered copyrights in our software and other written works. Instead, we have relied upon common law copyright, customer license agreements, and other forms of protection. We use non-disclosure agreements and license agreements to protect software and other written materials as copyrighted and/or trade secrets.
In the U.S. and other countries, prior to 2001, our predecessor held patents relating to a variety of POS and related inventions, which expire in accordance with the applicable law in the country where filed. In 2001, as part of the divestiture of VeriFone, Inc. from HP, VeriFone, Inc. and HP entered into a technology agreement whereby HP retained ownership of most of the patents owned or applied for by VeriFone prior to the date of divestiture. The technology agreement grants VeriFone a perpetual, non-exclusive license to use any of the patented technology retained by HP at no charge. In addition, we hold a non-exclusive license to patents held by NCR Corporation related to signature capture in electronic payment systems. This license expires in 2011, along with the underlying patents.
Segment and Geographical Information
For an analysis of financial information about geographic areas as well as our segments, see “Item 7 — Management’s Discussion and Analysis of Financial Condition and Results of Operations — Segment Information” and Note 15. “Segment and Geographic Information” of the Notes to Consolidated Financial Statements included herein.
Employees
As of October 31, 2009, we have 2,249 employees worldwide. None of our employees is represented by a labor union agreement or collective bargaining agreement. We have not experienced any work stoppages and we believe that our employee relations are good.
Executive Officers
The executive officers of VeriFone and their ages as of December 22, 2009 are as follows:
| Name |
Age | Position | ||
| Douglas Bergeron |
49 | Chief Executive Officer | ||
| Robert Dykes |
60 | Senior Vice President and Chief Financial Officer | ||
| Elmore Waller |
60 | Executive Vice President, Integrated Solutions | ||
| Jeff Dumbrell |
40 | Executive Vice President | ||
| Eliezer Yanay |
49 | President of VeriFone Israel & Managing Director of Middle East |
Douglas G. Bergeron. Mr. Bergeron has served as Chief Executive Officer and a director of VeriFone Holdings, Inc. since its formation in July 2002 and of VeriFone, Inc. since July 2001. From December 2000 to June 2002, Mr. Bergeron was Group President of Gores Technology Group and, from April 1999 to October 2000 served as President and Chief Executive Officer of Geac Computer Corporation. From 1990 to 1999, Mr. Bergeron served in a variety of executive management positions at SunGard Data Systems Inc., including Group CEO of SunGard Brokerage Systems Group and President of SunGard Futures Systems. Mr. Bergeron holds a Bachelor of Arts degree (with Honors) in computer science from York University in Toronto, Canada, and a Masters of Science degree from the University of Southern California. Mr. Bergeron also serves on the board of directors of Merriman Curhan Ford Group, Inc., a financial services holding company, and is a member of the Listed Company Advisory Committee of the NYSE Euronext (the “NYSE”).
17
Table of Contents
Robert Dykes. Mr. Dykes has served as Senior Vice President since September 2, 2008 and as Chief Financial Officer since September 9, 2008. Prior to joining VeriFone, Mr. Dykes was Chairman and CEO of NebuAd Inc., a provider of targeted online advertising networks. Before joining NebuAd, from January 2005 to March 2007, Mr. Dykes was Executive Vice President, Business Operations and Chief Financial Officer of Juniper Networks, Inc., a provider of network infrastructure to global service providers, enterprises, governments and research and educational institutions. From February 1997 to December 2004, Mr. Dykes was Chief Financial Officer and President, Systems Group, of Flextronics International Ltd., a provider of design and electronics manufacturing services to original equipment manufacturers. From October 1988 to February 1997, Mr. Dykes was Executive Vice President, Worldwide Operations and Chief Financial Officer of Symantec Corporation, a provider of software and services that address risks to information security, availability, compliance, and information technology systems performance. Mr. Dykes also held Chief Financial Officer roles at industrial robots manufacturer Adept Technology and senior financial management positions at Ford Motor Company and at disc drive controller manufacturer Xebec. Mr. Dykes holds a Bachelor of Commerce in Administration degree from Victoria University, Wellington, New Zealand.
Elmore Waller. Mr. Waller has served as Executive Vice President, Integrated Solutions since December 2004 and, since joining VeriFone in 1986, has served in a number of leadership positions including Senior Vice President and General Manager of the Worldwide Petro Division. Prior to working at VeriFone, Mr. Waller worked for 11 years at General Electric Company, serving in several financial management positions. Mr. Waller holds an M.B.A. from Syracuse University.
Jeff Dumbrell. Mr. Dumbrell joined VeriFone in July 2002 where he served in various senior-level management roles within the company, most recently as Executive Vice President responsible for managing VeriFone’s growth initiatives in the United States, Canada, Northern Europe, Middle East and Africa. From December 2000 to July 2002, Mr. Dumbrell was Executive Director of Sales for B3 Corporation and he was National Sales Manager for BankServ from October 1999 to December 2000. Previously, Mr. Dumbrell was Western Regional Manager for The Quaker Oats Company where he had sales responsibility for managing Tier 1 retail customers. Mr. Dumbrell holds a M.B.A. from The University of San Francisco and a Bachelor of Science in Marketing from Clemson University.
Eliezer Yanay. Mr. Yanay serves as President of VeriFone Israel and Executive Vice President, Continental Europe, South East Europe and Asia and is responsible for VeriFone’s operations and manufacturing in Israel, as well as business development, sales and marketing in Continental Europe, South East Europe and Asia. From November 2006 to March 2009, Mr. Yanay served as President of VeriFone Israel and Managing Director of Middle East. Mr. Yanay joined VeriFone following its acquisition of Lipman Electronic Engineering in November 2006. Mr. Yanay had served at Lipman as Executive Vice President of Sales and Marketing since September 2001 where his responsibilities included management of worldwide sales and marketing activities, management of the corporate sales and marketing department and oversight of Lipman’s non-U.S. subsidiaries. Before joining Lipman, Mr. Yanay held various senior-level positions at Shira Computers Ltd. (a subsidiary of VYYO Inc.) and Scitex Corporation, Ltd. Mr. Yanay holds a Bachelor of Arts in Psychology from Tel Aviv University.
Available Information
Our Internet address is http://www.verifone.com. We make available free of charge on our investor relations website under “SEC Filings” our Annual Reports on Form 10-K, Quarterly Reports on Form 10-Q, Current Reports on Form 8-K, registration statements and amendments to those reports and registration statements as soon as reasonably practicable after we electronically file or furnish such materials to the U.S. Securities and Exchange Commission (“SEC”). The SEC maintains an internet site that contains reports, proxy and information statements and other information regarding our filings at http://www.sec.gov. A copy of any materials we file with the SEC also may be read and copied at the SEC’s Public Reference Room at 100 F Street, NE, Washington, D.C. 20549. Information on the operation of the Public Reference Room can be obtained by calling the SEC at 1-800-SEC-0330.
18
Table of Contents
| ITEM 1A. | RISK FACTORS |
The risks set forth below may adversely affect our business, financial condition, and operating results. In addition to the risks set forth below and the factors affecting specific business operations identified with the description of these operations elsewhere in this report, there may also be risks of which we are currently aware, or that we currently regard as immaterial based on the information available to us that later prove to be material.
Risks Related to Our Business
Our internal processes and controls and our disclosure controls have been inadequate; if the processes and controls we have implemented and continue to implement are inadequate, we may not be able to comply with our financial statement certification requirements under applicable SEC rules, or prevent future errors in our financial reporting.
As described under “Item 9A — Controls and Procedures” in this Annual Report and under “Item 4 — Controls and Procedures” in our quarterly reports on Form 10-Q for the periods ended January 31, April 30 and July 31, 2009, our internal processes and controls have been inadequate because we have identified material weaknesses in our internal control over financial reporting and we have determined that our disclosure controls and procedures were not effective. These weaknesses, such as weakness in control activities related to income taxes and financial statement review processes and having insufficient number of qualified finance personnel, contributed to our need to restate previously reported interim financial information for each of the first three quarters of our fiscal year ended October 31, 2007, and to the delays in the filing of our Annual Report on Form 10-K for fiscal year 2007. We also were unable to file our quarterly reports on Form 10-Q for our fiscal quarters ended January 31, 2008 and April 30, 2008 on a timely basis. We have implemented and intend to continue to implement a number of additional and enhanced processes and controls to improve our internal control over financial reporting. However, as of October 31, 2009, we have not yet remediated weakness in control activities related to income taxes. If we are unsuccessful in adequately implementing these processes and controls, we may be unable to comply with Exchange Act Rules 13a-15 and 15d-15, which specify the processes and controls that public companies are required to have in place, and we may be unable to provide the executive certificates required by Exchange Act Rules 13a-15 and 15d-15 in our quarterly and annual reports. Even if we implement such controls, there can be no assurance that these controls will be sufficient to detect or prevent future errors in financial reporting. We have devoted additional resources to our financial control and reporting requirements, including hiring additional qualified employees in these areas. We expect to hire additional employees and may also engage additional consultants in these areas. Competition for qualified financial control and accounting professionals in the geographic areas in which we operate is keen and there can be no assurance that we will be able to hire and retain these individuals.
If current macroeconomic conditions persist or worsen, our business and results of operations could be further adversely affected.
The U.S. and international economy and financial markets have experienced significant slowdown and volatility due to uncertainties related to energy prices, availability of credit, difficulties in the banking and financial services sectors, softness in the housing, retail and consumer markets, severely diminished market liquidity, geopolitical conflicts, falling consumer confidence and rising unemployment rates. This slowdown has and could further lead to reduced demand for our products if customers decide to delay or reduce deployment of electronic payment systems, which in turn would reduce our revenues and adversely affect our business, financial condition and results of operations. In particular, the slowdown and volatility in the global markets have resulted in softer demand in the financial and retail sectors, pricing pressures and more conservative purchasing decisions by customers, including a tendency toward lower-priced products and lower volume of purchases, which could negatively impact our revenues, gross margins and results of operations. In some countries where we do business, the weakened economy has lead to economic instability which has negatively affected sales, an example of which is decreased purchasing power due to currency devaluations. In addition to a reduction in sales, our profitability
19
Table of Contents
may decrease during downturns because we may not be able to reduce costs at the same rate as our sales decline. Given the current unfavorable economic environment, our customers may have difficulties obtaining capital at adequate or historical levels to finance their ongoing business and operations, which could impair their ability to make timely payments to us.
We are unable to predict the likely duration and severity of the current disruption in the financial markets and adverse economic conditions in the U.S. and other countries and such conditions, if they persist or worsen, will further adversely impact our business, operating results, and financial condition. While some markets have shown signs of improvement and we have experienced modest sequential growth in revenues and earnings in recent quarters, we cannot predict whether such improvements or growth will continue and any future decline in global conditions could negatively impact our business, operating results and financial condition. Continued volatility in market conditions make it difficult to forecast earnings and if we fail to meet our financial guidance or the expectations of investment analysts or investors in any period, the market price of our common stock could decline.
We depend on a limited number of customers, including distributors and resellers, for a large percentage of our System Solutions sales. If we do not effectively manage our relationships with them, our net revenues and operating results will suffer.
A significant percentage of our net revenues are attributable to a limited number of customers, including distributors and ISOs. For the fiscal year ended October 31, 2009, our ten largest customers accounted for approximately 31.8% of our net revenues. Although no individual customer accounted for more than 10% of net revenues in fiscal year 2009, three customers accounted for approximately 14.0% of our net revenues in that period. If any of our large customers significantly reduces or delays purchases from us or if we are required to sell products to them at reduced prices or on other terms less favorable to us, our revenues and income could be materially adversely affected.
We sell a significant portion of our solutions through third parties such as independent distributors, independent sales organizations, or ISOs, value-added resellers, and payment processors. We depend on their active marketing and sales efforts. These third parties also provide after-sales support and related services to end user customers. When we introduce new applications and solutions, they also provide critical support for developing and supporting the custom software applications to run on our various electronic payment systems and, internationally, in obtaining requisite certifications in the markets in which they are active. Accordingly, the pace at which we are able to introduce new solutions in markets in which these parties are active depends on the resources they dedicate to these tasks. Moreover, our arrangements with these third parties typically do not prevent them from selling products of other companies, including our competitors, and they may elect to market our competitors’ products and services in preference to our system solutions. If one or more of our major resellers terminates or otherwise adversely changes its relationship with us, we may be unsuccessful in replacing it. The loss of one of our major resellers could impair our ability to sell our solutions and result in lower revenues and income. It could also be time consuming and expensive to replicate, either directly or through other resellers, the certifications and the custom applications owned by these third parties.
A majority of our net revenues is generated outside of the United States and we intend to continue to expand our operations internationally. Our results of operations could suffer if we are unable to manage our international expansion and operations effectively.
During the fiscal years ended October 31, 2009 and 2008, approximately 63.6% and 65.2%, respectively, of our net revenues were generated outside of the United States. We expect our percentage of net revenues generated outside of the United States to increase in the coming years. Part of our strategy is to expand our penetration in existing foreign markets and to enter new foreign markets and in particular to enter new emerging markets. Our ability to penetrate some international markets may be limited due to different technical standards, protocols or product requirements. Expansion of our international business will require significant management
20
Table of Contents
attention and financial resources. Our international net revenues will depend on our continued success in the following areas:
| • | securing commercial relationships to help establish our presence in new international markets; |
| • | hiring and training personnel capable of marketing, installing and integrating our solutions, supporting customers, and managing operations in foreign countries; |
| • | localizing our solutions to target the specific needs and preferences of foreign customers, which may differ from our traditional customer base in the markets we currently serve; |
| • | building our brand name and awareness of our services among foreign customers in new international markets; and |
| • | implementing new systems, procedures, and controls to monitor our operations in new international markets. |
In addition, we are subject to risks associated with operating in foreign countries, including:
| • | multiple, changing, and often inconsistent enforcement of laws and regulations; |
| • | satisfying local regulatory or industry imposed security or other certification requirements; |
| • | competition from existing market participants that may have a longer history in and greater familiarity with the international markets we enter; |
| • | tariffs and trade barriers; |
| • | laws and business practices that may favor local competitors; |
| • | fluctuations in currency exchange rates; |
| • | extended payment terms and the ability to collect accounts receivable; |
| • | economic and political instability in certain foreign countries; |
| • | imposition of limitations on conversion of foreign currencies into U.S. dollars or remittance of dividends and other payments by foreign subsidiaries; |
| • | changes in a specific country’s or region’s political or economic conditions; and |
| • | greater difficulty in safeguarding intellectual property in areas such as China, Russia, and Latin America. |
Many of these factors typically become more prevalent during periods of economic stress; therefore, current global economic differences may exacerbate certain of these risks. For example, we are subject to foreign currency risk and economic and political instability which can lead to significant and unpredictable volatility in currency rates, including significant currency devaluations, which may negatively impact our revenues, gross margins, results of operations and financial position. Although we engage in some hedging of our foreign currency exposures, we do not hedge all such exposures and our hedging arrangements may not always be effective. See “Foreign Currency Risk” under Part II Item 7A — “Quantitative and Qualitative Disclosures About Market Risk” in this Form 10-K. In addition, compliance with foreign and U.S. laws and regulations that are applicable to our international operations is complex and may increase our cost of doing business in international jurisdictions and our international operations could expose us to fines and penalties if we fail to comply with these regulations. These laws and regulations include import and export requirements, exchange control regulations, U.S. laws such as the Foreign Corrupt Practices Act, and local laws prohibiting corrupt payments to governmental officials. Although we have implemented policies and procedures designed to ensure compliance with these laws, there can be no assurance that our employees, contractors, and agents will not take actions in violation of our policies, particularly as we expand our operations through organic growth and acquisitions. For example, two of our Brazilian subsidiaries that were acquired as a part of the Lipman
21
Table of Contents
acquisition have been notified of assessments regarding Brazilian customs penalties that relate to alleged infractions in the importation of goods. See Part I Item 3 — “Legal Proceedings” of this Annual Report on Form 10-K. Any such violations could subject us to civil or criminal penalties, including the imposition of substantial fines and interest or prohibitions on our ability to offer our products and services to one or more countries, and could also materially damage our reputation, our brand, our international expansion efforts, our business, and negatively impact our operating results. In addition, if we fail to address the challenges and risks associated with international expansion and acquisition strategy, we may encounter difficulties implementing our strategy, which could impede our growth or harm our operating results.
A significant percentage of our business is executed towards the end of our fiscal quarters. This could negatively impact our business and results of operations.
Revenues recognized in our fiscal quarters tend to be back-end loaded. This means that sales orders are received, product is shipped, and revenue is recognized increasingly towards the end of each fiscal quarter. This back-end loading, particularly if it becomes more pronounced, could adversely affect our business and results of operations due to a number of factors including the following:
| • | the manufacturing processes at our internal manufacturing facility could become concentrated in a shorter time period. This concentration of manufacturing could also increase labor and other manufacturing costs and negatively impact gross margins. The risk of inventory write-offs could also increase if we were to hold higher inventory levels to counteract this effect; |
| • | the higher concentration of orders may make it difficult to accurately forecast component requirements and, as a result, we could experience a shortage of the components needed for production, possibly delaying shipments and causing lost orders; |
| • | if we are unable to fill orders at the end of a quarter, shipments may be delayed. This could cause us to fail to meet our revenue and operating profit expectations for a particular quarter and could increase the fluctuation of quarterly results if shipments are delayed from one fiscal quarter to the next or orders are cancelled by customers; and |
| • | in order to fulfill orders at the end of a quarter, we may be forced to deliver our products using air freight which results in increased distribution costs. |
We are exposed to credit risk with some of our customers and to credit exposures and currency controls in weakened markets, which could result in material losses.
A significant portion of our sales are on an open credit basis, with typical payment terms of up to 60 days in the United States and, because of local customs or conditions, longer in some international markets. In the past, there have been bankruptcies among our customer base. Although credit losses have not been material to date, future losses, if incurred, could harm our business and have a materially adverse effect on our operating results and financial condition. Also, certain customers who are invoiced in U.S. dollars, such as those based in Venezuela, have experienced and may continue to experience difficulties in obtaining U.S. dollar currency due to local currency controls, and therefore may not be able to remit timely payment to us. Additionally, to the degree that the recent turmoil in the credit markets makes it more difficult for some customers to obtain financing or access U.S. dollar currency, our customers’ ability to pay could be adversely impacted, which in turn could have a material adverse impact on our business, cash flows, operating results and financial condition.
Fluctuations in currency exchange rates may adversely affect our results of operations.
A substantial portion of our business consists of sales made to customers outside the United States. A portion of the net revenues we receive from such sales is denominated in currencies other than the U.S. dollar. Additionally, portions of our cost of net revenues and our other operating expenses are incurred by our International operations and denominated in local currencies. Fluctuations in the value of these net revenues,
22
Table of Contents
costs and expenses as measured in U.S. dollars have affected our results of operations historically, and adverse currency exchange rate fluctuations may have a material impact in the future. Further, changes in exchange rates that strengthen the U.S. dollar could increase the price of our products in the local currencies of the foreign markets we serve. This would result in making our products relatively more expensive than products that are denominated in local currencies, leading to a reduction in sales and profitability in those foreign markets. In addition, our balance sheet reflects non-U.S. dollar denominated assets and liabilities, primarily intercompany balances, which can be adversely affected by fluctuations in currency exchange rates and cause gains and losses that are included in other income (expense), net in our Consolidated Statements of Operations. We have entered into foreign exchange forward contracts and other arrangements intended to hedge our balance sheet exposure to adverse fluctuations in exchange rates. We have also effectively priced our System Solutions in U.S. dollars in certain countries. Nevertheless, these hedging arrangements may not always be effective, particularly in the event of imprecise forecasts of non-U.S. denominated assets and liabilities. Additionally, our efforts to effectively price products in U.S. dollars may have disadvantages since it may affect demand for our products if the local currency strengthens relative to the U.S. dollar. On the other hand, we could be adversely affected where the U.S. dollar strengthens relative to the local currency between the time of a sale and the time we receive payment, which would be collected in the devalued local currency. Accordingly, if there is an adverse movement in exchange rates, we might suffer significant losses and our results of operations may otherwise be adversely affected. Uncertainty in the global market conditions have resulted in and may continue to cause significant volatility in foreign currency exchange rates which could increase these risks. Additionally, hedging programs expose us to risks that could adversely affect our operating results, including the following:
| • | we may be unable to hedge currency risk for some transactions because of a high level of uncertainty or the inability to reasonably estimate our foreign exchange exposures; and |
| • | we may be unable to acquire foreign exchange hedging instruments in some of the geographic areas where we do business, or, where these derivatives are available, we may not be able to acquire enough of them to fully offset our exposure. |
We depend upon third parties to manufacture many of our systems and to supply the components necessary to manufacture our products.
We utilize a limited number of third parties to manufacture our hardware products pursuant to our specifications and rely upon these contract manufacturers to produce and deliver products to our customers on a timely basis and at an acceptable cost. Further, a majority of our manufacturing activities are concentrated in China. Disruptions to the business or operations of these contract manufacturers, or to their ability to produce the products we require in accordance with our and our customers’ requirements, and particularly disruptions to the manufacturing operations in China, could significantly affect our ability to fulfill customer demand on a timely basis which could materially harm our revenues and results of operations. Further, we expect to increase our use of contract manufacturers to manufacture our products which could exacerbate these risks, including the risk of disruptions related to our ability and the ability of our contract manufacturers to effectively accommodate the shift in production. Components such as application specific integrated circuits, or ASICs, payment processors, wireless modules, modems and printer mechanisms that are necessary to manufacture and assemble our systems are sourced either directly by us or on our behalf by our contract manufacturers from a variety of component suppliers selected by us. Certain of the components are specifically customized for use in our products and are obtained from sole source suppliers on a purchase order basis. In recent periods we have experienced a tightening in availability of certain semiconductor commodities that are necessary for the manufacture of our products. If our suppliers are unable or unwilling to deliver the quantities that we require, we would be faced with a shortage of critical components. We also experience from time to time an increase in the lead time for delivery of some of our key components. We may not be able to find alternative sources in a timely manner if suppliers of our key components become unwilling or unable to provide us with adequate supplies of these key components when we need them or if they increase their prices. If we are unable to obtain sufficient key required components, or to develop alternative sources if and as required in the future, or to replace our component and factory tooling for our products in a timely manner if they are damaged or destroyed, we could experience delays or reductions in
23
Table of Contents
product shipments. This could harm our relationships with our customers and cause our revenues to decline. Even if we are able to secure alternative sources or replace our tooling in a timely manner, our costs could increase.
The government tax benefits that our subsidiaries currently receive require them to meet several conditions and may be terminated or reduced in the future, which could require us to pay increased taxes or refund tax benefits received in the past.
Israel
Our principal subsidiary in Israel (formerly Lipman) has received tax benefits under Israeli law for capital investments that are designated as “Approved Enterprises.” We received such tax benefits of approximately $0.4 million in 2009 and $8.0 million in 2008. Due to our restructuring and contract manufacturing arrangements entered into in fiscal 2010 we will no longer meet the requirements necessary to maintain the tax benefit status in Israel. Effective beginning November 1, 2009, we will be taxed at the full statutory rate in Israel and no future tax benefit will be recorded. Our principal subsidiary in Israel has undistributed earnings of approximately $179.2 million, the vast majority of which are attributable to Lipman’s historic Approved Enterprise programs. As such, these earnings were not subject to Israeli statutory corporate tax at the time they were generated. To the extent that these earnings are distributed to the United States in the future, our Israeli subsidiary would be required to pay corporate tax at the rate ordinarily applicable to such earnings, currently between 12.5% and 36.25% which includes the withholding tax between the U.S. and Israel. We have accrued approximately $48.7 million for taxes associated with potential future distributions of our Israeli subsidiary’s approximately $179.2 million in earnings.
Singapore
Our principal subsidiary in Singapore has received tax benefits under the Singapore Pioneer Tax Holiday provision. We received such tax benefits of approximately $4.1 million in 2009 and $1.2 million in 2008. To maintain our eligibility for these benefits, we must meet certain agreed conditions, including maintaining agreed levels of Singapore employees and incurring and documenting total local business spend levels as agreed with the Singapore Economic Development Board. If the Company is not able to maintain the employment levels and total local business spend levels then all income in Singapore could be taxed at the statutory rate of 18% instead of the agreed Pioneer Tax Holiday rate of 0%. The Company is currently renegotiating terms and conditions for 2008 and subsequent years and expects to maintain its tax exempt status.
We have significant operations in Israel and therefore our results of operations may be adversely affected by political or economic instability or military operations in or around Israel.
We have offices and a manufacturing facility in Israel and many of our suppliers are located in Israel. Therefore, political, economic, and military conditions in Israel directly affect our operations. The future of peace efforts between Israel and its Arab neighbors remains uncertain. Any armed conflicts or further political instability in the region is likely to negatively affect business conditions and adversely affect our results of operations. Furthermore, several countries continue to restrict or ban business with Israel and Israeli companies. These restrictive laws and policies may seriously limit our ability to make sales in those countries.
In addition, many employees in Israel are obligated to perform at least 30 days and up to 40 days, depending on rank and position, of military reserve duty annually and are subject to being called for active duty under emergency circumstances. If a military conflict or war arises, these individuals could be required to serve in the military for extended periods of time. Our operations in Israel could be disrupted by the absence for a significant period of one or more key employees or a significant number of other employees due to military service. Any disruption in our operations in Israel could materially adversely affect our business.
24
Table of Contents
We depend on our manufacturing and warehouse facility and contract manufacturing facility in Israel. If operations at these facilities are interrupted for any reason, there could be a material adverse effect on our results of operations.
We currently assemble and test a number of our product lines at our manufacturing facility located in Israel. Component and limited finished product inventories are also stored at this facility. As a result of our outsourcing decision, we are in the process of transferring our manufacturing of NURIT products to a contract manufacturer with operations in Israel. Disruption of the manufacturing process at this facility or at the facility of our contract manufacturer or damage to either of these facilities, whether as a result of fire, natural disaster, act of war, terrorist attack, or otherwise, could materially affect our ability to deliver products on a timely basis and could materially adversely affect our results of operations. We also assemble some of our products in Brazil. To the extent products are manufactured by third parties in additional countries, we may become more dependent on third-party manufacturers to produce and deliver products sold in these markets on a timely basis and at an acceptable cost.
We have experienced rapid growth in recent years, and if we cannot adequately manage our growth, our results of operations will suffer.
We have experienced rapid growth in recent years in our operations, both internally and from acquisitions. We cannot be sure that we have made adequate allowances for the costs and risks associated with our expansion, or that our systems, procedures, and managerial controls will be adequate to support further expansion in our operations. Any delay in implementing, or transitioning to, new or enhanced systems, procedures, or controls to accommodate the requirements of our business and operations may adversely affect our ability to manage our product inventory and record and report financial and management information on a timely and accurate basis. If we are unable to successfully manage expansion, our results of operations may be adversely affected.
Our quarterly operating results may fluctuate significantly as a result of factors outside of our control, which could cause the market price of our common stock to decline.
We expect our revenues and operating results to vary from quarter to quarter. As a consequence, our operating results in any single quarter may not meet the expectations of securities analysts and investors, which could cause the price of our common stock to decline. Factors that may affect our operating results include:
| • | the type, timing, and size of orders and shipments; |
| • | demand for and acceptance of our new product offerings; |
| • | customers’ willingness to maintain inventories; |
| • | delays in the implementation and delivery of our products and services, which may impact the timing of our recognition of revenues; |
| • | variations in product mix and cost during any period; |
| • | development of new relationships and penetration of new markets and maintenance and enhancement of existing relationships with customers and strategic partners; |
| • | component supply, manufacturing, or distribution difficulties; |
| • | deferral of customer contracts in anticipation of product or service enhancements; |
| • | timing of commencement, implementation, or completion of major implementation projects; |
| • | timing of governmental, statutory and industry association requirements; |
| • | the relative mix of North America and International net revenues; |
| • | fluctuations in currency exchange rates; |
| • | the fixed nature of many of our expenses; and |
| • | industry and economic conditions, including competitive pressures and inventory obsolescence. |
25
Table of Contents
In particular, differences in relative growth rates between our businesses in North America and internationally may have a significant effect on our operating results, particularly our reported gross profit percentage, in any individual quarter, with International sales carrying lower margins.
In addition, we have in the past and may continue to experience periodic variations in sales to our key vertical and international markets. These periodic variations occur throughout the year and may lead to fluctuations in our quarterly operating results depending on the impact of any given market during that quarter and could lead to volatility in our stock price.
We are party to a number of lawsuits and we may be named in additional litigation, all of which are likely to require significant management time and attention and expenses and may result in an unfavorable outcome which could have a material adverse effect on our business, financial condition, and results of operations.
We are currently a party in several material litigation proceedings. For example, in connection with the restatements of our historical interim financial statements for fiscal year 2007, a number of securities class action complaints were filed against us and certain of our officers, and a number of purported derivative actions have also been filed against certain of our current and former directors and officers. For a description of our material pending litigation, please see Part I Item 3 — “Legal Proceedings” of this Annual Report on Form 10-K.
The amount of time and resources required to resolve these lawsuits is unpredictable, and defending ourselves is likely to divert management’s attention from the day-to-day operations of our business, which could adversely affect our business, financial condition, and results of operations. In addition, an unfavorable outcome in such litigation or a decision by us to settle such lawsuits to avoid the distraction and expense of continued litigation even if we deem the claims to be without merit would have a material adverse effect on our business, financial condition, and results of operations.
Our insurance may not be sufficient to cover our costs for defending these actions or paying any damages in the event of an unfavorable outcome. In addition, we may be obligated to indemnify (and advance legal expenses to) both current and former officers, employees and directors in connection with the securities class action and derivative action matters. We currently hold insurance policies for the benefit of our directors and officers, although our insurance coverage may not be sufficient in some or all of these matters. Furthermore, our insurance carriers may seek to deny coverage in some or all of these matters, in which case we may have to fund the indemnification amounts owed to such directors and officers ourselves.
We are subject to the risk of additional litigation and regulatory proceedings or actions in connection with the restatement. We have responded to inquiries and provided information and documents related to the restatement to the SEC, the U.S. Department of Justice, the New York Stock Exchange, and the Chicago Board Options Exchange. We were the subject of a Wells Notice from the SEC stating that the Staff intends to recommend that the SEC bring a civil injunctive action against us, alleging violations of the federal securities laws arising from the restatement. See additional discussion under Part I Item 3 — “Legal Proceedings” of this Annual Report on Form 10-K. Although we recently settled this matter with the SEC, additional regulatory inquiries may also be commenced by other U.S. federal, state or foreign regulatory agencies. In addition, we may in the future be subject to additional litigation or other proceedings or actions arising in relation to the restatement of our historical interim financial statements. Litigation and any potential regulatory proceeding or action may be time consuming, expensive and distracting from the conduct of our business. The adverse resolution of any specific lawsuit or any potential regulatory proceeding or action could have a material adverse effect on our business, financial condition, and results of operations.
These litigation proceedings could result in substantial additional costs and expenses and adversely affect our cash flows, and may adversely affect our business, financial condition, and results of operations. For example, we have incurred substantial expenses for legal, accounting, tax and other professional services in connection with the investigation by the audit committee of our board of directors, our internal review of our historical financial statements, the preparation of the restated financial statements, inquiries from government
26
Table of Contents
agencies, the related litigation, and the amendments to our credit agreement as a result of our failure to timely file our Exchange Act reports with the SEC. We expect to continue to incur significant expenses in connection with these matters. Many members of our senior management team and our Board of Directors have been and will be required to devote a significant amount of time to the litigation related to the restatement. In addition, certain of these individuals are named defendants in the litigation related to the restatement. Defending these actions may require significant time and attention from them. If our senior management is unable to devote sufficient time in the future developing and pursuing our strategic business initiatives and running ongoing business operations, there may be a material adverse effect on our business, financial condition and results of operations.
We may be subject to additional impairment charges due to potential declines in the fair value of our assets.
As a result of our acquisitions, particularly that of Lipman in November 2006, we have significant goodwill and intangible assets on our balance sheet. We test goodwill and intangible assets for impairment on a periodic basis as required, and whenever events or changes in circumstances indicate that the carrying value may not be recoverable. The events or changes that could require us to test our goodwill and intangible assets for impairment include a reduction in our stock price and market capitalization and changes in our estimated future cash flows, as well as changes in rates of growth in our industry or in any of our reporting units. In the fourth quarter of 2008, we recorded an impairment charge of $289.1 million for goodwill and developed technology intangible assets due to lower revenue expectations in light of current operating performance and future operating expectations. During the first fiscal quarter of 2009, we concluded that the carrying amount of the North America and Asia reporting units exceeded their implied fair values and recorded an estimated impairment charge of $178.2 million. We finalized the goodwill evaluation process and recorded a $2.7 million reduction of impairment charge during the second quarter of fiscal year 2009. The final goodwill impairment charge was $175.5 million as of April 30, 2009. We have not recorded any further impairment charges since the quarter ended April 30, 2009.
We will continue to evaluate the carrying value of our remaining goodwill and intangible assets and if we determine in the future that there is a potential further impairment in any of our reporting units, we may be required to record additional charges to earnings which could materially adversely affect our financial results and could also materially adversely affect our business. The process of evaluating the potential impairment of goodwill and intangible assets is subjective and requires significant judgment at many points during the analysis and includes estimates of our future cash flows attributable to a reporting unit or asset over its estimated remaining useful life. Any changes in our estimates, such as our estimates of the future cash flows attributable to a reporting unit or asset, or a longer or more significant decline in our market capitalization or the macroeconomic environment, could require us to record additional impairment charges which could materially adversely affect our financial results. See Part II Item 7 — “Management’s Discussion and Analysis of Financial Condition and Results of Operations” and “Note 2. Goodwill and Purchased Intangible Assets” under Part II Item 8 — “Financial Statements and Supplementary Data” for additional information related to impairment of goodwill and intangible assets.
Our North American and International operations are not equally profitable, which may promote volatility in our earnings and may adversely impact future growth in our earnings.
Our International sales of System Solutions have tended to carry lower average selling prices and therefore have lower gross margins than our sales in North America. As a result, if we successfully expand our International sales, any improvement in our results of operations will likely not be as favorable as an expansion of similar magnitude in the United States and Canada. In addition, we are unable to predict for any future period our proportion of revenues that will result from International sales versus sales in North America. Variations in this proportion from period to period may lead to volatility in our results of operations which, in turn, may depress the trading price of our common stock.
27
Table of Contents
Security is vital to our customers and end users and therefore breaches in the security of our solutions could adversely affect our reputation and results of operations.
Protection against fraud is of key importance to the purchasers and end users of our solutions. We incorporate security features, such as encryption software and secure hardware, into our solutions to protect against fraud in electronic payment transactions and to ensure the privacy and integrity of consumer data. Our solutions may be vulnerable to breaches in security due to defects in the security mechanisms, the operating system and applications, or the hardware platform. Security vulnerabilities could jeopardize the security of information transmitted or stored using our solutions. We also provide our customers with repair, encryption key loading and helpdesk services, and have in the past and may in the future also experience security breaches or fraudulent activities related to unauthorized access to sensitive customer information. If the security of our solutions is compromised, our reputation and marketplace acceptance of our solutions will be adversely affected, which would cause our business to suffer, and we may become subject to damages claims.
Our solutions may have defects that could result in sales delays, delays in our collection of receivables, increased costs and claims against us.
We offer complex solutions that are susceptible to undetected hardware and software errors or failures. Solutions may experience failures when first introduced, as new versions are released, or at any time during their lifecycle. Defects may also arise from third party components that we incorporate into our products, such as hardware modules, chipsets or battery cells. Any product recalls as a result of errors or failures could result in the loss of or delays in market acceptance of our solutions, adversely affect our business and reputation and increase our product costs which could negatively impact our margins, profitability and results of operations. In July 2009, we recorded a $3.2 million warranty accrual related to a potential warranty exposure for one of our products. During the fourth quarter of fiscal 2009, we recorded an additional warranty accrual of $2.4 million related to this potential exposure. The amount accrued represents our current best estimate of our exposure based on relevant facts and circumstances. There is a reasonable possibility that we may incur additional warranty expense related to this product in future periods. Any significant returns or warranty claims for this product or any of our products could result in significant additional costs to us and could adversely affect our results of operations. Our customers may also run third-party software applications on our electronic payment systems. Errors in third-party applications could adversely affect the performance of our solutions.
The existence of defects and delays in correcting them could result in negative consequences, including the following: harm to our brand; delays in shipping system solutions; loss of market acceptance for our system solutions; additional warranty expenses; diversion of resources from product development; and loss of credibility with distributors and customers. Correcting defects can be time consuming and in some circumstances extremely difficult. Software errors may take several months to correct, and hardware defects may take even longer to correct.
We may accumulate excess or obsolete inventory that could result in unanticipated price reductions and write-downs and adversely affect our financial condition.
In formulating our solutions, we have focused our efforts on providing to our customers solutions with higher levels of functionality, which requires us to develop and incorporate cutting edge and evolving technologies. This approach tends to increase the risk of obsolescence for products and components we hold in inventory and may compound the difficulties posed by other factors that affect our inventory levels, including the following:
| • | the need to maintain significant inventory of components that are in limited supply; |
| • | buying components in bulk for the best pricing; |
| • | responding to the unpredictable demand for products; |
| • | cancellation of customer orders; and |
| • | responding to customer requests for quick delivery schedules. |
28
Table of Contents
The accumulation of excess or obsolete inventory has in the past resulted in and may in future periods result in price reductions and inventory write-downs and scrap, which could adversely affect our business, results of operations and financial condition. We incurred costs for obsolete inventory, scrap, and purchase commitments for excess components at contract manufacturers of $23.0 million for the fiscal year ended October 31, 2009 and $11.8 million for the fiscal year ended October 31, 2008, with the significant increase year over year due to changing demand we experienced in fiscal year 2009 as a result of the severe deterioration in the macroeconomic environment. See also Part II, Item 7 “Management’s Discussion and Analysis of Financial Condition and Results of Operations”.
If we do not accurately forecast customer demand and effectively manage our product mix and inventory levels, we may lose sales from having too few or the wrong mix of products or incur costs associated with excess inventory.
If we improperly forecast demand for our products we could end up with too many products and be unable to sell the excess inventory in a timely manner, if at all, or, alternatively we could end up with too few products and not be able to satisfy demand. This problem is exacerbated because we attempt to closely match inventory levels with product demand leaving limited margin for error, and we generally receive a significant volume of customer orders towards the end of each fiscal quarter which leave us little room to adjust inventory mix to match demand. Also, during the transition from an existing product to a new replacement product, we must accurately predict the demand for the existing and the new product. Our inability to properly manage our inventory levels could cause us to incur increased expenses associated with writing off excessive or obsolete inventory or lose sales or have to ship products by air freight to meet immediate demand incurring incremental freight costs above sea freight costs, a preferred method, and suffering a corresponding decline in gross margins. If we do not accurately predict demand, we could also incur increased expenses associated with binding commitments to certain third party contract manufacturers which would negatively impact our gross margins and operating results. See “Note 12. Commitment and Contingencies” under Part II Item 8 — “Financial Statements and Supplementary Data.” During times of economic uncertainty, such as that of the current global economic environment, it becomes more difficult to accurately forecast demand and manage our inventory levels. Deteriorating market conditions have in the past and can in future periods cause us to incur additional costs associated with excess and obsolete inventory, scrap and excess inventory held by our contract manufacturers. For example, we incurred approximately $23.0 million of such costs for the fiscal year ended October 31, 2009.
Our proprietary technology is difficult to protect and unauthorized use of our proprietary technology by third parties may impair our ability to compete effectively.
We may not be able to protect our proprietary technology, which could enable competitors to develop services that compete with our own. We rely on copyright, trademark, and trade secret laws, as well as confidentiality, licensing and other contractual arrangements to establish and protect the proprietary aspects of our solutions. Institution of legal proceedings to enforce our intellectual property rights could be costly and divert the efforts and attention of our management and technical personnel from other business operations. In addition, there can be no assurance that such proceedings would be determined in our favor. We do not have patent protection for certain important aspects of our current solutions. The laws of some countries in which we sell our solutions and services may not protect software and intellectual property rights to the same extent as the laws in the United States. If we are unable to prevent misappropriation of our technology, competitors may be able to use and adapt our technology. Our failure to protect our technology could diminish our competitive advantage and cause us to lose customers to competitors.
Our business may suffer if we are sued for infringing the intellectual property rights of third parties, or if we are unable to obtain rights to third-party intellectual property on which we depend.
Third parties have in the past asserted and may in the future assert claims that our system solutions infringe their proprietary rights. Such infringement claims, even if meritless, may cause us to incur significant costs in defending those claims. We may be required to discontinue using and selling any infringing technology and
29
Table of Contents
services, to expend resources to develop non-infringing technology or to purchase licenses or pay royalties for other technology. Similarly, we depend on our ability to license intellectual property from third parties. These or other third parties may become unwilling to license to us on acceptable terms intellectual property that is necessary to our business. In either case, we may be unable to acquire licenses for other technology on reasonable commercial terms or at all. As a result, we may find that we are unable to continue to offer the solutions and services upon which our business depends.
We have received, and have currently pending, third-party claims and may receive additional notices of such claims of infringement in the future. Infringement claims may cause us to incur significant costs in defending those claims or to settle claims to avoid costly or protracted litigation even if we deem those claims to be without merit. For example, in September 2007, SPA Syspatronic AG commenced an infringement action against us and others and in March 2008, Cardsoft, Inc. and Cardsoft (Assignment for the Benefit of Creditors), LLC commenced an infringement action against us and others. Infringement claims are expensive and time consuming to defend, regardless of the merits or ultimate outcome. Similar claims may result in additional protracted and costly litigation. There can be no assurance that we will continue to prevail in any such actions or that any license required under any such patent or other intellectual property would be made available on commercially acceptable terms, if at all. See “Note 12. Commitments and Contingencies” under Part II Item 8 — “Financial Statements and Supplementary Data.”
We face litigation and tax assessment risks that could force us to incur substantial defense costs and could result in damages awards against us that would negatively impact our business.
As described in “Note 12. Commitments and Contingencies” under Part II Item 8 — “Financial Statements and Supplementary Data,” there are a number of pending litigation and tax assessment matters each of which may be time-consuming to resolve, expensive to defend, and disruptive to normal business operations. The outcome of litigation and tax assessments is inherently difficult to predict. An unfavorable resolution of any specific lawsuit or tax assessment could have a material adverse effect on our business, results of operations and financial condition.
We may not be able to attract, integrate, manage, and retain qualified personnel.
Our success depends to a significant degree upon the continued contributions of our key senior management, engineering, sales and marketing, and manufacturing personnel, many of whom would be difficult to replace. In addition, our future success also depends on our ability to attract, integrate, manage, and retain highly skilled employees throughout our businesses. Competition for some of these personnel is intense, and in the past, we have had difficulty hiring employees in our desired time frame, particularly qualified finance and accounting professionals. We may be unsuccessful in attracting and retaining personnel. The loss of the services of any of our key personnel, the inability to attract or retain qualified personnel in the future, or delays in hiring required personnel, particularly engineers and sales personnel, could make it difficult for us to manage our business and meet key objectives, such as timely product introductions.
During the last two fiscal years, we implemented work force reduction plans reducing the number of employees and contractors. These reductions have also required that we reassign certain employee duties. Workforce reductions and job reassignments could negatively affect employee morale, and make it difficult to motivate and retain our remaining employees and contractors, which would affect our ability to deliver our products in a timely fashion and otherwise negatively affect our business.
In addition, the restatement of our historical interim financial statements has adversely impacted our ability to attract and retain qualified personnel and may also have affected the morale and productivity of our workforce, including as a result of the uncertainties inherent in the restatement process, as well as our inability to provide equity-based compensation or permit the exercise of outstanding stock options from the time we announced that we would be restating our interim financial statements to August 2008, when we filed the required reports with
30
Table of Contents
the SEC. Moreover, the restatement process has adversely affected the market for our shares making our equity compensation program potentially less attractive for current or prospective employees.
Shipments of electronic payment systems may be delayed by factors outside of our control, which can harm our reputation and our relationships with our customers.
The shipment of payment systems requires us or our manufacturers, distributors, or other agents to obtain customs or other government certifications and approvals, and, on occasion, to submit to physical inspection of our systems in transit. Failure to satisfy these requirements, and the very process of trying to satisfy them, can lead to lengthy delays in the delivery of our solutions to our direct or indirect customers. Delays and unreliable delivery by us may harm our reputation in the industry and our relationships with our customers.
Force majeure events, such as terrorist attacks, other acts of violence or war, political instability, and health epidemics may adversely affect us.
Terrorist attacks, war and international political instability, along with health epidemics may disrupt our ability to generate revenues. Such events may negatively affect our ability to maintain sales revenues and to develop new business relationships. Because a substantial and growing part of our revenues is derived from sales and services to customers outside of the United States and we have our electronic payment systems manufactured outside the U.S., terrorist attacks, war and international political instability anywhere may decrease international demand for our products and inhibit customer development opportunities abroad, disrupt our supply chain and impair our ability to deliver our electronic payment systems, which could materially adversely affect our net revenues or results of operations. Any of these events may also disrupt global financial markets and precipitate a decline in the price of our common stock.
Natural or manmade disasters, business interruptions and health epidemics could delay our ability to receive or ship our products, or otherwise disrupt our business.
Our worldwide operations could be subject to earthquakes, power shortages, telecommunications failures, water shortages, tsunamis, floods, hurricanes, typhoons, fires, extreme weather conditions, health epidemics and other natural or manmade disasters or business interruptions. The occurrence of any of these business disruptions could seriously harm our revenue and financial condition and increase our costs and expenses. Our corporate headquarters, and a portion of our research and development activities, are located in California, and other critical business operations and some of our suppliers are located in California and Asia, near major earthquake faults. If our manufacturers’ or warehousing facilities are disrupted or destroyed, we would be unable to distribute our products on a timely basis, which could harm our business. Moreover, if our computer information systems or communication systems, or those of our vendors or customers, are subject to hacker attacks or other disruptions, our business could suffer. We have not established a comprehensive disaster recovery plan. Our back-up operations may be inadequate and our business interruption insurance may not be enough to compensate us for any losses that may occur. A significant business interruption could result in losses or damages and harm our business. For example, much of our order fulfillment process is automated and the order information is stored on our servers. If our computer systems and servers go down even for a short period at the end of a fiscal quarter, our ability to recognize revenue would be delayed until we were again able to process and ship our orders, which could harm our revenues for that quarter and cause our stock price to decline significantly.
While we believe we comply with environmental laws and regulations, we are still exposed to potential risks associated with environmental laws and regulations.
We are subject to other legal and regulatory requirements, including a European Union directive that places restrictions on the use of hazardous substances (RoHS) in electronic equipment, a European Union directive on Waste Electrical and Electronic Equipment (WEEE), and the environmental regulations promulgated by China’s Ministry of Information Industry (China RoHS). RoHS sets a framework for producers’ obligations in relation to
31
Table of Contents
manufacturing (including the amounts of named hazardous substances contained in products sold) and WEEE sets a framework for treatment, labeling, recovery, and recycling of electronic products in the European Union which may require us to alter the manufacturing of the physical devices that include our solutions and/or require active steps to promote recycling of materials and components. In addition, similar legislation could be enacted in other jurisdictions, including in the United States. If we do not comply with the RoHS directives, WEEE directives and China RoHS, we may suffer a loss of revenue, be unable to sell in certain markets or countries, be subject to penalties and enforced fees, and/or suffer a competitive disadvantage. Furthermore, the costs to comply with RoHS, WEEE and China RoHS, or with current and future environmental and worker health and safety laws may have a material adverse effect on our business, results of operations and financial condition.
We may pursue complementary acquisitions and strategic investments, which will involve numerous risks. We may not be able to address these risks without substantial expense, delay or other operational or financial problems.
We may seek to acquire or make investments in related businesses, technologies, or products in the future. Acquisitions or investments involve various risks, such as:
| • | the difficulty of integrating the technologies, operations, and personnel of the acquired business, technology or product; |
| • | the potential disruption of our ongoing business, including the diversion of management attention; |
| • | the possible inability to obtain the desired financial and strategic benefits from the acquisition or investment; |
| • | loss of customers; |
| • | the risk that increasing complexity inherent in operating a larger business may impact the effectiveness of our internal controls and adversely affect our financial reporting processes; |
| • | assumption of unanticipated liabilities; |
| • | the loss of key employees of an acquired business; and |
| • | the possibility of our entering markets in which we have limited prior experience. |
Future acquisitions and investments could also result in substantial cash expenditures, potentially dilutive issuance of our equity securities and incurrence of additional debt, contingent liabilities and amortization expenses related to other intangible assets that could adversely affect our business, operating results, and financial condition. We depend on the retention and performance of existing management and employees of acquired businesses for the day-to-day management and future operating results of these businesses.
Risks Related to Our Industry
Our markets are highly competitive and subject to price erosion.
The markets for our system solutions and services are highly competitive, and we have been subject to price pressures. Competition from manufacturers, distributors, or providers of products similar to or competitive with our system solutions or services could result in price reductions, reduced margins, and a loss of market share or could render our solutions obsolete. For example, First Data Corporation, a leading provider of payments processing services, and formerly our largest customer, has developed and continues to develop a series of proprietary electronic payment systems for the U.S. market.
We expect to continue to experience significant and increasing levels of competition in the future. We compete with suppliers of cash registers that provide built-in electronic payment capabilities and producers of software that facilitates electronic payment over the internet, as well as other manufacturers or distributors of electronic payment systems. We must also compete with smaller companies that have been able to develop
32
Table of Contents
strong local or regional customer bases. In certain foreign countries, some competitors are more established, benefit from greater name recognition and have greater resources within those countries than we do. Further, in certain international markets, such as Brazil, we may face competition from refurbished units which could result in reduced demand and pricing pressures.
We must adhere to industry and government regulations and standards and therefore sales will suffer if we cannot comply with them.
Our system solutions must meet industry standards imposed by EMVCo LLC, a payment systems standards setting organization, Visa, MasterCard, and other credit card associations and standard setting organizations. New standards are continually being adopted or proposed as a result of worldwide anti-fraud initiatives, the increasing need for system compatibility and technology developments such as wireless and wireline IP communication. Our solutions also must comply with government regulations, including those imposed by telecommunications authorities and independent standards groups worldwide regarding emissions, radiation, and connections with telecommunications and radio networks. We cannot be sure that we will be able to design our solutions to comply with future standards or regulations on a timely basis, if at all. Compliance with these standards could increase the cost of developing or producing our solutions. New products designed to meet any new standards need to be introduced to the market and ordinarily need to be certified by the credit card associations and our customers before being purchased. The certification process is costly and time consuming and increases the amount of time it takes to sell our products. Our business and financial condition could be adversely affected if we cannot comply with new or existing industry standards, or obtain or retain necessary regulatory approval or certifications in a timely fashion, or if compliance results in increasing the cost of our products. Selling products that are non-compliant may result in fines against us or our customers, which we may be liable to pay. In addition, even if our products are designed to be compliant, compliance with certain security standards is determined based on the merchant’s or service provider’s network environment in which our systems are installed and, therefore, is dependent upon a number of additional factors such as proper installation of the components of the environment including our systems, compliance of software and system components provided by other vendors, implementation of compliant security processes and business practices and adherence to such processes and practices. Our business and financial condition could be adversely affected if we do not comply with new or existing industry standards, or obtain or retain necessary regulatory approval or certifications in a timely fashion, or if compliance results in increasing the cost of our products.
If we do not continually enhance our existing solutions and develop and market new solutions and enhancements, our net revenues and income will be adversely affected.
The market for electronic payment systems is characterized by:
| • | rapid technological change; |
| • | frequent product introductions and enhancements; |
| • | evolving industry and government performance and security standards; and |
| • | changes in customer and end-user requirements. |
Because of these factors, we must continually enhance our existing solutions and develop and market new solutions. These efforts require significant investment in research and development as well as increased costs of manufacturing and distributing our system solutions, and we may not necessarily be able to increase or maintain prices to account for these costs.
We cannot be sure that we will successfully complete the development and introduction of new solutions or enhancements or that our new solutions will be accepted in the marketplace. We may also fail to develop and deploy new solutions and enhancements on a timely basis. In either case, we may lose market share to our competitors, and our net revenues and results of operations could suffer.
33
Table of Contents
Risks Related to Our Capital Structure
Our secured credit facility contains restrictive and financial covenants and, if we are unable to comply with these covenants, we will be in default. A default could result in the acceleration of our outstanding indebtedness, which would have an adverse effect on our business and stock price.
On October 31, 2006, our principal subsidiary, VeriFone, Inc., entered into a secured credit agreement consisting of a Term B Loan facility of $500.0 million and a revolving credit facility permitting borrowings of up to $40.0 million (the “Credit Facility”). The proceeds from the Term B loan were used to repay all outstanding amounts relating to an existing senior secured credit agreement, pay certain transaction costs, and partially fund the cash consideration in connection with the acquisition of Lipman on November 1, 2006. Through October 31, 2009, we had repaid an aggregate of $273.7 million, leaving a Term B Loan balance of $226.3 million at October 31, 2009.
Our Credit Facility contains customary covenants that require our subsidiaries to maintain certain specified financial ratios and restrict their ability to make certain distributions with respect to their capital stock, prepay other debt, encumber their assets, incur additional indebtedness, make capital expenditures above specified levels, engage in certain business combinations, or undertake various other corporate activities. Therefore, as a practical matter, these covenants restrict our ability to engage in or benefit from such activities. In addition, we have, in order to secure repayment of our Credit Facility, pledged substantially all of our assets and properties. This pledge may reduce our operating flexibility because it restricts our ability to dispose of these assets or engage in other transactions that may be beneficial to us.
If we are unable to comply with the covenants in our Credit Facility, we will be in default, which could result in the acceleration of our outstanding indebtedness. In addition, if our leverage exceeds a certain level set out in our Credit Facility, a portion of our excess cash flows must be used to pay down our outstanding debt. If acceleration occurs, we may not be able to repay our debt and we may not be able to borrow sufficient additional funds to refinance our debt. The U.S. credit markets have contracted significantly and as a result we may not be able to obtain additional financing on acceptable terms, or at all. If we were to default in performance under the Credit Facility we may pursue an amendment or waiver of the Credit Facility with our existing lenders, but there can be no assurance that the lenders would grant such an amendment or waiver and, in light of current credit market conditions, any such amendment or waiver requested is likely to be on terms, including additional fees, as well as increased interest rates and other more stringent terms and conditions that would be materially disadvantageous to us. For example, as a result of the delay in our financial reports for the 2007 fiscal year and the first two fiscal quarters of 2008, we were required to obtain amendments to our Credit Facility that resulted in an increase in the interest rate payable on our term loan and revolving commitments, as well as increases in the commitment fee for unused revolving commitments and letter of credit fees. We also paid the consenting lenders amendment fees in connection with the amendments. We expect that in light of current market conditions any lender’s fees or other terms and conditions for a covenant waiver or amendment would be substantially more costly to us today than the cost we incurred for credit agreement amendments in 2008.
The conditions of the U.S. and international capital markets may adversely affect our ability to draw on our revolving credit facility as well as have an adverse effect on other financial transactions.
Lehman Commercial Paper, Inc. (“Lehman CP”) was a lender under our revolving credit facility with a commitment of $15 million out of the $40 million facility. As a result of Lehman CP’s filing of a voluntary Chapter 11 bankruptcy petition in October 2008, we reduced the revolving credit facility by its commitment.
In addition, the filing by Lehman Brothers Holdings Inc. (“Lehman Brothers”) of a voluntary Chapter 11 bankruptcy petition constituted an “event of default” under our convertible note hedge transaction with Lehman Brothers OTC Derivatives Inc. (“Lehman Derivatives”), giving us the immediate right to terminate the transaction and entitling us to claim reimbursement for the loss incurred in terminating and closing out the transaction. On September 21, 2008, we delivered a notice of termination to Lehman Derivatives and claimed
34
Table of Contents
reimbursement for the loss incurred in termination and close out of the transaction. There can be no assurance we will receive any reimbursement of the losses incurred and we could incur significant costs to replace this hedge transaction if we elect to do so. These replacement costs may not be fully offset by any proceeds recoverable from Lehman Brothers and Lehman Derivatives (which has also filed a voluntary Chapter 11 bankruptcy petition) following our termination of the convertible note hedge transaction with Lehman Derivatives.
If other financial institutions that have extended credit commitments to us or have entered into hedge, insurance or similar transactions with us are adversely affected by the conditions of the U.S. and international capital markets, they may become unable to fund borrowings under their credit commitments to us or otherwise fulfill their obligations under the relevant transactions, which could have a material and adverse impact on our financial condition and our ability to borrow additional funds, if needed, for working capital, capital expenditures, acquisitions and other corporate purposes.
Our indebtedness and debt service obligations under our Credit Facility may adversely affect our cash flow, cash position, and stock price.
We intend to fulfill our debt service obligations under our Credit Facility from existing cash, investments and operations. Principal payments on the Term B Loan are due in equal quarterly instalments over the term with a maturity date of October 31, 2013. In the future, if we are unable to generate or raise additional cash sufficient to meet these obligations and need to use more of our existing cash than planned or to liquidate investments in order to fund these obligations, we may have to delay or curtail the development and/or the sales and marketing of new payment systems.
Our indebtedness could have significant additional negative consequences, including, without limitation:
| • | requiring the dedication of a significant portion of our expected cash flow to service the indebtedness, thereby reducing the amount of expected cash flow available for other purposes, including capital expenditures; |
| • | increasing our vulnerability to general adverse economic conditions; |
| • | limiting our ability to obtain additional financing; and |
| • | placing us at a possible competitive disadvantage to less leveraged competitors and competitors that have better access to capital resources. |
Additionally, if we are required to refinance or raise additional cash to settle our existing indebtedness on or prior to its maturity, our ability to successfully achieve such objective is dependent on a number of factors, including but not limited to our business outlook, projected financial performance, general availability of corporate credit, and market demand for our securities offerings.
Some provisions of our certificate of incorporation and bylaws may delay or prevent transactions that many stockholders may favor.
Some provisions of our certificate of incorporation and bylaws may have the effect of delaying, discouraging or preventing a merger or acquisition that our stockholders may consider favorable, including transactions in which stockholders might receive a premium for their shares. These provisions include:
| • | authorization of the issuance of “blank check” preferred stock without the need for action by stockholders; |
| • | the removal of directors or amendment of our organizational documents only by the affirmative vote of the holders of two-thirds of the shares of our capital stock entitled to vote; |
| • | provision that any vacancy on the board of directors, however occurring, including a vacancy resulting from an enlargement of the board, may only be filled by vote of the directors then in office; |
35
Table of Contents
| • | inability of stockholders to call special meetings of stockholders, although stockholders are permitted to act by written consent; and |
| • | advance notice requirements for board nominations and proposing matters to be acted on by stockholders at stockholder meetings. |
Our share price has been volatile and we expect that the price of our common stock may continue to fluctuate substantially.
Our stock price has fluctuated substantially since our initial public offering in 2005 and more recently since the announcement of our anticipated restatement in December 2007 and during the recent turmoil in the worldwide financial markets. In addition to fluctuations related to Company-specific factors, broad market and industry factors may adversely affect the market price of our common stock, regardless of our actual operating performance. Factors that could cause fluctuations in our stock price may include, among other things:
| • | actual or anticipated variations in quarterly operating results; |
| • | changes in financial estimates by us or by any securities analysts who might cover our stock, or our failure to meet the estimates made by securities analysts; |
| • | changes in the market valuations of other companies operating in our industry; |
| • | announcements by us or our competitors of significant acquisitions, strategic partnerships or divestitures; |
| • | additions or departures of key personnel; and |
| • | sales or purchases of our common stock, including sales or purchases of our common stock by our directors and officers or by our principal stockholders. |
| ITEM 1B. | UNRESOLVED STAFF COMMENTS |
None.
| ITEM 2. | PROPERTIES |
Our headquarters are located in San Jose, California. Warehouse and distribution facilities are located in the U.S., Israel, the United Kingdom, Turkey, Argentina, Spain and Brazil. Our warehouse and distribution space is leased and totals approximately 262,000 square feet.
We also maintain research facilities and sales and administrative offices in the U.S. at approximately 12 locations in seven states or jurisdictions and outside the U.S. at approximately 56 locations in 21 countries. All of these locations are leased. We are using substantially all of our currently available productive space to develop, manufacture, market, sell and distribute our products. Our facilities are in good operating condition, suitable for their respective uses and adequate for current needs.
| Location |
Approximate Square Footage | |
| Corporate Headquarters: |
||
| United States |
20,622 | |
| Warehouse and Distribution Facilities: |
||
| United States |
155,610 | |
| International |
106,508 | |
| 262,118 | ||
| Sales office or Research and Development: |
||
| United States |
207,695 | |
| International |
229,402 | |
| 437,097 | ||
36
Table of Contents
| ITEM 3. | LEGAL PROCEEDINGS |
Brazilian State Tax Assessments
State Value Added Tax
One of our Brazilian subsidiaries has been notified of a tax assessment regarding Brazilian state value added tax (“VAT”), for the periods from 2000 to 2002 that relates to products supplied to us by a contract manufacturer. The assessment relates to an asserted deficiency of 4.7 million Brazilian reais (approximately $2.7 million). The tax assessment was based on a clerical error in which our Brazilian subsidiary omitted the required tax exemption number on its invoices. On August 27, 2003, the tax authorities rendered a first level decision that maintained the tax assessment. We have appealed the first level decision. On March 30, 2009, the proceeding was remitted to the State Court of Appeals. This proceeding is currently pending second administrative level decision. We do not expect that we will ultimately incur a material liability in respect of this assessment and have not recorded a reserve for this assessment, because we believe, based in part on advice of our Brazilian tax counsel, that we are likely to prevail in the proceedings relating to this assessment. In the event we receive an adverse ruling from the administrative body, we will decide whether or not to appeal and would reexamine the determination as to whether an accrual is necessary. It is currently uncertain what impact this state tax examination may have with respect to our use of a corresponding exemption to reduce the Brazilian federal VAT.
Importation of Goods Assessments
Two of our Brazilian subsidiaries that were acquired as a part of the Lipman acquisition have been notified of assessments regarding Brazilian customs penalties that relate to alleged infractions in the importation of goods. The assessments were issued by the Federal Revenue Department in the City of Vitória, the City of São Paulo, and the City of Itajai. The assessments relate to asserted deficiencies initially totaling 26.9 million Brazilian reais (approximately $15.3 million) excluding interest. The tax authorities allege that the structure used for the importation of goods was simulated with the objective of evading taxes levied on the importation by under-invoicing the imported goods. The tax authorities allege that the simulation was created through a fraudulent interposition of parties, where the real sellers and buyers of the imported goods were hidden.
In the Vitória tax assessment, the fines were reduced from 4.7 million Brazilian reais (approximately $2.7 million) to 1.5 million Brazilian reais (approximately $0.8 million) on a first level administrative decision on January 26, 2007. The proceeding has been remitted to the Taxpayers Council to adjudicate the appeal of the first level administrative decision filed by the tax authorities. We also appealed the first level administrative decision on February 26, 2007. In this appeal, we argued that the tax authorities did not have enough evidence to determine that the import transactions were indeed fraudulent and that, even if there were some irregularities in such importations, they could not be deemed to be our responsibility since all the transactions were performed by the third-party importer of the goods. On February 27, 2008, the Taxpayers Council rendered its decision to investigate the first level administrative decision for further analysis of the matter. This proceeding was initially scheduled for judgment before the decision of the Taxpayers Administrative Council of Tax Appeals in 2009, but has been postponed to the next judgment session. In the event we receive an adverse ruling from the Taxpayers Council, we will decide whether or not to appeal to the judicial level. Based on our current understanding of the underlying facts, we believe that it is probable that our Brazilian subsidiary will be required to pay some amount of fines. At October 31, 2009, we have accrued 4.7 million Brazilian reais (approximately $2.7 million) for this matter, excluding interest, which we believe is the probable payment.
On July 12, 2007, we were notified of a first administrative level decision rendered in the São Paulo tax assessment, which maintained the total fine of 20.2 million Brazilian reais (approximately $11.5 million), imposed. On August 10, 2007, we appealed the first administrative level decision to the Taxpayers Council. A hearing was held on August 12, 2008 before the Taxpayers Council, and on October 14, 2008, the Taxpayers Council granted our appeal and dismissed the São Paulo assessment based upon the assessment being erroneously calculated on the value of the sale of the products in question to end customers in the local market rather than on the declared importation value of such products. We were subsequently notified of the Taxpayers
37
Table of Contents
Council’s decision and the case was dismissed on May 19, 2009. In August 2009, the Brazilian tax authorities requested additional materials from us. In October 2009, we received a revised assessment in this matter of 1.9 million Brazilian reais (approximately $1.1 million). In addition, pursuant to a contingency legal representation agreement entered into between our Brazilian subsidiary (prior to the Lipman acquisition) and Brazilian counsel, our Brazilian subsidiary has agreed to pay to Brazilian counsel legal fees in the amount of 5.0 million Brazilian reais (approximately $2.8 million) for achieving the successful dismissal of the São Paulo tax assessment. We paid approximately 2.0 million Brazilian reais (approximately $1.1 million) of this legal fee during the fourth quarter of fiscal 2009 and will pay the remainder over the next 12 months. At October 31, 2009, we have reduced the accrual for this matter to 4.6 million Brazilian reais (approximately $2.6 million), including the remaining Brazilian counsel legal fees.
On May 22, 2008, we were notified of a first administrative level decision rendered in the Itajai assessment, which maintained the total fine of 2.0 million Brazilian reais (approximately $1.1 million), imposed, excluding interest. On May 27, 2008, we appealed the first level administrative level decision to the Taxpayers Council. Based on our current understanding of the underlying facts, we believe that it is probable that our Brazilian subsidiary will be required to pay some amount of fines. Accordingly, at October 31, 2009, we have accrued 2.0 million Brazilian reais (approximately $1.1 million) for this matter, excluding interest.
Patent Infringement and Commercial Litigation
Heartland Payment Systems, Inc.
On September 6, 2009, we commenced an action in the United States District Court for the Northern District of California against Heartland Payment Systems, Inc. (“Heartland”), a card payment processor, for infringement of U.S. Patent No. 6,853,093 by certain Heartland payment terminals. We are seeking a judgment of infringement, an injunction against further infringement, damages, interest and attorneys’ fees. On September 16, 2009, Heartland sued us in the Superior Court of New Jersey, Mercer County, alleging certain unfair business activities. On October 13, 2009, we amended our original complaint to request declaratory judgment that we did not engage in such unfair business activities. On November 6, 2009, we filed a second lawsuit against Heartland in the United States District Court for the Northern District of California, alleging certain false advertising and unfair competition claims. On that same day, Heartland also filed a second lawsuit against us in the United States District Court, District of New Jersey, alleging trademark infringement, false advertising and violation of the Anti-cybersquatting Protection Act, and an emergency application for a temporary restraining order which was subsequently denied by the New Jersey District Court. A preliminary injunction hearing in the matter is scheduled in December 2009 before the New Jersey District Court. These actions are in the preliminary stages and at this time we are not able to predict the outcome or quantify any potential liability, if any, for these actions. An unfavorable outcome could have a material adverse effect on our business, financial condition, results of operations, and cash flow.
SPA Syspatronic AG v. VeriFone Holdings, Inc., VeriFone, Inc., et al.
On September 18, 2007, SPA Syspatronic AG (“SPA”) commenced an action in the United States District Court for the Eastern District of Texas, Marshall Division, against us and others, alleging infringement of U.S. Patent No. 5,093,862 purportedly owned by SPA. SPA is seeking a judgment of infringement, an injunction against further infringement, damages, interest and attorneys’ fees. We filed an answer and counterclaims on November 8, 2007, and intend to vigorously defend this litigation. On January 28, 2008, we requested that the U.S. Patent and Trademark Office (the “PTO”) perform a re-examination of the patent. The PTO granted the request on April 4, 2008. We then filed a motion to stay the proceedings with the court and on April 25, 2008, the court agreed to stay the proceedings pending the re-examination. On December 19, 2008, the PTO rejected all claims of the subject patent on the same basis as was identified in our request for re-examination. The case is still in the preliminary stages, and it is not possible to quantify the extent of our potential liability, if any, related to this action. An unfavorable outcome could have a material adverse effect on our business, financial condition, results of operations, and cash flow.
38
Table of Contents
Cardsoft, Inc. et al v. VeriFone Holdings, Inc., VeriFone, Inc., et al.
On March 6, 2008, Cardsoft, Inc. and Cardsoft (Assignment for the Benefit of Creditors), LLC (“Cardsoft”) commenced an action in the United States District Court for the Eastern District of Texas, Marshall Division, against us and others, alleging infringement of U.S. Patents No. 6,934,945 and No. 7,302,683 purportedly owned by Cardsoft. Cardsoft is seeking a judgment of infringement, an injunction against further infringement, damages, interest and attorneys’ fees. We intend to vigorously defend this litigation. The case is still in the preliminary stages, and it is not possible to quantify the extent of our potential liability, if any, related to this action. An unfavorable outcome could have a material adverse effect on our business, financial condition, results of operations, and cash flow.
Communication Transaction Solutions, Inc. v. VeriFone Holdings, Inc., VeriFone, Inc., et al.
We were a defendant in an action initiated in the California Superior Court in Santa Clara County on August 30, 2006, in which the plaintiff alleged among other things misappropriation of trade secrets in connection with our development of our wireless pay-at-the-table system. These allegations followed our decision in October 2005 to terminate discussions regarding a possible acquisition of the plaintiff’s business. The plaintiff sought damages, interest and attorneys’ fees. The parties argued summary judgment motions on September 4, 2008 and on September 11, 2008, the court dismissed certain of the plaintiffs’ claims. In January 2009, without admitting any misappropriation of trade secrets, wrongdoing or violation of law and to avoid the distraction and expense of continued litigation, we settled the litigation with the plaintiff. In exchange for a payment of $3.0 million by us, all asserted claims were dismissed and we received a perpetual, fully paid-up license to all plaintiff intellectual property and trade secrets asserted in the lawsuit.
Class Action and Derivative Lawsuits
On or after December 4, 2007, several securities class action claims were filed against us and certain of our officers, former officers, and a former director. These lawsuits were consolidated in the U.S. District Court for the Northern District of California as In re VeriFone Holdings, Inc. Securities Litigation, C 07-6140 MHP. The original actions were: Eichenholtz v. VeriFone Holdings, Inc. et al., C 07-6140 MHP; Lien v. VeriFone Holdings, Inc. et al., C 07-6195 JSW; Vaughn et al. v. VeriFone Holdings, Inc. et al., C 07-6197 VRW (Plaintiffs voluntarily dismissed this complaint on March 7, 2008); Feldman et al. v. VeriFone Holdings, Inc. et al., C 07-6218 MMC; Cerini v. VeriFone Holdings, Inc. et al., C 07-6228 SC; Westend Capital Management LLC v. VeriFone Holdings, Inc. et al., C 07-6237 MMC; Hill v. VeriFone Holdings, Inc. et al., C 07-6238 MHP; Offutt v. VeriFone Holdings, Inc. et al., C 07-6241 JSW; Feitel v. VeriFone Holdings, Inc., et al., C 08-0118 CW. On August 22, 2008, the court appointed plaintiff National Elevator Fund lead plaintiff and its attorneys lead counsel. Plaintiff filed its consolidated amended class action complaint on October 31, 2008, which asserts claims under the Securities Exchange Act Sections 10(b), 20(a), and 20A and Securities and Exchange Commission Rule 10b-5 for securities fraud and control person liability against us and certain of our current and former officers and directors, based on allegations that we and the individual defendants made false or misleading public statements regarding our business and operations during the putative class periods and seeks unspecified monetary damages and other relief. We filed our motion to dismiss on December 31, 2008. The court granted our motion on May 26, 2009 and dismissed the consolidated amended class action complaint with leave to amend within 30 days of the ruling. The proceedings were stayed pending a mediation held in October 2009 at which time the parties failed to reach a mutually agreeable settlement. Plaintiffs’ second amended complaint was filed on December 3, 2009 and our responsive motion is due on January 25, 2010. Although discovery has not yet commenced in this action, on November 20, 2009, plaintiffs filed a motion to partially lift the Private Securities Litigation Reform Act discovery stay in order to obtain documents produced by us to the SEC in connection with the SEC’s investigation into the restatement of our fiscal year 2007 interim financial statements. Our opposition to this motion is due January 11, 2010, with a hearing on the motion scheduled for February 1, 2010. At this time, we have not recorded any liabilities related to this action as we are unable to estimate any potential liability.
39
Table of Contents
Beginning on December 13, 2007, several actions were also filed against certain current and former directors and officers derivatively on our behalf. These derivative lawsuits were filed in: (1) the U.S. District Court for the Northern District of California, as In re VeriFone Holdings, Inc. Shareholder Derivative Litigation, Lead Case No. C 07-6347 MHP, which consolidates King v. Bergeron, et al. (Case No. 07-CV-6347), Hilborn v. VeriFone Holdings, Inc., et al. (Case No. 08-CV-1132), Patel v. Bergeron, et al. (Case No. 08-CV-1133), and Lemmond, et al. v. VeriFone Holdings, Inc., et al. (Case No. 08-CV-1301); and (2) California Superior Court, Santa Clara County, as In re VeriFone Holdings, Inc. Derivative Litigation, Lead Case No. 1-07-CV-100980, which consolidates Catholic Medical Mission Board v. Bergeron, et al. (Case No. 1-07-CV-100980), and Carpel v. Bergeron, et al. (Case No. 1-07-CV-101449). On May 15, 2008, the court in the federal derivative action appointed Charles R. King as lead plaintiff and his attorneys as lead counsel. On October 31, 2008, plaintiffs in the federal action filed their consolidated amended derivative complaint, which names us as a nominal defendant and brings claims for insider selling, breach of fiduciary duty, unjust enrichment, waste of corporate assets and aiding and abetting breach of fiduciary duty against us and certain of our current and former officers and directors. On December 15, 2008, we and the other defendants filed a motion to dismiss. The parties agreed by stipulation that briefing on this motion would relate only to the issue of plaintiffs’ failure to make a pre-suit demand on our Board of Directors. The court granted our motion on May 26, 2009 and dismissed the consolidated amended derivative complaint with leave to amend within 30 days of the ruling. The proceedings were stayed pending a mediation held in October 2009 at which time the parties failed to reach a mutually agreeable settlement. Plaintiffs’ second amended complaint was filed on December 10, 2009 and our responsive motion is due on January 25, 2010. While discovery is not yet underway in this action, on June 9, 2009, plaintiffs in the federal derivative action made a demand to inspect certain of our books and records. In response to this demand, we provided certain of our books and records, including minutes and materials for our Board of Directors, Audit Committee and Compensation Committee meetings for the relevant period. We produced documents responsive to each category of plaintiffs’ request except that we withheld production, on the basis of privilege, of the Audit Committee’s report of the independent investigation into the events leading to the restatement of our fiscal year 2007 interim financial statements. On November 6, 2009, plaintiffs filed a complaint in Delaware Chancery Court seeking to compel production of the independent investigation report. We filed a motion to dismiss this complaint on December 3, 2009, and our opening brief in support of the motion to dismiss is due in January 2010. At this time, we have not recorded any liabilities for this action as we are unable to estimate any potential liability.
On October 31, 2008, the derivative plaintiffs filed their consolidated derivative complaint in California Superior Court for the County of Santa Clara naming us as a nominal defendant and bringing claims for insider selling, breach of fiduciary duty, unjust enrichment, waste of corporate assets and aiding and abetting breach of fiduciary duty against certain of our current and former officers and directors and our largest shareholder as of October 31, 2008, GTCR Golder Rauner. On November 10, 2008, we filed a motion to stay the state court action pending resolution of the parallel federal actions, and the parties have agreed by stipulation to delay briefing on the motion to stay until after the issue of demand futility is resolved in the federal derivative case. The case management conference in the state court action has been continued until April 2010, pending the resolution of our motion to dismiss filed in the federal derivative action. At this time, we have not recorded any liabilities for this action as we are unable to estimate any potential liability.
On January 27, 2008, a class action complaint was filed against us in the Central District Court in Tel Aviv, Israel on behalf of purchasers of our stock on the Tel Aviv Stock Exchange. The complaint seeks compensation for damages allegedly incurred by the class of plaintiffs due to the publication of erroneous financial reports. We filed a motion to stay the action, in light of the proceedings already filed in the United States, on March 31, 2008. A hearing on the motion was held on May 25, 2008. Further briefing in support of the stay motion, specifically with regard to the threshold issue of applicable law, was submitted on June 24, 2008. On September 11, 2008, the Israeli District Court ruled in our favor, holding that U.S. law would apply in determining our liability. On October 7, 2008, plaintiffs filed a motion for leave to appeal the District Court’s ruling to the Israeli Supreme Court. Our response to plaintiffs’ appeal motion was filed on January 18, 2009. Because our motion to stay will depend upon the Supreme Court’s ruling, the District Court has stayed its proceedings until the Supreme Court
40
Table of Contents
rules on plaintiffs’ motion for leave to appeal. The hearing on plaintiffs’ motion in the Supreme Court is set for January 11, 2010. At this time, we have not recorded any liabilities for this action as we are unable to estimate any potential liability.
Certain of the foregoing cases are still in the preliminary stages, and we are not able to quantify the extent of our potential liability, if any. An unfavorable outcome in any of these matters could have a material adverse effect on our business, financial condition, results of operations, and cash flows. In addition, defending these legal proceedings is likely to be costly and may divert management’s attention from the day-to-day operations of our business.
Regulatory Actions
We have responded to inquiries and provided information and documents related to the restatement of our fiscal year 2007 interim financial statements to the Securities and Exchange Commission, the Department of Justice, the New York Stock Exchange and the Chicago Board Options Exchange. The SEC interviewed several current and former officers and employees.
On February 18, 2009, we received a “Wells Notice” from the SEC in connection with the investigation by the staff of the SEC’s Division of Enforcement (the “Staff”) notifying us that the Staff intends to recommend that the SEC bring a civil injunctive action against us, alleging violations of the federal securities laws arising from the restatement of our fiscal year 2007 interim financial statements. We submitted our response to the Wells Notice on March 18, 2009. On September 1, 2009, without admitting or denying the SEC’s allegations, we agreed to a permanent injunction against future violations of certain reporting, books and records and internal accounting control provisions of the federal securities laws. No other charge or monetary penalty was assessed against us, and we cooperated fully with the Commission’s investigation. This settlement, which was approved by the United States District Court for the Northern District of California in November 2009, concluded the SEC’s investigation of this matter with respect to us.
Other Litigation
We are subject to various other legal proceedings related to commercial, customer, and employment matters that have arisen during the ordinary course of business. Although there can be no assurance as to the ultimate disposition of these matters, our management has determined, based upon the information available at the date of these financial statements, that the expected outcome of these matters, individually or in the aggregate, will not have a material adverse effect on our consolidated financial position, results of operations or cash flows.
| ITEM 4. | SUBMISSION OF MATTERS TO A VOTE OF SECURITY HOLDERS |
None
41
Table of Contents
| ITEM 5. | MARKET FOR THE REGISTRANT’S COMMON EQUITY, RELATED STOCKHOLDER MATTERS AND ISSUER PURCHASES OF EQUITY SECURITIES |
Our common stock has been quoted on the New York Stock Exchange under the symbol “PAY” since April 29, 2005. Prior to that time, there was no public market for our stock.
The following table sets forth for the indicated periods, the high and low sale prices of our common stock.
| Fiscal 2009 Quarter Ended | Fiscal 2008 Quarter Ended | |||||||||||||||||||||||
| Jan. 31 2009 |
Apr. 30 2009 |
Jul. 31 2009 |
Oct. 31 2009 |
Jan. 31 2008 |
Apr. 30 2008 |
Jul. 31 2008 |
Oct. 31 2008 | |||||||||||||||||
| High |
$ | 12.23 | $ | 8.36 | $ | 9.28 | $ | 16.15 | $ | 49.79 | $ | 21.12 | $ | 16.14 | $ | 21.17 | ||||||||
| Low |
$ | 2.31 | $ | 3.65 | $ | 5.92 | $ | 8.75 | $ | 15.59 | $ | 10.10 | $ | 10.75 | $ | 8.53 | ||||||||
On October 30, 2009, the closing sale price of our common stock on the New York Stock Exchange was $13.30 and on December 15, 2009, the closing sale price of our common stock on the New York Stock Exchange was $15.46. As of December 15, 2009, there were approximately 40 stockholders of record. Because many shares of our common stock are held by brokers and other institutions on behalf of stockholders, we are unable to estimate the total number of stockholders represented by these holders of record.
Dividend Policy
We have not declared or paid cash dividends on our capital stock in our most recent four full fiscal years. We do not expect to pay any cash dividends for the foreseeable future. We currently intend to retain any future earnings to finance our operations and growth. Any future determination to pay cash dividends will be at the discretion of our board of directors and will be dependent on earnings, financial condition, operating results, capital requirements, any contractual restrictions, and other factors that our board of directors deems relevant. In addition, our Credit Facility contains limitations on the ability of our principal operating subsidiary, VeriFone, Inc., to declare and pay cash dividends. Because we conduct our business through our subsidiaries, as a practical matter these restrictions similarly limit our ability to pay dividends on our common stock.
Securities Authorized for Issuance Under Equity Compensation Plans
Information with respect to Securities Authorized for Issuance Under Equity Compensation may be found in “Item 12 — Security Ownership of Certain Beneficial Owners and Management and Related Stockholder Matters — Equity Compensation Plan Information,” which section is incorporated herein by reference.
42
Table of Contents
Performance Graph
The following graph and table:
| • | compares the performance of an investment in our common stock over the period of April 29, 2005 through October 31, 2009 beginning with an investment at the closing market price on April 29, 2005, the end of the first day our common stock traded on the exchange following our initial public offering, and thereafter, based on the closing price of our common stock on the market, with the S&P 500 Index and a selected peer group index (the “Comparables Index”). The Comparables Index was selected on an industry basis and includes Ingenico S.A., Hypercom Corp., International Business Machines Corp., MICROS Systems, Inc., NCR Corp. and Radiant Systems, Inc. |
| • | assumes $100 was invested on the start date at the price indicated and that dividends, if any, were reinvested on the date of payment without payment of any commissions. The performance shown in the graph and table represents past performance and should not be considered an indication of future performance. |
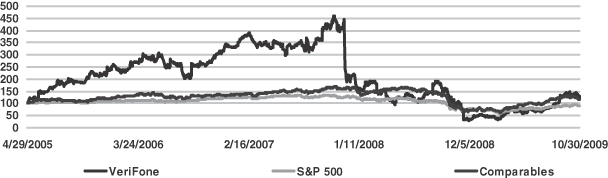
| April 29, 2005 |
October 31, 2005 |
October 31, 2006 |
October 31, 2007 |
October 31, 2008 |
October 31, 2009 | |||||||||||||
| VeriFone Holdings, Inc. |
$ | 100.00 | $ | 215.81 | $ | 271.72 | $ | 459.81 | $ | 105.67 | $ | 123.72 | ||||||
| S&P 500 Index |
$ | 100.00 | $ | 104.34 | $ | 119.11 | $ | 133.93 | $ | 83.74 | $ | 89.57 | ||||||
| Comparables Index |
$ | 100.00 | $ | 112.71 | $ | 131.58 | $ | 172.03 | $ | 88.38 | $ | 116.71 | ||||||
The information provided above under the heading “Performance Graph” shall not be considered “filed” for purposes of Section 18 of the Securities Exchange Act of 1934 or incorporated by reference in any filing under the Securities Act of 1933 or the Securities Exchange Act of 1934.
43
Table of Contents
| ITEM 6. | SELECTED FINANCIAL DATA |
The following selected consolidated financial data should be read in conjunction with our consolidated financial statements and the accompanying notes and “Item 7 — Management’s Discussion and Analysis of Financial Condition and Results of Operations” included elsewhere in this report. The selected data in this section is not intended to replace the consolidated financial statements.
| Fiscal Year Ended October 31, | ||||||||||||||||||||
| 2009 (1) | 2008 (2) | 2007 (3) | 2006 | 2005 | ||||||||||||||||
| (In thousands, except per share data) | ||||||||||||||||||||
| Consolidated Statements of Operations Data: |
||||||||||||||||||||
| Net revenues |
$ | 844,714 | $ | 921,931 | $ | 902,892 | $ | 581,070 | $ | 485,367 | ||||||||||
| Cost of net revenues |
562,585 | 628,900 | 603,660 | 319,525 | 288,542 | |||||||||||||||
| Gross profit |
282,129 | 293,031 | 299,232 | 261,545 | 196,825 | |||||||||||||||
| Operating expenses: |
||||||||||||||||||||
| Research and development |
65,148 | 75,622 | 65,430 | 47,353 | 41,830 | |||||||||||||||
| Sales and marketing |
73,544 | 91,457 | 96,295 | 58,607 | 52,231 | |||||||||||||||
| General and administrative |
76,468 | 126,625 | 80,704 | 42,573 | 29,609 | |||||||||||||||
| Impairment of goodwill and intangible assets |
175,512 | 289,119 | — | — | — | |||||||||||||||
| Amortization of purchased intangible assets |
20,423 | 26,033 | 21,571 | 4,703 | 4,967 | |||||||||||||||
| In-process research and development |
— | — | 6,752 | — | — | |||||||||||||||
| Total operating expenses |
411,095 | 608,856 | 270,752 | 153,236 | 128,637 | |||||||||||||||
| Operating income (loss) |
(128,966 | ) | (315,825 | ) | 28,480 | 108,309 | 68,188 | |||||||||||||
| Interest expense |
(12,481 | ) | (28,413 | ) | (36,598 | ) | (13,617 | ) | (15,384 | ) | ||||||||||
| Interest income |
1,517 | 5,981 | 6,702 | 3,372 | 598 | |||||||||||||||
| Other income (expense), net |
11,340 | (13,181 | ) | (7,882 | ) | (6,394 | ) | (6,673 | ) | |||||||||||
| Income (loss) before income taxes |
(128,590 | ) | (351,438 | ) | (9,298 | ) | 91,670 | 46,729 | ||||||||||||
| Provision for income taxes |
9,246 | 73,884 | 24,718 | 32,159 | 13,490 | |||||||||||||||
| Net income (loss) |
$ | (137,836 | ) | $ | (425,322 | ) | $ | (34,016 | ) | $ | 59,511 | $ | 33,239 | |||||||
| Net income (loss) per common share: |
||||||||||||||||||||
| Basic |
$ | (1.63 | ) | $ | (5.05 | ) | $ | (0.41 | ) | $ | 0.90 | $ | 0.57 | |||||||
| Diluted |
$ | (1.63 | ) | $ | (5.05 | ) | $ | (0.41 | ) | $ | 0.86 | $ | 0.54 | |||||||
| Weighted average shares used in computing net income (loss) per common share: |
||||||||||||||||||||
| Basic |
84,473 | 84,220 | 82,194 | 66,217 | 58,318 | |||||||||||||||
| Diluted |
84,473 | 84,220 | 82,194 | 68,894 | 61,460 | |||||||||||||||
| As of October 31, | ||||||||||||||||||||
| 2009 | 2008 | 2007 (4) | 2006 | 2005 | ||||||||||||||||
| (In thousands) | ||||||||||||||||||||
| Consolidated Balance Sheets Data: |
||||||||||||||||||||
| Cash and cash equivalents |
$ | 324,996 | $ | 157,160 | $ | 215,001 | $ | 86,564 | $ | 65,065 | ||||||||||
| Total assets |
918,910 | 1,079,752 | 1,547,309 | 452,945 | 327,352 | |||||||||||||||
| Long-term debt and capital leases, including current portion |
509,864 | 548,379 | 553,152 | 192,889 | 182,806 | |||||||||||||||
| (1) | We recorded $175.5 million of goodwill impairment charges in fiscal year 2009 after we concluded that the carrying amount of the North America and Asia reporting units exceeded their implied fair values. We repurchased and extinguished $33.5 million par value of our outstanding 1.375% Convertible Notes for |
44
Table of Contents
| $19.8 million, excluding accrued interest paid. As a result, we realized a $13.1 million gain on these transactions, net of a $0.6 million write-off of related deferred debt issuance costs. We reduced our accrual for Brazilian customs penalties by $14.9 million (28.2 million Brazilian reais) as a result of the dismissal of one of the assessments. Of this amount, $9.8 million was reversed against general and administrative expenses and $5.1 million was reversed against interest expense. This reduction was partially offset by the accrual for legal fees related to a contingency legal representation agreement entered into between one of our Brazilian subsidiaries (prior to our acquisition of that subsidiary from Lipman) and Brazilian counsel pursuant to which our Brazilian subsidiary has agreed to pay to Brazilian counsel legal fees in the amount of $2.8 million (5.0 million Brazilian reais) for achieving the successful dismissal of the assessment. These legal fees were accrued and included in general and administrative expenses in the third quarter of fiscal year 2009. |
| (2) | Our fiscal year 2008 results of operations include $41.8 million of general and administrative costs related to the restatement of interim financial information for the first three quarters of the fiscal year ended October 31, 2007 which we completed during fiscal year 2008. We recorded a $262.5 million impairment of our goodwill in our EMEA reporting unit and a $26.6 million impairment of developed and core technology intangible assets due to lower revenue expectations in light of current operating performance and future operating expectations. We also recognized a $62.3 million income tax expense for recording a full valuation allowance against all beginning of the year balances for U.S. deferred tax assets. |
| (3) | We acquired Lipman on November 1, 2006 and its results of operations are included from the date of acquisition. We also recognized an in-process research and development expense of $6.8 million in connection with our Lipman acquisition. |
| (4) | In November 2006, we increased our outstanding balance on our Term B Loan to $500.0 million. In June 2007, we sold $316.2 million of 1.375% Senior Convertible Notes due 2012. We repaid $263.8 million of our outstanding Term B Loan with the proceeds from the sale of the 1.375% Senior Convertible Notes. |
45
Table of Contents
| ITEM 7. | MANAGEMENT’S DISCUSSION AND ANALYSIS OF FINANCIAL CONDITION AND RESULTS OF OPERATIONS |
This section and other parts of this Form 10-K contain forward-looking statements that involve risks and uncertainties. In some cases, forward-looking statements can be identified by words such as “anticipates,” “expects,” “believes,” “intends,” “potential,” “continues,” “plans,” “predicts,” and similar terms. Such forward-looking statements are based on current expectations, estimates, and projections about our industry, and management’s beliefs and assumptions. Forward-looking statements are not guarantees of future performance and our actual results may differ significantly from the results discussed in the forward-looking statements. Factors that might cause such differences include, but are not limited to, those discussed in “Item 1A — Risk Factors” above. The following discussion should be read in conjunction with the consolidated financial statements and notes thereto included elsewhere in this Form 10-K. Unless required by law, we undertake no obligation to update any forward-looking statements, whether as result of new information, future events, or otherwise.
Overview
We are a global leader in secure electronic payment solutions. We provide system solutions and services that add value to the point of sale and back-office systems for financial, retail, hospitality, petroleum, government, transportation and healthcare vertical markets. We are one of the largest providers of electronic payment systems worldwide. We believe that we benefit from a number of competitive advantages gained through our 28-year history of success in our industry. These advantages include our globally trusted brand name, large installed base, significant involvement in the development of industry standards, global operating scale, customizable platforms, and investment in research and development. We believe that these advantages position us well to capitalize on the continuing global shift toward electronic payment transactions.
Our industry’s growth continues to be driven by the long-term shift toward electronic payment transactions and away from cash and checks in addition to changes in security standards that require more advanced electronic payment systems. Internationally, growth rates have continued to be higher because of the relatively low penetration rates of electronic payment transactions in many countries as well as governmental efforts to modernize economies and use electronic payments as a means of improving collection of value-added tax (“VAT”) and sales tax. Recently, additional factors have driven growth, including the shift from dial up to internet protocol (“IP”), developments in wireless communications, personal identification number (“PIN”) based debit transactions and advances in computing technology which enable vertical solutions and non-payment applications to reside at the point of sale (“POS”). Most recently, there have been well publicized breaches of POS and back-office systems that handle consumer card details, spurring widespread interest in more secure payment terminals and “end-to-end” encryption technology.
Revenues recognized in our fiscal quarters have tended to be back-end weighted as we receive sales orders and deliver our System Solutions toward the end of each fiscal quarter. This back-end weighting of orders may adversely affect our results of operations in a number of ways and could negatively impact revenues and profits. First, the product mix of orders may not align with the forecast provided to our contract manufacturers, internal manufacturing site or component suppliers, and we could experience a shortage of the components needed for production. Second, existing manufacturing capacity may not be sufficient to deliver a high volume of orders in a concentrated time at quarter-end. Third, back-end weighted demand could negatively impact gross margins through higher labor, delivery and other manufacturing costs. If, on the other hand, we were to manage the fulfillment of back-end weighted orders through holding increased inventory levels, higher inventory obsolescence charges could occur.
Because timing of our revenue recognition depends on timing of product shipments, decisions we make about product shipments, particularly toward the end of a fiscal quarter, may impact our reported revenues. The timing of product shipments may depend on a number of factors, including price discussions with our customers, operating costs, including costs of air shipments if required, delivery date requested by customers and our
46
Table of Contents
operating capacity to fill orders and ship products, as well as our long and short-term business plan, all of which may affect timing of shipment as well as revenues recognized for a particular period.
Security has become a driving factor in our business as our customers endeavor to meet ever escalating governmental requirements directed toward the prevention of identity theft as well as operating safeguards imposed by the credit and debit card associations, of which include Visa International (“Visa”), MasterCard Worldwide (“MasterCard”), American Express, Discover Financial Services, and JCB Co., Ltd. (“JCB”) are members. In September 2006, these card associations established the PCI SSC to oversee and unify industry standards in the areas of credit card data security. Standards include PCI-PED for pin entry devices, PCI-DSS for enterprise data security and PA-DSS for payment application data security. We are a leader in providing systems and software solutions that meet these standards.
We operate in two business segments: North America and International. We define North America as the United States and Canada, and International as all other countries from which we derive revenues.
Throughout fiscal year 2009 demand for wireless, IP-enabled, PIN-based debit and enhanced security systems was adversely affected by the global financial crisis. Specifically, we experienced lower North American demand as retailers closed redundant or underperforming locations and lower International demand due to the adverse foreign currency impact on the purchasing power of certain International customers. With the exception of China, emerging markets declined at a greater rate than developed markets in fiscal year 2009. To the extent the worldwide economic recession continues, we expect demand in certain emerging economies such as China to grow faster relative to our developed markets, but other emerging market economies perform worse than developed markets due to weak commodity prices and political instability. We continue to devote research and development (“R&D”) resources to address the market needs of both emerging and developed economies.
Results of Operations
Net Revenues
We generate net revenues through the sale of our electronic payment systems and solutions that enable electronic transactions, which we identify as System Solutions, and to a lesser extent, warranty and support services, field deployment, installation and upgrade services, and customer specific application development, which we identify as Services.
Net revenues, which include System Solutions and Services, are summarized in the following table (in thousands, except percentages):
| Fiscal Year Ended October 31, | ||||||||||||||||||||||
| 2009 | Change | % Change | 2008 | Change | % Change | 2007 | ||||||||||||||||
| System Solutions |
$ | 727,650 | $ | (79,815 | ) | -9.9 | % | $ | 807,465 | $ | 15,176 | 1.9 | % | $ | 792,289 | |||||||
| Services |
117,064 | 2,598 | 2.3 | % | 114,466 | 3,863 | 3.5 | % | 110,603 | |||||||||||||
| Total |
$ | 844,714 | $ | (77,217 | ) | -8.4 | % | $ | 921,931 | $ | 19,039 | 2.1 | % | $ | 902,892 | |||||||
System Solutions Revenues
System Solutions net revenues decreased $79.8 million, or 9.9%, to $727.7 million for the fiscal year ended October 31, 2009 from $807.5 million for the fiscal year ended October 31, 2008. System Solutions net revenues comprised 86.1% of total net revenues for the fiscal year ended October 31, 2009 as compared to 87.6% for the fiscal year ended October 31, 2008.
International System Solutions net revenues for the year ended October 31, 2009 decreased $67.8 million, or 13.4%, compared to the year ended October 31, 2008, primarily due to a $45.5 million, or 26.1% decline in Latin
47
Table of Contents
America and a $33.0 million, or 12.5% decrease in Europe, partially offset by a $10.7 million, or 15.8% increase in Asia. In Latin America, the decreases in System Solutions net revenues were primarily driven by decreased sales in Brazil and Venezuela due to the economic contraction and falling local currencies throughout most of the year, and a reduction in purchasing from one large Brazilian customer for the first three quarters of fiscal year 2009. In Europe, the decline was primarily attributable to the weak economic conditions in Russia and Spain, partially offset by growth relating to shipments to new financial customers in the United Kingdom and certain Nordic countries. Asia revenue growth was predominately attributable to revenue growth in China, where our sales have been less impacted than other countries by the global recession.
North America System Solutions net revenues for the year ended October 31, 2009 decreased $12.0 million or 4.0% compared to the year ended October 31, 2008, primarily due to a decrease in our U.S. Financial business and Canada revenues. Our U.S. Financial business, which sells payment systems to small and medium sized businesses through ISOs and payment processors, was constrained overall due to persistent adverse economic conditions which have slowed retail store openings. Multi-lane retail System Solutions sales were approximately flat as the majority of large customers completed their upgrade programs and sales activity diminished in the second half of the fiscal year. Partially offsetting this decline was an increase in Petroleum System Solutions revenues as this customer group in the second half of the fiscal year began to address the July 2010 PCI-PED compliance deadlines.
The weakened macroeconomic environment negatively impacted our net revenues for the fiscal year ended October 31, 2009. Although more recently there have been some signs of improvement in the functioning of financial markets and economic conditions, we are unable to predict the likely duration of such improvements in the U.S. and other countries. A subsequent deterioration of such conditions, if persistent, would adversely impact our business, operating results, and financial condition.
System Solutions net revenues increased $15.2 million, or 1.9%, to $807.5 million for the fiscal year ended October 31, 2008 from $792.3 million for the fiscal year ended October 31, 2007. System Solutions net revenues comprised 87.6% of total net revenues for the fiscal year ended October 31, 2008 as compared to 87.8% for the fiscal year ended October 31, 2007.
International System Solutions net revenues for the fiscal year ended October 31, 2008 increased $56.3 million, or 12.5%, to $506.9 million compared to the fiscal year ended October 31, 2007. Latin American net revenues increased $31.6 million, or 22.1% to $174.6 million, European net revenues increased $19.4 million, or 7.9%, to $264.6 million, and net revenues in Asia increased $5.3 million, or 8.5%, to $67.7 million, compared to the fiscal year ended October 31, 2007. In Latin America, our System Solutions net revenues from Brazil financial markets were favorably impacted by the public offering of one of our largest Brazilian customers and increased demand in Brazil for prepaid top-ups, medical and healthcare system solutions. Mexico revenues declined due to a less favorable tax regime relating to a government sponsored terminalization program. European net revenues increased slightly due to improved supply chain and sales execution compared to the fiscal year ended October 31, 2007. However, revenues were adversely impacted by increased pricing competition from our principal competitors in Europe and Latin America and local competitors in Asia.
North America System Solutions net revenues for the fiscal year ended October 31, 2008 decreased $41.2 million, or 12.0%, to $300.6 million compared to the fiscal year ended October 31, 2007. The largest declines were in the U.S. Financial business and Petroleum System Solutions business. Our U.S. Financial business was constrained overall due to adverse economic conditions which slowed retail store openings. Petroleum Solutions sales continued to decline due to an unfavorable economic climate and high petroleum prices for the majority of the year which affected the retail Petroleum market. The decline in revenue was partially offset by strong sales in multi-lane retail, reflecting deployments which address enhanced PCI-DSS requirements.
48
Table of Contents
Services Revenues
Services net revenues increased $2.6 million, or 2.3% for the fiscal year ended October 31, 2009 compared to the fiscal year ended October 31, 2008 primarily due to the growth in our European software maintenance and extended warranty services, partially offset by a reduction in custom software projects for our Petroleum customers.
Services net revenues increased $3.9 million, or 3.5%, for the fiscal year ended October 31, 2008 compared to the fiscal year ended October 31, 2007. During this period we experienced International service revenue growth in Brazil and Asia which was partially offset by a decline in European refurbishment contracts. North America revenue growth was approximately flat with higher taxicab related services offsetting a decline in Petroleum related services.
Gross Profit
The following table shows the gross profit and gross profit percentages for System Solutions and Services (in thousands, except percentages):
| Fiscal Year Ended October 31, | ||||||||||||||||||
| 2009 | 2008 | 2007 | ||||||||||||||||
| Amounts | % | Amounts | % | Amounts | % | |||||||||||||
| System Solutions |
$ | 231,191 | 31.8 | % | $ | 251,423 | 31.1 | % | $ | 246,294 | 31.1 | % | ||||||
| Services |
50,938 | 43.5 | % | 41,608 | 36.3 | % | 52,938 | 47.9 | % | |||||||||
| Total |
$ | 282,129 | 33.4 | % | $ | 293,031 | 31.8 | % | $ | 299,232 | 33.1 | % | ||||||
System Solutions
Gross profit on System Solutions decreased $20.2 million, or 8.0% for the fiscal year ended October 31, 2009 compared to the fiscal year ended October 31, 2008, primarily because of lower revenue levels. Gross profit on System Solutions represented 31.8% and 31.1%, respectively, of System Solutions net revenues for the fiscal years ended October 31, 2009 and 2008. For the fiscal year ended October 31, 2009, our International gross profit percentage improved modestly, our North America gross profit percentage declined slightly and our Corporate costs as a percentage of revenue decreased compared to the fiscal year ended October 31, 2008.
International gross profit percentage improved during the fiscal year ended October 31, 2009 compared to the fiscal year ended October 31, 2008 primarily as a result of a lower mix of sales to certain emerging markets where gross profit percentages are typically lower than gross profit percentages for developed market sales. Additionally, International gross margin benefited from improved sales and operational execution in the United Kingdom. Partially offsetting these improvements was a lower average selling price in Latin America, in part due to the declining purchasing power of customers who experienced currency devaluations and in part due to a program to sell slow moving inventory in the first six months of our fiscal year ended October 31, 2009.
North America System Solutions gross profit percentage declined slightly during the fiscal year ended October 31, 2009 compared to the fiscal year ended October 31, 2008 as sales shifted away from wireless solutions, which typically carry higher than average gross profit percentages and toward lower margin landline solutions. We also experienced increased price competition in our high-end landline financial solutions and a shift in product mix toward lower margin product in our Petroleum business.
Corporate costs are comprised of non-cash acquisition charges, including amortization of purchased core and developed technology assets, and other Corporate charges, including inventory obsolescence and scrap, rework, specific warranty provisions, non-standard freight, over-and-under absorption of materials management and supply chain engineering overhead. Since these costs are generally incurred on a company-wide basis, it is
49
Table of Contents
impractical to allocate them to either the North America or International segment. The decrease in Corporate costs for fiscal year 2009 was primarily a result of a $11.8 million reduction in amortization of core and developed technology assets, a $2.2 million reversal of a warranty claim associated with an acquired product, and a $1.3 million reduction in amortization of step-down in deferred revenue on acquisition. Partially offsetting this decrease was an increase of $11.1 million of excess and obsolescence provision in the first half of fiscal year 2009 in conjunction with the changing demand we experienced in the first half of fiscal year 2009 as a result of the deteriorating macroeconomic environment.
Gross profit on System Solutions increased $5.1 million, or 2.1%, to $251.4 million for the fiscal year ended October 31, 2008 from $246.3 million for the fiscal year ended October 31, 2007. Gross profit on System Solutions represented 31.1% of System Solutions net revenues for the fiscal years ended October 31, 2008 and 2007. Year over year declines in the gross profit percentages in both North America and International segments were offset by a reduction in Corporate costs during the fiscal year ended October 31, 2008.
North America gross profit percentage for the fiscal year ended October 31, 2008 declined compared to fiscal year ended October 31, 2007 primarily due to the growth in Multi-lane System Solutions, which tends to carry lower than average gross margins, and the lower proportion of Petroleum System Solution sales, which tend to carry higher than average gross margins. In addition, during fiscal year ended October 31, 2008 we experienced pricing pressure in both landline and wireless financial solutions. Partially offsetting these decreases was the reduction of sales of a low margin legacy check processing solution for which sales effectively terminated in the first quarter of fiscal year ended October 31, 2007.
International gross profit percentage for fiscal year ended October 31, 2008 declined compared to fiscal year ended October 31, 2007 due to increased price competition in emerging markets countries, including Russia, China, Turkey and Brazil. In addition, certain customers purchased non-PCI compliant inventory at significant discounts. Furthermore, revenues in Latin America, which have historically carried gross margins below International averages, increased proportionally in the fiscal year ended October 31, 2008 compared to the fiscal year ended October 31, 2007.
The overall gross profit percentage for fiscal year ended October 31, 2008 compared to fiscal year ended October 31, 2007 was also negatively impacted by the higher proportion of International net revenues, which typically carry a lower margin than North American net revenues.
Corporate costs for fiscal year ended October 31, 2008 decreased as a percentage of System Solutions net revenues compared to fiscal year ended October 31, 2007 primarily due to a $13.8 million decrease in amortization of inventory step-up and a $5.7 million decrease in amortization of purchased core and developed technology assets as a result of the Lipman acquisition. These amortization expenses amounted to 4.0% of System Solutions net revenues for the fiscal year ended October 31, 2008 compared to 6.5% for the fiscal year ended October 31, 2007. In addition, there was a $11.7 million decrease in excess and obsolescence charges and provisions for purchase of excess components from contract manufacturers, reflecting a reduction in non-PCI related inventory in fiscal year 2008 compared to fiscal year 2007.
Services
Gross profit on Services increased $9.3 million, or 22.4%, for the fiscal year ended October 31, 2009 compared to the fiscal year ended October 31, 2008. Gross profit represented 43.5% of Services net revenues for the fiscal year ended October 31, 2009, compared to 36.3% of Services net revenues for the fiscal year ended October 31, 2008. The majority of this increase was attributable to the improved operational efficiencies in our London service center, cost reduction initiatives associated with our North American call center, and a favorable service mix.
Gross profit on Services decreased $11.3 million, or 21.4%, to $41.6 million for the fiscal year ended October 31, 2008, from $52.9 million for the fiscal year ended October 31, 2007. Gross profit on Services represented 36.3% of Services net revenues for the fiscal year ended October 31, 2008, as compared to 47.9% for
50
Table of Contents
the fiscal year ended October 31, 2007. This decline was primarily due to unfavorable service mix within Europe and, to a lesser extent, a revenue shift towards Latin America and Asia, where gross profit percentages are generally below the International average. In North America, the gross profit percentage declined slightly due to a decline in higher margin upgrade services.
We expect the gross profit percentages, both System Solutions and Services, of our International segment to continue to be lower than the comparable gross profit percentages in our North America segment.
Research and Development Expenses
R&D expenses for the fiscal years ended October 31, 2009, 2008, and 2007 are summarized in the following table (in thousands, except percentages):
| Fiscal Year Ended October 31, | |||||||||||||||||||||||||
| 2009 | Change | % Change | 2008 | Change | % Change | 2007 | |||||||||||||||||||
| Research and development |
$ | 65,148 | $ | (10,474 | ) | -13.9 | % | $ | 75,622 | $ | 10,192 | 15.6 | % | $ | 65,430 | ||||||||||
| Percentage of net revenues |
7.7 | % | 8.2 | % | 7.2 | % | |||||||||||||||||||
R&D expenses for the fiscal year ended October 31, 2009, decreased $10.5 million, or 13.9%, compared to the fiscal year ended October 31, 2008, primarily driven by a $5.2 million decrease in personnel and outside services costs and a $1.9 million decrease in expenditure for engineering supplies and materials. These decreases were due to the cancelling of certain R&D projects as a result of lower anticipated demand caused by the economic downturn, cost reductions in response to global recession and increased savings as a result of favorable foreign currency exchange rates. Additionally, a $0.9 million reduction in restructuring costs in fiscal year ended October 31, 2009 and the non-recurrence of a $2.7 million write-off of capitalized software recorded in fiscal year ended October 31, 2008 contributed to the decrease in R&D expenses.
R&D expenses increased $10.2 million or 15.6% for the fiscal year ended October 31, 2008 compared to the year ended October 31, 2007 primarily due to a $7.4 million increase in personnel costs resulting from higher headcount and the impact of less favorable currency exchange rates on our expenditures, $1.8 million in restructuring costs, and a $2.7 million write-off of capitalized software development costs due to a change in our approach to the French market. In addition, expenditures for R&D materials and supplies increased by $1.0 million to support our ongoing R&D efforts. These increases were partially offset by a $1.0 million decrease in stock-based compensation expense.
We expect research and development expenses, assuming a stable currency environment, to grow modestly as we address business opportunities in certain markets where we believe economic growth and demand are relatively less affected by the global recession.
Sales and Marketing Expenses
Sales and marketing expenses for the fiscal years ended October 31, 2009, 2008, and 2007 are summarized in the following table (in thousands, except percentages):
| Fiscal Year Ended October 31, | ||||||||||||||||||||||||||
| 2009 | Change | % Change | 2008 | Change | % Change | 2007 | ||||||||||||||||||||
| Sales and marketing |
$ | 73,544 | $ | (17,913 | ) | -19.6 | % | $ | 91,457 | $ | (4,838 | ) | -5.0 | % | $ | 96,295 | ||||||||||
| Percentage of net revenues |
8.7 | % | 9.9 | % | 10.7 | % | ||||||||||||||||||||
Sales and marketing expenses decreased $17.9 million, or 19.6%, for the fiscal year ended October 31, 2009 compared to the fiscal year ended October 31, 2008 primarily due to a $10.4 million decrease in personnel and outside services costs from a global reduction in headcount in sales and marketing, and a $5.3 million decrease in spending on travel, trade shows, events and marketing communications. These reductions were initiated in
51
Table of Contents
response to the global economic crisis. In addition, we experienced a favorable foreign exchange rate impact and a $1.8 million decrease in restructuring expense. These decreases were partially offset by a $1.3 million net increase in stock-based compensation expense.
Sales and marketing expenses decreased $4.8 million or 5.0% for the fiscal year ended October 31, 2008, compared to the fiscal year ended October 31, 2007 mainly as a result of a $3.4 million reduction in expenses from lower trade show and marketing communication activities, a $2.8 million decrease in stock-based compensation expense, and $1.9 million in lower personnel costs. The decreases were partially offset by a $2.8 million increase in restructuring costs in fiscal year 2008 compared to fiscal year 2007.
We expect sales and marketing expenses, assuming a stable currency environment, to grow modestly as we address business opportunities in certain markets where we believe economic growth and demand are relatively less affected by the global recession.
General and Administrative Expenses
General and administrative expenses for the fiscal years ended October 31, 2009, 2008, and 2007 are summarized in the following table (in thousands, except percentages):
| Fiscal Year Ended October 31, | |||||||||||||||||||||||||
| 2009 | Change | % Change | 2008 | Change | % Change | 2007 | |||||||||||||||||||
| General and administrative |
$ | 76,468 | $ | (50,157 | ) | -39.6 | % | $ | 126,625 | $ | 45,921 | 56.9 | % | $ | 80,704 | ||||||||||
| Percentage of net revenues |
9.1 | % | 13.7 | % | 8.9 | % | |||||||||||||||||||
General and administrative expenses decreased $50.2 million, or 39.6%, in the fiscal year ended October 31, 2009 compared to the fiscal year ended October 31, 2008 primarily due to the non-recurrence of $41.8 million of expenses related to the restatement of our 2007 interim financial results incurred in the fiscal year 2008 and a reversal of a $7.2 million Lipman pre-acquisition contingency accrual for a Brazilian importation tax assessment that was dismissed in the third quarter of fiscal year 2009. Additionally, fiscal year 2009 general and administrative expenses were also impacted by a $4.9 million reduction in outside services costs and a $1.8 million decrease in travel expense, both driven by cost reduction initiatives. Partially offsetting these decreases were a $3.4 million net increase in stock-based compensation expense mainly as a result of the surrender of certain employee stock options and a $1.2 million increase in restructuring and accelerated depreciation expenses.
General and administrative expenses increased $45.9 million, or 56.9%, in the fiscal year ended October 31, 2008 compared to the fiscal year ended October 31, 2007. The increase was primarily due to $41.8 million in costs related to our 2007 quarterly restatement and the independent investigation. Additional increases consisted of a $5.4 million increase in professional services fees consisting primarily of higher audit and litigation fees, a $5.8 million increase in personnel costs to address restatement activities and the remediation of control weaknesses, a $2.4 million increase in restructuring costs and a $2.0 million expense for potential settlement of ongoing litigation. Furthermore, we incurred a $2.7 million increase in travel expenses and a $2.8 million increase in depreciation and maintenance costs primarily as a result of the November 2007 Oracle implementation. These increases were partially offset by the non-recurrence of $10.2 million of integration expenses incurred during fiscal year 2007 relating to the acquisition of Lipman and restructuring charges in VeriFone entities, a $5.7 million decrease in stock-based compensation, and a $2.4 million decrease in bad debt expenses due to a more favorable collections experience.
We expect general and administrative expenses, assuming a stable currency environment, to increase in the future both as the result of the non-recurrence of the reversal of the Lipman pre-acquisition contingency accrual recorded in fiscal year 2009, an additional $3.0 million in restructuring and accelerated depreciation expenses resulting from our decision to outsource our Israeli in-house manufacturing to Sanmina-SCI Corporation in fiscal year 2010 and higher legal expenses.
52
Table of Contents
Impairment of Goodwill and Intangible Assets
We performed our annual impairment test of goodwill as of August 1, 2009 and 2008 in accordance with ASC 350 (formerly SFAS No. 142), neither of which resulted in an impairment of goodwill.
Subsequent to the annual impairment test as of August 1, 2008 for fiscal year 2008, in light of our disappointing operating results for the fourth quarter of fiscal year 2008 due to severe macro-economic conditions caused by the illiquidity of the credit markets, difficulties in the banking and financial services sectors, falling consumer confidence and rising unemployment rates, we reduced our projected future cash flows significantly. This resulted in an indicator of possible impairment of goodwill and long-lived assets as defined under ASC 350 (formerly SFAS No. 142) and ASC 360 (formerly SFAS No. 144), requiring us to perform an impairment test as of October 15, 2008. Following this impairment test, we recorded impairment charges of $262.5 million for goodwill for our EMEA reporting unit and $26.6 million for developed and core technology intangible assets in the International segment during the fourth quarter of fiscal year 2008.
We determined the recoverability of the long-lived assets under ASC 360 (formerly SFAS No. 144) based on their undiscounted estimated future net cash flows and the impairment charge based on fair value using discounted cash flows.
During November 2008, the macroeconomic environment worldwide continued to weaken in face of further and more severe illiquidity in the credit markets, difficulties in the banking and financial services sectors, as well as persistent declines in consumer confidence and increases in unemployment rates on a global level. We experienced a further significant decline in our stock price and market capitalization, which was considered an indicator of possible impairment of goodwill and long-lived assets triggering the necessity of an additional impairment test as of December 1, 2008.
As a result of the December 1, 2008 goodwill impairment test, we concluded that the carrying amount of our North America and Asia reporting units exceeded their implied fair values and recorded an estimated impairment charge of $178.2 million in the Corporate segment during the first quarter of fiscal year 2009 for these reporting units. We finalized the goodwill evaluation process and recorded a $2.7 million reduction to the estimated impairment charge during the second quarter of fiscal year 2009. The final impairment charge for the North America and Asia reporting units was $175.5 million. The net carrying value of goodwill in North America and International segments was reduced by $65.6 million and $109.9 million, respectively, as a result of the impairment charges recorded in the first and second quarters of fiscal year 2009. See Note 2. “Goodwill and Purchased Intangible Assets” for additional information.
The long-lived assets impairment tests did not result in any significant impairment charges in fiscal year 2009.
Amortization of Purchased Intangible Assets
Amortization of purchased intangible assets decreased $5.6 million, or 21.5% in the fiscal year ended October 31, 2009 compared to the fiscal year ended October 31, 2008. As a result of our impairment analysis in October 2008, we recorded a $26.6 million impairment charge in the fourth quarter of fiscal year 2008 related to the write-down to fair value of the net carrying value of certain developed and core technology intangible assets. The decrease in amortization of purchased intangible assets for the fiscal year ended October 31, 2009 compared to the fiscal year ended October 31, 2008 was primarily attributable to the lower carrying value of the purchased intangible assets subsequent to the recognition of the above-mentioned impairment charge.
Amortization of purchased intangible assets increased $4.5 million, or 20.7%, for the fiscal year ended October 31, 2008 compared to fiscal year 2007 primarily due to the fluctuation of foreign currency exchange rates.
53
Table of Contents
In-Process Research and Development (IPR&D)
We recognized IPR&D expense of $6.8 million during the fiscal year ended October 31, 2007 in connection with our Lipman acquisition. The products considered to be IPR&D were in our consumer-activated and countertop communication modules which have subsequently reached technological feasibility.
Interest Expense
Interest expense decreased $15.9 million in the year ended October 31, 2009 compared to the year ended October 31, 2008 primarily attributable to lower effective interest rates on our Term-B loan as LIBOR rates continue to decline substantially over fiscal year 2009 and the reversal of $5.1 million of accrued interest related to a Lipman pre-acquisition contingency accrual for the Brazilian importation tax assessment that was dismissed in the third quarter of fiscal year 2009. See Note 12. “Commitment and Contingencies” for additional information.
Interest expense decreased $8.2 million for the fiscal year ended October 31, 2008 compared to the fiscal year ended October 31, 2007 mostly attributable to the lower effective interest rates in fiscal year 2008 compared to fiscal year 2007. In June 2007, we repaid an aggregate of $263.8 million of our Term B Loan which had an interest rate of 7.11% with a portion of the proceeds from the issuance of the Senior Convertible Notes which bear interest at a rate of 1.375%.
In May 2008, the FASB issued FASB Staff Position APB 14-1, Accounting for Convertible Debt Instruments That May Be Settled in Cash upon Conversion (Including Partial Cash Settlement) (or ASC 470-20), which requires the issuer of a convertible debt instrument with cash settlement features to account separately for the liability and equity components of the instrument. The debt would be recognized at the present value of our cash flows discounted using an entity specific nonconvertible debt borrowing rate at the time of issuance. The equity component would be recognized as the difference between the proceeds from the issuance of the note and the fair value of the liability. The standard also requires accretion of the resultant debt discount over the expected life of the debt. This accounting standard is effective for fiscal years beginning after December 15, 2008, and interim periods within those years. Entities are required to apply this standard retrospectively for all periods presented. We adopted FSP APB 14-1 (ASC 470-20) at the beginning of fiscal year 2010 and modified our accounting for our 1.375% Senior Convertible Notes (“Notes”). On the date of issuance of the Notes on June 22, 2007, approximately $80.0 million of the proceeds was allocated to equity in a manner that reflects market interest rate for a similar nonconvertible debt at the date of issuance. This equity amount will be accreted from the date of issuance to June 2012 as non-cash interest charges. The retroactive interest expense for the fiscal years ended October 31, 2009, 2008 and 2007 is expected to be approximately $14.0 million, $14.0 million and $5.0 million, respectively. The gain on debt extinguishment will be reduced from $13.1 million to approximately $7.0 million for the fiscal year ended October 31, 2009. The interest expense for fiscal year 2010 will be approximately $15.0 million.
Interest Income
Interest income decreased $4.5 million for the fiscal year ended October 31, 2009 compared to the fiscal year ended October 31, 2008. The decrease was attributable to the lower effective interest rates during the fiscal year ended October 31, 2009 partially offset by the impact of higher average cash balances.
Interest income decreased $0.7 million in the year ended October 31, 2008 compared to the year ended October 31, 2007. This decrease was attributable to the impact of lower effective interest rates during fiscal year 2008 compared to fiscal year 2007.
Other Income (Expense), net
Other income (expense), net increased $24.5 million during the fiscal year ended October 31, 2009 compared to the fiscal year ended October 31, 2008 mainly due to a $13.1 million gain on extinguishment of debt
54
Table of Contents
and a $9.3 million reduction in foreign exchange losses. In April 2009, we repurchased and extinguished $33.5 million par value of our outstanding 1.375% Convertible Notes for $19.8 million, excluding accrued interest paid. As a result, we realized a $13.1 million gain on these transactions, net of a $0.6 million write-off of related deferred debt issuance costs. The reduction in foreign exchange losses was primarily attributable to the non-recurrence of a $5.1 million foreign exchange loss recorded in fiscal year 2008 as a result of an un-hedged Israeli tax accrual and improved effectiveness of our foreign currency hedging programs in fiscal year 2009.
Other income (expense), net increased $5.3 million for the fiscal year ended October 31, 2008 compared to the fiscal year ended October 31, 2007 predominately resulting from a $9.0 million increase in foreign currency exchange loss and a $2.2 million impairment of equity investment primarily as a result of the investee being insolvent which were partially offset by the non-recurrence of a $4.8 million write-off of debt issuance expense as a result of the extinguishment of debt during the fiscal year ended October 31, 2007.
Provision for Income Taxes
We recorded a provision for income taxes of $9.2 million for the fiscal year ended October 31, 2009 compared to a provision for income taxes of $73.9 million for the fiscal year ended October 31, 2008. The decrease in the provision for income taxes was primarily attributable to the recording of a full valuation allowance in the U.S. during fiscal 2008 and as such we recorded a significant deferred tax expense for the write off of all U.S. deferred tax assets. The tax provision for the year ended October 31, 2009 primarily reflects taxes for profitable jurisdictions. It also reflects the benefit of U.S. loss carrybacks and the reversal of the U.S. federal and state deferred tax liabilities related to goodwill as a result of the current year’s goodwill impairment in the U.S.
As of October 31, 2009, we remain in a net deferred tax liability position. The realization of the deferred tax assets is primarily dependent on our ability to generate sufficient U.S. and foreign taxable income in future periods. We have determined that it is not more likely than not the deferred tax assets in the U.S. and certain foreign jurisdictions will be realized and as such we continue to record a full valuation allowance against our deferred tax assets as of October 31, 2009 in those jurisdictions. The amount of deferred tax assets considered realizable may increase or decrease in subsequent quarters as we re-evaluate the underlying basis for our estimates of future domestic and certain foreign taxable income.
Pursuant to the Worker, Homeownership, and Business Assistance Act of 2009 enacted on November 4, 2009, we will be able to carryback all U.S. loss carryforwards generated in fiscal year 2009 to prior years and obtain cash tax refunds. This law was enacted after our year-end and as such this future benefit will be reflected in the first quarter tax provision for the year ending October 31, 2010.
We are currently being audited by the Internal Revenue Service (“IRS”) for our fiscal years 2003 to 2004. Although we believe that we have correctly provided income taxes for the years subject to audit, the IRS may adopt different interpretations. We have not yet received any final determinations with respect to this audit although certain adjustments have been agreed with the IRS, none of which have a material impact to the current period income tax provision. Our subsidiaries are also under audit by the Israeli tax authorities for calendar years 2004 to 2006 and the Brazilian federal government for all periods subsequent to January 1, 2003. With few exceptions, we are no longer subject to tax examination outside of the U.S. for periods prior to 2001.
Effective November 1, 2007, we adopted ASC 740 (formally FASB Interpretation No. 48, “Accounting for Uncertainty in Income Taxes”). We have recorded our ASC 740 liability as a long-term liability as we do not expect significant payments to occur over the next 12 months. Our existing tax positions will continue to generate an increase in liabilities for uncertain tax benefits. We will continue to recognize interest and penalties related to income tax matters in income tax expense. The amount of unrecognized tax benefits could be reduced upon closure of tax examinations or if the statute of limitations on certain tax filings expires without assessment from the tax authorities. We believe that it is reasonably possible that there could be a reduction in unrecognized tax benefits due to statute of limitation expirations in multiple tax jurisdictions during the next 12 months of zero
55
Table of Contents
to $3.0 million. Interest and penalties accrued on these uncertain tax positions will also be released upon the expiration of statutes of limitations.
Segment Information
We operate in two business segments: North America and International. We define North America as the United States and Canada, and International as the other countries from which we derive revenues.
Net revenues and operating income (loss) of each business segment reflect net revenues generated within the segment, supply chain standard inventory cost of System Solutions net revenues, actual cost of Services net revenues, and expenses that directly benefit only that segment, including distribution center costs, royalty and warranty expense. Corporate net revenues and operating income (loss) reflect non-cash acquisition charges, including amortization of purchased core and developed technology assets, step-down in deferred revenue, impairment and other Corporate charges, including inventory obsolescence and scrap, rework, specific warranty provisions, non-standard freight and over-and-under absorption of materials management overhead.
In fiscal year 2009, we revised the methodology for business segment operating income (loss) reporting. Local inventory obsolescence and scrap costs previously recorded in International and North America segments were reclassified to the Corporate segment. The following table sets forth net revenues and operating income (loss), as revised, for our segments (in thousands):
| Fiscal Year Ended October 31, | ||||||||||||||||||||||||||
| 2009 | Change | % Change | 2008 | Change | % Change | 2007 | ||||||||||||||||||||
| Net revenues: |
||||||||||||||||||||||||||
| International |
$ | 501,670 | $ | (62,789 | ) | -11.1 | % | $ | 564,459 | $ | 58,264 | 11.5 | % | $ | 506,195 | |||||||||||
| North America |
343,446 | (15,690 | ) | -4.4 | % | 359,136 | (41,297 | ) | -10.3 | % | 400,433 | |||||||||||||||
| Corporate |
(402 | ) | 1,262 | nm | (1,664 | ) | 2,072 | nm | (3,736 | ) | ||||||||||||||||
| Total net revenues |
$ | 844,714 | $ | (77,217 | ) | -8.4 | % | $ | 921,931 | $ | 19,039 | 2.1 | % | $ | 902,892 | |||||||||||
| Operating income (loss): |
Revised | Revised | ||||||||||||||||||||||||
| International |
$ | 116,882 | $ | 6,800 | 6.2 | % | $ | 110,082 | $ | (13,451 | ) | -10.9 | % | $ | 123,533 | |||||||||||
| North America |
116,968 | (1,548 | ) | -1.3 | % | 118,516 | (28,738 | ) | -19.5 | % | 147,254 | |||||||||||||||
| Corporate |
(362,816 | ) | 181,607 | 33.4 | % | (544,423 | ) | (302,116 | ) | 124.7 | % | (242,307 | ) | |||||||||||||
| Total operating income (loss) |
$ | (128,966 | ) | $ | 186,859 | -59.2 | % | $ | (315,825 | ) | $ | (344,305 | ) | nm | $ | 28,480 | ||||||||||
nm- not meaningful
International Segment
International total net revenues decreased $62.8 million, or 11.1%, for the fiscal year ended October 31, 2009 as compared to the fiscal year ended October 31, 2008 primarily due to a $67.8 million decrease in System Solutions net revenues partially offset by a $5.0 million increase in Services net revenues. See discussion under “Results of Operations — Net Revenues.”
International operating income increased $6.8 million, or 6.2%, for the fiscal year ended October 31, 2009 compared to the fiscal year ended October 31, 2008 due to the overall decrease in operating expenses partially offset by a decline in gross margin largely attributable to the $62.8 million decrease in total net revenues.
Net revenues increased $58.3 million, or 11.5%, in International for the fiscal year ended October 31, 2008 as compared to the fiscal year ended October 31, 2007 primarily driven by a $56.3 million increase in System Solutions net revenues.
56
Table of Contents
The decrease in International operating income for the fiscal year ended October 31, 2008 compared to the fiscal year ended October 31, 2007 was mainly due to a lower gross profit percentage and higher operating expenses.
North America Segment
North America total net revenues decreased $15.7 million, or 4.4%, for the fiscal year ended October 31, 2009 as compared to the fiscal year ended October 31, 2008 primarily due to a $12.0 million decrease in Systems Solutions net revenues and a $3.7 million decrease in Services net revenues. See “Results of Operations — Net Revenues.”
North America operating income decreased $1.5 million, or 1.3%, for the year ended October 31, 2009 compared to the fiscal year ended October 31, 2008 mainly due to a decline in gross margin primarily attributable to the decrease in total revenues and a decline in gross margin percentage. The decrease in gross margin was partially offset by a decrease in operating expenses.
Net revenues decreased $41.3 million, or 10.3%, in North America for the fiscal year ended October 31, 2008 as compared to the fiscal year ended October 31, 2007 primarily driven by a decrease in System Solutions. See “Results of Operations — Net Revenues.”
The decrease in operating income for North America for the fiscal year ended October 31, 2008 compared to the fiscal year ended October 31, 2007 was mainly due to lower revenues and lower gross profit percentage, partially offset by lower operating expenses. See “Results of Operations — Gross Profit.”
Corporate Segment
Corporate operating loss decreased $181.6 million, or 33.4% for the fiscal year ended October 31, 2009 compared to the fiscal year ended October 31, 2008 primarily due to $113.6 million in lower goodwill and purchased intangible assets impairment charges, the non-recurrence of $41.8 million in restatement costs related to the restatement of the fiscal year 2007 interim financial results incurred in the fiscal year ended October 31, 2008, a $17.4 million reduction in amortization of purchased intangibles assets, a $12.2 million decrease in general operating expenses, a $7.2 million reversal of the Lipman pre-acquisition contingency accrual for the Brazilian importation tax assessment that was dismissed in the third quarter of fiscal year 2009, a $2.2 million reversal of a warranty claim associated with an acquired product and a $2.4 million decrease in restructuring expenses. These decreases were partially offset by a $11.1 million increase in excess and obsolescence and scrap charges as a result of the deteriorating macroeconomic environment, a $5.0 million net increase in stock-based compensation due primarily to the surrender of certain stock option grants, and a $2.6 million increase in product situation warranty reserves.
The increase in Corporate operating loss for the fiscal year ended October 31, 2008 compared to the fiscal year ended October 31, 2007 was primarily a result of a $289.1 million impairment charge for goodwill and developed and core technology intangible assets due to lower revenue expectations in light of current operating performance and future operating expectations, $41.8 million in costs related to the independent investigation and restatement, $11.0 million in restructuring costs and a $11.3 million increase in personnel expense largely attributable to restatement and remediation activities and the impact of unfavorable exchange rates. These increases were partially offset by the non-recurrence of $20.6 million of amortization of step-up in inventory and IPR&D write-off, the non-recurrence of $11.1 million of integration expenses relating to the acquisition of Lipman and restructuring charges, and a $11.0 million decrease in stock-based compensation expense. Additionally, corporate supply chain costs decreased $14.4 million primarily due to lower write-offs of inventory, less scrap and a decrease in the accrual of liabilities to purchase excess components from contract manufacturers compared to fiscal year ended October 31, 2007 when we took significant provisions for non-PCI compliant inventory and components.
57
Table of Contents
Liquidity and Capital Resources
| Fiscal Year Ended October 31, | ||||||||||||
| 2009 | 2008 | 2007 | ||||||||||
| (In thousands) | ||||||||||||
| Net cash provided by (used in): |
||||||||||||
| Operating activities |
$ | 202,609 | $ | (8,628 | ) | $ | 89,270 | |||||
| Investing activities |
(15,995 | ) | (37,804 | ) | (311,696 | ) | ||||||
| Financing activities |
(24,552 | ) | (2,245 | ) | 349,920 | |||||||
| Effect of foreign currency exchange rate changes on cash |
5,774 | (9,164 | ) | 943 | ||||||||
| Net increase (decrease) in cash and cash equivalents |
$ | 167,836 | $ | (57,841 | ) | $ | 128,437 | |||||
Our primary liquidity and capital resource needs are to service our debt, finance working capital, and to make capital expenditures and investments. At October 31, 2009, our primary sources of liquidity were cash and cash equivalents of $325.0 million and $25.0 million was available to us under our revolving credit facility. During fiscal year 2009, we repurchased $33.5 million principal of our 1.375% Convertible Notes in open market transactions. We may also in the future execute further voluntary repurchases of our 1.375% Convertible Notes if the market conditions are favorable, we have funds available to execute such repurchases and when the financial covenants under our Credit Facility allow us to do so.
Operating Activities
Net cash flow from operating activities was $202.6 million for the fiscal year ended October 31, 2009.
Cash provided by operations before changes in working capital amounted to $101.0 million for the fiscal year ended October 31, 2009 and consisted of a $137.8 million net loss adjusted for $238.8 million of non-cash items consisting primarily of impairment of goodwill and purchased intangible assets, amortization of purchased intangible assets, stock-based compensation expense, depreciation and amortization of property, plant, and equipment, gain on reversal of a Lipman pre-acquisition contingency and gain on extinguishment of debt.
Changes in working capital resulted in a $101.6 million increase in cash and cash equivalents during the year ended October 31, 2009. The main drivers of this increase were as follows:
| • | A $72.5 million decrease in inventories mainly due to lower year over year sales volume and improvements in inventory management as we focused on maintaining a strong cash position in face of weak economic conditions; |
| • | A $24.1 million decrease in prepaid expenses and other assets due to the timing of income taxes, value added tax and expense payments; and |
| • | A $13.0 million decrease in accounts receivable due to the timing of billings and cash collections. |
Offset by:
| • | A $16.6 million decrease in accounts payable and accrued expenses and other liabilities primarily due to a $14.4 million net reduction in accrued Brazilian tax liabilities as a result of the dismissal of one of the assessments, timing of payments of accrued interest and vendor invoices, the decrease in inventory purchases and a reduction in general and administrative expenses. |
Cash used in operations before changes in working capital amounted to $21.7 million for the fiscal year ended October 31, 2008 and consisted of a $425.3 million net loss adjusted for $447.0 million of non-cash items such as impairment of goodwill and intangible assets, impairment of equity investments, amortization of purchased intangible assets, stock-based compensation expense, depreciation and amortization of property, plant, and equipment, amortization of debt issuance costs and loss on write-off of capitalized software.
58
Table of Contents
Changes in working capital resulted in a $30.3 million decrease in cash and cash equivalents during the fiscal year ended October 31, 2008 primarily driven by a $60.6 million increase in inventories reflecting lower than expected System Solutions revenues, a strategic decision to increase inventory for certain products to ensure adequate quantity on hand, and an increase in inventory of MX Multi-lane Retail products based on sales projections and a $3.2 million increase in prepaid and other assets, partially offset by a $24.6 million decrease in accounts receivable due to improved collections, a $6.7 million increase in accounts payable and accrued expenses and other liabilities and a $5.2 million increase in deferred revenue.
Investing Activities
Cash used in investing activities was $16.0 million in the fiscal year ended October 31, 2009, and primarily consisted of $9.7 million in purchases of property, plant and equipment, $2.3 million used in capitalized software development costs and $2.7 million related to an equity investment in the fourth quarter of fiscal year 2009.
Cash used in investing activities was $37.8 million in the fiscal year ended October 31, 2008, and primarily consisted of $17.6 million in purchases of property, plant and equipment, $15.8 million used in business acquisitions, net of cash acquired, and $4.5 million in capitalized software development costs.
Financing Activities
The $24.6 million of cash used in financing activities in the fiscal year ended October 31, 2009 primarily consisted of a $33.8 million repayment of debt and advances against banker’s acceptances partially offset by $8.6 million of proceeds from advances against bankers acceptances. The $33.8 million repayment of debt primarily consisted of $19.8 million used to purchase a portion of our outstanding 1.375% Convertible Notes, $5.0 million of Term B loan repayments and $8.6 million of repayments of advances against banker’s acceptances.
The $2.2 million of cash used in financing activities in the fiscal year ended October 31, 2008 primarily consisted of $8.2 million repayment of debt and a $1.6 million debt amendment fee which were partially offset by $3.0 million of receipts from the exercise of stock options, $3.4 million proceeds from debt and $1.2 million from the tax benefit derived from stock-based compensation.
Our future capital requirements may vary significantly from prior periods as well as from those currently planned. These requirements will depend on a number of factors, including operating factors such as our terms and payment experience with customers and investments we may make in product or market development such as our current investments in expanding our International operations. As noted above, we may also in the future execute further voluntary repurchases of our convertible debt. Finally, our capital needs may be significantly affected by any acquisition we may make in the future. Based upon our current level of operations, we believe that we have the financial resources to meet our business requirements for the next year, including capital expenditures, working capital requirements, and future strategic investments, and to comply with our financial covenants.
Secured Credit Facility
On October 31, 2006, our principal subsidiary, VeriFone Inc., entered into a credit agreement (the “Credit Facility”) consisting of a Term B Loan facility of $500.0 million and a revolving loan permitting borrowings of up to $40.0 million. The proceeds from the Term B loan were used to repay all outstanding amounts relating to a previous credit facility, pay certain transaction costs, and partially fund the cash consideration in connection with the acquisition of Lipman on November 1, 2006. We repaid $5.0 million, $5.0 million and $263.7 million during fiscal years 2009, 2008 and 2007, respectively, leaving a Term B Loan balance of $226.3 million at October 31, 2009. As of October 31, 2009 and 2008, there were no outstanding balances on the revolving loan. The Credit Facility is guaranteed by us and certain of our subsidiaries and is secured by collateral including substantially all of our assets and stock of our subsidiaries.
59
Table of Contents
During fiscal year 2008, we entered into three amendments to the Credit Facility with our lenders, which extended the time periods for delivery of certain required financial information for the three-month periods ended January 31, April 30 and July 31, 2007, the year ended October 31, 2007 and the three-month periods ended January 31, 2008 and April 30, 2008. In connection with the three amendments, we paid a total fee of $1.6 million and agreed to certain increases in the interest rates and fees in fiscal year 2008.
Lehman Commercial Paper, Inc. (“Lehman CP”), a lender in the revolving loan, declared bankruptcy in October 2008. Under the terms of the Credit Facility, we declared Lehman CP a defaulting lender and removed Lehman CP as a lender in the revolving loan. Therefore, as of October 31, 2009 and October 31, 2008, $25.0 million was available to us under the revolving loan. We do not expect to obtain a replacement lender for Lehman CP under the revolving loan.
We pay a commitment fee on the unused portion of the revolving loan credit facility at a rate that varies depending upon our consolidated total leverage ratio. We pay a commitment fee at a rate of 0.425% per annum as of October 31, 2009 and 2008.
The maturity dates on the components of the Credit Facility are October 31, 2012 for the revolving loan and October 31, 2013 for the Term B Loan. Principal payments on the Term B Loan are due in equal quarterly installments of $1.3 million over the seven-year term on the last business day of each calendar quarter with the balance due on maturity.
At our option, the Term B loan and the revolving loan can be “Base Rate” or “Eurodollar Rate” loans. Base Rate loans bear interest at a per annum rate equal to a margin over the greater of the Federal Funds rate plus 0.50% or the JP Morgan prime rate. For the Base Rate Term B loan, the margin was 1.75% as of October 31, 2009 and 2008. For the Base Rate revolving loan, the margin varies depending upon our consolidated leverage ratio and was 1.00% as of October 31, 2009 and 2008.
At our option, Eurodollar Rate loans bear interest at a margin over the one-, two-, three- or six-month LIBOR rate. The margin for the Eurodollar Rate Term B loan was 2.75% as of October 31, 2009 and 2008. The margin for the Eurodollar Rate revolving loan varies depending upon our consolidated leverage ratio and was 2.00% as of October 31, 2009 and 2008.
As of October 31, 2009, the Term B loan bore interest at 2.75% over the one-month LIBOR rate of 0.25% for a total of 3.00%. As of October 31, 2008, the Term B loan bore interest at 2.75% over the one-month LIBOR rate of 3.12% for a total of 5.87%. As of October 31, 2009 and 2008, the outstanding balance on the Term B loan was $226.3 million and $231.3 million, respectively.
As of October 31, 2009, the revolving loan credit facility bore interest at 2.00% over the one-month LIBOR rate of 0.25% for a total of 2.25%. As of October 31, 2008, the revolving loan credit facility bore interest at 2.00% over the one-month LIBOR rate of 3.12% for a total of 5.12%. As of October 31, 2009 and 2008, no amounts were outstanding under the revolving loan.
The terms of the Credit Facility require us to comply with financial covenants, including maintaining leverage and fixed charge coverage ratios at the end of each fiscal quarter. As of October 31, 2009, we were required to maintain a total leverage ratio of not greater than 3.5 to 1.0 and a fixed charge coverage ratio of at least 2.0 to 1.0. Total leverage ratio is equal to total debt less cash as of the end of a reporting fiscal quarter divided by consolidated EBITDA, as adjusted, for the most recent four consecutive fiscal quarters. Fixed charge coverage ratio is, all for the most recent four consecutive fiscal quarters, the ratio of (a) consolidated EBITDA, as adjusted, less capital expenditures, as adjusted, and cash tax payments, over (b) the sum of cash interest expense and scheduled debt payments. Some of the financial covenants become more restrictive over the term of the Credit Facility. Noncompliance with any of the financial covenants without cure or waiver would constitute an event of default under the Credit Facility. An event of default resulting from a breach of a financial covenant may
60
Table of Contents
result, at the option of lenders holding a majority of the loans, in an acceleration of repayment of the principal and interest outstanding and a termination of the loan. The Credit Facility also contains non-financial covenants that restrict some of our activities, including our ability to dispose of assets, incur additional debt, pay dividends, create liens, make investments, make capital expenditures, and engage in specified transactions with affiliates. The terms of the Credit Facility permit prepayments of principal and require prepayments of principal upon the occurrence of certain events including among others, the receipt of proceeds from the sale of assets, the receipt of excess cash flow as defined, and the receipt of proceeds of certain debt issues. The Credit Facility also contains customary events of default, including defaults based on events of bankruptcy and insolvency; non payment of principal, interest, or fees when due, subject to specified grace periods; breach of specified covenants; change in control; and material inaccuracy of representations and warranties. In addition, if our leverage exceeds a certain level set out in our Credit Facility, a portion of the excess cash flows must be used to pay down our outstanding debt. We were in compliance with our financial and non-financial covenants as of October 31, 2009.
1.375% Senior Convertible Notes
On June 22, 2007, we issued and sold $316.2 million aggregate principal amount of 1.375% Senior Convertible Notes due in June 2012 (the “Notes”) in an offering through Lehman Brothers and JP Morgan Securities Inc. (together “initial purchasers”) to qualified institutional buyers pursuant to Section 4(2) and Rule 144A under the Securities Act. The net proceeds from the offering, after deducting transaction costs, were approximately $307.9 million. We incurred approximately $8.3 million of debt issuance costs. The transaction costs, consisting of the initial purchasers’ discounts and offering expenses, were primarily recorded in debt issuance costs, net and are being amortized to interest expense using the effective interest method over five years. We will pay 1.375% interest per annum on the principal amount of the Notes, payable semi-annually in arrears in cash on June 15 and December 15 of each year, commencing on December 15, 2007, subject to increase in certain circumstances as described below.
In April 2009, we repurchased and extinguished $33.5 million par value of the outstanding Notes for $19.8 million, excluding accrued interest paid. We realized a $13.1 million gain on these transactions, net of a $0.6 million write-off of related deferred debt issuance costs. As of October 31, 2009, the remaining par value of the Notes was $282.7 million.
The Notes were issued under an Indenture (the “Indenture”) with U.S. Bank National Association, as trustee. Each $1,000 of principal of the Notes are initially convertible into 22.719 shares of VeriFone common stock, which is equivalent to a conversion price of approximately $44.02 per share, subject to adjustment upon the occurrence of specified events. Holders of the Notes may convert their Notes prior to maturity during specified periods as follows: (1) on any date during any fiscal quarter beginning after October 31, 2007 (and only during such fiscal quarter) if the closing sale price of our common stock was more than 130% of the then current conversion price for at least 20 trading days in the period of the 30 consecutive trading days ending on the last trading day of the previous fiscal quarter; (2) at any time on or after March 15, 2012; (3) if we distribute, to all holders of our common stock, rights or warrants (other than pursuant to a rights plan) entitling them to purchase, for a period of 45 calendar days or less, shares of our common stock at a price less than the average closing sale price for the ten trading days preceding the declaration date for such distribution; (4) if we distribute, to all holders of our common stock, cash or other assets, debt securities, or rights to purchase our securities (other than pursuant to a rights plan), which distribution has a per share value exceeding 10% of the closing sale price of our common stock on the trading day preceding the declaration date for such distribution; (5) during a specified period if certain types of fundamental changes occur; or (6) during the five business-day period following any five consecutive trading-day period in which the trading price for the Notes was less than 98% of the average of the closing sale price of our common stock for each day during such five trading-day period multiplied by the then current conversion rate. Upon conversion, we would pay the holder the cash value of the applicable number of shares of our common stock, up to the principal amount of the note. Amounts in excess of the principal amount, if any, will be paid in stock.
61
Table of Contents
As of October 31, 2009, none of the conditions allowing holders of the Notes to convert had been met. If a fundamental change, as defined in the Indenture, occurs prior to the maturity date, holders of the Notes may require us to repurchase all or a portion of their Notes for cash at a repurchase price equal to 100% of the principal amount of the Notes to be repurchased, plus any accrued and unpaid interest (including additional interest, if any) to, but excluding, the repurchase date.
The Notes are senior unsecured obligations and rank equal in right of payment with all of our existing and future senior unsecured indebtedness. The Notes are effectively subordinated to any secured indebtedness to the extent of the value of the related collateral and structurally subordinated to indebtedness and other liabilities of our subsidiaries including any secured indebtedness of such subsidiaries.
In connection with the offering of the Notes, we entered into note hedge transactions with affiliates of the initial purchasers (the “counterparties”), consisting of Lehman Brothers OTC Derivatives (“Lehman Derivatives”) and JPMorgan Chase Bank, National Association, London Branch, whereby we have the option to purchase up to 7.2 million shares of our common stock at a price of approximately $44.02 per share. The note hedge transactions expire the earlier of the last day on which any Notes remain outstanding and June 14, 2012. The cost of the note hedge transactions was approximately $80.2 million. The note hedge transactions are intended to mitigate the potential dilution upon conversion of the Notes in the event that the volume weighted average price of our common stock on each trading day of the relevant conversion period or other relevant valuation period is greater than the applicable strike price of the convertible note hedge transactions, which initially corresponds to the conversion price of the Notes and is subject, with certain exceptions, to the adjustments applicable to the conversion price of the Notes. The note hedge transaction with Lehman Derivatives, which benefited from a guarantee by Lehman Brothers, covers 50% of the shares of our common stock potentially issuable upon conversion of the Notes. The filing by Lehman Brothers of a voluntary Chapter 11 bankruptcy petition in September 2008 constituted an “event of default” under the note hedge transaction with Lehman Derivatives, giving us the immediate right to terminate the transaction and entitling us to claim reimbursement for the loss incurred in terminating and closing out the transaction. On September 21, 2008, we delivered a notice of termination to Lehman Derivatives and claimed reimbursement for the loss incurred in termination and close-out of the transaction.
In addition, we sold warrants to the counterparties whereby they have the option to purchase up to approximately 7.2 million shares of VeriFone common stock at a price of $62.356 per share. We received approximately $31.2 million in cash proceeds from the sale of these warrants. The warrants expire progressively from December 19, 2013 to February 3, 2014.
The cost incurred in connection with the note hedge transactions, net of the related tax benefit and the proceeds from the sale of the warrants, is included as a net reduction in additional paid-in capital in the accompanying Consolidated Balance Sheets as of October 31, 2009 and 2008, in accordance with the guidance in ASC 815-40 (formerly Emerging Issues Task Force (“EITF”) Issue No. 00-19, Accounting for Derivative Financial Instruments Indexed to, and Potentially Settled in, a Company’s Own Stock).
62
Table of Contents
Contractual Commitments
The following table summarizes our contractual obligations as of October 31, 2009 (in thousands):
| For the Fiscal Years Ending October 31, | |||||||||||||||||||||
| 2010 | 2011 | 2012 | 2013 | 2014 | Thereafter | Total | |||||||||||||||
| Term B Loan (including interest) (1) |
$ | 11,812 | $ | 11,660 | $ | 11,526 | $ | 217,605 | $ | — | $ | — | $ | 252,603 | |||||||
| Senior convertible notes (including interest) |
3,898 | 3,888 | 286,638 | — | — | — | 294,424 | ||||||||||||||
| Capital lease obligations |
141 | 141 | 53 | — | — | — | 335 | ||||||||||||||
| Operating leases |
10,433 | 8,131 | 6,632 | 5,148 | 3,367 | 3,492 | 37,203 | ||||||||||||||
| Minimum purchase obligations |
66,381 | — | — | — | — | — | 66,381 | ||||||||||||||
| $ | 92,665 | $ | 23,820 | $ | 304,849 | $ | 222,753 | $ | 3,367 | $ | 3,492 | $ | 650,946 | ||||||||
| (1) | Interest in the above table has been calculated using the rate in effect at October 31, 2009. |
We expect that we will be able to fund our remaining obligations and commitments with cash flows from our operations. To the extent we are unable to fund these obligations and commitments with cash flows from operations, we intend to fund these obligations and commitments with proceeds from the $25.0 million available under our revolving loan under our secured credit facility or future debt or equity financings.
Manufacturing Agreements
We work on a purchase order basis with third-party contract manufacturers with facilities in China, Singapore and Brazil and components suppliers located throughout the world to supply a majority of our finished goods inventories, spare parts and accessories. We provide each supplier with a purchase order to cover the manufacturing requirements, which constitutes a binding commitment to purchase material produced by the manufacturer as specified in the purchase order. These purchase orders are generally considered to be non-cancelable and are expected to be paid within one year of the issuance date. The amount of purchase orders issued to contract manufacturers and component suppliers totaled approximately $66.4 million as of October 31, 2009. Of this amount, $3.8 million has been recorded in Other Current Liabilities in the accompanying Consolidated Balance Sheets as of October 31, 2009 because the commitment is not expected to have future value to us.
We utilize a limited number of third parties to manufacture a significant portion of our products and rely upon these contract manufacturers to produce and deliver products to our customers on a timely basis and at an acceptable cost. Furthermore, a majority of our manufacturing activities is concentrated in China. As a result, disruptions to the business or operations of the contract manufacturers or to their ability to produce the required products in a timely manner, and particularly disruptions to the manufacturing facilities located in China, could significantly impact our business and operations. In addition, a number of components that are necessary to manufacture and assemble our systems are specifically customized for use in our products and are obtained from sole source suppliers on a purchase order basis. Because of the customized nature of these components and the limited number of available suppliers, it would be difficult and costly to find alternative sources in a timely manner.
Off-Balance Sheet Arrangements
Our only off-balance sheet arrangements, as defined in Item 303(a)(4)(ii) of the SEC’s Regulation S-K, consist of foreign exchange forward contracts described under “Item 7A — Quantitative and Qualitative Disclosures about Market Risk” below.
63
Table of Contents
Effects of Inflation
Our monetary assets, consisting primarily of cash, cash equivalents, and receivables, are not affected by inflation because they are short-term and in the case of cash are immaterial. Our non-monetary assets, consisting primarily of inventory, intangible assets, goodwill, and prepaid expenses and other assets, are not affected significantly by inflation. We believe that replacement costs of equipment, furniture, and leasehold improvements will not materially affect our operations. However, the rate of inflation affects our cost of goods sold and expenses, such as those for employee compensation, which may not be readily recoverable in the price of system solutions and services offered by us.
Critical Accounting Polices and Estimates
General
Management’s Discussion and Analysis of Financial Condition and Results of Operations are based upon our Consolidated Financial Statements, which have been prepared in accordance with U.S.GAAP. On an ongoing basis, we evaluate our critical accounting policies and estimates. We base our estimates on historical experience and on various other assumptions that are believed to be reasonable under the circumstances, the results of which form the basis for making judgments about the carrying values of assets and liabilities that are not readily apparent from other sources. Actual results may differ from these estimates under different assumptions or conditions.
An accounting policy is deemed to be critical if it requires an accounting estimate to be made based on assumptions about matters that are highly uncertain at the time the estimate is made, and if different estimates that reasonably could have been used, or changes in the accounting estimates that are reasonably likely to occur periodically, could materially impact our consolidated financial statements. We believe the following critical accounting policies include our more significant estimates and assumptions used in the preparation of our consolidated financial statements. Our significant accounting policies are described in Note 1. “Principles of Consolidation and Significant Accounting Policies” to the Notes to the Consolidated Financial Statements included in Item 8 of this Annual Report on Form 10-K.
Revenue Recognition
Net revenues from System Solutions are recognized upon shipment, delivery, or customer acceptance of the product as required pursuant to the customer arrangement. Net revenues from services such as customer support are initially deferred and then recognized on a straight-line basis over the term of the contract. Net revenues from services such as installations, equipment repairs, refurbishment arrangements, training, and consulting are recognized as the services are rendered. For arrangements with multiple elements, we allocate net revenues to each element using the residual method based on objective and reliable evidence of the fair value of the undelivered elements. We defer the portion of the arrangement fee equal to the objective evidence of fair value of the undelivered elements until they are delivered.
While the majority of our sales transactions contain standard business terms and conditions, there are some transactions that contain non-standard business terms and conditions. As a result, significant contract interpretation is sometimes required to determine the appropriate accounting including: (1) whether an arrangement exists and what is included in the arrangement; (2) how the arrangement consideration should be allocated among the deliverables if there are multiple deliverables; (3) when to recognize net revenues on the deliverables; (4) whether undelivered elements are essential to the functionality of delivered elements; and (5) whether we have fair value for the undelivered elements. In addition, our revenue recognition policy requires an assessment as to whether collection is probable, which inherently requires us to evaluate the creditworthiness of our customers. Changes in judgments on these assumptions and estimates could materially impact the timing of revenue recognition.
64
Table of Contents
To a limited extent, we also enter into software development contracts with our customers that we recognize as net revenues on a completed contract basis. As a result, estimates of whether the contract is going to be profitable are necessary since we are required to record a provision for such loss in the period when the loss is first identified.
Inventory Valuation and Commitments
The valuation of inventories requires us to determine obsolete or excess inventory and inventory that is not of saleable quality. The determination of obsolete or excess inventories requires us to estimate the future demand for our products within specific time horizons, generally six months. If our demand forecast for specific products is greater than actual demand and we fail to reduce manufacturing output accordingly, we could be required to record additional inventory write-offs, which would have a negative impact on our gross profit percentage.
We review the adequacy of our inventory valuation on a quarterly basis. For production inventory, our methodology involves an assessment of the marketability of the product based on a combination of shipment history and future demand. We then evaluate the inventory found to be in excess and take appropriate write-downs to reflect the risk of obsolescence. This methodology is affected by our sales estimates. If actual demand were to be substantially lower than estimated, additional inventory write-downs for excess or obsolete inventories may be required.
We record accruals for estimated cancellation fees related to orders placed with our suppliers that have been cancelled or are expected to be cancelled. Consistent with industry practice, we acquire inventory through a combination of purchase orders, supplier contracts, and open orders based on projected demand information. These commitments typically cover our requirements for periods ranging from 1 to 5 months. If there is an abrupt and substantial decline in demand for one or more of our products or an unanticipated change in technological requirements for any of our products, we may be required to record additional accruals for cancellation fees that would negatively affect our results of operations in the period when the cancellation fees are identified and recorded.
Warranty Costs
We accrue for estimated warranty obligations when revenue is recognized based on an estimate of future warranty costs for delivered product. Our warranty obligation generally extends from one to three years from the date of shipment. We estimate such obligations based on the size of the installed base of products subject to warranty protection, historical and projected warranty claim rates, historical and projected costs associated with claims, and knowledge of specific product failures that are outside of our typical experience. Our estimates and judgments are affected by actual product failure rates and actual costs to repair. These estimates and judgments are more subjective for new product introductions as these estimates and judgments are based on similar products versus actual history.
General Revenue Reserve and Allowance for Doubtful Accounts
General revenue reserve represents an estimate of future revenue adjustments related to current period net revenues based upon historical experience. Material revenue adjustments may result in changes to the amount and timing of our net revenues for any period. We maintain allowances for doubtful accounts for estimated losses resulting from the inability of our customers to pay their invoices to us in full. We regularly review the adequacy of our accounts receivable allowance after considering the size of the accounts receivable balance, each customer’s expected ability to pay, aging of accounts receivable balances, and our collection history with each customer. We make estimates and judgments about the inability of customers to pay the amounts they owe us which could change significantly if their financial condition changes or the economy in general deteriorates.
65
Table of Contents
Goodwill
We performed our annual impairment test of goodwill as of August 1, 2009 and 2008 in accordance with ASC 350 (formerly SFAS No. 142) which did not result in an impairment of goodwill.
Subsequent to the annual impairment tests in fiscal year 2008, in light of our disappointing fourth quarter of fiscal year 2008 operating results due to severe macro-economic conditions caused by illiquidity of the credit markets, difficulties in the banking and financial sectors, falling consumer confidence and rising unemployment rates, we reduced our projected future cash flow significantly, which resulted in an indicator of possible impairment of goodwill and long-lived assets as defined under ASC 350 (formerly SFAS No. 142) and ASC 360 (formerly SFAS No. 144), requiring us to perform an impairment test as of October 15, 2008 (our fourth quarter of fiscal year 2008). During November 2008, the macroeconomic environment worldwide continued to weaken. This was caused by the illiquidity of the credit markets, difficulties in the banking and financial services sectors, falling consumer confidence and rising unemployment rates. Our stock price and market capitalization declined significantly which was considered an indicator of possible impairment of goodwill and long-lived assets triggering the necessity of an additional impairment test as of December 1, 2008 (our first fiscal quarter of fiscal year 2009).
When performing our impairment tests in fiscal year 2008 and 2009, we: (1) allocated goodwill to our various reporting units to which the acquired goodwill relates; (2) estimated the fair value of our reporting units; and (3) determined the carrying value (i.e. book value) of those reporting units, as some of the assets and liabilities related to those reporting units are not held by those reporting units but at the general corporate level.
During fiscal year 2008 and the first half of fiscal year 2009, we considered three generally accepted approaches to valuation in preparing our goodwill impairment assessment. These approaches are commonly referred to as the income approach, market approach and cost approach. Consistent with prior periods, we selected the income approach, and specifically the discounted cash flow (“DCF”) method, to derive the fair value of each of our reporting units. The DCF approach calculates fair value by estimating the after-tax cash flows to a present value using a risk-adjusted discount rate. We selected this method as being the most meaningful in conducting our goodwill assessments because we believe it most appropriately measures our income producing assets.
In applying the income approach to our accounting for goodwill, we made certain assumptions as to the amount and timing of future expected cash flows, terminal value growth rates and appropriate discount rates. The amount and timing of future cash flows within our DCF analysis is based on our most recent long-term forecasts of the expected future financial performance of each of the reporting units, including projections of revenues, costs of sales, operating expenses, income taxes, working capital requirements, and capital expenditures. The terminal value growth rate is used to calculate the value of cash flows beyond the last projected period in our DCF analysis and reflects our best estimates for stable, perpetual growth of our reporting units. We use weighted average cost of capital (“WACC”) as a basis for determining the discount rates to apply to our reporting units’ future expected cash flows.
Due to the weakening of the macroeconomic environment primarily driven by the illiquidity of the credit markets, difficulties in the banking and financial services sectors, falling consumer confidence, and rising unemployment rates, our stock price and market capitalization declined significantly. As a result, our estimated WACC increased from 19.4% for the goodwill impairment assessment in the fourth quarter of fiscal 2008 to 29.0% for our interim impairment assessment as of December 1, 2008.
As a result of the impairment tests described above, we recorded impairment charges of $262.5 million for goodwill in the fourth quarter of fiscal year 2008 for the EMEA reporting unit. During the first quarter of fiscal year 2009, we concluded that the carrying amount of the North America and Asia reporting units exceeded their implied fair values and recorded an estimated impairment charge of $178.2 million. We finalized the goodwill evaluation process and recorded a $2.7 million reduction of impairment charge during the second quarter of
66
Table of Contents
fiscal year 2009. The final impairment charge was $175.5 million. The net carrying value of goodwill in North America and International segments was reduced by $65.6 million and $109.9 million, respectively. See Note 2. “Goodwill and Purchased Intangible Assets” for additional information.
The process of evaluating the potential impairment of goodwill is subjective and requires significant judgment at many points during the analysis. In estimating the fair value of a reporting unit for the purposes of our annual or periodic analyses, we make estimates and judgments about the future cash flows of that reporting unit. Although our cash flow forecasts are based on assumptions that are consistent with our plans and estimates we are using to manage the underlying businesses, there is a significant amount of judgment involved in determining the cash flows attributable to a reporting unit. In addition, we make certain judgments about allocating shared assets to the estimated balance sheets of our reporting units. We also consider our and our competitor’s market capitalization on the date we perform the analysis. Changes in judgment on these assumptions and estimates could result in a goodwill impairment charge. Furthermore, a sustained decline in our market capitalization, further weakening of the macroeconomic environment or failure to meet our internal forecasts could result in changes to our evaluation of goodwill impairment in the future.
We will continue to evaluate the carrying value of our remaining goodwill and intangible assets and if we determine in the future that there is a potential further impairment in any of our reporting units, we may be required to record additional charges to earnings which could adversely affect our financial results.
Long-lived Assets
We consider quarterly whether indicators of impairment of long-lived assets and intangible assets are present. These indicators may include, but are not limited to, significant decreases in the market value of an asset and significant changes in the extent or manner in which an asset is used. If these or other indicators are present, we test for recoverability of the asset by determining whether the estimated undiscounted cash flows attributable to the assets in question are less than their carrying value. If less, we recognize an impairment loss based on the excess of the carrying amount of the assets over their respective fair values. Fair value is determined by discounted future cash flows, appraisals or other methods.
As a result of our impairment analysis in October 2008, we recorded an impairment charge of $26.6 million in the Corporate segment related to the write-down to fair value of the net carrying value of certain developed and core technology intangible assets in the International segment.
When determining the fair value of developed and core technology intangibles, we estimate the future cash flows expected to be generated through the sale of products developed from the technologies. The cash flows include our estimates of related direct costs including cost of sales and allocable selling, general and administrative, and research and development costs. The sum of the estimated scheduled cash flows calculated on an undiscounted, pretax basis, is then compared to the carrying value to test the assets for recoverability. In instances where the sum of the scheduled cash flows is lower than the recorded value, an indicator of impairment exists. We then estimate the fair value by discounting the after tax cash flows using an estimated discount rate derived from our estimated WACC, adjusted for specific risks attributed to the asset. The result is then compared to the carrying value of the asset to determine the impairment, if any.
The new carrying value of the related asset is depreciated or amortized over the remaining estimated useful life of the asset. We also must make subjective judgments regarding the remaining useful life of the asset.
Contingencies and Litigation
We evaluate contingent liabilities including threatened or pending litigation in accordance with ASC 450 (formerly SFAS No. 5, Accounting for Contingencies). We assess the likelihood of any adverse judgments or outcomes to a potential claim or legal proceeding, as well as potential ranges of probable losses, when the outcomes of the claims or proceedings are probable and reasonably estimable. A determination of the amount of
67
Table of Contents
accrued liabilities required, if any, for these contingencies is made after the analysis of each matter. Because of uncertainties related to these matters, we base our estimates on the information available at the time. As additional information becomes available, we reassess the potential liability related to pending claims and litigation and may revise our estimates. Any revisions in the estimates of potential liabilities could have a material impact on our results of operations and financial position.
Stock-Based Compensation
We account for stock-based employee compensation plans under the fair value recognition and measurement provisions of ASC 718 (formerly SFAS No. 123(R), Share-Based Payment), and recognize compensation over the requisite service period for awards expected to vest. The estimation of stock awards that will ultimately vest requires judgment, and to the extent actual results differ from our estimates, such amounts will be recorded as a cumulative adjustment in the period estimates are revised. In valuing share-based awards, significant judgment is required in determining the expected volatility of our common stock and the expected term individuals will hold their share-based awards prior to exercising. Expected volatility of the stock is based on a blend of our peer group in the industry in which we do business and the historical volatility of our own stock. The expected term of options granted is derived from the historical actual term of option grants and an estimate of future exercises during the remaining contractual period of the option. In the future, our expected volatility and expected term may change which could substantially change the grant-date fair value of future awards of stock options and ultimately the expense we record.
Business Combinations
We are required to allocate the purchase price of acquired companies to the tangible and intangible assets acquired and liabilities assumed, as well as IPR&D, based on their estimated fair values. Such valuations require management to make significant estimates and assumptions, especially with respect to intangible assets. The significant purchased intangible assets recorded by us include customer relationship, developed and core technology and trade names.
Critical estimates in valuing intangible assets include but are not limited to: future expected cash flows from customer contracts, customer lists, distribution agreements and acquired developed technologies and patents; expected costs to develop IPR&D into commercially viable products and estimating cash flows from projects when completed; brand awareness and market position, as well as assumptions about the period of time the brand will continue to be used in our product portfolio; and discount rates. Management’s estimates of fair value are based upon assumptions believed to be reasonable, but which are inherently uncertain and unpredictable and, as a result, actual results may differ from estimates.
Restructuring
We monitor and regularly evaluate our organizational structure and associated operating expenses. Depending on events and circumstances, we may decide to take actions to reduce future operating costs as our business requirements evolve. In determining restructuring charges, we analyze our future operating requirements, including the required headcount by business functions and facility space requirements. Our restructuring costs, and any resulting accruals, involve significant estimates using the best information available at the time the estimates are made. These restructuring costs are accounted for under ASC 420 (formerly SFAS No. 146, Accounting for Costs Associated with Exit or Disposal Activities) or under ASC 712 (formerly SFAS No. 112, Employers’ Accounting for Postemployment Benefits). In recording severance reserves, we accrue a liability when all of the following conditions have been met: management, having the authority to approve the action, commits to a plan of termination; the plan identifies the number of employees to be terminated, their job classifications and their locations, and the expected completion date; the plan is communicated such that the terms of the benefit arrangement are explained in sufficient detail to enable employees to determine the type and amount of benefits they will receive if they are involuntarily terminated; and actions required to complete the
68
Table of Contents
plan indicate that it is unlikely that significant changes to the plan will be made or that the plan will be withdrawn. In recording facilities lease loss reserves, we make various assumptions, including the time period over which the facilities are expected to be vacant, expected sublease terms, expected sublease rates, anticipated future operating expenses, and expected future use of the facilities. Our estimates involve a number of risks and uncertainties, some of which are beyond our control, including future real estate market conditions and our ability to successfully enter into subleases or lease termination agreements with terms as favorable as those assumed when arriving at our estimates. We regularly evaluate a number of factors to determine the appropriateness and reasonableness of our restructuring and lease loss accruals including the various assumptions noted above. If actual results differ significantly from our estimates, we may be required to adjust our restructuring and lease loss accruals in the future.
We also incur costs from our plan to exit certain activities of companies acquired in business combinations. These costs are recognized as a liability on the date of the acquisition when both of the following conditions are met: management assesses, formulates, and approves a plan to exit the activity; and the exit plan identifies the activities to be disposed, the locations of those activities, the method of disposition, all significant actions needed to complete the plan, and the expected date of completion of the plan.
Income Taxes
Deferred tax assets and liabilities are recognized for the expected tax consequences of temporary differences between the tax bases of assets and liabilities and their reported amounts using enacted tax rates in effect for the year the differences are expected to reverse. In evaluating our ability to recover our deferred tax assets we consider all available positive and negative evidence including our past operating results, the existence of cumulative losses in past fiscal years and our forecast of future taxable income in the jurisdictions in which we have operations.
We have placed a valuation allowance on all net U.S. deferred tax assets and certain non-U.S. deferred tax assets because realization of these tax benefits through future taxable income cannot be reasonably assured. We intend to maintain the valuation allowances until sufficient positive evidence exists to support the reversal of the valuation allowances. An increase in the valuation allowance would result in additional tax expense in such period. We make estimates and judgments about our future taxable income that are based on assumptions that are consistent with our plans and estimates. Should the actual amounts differ from our estimates, the amount of our valuation allowance could be materially impacted.
We must make certain estimates and judgments in determining income tax expense for financial statement purposes. These estimates and judgments occur in the calculation of tax credits and deductions, and in the calculation of certain tax assets and liabilities, which arise from differences in the timing of recognition of revenue and expense for tax and financial statement purposes, as well as the interest and penalties relating to these uncertain tax positions. Significant changes to these estimates may result in an increase or decrease to our tax provision in a subsequent period.
The calculation of our tax liabilities involves dealing with uncertainties in the application of complex tax laws. Our estimate for the potential outcome of any uncertain tax issue is based on detailed facts and circumstances of each issue. Resolution of these uncertainties in a manner inconsistent with our expectations could have a material impact on our results of operations and financial condition.
We adopted ASC 740 (formerly FASB Interpretation No. 48, “Accounting for Income Tax Uncertainties”) in the first quarter of fiscal year 2008. ASC 740 defines the threshold for recognizing the benefits of tax return positions in the financial statements as “more-likely-than-not” to be sustained by the taxing authority. The recently issued literature also provides guidance on the derecognition, measurement and classification of income tax uncertainties, along with any related interest and penalties. This standard also includes guidance concerning accounting for income tax uncertainties in interim periods and increases the level of disclosures associated with
69
Table of Contents
any recorded income tax uncertainties. See Note 8. “Income Taxes” in the Notes to Consolidated Financial Statements of this 2009 Form 10-K for further discussion.
As a result of the implementation of ASC 740, we recognize liabilities for uncertain tax positions based on the two-step process prescribed within the interpretation. The first step is to evaluate the tax position for recognition by determining if the weight of available evidence indicates that it is more likely than not that the position will be sustained on audit, including resolution of related appeals or litigation processes, if any. The second step requires us to estimate and measure the tax benefit as the largest amount that is more than 50% likely to be realized upon ultimate settlement. It is inherently difficult and subjective to estimate such amounts, as this requires us to determine the probability of various possible outcomes. We re-evaluate these uncertain tax positions on a quarterly basis. This evaluation is based on factors including, but not limited to, changes in facts or circumstances, changes in tax law, effectively settled issues under audit, and new audit activity. Such a change in recognition or measurement would result in the recognition of a tax benefit or an additional charge to the tax provision in the period.
Recent Accounting Pronouncements
Information with respect to our recent accounting pronouncements may be found in Note 1. “Principles of Consolidation and Summary of Significant Accounting Policies” in the Notes to Consolidated Financial Statements included in this Annual Report on Form 10-K, which section is incorporated herein by reference.
Recently Adopted Accounting Standards
Information with respect to our recently adopted accounting standards may be found in Note 1. “Principles of Consolidation and Summary of Significant Accounting Policies” in the Notes to Consolidated Financial Statements included in this Annual Report on Form 10-K, which section is incorporated herein by reference.
Selected Quarterly Results of Operations
The following selected quarterly data should be read in conjunction with the Consolidated Financial Statements and Notes and “Item 7 — Management’s Discussion and Analysis of Financial Condition and Results of Operations” in this Annual Report on Form 10-K. This information has been derived from our unaudited consolidated financial statements that, in our opinion, reflect all recurring adjustments necessary to fairly present our financial information when read in conjunction with our Consolidated Financial Statements and Notes. The results of operations for any quarter are not necessarily indicative of the results to be expected for any future period.
70
Table of Contents
Quarterly Consolidated Statements of Operations (Unaudited)
The table below sets forth selected unaudited financial data for each quarter for the last two fiscal years (in thousands, except for per share amounts):
| First Quarter |
Second Quarter |
Third Quarter |
Fourth Quarter |
|||||||||||||
| Fiscal Year Ended October 31, 2009 |
||||||||||||||||
| Net revenues: |
||||||||||||||||
| System Solutions |
$ | 185,841 | $ | 173,580 | $ | 182,198 | $ | 186,031 | ||||||||
| Services |
28,182 | 28,034 | 29,050 | 31,798 | ||||||||||||
| Total net revenues |
214,023 | 201,614 | 211,248 | 217,829 | ||||||||||||
| Cost of net revenues: |
||||||||||||||||
| System Solutions |
128,111 | 121,841 | 123,032 | 123,475 | ||||||||||||
| Services |
16,610 | 14,851 | 16,220 | 18,445 | ||||||||||||
| Total cost of net revenues |
144,721 | 136,692 | 139,252 | 141,920 | ||||||||||||
| Gross profit |
69,302 | 64,922 | 71,996 | 75,909 | ||||||||||||
| Operating expenses: |
||||||||||||||||
| Research and development |
17,872 | 15,024 | 15,554 | 16,698 | ||||||||||||
| Sales and marketing |
19,407 | 17,215 | 17,079 | 19,843 | ||||||||||||
| General and administrative (3) |
30,728 | 18,237 | 8,506 | 18,997 | ||||||||||||
| Impairment of goodwill (1) |
178,257 | (2,745 | ) | — | — | |||||||||||
| Amortization of purchased intangible assets |
5,871 | 4,827 | 4,835 | 4,890 | ||||||||||||
| Total operating expenses |
252,135 | 52,558 | 45,974 | 60,428 | ||||||||||||
| Operating income (loss) |
(182,833 | ) | 12,364 | 26,022 | 15,481 | |||||||||||
| Interest expense (3) |
(5,361 | ) | (4,285 | ) | 988 | (3,823 | ) | |||||||||
| Interest income |
647 | 369 | 259 | 242 | ||||||||||||
| Other income (expense), net (2) |
4,214 | 13,781 | (4,686 | ) | (1,969 | ) | ||||||||||
| Income (loss) before income taxes |
(183,333 | ) | 22,229 | 22,583 | 9,931 | |||||||||||
| Provision for (benefit of) income taxes |
(1,344 | ) | 3,673 | 673 | 6,244 | |||||||||||
| Net income (loss) |
$ | (181,989 | ) | $ | 18,556 | $ | 21,910 | $ | 3,687 | |||||||
| Basic net income (loss) per share |
$ | (2.15 | ) | $ | 0.22 | $ | 0.26 | $ | 0.04 | |||||||
| Diluted net income (loss) per share |
$ | (2.15 | ) | $ | 0.22 | $ | 0.26 | $ | 0.04 | |||||||
| (1) | During the first quarter of fiscal year 2009, we recorded $178.2 million in estimated goodwill impairment charges after we concluded that the carrying amount of the North America and Asia reporting units exceeded their implied fair values. We finalized the goodwill evaluation process and recorded a $2.7 million reduction of impairment charge during the second quarter of fiscal year 2009. |
| (2) | In the second quarter of fiscal year 2009, we repurchased and extinguished $33.5 million par value of our outstanding 1.375% Convertible Notes for $19.8 million, excluding accrued interest paid. As a result, we realized a $13.1 million gain on these transactions, net of a $0.6 million write-off of related deferred debt issuance costs. |
| (3) | In the third quarter of fiscal year 2009, we reduced our accrual for Brazilian customs penalties by $14.9 million (28.2 million Brazilian reais) as a result of the dismissal of one of the assessments. Of this amount, $9.8 million was reversed against general and administrative expenses and $5.1 million was reversed against interest expense. This reduction was partially offset by the accrual for legal fees related to a contingency legal representation agreement entered into between one of our Brazilian subsidiaries (prior to our acquisition of that subsidiary from Lipman) and Brazilian counsel pursuant to which our Brazilian subsidiary has agreed to pay to Brazilian counsel legal fees in the amount of $2.8 million (5.0 million Brazilian reais) for achieving the successful dismissal of the assessment. These legal fees were accrued and included in general and administrative expenses in the third quarter of fiscal year 2009. |
71
Table of Contents
| First Quarter |
Second Quarter |
Third Quarter |
Fourth Quarter |
|||||||||||||
| Fiscal Year Ended October 31, 2008 |
||||||||||||||||
| Net revenues: |
||||||||||||||||
| System Solutions |
$ | 155,601 | $ | 203,711 | $ | 228,766 | $ | 219,387 | ||||||||
| Services |
29,920 | 29,290 | 29,932 | 25,324 | ||||||||||||
| Total net revenues |
185,521 | 233,001 | 258,698 | 244,711 | ||||||||||||
| Cost of net revenues: |
||||||||||||||||
| System Solutions |
109,604 | 141,906 | 151,698 | 152,834 | ||||||||||||
| Services |
18,553 | 17,743 | 18,577 | 17,985 | ||||||||||||
| Total cost of net revenues |
128,157 | 159,649 | 170,275 | 170,819 | ||||||||||||
| Gross profit |
57,364 | 73,352 | 88,423 | 73,892 | ||||||||||||
| Operating expenses: |
||||||||||||||||
| Research and development |
22,462 | 17,159 | 17,558 | 18,443 | ||||||||||||
| Sales and marketing |
24,643 | 22,762 | 23,540 | 20,512 | ||||||||||||
| General and administrative (1) |
26,066 | 31,254 | 35,863 | 33,442 | ||||||||||||
| Impairment of goodwill and intangible assets (2) |
— | — | — | 289,119 | ||||||||||||
| Amortization of purchased intangible assets |
5,890 | 6,782 | 6,183 | 7,178 | ||||||||||||
| Total operating expenses |
79,061 | 77,957 | 83,144 | 368,694 | ||||||||||||
| Operating income (loss) |
(21,697 | ) | (4,605 | ) | 5,279 | (294,802 | ) | |||||||||
| Interest expense |
(6,440 | ) | (8,990 | ) | (6,447 | ) | (6,536 | ) | ||||||||
| Interest income |
2,088 | 1,395 | 1,194 | 1,304 | ||||||||||||
| Other income (expense), net |
(4,520 | ) | (1,914 | ) | 194 | (6,941 | ) | |||||||||
| Income (loss) before income taxes |
(30,569 | ) | (14,114 | ) | 220 | (306,975 | ) | |||||||||
| Provision for income taxes (3) |
2,929 | 3,873 | 7,419 | 59,663 | ||||||||||||
| Net loss |
$ | (33,498 | ) | $ | (17,987 | ) | $ | (7,199 | ) | $ | (366,638 | ) | ||||
| Basic net loss per share |
$ | (0.40 | ) | $ | (0.21 | ) | $ | (0.09 | ) | $ | (4.35 | ) | ||||
| Diluted net loss per share |
$ | (0.40 | ) | $ | (0.21 | ) | $ | (0.09 | ) | $ | (4.35 | ) | ||||
| (1) | During the fiscal year ended October 31, 2008, we incurred non-recurring general and administrative costs related to the independent investigation and 2007 quarterly restatement in the amounts of $6.1 million, $12.1 million, $15.4 million and $8.2 million in the first, second, third and fourth quarters, respectively. |
| (2) | In the fourth quarter of fiscal 2008, we recorded impairment charges in the amounts of $262.5 million and $26.6 million related to goodwill and developed and core technology intangible assets, respectively, due to lower revenue expectations in light of current operating performance and future operating expectations. |
| (3) | In the fourth quarter of fiscal 2008, we recorded tax expense of $62.3 million associated with the recording of a full valuation allowance against all beginning of the year balances for U.S. deferred tax assets. |
72
Table of Contents
| ITEM 7A. | QUANTITATIVE AND QUALITATIVE DISCLOSURES ABOUT MARKET RISK |
We are exposed to market risk related to changes in interest rates and foreign currency exchange rates. To mitigate some of these risks, we utilize derivative financial instruments to hedge these exposures. We do not use derivative financial instruments for speculative or trading purposes. We do not anticipate any material changes in our primary market risk exposures in fiscal year 2010.
Interest Rate Risk
We are exposed to interest rate risk related to our borrowings under the credit agreement we entered into on October 31, 2006. These borrowings generally bear interest based upon the one or three-month LIBOR rate. As of October 31, 2009, a 50 basis point increase in interest rates on our borrowings subject to variable interest rate fluctuations would increase our interest expense by approximately $1.1 million annually. We generally invest most of our cash in overnight and short-term instruments, which would earn more interest income if market interest rates rise and less interest income if market interest rates fall.
Foreign Currency Transaction Risk
A majority of our sales are made to customers outside the United States. A substantial portion of the net revenues we generate from such sales is denominated in currencies other than the U.S. dollar. Additionally, portions of our cost of net revenues and other operating expenses are incurred by our international operations and are denominated in local currencies. For consolidated reporting, revenue and expenses denominated in non-US currencies are translated to US dollars at average currency exchange rates for the period (“P&L Exposures”). Thus, even if foreign currency results were stable, fluctuating currency rates produce volatile reported results. We have made limited efforts to mitigate P&L Exposures by hedging with currency derivatives. As of October 31, 2009, we had one foreign exchange forward contract in place to hedge, in effect, the gross margin of a significant sales agreement in Brazil. The contract, designated as a Cash Flow Hedge pursuant to ASC 815 (formerly SFAS No. 133), had a remaining balance of $1.9 million at October 31, 2009.
We may in the future use foreign exchange forward or option contracts to hedge P&L Exposures, depending upon the risks of the exposures, the costs of hedging, and other considerations. However, hedges of P&L Exposures will only mitigate a portion of our risk and only for a short period. We will remain subject to the currency risk of P&L Exposures.
The balance sheets of our U.S. and international businesses have monetary assets and liabilities denominated in currencies other than the primary currency of such business (“Balance Sheet Exposures”), such as Canadian dollar receivables held by our U.S. business, or U.S. dollar payables of our Spanish business. As exchange rates fluctuate, Balance Sheet Exposures generate foreign currency transaction gains and losses, which are included in other income (expense), net in the Consolidated Statements of Operations.
We have in the past run a hedging program to mitigate the risk of Balance Sheet Exposures by entering into foreign exchange forward contracts. The objective is to have gains or losses of the foreign exchange forward contracts largely offset the losses or gains of the Balance Sheet Exposures. Foreign exchange forward contracts are included in Prepaid Expenses and Other Current Assets and Other Current Liabilities in the Consolidated Balance Sheets. The contracts are marked-to-market on a monthly basis with gains and losses included in other income (expense), net in the Consolidated Statements of Operations. In some instances, we seek to hedge transactions that are expected to become Balance Sheet Exposures in the very short-term, generally within one month. We do not use foreign exchange forward contracts for speculative or trading purposes.
73
Table of Contents
Our outstanding foreign exchange forward contracts as of October 31, 2009 are presented in the table below. All forward contracts are representative of the expected payments to be made under these instruments. The fair market value of the contracts represents the difference between the spot currency rate at October 31, 2009 and the contracted rate. All of these forward contracts mature within 35 days of October 31, 2009 (in thousands):
| Currency | Local Currency Contract Amount |
Currency | Contracted Amount |
Fair Market Value at October 31, 2009 |
||||||||||
| Contracts to buy USD |
||||||||||||||
| Brazilian real |
BRL | (20,714 | ) | USD | 11,905 | $ | 162 | |||||||
| Canadian dollar |
CAD | (7,500 | ) | USD | 6,960 | (9 | ) | |||||||
| British pound |
GBP | (3,000 | ) | USD | 4,912 | — | ||||||||
| Chinese yuan |
CNY | (45,000 | ) | USD | 6,591 | (1 | ) | |||||||
| Euro |
EUR | (13,000 | ) | USD | 19,193 | (2 | ) | |||||||
| India rupee |
INR | (150,000 | ) | USD | 3,185 | 22 | ||||||||
| $ | 172 | |||||||||||||
| Contracts to sell USD |
||||||||||||||
| Australian dollar |
AUD | 4,000 | USD | (3,602 | ) | $ | (4 | ) | ||||||
| Israeli shekel |
ILS | 38,800 | USD | (10,325 | ) | 5 | ||||||||
| $ | 1 | |||||||||||||
| $ | 173 | |||||||||||||
As of October 31, 2009, our Balance Sheet Exposures amounted to $79.6 million and were partially offset by forward contracts with a notional amount of $64.7 million. Based on our net exposures as of October 31, 2009, a 10% movement of currency rate would result in a gain or loss of $1.5 million.
Hedging of our Balance Sheet Exposures may not always be effective to protect us against currency exchange rate fluctuations, particularly in the event of imprecise forecasts of non-U.S. denominated assets and liabilities. In addition, at times we have not fully hedged our Balance Sheet Exposures, leaving us at risk to foreign exchange gains and losses on the un-hedged amounts. Furthermore, historically we have not hedged our P&L Exposures. Accordingly, if there were an adverse movement in exchange rates, we might suffer significant losses. For instance, for the years ended October 31, 2009, 2008 and 2007, we recorded $2.0 million, $11.3 million and $2.3 million in net foreign exchange losses, respectively, despite our hedging activities.
Equity Price Risk
In June 2007, we sold $316.2 million aggregate principal amount of 1.375% Senior Convertible Notes due 2012 (the “Notes”) which may be converted prior to maturity into cash and shares of our common stock upon the occurrence of certain events. In April 2009, we repurchased and extinguished $33.5 million par value of our outstanding Notes. As of October 31, 2009, the remaining par value of the Notes was $282.7 million. The conversion price of the Notes at issuance was approximately $44.02 per share. Upon conversion, we would pay the holder the cash value of the applicable number of shares of our common stock, up to the principal amount of the Notes. Amounts in excess of the principal amount, if any, would be paid in our common stock. Concurrently with the issuance of the Notes, we entered into note hedge transactions to reduce the financial impact from the conversion of the Notes and to mitigate any negative effect such conversion may have on the price of our common stock. We entered into the note hedge transactions with Lehman Brothers OTC Derivatives (“Lehman Derivatives”) and JP Morgan Chase Bank National Association, London Branch whereby we purchased options to purchase approximately 7.2 million shares of our common stock at a price of $44.02 per share and sold warrants to the same counterparties whereby they have the option to purchase 7.2 million shares of our common stock at a price of approximately $62.36.
74
Table of Contents
The filing by Lehman Brothers of a voluntary Chapter 11 bankruptcy petition in September 2008 constituted an “event of default” under the note hedge transactions with Lehman Derivatives. On September 21, 2008, we delivered a notice of termination to Lehman Derivatives to cancel 3.6 million options we purchased.
As of October 31, 2009, following the termination of the note hedge transaction with Lehman Derivatives as described above, we held an option to purchase up to 3.6 million shares of our common stock at $44.02, and have outstanding warrants for 7.2 million shares of our common stock at $62.36. Therefore, there is no impact if the share price of our common stock is below $44.02. For every $1 increase in the share price of our common stock from $44.02 up to $62.36, we expect to issue the equivalent of $3.6 million in shares of our common stock (at the relevant share price). For every $1 increase in the share price of our common stock above $62.36, we will be required to issue the equivalent of $7.2 million in shares of our common stock.
75
Table of Contents
| ITEM 8. | FINANCIAL STATEMENTS AND SUPPLEMENTAL DATA |
INDEX TO CONSOLIDATED FINANCIAL STATEMENTS
76
Table of Contents
REPORT OF INDEPENDENT REGISTERED PUBLIC ACCOUNTING FIRM
The Board of Directors and Stockholders
VeriFone Holdings, Inc.
We have audited the accompanying consolidated balance sheets of VeriFone Holdings, Inc., and subsidiaries as of October 31, 2009 and 2008, and the related consolidated statements of operations, stockholders’ equity and comprehensive income (loss) and cash flows for each of the three years in the period ended October 31, 2009. These financial statements are the responsibility of the Company’s management. Our responsibility is to express an opinion on these financial statements based on our audits.
We conducted our audits in accordance with the standards of the Public Company Accounting Oversight Board (United States). Those standards require that we plan and perform the audit to obtain reasonable assurance about whether the financial statements are free of material misstatement. An audit includes examining, on a test basis, evidence supporting the amounts and disclosures in the financial statements. An audit also includes assessing the accounting principles used and significant estimates made by management, as well as evaluating the overall financial statement presentation. We believe that our audits provide a reasonable basis for our opinion.
In our opinion, the financial statements referred to above present fairly, in all material respects, the consolidated financial position of VeriFone Holdings, Inc., and subsidiaries at October 31, 2009 and 2008, and the consolidated results of their operations and their cash flows for each of the three years in the period ended October 31, 2009, in conformity with U.S. generally accepted accounting principles.
VeriFone Holdings, Inc. changed its method of accounting for uncertain tax positions as of November 1, 2007.
We also have audited, in accordance with the standards of the Public Company Accounting Oversight Board (United States), VeriFone Holdings, Inc.’s internal control over financial reporting as of October 31, 2009, based on criteria established in Internal Control — Integrated Framework issued by the Committee of Sponsoring Organizations of the Treadway Commission and our report dated December 22, 2009 expressed an adverse opinion on the effectiveness of internal control over financial reporting.
Palo Alto, California
December 22, 2009
77
Table of Contents
REPORT OF INDEPENDENT REGISTERED PUBLIC ACCOUNTING FIRM
The Board of Directors and Stockholders
VeriFone Holdings, Inc.
We have audited VeriFone Holdings, Inc.’s internal control over financial reporting as of October 31, 2009, based on criteria established in Internal Control — Integrated Framework issued by the Committee of Sponsoring Organizations of the Treadway Commission (the “COSO criteria”). VeriFone Holdings, Inc.’s management is responsible for maintaining effective internal control over financial reporting and for its assessment of the effectiveness of internal control over financial reporting included in the accompanying Management’s Report on Internal Control over Financial Reporting. Our responsibility is to express an opinion on the Company’s internal control over financial reporting based on our audit.
We conducted our audit in accordance with the standards of the Public Company Accounting Oversight Board (United States). Those standards require that we plan and perform the audit to obtain reasonable assurance about whether effective internal control over financial reporting was maintained in all material respects. Our audit included obtaining an understanding of internal control over financial reporting, assessing the risk that a material weakness exists, testing and evaluating the design and operating effectiveness of internal control based on the assessed risk, and performing such other procedures as we considered necessary in the circumstances. We believe that our audit provides a reasonable basis for our opinion.
A company’s internal control over financial reporting is a process designed to provide reasonable assurance regarding the reliability of financial reporting and the preparation of financial statements for external purposes in accordance with generally accepted accounting principles. A company’s internal control over financial reporting includes those policies and procedures that (1) pertain to the maintenance of records that, in reasonable detail, accurately and fairly reflect the transactions and dispositions of the assets of the company; (2) provide reasonable assurance that transactions are recorded as necessary to permit preparation of financial statements in accordance with generally accepted accounting principles, and that receipts and expenditures of the company are being made only in accordance with authorizations of management and directors of the company; and (3) provide reasonable assurance regarding prevention or timely detection of unauthorized acquisition, use, or disposition of the company’s assets that could have a material effect on the financial statements.
Because of its inherent limitations, internal control over financial reporting may not prevent or detect misstatements. Also, projections of any evaluation of effectiveness to future periods are subject to the risk that controls may become inadequate because of changes in conditions, or that the degree of compliance with the policies or procedures may deteriorate.
A material weakness is a deficiency, or combination of deficiencies, in internal control over financial reporting, such that there is a reasonable possibility that a material misstatement of the company’s annual or interim financial statements will not be prevented or detected on a timely basis. In its assessment management has identified a material weakness in the identification, documentation and review of various income tax calculations, reconciliations and related supporting documentation. This material weakness was considered in determining the nature, timing, and extent of audit tests applied in our audit of the 2009 financial statements, and this report does not affect our report dated December 22, 2009 on those financial statements.
In our opinion, because of the effect of the material weakness described above on the achievement of the objectives of the control criteria, VeriFone Holdings, Inc. has not maintained effective internal control over financial reporting as of October 31, 2009, based on the COSO criteria.
Palo Alto, California
December 22, 2009
78
Table of Contents
VERIFONE HOLDINGS, INC. AND SUBSIDIARIES
CONSOLIDATED STATEMENTS OF OPERATIONS
| Years Ended October 31, | ||||||||||||
| 2009 | 2008 | 2007 | ||||||||||
| (In thousands, except per share data) | ||||||||||||
| Net revenues: |
||||||||||||
| System Solutions |
$ | 727,650 | $ | 807,465 | $ | 792,289 | ||||||
| Services |
117,064 | 114,466 | 110,603 | |||||||||
| Total net revenues |
844,714 | 921,931 | 902,892 | |||||||||
| Cost of net revenues: |
||||||||||||
| System Solutions |
496,459 | 556,042 | 545,995 | |||||||||
| Services |
66,126 | 72,858 | 57,665 | |||||||||
| Total cost of net revenues |
562,585 | 628,900 | 603,660 | |||||||||
| Gross profit |
282,129 | 293,031 | 299,232 | |||||||||
| Operating expenses: |
||||||||||||
| Research and development |
65,148 | 75,622 | 65,430 | |||||||||
| Sales and marketing |
73,544 | 91,457 | 96,295 | |||||||||
| General and administrative |
76,468 | 126,625 | 80,704 | |||||||||
| Impairment of goodwill and purchased intangible assets |
175,512 | 289,119 | — | |||||||||
| Amortization of purchased intangible assets |
20,423 | 26,033 | 21,571 | |||||||||
| In-process research and development |
— | — | 6,752 | |||||||||
| Total operating expenses |
411,095 | 608,856 | 270,752 | |||||||||
| Operating income (loss) |
(128,966 | ) | (315,825 | ) | 28,480 | |||||||
| Interest expense |
(12,481 | ) | (28,413 | ) | (36,598 | ) | ||||||
| Interest income |
1,517 | 5,981 | 6,702 | |||||||||
| Other income (expense), net |
11,340 | (13,181 | ) | (7,882 | ) | |||||||
| Loss before income taxes |
(128,590 | ) | (351,438 | ) | (9,298 | ) | ||||||
| Provision for income taxes |
9,246 | 73,884 | 24,718 | |||||||||
| Net loss |
$ | (137,836 | ) | $ | (425,322 | ) | $ | (34,016 | ) | |||
| Net loss per share: |
||||||||||||
| Basic |
$ | (1.63 | ) | $ | (5.05 | ) | $ | (0.41 | ) | |||
| Diluted |
$ | (1.63 | ) | $ | (5.05 | ) | $ | (0.41 | ) | |||
| Weighted average number of shares used in computing net loss per share: |
||||||||||||
| Basic |
84,473 | 84,220 | 82,194 | |||||||||
| Diluted |
84,473 | 84,220 | 82,194 | |||||||||
The accompanying notes are an integral part of these consolidated financial statements.
79
Table of Contents
VERIFONE HOLDINGS, INC. AND SUBSIDIARIES
CONSOLIDATED BALANCE SHEETS
| October 31, | ||||||||
| 2009 | 2008 | |||||||
| (In thousands, except par value) | ||||||||
| ASSETS | ||||||||
| Current assets: |
||||||||
| Cash and cash equivalents |
$ | 324,996 | $ | 157,160 | ||||
| Accounts receivable, net of allowances of $4,556 and $5,033 |
157,357 | 170,234 | ||||||
| Inventories |
95,921 | 168,360 | ||||||
| Deferred tax assets, net |
7,982 | 9,465 | ||||||
| Prepaid expenses and other current assets |
36,526 | 57,631 | ||||||
| Total current assets |
622,782 | 562,850 | ||||||
| Property, plant, and equipment, net |
46,978 | 52,309 | ||||||
| Purchased intangible assets, net |
52,974 | 92,637 | ||||||
| Goodwill |
150,845 | 321,903 | ||||||
| Deferred tax assets, net |
4,158 | 1,276 | ||||||
| Debt issuance costs, net |
8,424 | 11,704 | ||||||
| Other assets |
32,749 | 37,073 | ||||||
| Total assets |
$ | 918,910 | $ | 1,079,752 | ||||
| LIABILITIES AND STOCKHOLDERS’ EQUITY | ||||||||
| Current liabilities: |
||||||||
| Accounts payable |
$ | 87,094 | $ | 81,188 | ||||
| Income taxes payable |
2,650 | 2,185 | ||||||
| Accrued compensation |
20,942 | 19,477 | ||||||
| Accrued warranty |
10,870 | 8,527 | ||||||
| Deferred revenue, net |
45,668 | 47,687 | ||||||
| Deferred tax liabilities |
408 | 1,805 | ||||||
| Accrued expenses |
7,844 | 9,475 | ||||||
| Other current liabilities |
64,478 | 91,168 | ||||||
| Current portion of long-term debt |
5,699 | 5,022 | ||||||
| Total current liabilities |
245,653 | 266,534 | ||||||
| Accrued warranty |
2,938 | 1,490 | ||||||
| Deferred revenue, net |
18,294 | 13,292 | ||||||
| Long-term debt, less current portion |
504,165 | 543,357 | ||||||
| Deferred tax liabilities |
68,084 | 68,928 | ||||||
| Other long-term liabilities |
45,326 | 41,939 | ||||||
| 884,460 | 935,540 | |||||||
| Commitments and contingencies |
||||||||
| Minority interest |
2,401 | 2,058 | ||||||
| Stockholders’ equity: |
||||||||
| Preferred Stock: 10,000 shares authorized as of October 31, 2009 and 2008; no shares issued and outstanding as of October 31, 2009 and 2008 |
— | — | ||||||
| Common Stock: $0.01 par value, 200,000 shares authorized as of October 31, 2009 and 2008; 84,544 and 84,443 shares issued and outstanding as of October 31, 2009 and 2008 |
845 | 845 | ||||||
| Additional paid-in-capital |
679,250 | 655,974 | ||||||
| Accumulated deficit |
(642,009 | ) | (504,173 | ) | ||||
| Accumulated other comprehensive loss |
(6,037 | ) | (10,492 | ) | ||||
| Total stockholders’ equity |
32,049 | 142,154 | ||||||
| Total liabilities and stockholders’ equity |
$ | 918,910 | $ | 1,079,752 | ||||
The accompanying notes are an integral part of these consolidated financial statements.
80
Table of Contents
VERIFONE HOLDINGS, INC. AND SUBSIDIARIES
CONSOLIDATED STATEMENTS OF CHANGES IN STOCKHOLDERS’ EQUITY
AND COMPREHENSIVE INCOME (LOSS)
| Common Stock Voting |
Additional Paid-in Capital |
Accumulated Deficit |
Accumulated Other Comprehensive Income (Loss) |
Total Stockholders’ Equity |
|||||||||||||||||
| Shares | Amount | ||||||||||||||||||||
| (In thousands) | |||||||||||||||||||||
| Balance as of October 31, 2006 |
68,148 | $ | 682 | $ | 140,569 | $ | (43,468 | ) | $ | 958 | $ | 98,741 | |||||||||
| Issuance of common stock, net of issuance costs |
2,450 | 24 | 37,744 | — | — | 37,768 | |||||||||||||||
| Common stock issued for acquisition of Lipman |
13,462 | 135 | 417,471 | — | — | 417,606 | |||||||||||||||
| Fair value of options assumed in acquisition of Lipman |
— | — | 17,622 | — | — | 17,622 | |||||||||||||||
| Stock-based compensation |
— | — | 28,892 | — | — | 28,892 | |||||||||||||||
| Tax benefit on stock-based compensation |
— | — | 11,464 | — | — | 11,464 | |||||||||||||||
| Purchase of convertible note hedge, net of tax |
— | — | (49,546 | ) | — | — | (49,546 | ) | |||||||||||||
| Issuance of warrants |
— | — | 31,188 | — | — | 31,188 | |||||||||||||||
| Comprehensive loss: |
|||||||||||||||||||||
| Net loss |
— | — | — | (34,016 | ) | — | (34,016 | ) | |||||||||||||
| Other comprehensive loss: |
|||||||||||||||||||||
| Foreign currency translation adjustments |
— | — | — | — | 21,221 | 21,221 | |||||||||||||||
| Unrealized loss on marketable securities, net of tax |
— | — | — | — | (1 | ) | (1 | ) | |||||||||||||
| Interest rate hedges, net of tax |
— | — | — | — | (17 | ) | (17 | ) | |||||||||||||
| Total comprehensive loss |
(12,813 | ) | |||||||||||||||||||
| Balance as of October 31, 2007 |
84,060 | 841 | 635,404 | (77,484 | ) | 22,161 | 580,922 | ||||||||||||||
| Cumulative effect from the adoption of ASC 740 (formerly FIN 48) |
— | — | — | (1,367 | ) | — | (1,367 | ) | |||||||||||||
| Issuance of common stock, net of issuance costs |
383 | 4 | 2,178 | — | — | 2,182 | |||||||||||||||
| Stock-based compensation |
— | — | 17,916 | — | — | 17,916 | |||||||||||||||
| Tax benefit on stock-based compensation |
— | — | 476 | — | — | 476 | |||||||||||||||
| Comprehensive loss: |
|||||||||||||||||||||
| Net loss |
— | — | — | (425,322 | ) | — | (425,322 | ) | |||||||||||||
| Other comprehensive loss: |
|||||||||||||||||||||
| Foreign currency translation adjustments |
— | — | — | — | (31,029 | ) | (31,029 | ) | |||||||||||||
| Interest rate hedges, net of tax |
— | — | — | — | 63 | 63 | |||||||||||||||
| Unfunded portion of pension plan obligations |
— | — | — | — | (1,687 | ) | (1,687 | ) | |||||||||||||
| Total comprehensive loss |
(457,975 | ) | |||||||||||||||||||
| Balance as of October 31, 2008 |
84,443 | 845 | 655,974 | (504,173 | ) | (10,492 | ) | 142,154 | |||||||||||||
| Issuance of common stock, net of issuance costs |
101 | — | 403 | — | — | 403 | |||||||||||||||
| Stock-based compensation |
— | — | 22,873 | — | — | 22,873 | |||||||||||||||
| Comprehensive loss: |
|||||||||||||||||||||
| Net loss |
— | — | — | (137,836 | ) | — | (137,836 | ) | |||||||||||||
| Other comprehensive loss: |
|||||||||||||||||||||
| Foreign currency translation adjustments |
— | — | — | — | 4,297 | 4,297 | |||||||||||||||
| Unrealized loss on cash flow hedge |
— | — | — | — | (82 | ) | (82 | ) | |||||||||||||
| Unfunded portion of pension plan obligations |
— | — | — | — | 240 | 240 | |||||||||||||||
| Total comprehensive loss |
(133,381 | ) | |||||||||||||||||||
| Balance as of October 31, 2009 |
84,544 | $ | 845 | $ | 679,250 | $ | (642,009 | ) | $ | (6,037 | ) | $ | 32,049 | ||||||||
The accompanying notes are an integral part of these consolidated financial statements.
81
Table of Contents
VERIFONE HOLDINGS, INC. AND SUBSIDIARIES
CONSOLIDATED STATEMENTS OF CASH FLOWS
| Years Ended October 31, | ||||||||||||
| 2009 | 2008 | 2007 | ||||||||||
| (In thousands) | ||||||||||||
| Cash flows from operating activities |
||||||||||||
| Net loss |
$ | (137,836 | ) | $ | (425,322 | ) | $ | (34,016 | ) | |||
| Adjustments to reconcile net loss to net cash provided by (used in) operating activities: |
||||||||||||
| Amortization of purchased intangible assets |
40,837 | 58,263 | 59,468 | |||||||||
| Depreciation and amortization of property, plant, and equipment and other assets |
17,125 | 13,376 | 7,766 | |||||||||
| Amortization of capitalized software |
3,541 | 1,691 | 1,220 | |||||||||
| In-process research and development |
— | — | 6,752 | |||||||||
| Impairment of goodwill and purchased intangible assets |
175,512 | 289,119 | — | |||||||||
| Impairment of equity investment |
— | 2,236 | — | |||||||||
| Gain on debt extinguishment |
(13,103 | ) | — | 4,764 | ||||||||
| Gain on reversal of Lipman pre-acquisition contingency |
(14,870 | ) | — | — | ||||||||
| Write-off of capitalized software |
760 | 3,087 | — | |||||||||
| Write-off of property, plant, and equipment |
1,481 | 341 | 271 | |||||||||
| Amortization of debt issuance costs |
2,727 | 2,634 | 1,756 | |||||||||
| Stock-based compensation |
22,873 | 17,916 | 28,892 | |||||||||
| Deferred income taxes |
1,726 | 58,352 | 9,203 | |||||||||
| Other non cash items |
214 | (10 | ) | (135 | ) | |||||||
| Net cash provided by operating activities before changes in working capital |
100,987 | 21,683 | 85,941 | |||||||||
| Changes in operating assets and liabilities: |
||||||||||||
| Accounts receivable, net |
13,034 | 24,615 | (39,493 | ) | ||||||||
| Inventories |
72,544 | (60,567 | ) | 45,133 | ||||||||
| Prepaid expenses and other assets |
24,138 | (3,201 | ) | (46,648 | ) | |||||||
| Accounts payable |
5,906 | (24,317 | ) | 28,144 | ||||||||
| Income taxes payable |
465 | 1,672 | 20,391 | |||||||||
| Tax benefit from stock-based compensation |
(98 | ) | (1,176 | ) | (11,464 | ) | ||||||
| Accrued compensation |
1,393 | (1,912 | ) | (2,975 | ) | |||||||
| Accrued warranty |
3,791 | (1,650 | ) | (1,910 | ) | |||||||
| Deferred revenue, net |
2,982 | 5,172 | 14,495 | |||||||||
| Accrued expenses and other liabilities |
(22,533 | ) | 31,053 | (2,344 | ) | |||||||
| Net cash provided by (used in) operating activities |
202,609 | (8,628 | ) | 89,270 | ||||||||
| Cash flows from investing activities |
||||||||||||
| Purchases of property, plant, and equipment, net |
(9,728 | ) | (17,597 | ) | (30,225 | ) | ||||||
| Software development costs capitalized |
(2,326 | ) | (4,454 | ) | (7,740 | ) | ||||||
| Acquisition of businesses, net of cash and cash equivalents acquired |
(1,330 | ) | (15,753 | ) | (267,531 | ) | ||||||
| Purchases of equity investments |
(2,721 | ) | — | (5,700 | ) | |||||||
| Other |
110 | — | (500 | ) | ||||||||
| Net cash used in investing activities |
(15,995 | ) | (37,804 | ) | (311,696 | ) | ||||||
| Cash flows from financing activities |
||||||||||||
| Proceeds from advance against bankers acceptances |
8,638 | — | — | |||||||||
| Proceeds from debt, net of costs |
— | 3,408 | 613,197 | |||||||||
| Repayments of debt and advances against bankers acceptances |
(33,763 | ) | (8,210 | ) | (263,859 | ) | ||||||
| Payment of debt amendment fees |
— | (1,645 | ) | — | ||||||||
| Purchase of hedge on convertible debt |
— | — | (80,236 | ) | ||||||||
| Sale of warrants |
— | — | 31,188 | |||||||||
| Proceeds from exercises of stock options |
475 | 3,026 | 37,088 | |||||||||
| Tax benefit of stock-based compensation |
98 | 1,176 | 11,464 | |||||||||
| Investment in subsidiary by minority stockholder |
— | — | 1,050 | |||||||||
| Other |
— | — | 28 | |||||||||
| Net cash provided by (used in) financing activities |
(24,552 | ) | (2,245 | ) | 349,920 | |||||||
| Effect of foreign currency exchange rate changes on cash and cash equivalents |
5,774 | (9,164 | ) | 943 | ||||||||
| Net increase (decrease) in cash and cash equivalents |
167,836 | (57,841 | ) | 128,437 | ||||||||
| Cash and cash equivalents, beginning of year |
157,160 | 215,001 | 86,564 | |||||||||
| Cash and cash equivalents, end of year |
$ | 324,996 | $ | 157,160 | $ | 215,001 | ||||||
| Supplemental disclosures of cash flow information |
||||||||||||
| Cash paid for interest |
$ | 15,564 | $ | 19,015 | $ | 29,765 | ||||||
| Cash paid (received) for income taxes |
$ | (2,666 | ) | $ | (8,049 | ) | $ | 27,301 | ||||
| Schedule of noncash transactions |
||||||||||||
| Acquisition of property, plant and equipment under capital lease |
$ | 202 | $ | — | $ | — | ||||||
| Debt issuance costs withheld from proceeds |
$ | — | $ | — | $ | 8,388 | ||||||
| Issuance of common stock and stock options for acquisition |
$ | — | $ | — | $ | 435,228 | ||||||
The accompanying notes are an integral part of these consolidated financial statements.
82
Table of Contents
VERIFONE HOLDINGS, INC. AND SUBSIDIARIES
NOTES TO CONSOLIDATED FINANCIAL STATEMENTS
Note 1. Principles of Consolidation and Summary of Significant Accounting Policies
Business Description
VeriFone Holdings, Inc. (“VeriFone” or the “Company”) was incorporated in the state of Delaware on June 13, 2002 in order to acquire VeriFone, Inc on July 1, 2002. VeriFone, Inc. was incorporated in 1981 and became the Company’s principal operating subsidiary on July 1, 2002. Prior to the Company’s initial public offering on May 4, 2005, VeriFone was majority-owned by GTCR Fund VII, L.P., an equity fund managed by GTCR Golder Rauner, LLC (“GTCR”), a private equity firm. VeriFone designs, markets, and services electronic payment solutions that enable secure electronic payments among consumers, merchants, and financial institutions.
Prior to the acquisition of Lipman Electronic Engineering Ltd (“Lipman”) on November 1, 2006, Lipman was a provider of electronic payment systems headquartered in Israel that developed, manufactured and marketed a variety of handheld, wireless and landline POS terminals, electronic cash registers, retail ATM units, PIN pads and smart card readers, as well as integrated PIN and smart card solutions.
Principles of Consolidation
The accompanying consolidated financial statements include the accounts of the Company and its wholly-owned and majority-owned subsidiaries. All significant intercompany accounts and transactions have been eliminated and amounts pertaining to the non-controlling ownership interest held by third parties in the operating results and financial position of the Company’s majority-owned subsidiaries are reported as minority interest.
Use of Estimates
The preparation of financial statements in conformity with U.S. generally accepted accounting principles requires management to make estimates and assumptions that affect the reported amounts of assets and liabilities and disclosure of contingent assets and liabilities at the date of the financial statements and the reported amounts of revenues and expenses during the reporting periods. The Company bases its estimates on historical experience and various other assumptions that are believed to be reasonable under the circumstances. Actual results could differ from those estimates, and such differences may be material to the consolidated financial statements.
Subsequent Events
The Company has evaluated subsequent events through the date and time the consolidated financial statements were filed on December 22, 2009.
Reclassifications
Certain amounts reported in previous periods have been reclassified to conform to the current period presentation. The reclassifications did not affect previously reported revenues, total operating expense, operating income, net income, or stockholders’ equity.
Foreign Currency Translation and Remeasurement
The Company translates the assets and liabilities of its non-U.S. dollar functional currency subsidiaries into U.S. dollars using exchange rates in effect at the end of each period. Revenue and expenses for these subsidiaries are translated using rates that approximate those in effect during the period. Gains and losses from these translations are credited or charged to foreign currency translation included in accumulated other comprehensive
83
Table of Contents
VERIFONE HOLDINGS, INC. AND SUBSIDIARIES
NOTES TO CONSOLIDATED FINANCIAL STATEMENTS—(Continued)
income (loss) in shareholders’ equity. The Company’s subsidiaries that use the U.S. dollar as their functional currency remeasure monetary assets and liabilities at exchange rates in effect at the end of each period, and nonmonetary assets and liabilities at historical rates. Gains and losses from these remeasurements have been included in the Company’s results of operations.
Revenue Recognition
The Company’s revenue recognition policy is consistent with applicable revenue recognition guidance and interpretations, including the requirements of FASB Accounting Standard Codification (“ASC”) 605-25 (formerly Emerging Issues Task Force (“EITF”) Issue No. 00-21, Revenue Arrangements with Multiple Deliverables), ASC 985-605 (formerly Statement of Position (“SOP”) 97-2 Software Revenue Recognition), ASC 605-35 (formerly SOP 81-1, Accounting for Performance of Construction-Type and Certain Production Type Contracts), ASC 605 (formerly Staff Accounting Bulletin (“SAB”) No. 104, Revenue Recognition), and other applicable revenue recognition guidance and interpretations.
The Company records revenue when all of the following criteria are met: (i) there is persuasive evidence that an arrangement exists; (ii) delivery of the products and/or services has occurred; (iii) the selling price is fixed or determinable; and (iv) collection is reasonably assured. Cash received in advance of revenue recognition is recorded as deferred revenue.
Net revenues from System Solutions sales to end-users, resellers, value-added resellers, and distributors are recognized upon shipment of the product with the following exceptions:
| • | if a product is shipped free-on-board destination, revenue is recognized when the shipment is delivered, or |
| • | if an acceptance or a contingency clause exists, revenue is recognized upon the earlier of receipt of the acceptance letter or when the clause lapses. |
End-users, resellers, value-added resellers, and distributors generally have no rights of return, stock rotation rights, or price protection.
The Company’s System Solutions sales include software that is incidental to the electronic payment devices and services included in its sales arrangements.
The Company enters into revenue arrangements for individual products or services. As a System Solutions provider, the Company’s sales arrangements often include support services in addition to electronic payment devices (“multiple deliverables”). These services may include installation, training, consulting, customer support, product maintenance, and/or refurbishment arrangements.
Revenue arrangements with multiple deliverables are evaluated to determine if the deliverables (items) should be divided into more than one unit of accounting. An item can generally be considered a separate unit of accounting if all of the following criteria are met:
| • | the delivered item(s) has value to the customer on a standalone basis; |
| • | there is objective and reliable evidence of the fair value of the undelivered item(s); and |
| • | if the arrangement includes a general right of return relative to the delivered item(s), delivery or performance of the undelivered item(s) is considered probable and substantially in the control of the Company. |
84
Table of Contents
VERIFONE HOLDINGS, INC. AND SUBSIDIARIES
NOTES TO CONSOLIDATED FINANCIAL STATEMENTS—(Continued)
Deliverables which do not meet these criteria are combined into a single unit of accounting.
If there is objective and reliable evidence of fair value for all units of accounting, the arrangement consideration is allocated to the separate units of accounting based on their relative fair values. In cases where there is objective and reliable evidence of the fair value(s) of the undelivered item(s) in an arrangement but no such evidence for one or more of the delivered item(s), the residual method is used to allocate the arrangement consideration. In cases in which there is no objective and reliable evidence of the fair value(s) of the undelivered item(s), the Company defers all revenues for the arrangement until the period in which the last item is delivered.
For revenue arrangements with multiple deliverables, upon shipment of its electronic payment devices, the Company defers revenue for the aggregate fair value for all remaining undelivered elements and recognizes the residual amount within the arrangement as revenue for the delivered items as prescribed in ASC 605-25. Fair value is determined based on the price charged when each element is sold separately and/or the price charged by third parties for similar services.
Net revenues from services such as customer support and product maintenance are initially deferred and then recognized on a straight-line basis over the term of the contract. Net revenues from services such as installations, equipment repairs, refurbishment arrangements, training, and consulting are recognized as the services are rendered.
For software development contracts, the Company recognizes revenue using the completed contract method pursuant to ASC 605-35. During the period of performance of such contracts, billings and costs are accumulated on the balance sheet, but no profit is recorded before completion or substantial completion of the work. The Company uses customers’ acceptance of such products as the specific criteria to determine when such contracts are substantially completed. Provisions for losses on software development contracts are recorded in the period they become evident.
For operating lease arrangements, the Company recognizes the revenue and corresponding costs ratably over the term of the lease.
In addition, the Company sells products to leasing companies that, in turn, lease these products to end-users. In transactions where the leasing companies have no recourse to the Company in the event of default by the end-user, the Company recognizes revenue at the point of shipment or point of delivery, depending on the shipping terms and when all the other revenue recognition criteria have been met. In arrangements where the leasing companies have substantive recourse to the Company in the event of default by the end-user, the Company recognizes both the product revenue and the related cost of the product as the payments are made to the leasing company by the end-user, generally ratably over the lease term.
The Company presents revenues net of sales taxes and value-added taxes in its Consolidated Statement of Operations in accordance with ASC 605-45 (formerly EITF No. 06-3, How Taxes Collected From Customers and Remitted to Governmental Authorities should Be Presented in the Income Statements).
Segment Reporting
The Company maintains two reportable segments, North America, consisting of the United States and Canada, and International, consisting of all other countries from which the Company derives revenues.
Cash and Cash Equivalents
Cash and cash equivalents consist of cash, money market funds, and other highly liquid investments with maturities of three months or less when purchased.
85
Table of Contents
VERIFONE HOLDINGS, INC. AND SUBSIDIARIES
NOTES TO CONSOLIDATED FINANCIAL STATEMENTS—(Continued)
Fair Value of Financial Instruments
The Company applies fair value accounting for all financial assets and liabilities and non-financial assets and liabilities that are recognized or disclosed at fair value in the financial statements on a recurring basis. The Company defines fair value as the price that would be received from selling an asset or paid to transfer a liability in an orderly transaction between market participants at the measurement date. When determining the fair value measurements for assets and liabilities, which are required to be recorded at fair value, the Company considers the principal or most advantageous market in which the Company would transact and the market-based risk measurements or assumptions that market participants would use in pricing the asset or liability, such as inherent risk, transfer restrictions and credit risk.
Financial instruments consist principally of cash and cash equivalents, accounts receivable, accounts payable, long-term debt, foreign exchange forward contracts, Israeli severance funds and penalties on the 1.375% Senior Convertible Notes. The estimated fair value of cash, accounts receivable, and accounts payable approximates their carrying value. Cash equivalents, foreign exchange forward contracts, Israeli severance funds and penalties on the 1.375% Senior Convertible Notes are recorded at fair value. The estimated fair value of long-term debt related to the Term B loan approximates its carrying value since the rate of interest on the long-term debt adjusts to market rates on a periodic basis. The fair value of the Company’s 1.375% Senior Convertible Notes was approximately $241.4 million (carrying value of $282.7 million) and $191.0 million (carrying value of $316.2 million) as of October 31, 2009 and 2008, respectively.
Derivative Financial Instruments
The Company accounts for its financial derivatives as either assets or liabilities and carries them at fair value. Changes in the fair value of derivatives that do not qualify or are not effective as hedges are recognized currently in earnings. The Company does not use derivative financial instruments for speculative or trading purposes, nor does it hold or issue leveraged derivative financial instruments.
The Company uses foreign exchange forward contracts to hedge certain existing and anticipated foreign currency denominated transactions. Foreign exchange forward contracts generally mature within 90 days of inception. Gains and losses arising from the effective portion of foreign exchange forward contracts that are designated as cash flow hedging instruments are recorded in accumulated other comprehensive income (loss) (“AOCI”) and are subsequently reclassified into earnings in the same period or periods during which the underlying transactions affect earnings. Gains and losses on the derivative representing either hedge ineffectiveness or hedge components excluded from the assessment of effectiveness are recognized in current earnings. Gains and losses arising from changes in the fair values of foreign exchange forward contracts that are not designated as hedging instruments are recognized in current earnings.
The Company formally documents relationships between hedging instruments and associated hedged items. This documentation includes: identification of the specific foreign currency asset, liability, or forecasted transaction being hedged; the nature of the risk being hedged; the hedge objective; and, the method of assessing hedge effectiveness. Hedge effectiveness is formally assessed, both at hedge inception and on an ongoing basis, to determine whether the derivatives used in hedging transactions are highly effective in offsetting changes in foreign currency denominated assets, liabilities, and anticipated cash flows of hedged items. When an anticipated transaction is no longer likely to occur, the corresponding derivative instrument is ineffective as a hedge, and changes in fair value of the instrument are recognized in current earnings.
86
Table of Contents
VERIFONE HOLDINGS, INC. AND SUBSIDIARIES
NOTES TO CONSOLIDATED FINANCIAL STATEMENTS—(Continued)
Inventories
Inventories are stated at the lower of standard cost or market. Standard costs approximate actual costs under the first-in, first-out (“FIFO”) method. The Company regularly monitors inventory quantities on hand and records write-downs for excess and obsolete inventories based primarily on the shipment history and the Company’s estimated forecast of product demand. Such write-downs establish a new cost-basis of accounting for the related inventory. Actual inventory losses may differ from management’s estimates.
Property, Plant, and Equipment, net
Property, plant, and equipment are stated at cost, net of accumulated depreciation and amortization. Property, plant, and equipment are depreciated on a straight-line basis over the estimated useful lives of the assets, generally ranging from two to ten years, except buildings which are depreciated over 50 years. The cost of equipment under capital leases is recorded at the lower of the present value of the minimum lease payments or the fair value of the assets and is amortized on a straight-line basis over the shorter of the term of the related lease or the estimated useful life of the asset. Amortization of assets under capital leases is included with depreciation expense.
Research and Development Costs
Research and development costs are generally expensed as incurred. In the fiscal years ended October 31, 2009, 2008 and 2007, the Company capitalized $2.3 million, $4.5 million and $7.7 million, respectively, in accordance with ASC 985 (formerly SFAS No. 86, Accounting for the Costs of Computer Software to be Sold, Leased, or Otherwise Marketed). The capitalized software costs are amortized on a straight-line basis to cost of sales over the estimated life of the products, up to three years, commencing when the respective products are available to customers. Total amortization related to capitalized software development costs were $3.5 million, $1.7 million and $1.2 million for the years ended October 31, 2009, 2008 and 2007, respectively. Unamortized capitalized software development costs as of October 31, 2009 and 2008 of $8.4 million and $10.1 million, respectively, are recorded in Other Assets in the Consolidated Balance Sheets.
Business Combinations
The Company accounts for business combinations in accordance with ASC 805 (formerly FAS No. 141, Business Combinations), which requires the purchase method of accounting for business combinations. In accordance with ASC 805, the Company determines the recognition of intangible assets based on the following criteria: (i) the intangible asset arises from contractual or other rights; or (ii) the intangible is separable or divisible from the acquired entity and capable of being sold, transferred, licensed, returned or exchanged. In accordance with ASC 805, the Company allocates the purchase price of its business combinations to the tangible assets, liabilities and intangible assets acquired, including in-process research and development (“IPR&D”), based on their estimated fair values. The excess purchase price over those fair values is recorded as goodwill.
The Company must make valuation assumptions that require significant estimates, especially with respect to intangible assets. Critical estimates in valuing certain intangible assets include, but are not limited to future expected cash flows from customer contracts, customer lists, distribution agreements and acquired developed technologies, expected costs to develop IPR&D into commercially viable products, estimated cash flows from projects when completed and discount rates. The Company estimates fair value based upon assumptions the Company believes to be reasonable, but which are inherently uncertain and unpredictable and, as a result, actual results may differ from estimates. Other estimates such as restructuring accruals associated with the accounting for acquisitions may change as additional information becomes available regarding the assets acquired and liabilities assumed.
87
Table of Contents
VERIFONE HOLDINGS, INC. AND SUBSIDIARIES
NOTES TO CONSOLIDATED FINANCIAL STATEMENTS—(Continued)
Goodwill
Goodwill and purchased intangible assets have been recorded as a result of the Company’s acquisitions. Goodwill is not amortized for accounting purposes. The Company is required to perform an annual impairment test of goodwill. Should certain events or indicators of impairment occur between annual impairment tests, the Company would perform the impairment test of goodwill when those events or indicators occurred. In the first step of the analysis, the Company’s assets and liabilities, including existing goodwill and other intangible assets, are assigned to the identified reporting units to determine the carrying value of the reporting units. Based on how the business is managed, the Company has five reporting units. Goodwill is allocated to each reporting unit based on its relative contribution to the Company’s overall operating results. If the carrying value of a reporting unit is in excess of its fair value, an impairment may exist, and the Company must perform the second step of the analysis, in which the implied fair value of the goodwill is compared to its carrying value to determine the impairment charge, if any.
The fair value of the reporting units is determined using the income approach. The income approach focuses on the income-producing capability of an asset, measuring the current value of the asset by calculating the present value of its future economic benefits such as cash earnings, cost savings, tax deductions, and proceeds from disposition. Value indications are developed by discounting expected cash flows to their present value at a rate of return that incorporates the risk-free rate for the use of funds, the expected rate of inflation, and risks associated with the particular investment.
Accounting for Long-Lived Assets
The Company periodically evaluates whether changes have occurred that would require revision of the remaining useful life of property, plant, and equipment and purchased intangible assets or render them not recoverable. If such circumstances arise, the Company uses an estimate of the undiscounted value of expected future operating cash flows to determine whether the long-lived assets are impaired. If the aggregate undiscounted cash flows are less than the carrying value of the assets, the resulting impairment charge to be recorded is calculated based on the excess of the carrying value of the assets over the fair value of such assets, with the fair value determined based on an estimate of discounted future cash flows.
Purchased intangible assets are amortized over their estimated useful lives, generally ranging from one and one-half to twenty years.
Debt Issuance Costs
Debt issuance costs are stated at cost, net of accumulated amortization. Amortization expense is calculated using the effective interest method and is recorded in interest expense in the accompanying Consolidated Statements of Operations. In the second quarter of fiscal year 2009, the Company recorded a $0.6 million write-off of debt issuance costs as a result of the repurchase and extinguishment of $33.5 million of its 1.375% Convertible Notes. During the fiscal year ended October 31, 2007, the Company recorded a $4.8 million write-off of debt issuance costs related to the portion of the Credit Facility which was repaid.
Income Taxes
Deferred tax assets and liabilities are recognized for the expected tax consequences of temporary differences between the tax bases of assets and liabilities and their reported amounts using enacted tax rates in effect for the year the differences are expected to reverse. In evaluating the Company’s ability to recover its deferred tax assets management considered all available positive and negative evidence including the past operating results, the existence of cumulative losses in past fiscal years and the forecasted future taxable income in the jurisdictions in which VeriFone have operations.
88
Table of Contents
VERIFONE HOLDINGS, INC. AND SUBSIDIARIES
NOTES TO CONSOLIDATED FINANCIAL STATEMENTS—(Continued)
The Company has placed a valuation allowance on all net U.S. deferred tax assets and certain non-U.S. deferred tax assets because realization of these tax benefits through future taxable income cannot be reasonably assured. VeriFone intends to maintain the valuation allowances until sufficient positive evidence exists to support the reversal of the valuation allowances. An increase in the valuation allowance would result in additional tax expense in such period. The Company makes estimates and judgments about its future taxable income that are based on assumptions that are consistent with its plans and estimates. Should the actual amounts differ from the estimates, the amount of the valuation allowance could be materially impacted.
VeriFone must make certain estimates and judgments in determining income tax expense for financial statement purposes. These estimates and judgments occur in the calculation of tax credits and deductions, and in the calculation of certain tax assets and liabilities, which arise from differences in the timing of recognition of revenue and expense for tax and financial statement purposes, as well as the interest and penalties relating to these uncertain tax positions. Significant changes to these estimates may result in an increase or decrease to the Company’s tax provision in a subsequent period.
The calculation of the Company’s tax liabilities involves dealing with uncertainties in the application of complex tax laws. The Company’s estimate for the potential outcome of any uncertain tax issue is based on detailed facts and circumstances of each issue. Resolution of these uncertainties in a manner inconsistent with the Company’s expectations could have a material impact on its results of operations and financial condition.
In addition, the calculation of the Company’s tax liabilities involves dealing with uncertainties in the application of complex tax regulations. As a result of the implementation of ASC 740 (formerly FASB Interpretation No. 48, “Accounting for Income Tax Uncertainties”) in the first quarter of fiscal year 2008, the Company recognized liabilities for uncertain tax positions based on the two-step process prescribed within the interpretation. The first step is to evaluate the tax position for recognition by determining if the weight of available evidence indicates that it is more likely than not that the position will be sustained on audit, including resolution of related appeals or litigation processes, if any. The second step requires the Company to estimate and measure the tax benefit as the largest amount that is more than 50% likely of being realized upon ultimate settlement. It is inherently difficult and subjective to estimate such amounts, as this requires the Company to determine the probability of various possible outcomes. The Company reevaluates these uncertain tax positions on a quarterly basis. This evaluation is based on factors including, but not limited to, changes in facts or circumstances, changes in tax law, effectively settled issues under audit, and new audit activity. Such a change in recognition or measurement would result in the recognition of a tax benefit or an additional charge to the tax provision in the period.
Net Income (Loss) Per Share
Basic net income (loss) per common share is computed by dividing income (loss) attributable to common stockholders by the weighted average number of common shares outstanding for the period, less the weighted average number of common shares subject to repurchase. Diluted net income (loss) per common share is computed using the weighted average number of common shares outstanding plus the effect of common stock equivalents, unless the common stock equivalents are anti-dilutive. The potential dilutive shares of the Company’s common stock resulting from the assumed exercise of outstanding stock options and equivalents and the assumed exercise of the warrants relating to the senior convertible notes are determined under the treasury stock method.
Stock-Based Compensation
The Company accounts for stock-based compensation in accordance with the provisions of ASC 718 (formerly SFAS No. 123(R), Share-Based Payment). ASC 718 is applicable for stock-based awards exchanged
89
Table of Contents
VERIFONE HOLDINGS, INC. AND SUBSIDIARIES
NOTES TO CONSOLIDATED FINANCIAL STATEMENTS—(Continued)
for employee services and in certain circumstances for non-employee directors. Pursuant to ASC 718, stock-based compensation cost is measured at the grant date, based on the fair value of the award, and is recognized as expense over the requisite service period. ASC 718 also requires the cash flows resulting from the tax benefits due to tax deductions in excess of the compensation cost recognized for those options (excess tax benefits) to be classified as financing cash flows.
Restructuring
The Company has developed and implemented restructuring initiatives to improve efficiencies across the organization, reduce operating expenses, and better align its resources to market conditions. As a result of these plans, the Company has recorded restructuring charges comprised principally of employee severance and associated termination costs related to the reduction of its workforce, office closures, losses on subleases and contract termination costs. Restructuring costs are accounted for under ASC 420 (formerly SFAS No. 146, Accounting for Costs Associated with Exit or Disposal Activities) or under ASC 712 (formerly SFAS No. 112, Employers’ Accounting for Postemployment Benefits).
ASC 420 requires that a liability for costs associated with an exit or disposal activity be recognized when the liability is incurred, as opposed to when management commits to an exit plan. ASC 420 also requires that: (i) liabilities associated with exit and disposal activities be measured at fair value; (ii) one-time termination benefits be expensed at the date the entity notifies the employee, unless the employee must provide future service, in which case the benefits are expensed ratably over the future service period; and (iii) costs to terminate a contract before the end of its term be recognized when the entity terminated the contract in accordance with the contract terms. In addition, a portion of the Company’s restructuring costs related to employees and have been accounted for in accordance with ASC 712. ASC 420 requires that a liability for cost be recognized when it is probable that the Company will incur the costs and can reasonably estimate the amount.
Warranty Costs
The Company accrues for estimated warranty obligations when revenue is recognized based on an estimate of future warranty costs for delivered products. Such estimates are based on historical experience and expectations of future costs. The Company periodically evaluates and adjusts the accrued warranty costs to the extent actual warranty costs vary from the original estimates. The Company’s warranty period typically extends from 13 months to five years from the date of shipment. Costs associated with maintenance contracts, including extended warranty contracts, are expensed when they are incurred. Actual warranty costs may differ from management’s estimates.
Shipping and Handling Costs
Shipping and handling costs incurred for delivery to customers are expensed as incurred and are included in cost of net revenues in the accompanying Consolidated Statements of Operations. In those instances where the Company bills shipping and handling costs to customers, the amounts billed are classified as revenue.
Advertising Costs
Advertising costs are expensed as incurred and totaled approximately $0.7 million, $1.1 million, and $1.4 million for the fiscal years ended October 31, 2009, 2008 and 2007, respectively.
90
Table of Contents
VERIFONE HOLDINGS, INC. AND SUBSIDIARIES
NOTES TO CONSOLIDATED FINANCIAL STATEMENTS—(Continued)
Concentrations of Credit Risk
Cash is placed on deposit in major financial institutions in the United States, Israel and other countries. Such deposits may be in excess of insured limits. Management believes that the financial institutions that hold the Company’s cash are financially sound and, accordingly, minimal credit risk exists with respect to these balances.
The Company invests cash not required for use in operations in high credit quality securities based on its investment policy. The investment policy has limits based on credit quality, investment concentration, investment type, and maturity that the Company believes will result in reduced risk of loss of capital. Investments are of a short-term nature and include investments in money market funds and corporate debt securities.
The Company has not experienced any investment losses due to institutional failure or bankruptcy.
The Company’s accounts receivable are derived from sales to a large number of direct customers, resellers, and distributors in the Americas, Europe, and the Asia Pacific region. The Company performs ongoing evaluations of its customers’ financial condition and limits the amount of credit extended when deemed necessary, but generally requires no collateral.
An allowance for doubtful accounts is established with respect to those amounts that the Company has determined to be doubtful of collection using specific identification of doubtful accounts and an aging of receivables analysis based on invoice due dates. Actual collection losses may differ from management’s estimates, and such differences could be material to the Company’s consolidated financial position, results of operations, and cash flows. Uncollectible receivables are written off against the allowance for doubtful accounts when all efforts to collect them have been exhausted and recoveries of receivables previously written-off are recognized when received. Generally, accounts receivable are past due 30 days after the invoice date unless special payment terms are provided.
For the fiscal years ended October 31, 2009, 2008 and 2007, no customer accounted for more than 10% of net revenues. At October 31, 2009 and 2008, no customer accounted for more than 10% of accounts receivable.
The Company is exposed to credit loss in the event of nonperformance by counterparties to the foreign exchange forward contracts used to mitigate the effect of exchange rate changes and the purchased call option for the Company’s stock related to the 1.375% Senior Convertible Notes. As described in Note 4. “Financings” in September 2008, following the bankruptcy of Lehman Brothers Holdings, Inc. (“Lehman Brothers”), the Company delivered a notice of termination for the note hedge purchased from Lehman OTC Derivatives Inc. (“Lehman Derivatives”) in June 2007. The Company believes the counterparties for its other outstanding contracts are large, financially sound institutions and thus the Company does not anticipate nonperformance by these counterparties. However, given the recent, unprecedented turbulence in the financial markets, the failure of additional counterparties is possible.
Equity Investments
The Company holds equity investments. These investments are accounted for under the equity method if the Company can exert significant influence over the investee company or under the cost method if the Company does not have significant influence over the investee company. The investments are included in other assets in the accompanying Consolidated Balance Sheets. Gains and losses recorded for equity method investments are included in Other Income (Expenses), net in the accompanying Consolidated Statements of Operations. The Company periodically monitors its investments for impairment and will record a reduction in the carrying value, if and when necessary.
91
Table of Contents
VERIFONE HOLDINGS, INC. AND SUBSIDIARIES
NOTES TO CONSOLIDATED FINANCIAL STATEMENTS—(Continued)
During fiscal year 2008, the Company recorded a $2.2 million charge for impairment related to one of its equity investments to reflect the decline of the investment’s fair value below its carrying value.
Comprehensive Income (Loss)
Comprehensive income (loss) consists of net income (loss) and other comprehensive income (loss). Other comprehensive income (loss) includes certain changes in equity that are excluded from results of operations. Specifically, foreign currency translation adjustments, changes in the fair value of derivatives designated as hedges and the unfunded portion of pension plan obligations are included in accumulated other comprehensive income (loss) in the accompanying Consolidated Balance Sheets.
Recent Accounting Pronouncements
In December 2007, the FASB issued SFAS No. 141(R), Business Combinations (ASC 805). This standard changes the accounting for business combinations including the measurement of acquirer shares issued in consideration for a business combination, the recognition of contingent consideration, the accounting for pre-acquisition gain and loss contingencies, the recognition of capitalized in-process research and development as an indefinite-lived intangible asset until approved or discontinued rather than as an immediate expense, expensing restructuring costs in connection with an acquisition rather than considering them a liability assumed in the acquisition, the treatment of acquisition-related transaction costs, the recognition of changes in the acquirer’s income tax valuation allowance, and accounting for partial and/or step acquisitions. SFAS No. 141(R) (ASC 805) is effective on a prospective basis for all business combinations for which the acquisition date is on or after the beginning of the first annual period subsequent to December 15, 2008. SFAS No. 141(R) (ASC 805) is effective for the Company at the beginning of fiscal year 2010 and the impact of this adoption will largely be dependent on the size and nature of the business combinations completed after the adoption of this statement.
In December 2007, the FASB issued SFAS No. 160 Noncontrolling Interests in Consolidated Financial Statements, an amendment of ARB No. 51 (ASC 810). This accounting standard will change the accounting and reporting for minority interests, which will be recharacterized as noncontrolling interests and classified as a component of equity. In conjunction with SFAS No. 141(R) (ASC 805), this standard will significantly change the accounting for partial and/or step acquisitions. SFAS No. 160 (ASC 810) is effective for the Company at the beginning of fiscal year 2010. The Company does not expect the impact of this adoption to be material.
In May 2008, the FASB issued FASB Staff Position (“FSP”) APB 14-1, Accounting for Convertible Debt Instruments That May Be Settled in Cash upon Conversion (Including Partial Cash Settlement) (ASC 470-20), which requires the issuer of a convertible debt instrument with cash settlement features to account separately for the liability and equity components of the instrument. The debt would be recognized at the present value of its cash flows discounted using an entity specific nonconvertible debt borrowing rate at the time of issuance. The equity component would be recognized as the difference between the proceeds from the issuance of the note and the fair value of the liability. The standard also requires accretion of the resultant debt discount over the expected life of the debt. This accounting standard is effective for fiscal years beginning after December 15, 2008, and interim periods within those years. Entities are required to apply this standard retrospectively for all periods presented. The Company adopted FSP APB 14-1 (ASC 470-20) at the beginning of fiscal year 2010 and modified its accounting for its 1.375% Senior Convertible Notes (“Notes”). On the date of issuance of the Notes on June 22, 2007, approximately $80.0 million of the proceeds was allocated to equity in a manner that reflects market interest rate for a similar nonconvertible debt at the date of issuance. This equity amount will be accreted from date of issuance to June 2012 as non-cash interest charges. The retroactive interest expense for the fiscal years ended October 31, 2009, 2008 and 2007 is expected to be approximately $14.0 million, $14.0 million and
92
Table of Contents
VERIFONE HOLDINGS, INC. AND SUBSIDIARIES
NOTES TO CONSOLIDATED FINANCIAL STATEMENTS—(Continued)
$5.0 million respectively. The gain on debt extinguishment will be reduced from $13.1 million to approximately $7.0 million for the fiscal year ended October 31, 2009. The interest expense for fiscal year 2010 will be approximately $15.0 million.
In April 2009, the FASB issued FASB Staff Position (“FSP”) No. FAS 141(R)-1, Accounting for Assets Acquired and Liabilities Assumed in a Business Combination That Arise from Contingencies (ASC 805), which amends and clarifies the initial recognition and measurement, subsequent measurement and accounting, and related disclosures of assets and liabilities arising from contingencies in a business combination under SFAS No. 141(R) (ASC 805). FSP No. FAS 141 (R)-1 (ASC 805) is effective for the Company at the beginning of fiscal year 2010 and the impact of this adoption will largely be dependent on the size and nature of the business combinations completed after the adoption of this statement.
In June 2009, the FASB issued SFAS No. 167, Amendments to FASB Interpretation No. 46R (ASC 810). SFAS No. 167 amends FASB Interpretation No. (FIN) 46 (revised December 2003), Consolidation of Variable Interest Entities (FIN 46R) to require an analysis to determine whether a variable interest gives the entity a controlling financial interest in a variable interest entity. This statement requires an ongoing reassessment and eliminates the quantitative approach previously required for determining whether an entity is the primary beneficiary. This statement is effective for fiscal years beginning after Nov. 15, 2009. Accordingly, the Company will adopt SFAS No. 167 at the beginning of fiscal year 2011. The Company is currently evaluating and has not yet determined the impact, if any, its adoption will have on the Company’s consolidated financial statements.
In October 2009, the FASB issued Accounting Standards Update (“ASU”) 2009-13, Revenue Recognition (Topic 605) — Multiple-Deliverable Revenue Arrangements. This guidance modifies the fair value requirements of FASB ASC subtopic 605-25, Revenue Recognition-Multiple Element Arrangements, by allowing the use of the “best estimate of selling price” in addition to vendor specific objective evidence and third-party evidence for determining the selling price of a deliverable. This guidance establishes a selling price hierarchy for determining the selling price of a deliverable, which is based on: (a) vendor-specific objective evidence, (b) third-party evidence, or (c) estimates. In addition, the residual method of allocating arrangement consideration is no longer permitted. The new guidance also requires expanded quantitative and qualitative disclosures about revenue from arrangements with multiple deliverables.
In October 2009, the FASB issued ASU No. 2009-14 — Software (Topic 985): Certain Revenue Arrangements That Include Software Elements — a consensus of the FASB Emerging Issues Task Force. ASU 2009-14 modifies the scope of the software revenue recognition guidance to exclude arrangements that contain tangible products for which the software element is “essential” to the functionality of the tangible products.
ASU 2009-13 and ASU 2009-14 are effective prospectively for revenue arrangements entered into or materially modified in fiscal years beginning on or after June 15, 2010, and must be adopted in the same period using the same transition method. If adoption is elected in a period other than the beginning of a fiscal year, the amendments in these standards must be applied retrospectively to the beginning of the fiscal year. Full retrospective application of these amendments to prior fiscal years is optional. Companies may elect early adoption of these standards. The Company is currently assessing the timing of adoption and impacts that ASU 2009-13 and ASU 2009-14 will have on the Company’s consolidated financial statements.
Recently adopted accounting standards
Effective November 1, 2008, the Company adopted ASC 820 (formerly SFAS No. 157, Fair Value Measurements), except as it applies to goodwill, other intangible asset and non-financial assets and liabilities. ASC 820 defines fair value, establishes a framework for measuring fair value and expands disclosures about fair
93
Table of Contents
VERIFONE HOLDINGS, INC. AND SUBSIDIARIES
NOTES TO CONSOLIDATED FINANCIAL STATEMENTS—(Continued)
value measurements. ASC 820 applies to other pronouncements that require or permit fair value measurements; it does not require any new fair value measurements. The Company has delayed the implementation of ASC 820 provisions on the fair value of goodwill, other intangible assets and non-financial long-lived assets until the beginning of fiscal year 2010. The adoption of ASC 820 did not have a material impact on the Company’s consolidated financial statements. See Note 5. “Fair Value Measurements” for additional information relating to the adoption of ASC 820.
Effective November 1, 2008, the Company adopted ASC 825 (formerly SFAS No. 159, The Fair Value Option for Financial Assets and Financial Liabilities — including an Amendment of FASB Statement No. 115), which allows an entity to choose to measure certain financial assets and liabilities at fair value on a instrument-by-instrument basis. Subsequent fair value measurements for the financial assets and liabilities an entity elects to measure will be recognized in earnings. The Company has not elected the fair value option for any eligible assets and liabilities.
Effective February 1, 2009, the Company adopted the disclosure requirements of ASC 815 (formerly SFAS No. 161, Disclosures about Derivative Instruments and Hedging Activities). ASC 815 amends and expands the disclosure requirements of derivative instruments and hedging activities. It requires qualitative disclosures about objectives and strategies for using derivatives, quantitative disclosures about fair value amounts of gains and losses on derivative instruments, and disclosures about credit-risk-related contingent features in derivative agreements. See Note 6. “Derivative Financial Instruments” for additional information relating to the adoption of the disclosure requirements of ASC 815.
Effective May 1, 2009, the Company adopted ASC 855 (formerly SFAS No. 165, Subsequent Events). ASC 855 establishes the principles and requirements for evaluating and reporting subsequent events, including the period subject to evaluation for subsequent events, the circumstances requiring recognition of subsequent events in the financial statements, and the required disclosures.
Effective August 1, 2009, the Company adopted ASC 105 (formerly SFAS No. 168, The FASB Accounting Standards Codification and the Hierarchy of Generally Accepted Accounting Principles, a replacement of FASB No. 162). ASC 105 establishes the FASB Accounting Standards Codification (“Codification”) as the single source of authoritative accounting and reporting standards in the United States for all non-government entities, with the exception of the Securities and Exchange Commission and its staff. It does not include any new guidance or interpretations of U.S. GAAP, but merely eliminates the existing hierarchy and codifies the previously issued standards and pronouncements into specific topic areas.
Note 2. Goodwill and Purchased Intangible Assets
The Company performed its annual impairment test of goodwill as of August 1, 2009 and 2008 in accordance with ASC 350 (formerly SFAS No. 142, Goodwill and Other Intangible Assets) which did not result in an impairment of goodwill.
Subsequent to the annual impairment test as of August 1, 2008, in light of the Company’s disappointing operating results for the fourth quarter of fiscal year 2008 due to severe macroeconomic conditions caused by the illiquidity of the credit markets, difficulties in the banking and financial services sectors, falling consumer confidence and rising unemployment rates, the Company reduced its projected future cash flows significantly. This resulted in an indicator of possible impairment of goodwill and long-lived assets as defined under ASC 350 (formerly SFAS No. 142) and ASC 360 (formerly SFAS No. 144), requiring the Company to perform an impairment test as of October 15, 2008. Following the impairment test, the Company recorded impairment
94
Table of Contents
VERIFONE HOLDINGS, INC. AND SUBSIDIARIES
NOTES TO CONSOLIDATED FINANCIAL STATEMENTS—(Continued)
charges of $262.5 million for goodwill for its EMEA reporting unit and $26.6 million for developed and core technology intangible assets in the International segment during the fourth quarter of fiscal year 2008.
The Company’s management determined the recoverability of the long-lived assets under ASC 360 (formerly SFAS No. 144) based on their undiscounted estimated future net cash flows and the impairment charge based on fair value using discounted cash flows.
During November 2008, the macroeconomic environment worldwide continued to weaken. This was caused by the illiquidity of the credit markets, difficulties in the banking and financial services sectors, falling consumer confidence and rising unemployment rates. The Company’s stock price and market capitalization declined significantly which was considered an indicator of possible impairment of goodwill and long-lived assets triggering the necessity of additional impairment tests as of December 1, 2008.
As a result of the goodwill impairment test, the Company concluded that the carrying amount of the North America and Asia reporting units exceeded their implied fair values and recorded an estimated impairment charge of $178.2 million in the Corporate segment during the first quarter of fiscal year 2009. The Company finalized the goodwill evaluation process and recorded a $2.7 million reduction of impairment charge during the second quarter of fiscal year 2009. The final impairment charge for the North America and Asia reporting units was $175.5 million. The net carrying values of goodwill in the North America and International segments were reduced by $65.6 million and $109.9 million, respectively, as a result of the impairment charges. See Note 15. “Segment and Geographic Information” for additional information.
The Company uses the income approach and specifically the discounted cash flow (“DCF”) method, to derive the fair value of each of its reporting units for the goodwill impairment assessment. The DCF approach calculates the fair value by discounting the present value of the estimated after-tax cash flows using a risk-adjusted discount rate.
The long-lived assets impairment test did not result in any significant impairment charges in fiscal year 2009.
Goodwill
Activity related to goodwill consisted of the following (in thousands):
| October 31, | ||||||||
| 2009 | 2008 | |||||||
| Balance at beginning of period |
$ | 321,903 | $ | 611,977 | ||||
| Additions related to acquisitions |
— | 4,564 | ||||||
| Resolution of tax contingencies and adjustments to tax reserves and valuation allowance established in purchase accounting and tax benefits for exercise of vested stock options assumed |
(5,366 | ) | 139 | |||||
| Goodwill impairment |
(175,512 | ) | (262,462 | ) | ||||
| Currency translation adjustments |
9,820 | (32,315 | ) | |||||
| Balance at end of period |
$ | 150,845 | $ | 321,903 | ||||
95
Table of Contents
VERIFONE HOLDINGS, INC. AND SUBSIDIARIES
NOTES TO CONSOLIDATED FINANCIAL STATEMENTS—(Continued)
Purchased Intangible Assets
Purchased intangible assets subject to amortization consisted of the following (in thousands):
| October 31, 2009 | October 31, 2008 | |||||||||||||||||||
| Gross Carrying Amount |
Accumulated Amortization |
Net Carrying Amount |
Gross Carrying Amount |
Accumulated Amortization |
Net Carrying Amount | |||||||||||||||
| Developed and core technology |
$ | 159,903 | $ | (130,736 | ) | $ | 29,167 | $ | 158,432 | $ | (109,991 | ) | $ | 48,441 | ||||||
| Trade name |
24,917 | (22,584 | ) | 2,333 | 24,917 | (22,315 | ) | 2,602 | ||||||||||||
| Internal use software |
5,143 | (2,745 | ) | 2,398 | 5,155 | (1,629 | ) | 3,526 | ||||||||||||
| Customer relationships |
94,750 | (75,674 | ) | 19,076 | 94,003 | (55,935 | ) | 38,068 | ||||||||||||
| $ | 284,713 | $ | (231,739 | ) | $ | 52,974 | $ | 282,507 | $ | (189,870 | ) | $ | 92,637 | |||||||
Amortization of purchased intangible assets for the years ended October 31, 2009, 2008 and 2007 was allocated as follows (in thousands):
| For the Years Ended October 31, | |||||||||
| 2009 | 2008 | 2007 | |||||||
| Included in cost of net revenues |
$ | 20,414 | $ | 32,230 | $ | 37,897 | |||
| Included in operating expenses |
20,423 | 26,033 | 21,571 | ||||||
| $ | 40,837 | $ | 58,263 | $ | 59,468 | ||||
Estimated future amortization expense of intangible assets recorded as of October 31, 2009 is as follows (in thousands):
| Fiscal Years Ending October 31: |
Cost of Net Revenues |
Operating Expenses |
Total | ||||||
| 2010 |
$ | 16,042 | $ | 12,403 | $ | 28,445 | |||
| 2011 |
10,825 | 3,883 | 14,708 | ||||||
| 2012 |
1,127 | 1,221 | 2,348 | ||||||
| 2013 |
337 | 736 | 1,073 | ||||||
| 2014 |
236 | 714 | 950 | ||||||
| Thereafter |
599 | 4,851 | 5,450 | ||||||
| $ | 29,166 | $ | 23,808 | $ | 52,974 | ||||
Note 3. Balance Sheet Details
Allowance for Doubtful Accounts
Activity related to the general revenue reserves and allowance for doubtful accounts consisted of the following (in thousands):
| Balance at Beginning of Year |
Charges to Bad Debt Expense |
Write-Offs, Recoveries and Adjustments |
Balance at End of Year | ||||||||||
| Year ended October 31, 2009 |
$ | 5,033 | $ | 763 | $ | (1,240 | ) | $ | 4,556 | ||||
| Year ended October 31, 2008 |
$ | 4,270 | $ | 110 | $ | 653 | $ | 5,033 | |||||
| Year ended October 31, 2007 |
$ | 2,364 | $ | 2,654 | $ | (748 | ) | $ | 4,270 | ||||
96
Table of Contents
VERIFONE HOLDINGS, INC. AND SUBSIDIARIES
NOTES TO CONSOLIDATED FINANCIAL STATEMENTS—(Continued)
Inventories
Inventories consisted of the following (in thousands):
| October 31, | ||||||
| 2009 | 2008 | |||||
| Raw materials |
$ | 34,955 | $ | 52,152 | ||
| Work-in-process |
1,155 | 6,416 | ||||
| Finished goods |
59,811 | 109,792 | ||||
| $ | 95,921 | $ | 168,360 | |||
Prepaid Expenses and Other Current Assets
Prepaid expenses and other current assets consisted of the following (in thousands):
| October 31, | ||||||
| 2009 | 2008 | |||||
| Prepaid taxes |
$ | 15,382 | $ | 31,554 | ||
| Other prepaid expenses |
10,585 | 13,489 | ||||
| Other receivables |
3,293 | 5,267 | ||||
| Other current assets |
7,266 | 7,321 | ||||
| $ | 36,526 | $ | 57,631 | |||
Property, Plant, and Equipment, net
Property, plant, and equipment consisted of the following (in thousands):
| Estimated Useful Life (in Years) |
October 31, | |||||||||
| 2009 | 2008 | |||||||||
| Computer hardware and software |
3-7 | $ | 41,210 | $ | 40,013 | |||||
| Office equipment, furniture, and fixtures |
2-5 | 4,093 | 3,979 | |||||||
| Machinery and equipment |
2-5 | 17,895 | 15,027 | |||||||
| Leasehold improvements |
Lesser of the term of the lease or the estimated useful life |
12,970 | 11,413 | |||||||
| Construction in progress |
— | 1,259 | 1,549 | |||||||
| Land |
— | 1,025 | 1,025 | |||||||
| Buildings |
50 | 5,444 | 5,439 | |||||||
| Total |
83,896 | 78,445 | ||||||||
| Accumulated depreciation and amortization |
(36,918 | ) | (26,136 | ) | ||||||
| Property, plant, and equipment, net |
$ | 46,978 | $ | 52,309 | ||||||
For the years ended October 31, 2009, 2008 and 2007, total depreciation expense for property, plant and equipment was $14.9 million, $11.7 million and $7.2 million, respectively.
At October 31, 2009 and 2008, equipment amounting to $1.2 million and $1.5 million, respectively, was capitalized under capital leases. Related accumulated depreciation as of October 31, 2009 and 2008 amounted to $1.0 million and $1.4 million, respectively.
97
Table of Contents
VERIFONE HOLDINGS, INC. AND SUBSIDIARIES
NOTES TO CONSOLIDATED FINANCIAL STATEMENTS—(Continued)
Restricted Cash
The Company had $2.1 million and $1.9 million of restricted cash as of October 31, 2009 and 2008, respectively. The restricted cash balances were comprised mainly of pledged deposits for bank guarantees to customers. As of October 31, 2009, $1.7 million of the restricted cash was included in Other Assets and the remaining $0.4 million was included in Prepaid Expenses and Other Current Assets in the Consolidated Balance Sheets. As of October 31, 2008, the entire $1.9 million of the restricted cash was included in Other Assets in the Consolidated Balance Sheets.
Warranty
Activity related to warranty consisted of the following (in thousands):
| Years Ended October 31, | ||||||||
| 2009 | 2008 | |||||||
| Balance, beginning of year |
$ | 10,017 | $ | 11,667 | ||||
| Warranty charged to cost of net revenues |
7,886 | 7,289 | ||||||
| Utilization of warranty |
(9,038 | ) | (10,877 | ) | ||||
| Changes in estimates |
4,943 | 1,889 | ||||||
| Warranty liabilities assumed on acquisitions |
— | 49 | ||||||
| Balance, end of year |
13,808 | 10,017 | ||||||
| Less current portion |
(10,870 | ) | (8,527 | ) | ||||
| Long-term portion |
$ | 2,938 | $ | 1,490 | ||||
Deferred Revenue, Net
Deferred revenue, net of related costs consisted of the following (in thousands):
| October 31, | ||||||||
| 2009 | 2008 | |||||||
| Deferred revenue |
$ | 77,919 | $ | 73,263 | ||||
| Deferred cost of revenue |
(13,957 | ) | (12,284 | ) | ||||
| 63,962 | 60,979 | |||||||
| Less current portion |
(45,668 | ) | (47,687 | ) | ||||
| Long-term portion |
$ | 18,294 | $ | 13,292 | ||||
Other Current Liabilities
Other current liabilities consisted of the following (in thousands):
| October 31, | ||||||
| 2009 | 2008 | |||||
| Other tax liabilities (1) |
$ | 34,655 | $ | 35,542 | ||
| Accrued interest |
2,122 | 4,448 | ||||
| Accounts payable related accruals |
15,368 | 23,217 | ||||
| Accrued legal and audit fees |
1,541 | 10,885 | ||||
| Other |
10,792 | 17,076 | ||||
| Total other current liabilities |
$ | 64,478 | $ | 91,168 | ||
98
Table of Contents
VERIFONE HOLDINGS, INC. AND SUBSIDIARIES
NOTES TO CONSOLIDATED FINANCIAL STATEMENTS—(Continued)
| (1) | Two of the Company’s Brazilian subsidiaries that were acquired as part of the Lipman acquisition have been notified of assessments regarding Brazilian customs penalties that relate to alleged infractions in the importation of goods. The Company has accrued $8.1 million (14.2 million Brazilian reais) and $17.7 million (37.1 million Brazilian reais) as of October 31, 2009 and October 31, 2008, respectively, related to these assessments. In fiscal year 2009, the Company reduced this accrual by $14.9 million (28.2 million Brazilian reais) as a result of the dismissal of one of the assessments. Of this amount, $9.8 million was reversed against general and administrative expenses and $5.1 million was reversed against interest expense. This reduction was partially offset by the accrual for legal fees related to a contingent legal representation agreement entered into between one of the Company’s Brazilian subsidiaries (prior to the Lipman acquisition) and Brazilian counsel pursuant to which the Company’s Brazilian subsidiary has agreed to pay to Brazilian counsel legal fees in the amount of $2.8 million (5.0 million Brazilian reais) for achieving the successful dismissal of the assessment. The accrued legal fee was included in general and administrative expenses in fiscal year 2009. During the fourth quarter of fiscal year 2009, the Company paid $1.1 million (2.0 million reais) of this legal fee and will pay the remainder over the next 12 months. The Company also recorded accrued interest totaling $2.7 million (4.8 million reais) during fiscal year 2009. The remaining movement in the balance reflects the impact of the changes in Brazilian reais exchange rates. See Note 12. “Commitments and Contingencies” for additional information related to these tax assessments. |
Note 4. Financings
The Company’s financings as of October 31, 2009 and 2008 consisted of the following (in thousands):
| October 31, | ||||||||
| 2009 | 2008 | |||||||
| Term B Loan |
$ | 226,250 | $ | 231,250 | ||||
| Senior convertible notes |
282,750 | 316,250 | ||||||
| Other |
864 | 879 | ||||||
| Total |
509,864 | 548,379 | ||||||
| Less current portion |
(5,699 | ) | (5,022 | ) | ||||
| Long-term portion |
$ | 504,165 | $ | 543,357 | ||||
Secured Credit Facility
On October 31, 2006, the Company’s principal subsidiary, VeriFone Inc., entered into a credit agreement (the “Credit Facility”) consisting of a Term B Loan facility of $500.0 million and a revolving loan permitting borrowings of up to $40.0 million. The proceeds from the Term B loan were used to repay all outstanding amounts relating to a previous credit facility, pay certain transaction costs, and partially fund the cash consideration in connection with the acquisition of Lipman on November 1, 2006. The Company repaid $5.0 million, $5.0 million and $263.7 million during fiscal years 2009, 2008 and 2007, respectively, leaving an outstanding balance of $226.3 million at October 31, 2009. There was no outstanding balance on the revolving loan as of October 31, 2009 and 2008. The Credit Facility is guaranteed by the Company and certain of its subsidiaries and is secured by collateral including substantially all of the Company’s assets and stock of the Company’s subsidiaries.
During fiscal year 2008, the Company entered into three amendments to the Credit Facility with its lenders, which extended the time periods for delivery of certain required financial information for the three-month periods ended January 31, April 30 and July 31, 2007, the year ended October 31, 2007 and the three-month
99
Table of Contents
VERIFONE HOLDINGS, INC. AND SUBSIDIARIES
NOTES TO CONSOLIDATED FINANCIAL STATEMENTS—(Continued)
periods ended January 31, 2008 and April 30, 2008. In connection with the three amendments, the Company paid a total fee of $1.6 million and agreed to certain increases in the interest rates and fees in fiscal year 2008.
Lehman Commercial Paper, Inc. (“Lehman CP”), a lender in the revolving loan, declared bankruptcy in October 2008. Under the terms of the Credit Facility, the Company declared Lehman CP a defaulting lender and removed Lehman CP as a lender in the revolving loan. Therefore, as of October 31, 2009 and 2008, $25.0 million was available to the Company under the revolving loan. The Company does not expect to obtain a replacement lender for Lehman CP under the revolving loan.
The Company pays a commitment fee on the unused portion of the revolving loan credit facility at a rate that varies depending upon its consolidated total leverage ratio. The Company was paying a commitment fee at a rate of 0.425% per annum as of October 31, 2009 and 2008.
The maturity dates on the components of the Credit Facility are October 31, 2012 for the revolving loan and October 31, 2013 for the Term B Loan. Principal payments on the Term B Loan are due in equal quarterly installments of $1.3 million over the seven-year term on the last business day of each calendar quarter with the balance due on maturity.
At the Company’s option, the Term B loan and the revolving loan can be “Base Rate” or “Eurodollar Rate” loans. Base Rate loans bear interest at a per annum rate equal to a margin over the greater of the Federal Funds rate plus 0.50% or the JP Morgan prime rate. For the Base Rate Term B loan, the margin was 1.75% as of October 31, 2009 and 2008. For the Base Rate revolving loan, the margin varies depending upon the Company’s consolidated leverage ratio and was 1.00% as of October 31, 2009 and 2008.
At the Company’s option, Eurodollar Rate loans bear interest at a margin over the one-, two-, three- or six-month LIBOR rate. The margin for the Eurodollar Rate Term B loan was 2.75% as of October 31, 2009 and 2008. The margin for the Eurodollar Rate revolving loan varies depending upon the Company’s consolidated leverage ratio and was 2.00% as of October 31, 2009 and 2008.
As of October 31, 2009, the Term B loan bore interest at 2.75% over the one-month LIBOR rate of 0.25% for a total of 3.00%. As of October 31, 2008, the Term B loan bore interest at 2.75% over the one-month LIBOR rate of 3.12% for a total of 5.87%. As of October 31, 2009 and 2008, the outstanding balance on the Term B loan was $226.3 million and $231.3 million, respectively.
As of October 31, 2009, the revolving loan credit facility bore interest at 2.00% over the one-month LIBOR rate of 0.25% for a total of 2.25%. As of October 31, 2008, the revolving loan credit facility bore interest at 2.00% over the one-month LIBOR rate of 3.12% for a total of 5.12%. As of October 31, 2009 and 2008, no amounts were outstanding under the revolving loan.
The terms of the Credit Facility require the Company to comply with financial covenants, including maintaining leverage and fixed charge coverage ratios at the end of each fiscal quarter. As of October 31, 2009, the Company was required to maintain a total leverage ratio of not greater than 3.5 to 1.0 and a fixed charge coverage ratio of at least 2.0 to 1.0. Total leverage ratio is equal to total debt less cash as of the end of a reporting fiscal quarter divided by consolidated EBITDA, as adjusted, for the most recent four consecutive fiscal quarters. Fixed charge coverage ratio is, all for the most recent four consecutive fiscal quarters, the ratio of (a) consolidated EBITDA, as adjusted, less capital expenditures, as adjusted, and cash tax payments, over (b) the sum of cash interest expense and scheduled debt payments. Some of the financial covenants become more restrictive over the term of the Credit Facility. Noncompliance with any of the financial covenants without cure or waiver would constitute an event of default under the Credit Facility. An event of default resulting from a
100
Table of Contents
VERIFONE HOLDINGS, INC. AND SUBSIDIARIES
NOTES TO CONSOLIDATED FINANCIAL STATEMENTS—(Continued)
breach of a financial covenant may result, at the option of lenders holding a majority of the loans, in an acceleration of repayment of the principal and interest outstanding and a termination of the loan. The Credit Facility also contains non-financial covenants that restrict some of the Company’s activities, including its ability to dispose of assets, incur additional debt, pay dividends, create liens, make investments, make capital expenditures, and engage in specified transactions with affiliates. The terms of the Credit Facility permit prepayments of principal and require prepayments of principal upon the occurrence of certain events including among others, the receipt of proceeds from the sale of assets, the receipt of excess cash flow as defined, and the receipt of proceeds of certain debt issues. The Credit Facility also contains customary events of default, including defaults based on events of bankruptcy and insolvency; nonpayment of principal, interest, or fees when due, subject to specified grace periods; breach of specified covenants; change in control; and material inaccuracy of representations and warranties. In addition, if the Company’s leverage exceeds a certain level set out in its Credit Facility, a portion of the Company’s excess cash flows must be used to pay down its outstanding debt. The Company was in compliance with its financial and non-financial covenants as of October 31, 2009 and 2008.
1.375% Senior Convertible Notes
On June 22, 2007, the Company issued and sold $316.2 million aggregate principal amount of 1.375% Senior Convertible Notes due in June 2012 (the “Notes”) in an offering through Lehman Brothers and JP Morgan Securities Inc. (together “initial purchasers”) to qualified institutional buyers pursuant to Section 4(2) and Rule 144A under the Securities Act. The net proceeds from the offering, after deducting transaction costs, were approximately $307.9 million. The Company incurred approximately $8.3 million of debt issuance costs. The transaction costs, consisting of the initial purchasers’ discounts and offering expenses, were primarily recorded in debt issuance costs, net and are being amortized to interest expense using the effective interest method over five years. The Company will pay 1.375% interest per annum on the principal amount of the Notes, payable semi-annually in arrears in cash on June 15 and December 15 of each year, commencing on December 15, 2007, subject to increase in certain circumstances as described below.
In April 2009, the Company repurchased and extinguished $33.5 million par value of its outstanding Notes for $19.8 million, excluding accrued interest paid. The Company realized a $13.1 million gain on these transactions, net of a $0.6 million write-off of related deferred debt issuance costs. As of October 31, 2009, the remaining par value of the Notes was $282.7 million.
The Notes were issued under the Indenture between the Company and U.S. Bank National Association, as trustee. Each $1,000 of principal of the Notes are initially convertible into 22.719 shares of VeriFone common stock, which is equivalent to a conversion price of approximately $44.02 per share, subject to adjustment upon the occurrence of specified events. Holders of the Notes may convert their Notes prior to maturity during specified periods as follows: (1) on any date during any fiscal quarter beginning after October 31, 2007 (and only during such fiscal quarter) if the closing sale price of the Company’s common stock was more than 130% of the then current conversion price for at least 20 trading days in the period of the 30 consecutive trading days ending on the last trading day of the previous fiscal quarter; (2) at any time on or after March 15, 2012; (3) if the Company distributes, to all holders of its common stock, rights or warrants (other than pursuant to a rights plan) entitling them to purchase, for a period of 45 calendar days or less, shares of the Company’s common stock at a price less than the average closing sale price for the ten trading days preceding the declaration date for such distribution; (4) if the Company distributes, to all holders of its common stock, cash or other assets, debt securities, or rights to purchase the Company’s securities (other than pursuant to a rights plan), which distribution has a per share value exceeding 10% of the closing sale price of the Company’s common stock on the trading day preceding the declaration date for such distribution; (5) during a specified period if certain types of fundamental changes occur; or (6) during the five business-day period following any five consecutive trading-day period in which the trading price for the Notes was less than 98% of the average of the closing sale price of the Company’s
101
Table of Contents
VERIFONE HOLDINGS, INC. AND SUBSIDIARIES
NOTES TO CONSOLIDATED FINANCIAL STATEMENTS—(Continued)
common stock for each day during such five trading-day period multiplied by the then current conversion rate. Upon conversion, the Company would pay the holder the cash value of the applicable number of shares of the Company’s common stock, up to the principal amount of the note. Amounts in excess of the principal amount, if any, will be paid in stock.
As of October 31, 2009, none of the conditions allowing holders of the Notes to convert had been met. If a fundamental change, as defined in the Indenture, occurs prior to the maturity date, holders of the Notes may require the Company to repurchase all or a portion of their Notes for cash at a repurchase price equal to 100% of the principal amount of the Notes to be repurchased, plus any accrued and unpaid interest (including additional interest, if any) up to, but excluding, the repurchase date.
The Notes are senior unsecured obligations and rank equal in right of payment with all of the Company’s existing and future senior unsecured indebtedness. The Notes are effectively subordinated to any secured indebtedness to the extent of the value of the related collateral and structurally subordinated to indebtedness and other liabilities of the Company’s subsidiaries including any secured indebtedness of such subsidiaries.
In connection with the offering of the Notes, the Company entered into note hedge transactions with affiliates of the initial purchasers (the “counterparties”), consisting of Lehman Brothers OTC Derivatives (“Lehman Derivatives”) and JPMorgan Chase Bank, National Association, London Branch, whereby the Company has the option to purchase up to 7.2 million shares of its common stock at a price of approximately $44.02 per share. The note hedge transactions expire the earlier of the last day on which any Notes remain outstanding and June 14, 2012. The cost to the Company of the note hedge transactions was approximately $80.2 million. The note hedge transactions are intended to mitigate the potential dilution upon conversion of the Notes in the event that the volume weighted average price of the Company’s common stock on each trading day of the relevant conversion period or other relevant valuation period is greater than the applicable strike price of the convertible note hedge transactions, which initially corresponds to the conversion price of the Notes and is subject, with certain exceptions, to the adjustments applicable to the conversion price of the Notes. The note hedge transaction with Lehman Derivatives, which benefited from a guarantee by Lehman Brothers, covers 50% of the shares of the Company’s common stock potentially issuable upon conversion of the Notes. The filing by Lehman Brothers of a voluntary Chapter 11 bankruptcy petition in September 2008 constituted an “event of default” under the note hedge transaction with Lehman Derivatives, giving the Company the immediate right to terminate the transaction and entitling the Company to claim reimbursement for the loss incurred in terminating and closing out the transaction. On September 21, 2008, the Company delivered a notice of termination to Lehman Derivatives and claimed reimbursement for the loss incurred in termination and close-out of the transaction.
In addition, the Company sold warrants to the counterparties whereby they have the option to purchase up to approximately 7.2 million shares of VeriFone common stock at a price of $62.356 per share. The Company received approximately $31.2 million in cash proceeds from the sale of these warrants. The warrants expire progressively from December 19, 2013 to February 3, 2014.
The cost incurred in connection with the note hedge transactions, net of the related tax benefit and the proceeds from the sale of the warrants, is included as a net reduction in additional paid-in capital in the accompanying Consolidated Balance Sheets as of October 31, 2009 and 2008, in accordance with the guidance in ASC 815-40 (formerly EITF Issue No. 00-19, Accounting for Derivative Financial Instruments Indexed to, and Potentially Settled in, a Company’s Own Stock).
102
Table of Contents
VERIFONE HOLDINGS, INC. AND SUBSIDIARIES
NOTES TO CONSOLIDATED FINANCIAL STATEMENTS—(Continued)
Banker’s Acceptances
The Company received $8.6 million as an advance against banker’s acceptances during the second quarter of fiscal year 2009 which was recorded as short-term debt. The full amount was settled during the second and third quarters of fiscal year 2009.
Principal Payments
Principal payments due for financings over the next four years are as follows (in thousands):
| Fiscal Years Ending October 31: |
|||
| 2010 |
$ | 5,699 | |
| 2011 |
5,121 | ||
| 2012 |
287,795 | ||
| 2013 |
211,249 | ||
| $ | 509,864 | ||
Note 5. Fair Value Measurements
Effective November 1, 2008, the Company adopted ASC 820 (formerly SFAS No. 157, Fair Value Measurements), except as it applies to goodwill, other intangible assets, and non-financial assets and liabilities. This standard clarifies that fair value is an exit price, representing the amount that would be received to sell an asset or paid to transfer a liability in an orderly transaction between market participants. As such, fair value is a market-based measurement that should be determined based on assumptions that market participants would use in pricing an asset or a liability. As a basis for considering such assumptions, ASC 820 establishes a framework for measuring fair value and expands disclosures about fair value measurements by establishing a fair value hierarchy that prioritizes the inputs to valuation techniques used to measure fair value. The hierarchy gives the highest priority to unadjusted quoted prices in active markets for identical assets or liabilities (Level 1 measurements) and lowest priority to unobservable inputs (Level 3 measurements). The three levels of the fair value hierarchy under this standard are described below:
Level 1 — Observable inputs that reflect quoted prices (unadjusted) for identical assets or liabilities in active markets.
Level 2 — Include other inputs that are directly or indirectly observable in the marketplace.
Level 3 — Unobservable inputs which are supported by little or no market activity.
The fair value hierarchy also requires an entity to maximize the use of observable inputs and minimize the use of unobservable inputs when measuring fair value. In accordance with ASC 820, the Company measures its cash equivalents, Israeli severance funds and foreign exchange forward contracts at fair value. The money market funds are classified as Level 1 because the funds are valued using quoted market prices. Israeli severance funds and foreign exchange forward contracts are classified as Level 2 because they are valued using quoted prices and other observable data of similar instruments in active markets.
103
Table of Contents
VERIFONE HOLDINGS, INC. AND SUBSIDIARIES
NOTES TO CONSOLIDATED FINANCIAL STATEMENTS—(Continued)
The following table presents the Company’s assets and liabilities that were measured at fair value on a recurring basis as of October 31, 2009, classified by the level within the fair value hierarchy (in thousands):
| Level 1 | Level 2 | Level 3 | |||||||
| Assets |
|||||||||
| Money market funds |
$ | 123,348 | $ | — | $ | — | |||
| Israeli severance funds |
— | 2,420 | — | ||||||
| Foreign exchange forward contracts |
— | 189 | — | ||||||
| Total assets at fair value |
$ | 123,348 | $ | 2,609 | $ | — | |||
| Liabilities |
|||||||||
| Foreign exchange forward contracts |
$ | — | $ | 16 | $ | — | |||
| Total liabilities at fair value |
$ | — | $ | 16 | $ | — | |||
Note 6. Derivative Financial Instruments
Effective February 1, 2009, the Company adopted ASC 815 (formerly SFAS No. 161, Disclosures about Derivative Instruments and Hedging Activities, an amendment of FASB Statement 133). The adoption of ASC 815 had no financial impact on the Company’s consolidated financial statements and only required additional financial statement disclosures. The Company applied the requirements of this standard on a prospective basis. Accordingly, disclosures related to interim periods prior to the date of adoption have not been presented.
Foreign exchange forward contracts, both designated and not designated as hedging instruments are recognized either as assets or liabilities on the balance sheet at fair value at the end of each reporting period.
Cash Flow Hedges
The Company has used and from time to time in the future may use foreign currency derivatives such as forward contracts and options as hedges against anticipated sales or purchases denominated in foreign currencies. The company enters into these contracts to protect itself against the risk that the eventual net cash flows will be adversely affected by changes in foreign exchange rates.
For derivative instruments that are designated and qualify as a cash flow hedge under ASC 815 (formerly SFAS No. 133), the effective portion of the gain or loss on the derivative is reported as a component of accumulated other comprehensive income (loss) (“AOCI”) and reclassified into earnings in the same period or periods during which the hedged transaction affects earnings. Gains and losses on the derivative representing either hedge ineffectiveness or hedge components excluded from the assessment of effectiveness are recognized in current earnings.
As of October 31, 2009, there was one cash flow hedge open to sell Brazilian reais with a remaining notional amount of $1.9 million and maturing within 30 days. A loss of $0.1 million was recorded in AOCI for this contract. No cash flow hedges were discontinued during the period from February 1, 2009, the date of the Company’s adoption of ASC 815, to October 31, 2009.
Derivatives Not Designated as Hedging Instruments
The Company primarily utilizes foreign exchange forward contracts to offset the risks associated with certain foreign currency balance sheet exposures. Under this program, foreign exchange forward contracts are arranged and maintained so as to yield gains or losses to offset changes in foreign currency denominated assets or
104
Table of Contents
VERIFONE HOLDINGS, INC. AND SUBSIDIARIES
NOTES TO CONSOLIDATED FINANCIAL STATEMENTS—(Continued)
liabilities due to movements in foreign exchange rates, thus mitigating the volatility associated with foreign currency transaction gains or losses. The Company’s foreign currency exposures are predominantly intercompany receivables and payables arising from product sales from one VeriFone entity to another. Foreign exchange forward contracts generally settle within 90 days. The Company does not use these foreign exchange forward contracts for trading purposes.
Gains or losses resulting from changes in the fair value of these foreign exchange forward contracts are recorded as other income (expense), net, in the Consolidated Statement of Operations.
As of October 31, 2009, the notional amounts of the forward contracts the Company held to purchase and sell U.S. Dollars in exchange for other major international currencies were $50.9 million and $13.9 million, respectively.
The following table presents the fair value of the Company’s outstanding derivative instruments as of October 31, 2009 (in thousands):
| Balance Sheet Location |
Fair Value | ||||
| Derivative Assets |
|||||
| Derivatives designated as hedging instruments: |
|||||
| Foreign exchange forward contracts |
Prepaid expenses and Other Current Assets | $ | 26 | ||
| Derivatives not designated as hedging instruments: |
|||||
| Foreign exchange forward contracts |
Prepaid Expenses and Other Current Assets | 163 | |||
| Total |
$ | 189 | |||
| Derivative Liabilities |
|||||
| Derivatives designated as hedging instruments: |
|||||
| Foreign exchange forward contracts |
Other Current Liabilities | $ | –– | ||
| Derivatives not designated as hedging instruments: |
|||||
| Foreign exchange forward contracts |
Other Current Liabilities | 16 | |||
| Total |
$ | 16 | |||
The Company adopted ASC 815 prospectively on February 1, 2009. The effects of derivative instruments designated as cash flow hedges on income and AOCI are summarized below (in thousands):
| Losses Recognized in AOCI on Derivatives Before Tax Effect (Effective Portion) |
Losses Reclassified from AOCI into Income |
Losses Recognized in Income on Derivatives (Ineffective Portion) | ||||||||||||||
| Amount | Amount | Location | Amount | Location | ||||||||||||
| Derivatives designated as cash flow hedges from February 1, 2009 to October 31, 2009: |
||||||||||||||||
| Foreign exchange forward contracts |
$ | (250 | ) | $ | (168 | ) | Cost of net revenues- System Solutions |
$ | (223 | ) | Other income (expense), net | |||||
| Total |
$ | (250 | ) | $ | (168 | ) | $ | (223 | ) | |||||||
105
Table of Contents
VERIFONE HOLDINGS, INC. AND SUBSIDIARIES
NOTES TO CONSOLIDATED FINANCIAL STATEMENTS—(Continued)
The effects of derivatives instruments not designated as hedging instruments on income are summarized as follows (in thousands):
| Losses Recognized in Income on Derivatives | ||||||
| From February 1, 2009 to October 31, 2009 |
Location | |||||
| Derivatives not designated as hedging instruments: |
||||||
| Foreign exchange forward contracts |
$ | (7,289 | ) | Other income (expense), net | ||
| Total |
$ | (7,289 | ) | |||
Note 7. Other Income (Expense) and Comprehensive Income (Loss)
Other Income (Expense), net
Other income (expense), net consisted of the following (in thousands):
| Years Ended October 31, | ||||||||||||
| 2009 | 2008 | 2007 | ||||||||||
| Foreign currency transaction gains (losses), net |
$ | 5,464 | $ | (16,167 | ) | $ | 2,534 | |||||
| Foreign currency contract gains (losses), net |
(7,512 | ) | 4,841 | (4,804 | ) | |||||||
| Gains (losses) on debt extinguishment and debt repricing fee |
13,103 | — | (4,764 | ) | ||||||||
| Impairment of equity investment |
— | (2,236 | ) | — | ||||||||
| Other income (expense), net |
285 | 381 | (848 | ) | ||||||||
| $ | 11,340 | $ | (13,181 | ) | $ | (7,882 | ) | |||||
Accumulated Other Comprehensive Loss
Accumulated other comprehensive loss consisted of the following (in thousands):
| October 31, | ||||||||
| 2009 | 2008 | |||||||
| Foreign currency translation adjustments |
$ | (4,508 | ) | $ | (8,805 | ) | ||
| Unrealized loss on cash flow hedge |
(82 | ) | — | |||||
| Unfunded portion of pension plan obligations |
(1,447 | ) | (1,687 | ) | ||||
| Accumulated other comprehensive loss |
$ | (6,037 | ) | $ | (10,492 | ) | ||
Note 8. Income Taxes
Loss before income taxes consisted of the following (in thousands):
| Years Ended October 31, | ||||||||||||
| 2009 | 2008 | 2007 | ||||||||||
| US |
$ | (47,672 | ) | $ | (58,389 | ) | $ | (15,390 | ) | |||
| Foreign |
(80,918 | ) | (293,049 | ) | 6,092 | |||||||
| $ | (128,590 | ) | $ | (351,438 | ) | $ | (9,298 | ) | ||||
106
Table of Contents
VERIFONE HOLDINGS, INC. AND SUBSIDIARIES
NOTES TO CONSOLIDATED FINANCIAL STATEMENTS—(Continued)
The provision for income taxes consisted of the following (in thousands):
| Years Ended October 31, | ||||||||||||
| 2009 | 2008 | 2007 | ||||||||||
| Current: |
||||||||||||
| Federal |
$ | (5,913 | ) | $ | (2,253 | ) | $ | 8,964 | ||||
| State |
167 | (293 | ) | 1,843 | ||||||||
| Foreign |
17,296 | 19,814 | 12,250 | |||||||||
| 11,550 | 17,268 | 23,057 | ||||||||||
| Deferred: |
||||||||||||
| Federal |
(2,184 | ) | 55,736 | 2,127 | ||||||||
| State |
(203 | ) | 5,564 | 735 | ||||||||
| Foreign |
83 | (4,684 | ) | (1,201 | ) | |||||||
| (2,304 | ) | 56,616 | 1,661 | |||||||||
| $ | 9,246 | $ | 73,884 | $ | 24,718 | |||||||
A reconciliation of taxes computed at the federal statutory income tax rate to the provision for income taxes is as follows (in thousands):
| Years Ended October 31, | ||||||||||||
| 2009 | 2008 | 2007 | ||||||||||
| Benefit from income taxes computed at the federal statutory rate |
$ | (45,007 | ) | $ | (123,003 | ) | $ | (3,254 | ) | |||
| State income tax |
(36 | ) | 5,271 | 1,651 | ||||||||
| Foreign income tax rate differential |
(16,008 | ) | (33,148 | ) | 1,445 | |||||||
| Goodwill and intangibles impairment |
43,221 | 91,862 | — | |||||||||
| Valuation allowance |
24,639 | 133,252 | 23,571 | |||||||||
| Stock compensation |
2,731 | 740 | 1,302 | |||||||||
| Research credit |
— | — | (763 | ) | ||||||||
| Other |
(294 | ) | (1,090 | ) | 766 | |||||||
| $ | 9,246 | $ | 73,884 | $ | 24,718 | |||||||
107
Table of Contents
VERIFONE HOLDINGS, INC. AND SUBSIDIARIES
NOTES TO CONSOLIDATED FINANCIAL STATEMENTS—(Continued)
Deferred income taxes reflect the net tax effects of temporary differences between the carrying amounts of assets and liabilities for financial reporting purposes and the amounts used for income tax purposes. The significant components of the Company’s deferred tax assets and liabilities were as follows (in thousands):
| Years Ended October 31, | ||||||||
| 2009 | 2008 | |||||||
| Deferred tax assets: |
||||||||
| Inventories |
$ | 10,222 | $ | 7,482 | ||||
| Loss carryforwards |
25,013 | 22,033 | ||||||
| Accrued expenses and reserves |
20,126 | 19,308 | ||||||
| Deferred revenue |
17,317 | 16,106 | ||||||
| Depreciation |
2,211 | 3,088 | ||||||
| Basis differences in deductible goodwill and intangibles |
139,195 | 103,982 | ||||||
| Other |
1,296 | 567 | ||||||
| Stock option compensation |
14,902 | 11,743 | ||||||
| Amortizable debt costs |
17,925 | 27,839 | ||||||
| Foreign taxes on basis differences |
77,086 | 62,599 | ||||||
| Foreign tax credit carryforwards |
27,381 | 22,921 | ||||||
| Total deferred tax assets |
352,674 | 297,668 | ||||||
| Valuation allowance |
(312,845 | ) | (277,316 | ) | ||||
| Deferred tax liabilities: |
||||||||
| Basis differences on acquired intangibles |
(11,454 | ) | (13,034 | ) | ||||
| Unrealized foreign currency gains |
(4,484 | ) | (243 | ) | ||||
| Depreciation |
(1,268 | ) | (129 | ) | ||||
| Basis differences in investments in foreign subsidiaries |
(70,573 | ) | (60,660 | ) | ||||
| Other |
(8,402 | ) | (6,278 | ) | ||||
| Total deferred tax liabilities |
(96,181 | ) | (80,344 | ) | ||||
| Net deferred tax liabilities |
$ | (56,352 | ) | $ | (59,992 | ) | ||
As of October 31, 2009, the Company has recorded a net deferred tax liability of $56.4 million. The realization of the deferred tax assets is primarily dependent on the Company generating sufficient U.S. and foreign taxable income in future fiscal years. Management has determined that it is not more likely than not the deferred tax assets in the U.S. and certain foreign jurisdictions will be realized and as such the Company has recorded a full valuation allowance against these assets as of October 31, 2009. At October 31, 2009 and 2008, the Company has recorded a valuation allowance for deferred tax assets of $312.8 million and $277.3 million, respectively. The Company’s deferred tax asset valuation allowance increased by $35.5 million for the fiscal year ended October 31, 2009,increased by $157.8 million for the fiscal year ended October 31, 2008 and increased by $94.3 million for the fiscal year ended October 31, 2007. The increase of $35.5 million during fiscal year 2009 is primarily attributable to increased basis differences in the U.S. associated with goodwill impairments and increases in foreign tax credit carryforwards during October 31, 2009. During the fiscal years ended October 31, 2009 and 2008, goodwill was reduced by approximately $4.9 million and $0.5 million, respectively, as a result of a reduction in the valuation allowance for acquisition-related deferred tax assets that were realized. The Company will adopt ASC 805 starting from the first quarter of the fiscal year ended October 31, 2010. Post adoption of ASC 805 (formally FAS 141R), reversal of acquisition related deferred tax assets subject to valuation allowance will not result in modifications to goodwill.
108
Table of Contents
VERIFONE HOLDINGS, INC. AND SUBSIDIARIES
NOTES TO CONSOLIDATED FINANCIAL STATEMENTS—(Continued)
Tax losses carryforwards of $175.4 million are primarily related to tax losses in Ireland of $161.0 million, the United States federal of $4.2 million, Israel of $1.6 million, the United Kingdom of $2.9 million and various other non-U.S. countries of $5.7 million. Approximately $167.6 million of foreign tax losses may be carried forward indefinitely. The remaining balance of approximately $7.8 million of tax losses is subject to limited carry forward terms of 5 to 20 years.
As of October 31, 2009, the Company has recorded U.S. foreign tax credit carryforwards of $27.4 million, which will expire beginning in 2018, if not utilized.
The Company reduced tax liabilities by $0.4 million and $1.0 million for the fiscal years ended October 31, 2009 and 2008, respectively, due to the resolution of certain pre-acquisition tax contingencies. The reduction in tax liabilities resulted in a reduction of goodwill by $0.4 million and $1.0 million for the fiscal years ended October 31, 2009 and 2008, respectively. The Company will adopt ASC 805 (formally FAS 141R) starting from the first quarter of the fiscal year ended October 31, 2010.
The Company recognizes deferred tax liabilities associated with outside basis differences on investments in foreign subsidiaries unless the difference is considered essentially permanent in duration. As of October 31, 2009, the Company has recorded a deferred tax liability of $70.6 million associated with $217.5 million of taxable outside basis differences which are not considered permanently reinvested. The Company has not recorded deferred taxes on approximately $63.4 million of taxable outside basis differences as they are considered permanently reinvested. As of October 31, 2009, the determination of the unrecorded deferred tax liability related to these earnings is not practicable. If circumstances change and it becomes apparent that some or all of the undistributed earnings will not be invested indefinitely, or will be remitted in the foreseeable future, an additional deferred tax liability will be recorded for some or all of the outside basis difference.
The Company has been granted Pioneer Status for its operations in Singapore commencing November 1, 2005. The tax rate for enterprises granted Pioneer Status in Singapore is 0%. The benefits of the Pioneer Status will expire on November 1, 2011. The tax benefit of the tax holiday for the year ended October 31, 2009 was $4.1 million which had an insignificant impact on earnings per share.
The Company has a Tax Holiday in Turkey, Uruguay, India and China. The Tax Holiday in Turkey and Uruguay do not have expiration dates provided the Company complies with the local tax law requirements. The Tax Holiday in India expires in fiscal 2011 and the Tax Holiday in China expired during fiscal 2009. The combined Tax Holiday benefit is not significant and would have an insignificant impact on earnings per share for both fiscal 2009 and 2008.
The Company’s subsidiary in Israel and a subsidiary in Brazil are currently under audit by the Israeli and Brazilian taxing authorities for the fiscal years 2004 to 2006 and calendar years 2003 to 2008, respectively. Although the Company believes it has provided income taxes for the years subject to audit, the Israeli and Brazilian taxing authorities may adopt different interpretations. The Company has not yet received any final determinations with respect to these audits.
The Company is currently subject to an audit by the Internal Revenue Service, or IRS, for its fiscal years ended October 31, 2003 and 2004. Although the Company believes it has accurately recorded provisions for income taxes for the years subject to audit, the IRS may adopt different interpretations. The Company has not yet received any final determinations with respect to this audit although certain adjustments have been agreed with the IRS. The tax liability associated with the agreed adjustments has been accrued in the financial statements.
109
Table of Contents
VERIFONE HOLDINGS, INC. AND SUBSIDIARIES
NOTES TO CONSOLIDATED FINANCIAL STATEMENTS—(Continued)
The Company’s policy to include interest and penalties related to unrecognized tax benefits within the provision for taxes on the consolidated statements of operations did not change as a result of implementing the provisions of FIN 48.
The aggregate changes in the balance of gross unrecognized tax benefits under ASC 740 were as follows (in thousands):
| Beginning balance as of November 1, 2007 (date of adoption) |
$ | 19,200 | ||
| Lapse of statute of limitations |
(1,300 | ) | ||
| Increases in balances related to tax positions taken during prior periods |
1,500 | |||
| Decreases in balances related to tax positions taken during prior periods |
(800 | ) | ||
| Increases in balances related to tax positions taken during current period |
9,600 | |||
| Balance as of October 31, 2008 |
28,200 | |||
| Lapse of statute of limitations |
(900 | ) | ||
| Increases in balances related to tax positions taken during prior periods |
4,400 | |||
| Decreases in balances related to tax positions taken during prior periods |
(4,000 | ) | ||
| Increases in balances related to tax positions taken during current period |
2,300 | |||
| Balance as of October 31, 2009 |
$ | 30,000 | ||
Due to the adoption of ASC 805 (formally FAS 141R), effective for fiscal year 2010, the total gross unrecognized tax benefits of $30.0 million at October 31, 2009, if recognized, will affect the Company’s effective tax rate.
As of October 31, 2009, the Company had accrued interest and penalties related to unrecognized tax benefits of $8.4 million (net of tax benefit). During fiscal year 2009, interest and penalties related to unrecognized tax benefits increased by $2.0 million compared to fiscal year 2008, and was recognized in the provision for income taxes.
The amount of unrecognized tax benefits could be reduced upon closure of tax examinations or if the statute of limitations on certain tax filings expires without assessment from the tax authorities. We believe that it is reasonably possible that there could be a reduction in unrecognized tax benefits due to statute of limitation expirations in multiple tax jurisdictions during the next 12 months of zero to $3.0 million. Interest and penalties accrued on these uncertain tax positions will also be released upon the expiration of statutes of limitations.
Note 9. Stockholders’ Equity
Common and Preferred Stock
On October 8, 2008, the Company’s stockholders approved an amendment to the Certificate of Incorporation increasing the authorized shares of Common Stock from 100,000,000 to 200,000,000 shares, par value $0.01 per share. In addition, the Company has 10,000,000 authorized shares of Preferred Stock, par value $0.01. The holder of each share of Common Stock has the right to one vote. The Board of Directors has the authority to issue the undesignated Preferred Stock in one or more series and to fix the rights, preferences, privileges and restrictions thereof. As of October 31, 2009 and October 31, 2008, there were no shares of Preferred Stock outstanding and there were 84,544,086 and 84,442,833 shares of Common Stock outstanding, respectively.
110
Table of Contents
VERIFONE HOLDINGS, INC. AND SUBSIDIARIES
NOTES TO CONSOLIDATED FINANCIAL STATEMENTS—(Continued)
Stock Option Plans
The Company had a total of 12,049,432 stock options and 46,657 restricted stock units (“RSUs”) outstanding as of October 31, 2009. The number of shares that remained available for future grants under the 2006 Equity Incentive Plan was 2,572,198 as of October 31, 2009.
New Founders’ Stock Option Plan
In April 2003, the Company adopted the New Founders’ Stock Option Plan (the “New Founders’ Plan”) for executives and employees of the Company. A total of 1,500,000 shares of the Company’s Common Stock were reserved for issuance under the New Founders’ Plan. The Company is no longer granting options under the New Founders’ Plan and will retire any options cancelled thereafter. Option awards under the New Founders’ Plan were generally granted with an exercise price equal to the market price of the Company’s stock on the date of grant. Those option awards generally vest in equal annual amounts over a period of five years from the date of grant and have a maximum term of ten years.
Outside Directors’ Stock Option Plan
In January 2005, the Company adopted the Outside Directors’ Stock Option Plan (the “Directors’ Plan”) for members of the Board of Directors of the Company who are not employees of the Company or representatives of major stockholders of the Company. A total of 225,000 shares of the Company’s Common Stock have been reserved for issuance under the Directors’ Plan. The Company will no longer grant options under the Directors’ Plan and will retire any options cancelled thereafter. Stock options granted generally vest over a period of four years from the date of grant and have a maximum term of seven years.
2005 Equity Incentive Option Plan
On April 29, 2005, the Company adopted the 2005 Equity Incentive Option Plan (the “EIP Plan”) for executives and employees of the Company, and other individuals who provide services to the Company. A total of 3,100,000 shares of the Company’s Common Stock have been reserved for issuance under the EIP Plan. The Company will no longer grant options under the EIP Plan and will retire any options cancelled thereafter. Option awards were generally granted with an exercise price equal to the market price of the Company’s stock at the date of grant. Those options generally vest over a period of four years from the date of grant and have a maximum term of seven years.
Lipman Plans
In November 2006, the Company completed its acquisition of Lipman. As part of the acquisition consideration, the Company issued 13,462,474 shares of its common stock and assumed all of Lipman’s outstanding options totaling 3,375,527 options. The Company no longer grants options under the Lipman Plans and will retire any options cancelled thereafter.
2006 Equity Incentive Plan
In March 2006, the Company’s stockholders approved the 2006 Equity Incentive Plan (the “2006 Plan”) for officers, directors, employees, and consultants of the Company. Upon approval of the 2006 Plan a total of 9,000,000 shares of the Company’s Common Stock were reserved for issuance. On October 8, 2008, the stockholders approved an amendment to the 2006 Plan increasing the shares reserved for issuance to 13,200,000. Awards are granted with an exercise price equal to the market price of the Company’s Common Stock at the date of grant except for restricted stock units (“RSUs”). The awards generally vest over a period of four years from
111
Table of Contents
VERIFONE HOLDINGS, INC. AND SUBSIDIARIES
NOTES TO CONSOLIDATED FINANCIAL STATEMENTS—(Continued)
the date of grant and have a maximum term of seven years. Any shares granted as stock options and stock appreciation rights shall be counted as one share for every share granted. Any RSUs granted shall be counted as 1.75 shares for every RSU granted for the purpose of the number of shares issuable under the 2006 Plan. Option awards were generally granted with an exercise price equal to the market price of the Company’s stock at the day of grant.
In January 2007, the Company issued an award of up to 900,000 RSUs to the Company’s CEO. These RSUs were subject to vesting in three tranches of up to 300,000 RSUs each over a four-year period based upon annual growth in the Company’s net income, as adjusted, per share and its share price. Two-thirds of the RSUs were “performance units” that would have vested based on achievement of net income, as adjusted, targets, and one-third of the RSUs were “market units” that would have vested based on achievement of net income, as adjusted, targets and specified targets for the share price of the Company’s stock. The performance targets for 2007 and 2008 were not achieved; hence 400,000 performance units and 200,000 market units for those years have been cancelled.
The 2009 portion of the RSU awards were cancelled in connection with the amended and restated employment agreement for the Company’s CEO dated April 8, 2009. At the time of the cancellation, it was determined that the fiscal year 2009 performance targets would not be met and accordingly no compensation expense was recorded in connection with the cancellation.
All Plans
The total proceeds received from employees as a result of employee stock option exercises under all plans for each of the fiscal years ended October 31, 2009, 2008, and 2007 were $0.5 million, $2.4 million, and $38.3 million, respectively. In connection with these exercises, there were no tax benefits recognized by the Company in 2009 and the tax benefits realized by the Company for each of the fiscal years 2008 and 2007 were $0.5 million, and $11.5 million, respectively.
On October 8, 2009, the Company made an offer to exchange certain options to purchase shares of the Company’s common stock, par value $0.01 per share, for a lesser number of replacement options to purchase shares of common stock (the “Offer to Exchange”). The Offer to Exchange expired on November 6, 2009. Pursuant to the terms and conditions of the Offer to Exchange, the Company accepted for cancellation eligible options covering 3,322,075 shares of the Company’s common stock, representing approximately 74.5% of the total shares of common stock underlying options eligible for exchange. All surrendered options were cancelled as of November 6, 2009. The Company issued replacement options covering 1,474,970 shares of the Company’s common stock in exchange for the eligible options tendered and accepted in the Offer to Exchange. The exercise price of the replacement options is $14.29, which was the closing price of the Company’s common stock on November 6, 2009 as reported by the New York Stock Exchange. The Offer to Exchange was structured as a value-for-value exchange.
The Company estimates the grant-date fair value of stock options using a Black-Scholes valuation model, consistent with the provisions of ASC 718 (formerly SFAS No. 123(R) and SAB No. 107, Share-Based Payment), using the weighted-average assumptions noted in the following table. Expected volatility of the stock is based on a blend of the Company’s peer group in the industry in which it does business and the Company’s historical volatility for its own stock. The expected term represents the period of time that options granted are expected to be outstanding. The expected term of options granted is derived from the historical actual term of option grants and an estimate of future exercises during the remaining contractual period of the option. The average risk-free rate is based on the US Treasury zero-coupon issues with a remaining term equal to the
112
Table of Contents
VERIFONE HOLDINGS, INC. AND SUBSIDIARIES
NOTES TO CONSOLIDATED FINANCIAL STATEMENTS—(Continued)
expected term of the options used in the Black-Scholes valuation model. Estimates of fair value are not intended to predict actual future events or the value ultimately realized by employees who receive equity awards, and subsequent events are not indicative of the reasonableness of the original estimates of fair value made by the Company under ASC 718. The fair value of each RSU is equal to the market value of the Company’s common stock on the date of grant. The Company estimates forfeitures of options and RSUs based on historical experience and records compensation expense only for those awards that are expected to vest.
The Company’s assumptions subsequent to adoption of ASC 718 are as follows:
| Years Ended October 31, | |||||||||
| 2009 | 2008 | 2007 | |||||||
| Expected term of the options |
4 years | 3 years | 2 years | ||||||
| Risk-free interest rate |
2.1 | % | 2.5 | % | 4.8 | % | |||
| Expected stock price volatility |
64.0 | % | 52.2 | % | 40.0 | % | |||
| Expected dividend rate |
0.0 | % | 0.0 | % | 0.0 | % | |||
The following table presents the stock-based compensation expense recognized in accordance with ASC 718 during the fiscal years ended October 31, 2009, 2008, and 2007 (in thousands):
| Years Ended October 31, | |||||||||
| 2009 | 2008 | 2007 | |||||||
| Cost of net revenues |
$ | 1,714 | $ | 1,521 | $ | 2,998 | |||
| Research and development |
4,976 | 4,910 | 5,937 | ||||||
| Sales and marketing |
7,495 | 6,157 | 8,942 | ||||||
| General and administrative |
8,688 | 5,328 | 11,015 | ||||||
| Total stock-based compensation |
$ | 22,873 | $ | 17,916 | $ | 28,892 | |||
In fiscal year 2009, as a result of the cancellation of certain stock option grants voluntarily surrendered by employees, the Company expensed all previously unrecognized compensation cost of such stock option grants amounting to $3.9 million as of the cancellation dates.
As of October 31, 2009, total unrecognized compensation expense adjusted for estimated forfeitures related to unvested stock options and RSUs was $31.4 million and $1.2 million, respectively, which is expected to be recognized over the remaining weighted-average vesting periods of 2.8 years for stock options and 1.4 years for RSUs.
113
Table of Contents
VERIFONE HOLDINGS, INC. AND SUBSIDIARIES
NOTES TO CONSOLIDATED FINANCIAL STATEMENTS—(Continued)
Stock Option Activity
The following table provides a summary of stock option activity under all of the equity incentive plans described above for the year ended October 31, 2009:
| Shares Under Option (Thousands) |
Weighted Average Exercise Price |
Weighted Average Remaining Contractual Term (Years) |
Aggregate Intrinsic Value (Thousands) | ||||||||
| Outstanding at October 31, 2008 |
8,707 | $ | 26.20 | ||||||||
| Granted |
5,584 | $ | 7.27 | ||||||||
| Exercised |
(78 | ) | $ | 6.11 | |||||||
| Cancelled |
(837 | ) | $ | 22.17 | |||||||
| Expired |
(1,327 | ) | $ | 24.13 | |||||||
| Outstanding at October 31, 2009 |
12,049 | $ | 18.06 | 5.0 | $ | 36.421 | |||||
| Vested or expected to vest at October 31, 2009 |
11,130 | $ | 18.62 | 4.9 | $ | 32,055 | |||||
| Exercisable at October 31, 2009 |
4,537 | $ | 26.14 | 3.5 | $ | 3,648 | |||||
The weighted-average grant date fair value per share of options granted during each of the fiscal years 2009, 2008, and 2007 was $3.63, $7.29, and $9.59, respectively. The total intrinsic value of options exercised during each of the fiscal years 2009, 2008, and 2007 was $0.5 million, $5.3 million and $53.9 million, respectively.
The following table summarizes RSU activity for the year ended October 31, 2009:
| Shares (Thousands) |
Aggregate Intrinsic Value (Thousands) | |||||
| Outstanding at October 31, 2008 |
385 | |||||
| Granted |
10 | |||||
| Vested |
(32 | ) | ||||
| Forfeited |
(316 | ) | ||||
| Outstanding at October 31, 2009 |
47 | $ | 621 | |||
| Expected to vest at October 31, 2009 |
31 | $ | 406 | |||
The weighted-average grant date fair value per share of RSUs granted during each of the fiscal years 2009, 2008 and 2007, excluding the CEO’s performance and market RSUs was $5.30, $19.81 and $36.85, respectively. The total fair value of RSUs that vested in fiscal years 2009, 2008 and 2007 was $0.3 million, $1.9 million and $1.7 million, respectively.
Note 10. Employee Benefit Plans
401(k) and Pension Plans
The Company maintains a defined contribution 401(k) plan for its US employees that allow eligible employees to contribute up to 60% of their pretax salary up to the maximum allowed under Internal Revenue Service regulations. Discretionary employer matching contributions of $1.2 million, $2.2 million, and $2.0 million were made to the plan during the fiscal years ended October 31, 2009, 2008 and 2007, respectively. The Company stopped its discretionary employer matching contribution on May 16, 2009.
114
Table of Contents
VERIFONE HOLDINGS, INC. AND SUBSIDIARIES
NOTES TO CONSOLIDATED FINANCIAL STATEMENTS—(Continued)
The Company has a defined benefit plan for its employees in Taiwan, as required by local laws. The unfunded portion of the pension plan’s obligations was $1.4 million as of October 31, 2009 and is included in other long-term liabilities in the Consolidated Balance Sheets. The Company’s fiscal year end, October 31, is the measurement date for the plan. Net pension costs were approximately $0.3 million, $0.3 million and $0.2 million for the fiscal years ended October 31, 2009, 2008 and 2007, respectively.
Israeli Severance Funds
The Company’s liability for severance funds to its Israeli employees is calculated pursuant to Israeli severance fund law based on the most recent salary of the employee multiplied by the number of years of employment of such employee as of the applicable balance sheet date. Employees are entitled to one month’s salary for each year of employment, or a pro-rata portion thereof. The Company funds the liability by monthly deposits in insurance policies and severance funds. Severance funds expense totaled approximately $1.4 million, $1.7 million and $1.4 million for the fiscal years ended October 31, 2009, 2008 and 2007, respectively. The accrued severance funds liability as of October 31, 2009 and 2008 was $3.8 million and $4.0 million, respectively.
Note 11. Net Loss per Share of Common Stock
Basic net loss per share of common stock is computed by dividing net loss by the weighted average number of shares of common stock outstanding for the period, less the weighted average number of shares of common stock subject to repurchase. Diluted net loss per share of common stock is computed using the weighted average number of shares of common stock outstanding plus the effect of common stock equivalents, unless the common stock equivalents are anti-dilutive. The potential dilutive shares of the Company’s common stock resulting from the assumed exercise of outstanding stock options and equivalents and the assumed exercise of the warrants relating to the convertible senior notes are determined using the treasury stock method. Under the treasury stock method, an increase in the fair market value of the Company’s common stock can result in a greater number of dilutive securities.
The following details the computation of loss per share of common stock (in thousands, except per share data):
| Years Ended October 31, | ||||||||||||
| 2009 | 2008 | 2007 | ||||||||||
| Basic and diluted net loss per share: |
||||||||||||
| Numerator: |
||||||||||||
| Net loss |
$ | (137,836 | ) | $ | (425,322 | ) | $ | (34,016 | ) | |||
| Denominator: |
||||||||||||
| Weighted average common stock outstanding |
84,473 | 84,220 | 82,862 | |||||||||
| Less: weighted average number of shares subject to repurchase |
— | — | (668 | ) | ||||||||
| Weighted average shares used in computing basic per share calculation |
84,473 | 84,220 | 82,194 | |||||||||
| Weighted average effect of dilutive securities: |
||||||||||||
| Stock options and RSUs |
— | — | — | |||||||||
| Weighted average shares used in computing diluted per share calculation |
84,473 | 84,220 | 82,194 | |||||||||
| Net loss per share: |
||||||||||||
| Basic |
$ | (1.63 | ) | $ | (5.05 | ) | $ | (0.41 | ) | |||
| Diluted |
$ | (1.63 | ) | $ | (5.05 | ) | $ | (0.41 | ) | |||
115
Table of Contents
VERIFONE HOLDINGS, INC. AND SUBSIDIARIES
NOTES TO CONSOLIDATED FINANCIAL STATEMENTS—(Continued)
For the years ended October 31, 2009, 2008, and 2007, options and RSUs to purchase 12.1 million, 9.1 million and 9.1 million shares of common stock, respectively, were excluded from the calculation of weighted average shares for diluted net loss per share as they were anti-dilutive.
The Notes are considered to be Instrument C securities as defined by ASC 815-15-55-18 (formerly EITF No. 90-19, Convertible Bonds with Issuer Option to Settle for Cash upon Conversion), therefore, only the conversion spread relating to the Notes is included in the Company’s diluted earnings per share calculation, if dilutive. Under such method, the settlement of the conversion spread of the Notes has a dilutive effect when the average share price of the Company’s common stock during the period exceeds $44.02. The average share price of the Company’s common stock during the fiscal years ended October 31, 2009, 2008 and 2007 did not exceed $44.02, therefore the effect of the Notes was anti-dilutive for those periods.
Warrants to purchase 7.2 million shares of the Company’s common stock were outstanding at October 31, 2009, 2008 and 2007, but were not included in the computation of diluted earnings per share because the warrants’ exercise price was greater than the average share price of the Company’s common stock during the fiscal years ended October 31, 2009, 2008 and 2007; therefore, the effect of the warrants was anti-dilutive for those periods.
Note 12. Commitments and Contingencies
The Company leases certain facilities under non-cancelable operating leases that contain free rent periods and/or rent escalation clauses. Rent expense under these leases has been recorded on a straight-line basis over the lease term. The Company is committed to pay a portion of the related actual operating expenses under certain of these lease agreements. These operating expenses are not included in the table below. The difference between amounts paid and rent expense is recorded as deferred rent and the short-term and long-term portions are included in Other Current Liabilities and Other Long-term Liabilities, respectively, in the Consolidated Balance Sheets. Additionally, the Company subleases certain real property to third parties.
Future minimum lease payments and sublease rental income under these leases as of October 31, 2009, were as follows (in thousands):
| Fiscal Years Ending October 31: | Minimum Lease Payments |
Sublease Rental Income |
Net Minimum Lease Payments | |||||||
| 2010 |
$ | 10,433 | $ | (4 | ) | $ | 10,429 | |||
| 2011 |
8,131 | — | 8,131 | |||||||
| 2012 |
6,632 | — | 6,632 | |||||||
| 2013 |
5,148 | — | 5,148 | |||||||
| 2014 |
3,367 | — | 3,367 | |||||||
| Thereafter |
3,492 | — | 3,492 | |||||||
| Total |
$ | 37,203 | $ | (4 | ) | $ | 37,199 | |||
Rent expense was approximately $12.9 million, $16.1 million and $14.9 million for the fiscal years ended October 31, 2009, 2008, and 2007, respectively.
Manufacturing Agreements
The Company works on a purchase order basis with third-party contract manufacturers with facilities in China, Singapore and Brazil, and component suppliers located throughout the world to supply a majority of the Company’s finished goods inventories, spare parts, and accessories. The Company provides each supplier with a
116
Table of Contents
VERIFONE HOLDINGS, INC. AND SUBSIDIARIES
NOTES TO CONSOLIDATED FINANCIAL STATEMENTS—(Continued)
purchase order to cover the manufacturing requirements, which constitutes a binding commitment by the Company to purchase materials produced by the manufacturer as specified in the purchase order. These purchase orders are generally considered to be non-cancellable and are expected to be paid within one year of the issuance date. As of October 31, 2009, the amount of purchase orders issued to contract manufacturers and component suppliers totaled approximately $66.4 million. Of this amount, $3.8 million has been recorded in Other Current Liabilities in the accompanying Consolidated Balance Sheets as of October 31, 2009 because these commitments are not expected to have future value to the Company.
The Company utilizes a limited number of third parties to manufacture a significant portion of its products and relies upon these contract manufacturers to produce and deliver products to its customers on a timely basis and at an acceptable cost. Furthermore, a majority of the Company’s manufacturing activities is concentrated in China. As a result, disruptions to the business or operations of the contract manufacturers or to their ability to produce the required products in a timely manner, and particularly disruptions to these manufacturing facilities located in China, could significantly impact the Company’s business and operations. In addition, a number of components that are necessary to manufacture and assemble the Company’s systems are specifically customized for use in the Company’s products and are obtained from sole source suppliers on a purchase order basis. Because of the customized nature of these components and the limited number of available suppliers, it would be difficult and costly to find alternative sources in a timely manner.
Employee Health and Dental Costs
The Company is primarily self-insured for employee health and dental costs, but has stop-loss insurance coverage to limit per-incident liability. The Company believes that adequate accruals are maintained to cover the retained liability. The accrual for self-insurance is determined based on claims filed and an estimate of claims incurred but not yet reported.
Accrued Warranty
The Company provides reserves for the estimated costs of product warranty obligations based on a number of factors including the size of the installed base of products subject to warranty protection, historical and projected warranty claim rates, historical and projected costs associated with claims, and knowledge of specific product failures that are outside of the Company’s typical experience. The Company assesses the adequacy of its recorded warranty liabilities and adjusts the amounts as necessary based on actual experience and changes in future estimates. As of October 31, 2009, the Company’s warranty accrual included approximately $4.0 million related to a potential warranty exposure for one of its products. The amount accrued represents the Company’s estimate of its exposure based on currently available information. There is a reasonable possibility that the Company may incur additional warranty expense related to this product in future periods.
ASC 740 Income Tax Uncertainties (formerly FASB Interpretation No. 48, “Accounting for Income Tax Uncertainties”)
As of October 31, 2009, the amount payable of the Company’s unrecognized tax benefits was $32.6 million, including accrued interest and penalties, of which none is expected to be paid within one year. The Company is unable to make a reasonably reliable estimate as to when cash settlement with a taxing authority may occur. The Company believes that it is reasonably possible that there could be a reduction in unrecognized tax benefits due to statute of limitation expirations in multiple tax jurisdictions during the next 12 months of zero to $3.0 million, plus related interest.
117
Table of Contents
VERIFONE HOLDINGS, INC. AND SUBSIDIARIES
NOTES TO CONSOLIDATED FINANCIAL STATEMENTS—(Continued)
Legal Proceedings
Brazilian State Tax Assessments
State Value Added Tax
One of the Company’s Brazilian subsidiaries has been notified of a tax assessment regarding Brazilian state value added tax (“VAT”), for the periods from 2000 to 2002 that relates to products supplied to the Company by a contract manufacturer. The assessment relates to an asserted deficiency of 4.7 million Brazilian reais (approximately $2.7 million). The tax assessment was based on a clerical error in which the Company’s Brazilian subsidiary omitted the required tax exemption number on its invoices. On August 27, 2003, the tax authorities rendered a first level decision that maintained the tax assessment. The Company has appealed the first level decision. On March 30, 2009, the proceeding was remitted to the State Court of Appeals. This proceeding is currently pending second administrative level decision. The Company does not expect that it will ultimately incur a material liability in respect of this assessment and has not recorded a reserve for this assessment, because the Company believes, based in part on advice of its Brazilian tax counsel, that it is likely to prevail in the proceedings relating to this assessment. In the event the Company receives an adverse ruling from the administrative body, it will decide whether or not to appeal and would reexamine the determination as to whether an accrual is necessary. It is currently uncertain what impact this state tax examination may have with respect to the Company’s use of a corresponding exemption to reduce the Brazilian federal VAT.
Importation of Goods Assessments
Two of the Company’s Brazilian subsidiaries that were acquired as a part of the Lipman acquisition have been notified of assessments regarding Brazilian customs penalties that relate to alleged infractions in the importation of goods. The assessments were issued by the Federal Revenue Department in the City of Vitória, the City of São Paulo, and the City of Itajai. The assessments relate to asserted deficiencies initially totaling 26.9 million Brazilian reais (approximately $15.3 million) excluding interest. The tax authorities allege that the structure used for the importation of goods was simulated with the objective of evading taxes levied on the importation by under-invoicing the imported goods. The tax authorities allege that the simulation was created through a fraudulent interposition of parties, where the real sellers and buyers of the imported goods were hidden.
In the Vitória tax assessment, the fines were reduced from 4.7 million Brazilian reais (approximately $2.7 million) to 1.5 million Brazilian reais (approximately $0.8 million) on a first level administrative decision on January 26, 2007. The proceeding has been remitted to the Taxpayers Council to adjudicate the appeal of the first level administrative decision filed by the tax authorities. The Company also appealed the first level administrative decision on February 26, 2007. In this appeal, the Company argued that the tax authorities did not have enough evidence to determine that the import transactions were indeed fraudulent and that, even if there were some irregularities in such importations, they could not be deemed to be the Company’s responsibility since all the transactions were performed by the third-party importer of the goods. On February 27, 2008, the Taxpayers Council rendered its decision to investigate the first level administrative decision for further analysis of the matter. This proceeding was initially scheduled for judgment before the decision of the Taxpayers Administrative Council of Tax Appeals in 2009, but has been postponed to the next judgment session. In the event the Company receives an adverse ruling from the Taxpayers Council, the Company will decide whether or not to appeal to the judicial level. Based on the Company’s current understanding of the underlying facts, the Company believes that it is probable that its Brazilian subsidiary will be required to pay some amount of fines. At October 31, 2009, the Company has accrued 4.7 million Brazilian reais (approximately $2.7 million) for this matter, excluding interest, which it believes is the probable payment.
118
Table of Contents
VERIFONE HOLDINGS, INC. AND SUBSIDIARIES
NOTES TO CONSOLIDATED FINANCIAL STATEMENTS—(Continued)
On July 12, 2007, the Company was notified of a first administrative level decision rendered in the São Paulo tax assessment, which maintained the total fine of 20.2 million Brazilian reais (approximately $11.5 million), imposed. On August 10, 2007, the Company appealed the first administrative level decision to the Taxpayers Council. A hearing was held on August 12, 2008 before the Taxpayers Council, and on October 14, 2008, the Taxpayers Council granted the Company’s appeal and dismissed the São Paulo assessment based upon the assessment being erroneously calculated on the value of the sale of the products in question to end customers in the local market rather than on the declared importation value of such products. The Company was subsequently notified of the Taxpayers Council’s decision and the case was dismissed on May 19, 2009. In August 2009, the Brazilian tax authorities requested additional materials from the Company. In October 2009, the Company received a revised assessment in this matter of 1.9 million Brazilian reais (approximately $1.1 million). In addition, pursuant to a contingency legal representation agreement entered into between the Company’s Brazilian subsidiary (prior to the Lipman acquisition) and Brazilian counsel, the Company’s Brazilian subsidiary has agreed to pay to Brazilian counsel legal fees in the amount of 5.0 million reais (approximately $2.8 million) for achieving the successful dismissal of the São Paulo tax assessment. The Company paid $1.1 million (2.0 million reais) of this legal fee during the fourth quarter of fiscal year 2009 and will pay the remainder over the next 12 months. At October 31, 2009, the Company has reduced its accrual for this matter to 4.6 million Brazilian reais (approximately $2.6 million), including the remaining Brazilian counsel legal fees.
On May 22, 2008, the Company was notified of a first administrative level decision rendered in the Itajai assessment, which maintained the total fine of 2.0 million Brazilian reais (approximately $1.1 million), imposed, excluding interest. On May 27, 2008, the Company appealed the first level administrative level decision to the Taxpayers Council. Based on the Company’s current understanding of the underlying facts, the Company believes that it is probable that its Brazilian subsidiary will be required to pay some amount of fines. Accordingly, at October 31, 2009, the Company has accrued 2.0 million Brazilian reais (approximately $1.1 million) for this matter, excluding interest.
Patent Infringement and Commercial Litigation
Heartland Payment Systems, Inc.
On September 6, 2009, the Company commenced an action in the United States District Court for the Northern District of California against Heartland Payment Systems, Inc. (“Heartland”), a card payment processor, for infringement of U.S. Patent No. 6,853,093 by certain Heartland payment terminals. The Company is seeking a judgment of infringement, an injunction against further infringement, damages, interest and attorneys’ fees. On September 16, 2009, Heartland sued the Company in the Superior Court of New Jersey, Mercer County, alleging certain unfair business activities. On October 13, 2009, the Company amended its original complaint to request declaratory judgment that the Company did not engage in such unfair business activities. On November 6, 2009, the Company filed a second lawsuit against Heartland in the United States District Court for the Northern District of California, alleging certain false advertising and unfair competition claims. On that same day, Heartland also filed a second lawsuit against the Company in the United States District Court, District of New Jersey, alleging trademark infringement, false advertising and violation of the Anti-cybersquatting Protection Act, and an emergency application for a temporary restraining order which was subsequently denied by the New Jersey District Court. A preliminary injunction hearing on this matter is scheduled in December 2009 before the New Jersey District Court. These actions are in the preliminary stages and at this time the Company is not able to predict the outcome or quantify the potential liability, if any, for these actions. An unfavorable outcome could have a material adverse effect on the Company’s business, financial condition, results of operations, and cash flow.
119
Table of Contents
VERIFONE HOLDINGS, INC. AND SUBSIDIARIES
NOTES TO CONSOLIDATED FINANCIAL STATEMENTS—(Continued)
SPA Syspatronic AG v. VeriFone Holdings, Inc., VeriFone, Inc., et al.
On September 18, 2007, SPA Syspatronic AG (“SPA”) commenced an action in the United States District Court for the Eastern District of Texas, Marshall Division, against the Company and others, alleging infringement of U.S. Patent No. 5,093,862 purportedly owned by SPA. SPA is seeking a judgment of infringement, an injunction against further infringement, damages, interest and attorneys’ fees. The Company filed an answer and counterclaims on November 8, 2007, and intends to vigorously defend this litigation. On January 28, 2008, the Company requested that the U.S. Patent and Trademark Office (the “PTO”) perform a re-examination of the patent. The PTO granted the request on April 4, 2008. The Company then filed a motion to stay the proceedings with the Court and on April 25, 2008, the Court agreed to stay the proceedings pending the re-examination. On December 19, 2008, the PTO rejected all claims of the subject patent on the same basis as was identified in the Company’s request for re-examination. The case is still in the preliminary stages, and it is not possible to quantify the extent of the Company’s potential liability, if any, related to this action. An unfavorable outcome could have a material adverse effect on the Company’s business, financial condition, results of operations, and cash flow.
Cardsoft, Inc. et al v. VeriFone Holdings, Inc., VeriFone, Inc., et al.
On March 6, 2008, Cardsoft, Inc. and Cardsoft (Assignment for the Benefit of Creditors), LLC (“Cardsoft”) commenced an action in the United States District Court for the Eastern District of Texas, Marshall Division, against the Company and others, alleging infringement of U.S. Patents No. 6,934,945 and No. 7,302,683 purportedly owned by Cardsoft. Cardsoft is seeking a judgment of infringement, an injunction against further infringement, damages, interest and attorneys’ fees. The Company intends to vigorously defend this litigation. The case is still in the preliminary stages, and it is not possible to quantify the extent of the Company’s potential liability, if any, related to this action. An unfavorable outcome could have a material adverse effect on the Company’s business, financial condition, results of operations, and cash flow.
Communication Transaction Solutions, Inc. v. VeriFone Holdings, Inc., VeriFone, Inc., et al.
The Company was a defendant in an action initiated in the California Superior Court in Santa Clara County on August 30, 2006, in which the plaintiff alleged among other things misappropriation of trade secrets in connection with the Company’s development of its wireless pay-at-the-table system. These allegations followed the Company’s decision in October 2005 to terminate discussions regarding a possible acquisition of the plaintiff’s business. The plaintiff sought damages, interest and attorneys’ fees. The parties argued summary judgment motions on September 4, 2008 and on September 11, 2008, the court dismissed certain of the plaintiffs’ claims. In January 2009, without admitting any misappropriation of trade secrets, wrongdoing or violation of law and to avoid the distraction and expense of continued litigation, the Company settled the litigation with the plaintiff. In exchange for a payment of $3.0 million by the Company, all asserted claims were dismissed and the Company received a perpetual, fully paid-up license to all plaintiff intellectual property and trade secrets asserted in the lawsuit.
Class Action and Derivative Lawsuits
On or after December 4, 2007, several securities class action claims were filed against the Company and certain of the Company’s officers, former officers, and a former director. These lawsuits were consolidated in the U.S. District Court for the Northern District of California as In re VeriFone Holdings, Inc. Securities Litigation, C 07-6140 MHP. The original actions were: Eichenholtz v. VeriFone Holdings, Inc. et al., C 07-6140 MHP; Lien v. VeriFone Holdings, Inc. et al., C 07-6195 JSW; Vaughn et al. v. VeriFone Holdings, Inc. et al., C 07-6197 VRW (Plaintiffs voluntarily dismissed this complaint on March 7, 2008); Feldman et al. v. VeriFone
120
Table of Contents
VERIFONE HOLDINGS, INC. AND SUBSIDIARIES
NOTES TO CONSOLIDATED FINANCIAL STATEMENTS—(Continued)
Holdings, Inc. et al., C 07-6218 MMC; Cerini v. VeriFone Holdings, Inc. et al., C 07-6228 SC; Westend Capital Management LLC v. VeriFone Holdings, Inc. et al., C 07-6237 MMC; Hill v. VeriFone Holdings, Inc. et al., C 07-6238 MHP; Offutt v. VeriFone Holdings, Inc. et al., C 07-6241 JSW; Feitel v. VeriFone Holdings, Inc., et al., C 08-0118 CW. On August 22, 2008, the court appointed plaintiff National Elevator Fund lead plaintiff and its attorneys lead counsel. Plaintiff filed its consolidated amended class action complaint on October 31, 2008, which asserts claims under the Securities Exchange Act Sections 10(b), 20(a), and 20A and Securities and Exchange Commission Rule 10b-5 for securities fraud and control person liability against the Company and certain of the Company’s current and former officers and directors, based on allegations that the Company and the individual defendants made false or misleading public statements regarding the Company’s business and operations during the putative class periods and seeks unspecified monetary damages and other relief. The Company filed its motion to dismiss on December 31, 2008. The court granted the Company’s motion on May 26, 2009 and dismissed the consolidated amended class action complaint with leave to amend within 30 days of the ruling. The proceedings were stayed pending a mediation held in October 2009 at which time the parties failed to reach a mutually agreeable settlement. Plaintiffs’ second amended complaint was filed on December 3, 2009 and the Company’s responsive motion is due on January 25, 2010. Although discovery has not yet commenced in this action, on November 20, 2009, plaintiffs filed a motion to partially lift the Private Securities Litigation Reform Act discovery stay in order to obtain documents produced by the Company to the SEC in connection with the SEC’s investigation into the Company’s restatement of its fiscal year 2007 interim financial statements. The Company’s opposition to this motion is due January 11, 2010, with a hearing on the motion scheduled for February 1, 2010. At this time, the Company has not recorded any liabilities related to this action as the Company is unable to estimate any potential liability.
Beginning on December 13, 2007, several actions were also filed against certain current and former directors and officers derivatively on the Company’s behalf. These derivative lawsuits were filed in: (1) the U.S. District Court for the Northern District of California, as In re VeriFone Holdings, Inc. Shareholder Derivative Litigation, Lead Case No. C 07-6347 MHP, which consolidates King v. Bergeron, et al. (Case No. 07-CV-6347), Hilborn v. VeriFone Holdings, Inc., et al. (Case No. 08-CV-1132), Patel v. Bergeron, et al. (Case No. 08-CV-1133), and Lemmond, et al. v. VeriFone Holdings, Inc., et al. (Case No. 08-CV-1301); and (2) California Superior Court, Santa Clara County, as In re VeriFone Holdings, Inc. Derivative Litigation, Lead Case No. 1-07-CV-100980, which consolidates Catholic Medical Mission Board v. Bergeron, et al. (Case No. 1-07-CV-100980), and Carpel v. Bergeron, et al. (Case No. 1-07-CV-101449). On May 15, 2008, the court in the federal derivative action appointed Charles R. King as lead plaintiff and his attorneys as lead counsel. On October 31, 2008, plaintiffs in the federal action filed their consolidated amended derivative complaint, which names the Company as a nominal defendant and brings claims for insider selling, breach of fiduciary duty, unjust enrichment, waste of corporate assets and aiding and abetting breach of fiduciary duty against the Company and certain of the Company’s current and former officers and directors. On December 15, 2008, the Company and the other defendants filed a motion to dismiss. The parties agreed by stipulation that briefing on this motion would relate only to the issue of plaintiffs’ failure to make a pre-suit demand on the Company’s Board of Directors. The court granted the Company’s motion on May 26, 2009 and dismissed the consolidated amended derivative complaint with leave to amend within 30 days of the ruling. The proceedings were stayed pending a mediation held in October 2009 at which the parties failed to reach a mutually agreeable settlement. Plaintiffs’ second amended complaint was filed on December 10, 2009 and the Company’s responsive motion is due on January 25, 2010. While discovery is not yet underway in this action, on June 9, 2009, plaintiffs in the federal derivative action made a demand to inspect certain of the Company’s books and records. In response to this demand, the Company provided certain of its books and records, including minutes and materials for its Board of Directors, Audit Committee and Compensation Committee meetings for the relevant period. The Company produced documents responsive to each category of plaintiffs’ request except that the Company withheld production, on the basis of privilege, of the Audit Committee’s report of the independent investigation into the events leading to
121
Table of Contents
VERIFONE HOLDINGS, INC. AND SUBSIDIARIES
NOTES TO CONSOLIDATED FINANCIAL STATEMENTS—(Continued)
the Company’s restatement of its fiscal year 2007 interim financial statements. On November 6, 2009, plaintiffs filed a complaint in Delaware Chancery Court seeking to compel production of the independent investigation report. The Company filed a motion to dismiss this complaint on December 3, 2009, and its opening brief in support of the motion to dismiss is due in January 2010. At this time, the Company has not recorded any liabilities for this action as it is unable to estimate any potential liability.
On October 31, 2008, the derivative plaintiffs filed their consolidated derivative complaint in California Superior Court for the County of Santa Clara naming the Company as a nominal defendant and bringing claims for insider selling, breach of fiduciary duty, unjust enrichment, waste of corporate assets and aiding and abetting breach of fiduciary duty against certain of the Company’s current and former officers and directors and its largest shareholder as of October 31, 2008, GTCR Golder Rauner. On November 10, 2008, the Company filed a motion to stay the state court action pending resolution of the parallel federal actions, and the parties have agreed by stipulation to delay briefing on the motion to stay until after the issue of demand futility is resolved in the federal derivative case. The case management conference in the state court action has been continued until April 2010, pending the resolution of the Company’s motion to dismiss filed in the federal derivative action. At this time, the Company has not recorded any liabilities for this action as it is unable to estimate any potential liability.
On January 27, 2008, a class action complaint was filed against the Company in the Central District Court in Tel Aviv, Israel on behalf of purchasers of the Company’s stock on the Tel Aviv Stock Exchange. The complaint seeks compensation for damages allegedly incurred by the class of plaintiffs due to the publication of erroneous financial reports. The Company filed a motion to stay the action, in light of the proceedings already filed in the United States, on March 31, 2008. A hearing on the motion was held on May 25, 2008. Further briefing in support of the stay motion, specifically with regard to the threshold issue of applicable law, was submitted on June 24, 2008. On September 11, 2008, the Israeli District Court ruled in the Company’s favor, holding that U.S. law would apply in determining the Company’s liability. On October 7, 2008, plaintiffs filed a motion for leave to appeal the District Court’s ruling to the Israeli Supreme Court. The Company’s response to plaintiffs’ appeal motion was filed on January 18, 2009. Because the Company’s motion to stay will depend upon the Supreme Court’s ruling, the District Court has stayed its proceedings until the Supreme Court rules on plaintiffs’ motion for leave to appeal. The hearing on plaintiffs’ motion in the Supreme Court is set for January 11, 2010. At this time, the Company has not recorded any liabilities for this action as it is unable to estimate any potential liability.
Certain of the foregoing are still in the preliminary stages, and the Company is not able to quantify the extent of its potential liability, if any. An unfavorable outcome in any of these matters could have a material adverse effect on the Company’s business, financial condition, results of operations, and cash flows. In addition, defending these legal proceedings is likely to be costly and may divert management’s attention from the day-to-day operations of the business.
Regulatory Actions
The Company has responded to inquiries and provided information and documents related to the restatement of its fiscal year 2007 interim financial statements to the Securities and Exchange Commission, the Department of Justice, the New York Stock Exchange and the Chicago Board Options Exchange. The SEC has interviewed several current and former officers and employees.
On February 18, 2009, the Company received a “Wells Notice” from the SEC in connection with the investigation by the staff of the SEC’s Division of Enforcement (the “Staff”) notifying the Company that the Staff intends to recommend that the SEC bring a civil injunctive action against the Company, alleging violations of the federal securities laws arising from the restatement of the Company’s fiscal year 2007 interim financial
122
Table of Contents
VERIFONE HOLDINGS, INC. AND SUBSIDIARIES
NOTES TO CONSOLIDATED FINANCIAL STATEMENTS—(Continued)
statements. The Company submitted its response to the Wells Notice on March 18, 2009. On September 1, 2009, without admitting or denying the SEC’s allegations, the Company agreed to a permanent injunction against future violations of certain reporting, books and records and internal accounting control provisions of the federal securities laws. No other charge or monetary penalty was assessed against the Company, which cooperated fully with the Commission’s investigation. This settlement, which was approved by the United States District Court for the Northern District of California in November 2009, concluded the SEC’s investigation of this matter with respect to the Company.
Other Litigation
The Company is subject to various other legal proceedings related to commercial, customer, and employment matters that have arisen during the ordinary course of business. Although there can be no assurance as to the ultimate disposition of these matters, the Company’s management has determined, based upon the information available at the date of these financial statements, that the expected outcome of these matters, individually or in the aggregate, will not have a material adverse effect on the Company’s consolidated financial position, results of operations or cash flows.
Note 13. Restructuring Charges
The following table summarizes restructuring expenses for the years ended October 31, 2009, 2008 and 2007 (in thousands):
| 2009 | 2008 | 2007 | |||||||
| Cost of net revenues |
$ | 434 | $ | 587 | $ | 158 | |||
| Research and development |
949 | 1,829 | — | ||||||
| Sales and marketing |
1,272 | 3,048 | 223 | ||||||
| General and administrative |
3,260 | 2,805 | 441 | ||||||
| $ | 5,915 | $ | 8,269 | $ | 822 | ||||
In addition to the restructuring expense, the Company incurred restructuring related expense of $1.7 million in fiscal year 2009 which represented accelerated depreciation in relation to the Company’s decision to outsource its Israeli in-house manufacturing to Sanmina-SCI Corporation in 2010. Of the $1.7 million, $1.0 million was included in cost of net revenues and $0.7 million in general and administrative expenses in the Consolidated Statement of Operations.
The Company expects to incur approximately $1.0 million of additional restructuring charges and approximately $2.0 million of additional accelerated depreciation related restructuring expense in fiscal year 2010.
Restructuring activity for the fiscal year ended October 31, 2009 was as follows (in thousands):
| Employee Severance and Benefit Arrangements |
Facilities Related Costs |
Total | ||||||||||
| Balance at November 1, 2008 |
$ | 1,332 | $ | 1,992 | $ | 3,324 | ||||||
| Current year charges |
3,318 | 2,597 | 5,915 | |||||||||
| Other adjustments |
(130 | ) | 28 | (102 | ) | |||||||
| Cash payments |
(3,457 | ) | (1,195 | ) | (4,652 | ) | ||||||
| Balance at October 31, 2009 |
$ | 1,063 | $ | 3,422 | $ | 4,485 | ||||||
123
Table of Contents
VERIFONE HOLDINGS, INC. AND SUBSIDIARIES
NOTES TO CONSOLIDATED FINANCIAL STATEMENTS—(Continued)
As of October 31, 2009, $2.7 million of restructuring accrual was included in Other Current Liabilities and $1.8 million of restructuring accrual was included in Other Long-term Liabilities in the Consolidated Balance Sheets.
Fiscal Year 2009 Restructuring Plans
During fiscal year 2009, in light of the macroeconomic conditions, management approved several actions worldwide as part of a restructuring plan designed to improve financial results. The Company expensed $0.1 million for facilities, $2.9 million for employee restructuring and $0.1 million of other restructuring expense in the Corporate segment. As of October 31, 2009, $2.7 million has been paid, resulting in a remaining liability of $0.4 million.
Fiscal Year 2008 Restructuring Plans
In 2008, management approved and committed plans to reduce the Company’s cost structure. The restructuring plan applied to employees and facilities worldwide. The Company expensed $0.8 million for facilities and $6.7 million for employees for a total of $7.5 million in the year ended October 31, 2008. As of October 31, 2008, $5.7 million had been paid, resulting in a remaining liability of $0.9 million for facilities and $0.8 million for employees. In fiscal year 2009, the Company expensed an additional $2.8 million in the corporate segment for facilities and paid $0.7 million, resulting in a remaining liability of $3.0 million. The Company also expensed $0.1 million in the corporate segment for employees and paid $0.8 million, resulting in a liability of $0.1 million.
Acquisition-Related Restructuring Plans
Lipman Restructuring Plan
In the first quarter of fiscal year 2007, the Company completed the acquisition of Lipman and formulated a restructuring plan. The Company accrued into the purchase price allocation restructuring costs related to a reduction in workforce and future facilities lease obligations. For the fiscal year ended October 31, 2007, the Company accrued and paid restructuring costs of $6.1 million and $5.3 million, respectively. For the fiscal year ended October 31, 2007, the Company accrued and paid restructuring costs of $0.5 million for the North America segment. As of October 31, 2007, the Company had a remaining liability of $0.8 million. For the fiscal year ended October 31, 2008, the Company paid $0.2 million, resulting in a remaining liability of $0.6 million. There was no change in fiscal year 2009.
PayWare Restructuring Plan
In the fourth quarter of fiscal year 2006, the Company completed the acquisition of PayWare, the payment system business of Trintech Group PLC. The Company developed a restructuring plan and accrued $2.9 million of restructuring costs for the International segment related to a workforce reduction and future facilities lease obligations which were included in the purchase price allocation of PayWare. The Company paid $0.4 million in restructuring costs in the fiscal year ended October 31, 2006. During the fiscal year ended October 31, 2007, the Company accrued and paid $1.2 million and $2.8 million in restructuring costs, respectively. As of October 31, 2007, the Company had a liability of $0.9 million which related mainly to facilities costs. During the fiscal year ended October 31, 2008, the Company paid $0.6 million and expensed $0.8 million for facilities, resulting in a remaining liability of $1.0 million as of October 31, 2008. During the fiscal year ended October 31, 2009, the Company paid $0.4 million and reversed $0.2 million for facilities in the corporate segment, resulting in a remaining liability of $0.4 million.
124
Table of Contents
VERIFONE HOLDINGS, INC. AND SUBSIDIARIES
NOTES TO CONSOLIDATED FINANCIAL STATEMENTS—(Continued)
Note 14. Related-Party Transactions
For the years ended October 31, 2009, 2008, and 2007 the Company recorded $12.2 million, $11.2 million, and $11.9 million, respectively, of sales to certain companies of which members of the Company’s Board of Directors also serve on the boards of each such company. As of October 31, 2009 and 2008, the Company has outstanding accounts receivable balance of $1.3 million and $2.4 million, respectively, related to the above sales.
Note 15. Segment and Geographic Information
The Company is primarily structured in a geographic manner. The Company’s Chief Executive Officer is identified as the Chief Operating Decision Maker (“CODM”) as defined by ASC 280 (formerly SFAS No. 131, Disclosures About Segments of an Enterprise and Related Information). The CODM reviews consolidated financial information on revenues and gross profit percentage for System Solutions and Services. The CODM also reviews operating expenses, certain of which are allocated to the Company’s two segments described below.
Segment Information
The Company operates in two business segments: North America and International. The Company defines North America as the United States and Canada, and International as the other countries from which it derives revenues. Total assets and goodwill by segment are based on the location of the assets.
Net revenues and operating income (loss) of each business segment reflect net revenues generated within the segment, supply chain standard inventory cost of System Solutions net revenues, actual cost of Services net revenues, and expenses that directly benefit only that segment, including distribution center costs, royalty and warranty expense. Corporate net revenues and operating income (loss) reflect non-cash acquisition charges, including amortization of purchased core and developed technology assets, step-down in deferred revenue, impairment and other Corporate charges, including inventory obsolescence and scrap at corporate distribution centers, rework, specific warranty provisions, non-standard freight and over-and-under absorption of materials management overhead.
In fiscal year 2009, the Company revised the methodology for business segment operating income (loss) reporting. Local inventory obsolescence and scrap costs previously recorded in the International and North America segments were reclassified to the Corporate segment. The following table sets forth net revenues and operating income (loss), as revised, for the Company’s segments (in thousands):
| Years Ended October 31, | ||||||||||||
| 2009 | 2008 | 2007 | ||||||||||
| Net revenues: |
||||||||||||
| North America |
$ | 343,446 | $ | 359,136 | $ | 400,433 | ||||||
| International |
501,670 | 564,459 | 506,195 | |||||||||
| Corporate |
(402 | ) | (1,664 | ) | (3,736 | ) | ||||||
| Total net revenues |
$ | 844,714 | $ | 921,931 | $ | 902,892 | ||||||
| Operating income (loss): |
Revised | Revised | ||||||||||
| North America |
$ | 116,968 | $ | 118,516 | $ | 147,254 | ||||||
| International |
116,882 | 110,082 | 123,533 | |||||||||
| Corporate |
(362,816 | ) | (544,423 | ) | (242,307 | ) | ||||||
| Total operating income (loss) |
$ | (128,966 | ) | $ | (315,825 | ) | $ | 28,480 | ||||
125
Table of Contents
VERIFONE HOLDINGS, INC. AND SUBSIDIARIES
NOTES TO CONSOLIDATED FINANCIAL STATEMENTS—(Continued)
The Company’s goodwill by segment was as follows (in thousands):
| October 31, | ||||||
| 2009 | 2008 | |||||
| International |
$ | 147,363 | $ | 252,869 | ||
| North America |
3,482 | 69,034 | ||||
| $ | 150,845 | $ | 321,903 | |||
The Company’s total assets by segment were as follows (in thousands):
| October 31, | ||||||
| 2009 | 2008 | |||||
| International |
$ | 611,260 | $ | 735,991 | ||
| North America |
307,650 | 343,761 | ||||
| $ | 918,910 | $ | 1,079,752 | |||
The Company’s depreciation and amortization expense of property, plant and equipment and other assets by segment was as follows (in thousands):
| Years Ended October 31, | |||||||||
| 2009 | 2008 | 2007 | |||||||
| International |
$ | 9,368 | $ | 6,352 | $ | 4,738 | |||
| North America |
7,757 | 7,024 | 3,028 | ||||||
| $ | 17,125 | $ | 13,376 | $ | 7,766 | ||||
Geographic Information
The Company’s revenues by geographic area were as follows (in thousands):
| Years Ended October 31, | |||||||||
| 2009 | 2008 | 2007 | |||||||
| United States |
$ | 307,803 | $ | 321,247 | $ | 355,222 | |||
| Canada |
35,239 | 36,225 | 41,475 | ||||||
| Europe |
265,548 | 292,038 | 281,628 | ||||||
| Latin America |
150,071 | 198,443 | 160,867 | ||||||
| Asia |
86,053 | 73,978 | 63,700 | ||||||
| $ | 844,714 | $ | 921,931 | $ | 902,892 | ||||
Revenues are allocated to the geographic areas based on the shipping destination of customer orders. Corporate revenues are included in the United States geographic area.
126
Table of Contents
VERIFONE HOLDINGS, INC. AND SUBSIDIARIES
NOTES TO CONSOLIDATED FINANCIAL STATEMENTS—(Continued)
The Company’s long-lived assets, which consist primarily of property, plant and equipment, exclusive of intercompany accounts, were as follows (in thousands):
| October 31, | ||||||
| 2009 | 2008 | |||||
| North America |
$ | 28,572 | $ | 29,182 | ||
| Europe |
20,050 | 22,808 | ||||
| Asia |
3,588 | 3,093 | ||||
| Latin America |
2,632 | 2,184 | ||||
| $ | 54,842 | $ | 57,267 | |||
127
Table of Contents
| ITEM 9. | CHANGES IN AND DISAGREEMENTS WITH ACCOUNTANTS ON ACCOUNTING AND FINANCIAL DISCLOSURE. |
There were no changes in or disagreements with accountants on accounting and financial disclosure during the last three fiscal years.
| ITEM 9A. | CONTROLS AND PROCEDURES |
Evaluation of Disclosure Controls and Procedures
VeriFone maintains disclosure controls and procedures (as defined in Rule 13a-15(e) under the Securities Exchange Act of 1934, as amended (the “Exchange Act”)), that are designed to ensure that information required to be disclosed in the reports that we file or submit under the Exchange Act is recorded, processed, summarized, and reported within the time periods specified in Securities and Exchange Commission rules and forms, and that such information is accumulated and communicated to our management, including our Chief Executive Officer and Chief Financial Officer, as appropriate, to allow timely decisions regarding required disclosure.
Our management is responsible for establishing and maintaining our disclosure controls and procedures. Our Chief Executive Officer and Chief Financial Officer participated with our management in evaluating the effectiveness of our disclosure controls and procedures as of October 31, 2009.
Based on our management’s evaluation (with the participation of our Chief Executive Officer and Chief Financial Officer), our Chief Executive Officer and Chief Financial Officer have concluded that, as of October 31, 2009, in light of the material weakness described below, our disclosure controls and procedures were not effective to provide reasonable assurance that the information required to be disclosed by us in the reports we file or submit under the Exchange Act is recorded, processed, summarized, and reported within the time periods specified in the SEC’s rules and forms, and that such information is accumulated and communicated to our management, including our Chief Executive Officer and Chief Financial Officer, as appropriate to allow timely decisions regarding required disclosure.
Notwithstanding the material weakness described below, we have performed additional analyses and other procedures to enable management to conclude that our consolidated financial statements included in this report were prepared in accordance with accounting principles generally accepted in the United States of America (“US GAAP”). Based in part on these additional efforts, our Chief Executive Officer and Chief Financial Officer have included their certifications as exhibits to this Annual Report on Form 10-K.
Management’s Report on Internal Control over Financial Reporting
Our management is responsible for establishing and maintaining adequate internal control over financial reporting, as such term is defined in Exchange Act Rules 13a-15(f) and 15d-15(f), to provide reasonable assurance regarding the reliability of our financial reporting and the preparation of financial statements for external purposes in accordance with US GAAP. Under the supervision and with the participation of our management, including our Chief Executive Officer and Chief Financial Officer, we conducted an evaluation of the design and operational effectiveness of our internal control over financial reporting as of October 31, 2009 based on the framework in Internal Control — Integrated Framework issued by the Committee of Sponsoring Organizations of the Treadway Commission (“COSO”).
Our management, including our Chief Executive Officer and Chief Financial Officer, does not expect our disclosure controls or our internal control over financial reporting will prevent or detect all errors or all fraud. A control system, no matter how well designed and operated, can provide only reasonable, not absolute, assurance that the control system’s objectives will be met. The design of a control system must reflect the fact that there are resource constraints, and the benefits of controls must be considered relative to their costs. Further, because of the inherent limitations in all control systems, no evaluation of controls can provide absolute assurance that
128
Table of Contents
misstatements due to error or fraud will not occur or that all control issues and instances of fraud, if any, within the company have been detected. These inherent limitations include the realities that judgments in decision-making can be faulty and that breakdowns can occur because of simple error or mistake. Controls can also be circumvented by the individual acts of some persons, by collusion of two or more people, or by management override of the controls. The design of any system of controls is based in part on certain assumptions about the likelihood of future events, and there can be no assurance that any design will succeed in achieving its stated goals under all potential future conditions. Projections of any evaluation of controls effectiveness to future periods are subject to risks. Over time, controls may become inadequate because of changes in conditions or deterioration in the degree of compliance with policies or procedures.
A material weakness is a control deficiency, or combination of control deficiencies, in internal control over financial reporting such that there is a reasonable possibility that a material misstatement of the annual or interim financial statements will not be prevented or detected on a timely basis. Management’s assessment identified transaction-level material weakness in the design and operating effectiveness of controls related to income taxes as of October 31, 2009.
Specifically, our processes and procedures were not designed to provide for adequate and timely identification, documentation and review of various income tax calculations, reconciliations and related supporting documentation required to apply our accounting policy for income taxes in accordance with U.S. GAAP. This material weakness impacted our ability to timely report financial information related to income tax accounts and resulted in adjustments to income tax expense, deferred tax assets and liabilities, and goodwill accounts during the fiscal year ended October 31, 2009.
As a result of the identified material weakness, our management concluded that, as of October 31, 2009, our internal control over financial reporting was not effective. The effectiveness of our internal control over financial reporting as of October 31, 2009 was audited by Ernst & Young LLP, our independent registered public accounting firm as stated in their report, which report is included in Item 8 of this Annual Report on Form 10-K.
Management’s Remediation Initiatives
During fiscal 2009 we developed a plan to remediate the transaction-level material weakness in the design and operating effectiveness of controls related to income taxes. We have also taken actions to implement our remediation plan. Actions taken during fiscal 2009 and our future plans for remediation include the following:
| • | Actions we have taken during the first three quarters of fiscal 2009: |
| • | Hired dedicated in-house professional tax staff that will focus entirely on tax matters. We engaged a Vice President of Tax in October 2008, who was subsequently hired, and in June 2009, we hired a tax director and a tax manager, both with substantial and relevant experience. |
| • | Developed and implemented uniform internal policies and procedures to assure timely receipt of international data and the proper recording of tax entries to allow more robust review and analysis. |
| • | Implemented procedures to analyze tax accounts on a quarterly basis locally and at the corporate level including, for example, review and analysis of tax payments, refunds and accruals. |
| • | Provided ongoing training for our regional accounting personnel to strengthen their understanding of U.S. GAAP and the Company’s tax accounting policies and procedures. |
| • | Actions taken during the fourth quarter of fiscal 2009: |
| • | Developed an enhanced tax provision model to capture, summarize and consolidate tax provision data to facilitate the preparation of our quarterly and annual income tax provision. |
| • | Continued ongoing training of our regional accounting personnel. |
129
Table of Contents
| • | Actions we will take in the future include the following: |
| • | Continue to evaluate our staffing needs for dedicated in-house professional tax staff both at our corporate headquarters and internal locations to ensure we have adequate staffing. |
| • | Establish additional procedures to regularly review, re-assess and document tax positions taken in prior periods to ensure that changes in facts and circumstances that impact the tax accounts are identified and reflected in the tax accounts on a timely basis. |
| • | We have developed uniform internal policies and procedures and will continue to refine our procedures to assure timely receipt of international data and the proper recording of tax entries to allow more robust review and analysis. |
| • | Enhance our ERP systems so that information can be provided more quickly and in a uniform manner to facilitate a more effective and efficient tax provision process that will enable a more timely preparation and review of the tax accounts each period. |
| • | Continue to provide ongoing training for our regional accounting personnel. |
We believe we will complete the required remedial actions for the material weakness in fiscal year 2010. The material costs associated with the above remedial actions include ongoing compensation expenses for the expanded tax department and engagement fees for third party tax consulting firms to assist with the design and implementation and testing of the new processes and controls.
| ITEM 9B. | OTHER INFORMATION |
We have no information to report pursuant to Item 9B.
| ITEM 10. | DIRECTORS, EXECUTIVE OFFICERS OF THE REGISTRANT AND CORPORATE GOVERNANCE |
In addition to the information set forth under the caption “Executive Officers” in Part I of this Form 10-K, the information required by this Item is expected to be in our definitive Proxy Statement for the 2010 Annual Meeting of Stockholders (the “Proxy Statement”), which we expect to be filed within 120 days of the end of our fiscal year ended October 31, 2009 and is incorporated herein by reference.
Code of Business Conduct and Ethics
We have adopted a Code of Business Conduct and Ethics, which can be found in the Investor Relations section of our website, http://ir.verifone.com/, and is available in print to any stockholder who requests it. The Code of Business Conduct and Ethics applies to all of VeriFone’s employees, officers and directors. We will post any amendments to or waivers from a provision of our Code of Business Conduct and Ethics that applies to our principal executive officer, principal financial officer, principal accounting officer or controller or persons performing similar functions and that relates to any element of the “code of ethics” definition set forth in Item 406(b) of Regulation S-K of the SEC at http://ir.verifone.com/.
| ITEM 11. | EXECUTIVE COMPENSATION |
Information relating to our executive officer and director compensation is incorporated herein by reference in the Proxy Statement.
130
Table of Contents
| ITEM 12. | SECURITY OWNERSHIP OF CERTAIN BENEFICIAL OWNERS AND MANAGEMENT AND RELATED STOCKHOLDER MATTERS |
Information relating to security ownership of certain beneficial owners of our common stock and information relating to the security ownership of the registrant’s management is incorporated herein by reference to the Proxy Statement.
| ITEM 13. | CERTAIN RELATIONSHIPS AND RELATED TRANSACTIONS, AND DIRECTOR INDEPENDENCE |
Information relating to certain relationships and related transactions and director independence is incorporated herein by reference to the Proxy Statement.
| ITEM 14. | PRINCIPAL ACCOUNTANT FEES AND SERVICES |
Information regarding principal accountant fees and services is incorporated herein by reference in the Proxy Statement.
| ITEM 15. | EXHIBITS, FINANCIAL STATEMENT SCHEDULES |
(a) The following documents are filed as part of this Annual Report on Form 10-K:
1. Consolidated Financial Statements
The consolidated financial statements required to be filed in the Annual Report on Form 10-K are listed in Item 8 hereof. Other supplemental financial information required by Item 302 of Regulation S-K is contained in Item 7 hereof under “Selected Quarterly Results of Operations”.
2. Exhibits
The documents set forth below are filed herewith or incorporated by reference to the location indicated.
| Exhibit Number |
Description | |
| 3.1(4) | Form of Amended and Restated Certificate of Incorporation of the Registrant | |
| 3.2(19) | Amendment of Amended and Restated Certificate of Incorporation of the Registrant | |
| 3.2(5) | Form of Amended and Restated Bylaws of the Registrant | |
| 3.3(14) | Amendment No. 1 to the Bylaws of VeriFone Holdings, Inc. | |
| 4.1(3) | Specimen Common Stock Certificate | |
| 4.2(2) | Stockholders Agreement, dated as of July 1, 2002, by and among VeriFone Holdings, Inc., GTCR Fund VII, L.P., GTCR Co-Invest, L.P., GTCR Capital Partners, L.P., TCW/Crescent Mezzanine Partners III, L.P., TCW/Crescent Mezzanine Trust III, TCW/Crescent Mezzanine Partners III Netherlands, L.P. and TCW Leveraged Income Trust IV, L.P., VF Holding Corp. and the executives who are parties thereto | |
| 4.2.1(4) | Form of Amendment to Stockholders Agreement | |
131
Table of Contents
| Exhibit Number |
Description | |
| 4.3(1) | Registration Rights Agreement, dated as of July 1, 2002, by and among VeriFone Holdings, Inc., GTCR Fund VII, L.P., GTCR Co-Invest, L.P., GTCR Capital Partners, L.P., TCW/Crescent Mezzanine Partners III, L.P., TCW/Crescent Mezzanine Trust III, TCW/Crescent Mezzanine Partners III Netherlands, L.P., and TCW Leveraged Income Trust IV, L.P., VF Holding Corp., Jesse Adams, William Atkinson, Douglas G. Bergeron, Nigel Bidmead, Denis Calvert, Donald Campion, Robert Cook, Gary Grant, Robert Lopez, James Sheehan, David Turnbull and Elmore Waller | |
| 4.4(1) | Amendment to Registration Rights Agreement, dated as of November 30, 2004, by and among VeriFone Holdings, Inc., GTCR Fund VII, L.P., Douglas Bergeron, DGB Investments, Inc., The Douglas G. Bergeron Family Annuity Trust, The Sandra E. Bergeron Family Annuity Trust and The Bergeron Family Trust | |
| 4.5(11) | Indenture related to the 1.375% Senior Convertible Notes due 2012, dated as of June 22, 2007, between VeriFone Holdings, Inc. and U.S. Bank National Association, as trustee | |
| 4.6(11) | Registration Rights Agreement, dated as of June 22, 2007, between VeriFone Holdings, Inc. and Lehman Brothers Inc. and J.P. Morgan Securities Inc. | |
| 10.1(2) | Purchase Agreement, dated as of July 1, 2002, by and among VeriFone Holdings, Inc., GTCR Fund VII, L.P., GTCR Co-Invest, L.P., TCW/Crescent Mezzanine Partners III, L.P., TCW/Crescent Mezzanine Trust III, TCW/Crescent Mezzanine Partners III Netherlands, L.P. and TCW Leveraged Income Trust IV, L.P. | |
| 10.1.1(4) | Form of Amendment No. 1 to Purchase Agreement | |
| 10.2(1)+ | Senior Management Agreement, dated as of July 1, 2002, among VeriFone Holdings, Inc., VeriFone, Inc. and Douglas G. Bergeron | |
| 10.2.1(2)+ | Amendment to Senior Management Agreement, dated as of June 29, 2004, by and among VeriFone Holdings, Inc., VeriFone, Inc. and Douglas G. Bergeron | |
| 10.3(1)+ | Amendment to Senior Management Agreement, dated as of December 27, 2004, by and among VeriFone Holdings, Inc., VeriFone, Inc. and Douglas Bergeron | |
| 10.4(1)+ | 2002 Securities Purchase Plan | |
| 10.5(1)+ | New Founders’ Stock Option Plan | |
| 10.6(3)+ | Outside Directors’ Stock Option Plan | |
| 10.7(1) | Patent License Agreement, effective as of November 1, 2004, by and between NCR Corporation and VeriFone, Inc. | |
| 10.8(6)+ | 2005 Employee Equity Incentive Plan | |
| 10.9(5)+ | Form of Indemnification Agreement | |
| 10.10(18)+ | Amended and Restated VeriFone Holdings, Inc. 2006 Equity Incentive Plan | |
| 10.11(7)+ | VeriFone Holdings, Inc. Bonus Plan | |
| 10.12(8) | Credit Agreement, dated October 31, 2006, among VeriFone Intermediate Holdings, Inc., VeriFone, Inc., various financial institutions and other persons from time to time parties thereto, as lenders, JPMorgan Chase Bank, N.A., as the administrative agent for the lenders, Lehman Commercial Paper Inc., as the syndication agent for the lenders, Bank Leumi USA and Wells Fargo Bank, N.A., as the co-documentation agents for the lenders, and J.P. Morgan Securities Inc. and Lehman Brothers Inc., as joint lead arrangers and joint book running managers | |
| 10.13(9)+ | Lipman Electronic Engineering Ltd. 2003 Stock Option Plan | |
132
Table of Contents
| Exhibit Number |
Description | |
| 10.14(9)+ | Lipman Electronic Engineering Ltd. 2004 Stock Option Plan | |
| 10.15(9)+ | Lipman Electronic Engineering Ltd. 2004 Share Option Plan | |
| 10.16(9)+ | Amendment to Lipman Electronic Engineering Ltd. 2004 Share Option Plan | |
| 10.17(9)+ | Lipman Electronic Engineering Ltd. 2006 Share Incentive Plan | |
| 10.18(10)+ | Amended and Restated Employment Agreement, dated January 4, 2007, among VeriFone Holdings, Inc., VeriFone, Inc., and Douglas G. Bergeron | |
| 10.19(11) | Confirmation of Convertible Note Hedge Transaction, dated June 18, 2007, by and between VeriFone Holdings, Inc. and Lehman Brothers OTC Derivatives Inc. | |
| 10.20(11) | Confirmation of Convertible Note Hedge Transaction, dated June 18, 2007, by and between VeriFone Holdings, Inc. and JPMorgan Chase Bank, National Association, London Branch | |
| 10.21(11) | Confirmation of Warrant Transaction, dated June 18, 2007, by and between VeriFone Holdings, Inc. and Lehman Brothers OTC Derivatives Inc. | |
| 10.22(11) | Confirmation of Warrant Transaction, dated June 18, 2007, by and between VeriFone Holdings, Inc. and JPMorgan Chase Bank, National Association, London Branch | |
| 10.23(11) | Amendment to Confirmation of Warrant Transaction, dated June 21, 2007, by and between VeriFone Holdings, Inc. and Lehman Brothers OTC Derivatives Inc. | |
| 10.24(11) | Amendment to Confirmation of Warrant Transaction, dated June 21, 2007, by and between VeriFone Holdings, Inc. and JPMorgan Chase Bank, National Association, London Branch | |
| 10.25(12)+ | Confidential Separation Agreement, dated August 2, 2007, between VeriFone Holdings, Inc. and William G. Atkinson | |
| 10.26(13)+ | First Amendment and Waiver to Credit Agreement, dated as of January 25, 2008. | |
| 10.27(15) | Second Amendment to Credit Agreement, dated as of April 28, 2008. | |
| 10.28(16) | Third Amendment to Credit Agreement, dated as of July 31, 2008. | |
| 10.29(17)+ | Offer Letter between VeriFone Holdings, Inc. and Robert Dykes. | |
| 10.30(17)+ | Severance Agreement, dated September 2, 2008, between VeriFone Holdings, Inc. and Robert Dykes. | |
| 10.31(20)+ | Amended and Restated Employment Agreement, Dated as of April 8, 2009, among VeriFone Holdings, Inc., VeriFone, Inc. and Douglas G. Bergeron | |
| 21.1* | List of subsidiaries of the Registrant | |
| 23.1* | Consent of Independent Registered Public Accounting Firm | |
| 31.1* | Certification of the Chief Executive Officer, as required by Section 302 of the Sarbanes-Oxley Act of 2002. | |
| 31.2* | Certification of the Chief Financial Officer, as required by Section 302 of the Sarbanes-Oxley Act of 2002. | |
| 32.1* | Certification of the Chief Executive Officer and the Chief Financial Officer as required by Section 906 of the Sarbanes-Oxley Act of 2002. | |
| * | Filed herewith. |
| + | Indicates a management contract or compensatory plan or arrangement. |
| (1) | Filed as an exhibit to Amendment No. 1 to the Registrant’s Registration Statement on Form S-1 (File No. 333-121947), filed February 23, 2005. |
133
Table of Contents
| (2) | Filed as an exhibit to Amendment No. 2 to the Registrant’s Registration Statement on Form S-1 (File No. 333-121947), filed March 28, 2005. |
| (3) | Filed as an exhibit to Amendment No. 3 to the Registrant’s Registration Statement on Form S-1 (File No. 333-121947), filed April 18, 2005. |
| (4) | Filed as an exhibit to Amendment No. 4 to the Registrant’s Registration Statement on Form S-1 (File No. 333-121947), filed April 21, 2005. |
| (5) | Filed as an exhibit to Amendment No. 5 to the Registrant’s Registration Statement on Form S-1 (File No. 333-121947), filed April 29, 2005. |
| (6) | Filed as an exhibit to the Registrant’s Registration Statement on Form S-8 (File No. 333-124545), filed May 2, 2005. |
| (7) | Incorporated by reference in the Registrant’s Current Report on Form 8-K, filed March 23, 2006. |
| (8) | Filed as an exhibit to the Registrant’s Current Report on Form 8-K, filed November 1, 2006. |
| (9) | Incorporated by reference in the Registrant’s Registration Statement on Form S-8 (File No. 333-138533), filed November 9, 2006. |
| (10) | Filed as an exhibit to the Registrant’s Current Report on Form 8-K, filed January 5, 2007. |
| (11) | Filed as an exhibit to the Registrant’s Current Report on Form 8-K, filed June 22, 2007. |
| (12) | Filed as an exhibit to the Registrant’s Current Report on Form 8-K, filed August 3, 2007. |
| (13) | Filed as an exhibit to the Registrant’s Current Report on Form 8-K, filed January 28, 2008. |
| (14) | Filed as an exhibit to the Registrant’s Current Report on Form 8-K, filed March 31, 2008. |
| (15) | Filed as an exhibit to the Registrant’s Current Report on Form 8-K, filed April 29, 2008. |
| (16) | Filed as an exhibit to the Registrant’s Current Report on Form 8-K, filed July 31, 2008. |
| (17) | Filed as an exhibit to the Registrant’s Current Report on Form 8-K, filed September 3, 2008. |
| (18) | Filed as an annex to the Registrant’s Definitive Proxy Statement for its 2008 Annual Meeting of Stockholders, filed September 10, 2008. |
| (19) | Filed as an exhibit to the Registrant’s Current Report on Form 8-K, filed October 9, 2008. |
| (20) | Filed as an exhibit to the Registrant’s Current Report on Form 8-K, filed April 9, 2009. |
134
Table of Contents
SIGNATURES
Pursuant to the requirements of Section 13 or 15(d) of the Securities Exchange Act of 1934, the registrant has duly caused this report on Annual Report on Form 10-K to be signed on its behalf by the undersigned, thereunto duly authorized.
| VERIFONE HOLDINGS, INC. | ||
| By: | /s/ DOUGLAS G. BERGERON | |
| Douglas G. Bergeron, | ||
| Chief Executive Officer | ||
December 22, 2009
Pursuant to the requirements of the Securities Exchange Act of 1934, this report on Annual Report on Form 10-K has been signed below by the following persons on behalf of the registrant and in the capacities and on the dates indicated:
| Signature |
Title |
Date | ||
| /s/ DOUGLAS G. BERGERON Douglas G. Bergeron |
Chief Executive Officer (principal executive officer) |
December 22, 2009 | ||
| /s/ ROBERT DYKES Robert Dykes |
Senior Vice President and Chief Financial Officer (principal financial and accounting officer) |
December 22, 2009 | ||
| /s/ ROBERT W. ALSPAUGH Robert W. Alspaugh |
Director |
December 22, 2009 | ||
| /s/ LESLIE G. DENEND Leslie G. Denend |
Director |
December 22, 2009 | ||
| /s/ ALEX W. HART Alex W. Hart |
Director |
December 22, 2009 | ||
| /s/ ROBERT B. HENSKE Robert B. Henske |
Director |
December 22, 2009 | ||
| /s/ RICHARD MCGINN Richard McGinn |
Director |
December 22, 2009 | ||
| /s/ EITAN RAFF Eitan Raff |
Director |
December 22, 2009 | ||
| /s/ COLLIN E. ROCHE Collin E. Roche |
Director |
December 22, 2009 | ||
| /s/ JEFFREY E. STIEFLER Jeffrey E. Stiefler |
Director |
December 22, 2009 | ||
| /s/ CHARLES R. RINEHART Charles R. Rinehart |
Chairman of the Board of Directors |
December 22, 2009 | ||
135