Attached files
| file | filename |
|---|---|
| 8-K - FORM 8-K - Delek US Holdings, Inc. | c22145e8vk.htm |
Exhibit 99.1

| Investor Presentation September 2011 |

| Safe Harbor Provision 2 Delek US Holdings is traded on the New York Stock Exchange in the United States under the symbol "DK" and, as such, is governed by the rules and regulations of the United States Securities and Exchange Commission. This presentation may contain forward-looking statements that are based upon current expectations and involve a number of risks and uncertainties. Statements concerning our current estimates, expectations and projections about our future results, performance, prospects and opportunities and other statements, concerns, or matters that are not historical facts are "forward-looking statements," as that term is defined under United States securities laws. Investors are cautioned that the following important factors, among others, may affect these forward-looking statements. These factors include but are not limited to: management's ability to execute its strategy of growth through acquisitions and transactional risks in acquisitions; our competitive position and the effects of competition; the projected growth of the industry in which we operate; changes in the scope, costs, and/or timing of capital projects; losses from derivative instruments; general economic and business conditions, particularly levels of spending relating to travel and tourism or conditions affecting the southeastern United States; risks and uncertainties with the respect to the quantities and costs of crude oil, the costs to acquire feedstocks and the price of the refined petroleum products we ultimately sell; potential conflicts of interest between our majority stockholder and other stockholders; and other risks contained in our filings with the Securities and Exchange Commission. Forward-looking statements should not be read as a guarantee of future performance or results and will not be accurate indications of the times at, or by which such performance or results will be achieved. Forward-looking information is based on information available at the time and/or management's good faith belief with respect to future events, and is subject to risks and uncertainties that could cause actual performance or results to differ materially from those expressed in the statements. Delek US undertakes no obligation to update or revise any such forward-looking statements. |

| Integrated Downstream Energy Company(1) Breadth of Exposure Across Refining, Wholesale Marketing and Retail Distribution Operates 140,000 BPD of refined production capacity in Texas and Arkansas Refining Segment ) Owned product terminals and pipeline assets in Texas, Arkansas and Tennessee Marketing Segment 390 convenience stores -- primarily in Tennessee, Alabama and Georgia Retail Segment 3 60,000 BPD9.4 complexity (1) As of June 30, 2011 Tyler Refinery 80,000 BPD9.0 complexity El Dorado Refinery Strategically Located Refineries Allow For Broad Wholesale and Retail Product Distribution Opportunities Own more than 600,000 barrels of crude storage (tank farm) capacity in Longview, Texas |

| Strong Financial Performance During 2011 4 Significant Growth In Contribution Margin(1) Increased Cash Generation Benefits Liquidity(2) (CHART) Segment contribution margin = net sales less cost of sales and operating expenses, excluding depreciation and amortization. Periods are for the six months ended June 30.Due to a disruption in the supply of crude oil to the El Dorado refinery during the second quarter 2011, the Company carried approximately $90 million in excess inventory and accounts receivable that otherwise would have been converted to cash prior to quarter-end. $56.1 mm $108.8 mm $79.7 mm $201.7 mm (CHART) $15.3mm $68.4 mm $49.1 mm $148.2 mm ~$90 mm |
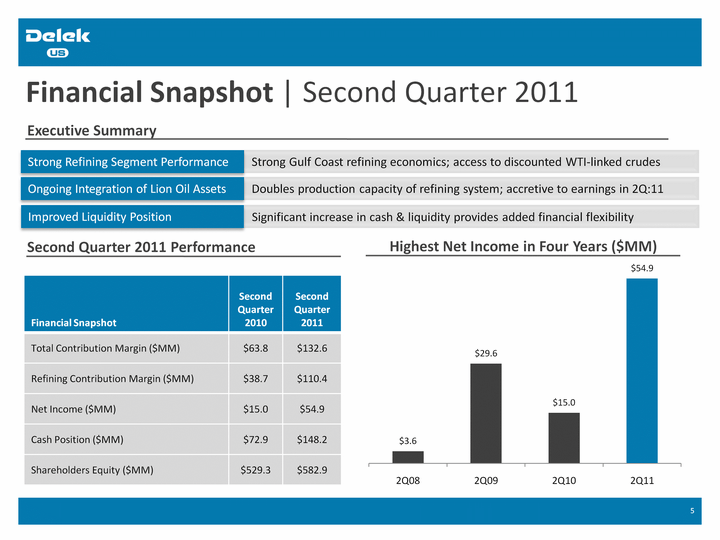
| Financial Snapshot | Second Quarter 2011 5 Financial Snapshot Second Quarter 2010 Second Quarter 2011 Total Contribution Margin ($MM) $63.8 $132.6 Refining Contribution Margin ($MM) $38.7 $110.4 Net Income ($MM) $15.0 $54.9 Cash Position ($MM) $72.9 $148.2 Shareholders Equity ($MM) $529.3 $582.9 (CHART) Second Quarter 2011 Performance Highest Net Income in Four Years ($MM) Strong Gulf Coast refining economics; access to discounted WTI-linked crudes Strong Refining Segment Performance Doubles production capacity of refining system; accretive to earnings in 2Q:11 Ongoing Integration of Lion Oil Assets Significant increase in cash & liquidity provides added financial flexibility Improved Liquidity Position Executive Summary |

| Lion Oil Transaction Executive Summary |

| Transaction Summary Asset Overview Purchase Summary 80,000 BPD refinery in El Dorado, Arkansas80-mile Magnolia-El Dorado crude oil system (Shreveport, LA to Magnolia terminal)28-mile El Dorado crude oil system (Magnolia terminal to El Dorado refinery)Crude oil gathering system with more than 600 miles of operable pipelines3 light product distribution terminals (Memphis and Nashville, TN; El Dorado, AR)Owned asphalt distribution terminal in El Dorado, Arkansas Transaction completed on April 29, 2011Delek US has acquired Ergon's 53.7% equity interest in Lion Oil for a combination of cash, stock and the payment and replacement of all debt owed by Lion to Ergon as follows:$45 million in restricted Delek US Common Stock(1) $50 million cash payment to Ergon$50 million term note executed by Lion Oil payable to Ergon; secured by Delek USLion Oil divested certain non-refining assets to ErgonDelek US has assisted Lion Oil in obtaining third-party financing of working capital 7 Determined by the average closing price of Delek US' common stock as reported on the NYSE for the ten consecutive trading days immediately preceding the closing date on April 29, 2011. In total, 3,292,844 shares of common stock issued to Ergon in conjunction with the purchase agreement. |
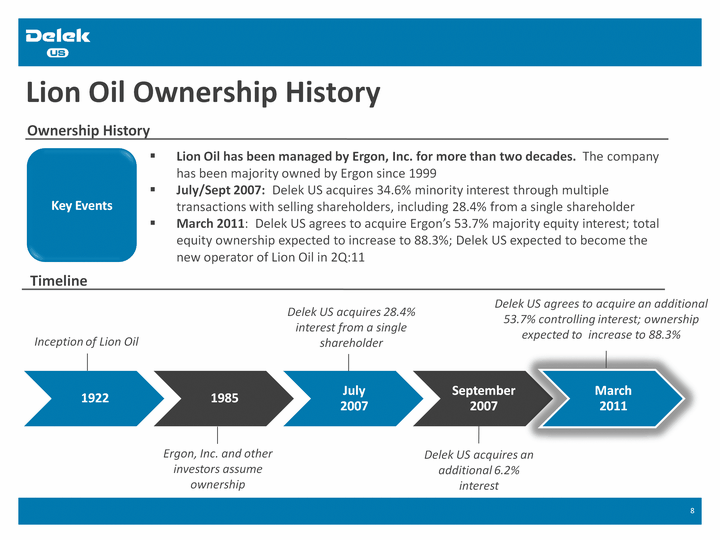
| Lion Oil Ownership History Timeline Inception of Lion Oil Ergon, Inc. and other investors assume ownership Delek US acquires 28.4% interest from a single shareholder Delek US acquires an additional 6.2% interest Delek US agrees to acquire an additional 53.7% controlling interest; ownership expected to increase to 88.3% Ownership History Key Events Lion Oil has been managed by Ergon, Inc. for more than two decades. The company has been majority owned by Ergon since 1999July/Sept 2007: Delek US acquires 34.6% minority interest through multiple transactions with selling shareholders, including 28.4% from a single shareholderMarch 2011: Delek US agrees to acquire Ergon's 53.7% majority equity interest; total equity ownership expected to increase to 88.3%; Delek US expected to become the new operator of Lion Oil in 2Q:11 8 |

| Key Strategic Opportunities 9 Optimize Crude Slate Increased access to wide range of domestic, offshore & foreign crude oilsAdding capability to process medium sour crudesAccess to crudes priced on both a WTI and Brent-basis Enhance Production Capabilities More than doubles production capacity above pre-transaction levelsEntry point into asphalt marketStill heavily weighted toward light, high-value products post-transaction Capture Supply Chain Synergies Supply chain synergies with (MAPCO) retail store networkLion has two light product terminals in Tennessee Expand Wholesale Marketing Expand wholesale marketing business into the Mid-ContinentWholesale distribution strategy designed to optimize margin capture Other Strategic Benefits Eliminate single-asset refiner riskLimited capital requirements over the near-termOverhead cost savings |
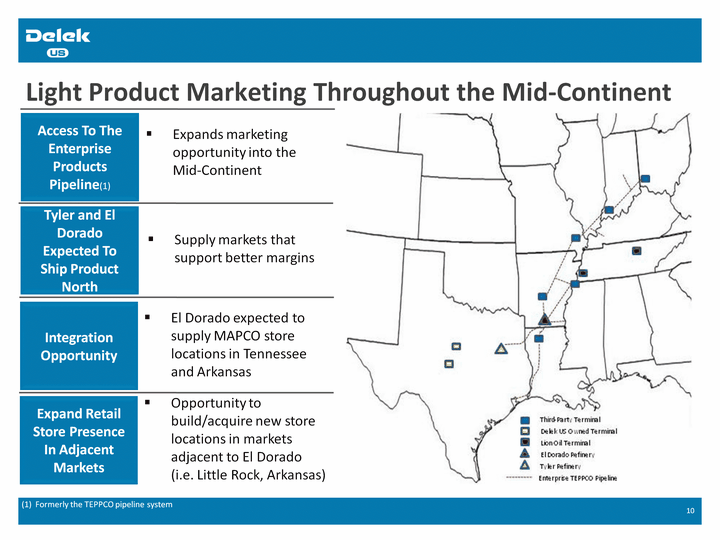
| Light Product Marketing Throughout the Mid-Continent 10 Access To The Enterprise Products Pipeline(1) Integration Opportunity Expands marketing opportunity into the Mid-Continent El Dorado expected to supply MAPCO store locations in Tennessee and Arkansas Tyler and El Dorado Expected To Ship Product North Supply markets that support better margins Expand Retail Store Presence In Adjacent Markets Opportunity to build/acquire new store locations in markets adjacent to El Dorado (i.e. Little Rock, Arkansas) (1) Formerly the TEPPCO pipeline system |
| Refining Segment Operational Update |
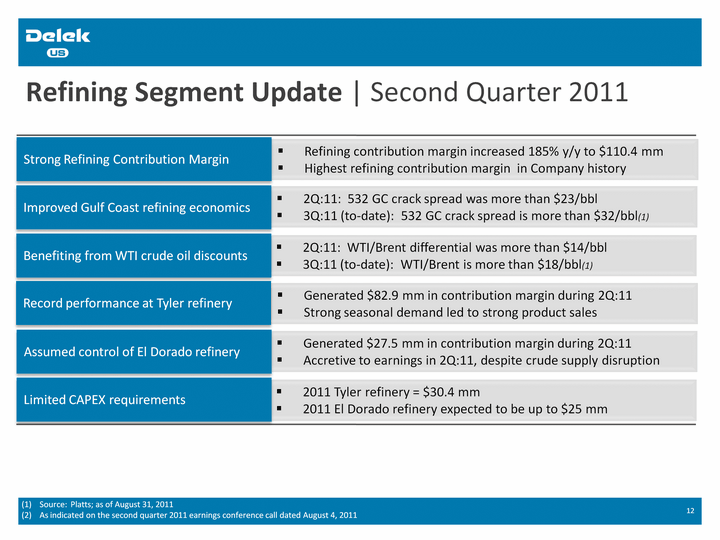
| Refining Segment Update | Second Quarter 2011 2Q:11: 532 GC crack spread was more than $23/bbl3Q:11 (to-date): 532 GC crack spread is more than $32/bbl(1) 12 Improved Gulf Coast refining economics Refining contribution margin increased 185% y/y to $110.4 mmHighest refining contribution margin in Company history Strong Refining Contribution Margin Source: Platts; as of August 31, 2011As indicated on the second quarter 2011 earnings conference call dated August 4, 2011 2Q:11: WTI/Brent differential was more than $14/bbl3Q:11 (to-date): WTI/Brent is more than $18/bbl(1) Benefiting from WTI crude oil discounts Generated $82.9 mm in contribution margin during 2Q:11Strong seasonal demand led to strong product sales Record performance at Tyler refinery Generated $27.5 mm in contribution margin during 2Q:11Accretive to earnings in 2Q:11, despite crude supply disruption Assumed control of El Dorado refinery 2011 Tyler refinery = $30.4 mm2011 El Dorado refinery expected to be up to $25 mm Limited CAPEX requirements |

| Contango Benefits The "Theoretical" Benchmark Building a Theoretical Benchmark High-Sulfur Diesel 5-3-2 Gulf Coast Crack Spread + Contango = Theoretical Margin "Theoretical" Benchmark For Tyler 13 High-Sulfur Diesel 5-3-2 Gulf Coast Crack Spread, Including Contango Benefit* *Source: WTI Backwardation/Contango data is supplied by Argus Media; all crack spread data supplied by Platts (CHART) |

| Refining Benchmark Well Above Historical Levels 14 Crack Spread (per bbl) Reached Multi-Year High During July and August 2011(1) (1) Source: Platts; references the High Sulfur Diesel 532 Gulf Coast Crack Spread More Than $20/bbl Above 4-Yr Trailing Average in July 2011 Nearly $24/bbl Above 4-Yr Trailing Average in August 2011 (CHART) |

| WTI Priced At A Discount To Competing Crudes Current cost to purchase WTI is significantly below competing crudes Substantial widening of crude differentials ) Cheaper crude lowers the cost of production, benefiting refining margin Wider differentials benefit refiners processing WTI 15 WTI Is More Than $16/bbl Cheaper Than LLS Year-To-Date 2011(1) Source: Bloomberg; YTD 2011 is thru August 30, 2011 Refining System Benefits From Discounted WTI-Linked Crudes (CHART) |

| Forward Curve Indicates Wide WTI/Brent Differential 16 Futures Markets Expect the WTI-Brent Differential To Remain Wide Over a Multi-Year Period(1) Source: Bloomberg (as of August 30, 2011) (CHART) Forward Curve Indicates an Average WTI-Brent Differential of More Than $15/bbl between 2012-2014 period |

| Tyler, Texas Refinery Update Overview 60,000 barrels per day located in East Texas Niche, Inland Refiner In PADD III ) 9.4 complexity; equipped with a delayed coking unit High Conversion, Moderate Complexity Primarily local domestic crudes such as WTI and East Texas Crude Processes Mostly Light Sweet Crudes 17 Generally produces more than 90% light products; sold at rack in Tyler market Production Sold Into Local Niche Market Tyler Refinery Second Quarter 2010 Second Quarter 2011 Days Operated in Period 91 91 Capacity Utilization 95.0% 93.4% Total Sales Volumes (bpd) 59,161 60,140 Contribution Margin ($MM) $38.7 $82.9 Refining Margin/bbl(1) $8.96 $21.26 Excludes intercompany marketing fees El Dorado Refinery Update | Second Quarter 2011(1,2) Strong results attributable to a combination of elevated refined product margins and strong regional demandRefining margin more than doubled y/y - four year highKey beneficiary of widening crude differentialsSold more than 60,000 BPD of refined products Maintenance-level capital spending expected in 2011 |
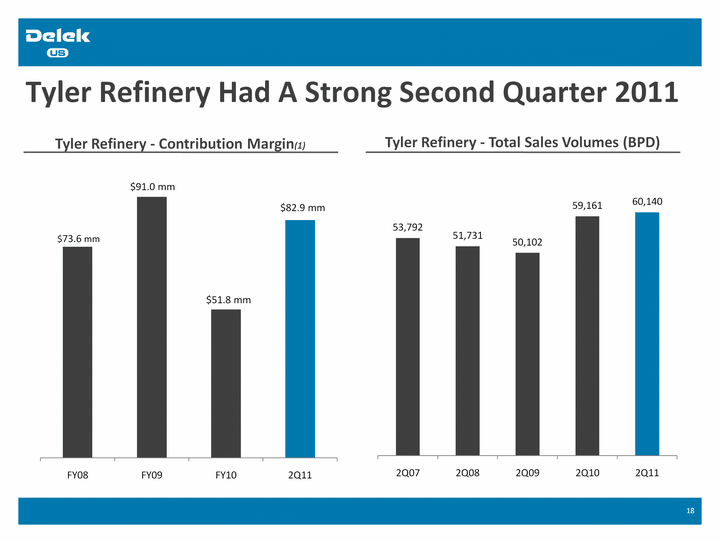
| Tyler Refinery Had A Strong Second Quarter 2011 18 Tyler Refinery - Contribution Margin(1) Tyler Refinery - Total Sales Volumes (BPD) (CHART) $82.9 mm $51.8 mm $91.0 mm $73.6 mm (CHART) |
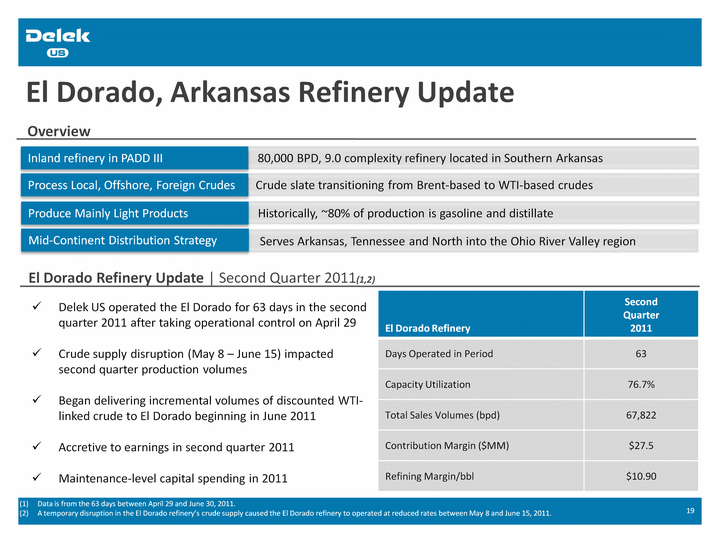
| El Dorado, Arkansas Refinery Update Overview 80,000 BPD, 9.0 complexity refinery located in Southern Arkansas Inland refinery in PADD III ) Crude slate transitioning from Brent-based to WTI-based crudes Process Local, Offshore, Foreign Crudes Historically, ~80% of production is gasoline and distillate Produce Mainly Light Products 19 Serves Arkansas, Tennessee and North into the Ohio River Valley region Mid-Continent Distribution Strategy El Dorado Refinery Update | Second Quarter 2011(1,2) Data is from the 63 days between April 29 and June 30, 2011.A temporary disruption in the El Dorado refinery's crude supply caused the El Dorado refinery to operated at reduced rates between May 8 and June 15, 2011. El Dorado Refinery Second Quarter 2011 Days Operated in Period 63 Capacity Utilization 76.7% Total Sales Volumes (bpd) 67,822 Contribution Margin ($MM) $27.5 Refining Margin/bbl $10.90 Delek US operated the El Dorado for 63 days in the second quarter 2011 after taking operational control on April 29Crude supply disruption (May 8 - June 15) impacted second quarter production volumesBegan delivering incremental volumes of discounted WTI- linked crude to El Dorado beginning in June 2011Accretive to earnings in second quarter 2011Maintenance-level capital spending in 2011 |

| Supplying More Discounted Crude to El Dorado 20 Louisiana Offshore crude oil includes: Eugene Island, Louisiana Light Sweet, Mars, North Louisiana Sweet, Poseidon and Thunder Horse BlendOther crude oils includes: Yoho condensate, Basrah Light and Appalachian Light SweetAs indicated on the second quarter 2011 earnings conference call dated August 4, 2011 (CHART) El Dorado Crude Slate (Prior Owner, CY10) Delivering More WTI-Linked Barrels (BPD)(3) (CHART) 15,000 21,000 25,000 25,000 50,000 Historically processed local Arkansas, domestic offshore and foreign crude oils El Dorado Has A Diverse Crude Slate 15,000 BPD of local Arkansas crudes; generally priced at $8/bbl below WTI Local Arkansas Crude Is WTI-Linked Reconfiguring El Dorado's Crude Slate Toward WTI-linked Crudes LT objective: 35,000 BPD of incremental WTI-linked crude deliveries to El Dorado Evaluating Other Channels of Supply |
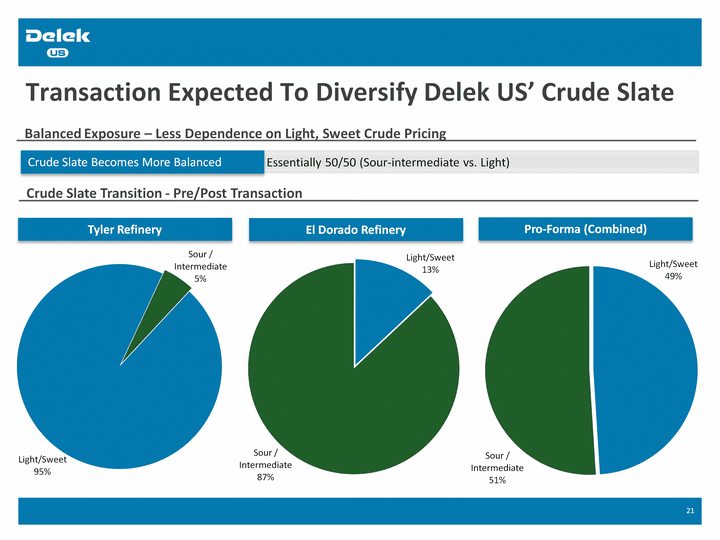
| Transaction Expected To Diversify Delek US' Crude Slate 21 Balanced Exposure - Less Dependence on Light, Sweet Crude Pricing Essentially 50/50 (Sour-intermediate vs. Light) Crude Slate Becomes More Balanced Crude Slate Transition - Pre/Post Transaction Tyler Refinery El Dorado Refinery Pro-Forma (Combined) (CHART) (CHART) (CHART) |

| Retail Segment Operational Update |
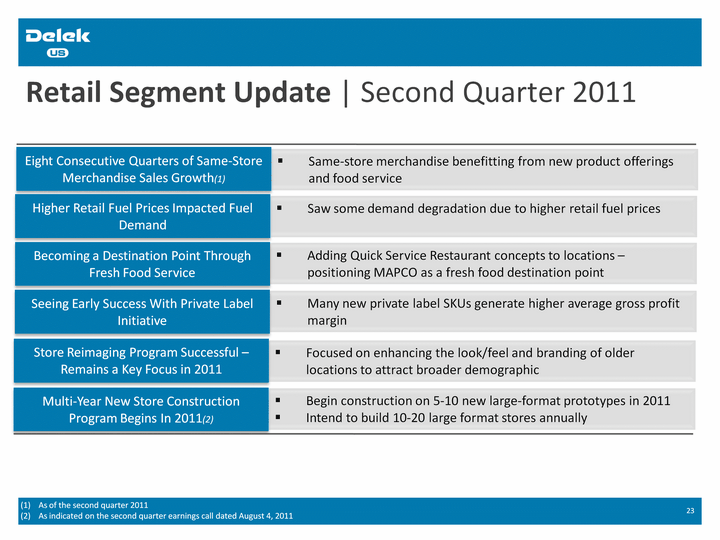
| Retail Segment Update | Second Quarter 2011 Same-store merchandise benefitting from new product offerings and food service 23 Eight Consecutive Quarters of Same-Store Merchandise Sales Growth(1) Saw some demand degradation due to higher retail fuel prices Higher Retail Fuel Prices Impacted Fuel Demand Adding Quick Service Restaurant concepts to locations - positioning MAPCO as a fresh food destination point Becoming a Destination Point Through Fresh Food Service Many new private label SKUs generate higher average gross profit margin Seeing Early Success With Private Label Initiative Focused on enhancing the look/feel and branding of older locations to attract broader demographic Store Reimaging Program Successful - Remains a Key Focus in 2011 Begin construction on 5-10 new large-format prototypes in 2011Intend to build 10-20 large format stores annually Multi-Year New Store Construction Program Begins In 2011(2) As of the second quarter 2011As indicated on the second quarter earnings call dated August 4, 2011 |
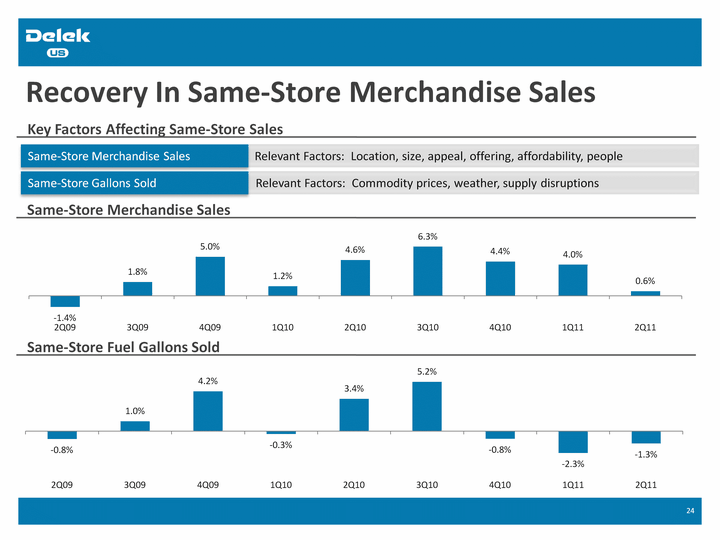
| Recovery In Same-Store Merchandise Sales Key Factors Affecting Same-Store Sales Relevant Factors: Location, size, appeal, offering, affordability, people Same-Store Merchandise Sales ) Relevant Factors: Commodity prices, weather, supply disruptions Same-Store Gallons Sold 24 Same-Store Merchandise Sales Same-Store Fuel Gallons Sold (CHART) (CHART) |

| Private Label Initiative Making Progress Private Label - A Value Offering That Generates Above Average Margins Higher margin, lower-cost option for consumers Quality, Affordable Replacement Option ) Private label is an effective way of offering value to time-starved consumers Countermeasure To Channel Blur 25 Private Label vs. Branded Products(1) Margin does not include rebates and other promotional subsidies from vendorsSame-store sales of private label products as a percentage of total same-store merchandise sales; excludes lottery and services (CHART) Private Label as % of Merchandise Sales(2) (CHART) |

| Store Reimaging & New Construction Initiatives Elevate MAPCO Brand Through Store Remodeling and New Construction More than 40% of store base was reimaged or newly constructed as of 6/30/11 Multi-Year Store Enhancement Initiative ) Constructing 5-10 locations in 2011; LT target of 10-20 new builds per annum(1) Multi-Year New Store Construction Plan 26 Multi-Year Remodeling & Construction Initiative ) Expanding into new markets in the Midwest and Southeastern U.S. Expanding Market Footprint As indicated on the second quarter 2011 earnings call dated August 4, 2011As of June 30, 2011 ) Reimaging at least 25 sites in 2011 Accelerating Store Reimaging Plan (CHART) |

| Favorable Impact From Store Reimaging Strong Economic Case Favoring Store Reimaging Investment Reshaping the retail brand identity to attract a broader demographic Newer, Cleaner Stores Draw Customers ) Atmosphere matters, especially when you are selling food and produce More Conducive To Fresh Offerings 27 Reimaged Store Outperformance Same-Store Fuel Gallons Sold (2Q:11) Same-Store Merchandise Sales (2Q:11) (CHART) (CHART) |

| Marketing Segment Operational Update |

| Marketing Segment | Operational Update Wholesale Marketing In West Texas Owned (San Angelo, Abilene, Tyler); Third-Party (Aledo, Odessa, Big Springs, Frost) Product Marketing Terminals ) Owned and leased pipelines transport crude to Tyler refinery Supply Synergies With Tyler 29 ) Annual CAPEX less than $1 million per year 2006-2010 Minimal CAPEX requirements ) Positive contribution margin every quarter since 2006 Consistent Contribution Margin Total Sales Volumes (BPD) Consistent Contribution Margin ($MM)(1) (CHART) (CHART) (1) Periods are for the six months ended June 30 |

| Appendix Additional Data |
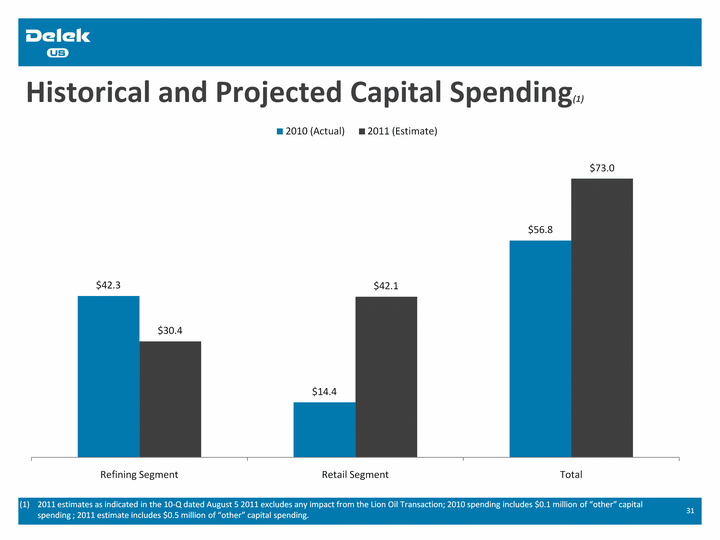
| Historical and Projected Capital Spending(1) 31 2011 estimates as indicated in the 10-Q dated August 5 2011 excludes any impact from the Lion Oil Transaction; 2010 spending includes $0.1 million of "other" capital spending ; 2011 estimate includes $0.5 million of "other" capital spending. (CHART) |

| Major Capital Projects Have Been Completed 32 (1) Refining segment capital spending data for the Tyler refinery as indicated in the form 10-Q filed with the SEC on August 5, 2011*Includes refining segment only; 2009 capital spending includes cost to rebuild saturated gas plant Historical/Projected Capital Spending at Tyler and El Dorado ($MM)(1) (CHART) |

| El Dorado Unit Capacities 33 Unit Description Present Capacity (BPD)(1) (1) Per the Lion Oil transaction announcement conference call held on March 21, 2011. In 2009, Lion Oil estimated that approximately $150 million in capital spending would be required to take advantage of the 100,000 barrel a day crude and vacuum unit capacity |
