Attached files
| file | filename |
|---|---|
| 8-K - FORM 8-K - ASSOCIATED BANC-CORP | c65985e8vk.htm |
Exhibit 99.1

| Investor Presentation Updated: August 25, 2011 |

| Forward-Looking Statements Important Note Regarding Forward-Looking Statements: Statements made in this presentation which are not purely historical are forward-looking statements, as defined in the Private Securities Litigation Reform Act of 1995. This includes any statements regarding management's plans, objectives, or goals for future operations, products or services, and forecasts of its revenues, earnings, or other measures of performance. Forward-looking statements are based on current management expectations and, by their nature, are subject to risks and uncertainties. These statements may be identified by the use of words such as "believe", "expect", "anticipate", "plan", "estimate", "should", "will", "intend", or similar expressions. Outcomes related to such statements are subject to numerous risk factors and uncertainties including those listed in the company's most recent Form10-K and any subsequent Form 10-Q. 1 |

| Associated Banc-Corp About Associated Banc-Corp Addressing Current Challenges Driving Loan Growth and Margin Expansion Strategic Initiative Highlights 2Q 2011 Highlights Summary 2 |

| ASBC Vision Statement Associated Banc-Corp will be the most admired Midwestern financial services company, distinguished by sound, value-added financial solutions with personal service for our customers, built upon a strong commitment to our colleagues and the communities we serve, resulting in exceptional value for our shareholders. 3 |

| Snapshot (as of June 30, 2011) (as of June 30, 2011) (as of June 30, 2011) 4 |

| Associated Bank is known for its strong relationships with the communities it serves, with many bank office roots dating back to the 1880s and 1890s. Market Share Offices Deposits #3 Wisconsin 209 $12.1B #6 Minnesota 26 $ 1.7B #18 Illinois 53 $ 3.2B Source: FDIC 6/30/10 5 MN IL WI Minneapolis St. Louis Chicago Hudson Eau Claire Green Bay Appleton Neenah Madison La Crosse Milwaukee Rockford Peoria Wausau No. 1 Top 4 Top 10 Regional Banking Strong Franchise |

| Associated Markets - Economic Dashboard June 2011 June 2011 June 2011 6 *GDP measured in billions. (CHART) (CHART) (CHART) (CHART) (CHART) (CHART) Unemployment Rates: Bureau of Labor Statistics for June 2011 |

| Major Metro Markets Major Metro Markets 7 1Source: State of Wisconsin Department of Workforce Development for June 2011; Greater Milwaukee Association of Realtors, Aug 2011; 2Gross State Product; 3Source: Minnesota Department of Employment and Economic Development, July 2011; 4Source: Illinois Deptartment of Employment Security (data as of 7/27/11) |

| Associated Banc-Corp About Associated Banc-Corp Addressing Current Challenges Driving Loan Growth and Margin Expansion Strategic Initiative Highlights 2Q 2011 Highlights Summary 8 |

| Addressing Current Challenges Addressing Current Challenges 9 |
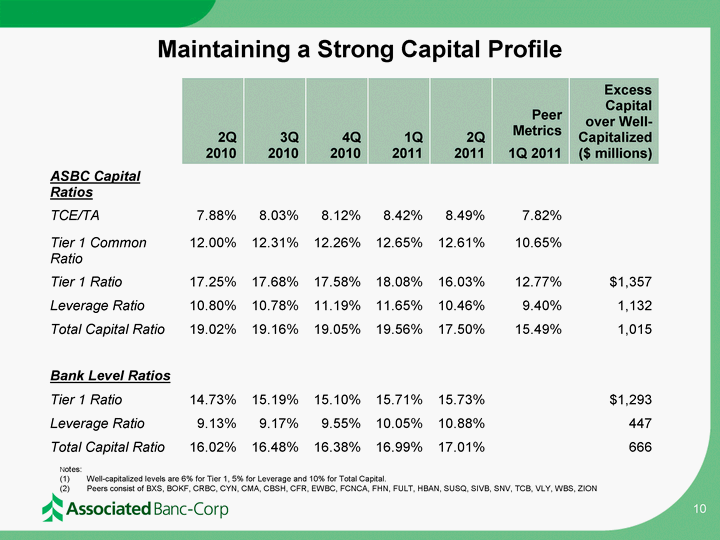
| Maintaining a Strong Capital Profile 2Q 2010 3Q 2010 4Q 2010 1Q 2011 2Q 2011 Peer Metrics1Q 2011 Excess Capital over Well-Capitalized ($ millions) ASBC Capital Ratios TCE/TA 7.88% 8.03% 8.12% 8.42% 8.49% 7.82% Tier 1 Common Ratio 12.00% 12.31% 12.26% 12.65% 12.61% 10.65% Tier 1 Ratio 17.25% 17.68% 17.58% 18.08% 16.03% 12.77% $1,357 Leverage Ratio 10.80% 10.78% 11.19% 11.65% 10.46% 9.40% 1,132 Total Capital Ratio 19.02% 19.16% 19.05% 19.56% 17.50% 15.49% 1,015 Bank Level Ratios Tier 1 Ratio 14.73% 15.19% 15.10% 15.71% 15.73% $1,293 Leverage Ratio 9.13% 9.17% 9.55% 10.05% 10.88% 447 Total Capital Ratio 16.02% 16.48% 16.38% 16.99% 17.01% 666 Notes: (1) Well-capitalized levels are 6% for Tier 1, 5% for Leverage and 10% for Total Capital. Peers consist of BXS, BOKF, CRBC, CYN, CMA, CBSH, CFR, EWBC, FCNCA, FHN, FULT, HBAN, SUSQ, SIVB, SNV, TCB, VLY, WBS, ZION 10 |

| Addressing Current Challenges Addressing Current Challenges 11 |

| Significant Improvements in Credit Quality Indicators 2Q 2010 3Q 2010 4Q 2010 1Q 2011 2Q 2011 Provision for loan losses $ 97.7 $ 64.0 $ 63.0 $ 31.0 $ 16.0 Net charge offs $ 105.3 $ 109.9 $ 108.2 $ 53.4 $ 44.5 ALLL/Total loans 4.51% 4.22% 3.78% 3.59% 3.25% ALLL/Nonaccruals 58.21% 71.72% 83.02% 93.07% 91.09% NPA/Assets 4.51% 3.47% 2.84% 2.50% 2.33% Nonaccruals/Loans 7.74% 5.88% 4.55% 3.86% 3.57% NCOs / Avg Loans 3.15% 3.39% 3.41% 1.71% 1.37% 12 ($ in millions) |

| Associated Banc-Corp About Associated Banc-Corp Addressing Current Challenges Driving Loan Growth and Earnings Expansion Strategic Initiative Highlights 2Q 2011 Highlights Summary 13 |
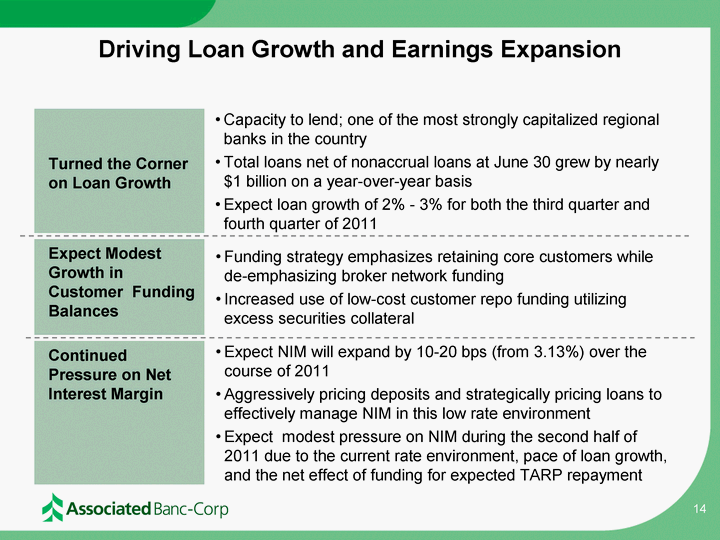
| Driving Loan Growth and Earnings Expansion Driving Loan Growth and Earnings Expansion 14 |

| Driving Loan Growth and Earnings Expansion Driving Loan Growth and Earnings Expansion 15 |

| Associated Banc-Corp About Associated Banc-Corp Addressing Current Challenges Driving Loan Growth and Earnings Expansion Strategic Initiative Highlights 2Q 2011 Highlights Summary 16 |

| Strategic Initiative Highlights Strategic Initiative Highlights 17 |

| ASBC Business Portfolio Commercial Real Estate Commercial Banking 18 Retail Banking Consumer Banking Business Banking Residential Lending Retail Payments Treasury Management Capital Markets Regional/ Middle Market Banking Specialized Financial Services Associated Financial Group Wealth Management Private Banking Trust Investment Management AIS - Brokerage |

| Strategic Initiative Highlights - Commercial Strategic Initiative Highlights - Commercial 19 |

| Strategic Initiative Highlights - Commercial Real Estate Strategic Initiative Highlights - Commercial Real Estate 20 |

| Strategic Initiative Highlights - Retail Banking Strategic Initiative Highlights - Retail Banking 21 |

| Strategic Initiative Highlights - Wealth Strategic Initiative Highlights - Wealth 22 |
| Associated Banc-Corp About Associated Banc-Corp Addressing Current Challenges 2011 - Driving Loan Growth and Earnings Expansion Strategic Initiative Highlights 2Q 2011 Highlights Summary 23 |

| Second Quarter 2011 Highlights Fourth consecutive quarter of profitability Pre-tax income improved $13M and net income to common shareholders improved $10M from the prior quarter Total loans of $13.1 billion, up 3% from the prior quarter Net growth of $230M in C&I loans on linked-quarter basis Specialized Financial Services contributed more than $120M of net portfolio growth Chicago was largest metro area contributor with ~$50M of net growth Wisconsin was largest state contributor with ~$80M of net loan growth Utilization rates were up slightly at 45% compared to 43% in 1Q11 Commercial real estate and construction loans were up $50M Residential mortgages grew $156M during 2Q11 Positive Results From Our Actions 24 |

| Loan Portfolio Growth and Composition 25 Total Loans of $13.1 billion at June 30, 2011 Loan Mix - 12/31/08 compared to 6/30/11 Loan Composition ($ billions) Total Loans ($ billions) (CHART) (CHART) (CHART) (CHART) |

| Second Quarter 2011 Highlights Total deposits and customer funding grew $300M during the quarter to $16.1 billion Drove noncustomer network transaction deposits and brokered CDs down another 10% during 2Q11 Do not expect to see significant expansion of customer repos or FHLB balance going forward Solid growth in interest-bearing checking, savings and sweep account balances Net deposit growth driven by a 10% increase in interest-bearing deposits and a 4% increase in savings deposits during the quarter Positive Results From Our Actions 26 |

| Quarterly Deposit and Funding Portfolio Trends 27 ($ in Thousands) |

| Second Quarter 2011 Highlights Net interest margin of 3.29%, down 3 basis points from previous quarter Impact of March 2011 debt offering (~ -8 basis points) along with the impact of lower loan yields was partially offset by a 5 bps improvement in interest-bearing deposits For the balance of the year, expect margin will be impacted by current rate environment, pace of loan growth, and net effect of funding for the expected TARP repayment Positive Results From Our Actions 28 |

| Net Interest Income* and Net Interest Margin 29 Q2 vs. Q1 Impact on Margin During 2Q 2011, net interest income grew modestly while NIM compressed. Gross growth in interest income and lower deposit expenses, more than offset net funding expense growth, despite nearly $4 million of new CPP financing costs. Absent the CPP related interest expense, NIM would have expanded QoQ. NIM = - 3bps NII* = + $0.3 mm * NII on a Tax Equivalent Basis Earning Asset Yields = -1bps Other Liabilities= -7bps Deposit Expense = +5bps |

| Second Quarter 2011 Highlights Core fee-based revenue of $61M was relatively flat compared to 1Q2011 Impacted by a $6M reduction in the value of Mortgage Servicing Rights Impacted by a $4M valuation expense related to credit exposure on interest rate swap transactions Service charges on deposit accounts ($19M) were also relatively flat compared to the prior quarter Projecting NSF/OD fees of $40-45M in 2011, down ~$10 million from 2010 4Q2011 impact of Durbin will be ~$4M Annualized gross revenue impact will be $17-$19M Trust fees were $10M, up 2% from last quarter Non-interest expense of $159M was down 3% from the first quarter Positive Results From Our Actions 30 |
| Second Quarter 2011 Highlights Credit quality continued to improve Nonaccrual loans of $468M, the lowest level in six quarters Potential problem loans down $213M (23%) from $912M for 1Q11 Provision for loan losses of $16M, down from $31M for the first quarter; expect provision will continue to decline for the balance of the year Net charge-offs of $45M, down 17% from $53M for the prior quarter; expect charge-offs will remain at about 1Q/2Q levels for the balance of 2011 Positive Results From Our Actions 31 |

| Nonaccrual Loans Continue to Decline 3Q 2010 4Q 2010 1Q 2011 2Q 2011 Beginning balance $ 976 $ 728 $ 574 $ 488 New nonaccrual loans 100 136 81 95 Nonaccrual loan payoffs / downs (92) (73) (74) (62) Loans sold Book balance (199) (163) --- --- Charge-offs taken 85 42 --- --- Net Proceeds (114) (121) --- --- Net charge offs / write-downs On sold loans On loans transferred to held for sale (85)--- (42)--- ---(10) ------ Other nonaccrual loans (25) (66) (43) (45) Total (110) (108) (53) (45) Other net changes (32) 12 (40) (8) Ending balance $ 728 $ 574 $ 488 $ 468 32 ($ in millions) |

| Five Consecutive Quarters of Declines in Potential Problem Loans 2Q 2010 3Q 2010 4Q 2010 1Q 2011 2Q 2011 Beginning balance $1,368 $1,272 $1,132 $ 964 $ 912 New inflow from downgrades 172 117 66 80 22 Net loans downgraded to impaired (128) (44) (66) (11) (46) Loans closed or paid off (103) (76) (142) (51) (88) Loans upgraded (49) (90) (33) (51) (84) Other net changes 12 (47) 7 (19) (17) Ending balance $1,272 $1,132 $ 964 $ 912 $ 699 33 ($ in millions) |

| 2Q 2011 Provision Expense 34 Provision Components Provision Drivers Release of FAS 114 reserves due to restructurings, payoffs, and charge offs Accruing TDR allocation increase due to increased balances Decrease in FAS 5 allocation due to positive asset quality migration within the portfolio ($ in millions) $ 45 Net charge offs $ (9) Decreased specific reserves on non accrual loans (FAS 114) $ 2 Increased allocation on restructured loans (TDRs) in accrual status $ (22) Historical loss allocations (FAS 5) and other management factors allocation $ 16 Total 2Q11 Provision |

| Associated Banc-Corp About Associated Banc-Corp Addressing Current Challenges Driving Loan Growth and Earnings Expansion Strategic Initiative Highlights 2Q 2011 Highlights Summary 35 |

| Fourth consecutive quarter of profitability with EPS of $0.15 per common share Loan portfolio grew 3% to $13.1 billion, with the most significant growth in C&I loans Total loans, net of nonaccrual loans, grew by nearly $1 billion on a YoY basis Impact of debt offering on NIM offset by a 5 bps improvement in deposit costs Lowest level of nonaccrual loans in 6 quarters and 23% linked-quarter decline in potential problem loans 36 2Q 2011 - Solid Quarterly Results Summary Remainder of 2011 - Positioning for the Future Continued execution of our strategic initiatives Continued investments in management reporting systems Upgrades to our branch network Ongoing investments in new talent Continued optimization of funding costs Expect to repay the balance of TARP Addressed all of the conditions of the Memorandums of Understanding |

| 37 Summary 2012 and Beyond - Poised for Revenue Growth and Earnings Expansion Strong, stable Midwest franchise Largest Wisconsin-based bank Long history and commitment to the communities we serve Four consecutive quarters of profitability Turned the corner on loan growth Focused on fee-generating businesses Solid long-term strategy to reduce and manage risk Improved systems, processes, and procedures Strong balance sheet with adequate capital Ability to cover enterprise-wide risk Ability to grow organically and through acquisitions Solid return for our shareholders Attractive stock price Potential to generate future dividend yield |

| Appendix Credit Details Past Due Loans Page 39 Potential Problem Loans 40 Nonaccrual Loans 41 Net Charge-offs 42 Loan Portfolio Residential Mortgages 44 Home Equity 45 Commercial Real Estate 46 Construction Loans 47 C&I Loans 48 Net Interest Income Page 50-51 Investment Portfolio Page 53 Senior Management Team Page 55-59 38 |
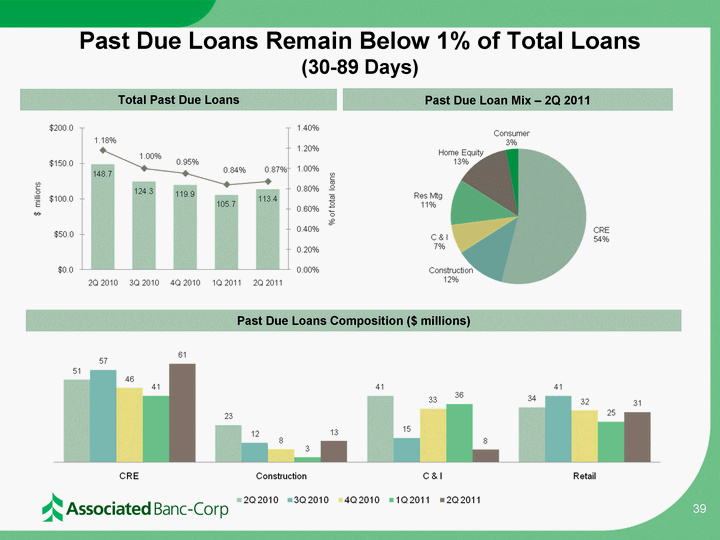
| Past Due Loans Remain Below 1% of Total Loans (30-89 Days) Total Past Due Loans Past Due Loan Mix - 2Q 2011 Past Due Loans Composition ($ millions) 39 (CHART) (CHART) (CHART) |

| Continued Downward Trend in Potential Problem Loans Potential Problem Loan Composition ($ millions) Total Potential Problem Loans ($ millions) Potential Problem Loan Mix 2Q 2011 40 (CHART) (CHART) (CHART) |

| Nonaccrual Loan Mix and Composition Total Nonaccruals ($ millions) Nonaccrual Mix - 2Q 2011 Nonaccrual Composition ($ millions) 41 (CHART) (CHART) (CHART) |

| Total Net Charge-Offs Total NCOs ($ millions) NCO Mix - 2Q 2011 NCO Composition ($ millions) 42 (CHART) (CHART) (CHART) |

| Appendix Credit Details Past Due Loans Page 39 Potential Problem Loans 40 Nonaccrual Loans 41 Net Charge-offs 42 Residential Mortgages 44 Home Equity 45 Commercial Real Estate 46 Construction Loans 47 C&I Loans 48 Net Interest Income Page 50-51 Investment Portfolio Page 54 Senior Management Team Page 55-59 43 Loan Portfolio |

| Residential Mortgages Residential Housing Price Index (HPI*) Portfolio Mortgage Balance by State Portfolio Mortgage NCOs by State $2.7 billion, or 21% of Total Loans, at June 30, 2011 Comments June 30, 2011 vs. June 30, 2010 % Change(Projected**) June 30, 2011 vs.March 30, 2011% Change(Projected**) Milwaukee1 -2.97% -0.50% Chicago2 -1.69% +2.02% Twin Cities3 -3.26% +0.76% Wisconsin -2.51% -0.86% Minnesota -2.86% +0.48% Illinois -1.71% +1.53% U.S. -3.61% -0.99% *FHFA Conventional and Conforming Home Price Index ** Data for Q2 2011 not yet available. Projection by Moody's 1Milwaukee, West Allis, Waukesha 2Chicago, Naperville, Joliet 3 Minneapolis, St. Paul, Bloomington Nonaccruals continue to decline: 2Q11 - $67 M 1Q11 - $70 M 4Q10 - $76 M 3Q10 - $77 M 2Q10 - $84 M 44 (CHART) (CHART) |

| Home Equity Comments Home Equity Balance by State Home Equity NCOs by State $2.6 billion, or 20% of Total Loans, at June 30, 2011 Nonaccruals remained on a downward trend: 2Q11 - $47 M 1Q11 - $50 M 4Q10 - $52 M 3Q10 - $51 M 2Q10 - $42 M 30-89 days past due remained stable: 2Q11 - $15 M 1Q11 - $15 M 4Q10 - $14 M 3Q10 - $20 M 2Q10 - $16 M NCOs decrease significantly: 2Q11 - $ 8 M 1Q11 - $14 M 4Q10 - $15 M 3Q10 - $11 M 2Q10 - $11 M 45 (CHART) (CHART) |

| CRE Loans by State Comments Commercial Real Estate Loans Nonaccrual loans were slightly elevated: 2Q11 - $193 M 1Q11 - $187 M 4Q10 - $224 M 3Q10 - $276 M Potential Problem Loans were down for the third consecutive quarter: 2Q11 - $382 M 1Q11 - $465 M 4Q10 - $493 M 3Q10 - $553 M NCOs remained flat for the 2Q11: 2Q11 - $ 9 M 1Q11 - $ 8 M 4Q10 - $20 M 3Q10 - $29 M CRE Loans by Collateral $3.4 billion, or 26% of Total Loans, at June 30, 2011 46 (CHART) (CHART) |

| Construction Loans by State Comments Construction Loans Nonaccrual loans continued to decline for the third consecutive quarter: 2Q11 - $ 73 M 1Q11 - $ 85 M 4Q10 - $ 95 M 3Q10 - $132 M Potential Problem Loans were down slightly: 2Q11 - $ 63 M 1Q11 - $ 71 M 4Q10 - $ 92 M 3Q10 - $176 M NCOs were down from the prior quarter 2Q11 - $ 6 M 1Q11 - $12 M 4Q10 - $32 M 3Q10 - $60 M Construction Loans by Collateral $534 million, or 4% of Total Loans, at June 30, 2011 47 (CHART) (CHART) |

| C&I Loans by State C&I Loans 2Q 2011 nonaccrual loans declined from the prior quarter: 2Q11 - $ 84 M 1Q11 - $ 92 M 4Q10 - $117 M 3Q10 - $184 M Potential Problem Loans were significantly down from the prior quarter: 2Q11 - $231 M 1Q11 - $351 M 4Q10 - $357 M 3Q10 - $376 M NCOs were elevated from the prior quarter: 2Q11 - $15 M 1Q11 - $ 4 M 4Q10 - $36 M 3Q10 - $ 5 M C&I Loans by Collateral $3.3 billion, or 25% of Total Loans, at June 30, 2011 Comments C&I Loans by Collateral 48 (CHART) (CHART) |

| Appendix Credit Details Past Due Loans Page 39 Potential Problem Loans 40 Nonaccrual Loans 41 Net Charge-offs 42 Loan Portfolio Residential Mortgages 44 Home Equity 45 Commercial Real Estate 46 Construction Loans 47 C&I Loans 48 Investment Portfolio Page 53 Senior Management Team Page 55-59 49 Net Interest Income Page 50-51 |

| Net Interest Income Analysis - Taxable Equivalent Basis 50 Three months ended June 30, 2011 Three months ended June 30, 2011 Three months ended June 30, 2011 Three months ended March 31, 2011 Three months ended March 31, 2011 Three months ended March 31, 2011 Average Interest Average Average Interest Average (in thousands) Balance Income / Expense Yield / Rate Balance Income / Expense Yield / Rate Earning assets: Loans: (1) (2) (3) Commercial $ 7,114,930 $ 77,122 4.35% $ 6,907,941 $ 76,444 4.48% Residential mortgage 2,657,740 28,032 4.22 2,527,035 27,147 4.31 Retail 3,232,234 40,033 4.96 3,238,868 39,992 4.98 Total loans 13,004,904 145,187 4.47 12,673,844 143,583 4.58 Investment securities 5,689,728 47,359 3.33 5,858,293 46,993 3.21 Other short-term investments 736,660 1,437 0.78 765,729 1,458 0.76 Investments and other 6,426,388 48,796 3.04 6,624,022 48,451 2.93 Total earning assets 19,431,292 193,983 4.00 19,297,866 192,034 4.01 Other assets, net 2,094,863 2,038,992 Total assets $ 21,526,155 $ 21,336,858 Interest-bearing liabilities: Savings deposits $ 999,748 $ 308 0.12% $ 917,053 $ 264 0.12% Interest-bearing demand deposits 1,811,525 738 0.16 1,764,439 631 0.15 Money market deposits 5,039,056 4,206 0.33 5,149,261 4,688 0.37 Time deposits, excluding Brokered CDs 2,655,944 10,667 1.61 2,815,301 11,616 1.67 Total interest-bearing deposits, excluding Brokered CDs Total interest-bearing deposits, excluding Brokered CDs 10,506,273 15,919 0.61 10,646,054 17,199 0.66 Brokered CDs 320,741 982 1.23 378,289 1,050 1.13 Total interest-bearing deposits 10,827,014 16,901 0.63 11,024,343 18,249 0.67 Short and long-term funding 4,434,500 17,627 1.59 3,883,122 14,622 1.52 Total interest-bearing liabilities 15,261,514 34,528 0.91 14,907,465 32,871 0.89 Noninterest-bearing demand deposits 3,225,675 3,221,271 Other liabilities 62,126 35,486 Stockholders' equity 2,976,840 3,172,636 Total liabilities and stockholders' equity $ 21,526,155 $ 21,336,858 Net interest income and rate spread (1) $ 159,455 3.09% $ 159,163 3.12% Net interest margin (1) 3.29% 3.32% Taxable equivalent adjustment $ 5,332 $ 5,440 (1) The yield on tax exempt loans and securities is computed on a taxable equivalent basis using a tax rate of 35% for all periods presented and is net of the effects of certain disallowed interest deductions. (1) The yield on tax exempt loans and securities is computed on a taxable equivalent basis using a tax rate of 35% for all periods presented and is net of the effects of certain disallowed interest deductions. (1) The yield on tax exempt loans and securities is computed on a taxable equivalent basis using a tax rate of 35% for all periods presented and is net of the effects of certain disallowed interest deductions. (1) The yield on tax exempt loans and securities is computed on a taxable equivalent basis using a tax rate of 35% for all periods presented and is net of the effects of certain disallowed interest deductions. (1) The yield on tax exempt loans and securities is computed on a taxable equivalent basis using a tax rate of 35% for all periods presented and is net of the effects of certain disallowed interest deductions. (1) The yield on tax exempt loans and securities is computed on a taxable equivalent basis using a tax rate of 35% for all periods presented and is net of the effects of certain disallowed interest deductions. (1) The yield on tax exempt loans and securities is computed on a taxable equivalent basis using a tax rate of 35% for all periods presented and is net of the effects of certain disallowed interest deductions. (1) The yield on tax exempt loans and securities is computed on a taxable equivalent basis using a tax rate of 35% for all periods presented and is net of the effects of certain disallowed interest deductions. (1) The yield on tax exempt loans and securities is computed on a taxable equivalent basis using a tax rate of 35% for all periods presented and is net of the effects of certain disallowed interest deductions. (2) Nonaccrual loans and loans held for sale have been included in the average balances. (2) Nonaccrual loans and loans held for sale have been included in the average balances. (2) Nonaccrual loans and loans held for sale have been included in the average balances. (2) Nonaccrual loans and loans held for sale have been included in the average balances. (3) Interest income includes net loan fees. |

| Asset Sensitivity - Interest Rate Shock Simulation 51 Quarter Ended NII % Change 06/30/2011 0.7% 03/31/2011 0.8% 12/31/2010 1.7% 09/30/2010 3.9% 06/30/2010 3.2% Rate Change: +100 bps Asset Sensitive = projected net interest income is positively impacted by projected rising rates. |

| Appendix Credit Details Past Due Loans Page 39 Potential Problem Loans 40 Nonaccrual Loans 41 Net Charge-offs 42 Loan Portfolio Residential Mortgages 44 Home Equity 45 Commercial Real Estate 46 Construction Loans 47 C&I Loans 48 Net Interest Income Page 50-51 Senior Management Team Page 55-59 52 Investment Portfolio Page 53 |

| High Quality Investment Securities Portfolio Investment Portfolio - June 30, 2011 Market Value Composition - June 30, 2011 Portfolio Composition Ratings - June 30, 2011 Type Bk Value(000's) Mkt Value (000's) TEY(%) Duration (Yrs) Govt & Agencies $ 28,255 $ 28,298 0.63 0.41 MBS Agency 1,574,269 1,668,901 4.53 2.38 CMO - Agency 2,832,617 2,874,871 2.80 2.58 CMO - Non-agency 46,661 47,665 5.79 6.75 Municipals 787,768 818,212 5.78 5.55 ABS 243,387 243,115 0.41 0.29 Corporate Floating Rate Bonds 44,960 44,922 0.87 0.31 Trust Preferred Securities 2,127 1,457 --- --- Other * 11,807 14,593 --- --- TOTAL AFS $5,571,851 $5,742,034 3.59 2.76 Credit Rating (& in millions) Mkt Value % of Total Govt & Agency $ 4,571,870 79.6% AAA 257,063 4.5% AA 729,001 12.7% A 95,880 1.7% BAA1, BAA2 & BAA3 17,173 0.3% BA1 & Lower 42,885 0.7% Non-rated 28,162 0.5% Total $ 5,742,034 100.0% * Includes money market funds and other stock. 53 (CHART) |

| Appendix Credit Details Past Due Loans Page 39 Potential Problem Loans 40 Nonaccrual Loans 41 Net Charge-offs 42 Loan Portfolio Residential Mortgages 44 Home Equity 45 Commercial Real Estate 46 Construction Loans 47 C&I Loans 48 Net Interest Income Page 50-51 Investment Portfolio Page 53 54 Senior Management Team Page 55-59 |

| Experienced Senior Management Team Philip B. Flynn - President and Chief Executive Officer (2009) 30+ years of banking experience Previously Vice Chairman and Chief Operating Officer of Union Bank Other executive positions include Chief Credit Officer and Head of Commercial Banking, Union Bank Brian R. Bodager - Chief Administrative Officer, General Counsel & Corporate Secretary (1992) 19+ years as General Counsel and Corporate Secretary Assumed Chief Administrative Officer responsibilities in 1999 Oliver Buechse - Chief Strategy Officer (2010) Previously head of strategy for Union Bank; responsible for North American Vision and Portfolio Strategy for Bank of Tokyo Mitsubishi UFJ Began his career at McKinsey & Company 55 |

| Experienced Senior Management Team Christopher Del Moral-Niles - Deputy Chief Financial Officer and Treasurer (2010) 18+ years of financial services industry experience (10 years in investment banking) Previously, Corporate Treasurer, The First American Corporation; Divisional President, First American Trust; SVP, Treasury, Union Bank Patrick J. Derpinghaus - General Auditor (2011) 30+ years of audit, accounting and administration Most recently, Audit Director, U.S. Bancorp. Other experience: EVP and CFO, The Bankers Bank; SVP and Controller, UMB Financial; and, Chief Administration Officer, Mercantile Bancorporation Judith M. Docter - Director of Human Resources (1992) 29+ years of human resources experience, including 19+ with Associated Assumed Executive Vice President role in 2005 56 |

| Experienced Senior Management Team Breck F. Hanson - Head of Commercial Real Estate (2010) 30+ years of commercial banking experience (over 20 years in the CRE segment) Served as Midwest Regional Executive, Commercial Real Estate for Bank of America (LaSalle Bank) Arthur G. Heise - Chief Risk Officer (2011) 30+ years of leadership experience in audit and risk management Previously, Director of Enterprise Risk Services, U.S. Bancorp. Other leadership positions in risk management and audit at CitiMortgage, UMB Financial, Mercantile Bancorporation and Valley Bancorporation Scott S. Hickey - Chief Credit Officer (2008) 30+ years of banking experience; 20+ years with U.S. Bank Previous positions include Executive Vice President - Wholesale Credit for U.S. Bank and Chief Credit Officer for Firstar Minnesota, Illinois 57 |

| Experienced Senior Management Team Timothy J. Lau - Head of Wealth Management (1989) 24+ years of banking experience Broad range of experience including senior management positions in consumer and small business banking, residential lending, and commercial banking Mark J. McMullen - Vice Chairman of Associated Bank N.A. (1981) 20+ years of financial services industry experience Began his career at Associated in treasury and portfolio management; elected an officer in 2001 Most recently, serviced as head of Wealth Management Mark D. Quinlan - Chief Information Officer (2005) 25+ year of financial service industry experience IT/Operations leadership roles at several large banks, including Citibank and US Bank 58 |

| Experienced Senior Management Team Joseph B. Selner - Chief Financial Officer (1973) 35+ years of banking industry experience; CPA and certified internal auditor Named Executive Vice President and CFO of Associated Banc-Corp in 1983 Donna N. Smith - Head of Commercial Middle Market & Regional Banking (2010) 30+ years of commercial banking experience Leadership roles with Bank of America (LaSalle Bank), Harris Bank, and Fifth Third Bank David L. Stein - Head of Retail Banking (2005) 25+ years of banking experience Previously, held a number of progressively responsible retail banking management positions with JP Morgan Chase 59 John A. Utz - Head of Specialized Industries and Commercial Financial Services (2010) 18+ years of banking experience Most recently, Head of Capital Markets and Asset Management, Union Bank, and President of UnionBanCal Equities |