Attached files
| file | filename |
|---|---|
| 8-K - FORM 8-K - TRANSATLANTIC PETROLEUM LTD. | d8k.htm |
| EX-99.1 - PRESS RELEASE - TRANSATLANTIC PETROLEUM LTD. | dex991.htm |
 Second
Quarter 2011 Investor Update Exhibit 99.2 |
 Disclaimer
2
Forward-Looking Statements
Outlooks, projections, estimates, targets, and business plans in this presentation or any
related subsequent discussions are forward-looking statements. Actual future
results, including TransAtlantic Petroleum Ltd.’s own production growth and mix; financial results; the amount and mix
of capital expenditures; resource additions and recoveries; finding and development costs;
project and drilling plans, timing, costs, and capacities; revenue enhancements and cost
efficiencies; industry margins; margin enhancements and integration benefits; and the impact of technology
could differ materially due to a number of factors. These include changes in long-term oil
or gas prices or other market conditions affecting the oil, gas, and petrochemical
industries; reservoir performance; timely completion of development projects; war and other political or security
disturbances; changes in law or government regulation; the outcome of commercial negotiations;
the actions of competitors; unexpected technological developments; the occurrence and
duration of economic recessions; unforeseen technical difficulties; and other factors discussed
here and under the heading “Risk Factors" in our Annual Report on Form 10-K
for the year ended December 31, 2010 and our Quarterly Report on Form 10-Q for the
quarter ended March 31, 2011, and our Quarterly Report on Form 10-Q for the quarter ended June 30, 2011 available at our
website at www.transatlanticpetroleum.com and www.sec.gov. See also TransAtlantic’s 2010
audited financial statements and the accompanying management discussion and analysis.
Forward-looking statements are based on management’s knowledge and reasonable
expectations on the date hereof, and we assume no duty to update these statements as of any
future date. The information set forth in this presentation does not constitute
an offer, solicitation or recommendation to sell or an offer to buy any securities of
the Company. The information published herein is provided for informational purposes only. The Company makes no representation that the
information and opinions expressed herein are accurate, complete or current. The information
contained herein is current as of the date hereof, but may become outdated or
subsequently may change. Nothing contained herein constitutes financial, legal, tax, or other advice.
Barrels of oil equivalent, or Boe, is derived by converting natural gas to oil in the ratio of
six thousand cubic feet (mcf) of natural gas to one barrel (bbl) of oil. Boe may
be misleading, particularly if used in isolation. A boe conversion ratio of 6 mcf to 1 bbl is based on an energy equivalency
conversion method primarily applicable at the burner tip and does not represent a value
equivalency at the wellhead. |
 Second
Quarter 2011 Highlights •
Production Increase
Total
production
up
59%
to
362
Mboe
(3,935
boe/d)
over
Q2
2010,
up
2%
over
Q1
2011
Total
oil
production
up
29%
to
220
Mbbls
over
Q2
2010,
and
flat
over
Q1
2011
Natural Gas from Thrace basin* increase 90% over Q2 2010, decreased (18%) over Q1 2011
•
Revenue and EBITDAX Increase
Revenues up 91% to $35.5 million from Q2 2010, up 10% over Q1 2011
EBITDAX increased to $14.5 million in Q2 2011 from $5.5 million Q2 2010 and $12.1
million Q1 2011
Net cash provided by operating activities from continuing operations was $19.1 million in Q2
2011, from $5.6 million in Q1 2011.
3
Note: Does not include TBNG
Note: See definition and reconciliation of EBITDAX in Appendix. EBITDAX is a
non-GAAP financial measure. |
 Second
Quarter Financial and Operating Results * See definition and reconciliation of EBITDAX
in Appendix. EBITDAX is a non-GAAP financial measure. 4
Three Months
Six Months
(in millions, except per share)
Q2
Q2
30-Jun
30-Jun
2011
2010
2011
2010
Revenues (millions)
$ 35.51
$ 18.60
$ 67.71
$ 31.00
Production & LOE Expense
$ 4.16
$ 4.70
$ 8.26
$ 8.89
Exploration Expense
$ 11.13
$ 8.12
$ 24.91
$ 15.51
Revaluation of contingent consideration
$ 1.25
$ -
$ 1.25
$
- General & Administrative Expense
$ 10.25
$ 6.77
$ 20.50
$ 12.55
Depletion, Depreciation & Amortization
$ 13.14
$ 4.30
$ 21.64
$ 7.34
Total Cost & Expense
$ 39.92
$ 23.90
$ 76.56
$ 44.28
Net Operating Loss
$ 4.41
$ 5.29
$ 8.85
$ 13.29
Net loss from continuing operations
$ 8.95
$ 4.61
$ 27.30
$ 13.49
Net loss from continuing operations per share
$ 0.03
$ 0.02
$ 0.08
$ 0.04
EBITDAX (non-GAAP) Gain *
$ 14.46
$ 5.48
$ 27.31
$ 5.59
EBITDAX (non-GAAP) per diluted share Gain*
$ 0.04
$ 0.02
$ 0.08
$ 0.02
From continuing operations, including TBNG |
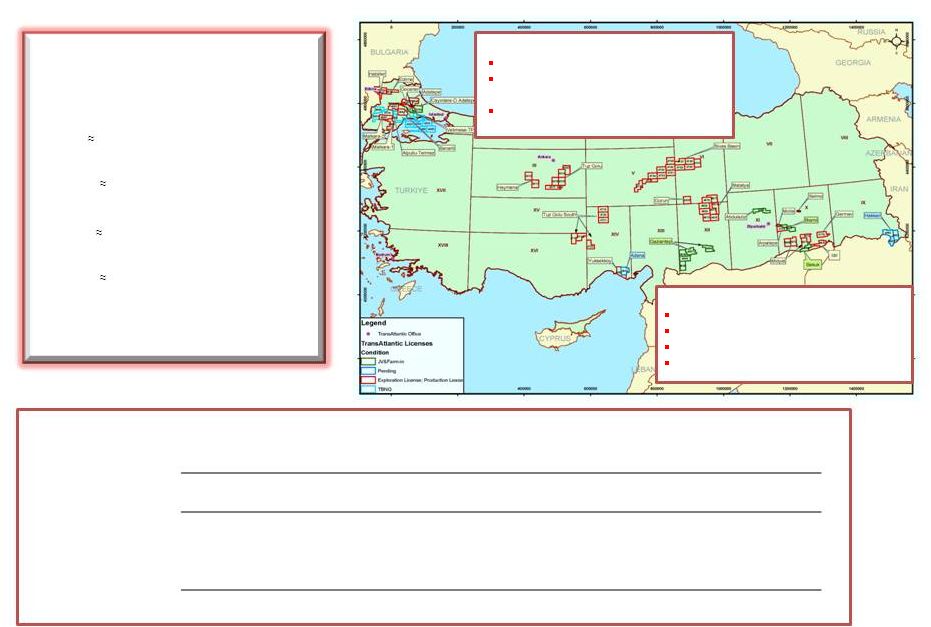 Exchange /
Ticker NYSE-AMEX / TAT
TSX / TNP
Acreage Position
Turkey
6.4 MM Gross
6.0 MM Net
Morocco
0.65 MM Gross/Net
Bulgaria
0.6 MM Gross/Net
Romania
1.0 MM Gross
0.5 MM Net
2011 estimated
CAPEX
$37 million
TAPCOR Overview
Enterprise Value $537 MM
3,657 Boe/d Q2 production (net, after royalty)
•
65% Oil
2,393 bbls/d Selmo/Arpatepe
•
35% Natural Gas
7,581 Mcf/d Thrace Basin*
* Does not include TBNG
Note: Enterprise value is equal to market capitalization using the closing price of $1.10 per
share as of 8/8/11, plus net debt as of 6/30/11. Thrace Basin
Both conventional/unconventional play
Deep prospects with large structural
closures
3.5 Mmboe of proved reserves
SE Basin
Directional Pad drilling at Selmo
Seismic completed
Drilling work under way at Arpatepe
13.1 Mmboe of proved reserves
5 |
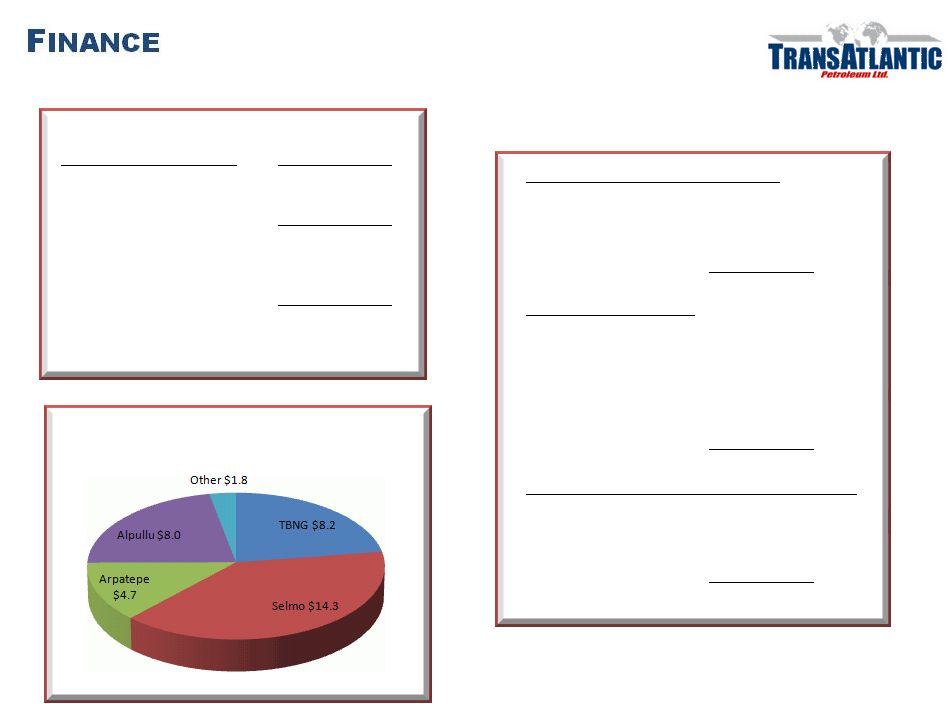 6
Sources and Uses for July-December 2011
* At retail
** Assumes $90 oil and $7.50 gas
Debt Maturity
As of June 30
(in thousands)
Short Term
Dalea & Viking Note
$ 77,932
Other
15,046
Total Short Term Debt
$ 92,978
Long Term
RBL and Other
$ 67,931
Viking Long Term Debt
$ 426
Total Long Term Debt
$ 68,357
Total Debt
$ 161,335
Sources and Uses for Remainder of 2011 (July-Dec)
(in thousands)
Capex
-$37,000
Cash at 6/30
$26,300
Credit Line Availability
$29,000
TBNG Borrowing Capacity
$10,000
Available Cash from Operations
$39,500
Excess
$67,800
2011 Cash Model (July-December)
Estimated Revenue
(includes third party service
revenue)
$80,000
LOE at $12/boe
-$12,000
Cost of Services
-$8,000
Cash G&A
-$16,000
Interest Expense and debt service
-$7,500
Income Tax
-$5,000
Available Cash
$31,500
TransAtlantic at 7,500 boepd net (est. year end 2011 run rate)
Annual Revenue at 45/55 oil/gas mix
$178,500
LOE at $10/boe
-$24,000
Cash G&A
-$25,000
Interest Expense
-$16,000
Income Tax
-$12,000
Available Cash for CAPEX
$101,500
Assume $90 oil and $7.50 gas
2011 Capital Budget $37 million
(August –
December, on cash cost basis) |
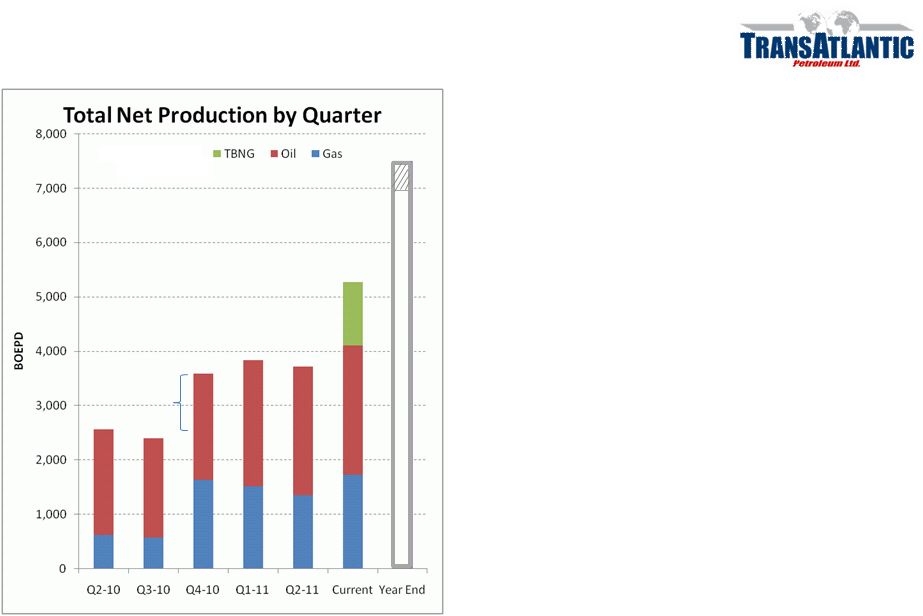 Revised YE
Target = 7,000 to 7,500 BOEPD •
Program Deferrals –
Poor results on lead wells
•
Amity –
False amplitudes
•
Alpullu –
Tight sands
•
Edirne –
Wet structural plays
•
Delays at
•
Gocerler –
3D –
Dev & Expl. drilling
•
Bakuk –
PKK activity –
deferred drilling
Decision to defer made:
•
In consultation with New Expl.
Mgmt. Team
•
Considering new inventories w/ new 3Ds
Already constructed new inventory on 4861/Aplullu
•
Prospects with potential to add material results
Redeployment of capital to higher return opportunities
YE Target
AMITY
Acqusition
Total Net Production
7 |
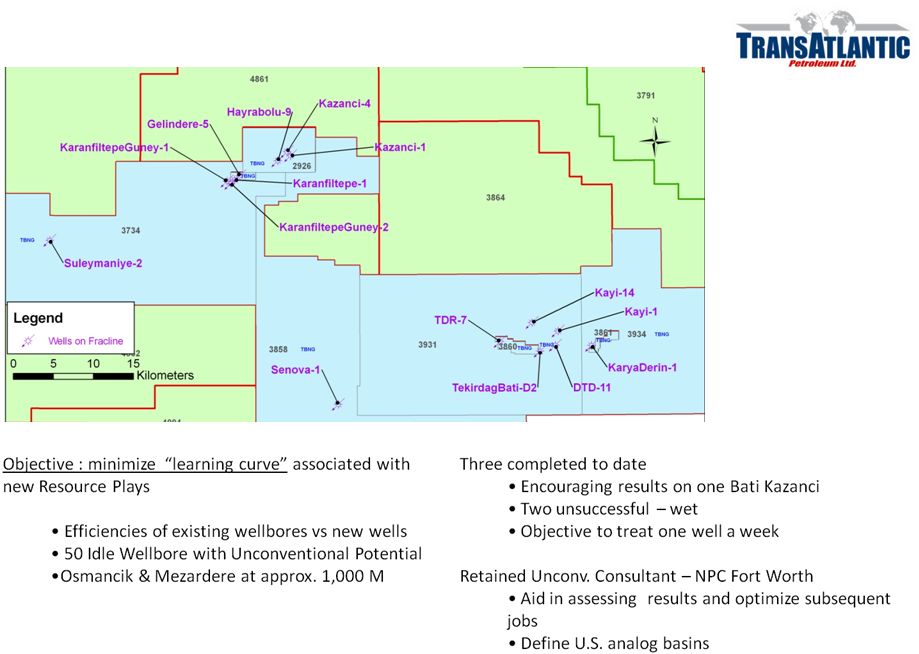
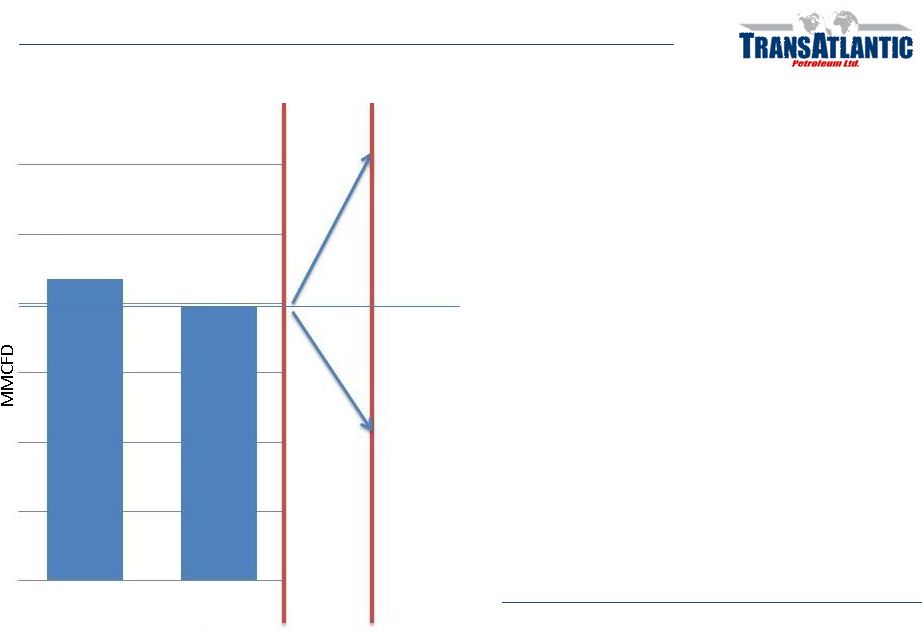 TBNG
2H 2011 Re-Development / Exploration Plan
Closed June 7, 2011
•
Partners –
Valeura & Pinnacle Group
•
TAT Retained 41.5 % WI
2H 2011 Expl & Drilling Program
•
41 Recompletes
—
8
performed for 3.2 mmcfd
•
2
3D
Surveys
of
460
km
2
underway
—
Tekirdag & Hayrabolu
•
High graded Rigline 2D Prospects
•
50 Re Entry Frac Candidates
Work Programs to Offset 90% Base Decline
Q1 2012 New 3D Based Prospect Inventory
JAN
2011
DEC
2011
Closed
6/7/2011
10 mmcfd
Drilling
+ Fracs
Recompletes
4 mmcfd
+6
-4
90%
Base
Decline
8
NET SALES
8.7
7.9
Q1
Q2 |
 TBNG
Re-Entry Frac Program
9 |
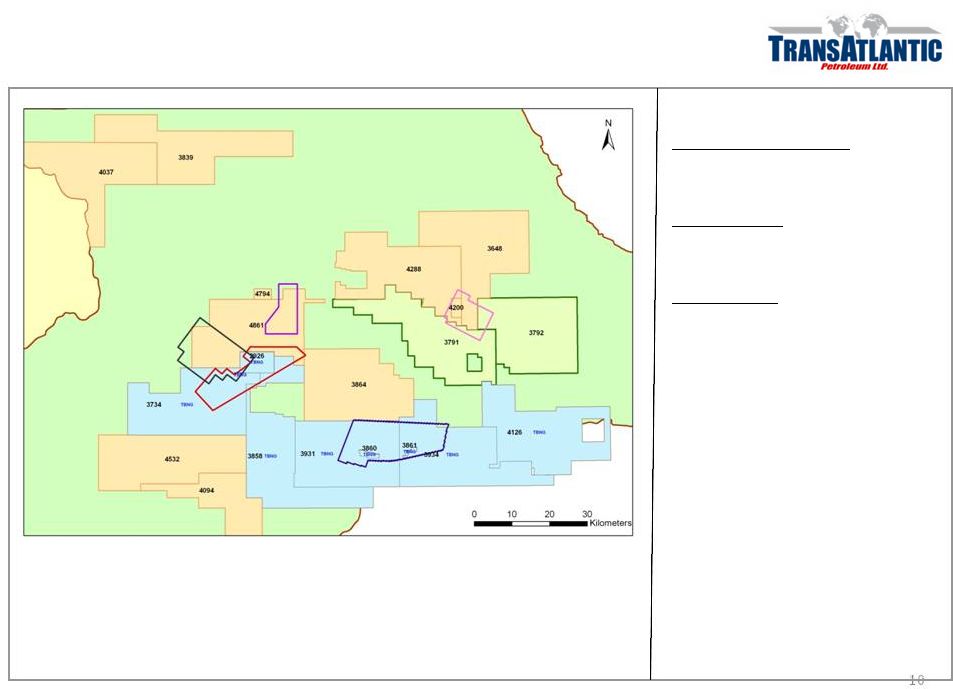 10
Thrace New Seismic DataSets Supporting New Prospect Inventories
4861 Exploration License
-
Temrez E : 166-sqkm 3D
-
Temrez S : 192-sqkm 3D
TBNG Licenses
-
Tekirdag
3D: 263-sqkm
-
Hayrabolu 3D: 200-sqkm
Amity Licenses
-
Gocerler 4D: 97-sqkm |
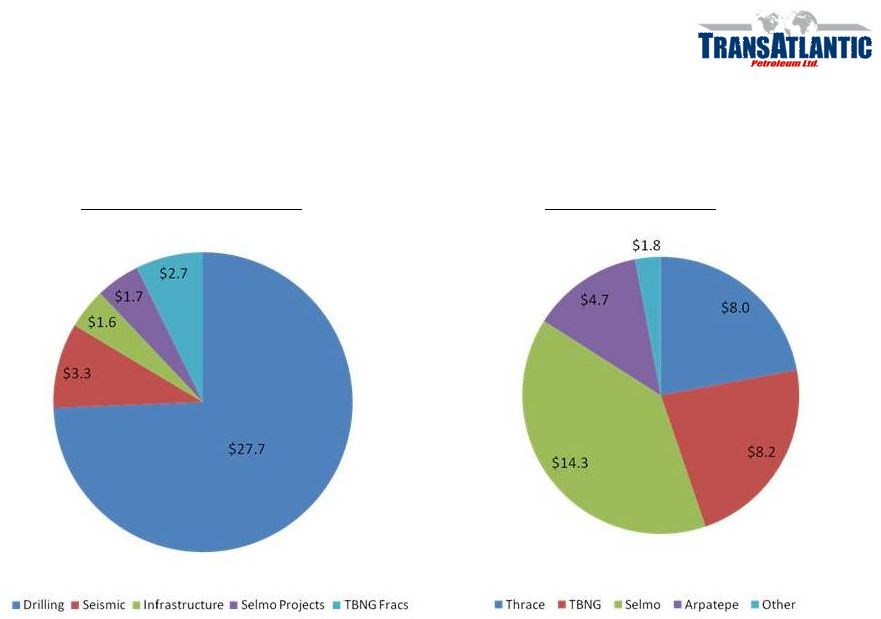 2011 Capital Budget $37 Million
Budget by Activities
Budget by Area
2011
Net Capital Budget
(Cost Basis)
11 |
 Turkey Drilling
Update January Through June 2011 (Wells Spud)
July through December 2011 (Planned Wells)
Activity
Activity
Selmo
9
Selmo
8
Arpatepe
2
Arpatepe
4
Thrace-
TAT
11
Thrace-TAT
15
Morocco
1
Thrace-TBNG
10
Total
23
Total
37
12 |
 Key TransAtlantic
E&P Management New Hires 13
(TBN) –
Giving Notice
Exploration Manager
Start date September 15, 2011
More than 25 years experience
Exploration & Geophysical
Mgr
Major Independent
Dan Hawe
Reservoir Engineering Manager
Start date June 1, 2011
BS Petroleum Engineer
Worked w/ ExxonMobil, Newfield and Laredo
35 years experience in the reservoir
engineering
Experience in all most unconventional U.S.
basins
Mitch Elkins
International Drilling Engineering Manager
Start date August 1, 2011
Formally
Unocal Permission Drilling
Apache Offshore Drilling Mgr
26 years in various engineering, supervisory
and management positions, including 14
years with Unocal.
Darcy Dorscher
Vice President of Operations
Start date June 1, 2011
BS Chemical Engineer
28 years experience in all engineering
disciplines and has managed “green field
projects”
in Russia, India, Kazakhstan, Qatar
and North America |
 Operations
New Operations / Exploration
Management Team
2H 2011 Redevelopment / Exploration
Program at TBNG
Unconventional
Re-Entry Program To
“Crack The Code”
TAT Thrace Basin (4861) 3D Datasets /
Inventory Growth
1st Energy Marketing
–
Risk Reducer
Turkey & Bulgaria
Arpatepe Exploration / Development
Drilling Initiatives
Complete Pipeline / Infrastructure
Projects
Corporate
Restructure service company
Extend maturity of short term debt
Resume consolidation growth strategy
Cost cutting initiatives
Execution Plan 2011
14 |
 Appendix
Cash Flow Information and EBITDAX Reconciliation |
 Cash
Flow Statement 16
U.S. dollars in thousands
June 30, 2011
March 31, 2011
Net cash provided by operating activities from continuing operations
$ 19,054
$ 5,630
Net cash used in investing activities from continuing operations
(11,802)
(23,418)
Net cash (used in) provided by financing activities from continuing operations
(832)
7,248
Net cash used in discontinued operations
(105)
(4,098)
Effect of exchange rate changes on cash and cash equivalents
(211)
162
Net increase (decrease) in cash and cash equivalents
$ 6,104
$ (14,476)
Cash flow from operations before working capital changes, non-recurring other operating
items, early termination of derivatives and adjustments for settlements of
derivative financial instruments with a financing element are presented because management believes it is a useful financial indicator for companies in our
industry. This non-GAAP disclosure is widely accepted as a measure of an oil and natural
gas company’s ability to generate cash used to fund development and acquisition
activities and service debt or pay dividends. Operating cash flow is not a measure of financial performance pursuant to GAAP and should not be used
as an alternative to cash flows from operating, investing, or financing activities. We have
also elected to exclude the adjustment for derivative financial instruments with
a financing element as this adjustment simply reclassifies settlements from operating cash flows to financing activities. Management believes
these settlements should be included in this non-GAAP measure to conform to the intended
measure of our ability to generate cash to fund operations and development activities.
Non-recurring other operating items and early termination of derivatives have been excluded as they do not reflect our on-going
operating activities.
|
 EBITDAX
reconciliation (unaudited) Q2-11
Q2-10
Q1-11
Net Loss from continuing operations
($8,948)
($4,609)
($18,356)
Add back:
Income tax
$1,127
$1,475
$531
Interest expense
$3,695
$654
$3,776
Interest and other income
($200)
($126)
($196)
Share-based compensation / rsu & options
$400
$397
$557
Exploration, abandonment and impairment
$4,463
$4,149
$7,232
Seismic and other exploration expense
$939
$2,273
$1,489
Gain/loss on commodity derivative contracts
($154)
($3,034)
$8,607
Depreciation, depletion and accretion
$13,135
$4,302
$8,505
EBITDAX For the Period Ended
$14,457
$5,481
$12,145
17 |
 This
presentation references estimated EBITDAX, which is a non-GAAP financial measure that represents earnings
from continuing operations before income taxes, interest, depreciation, depletion,
amortization, impairment, abandonment and exploration expense.
The Company believes EBITDAX assists management and investors in
comparing the Company’s performance and
ability to fund capital expenditures and working capital requirements on a consistent basis
without regard to depreciation, depletion and amortization, impairment of natural gas
and oil properties and exploration expenses, which can vary significantly from period
to period. In addition, management uses EBITDAX as a financial measure to
evaluate the Company’s operating performance. EBITDAX is also widely used by
investors and rating agencies. EBITDAX is not a measure of financial performance under
GAAP. Accordingly, it should not be considered as a substitute for net income,
income from operations, or cash flow provided by operating activities prepared in
accordance with GAAP. Information regarding income taxes, interest, depreciation,
depletion, amortization, impairment, abandonment and exploration expense is unavailable
on a forward looking basis. Net income, income from operations, or cash flow provided
by operating activities may vary materially from EBITDAX. Investors should
carefully consider the specific items included in the computation of EBITDAX. The
Company has disclosed EBITDAX to permit a comparative analysis of its operating
performance and debt servicing ability relative to other companies. 18
|
 Thank
you |