Attached files
| file | filename |
|---|---|
| EX-99.1 - EX-99.1 - TRANSATLANTIC PETROLEUM LTD. | tat-ex991_836.htm |
| EX-32.2 - EX-32.2 - TRANSATLANTIC PETROLEUM LTD. | tat-ex322_12.htm |
| EX-32.1 - EX-32.1 - TRANSATLANTIC PETROLEUM LTD. | tat-ex321_10.htm |
| EX-31.2 - EX-31.2 - TRANSATLANTIC PETROLEUM LTD. | tat-ex312_7.htm |
| EX-31.1 - EX-31.1 - TRANSATLANTIC PETROLEUM LTD. | tat-ex311_11.htm |
| EX-23.3 - EX-23.3 - TRANSATLANTIC PETROLEUM LTD. | tat-ex233_1148.htm |
| EX-23.2 - EX-23.2 - TRANSATLANTIC PETROLEUM LTD. | tat-ex232_981.htm |
| EX-23.1 - EX-23.1 - TRANSATLANTIC PETROLEUM LTD. | tat-ex231_1089.htm |
| EX-21.1 - EX-21.1 - TRANSATLANTIC PETROLEUM LTD. | tat-ex211_1090.htm |
| EX-10.22 - EX-10.22 - TRANSATLANTIC PETROLEUM LTD. | tat-ex1022_1151.htm |
| EX-10.21 - EX-10.21 - TRANSATLANTIC PETROLEUM LTD. | tat-ex1021_1149.htm |
| EX-10.20 - EX-10.20 - TRANSATLANTIC PETROLEUM LTD. | tat-ex1020_1150.htm |
UNITED STATES
SECURITIES AND EXCHANGE COMMISSION
WASHINGTON, D.C. 20549
FORM 10-K
(Mark One)
|
☒ |
ANNUAL REPORT PURSUANT TO SECTION 13 OR 15(d) OF THE SECURITIES EXCHANGE ACT OF 1934 |
For the fiscal year ended December 31, 2016
OR
|
☐ |
TRANSITION REPORT PURSUANT TO SECTION 13 OR 15(d) OF THE SECURITIES EXCHANGE ACT OF 1934 |
For the transition period from to
Commission file number 001-34574
TRANSATLANTIC PETROLEUM LTD.
(Exact name of registrant as specified in its charter)
|
Bermuda |
|
None |
|
(State or other jurisdiction of incorporation or organization) |
|
(I.R.S. Employer Identification No.) |
|
|
|
|
|
16803 Dallas Parkway Addison, Texas |
|
75001 |
|
(Address of principal executive offices) |
|
(Zip Code) |
Registrant’s telephone number, including area code: (214) 220-4323
Securities registered pursuant to Section 12(b) of the Act:
|
Title of each class |
|
Name of each exchange on which registered |
|
Common shares, par value $0.10 |
|
NYSE MKT |
Securities registered pursuant to Section 12(g) of the Act:
None
Indicate by check mark if the registrant is a well-known seasoned issuer, as defined in Rule 405 of the Securities Act. Yes ☐ No ☒
Indicate by check mark if the registrant is not required to file reports pursuant to Section 13 or Section 15(d) of the Act. Yes ☐ No ☒
Indicate by check mark whether the registrant (1) has filed all reports required to be filed by Section 13 or 15(d) of the Securities Exchange Act of 1934 during the preceding 12 months (or for such shorter period that the registrant was required to file such reports), and (2) has been subject to such filing requirements for the past 90 days. Yes ☒ No ☐
Indicate by check mark whether the registrant has submitted electronically and posted on its corporate Website, if any, every Interactive Data File required to be submitted and posted pursuant to Rule 405 of Regulation S-T during the preceding 12 months (or for such shorter period that the registrant was required to submit and post such files). Yes ☒ No ☐
Indicate by check mark if disclosure of delinquent filers pursuant to Item 405 of Regulation S-K is not contained herein, and will not be contained, to the best of registrant’s knowledge, in definitive proxy or information statements incorporated by reference in Part III of this Form 10-K or any amendment to this Form 10-K. ☐
Indicate by check mark whether the registrant is a large accelerated filer, an accelerated filer, a non-accelerated filer, or a smaller reporting company. See definitions of “large accelerated filer,” “accelerated filer” and “smaller reporting company” in Rule 12b-2 of the Exchange Act. (Check one):
|
Large accelerated filer |
☐ |
Accelerated filer |
☐ |
|
|
|
|
|
|
Non-accelerated filer |
☐ (Do not check if a smaller reporting company) |
Smaller reporting company |
☒ |
Indicate by check mark whether the registrant is a shell company (as defined in Rule 12b-2 of the Exchange Act). Yes ☐ No ☒
The aggregate market value of common shares, par value $0.10 per share, held by non-affiliates of the registrant, based on the last sale price of the common shares on June 30, 2016 (the last business day of the registrant’s most recently completed second fiscal quarter), was approximately $22.3 million. For purposes of this computation, all officers, directors and 10% beneficial owners of the registrant are deemed to be affiliates. Such determination should not be deemed an admission that such officers, directors or 10% beneficial owners are, in fact, affiliates of the registrant.
As of March 17, 2017, there were 47,312,231 common shares outstanding.
DOCUMENTS INCORPORATED BY REFERENCE
The information required by Part III of this Annual Report on Form 10-K, to the extent not set forth herein, is incorporated by reference to the registrant’s definitive proxy statement relating to the 2017 Annual Meeting of Shareholders which will be filed with the Securities and Exchange Commission within 120 days after the end of the fiscal year to which this Annual Report on Form 10-K relates.
FORM 10-K
FOR THE FISCAL YEAR ENDED DECEMBER 31, 2016
INDEX
|
|
|
Page |
|
|
|
|
|
Item 1. |
5 |
|
|
Item 1A. |
12 |
|
|
Item 1B. |
21 |
|
|
Item 2. |
22 |
|
|
Item 3. |
37 |
|
|
Item 4. |
38 |
|
|
|
|
|
|
|
|
|
|
Item 5. |
39 |
|
|
Item 6. |
41 |
|
|
Item 7. |
Management’s Discussion and Analysis of Financial Condition and Results of Operations |
42 |
|
Item 7A. |
54 |
|
|
Item 8. |
55 |
|
|
Item 9. |
Changes in and Disagreements With Accountants on Accounting and Financial Disclosure |
55 |
|
Item 9A. |
55 |
|
|
Item 9B. |
56 |
|
|
|
|
|
|
|
|
|
|
Item 10. |
57 |
|
|
Item 11. |
57 |
|
|
Item 12. |
Security Ownership of Certain Beneficial Owners and Management and Related Stockholder Matters |
57 |
|
Item 13. |
Certain Relationships and Related Transactions, and Director Independence |
57 |
|
Item 14. |
57 |
|
|
|
|
|
|
|
|
|
|
Item 15. |
58 |
Certain statements in this Annual Report on Form 10-K constitute “forward-looking statements” within the meaning of applicable U.S. and Canadian securities legislation. Additionally, forward-looking statements may be made orally or in press releases, conferences, reports, on our website or otherwise, in the future, by us or on our behalf. Such statements are generally identifiable by the terminology used such as “plans,” “expects,” “estimates,” “budgets,” “intends,” “anticipates,” “believes,” “projects,” “indicates,” “targets,” “objective,” “could,” “should,” “may” or other similar words.
By their very nature, forward-looking statements require us to make assumptions that may not materialize or that may not be accurate. Forward-looking statements are subject to known and unknown risks and uncertainties and other factors that may cause actual results, levels of activity and achievements to differ materially from those expressed or implied by such statements, including the factors discussed under Item 1A. Risk Factors in this Annual Report on Form 10-K. Such factors include, but are not limited to, the following: our ability to access sufficient capital to fund our operations; fluctuations in and volatility of the market prices for oil and natural gas products; the ability to produce and transport oil and natural gas; the results of exploration and development drilling and related activities; global economic conditions, particularly in the countries in which we carry on business, especially economic slowdowns; actions by governmental authorities including increases in taxes, legislative and regulatory initiatives related to fracture stimulation activities, changes in environmental and other regulations, and renegotiations of contracts; political uncertainty, including actions by insurgent groups or other conflicts; the negotiation and closing of material contracts or sale of assets; future capital requirements and the availability of financing; estimates and economic assumptions used in connection with our acquisitions; risks associated with drilling, operating and decommissioning wells; actions of third-party co-owners of interests in properties in which we also own an interest; our ability to effectively integrate companies and properties that we acquire; and the other factors discussed in other documents that we file with or furnish to the U.S. Securities and Exchange Commission (the “SEC”) and Canadian securities regulatory authorities. The impact of any one factor on a particular forward-looking statement is not determinable with certainty as such factors are interdependent upon other factors and our course of action would depend upon our assessment of the future, considering all information then available. In that regard, any statements as to: future oil or natural gas production levels; capital expenditures; asset sales; the allocation of capital expenditures to exploration and development activities; sources of funding for our capital expenditure programs or operations; drilling of new wells; demand for oil and natural gas products; expenditures and allowances relating to environmental matters; dates by which certain areas will be developed or will come on-stream; expected finding and development costs; future production rates; ultimate recoverability of reserves, including the ability to convert probable and possible reserves to proved reserves; dates by which transactions are expected to close; future cash flows, uses of cash flows, collectability of receivables and availability of trade credit; expected operating costs; changes in any of the foregoing and other statements using forward-looking terminology are forward-looking statements, and there can be no assurance that the expectations conveyed by such forward-looking statements will, in fact, be realized.
Although we believe that the expectations conveyed by the forward-looking statements are reasonable based on information available to us on the date such forward-looking statements were made, no assurances can be given as to future results, levels of activity, achievements or financial condition.
Readers should not place undue reliance on any forward-looking statement and should recognize that the statements are predictions of future results, which may not occur as anticipated. Actual results could differ materially from those anticipated in the forward-looking statements and from historical results, due to the risks and uncertainties described above, as well as others not now anticipated. The foregoing statements are not exclusive and further information concerning us, including factors that potentially could materially affect our financial results, may emerge from time to time. We do not intend to update forward-looking statements to reflect actual results or changes in factors or assumptions affecting such forward-looking statements, except as required by law.
Glossary of Selected Oil and Natural Gas Terms
The following are abbreviations and definitions of terms commonly used in the oil and natural gas industry and this Annual Report on Form 10-K.
2D seismic. Geophysical data that depict the subsurface strata in two dimensions.
3D seismic. Geophysical data that depict the subsurface strata in three dimensions. 3D seismic typically provides a more detailed and accurate interpretation of the subsurface strata than 2D seismic.
Appraisal wells. Wells drilled to convert an area or sub-region from the resource to the reserves category.
Bbl. One stock tank barrel, or 42 U.S. gallons liquid volume, used in reference to oil or other liquid hydrocarbons.
i
Bbl/d. Barrels of oil per day.
Bcf. One billion cubic feet of natural gas.
Boe. Barrels of oil equivalent. Boe is not included in the DeGolyer and MacNaughton reserves report and is derived by the Company by converting natural gas to oil in the ratio of six Mcf of natural gas to one Bbl of oil. The conversion factor is the current convention used by many oil and natural gas companies. Boe may be misleading, particularly if used in isolation. A Boe conversion ratio of six Mcf to one Bbl is based on an energy equivalency conversion method primarily applicable at the burner tip and does not represent a value equivalency at the wellhead.
Boepd. Barrels of oil equivalent per day.
Commercial well; commercially productive well. An oil and natural gas well which produces oil and natural gas in sufficient quantities such that proceeds from the sale of such production exceed production expenses and taxes.
Completion. The installation of permanent equipment for the production of oil or natural gas or, in the case of a dry hole, the reporting of abandonment to the appropriate agency.
Developed acreage. The number of acres which are allocated or assignable to producing wells or wells capable of production.
Development well. A well drilled within the proved area of an oil or natural gas reservoir to the depth of a stratigraphic horizon known to be productive.
Directional drilling. The technique of drilling a well while varying the angle of direction of a well and changing the direction of a well to hit a specific target.
Dry hole; dry well. A well found to be incapable of producing either oil or natural gas in sufficient quantities to justify completion as an oil or natural gas well.
Exploitation. The continuing development of a known producing formation in a previously discovered field, including efforts to maximize the ultimate recovery of oil or natural gas from the field by development wells, secondary recovery equipment or other suitable processes and technology.
Exploratory well. A well drilled to find a new field or to find a new reservoir in a field previously found to be productive of oil or natural gas in another reservoir. Generally, an exploratory well is any well that is not a development well.
Farm-in or farm-out. An assignment of an interest in a drilling location and related acreage conditional upon the drilling of a well on that location, the completion of other work commitments related to that acreage, or some combination thereof.
Formation. A succession of sedimentary beds that were deposited under the same general geologic conditions.
Frac; fracture stimulation. A stimulation treatment involving the fracturing of a reservoir and then injecting water, sand and chemicals into the fractures under pressure to stimulate hydrocarbon production in low-permeability reservoirs.
Gross acres or gross wells. The total acres or wells, as the case may be, in which a working interest is owned.
Horizontal drilling. A technique used in certain formations where a well is drilled vertically to a certain depth and then drilled at a right angle with a specified interval.
Initial production rate. Generally, the maximum 24-hour production volume from a well.
Mbbl. One thousand stock tank barrels.
Mboe. One thousand barrels of oil equivalent.
Mboepd. One thousand barrels of oil equivalent per day.
Mcf. One thousand cubic feet of natural gas.
ii
Mcf/d. One thousand cubic feet of natural gas per day.
Mmbbl. One million stock tank barrels.
Mmboe. One million barrels of oil equivalent.
Mmcf. One million cubic feet of natural gas.
Mmcf/d. One million cubic feet of natural gas per day.
Net acres or net wells. The sum of the fractional working interests owned in gross acres or gross wells.
Overriding royalty interest. An interest in an oil or natural gas property entitling the owner to a share of oil and natural gas production free of costs of production.
Play. A term applied to a portion of the exploration and production cycle following the identification by geologists and geophysicists of areas with potential oil and natural gas reserves.
Present value of estimated future net revenues or PV-10. The present value of estimated future net revenues is an estimate of future net revenues from a property at the date indicated, without giving effect to derivative financial instrument activities, after deducting production and ad valorem taxes, future capital costs, abandonment costs and operating expenses, but before deducting future federal income taxes. The future net revenues have been discounted at an annual rate of 10% to determine their “present value.” The present value is shown to indicate the effect of time on the value of the net revenue stream and should not be construed as being the fair market value of the properties. Estimates have been made using constant oil and natural gas prices and operating and capital costs at the date indicated, at its acquisition date, or as otherwise indicated. We believe that the present value of estimated future net revenues before income taxes, while not a financial measure in accordance with U.S. generally accepted accounting principles (“U.S. GAAP”), is an important financial measure used by investors and independent oil and natural gas producers for evaluating the relative significance of oil and natural gas properties and acquisitions because the tax characteristics of comparable companies can differ materially.
Productive well. A productive well is a well that is not a dry well.
Proved developed reserves. Developed oil and natural gas reserves are reserves of any category that can be expected to be recovered: (i) through existing wells with existing equipment and operating methods or in which the cost of the required equipment is relatively minor compared to the cost of a new well and (ii) through installed extraction equipment and infrastructure operational at the time of the reserves estimate.
Proved reserves. Those quantities of oil and natural gas, which, by analysis of geoscience and engineering data, can be estimated with reasonable certainty to be economically producible, from a given date forward, from known reservoirs, and under existing economic conditions, operating methods, and government regulations, prior to the time at which contracts providing the right to operate expire, unless evidence indicates that renewal is reasonably certain, regardless of whether deterministic or probabilistic methods are used for the estimation. The project to extract the hydrocarbons must have commenced or the operator must be reasonably certain that it will commence the project within a reasonable time.
The area of the reservoir considered as proved includes: (i) the area identified by drilling and limited by fluid contacts, if any, and (ii) adjacent undrilled portions of the reservoir that can, with reasonable certainty, be judged to be continuous with it and to contain economically producible oil or natural gas on the basis of available geoscience and engineering data.
In the absence of data on fluid contacts, proved quantities in a reservoir are limited by the lowest known hydrocarbons as seen in a well penetration unless geoscience, engineering, or performance data and reliable technology establishes a lower contact with reasonable certainty. Where direct observation from well penetrations has defined a highest known oil elevation and the potential exists for an associated gas cap, proved oil reserves may be assigned in the structurally higher portions of the reservoir only if geoscience, engineering, or performance data and reliable technology establish the higher contact with reasonable certainty.
Reserves which can be produced economically through application of improved recovery techniques (including, but not limited to, fluid injection) are included in the proved classification when: (i) successful testing by a pilot project in an area of the reservoir with properties no more favorable than in the reservoir as a whole, the operation of an installed program in the reservoir or an analogous reservoir, or other evidence using reliable technology establishes the reasonable certainty of the engineering analysis on which the project or program was based and (ii) the project has been approved for development by all necessary parties and entities, including governmental entities.
iii
Existing economic conditions include prices and costs at which economic producibility from a reservoir is to be determined. The price shall be the average price during the twelve month period prior to the ending date of the period covered by the report, determined as an unweighted arithmetic average of the first-day-of-the-month price for each month within such period, unless prices are defined by contractual arrangements, excluding escalations based upon future conditions.
Proved undeveloped reserves. Reserves of any category that are expected to be recovered from new wells on undrilled acreage or from existing wells where a relatively major expenditure is required for recompletion.
Reserves on undrilled acreage shall be limited to those directly offsetting development spacing areas that are reasonably certain of production when drilled, unless evidence using reliable technology exists that establishes reasonable certainty of economic producibility at greater distances. Undrilled locations can be classified as having undeveloped reserves only if a development plan has been adopted indicating that they are scheduled to be drilled within five years, unless the specific circumstances justify a longer time.
Undrilled locations can be classified as having proved undeveloped reserves only if a development plan has been adopted indicating that they are scheduled to be drilled within five years, unless the specific circumstances justify a longer time.
Under no circumstances shall estimates for undeveloped reserves be attributable to any acreage for which an application of fluid injection or other improved recovery technique is contemplated, unless such techniques have been proved effective by actual projects in the same reservoir or an analogous reservoir or by other evidence using reliable technology establishing reasonable certainty.
Reasonable certainty. If deterministic methods are used, reasonable certainty means a high degree of confidence that the quantities will be recovered. If probabilistic methods are used, there should be at least a 90% probability that the quantities actually recovered will equal or exceed the estimate. A high degree of confidence exists if the quantity is much more likely to be achieved than not and, as changes due to increased availability of geoscience (geological, geophysical, and geochemical), engineering, and economic data are made to estimated ultimate recovery (“EUR”) with time, reasonably certain EUR is much more likely to increase or remain constant than to decrease.
Recompletion. An operation within an existing well bore to make the well produce oil or natural gas from a different, separately producible zone other than the zone from which the well had been producing.
Reservoir. A porous and permeable underground formation containing a natural accumulation of producible oil and/or natural gas that is confined by impermeable rock or water barriers and is individual and separate from other reservoirs.
Sales volumes. The amount of production of oil or natural gas sold after deducting royalties and working interests owned by third parties.
Shale. Fine-grained sedimentary rock composed mostly of consolidated clay or mud. Shale is one of the most frequently occurring sedimentary rocks.
Standardized measure of discounted future net cash flows or the Standardized Measure. Under the Standardized Measure, future cash flows for the years ended December 31, 2016, 2015 and 2014 are estimated by applying the simple average spot prices for the trailing twelve month period using the first day of each month beginning on January 1 and ending on December 1 of each respective year, adjusted for fixed and determinable escalations, to the estimated future production of year-end proved reserves. Future cash inflows are reduced by estimated future production and development costs based on period-end and future plugging and abandonment costs to determine pre-tax cash inflows. Future income taxes are computed by applying the statutory tax rate to the excess of pre-tax cash inflows over our tax basis in the associated properties. Future net cash inflows after income taxes are discounted using a 10% annual discount rate to arrive at the Standardized Measure.
Tcf. One trillion cubic feet of natural gas.
Undeveloped acreage. License or lease acreage on which wells have not been drilled or completed to a point that would permit the production of commercial quantities of oil and natural gas regardless of whether such acreage contains proved reserves.
Wellhead production. The volume of oil or natural gas produced after deducting royalties and working interests owned by third parties prior to any oil and natural gas lost or used from wellhead to market.
Working interest (“WI”). The operating interest that gives the owner the right to drill, produce and conduct activities on the property and a share of production.
iv
In this Annual Report on Form 10-K, references to “we,” “us,” “our,” or the “Company” refer to TransAtlantic Petroleum Ltd. and its subsidiaries on a consolidated basis. Unless stated otherwise, all sums of money stated in this Annual Report on Form 10-K are expressed in U.S. Dollars.
As of December 31, 2016, we held for sale the ownership interests in our subsidiary Thrace Basin Natural Gas (Turkiye) Corporation (“TBNG”). We completed the sale of TBNG in February 2017. In this Annual Report on Form 10-K, except as set forth in Management’s Discussion and Analysis of Financial Condition and Results of Operations, all references to our reserves, wells, production, and acreage in Turkey excludes the reserves, wells, production and acreage of TBNG.
Our Business
We are an international oil and natural gas company engaged in acquisition, exploration, development and production. We have focused our operations in countries that have established, yet underexplored, petroleum systems, are net importers of petroleum, have an existing petroleum transportation infrastructure and provide favorable commodity pricing, royalty rates and tax rates to exploration and production companies. As of December 31, 2016, excluding TBNG, we held interests in approximately 395,000 and 165,000 net acres of developed and undeveloped oil and natural gas properties in Turkey and Bulgaria, respectively, and an operated interest in a joint venture in Albania. As of March 17, 2017, approximately 47% of our outstanding common shares were beneficially owned by N. Malone Mitchell 3rd, the chairman of our board of directors and our chief executive officer.
Based on the reserves report prepared by DeGolyer and MacNaughton, independent petroleum engineers, our estimated proved reserves at December 31, 2016 in Turkey, excluding TBNG, were approximately 13,599 Mboe, of which 93.6% was oil. Of these estimated proved reserves, 39.4% were proved developed reserves. As of December 31, 2016, the Standardized Measure and PV-10 of our proved reserves in Turkey, excluding TBNG, were $126.5 million and $137.5 million, respectively. See “Item 2. Properties—Value of Proved Reserves” for a reconciliation of PV-10 to the Standardized Measure.
Recent Developments
Sale of TBNG. On February 24, 2017, we sold TBNG for gross proceeds of $20.9 million, and approximate net cash proceeds of $16.3 million, effective as of March 31, 2016. The purchase price is subject to post-closing adjustments, and we agreed to escrow $3.1 million of the purchase price for 30 days to satisfy any agreed upon purchase price adjustments.
We used $2.7 million of the net proceeds from the sale to pay off our promissory note (as amended, the “Note”) with ANBE Holdings, L.P., (“ANBE”) an entity owned by the adult children of our chairman and chief executive officer, N. Malone Mitchell, 3rd, and controlled by an entity managed by Mr. Mitchell and his wife. Pursuant to the terms of the Note, we were required to repay it in full within five business days from the closing of the sale of TBNG.
Optional Redemption of 2017 Notes. On January 1, 2017 (the “Redemption Date”), we effected an optional redemption of $4.3 million in aggregate principal amount of our outstanding 13.0% Convertible Notes due 2017 (the “2017 Notes”) at a cash redemption price equal to 100% of the principal amount thereof plus accrued and unpaid interest thereon to the Redemption Date. After the optional redemption, we had $10.0 million of 2017 Notes outstanding.
Our Properties and Operations
Summary of Geographic Areas of Operations
The following table shows net reserves information as of December 31, 2016:
|
|
|
|
|
|
Proved |
|
|
|
|
|
|
|
|
|
|
|
|
|
|
|
|
Proved Developed |
|
|
Undeveloped |
|
|
Total Proved |
|
|
Probable Reserves |
|
|
Possible Reserves |
|
|||||
|
|
Reserves (Mboe) |
|
|
Reserves (Mboe) |
|
|
Reserves (Mboe) |
|
|
(Mboe) |
|
|
(Mboe) |
|
|||||
|
Turkey |
|
5,353 |
|
|
|
8,246 |
|
|
|
13,599 |
|
|
|
12,069 |
|
|
|
20,393 |
|
|
Albania |
|
47 |
|
|
|
240 |
|
|
|
287 |
|
|
|
788 |
|
|
|
1,314 |
|
|
TBNG |
|
643 |
|
|
|
867 |
|
|
|
1,510 |
|
|
|
2,776 |
|
|
|
2,943 |
|
5
The following summary excludes TBNG:
As of December 31, 2016, we held interests in 11 onshore and offshore exploration licenses and 25 onshore production leases covering a total of approximately 507,000 gross acres (395,000 net acres) in Turkey. As of December 31, 2016, we had total net proved reserves of 12,730 Mbbl of oil and 5,212 Mmcf of natural gas, net probable reserves of 11,519 Mbbl of oil and 3,300 Mmcf of natural gas and net possible reserves of 11,579 Mbbl of oil and 52,881 Mmcf of natural gas in Turkey. During 2016, our average wellhead production was approximately 4,411 net Boepd of oil and natural gas in Turkey. See below for further discussion of our current and planned 2017 operations. The following summarizes our core producing properties in Turkey:
Southeastern Turkey. During 2016, substantially all of our oil production was concentrated in Southeastern Turkey, primarily in the Arpatepe, Bahar, Goksu and Selmo oil fields. These fields are located southwest of the Turkish portion of the North Arabian Basin. The North Arabian Basin includes prolific oil trends that extend from Iran and Iraq into Turkey.
We hold a 100% working interest in the Selmo production lease, which expires in June 2025. The Selmo oil field is the second largest oil field in Turkey in terms of historical cumulative production and is responsible for a large portion of our current crude oil production. We expanded our waterflood program and executed several low-cost production optimizations in the Selmo field in 2016. We believe secondary recovery will continue to increase production recovery from the field. For 2016, our net wellhead production of crude oil from the Selmo field was 735,562 Bbls at an average rate of approximately 2,010 Bbl/d. Turkiye Petrolleri Anonim Ortakligi (“TPAO”), a Turkish government-owned oil and natural gas company, and Türkiye Petrol Rafinerileri A.Ş. (“TUPRAS”), a privately-owned oil refinery in Turkey, purchase all of our crude oil production from the Selmo oil field, which is transported by truck to their neighboring facilities. At December 31, 2016, we had 53 gross and net producing wells in the Selmo oil field.
We hold a 100% working interest in each of our two Molla exploration licenses and one Molla production license, which contain the Goksu and Bahar oil fields. In the Molla licenses, we target Bedinan, Dadas, Hazro and Mardin formations, which produce on the licenses. For 2016, our wellhead production of crude oil from the Molla licenses was 584,047 Bbls at an average rate of approximately 1,596 Bbl/d. At December 31, 2016, we had eight gross and net producing wells on the Molla licenses.
We hold a 50% working interest in our Arpatepe production lease. For 2016, our wellhead production of crude oil from the Arpatepe field was 54,036 Bbls at an average rate of approximately 148 Bbl/d. At December 31, 2016, we had six gross (three net) producing wells on the Arpatepe production lease. We have operated the Arpatepe production lease since December 2015.
We hold a 50% working interest in the Bakuk production license. For 2016, our production was shut in.
Northwestern Turkey. Substantially all of our natural gas production is concentrated in the Thrace Basin, which is one of Turkey’s most productive onshore natural gas regions. It is located in northwestern Turkey near Istanbul. For 2016, our net wellhead production was 449 Mmcf at an average rate of approximately 1.2 Mmcf/d.
Bulgaria
As of December 31, 2016, we held interests in one production concession covering a total of approximately 165,000 net undeveloped acres in Bulgaria. During 2016, we had no production or reserves in Bulgaria. See below for further discussion of our planned 2017 operations.
Albania
As of December 31, 2016, we owned a 25% interest in one onshore gas field through a joint venture.
Current Operations
As of March 17, 2017, our year-to-date net wellhead production in Turkey was of approximately 3,630 Bbl/d, primarily from Selmo, Arpatepe and Molla, and approximately 5.2 Mmcf/d of natural gas, primarily from the Thrace Basin.
In January 2017, we spud the Bahar-11H well in the Bahar field in Southeastern Turkey. Drilling is ongoing, and we expect this to be completed in the Bahar structure. We expect to start completion operations in the second quarter of 2017. We have also continued construction of an enhanced production facility in the Bahar field and the electrification of the field via natural gas powered generators. We expect this project to be fully completed late in the first quarter of 2017. In the Selmo field in Southeastern Turkey, we have continued with low cost workovers and facility enhancements.
6
We expect our net field capital expenditures for 2017 to range between $25.0 million and $35.0 million. We expect net field capital expenditures during 2017 to include approximately $24.0 million of drilling and completion expense for between five and six gross wells, between $3.0 million and $4.5 million for 3D seismic, and $1.0 million in infrastructure improvements and other capital investments in Southeast Turkey. Most of the remaining 2017 expenditures are expected to be invested in our Selmo, Bahar and Molla areas of Southeast Turkey and the Koynare license in Bulgaria. We expect cash on hand and cash flow from operations will be sufficient to fund our 2017 net field capital expenditures. If not, we will either curtail our discretionary capital expenditures or seek other funding sources. Our projected 2017 capital expenditure budget is subject to change.
Principal Markets
In accordance with the Financial Accounting Standards Board (“FASB”) Accounting Standards Codification (“ASC”) 280, Segment Reporting (“ASC 280”), we had two reportable geographic segments during 2016: Turkey and Bulgaria. For financial information about our operating segments and geographic areas, refer to “Note 12—Segment information” to our consolidated financial statements.
Customers
Oil. During 2016, 93.3% of our oil production, which is U.S. Dollar indexed, was concentrated in the Selmo and Bahar oil fields in Turkey. TUPRAS purchases the majority of our oil production. During 2016, we sold $52.2 million of oil to TUPRAS, representing approximately 76.1% of our total revenues. We sell all of our Southeastern Turkey oil to TUPRAS pursuant to a domestic crude oil purchase and sale agreement. Under the purchase and sale agreement, TUPRAS purchases oil produced by us and delivered to our Boru Hatlari ile Petrol Tasima A.S. (“BOTAŞ”) Batman tanks and to the BOTAŞ Dörtyol plant. The price of the oil delivered pursuant to the purchase and sale agreement is determined under the Petroleum Market Law No. 5015 under the laws of the Republic of Turkey. The purchase and sale agreement automatically renews for successive one-year terms unless earlier terminated in writing by either party. All payments for our oil production made by TUPRAS for the past eight years have been in full and on time. No other purchasers of our oil accounted for more than 10% of our total revenues.
Natural Gas. During 2016, no purchasers of our natural gas production, which is indexed on the New Turkish Lira (“TRY”), accounted for 10% or more of our total revenues.
Competition
We operate in the highly competitive areas of oil and natural gas exploration, development, production and acquisition with a number of other companies, including U.S.-based and international companies doing business in each of the countries in which we operate. We face competition from both major and other independent oil and natural gas companies in each of the following areas seeking oil and natural gas exploration licenses and production licenses and leases and acquiring desirable producing properties or new leases for future exploration.
Many of our competitors have substantially greater financial, managerial, technological and other resources than we do. To the extent competitors are able to pay more for properties than we are paying, we will be at a competitive disadvantage. Further, many of our competitors enjoy technological advantages over us and may be able to implement new technologies more rapidly than we can. Our ability to explore for and produce oil and natural gas prospects and to acquire additional properties in the future will depend upon our ability to successfully conduct operations, implement advanced technologies, evaluate and select suitable properties and consummate transactions in this highly competitive environment.
Fracture Stimulation Program
Oil and natural gas may be recovered from our properties through the use of fracture stimulation combined with modern drilling and completion techniques. Fracture stimulation involves the injection of water, sand and chemicals under pressure into formations to fracture the surrounding rock and stimulate production. We have successfully utilized fracture stimulation in our Thrace Basin, Molla and Selmo licenses and production leases.
7
For unconventional reservoirs, including the Mezardere formation in the Thrace Basin, a typical fracture stimulation consists of injecting between 20,000 and 100,000 gallons of fluid that contain between 10,000 and 150,000 pounds of sand per stage. Fluids vary depending on formation and treatment objective but, in general, are either slickwater (fresh water with salt and friction reducer) or a gelled fluid containing organic polymers with a 4% potassium chloride solution and required breakers. Fracture stimulations in Molla are conducted in a low permeability reservoir. These stimulations generally consist of injecting between 20,000 and 100,000 gallons of fluid that contain between 10,000 and 100,000 pounds of sand per stage. Fluids are generally a mixture of slickwater and gells, which is typical in stimulation. The size of fracture stimulation treatments is dependent on net pay thickness and the proximity of the hydrocarbon zones of interest to water bearing zones.
Although the cost of each well will vary, on average approximately 15% to 30% of the total cost of completing a well at Selmo is associated with stimulation activities. We account for these costs as typical drilling and completion costs and include them in our capital expenditure budget.
We diligently review best practices and industry standards in connection with fracture stimulation activities and strive to comply with all regulatory requirements in the protection of potable water sources. Protective practices include, but are not limited to, setting multiple strings of protection pipe across potable water sources, cementing surface casing from setting depth to surface and second string from setting depth up into the surface casing and, in some cases, to surface, continuously monitoring the fracture stimulation process in real time and disposing of all non-commercially produced fluids in certified disposal wells at depths below the potable water sources or at a certified water treatment plant. In Southeast Turkey, the base of potable water is generally 3,000 feet to 8,000 feet above the hydrocarbon zones. There have not been any incidents, citations or suits involving environmental concerns related to our fracture stimulation operations on our properties.
In the Thrace Basin, Selmo and Molla, we have access to water resources which we believe will be adequate to execute any stimulation activities that we may perform in the future. We also employ procedures for environmentally friendly disposal of fluids recovered from fracture stimulation, including recycling approximately 50% of these fluids.
For more information on the risks of fracture stimulation, please read “Item 1A. Risk Factors—Risks Related to the Oil and Natural Gas Industry—Our oil and natural gas operations are subject to extensive and complex laws and government regulation in the jurisdictions in which we operate and compliance with existing and future laws may increase our costs or impair our operations” and “Item 1A. Risk Factors—Risks Related to the Oil and Natural Gas Industry—Legislative and regulatory initiatives and increased public scrutiny relating to fracture stimulation activities could result in increased costs and additional operating restrictions or delays.”
Governmental Regulations
Government Regulations. Our current or future operations, including exploration and development activities on our properties, require permits from various governmental authorities, and such operations are and will be governed by laws and regulations concerning exploration, development, production, exports, taxes, labor laws and standards, occupational health, waste disposal, toxic substances, land use, environmental protection and other matters. Compliance with these requirements may prove to be difficult and expensive. Due to our international operations, we are subject to the following issues and uncertainties that can affect our operations adversely:
|
|
• |
the risk of expropriation, nationalization, war, revolution, political instability, border disputes, renegotiation or modification of existing contracts, and import, export and transportation regulations and tariffs; |
|
|
• |
laws of foreign governments affecting our ability to fracture stimulate oil or natural gas wells, such as the legislation enacted in Bulgaria in January 2012; |
|
|
• |
the risk of not being able to procure residency and work permits for our expatriate personnel; |
|
|
• |
taxation policies, including royalty and tax increases and retroactive tax claims; |
|
|
• |
exchange controls, currency fluctuations and other uncertainties arising out of foreign government sovereignty over international operations; |
|
|
• |
laws and policies of the United States affecting foreign trade, taxation and investment, including anti-bribery and anti-corruption laws; |
|
|
• |
the possibility of being subjected to the exclusive jurisdiction of foreign courts in connection with legal disputes and the possible inability to subject foreign persons to the jurisdiction of courts in the United States; and |
|
|
• |
the possibility of restrictions on repatriation of earnings or capital from foreign countries. |
8
Permits and Licenses. In order to carry out exploration and development of oil and natural gas interests or to place these into commercial production, we may require certain licenses and permits from various governmental authorities. There can be no guarantee that we will be able to obtain all necessary licenses and permits that may be required. In addition, such licenses and permits are subject to change and there can be no assurances that any application to renew any existing licenses or permits will be approved.
Repatriation of Earnings. Currently, there are no prohibitions on the repatriation of earnings or capital to foreign entities from Turkey, Albania or Bulgaria. However, there can be no assurance that any such prohibitions on repatriation of earnings or capital from the aforementioned countries or any other country where we may invest will not be imposed in the future. We may be liable for the payment of taxes upon repatriation of certain earnings from the aforementioned countries.
Environmental. The oil and natural gas industry is subject to extensive and varying environmental regulations in each of the jurisdictions in which we operate. Environmental regulations establish standards respecting health, safety and environmental matters and place restrictions and prohibitions on emissions of various substances produced concurrently with oil and natural gas. In most instances, the regulatory requirements relate to the handling and disposal of drilling and production waste products and waste created by water and air pollution control procedures. These regulations can have an impact on the selection of drilling locations and facilities, and potentially result in increased capital expenditures. In addition, environmental legislation may require those wells and production facilities to be abandoned and sites reclaimed to the satisfaction of local authorities. Such regulation has increased the cost of planning, designing, drilling, operating and, in some instances, abandoning wells. We are committed to complying with environmental and operational legislation wherever we operate.
Such laws and regulations not only expose us to liability for our own negligence, but may also expose us to liability for the conduct of others or for our actions that were in compliance with all applicable laws at the time those actions were taken. We may incur significant costs as a result of environmental accidents, such as oil spills, natural gas leaks, ruptures, or discharges of hazardous materials into the environment, including clean-up costs and fines or penalties. Additionally, we may incur significant costs in order to comply with environmental laws and regulations and may be forced to pay fines or penalties if we do not comply.
There has been a surge in interest among the media, government regulators and private citizens concerning the possible negative environmental and geological effects of fracture stimulation. Some have alleged that fracture stimulation results in the contamination of aquifers and may even contribute to seismic activity. In January 2012, the government of Bulgaria enacted legislation that banned the fracture stimulation of oil and natural gas wells in the Republic of Bulgaria and imposed large monetary penalties on companies that violate that ban. There is a risk that Turkey could at some point impose similar legislation or regulations. Such legislation or regulations could severely impact our ability to drill and complete wells, and could increase the cost of planning, designing, drilling, completing and operating wells. We are committed to complying with legislation and regulations involving fracture stimulation wherever we operate.
Insurance
We currently carry general liability insurance and excess liability insurance, including pollution insurance, with a combined annual limit of $22.0 million per occurrence and $24.0 million in the aggregate. These insurance policies contain maximum policy limits and are subject to customary exclusions and limitations. Our general liability insurance covers us and our subsidiaries for third-party claims and liabilities arising out of lease operations and related activities. The excess liability insurance is in addition to, and is triggered if, the general liability insurance per occurrence limit is reached. We also maintain control of well insurance. Our control of well insurance has a per occurrence and combined single limit of $15.0 million and is subject to deductibles ranging from $100,000 to $150,000 per occurrence. In addition, we carry a political risk policy, which covers our scheduled production facilities in the event of an act of terrorism with an annual limit of $16.8 million. This policy also contains business interruption coverage, with an annual limit of $29.1 million, if one or more of the production facilities lose production due to a political risk event. We will continue to monitor our insurance coverage and will maintain appropriate levels of insurance to satisfy applicable regulations, as well as maintain levels of insurance appropriate for prudent operations within the industry in which we operate.
We require our third-party service providers to sign master service agreements with us pursuant to which they agree to indemnify us for the personal injury and death of the service provider’s employees as well as subcontractors that are hired by the service provider. Similarly, we generally agree to indemnify our third-party service providers against similar claims regarding our employees and our other contractors.
We also require our third-party service providers that perform fracture stimulation operations for us to sign master service agreements containing the indemnification provisions noted above. We do not currently have any insurance policies in effect that are intended to provide coverage for losses solely related to fracture stimulation operations. We believe that our general liability, excess liability and pollution insurance policies would cover third-party claims related to fracture stimulation operations and associated legal expenses, in accordance with, and subject to, the terms of such policies. However, these policies may not cover fines, penalties or costs and expenses related to government-mandated environmental clean-up responsibilities.
9
As a Bermuda exempted company and under current Bermuda law, we are not subject to tax on profits, income or dividends, nor is there any capital gains tax applicable to us in Bermuda. Profits can be accumulated, and it is not obligatory for us to pay dividends.
Furthermore, we have received an assurance from the Minister of Finance of Bermuda under the Exempted Undertakings Tax Protection Act 1966, as amended, that in the event that Bermuda enacts any legislation imposing tax computed on profits, income, any capital asset, gain or appreciation, we and any of our operations or our shares, debentures or other obligations shall be exempt from the imposition of such tax until March 31, 2035, provided that such exemption shall not prevent the application of any tax payable in accordance with the provisions of the Land Tax Act, 1967 or otherwise payable in relation to land in Bermuda leased to us.
We are required to pay an annual government fee (the “AGF”), which is determined on a sliding scale by reference to our authorized share capital and share premium account, with a minimum fee of $1,995 Bermuda Dollars and a maximum fee of $31,120 Bermuda Dollars. The Bermuda Dollar is treated at par with the U.S. Dollar. The AGF is payable each year on or before the end of January and is based on the authorized share capital and share premium account on August 31 of the preceding year.
In Bermuda, stamp duty is not chargeable in respect of the incorporation, registration, licensing of an exempted company or, subject to certain minor exceptions, on their transactions.
Employees
As of December 31, 2016, we employed 169 people in Turkey, including 62 with TBNG, 28 people in Addison, Texas and 6 people in Bulgaria. Approximately 40 of our employees at one of our subsidiaries operating in Turkey were represented by collective bargaining agreements with the Petroleum, Chemical and Rubber Workers Union of Turkey (“PETROL-IS”). Approximately 40 of our employees at another of our subsidiaries operating in Turkey were represented by a separate collective bargaining agreement with PETROL-IS.
Following the sale of TBNG on February 24, 2017, we employed 111 people in Turkey and approximately 40 at one of our subsidiaries operating in Turkey were represented by collective bargaining agreements with PETROL-IS. We consider our employee relations to be satisfactory.
Formation
We were incorporated under the laws of British Columbia, Canada on October 1, 1985 under the name Profco Resources Ltd. and continued to the jurisdiction of Alberta, Canada under the Business Corporations Act (Alberta) on June 10, 1997. Effective December 2, 1998, we changed our name to TransAtlantic Petroleum Corp. Effective October 1, 2009, we continued to the jurisdiction of Bermuda under the Bermuda Companies Act 1981 under the name TransAtlantic Petroleum Ltd.
Available Information
Our annual reports on Form 10-K, quarterly reports on Form 10-Q, current reports on Form 8-K, and amendments to those reports filed or furnished pursuant to Section 13(a) or 15(d) of the Securities Exchange Act of 1934, as amended (the “Exchange Act”), are made available free of charge on our website at www.transatlanticpetroleum.com as soon as reasonably practicable after those reports and other information are electronically filed with or furnished to the SEC.
Our common shares are listed on the NYSE MKT LLC (“NYSE MKT”). Section 110 of the NYSE MKT company guide permits the NYSE MKT to consider the laws, customs and practices of foreign issuers in relaxing certain NYSE MKT listing criteria, and to grant exemptions from NYSE MKT listing criteria based on these considerations. A description of the significant ways in which our governance practices differ from those followed by US domestic companies pursuant to NYSE MKT standards is available on our website, www.transatlanticpetroleum.com, under Corporate Governance page, which is accessible under the About heading on the home page.
10
Executive Officers of the Registrant
The following table and text sets forth certain information with respect to our executive officers as of March 1, 2017:
|
Name |
|
Age |
|
Positions |
|
N. Malone Mitchell 3rd |
|
55 |
|
Chairman and Chief Executive Officer |
|
Todd C. Dutton |
|
63 |
|
President |
|
Christopher R. Elmore |
|
38 |
|
Interim Principal Accounting and Financial Officer |
|
Chad D. Burkhardt |
|
43 |
|
Vice President, General Counsel and Corporate Secretary |
|
Harold “Lee” Muncy |
|
64 |
|
Vice President of Geosciences |
N. Malone Mitchell 3rd has served as our chief executive officer since May 2011, as a director since April 2008 and as our chairman since May 2008. Since 2005, Mr. Mitchell has served as the president of Riata Corporate Group, LLC and Longfellow Energy, LLC, a Dallas-based private oil and natural gas exploration and production company. From June to December 2006, Mr. Mitchell served as president and chief operating officer of SandRidge Energy, Inc. (formerly Riata Energy, Inc.), an independent oil and natural gas company concentrating in exploration, development and production activities. Until he sold his controlling interest in Riata Energy, Inc. in June 2006, Mr. Mitchell also served as president, chief executive officer and chairman of Riata Energy, Inc., which Mr. Mitchell founded in 1985 and built into one of the largest privately held energy companies in the United States.
Todd C. Dutton has served as our president since May 2014. Mr. Dutton has served as president of Longfellow Energy, LP ("Longfellow"), a Dallas, Texas-based independent oil and natural gas exploration and production company owned by the Company's chairman and chief executive officer, N. Malone Mitchell 3rd and his family, since January 2007, where his primary responsibility is to originate and develop oil and natural gas projects. He brings 39 years of experience in the oil and natural gas industry, focusing on exploration, acquisitions and property evaluation. He has served in various supervisory and management roles at Texas Pacific Oil Company, Coquina Oil Corporation, BEREXCO INC. and Riata Energy, Inc. Mr. Dutton earned a B.B.A. in Petroleum Land Management from the University of Oklahoma.
Christopher R. Elmore has served as interim principal accounting and financial officer since September 2016, and as vice president accounting and corporate controller since May 2013. Mr. Elmore previously served as an audit senior manager with KPMG LLP, where he worked for twelve years in positions of increasing responsibility in the Dallas, Texas audit practice and KPMG LLP’s U.S. accounting and reporting groups in Zurich and London. Mr. Elmore holds a B.S. degree in Accounting and Finance from Florida State University and is a certified public accountant.
Chad D. Burkhardt has served as the Company’s vice president, general counsel and corporate secretary since August 2015. From 2008 until August 2015, Mr. Burkhardt served as partner in the corporate department of Baker Botts L.L.P., where he advised clients on various corporate transactions including corporate securities offerings, mergers and acquisitions and various public company filings. Mr. Burkhardt brings significant cross-border and international transaction experience from a variety of industries ranging from oil and gas exploration, midstream, and oil field services to high-tech and start-up transactions. Mr. Burkhardt is a graduate of Texas A&M University and Duke University School of Law.
Harold “Lee” Muncy has served as the Company’s vice president of geosciences since June 2014. Mr. Muncy previously served as vice president, exploration for the Bass Companies, a group of Fort Worth, Texas-based independent oil and natural gas exploration and production companies, where he worked from 2000 to 2012. He brings more than 35 years of geological experience in the oil and natural gas industry, where he has focused on exploration, exploitation and worldwide transactions. He began his career as a geologist with Mobil Oil Corporation and served as exploration manager for Fina Oil & Chemical Company and vice president of exploration and land for TransTexas Gas Corp. Mr. Muncy earned a B.S. and an M.S. in Geology & Mineralogy from The Ohio State University.
11
Risks Related to Our Business
Virtually all of our operations are conducted in Turkey and Bulgaria, and we are subject to political, economic and other risks and uncertainties in these countries.
Virtually all of our international operations are performed in the emerging markets of Turkey and Bulgaria, which may expose us to greater risks than those associated with U.S. or Canadian markets. Due to our foreign operations, we are subject to the following issues and uncertainties that can adversely affect our operations:
|
|
• |
the risk of, and disruptions due to, expropriation, nationalization, war, terrorism, revolution, election outcomes, economic instability, political instability, or border disputes; |
|
|
• |
the uncertainty of local contractual terms, renegotiation or modification of existing contracts and enforcement of contractual terms in disputes before local courts; |
|
|
• |
the risk of import, export and transportation regulations and tariffs, including boycotts and embargoes; |
|
|
• |
the risk of not being able to procure residency and work permits for our expatriate personnel; |
|
|
• |
the requirements or regulations imposed by local governments upon local suppliers or subcontractors, or being imposed in an unexpected and rapid manner; |
|
|
• |
taxation and revenue policies, including royalty and tax increases, retroactive tax claims and the imposition of unexpected taxes or other payments on revenues; |
|
|
• |
exchange controls, currency fluctuations and other uncertainties arising out of foreign government sovereignty over foreign operations; |
|
|
• |
laws and policies of the United States, including the U.S. Foreign Corrupt Practices Act, (“FCPA”) and of the other countries in which we operate affecting foreign trade, taxation and investment, including anti-bribery and anti-corruption laws; |
|
|
• |
our internal control policies may not protect us from reckless and criminal acts committed by our employees or agents, including violations or alleged violations of the FCPA; |
|
|
• |
the possibility of being subjected to the exclusive jurisdiction of foreign courts in connection with legal disputes and the possible inability to subject foreign persons to the jurisdiction of courts in the United States; and |
|
|
• |
the possibility of restrictions on repatriation of earnings or capital from foreign countries. |
To manage these risks, we sometimes form joint ventures and/or strategic partnerships with local private and/or governmental entities. Local partners provide us with local market knowledge. However, there can be no assurance that changes in conditions or regulations in the future will not affect our profitability or ability to operate in such markets.
Acts of violence, terrorist attacks or civil unrest in Turkey and nearby countries could adversely affect our business.
During 2016, we derived substantially all of our revenue from our continuing operations in Turkey and substantially all of our oil production was derived from Southeastern Turkey. Historically, the southeastern area of Turkey and nearby countries such as Iran, Iraq and Syria have occasionally experienced political, social, security and economic problems, terrorist attacks, insurgencies, war and civil unrest. Since December 2010, political instability has increased in a number of countries in the Middle East and North Africa. As a result of the civil war in Syria, hundreds of thousands of Syrian refugees have fled to Turkey and more can be expected to cross the border if the conflict continues. Moreover, tensions continue between Turkey and Syria. More recently, Turkey has experienced terrorist attacks in Istanbul, and in July 2016, there was a failed attempt to overthrow the government of President Recep Tayyip Erdoğan.
The current conflict with the terrorist group Islamic State in Iraq and Syria (“ISIS”), the tension in and involving the Kurdish regions of northern Iraq, which are contiguous to the region where our Southeast Turkey licenses are located, and the aftermath the attempted coup d’etat may have political, social or security implications in Turkey or otherwise have a negative impact on the Turkish economy.
Turkey has also experienced problems with domestic terrorist and ethnic separatist groups. For example, Turkey has been in conflict for many years with the People’s Congress of Kurdistan (formerly known as the PKK), an organization that is listed as a terrorist organization by states and organizations, including Turkey, the European Union and the United States.
12
The potential impact on our business from such events, conditions and conflicts in these countries is uncertain. We may be unable to access the locations where we conduct operations or transport oil to our offtakers in a reliable manner. In those locations where we have employees or operations, we may incur substantial costs to maintain the safety of our personnel and our operations.
We have a history of losses and may not achieve consistent profitability in the future.
We have incurred substantial losses in prior years. During 2016, we generated a net loss from continuing operations of $22.4 million. We will need to generate and sustain increased revenue levels in future periods in order to become consistently profitable, and even if we do, we may not be able to maintain or increase our level of profitability. We may incur losses in the future for a number of reasons, including the risks described herein, unforeseen expenses, difficulties, complications and delays, and other unknown risks.
We depend on the services of our chairman and chief executive officer.
We depend on the performance of Mr. Mitchell, our chairman and chief executive officer. The loss of Mr. Mitchell could negatively impact our ability to execute our strategy. We do not maintain a key person life insurance policy on Mr. Mitchell.
We could lose permits or licenses on certain of our properties in Turkey unless the permits or licenses are extended or we commence production and convert the permits or licenses to production leases or concessions.
At December 31, 2016, of our total net undeveloped acreage, 22.2% and 12.8% will expire during 2017 and 2018, respectively, unless we are able to extend the permits or licenses covering this acreage or commence production on this acreage and convert the permits or licenses into production leases or concessions. If our permits or licenses expire, we will lose our right to explore and develop the related properties. Our drilling plans for these areas are subject to change based upon various factors, including factors that are beyond our control. Such factors include drilling results, oil and natural gas prices, the availability and cost of capital, drilling and production costs, availability of drilling services and equipment, gathering system and pipeline transportation constraints, and regulatory approvals. In addition, if our liquidity continues to be constrained and we are not able to access additional capital, we may be unable to fund the drilling of some or all of our obligation wells, and we could lose some or all of our licenses.
The majority of our oil is sold to one customer, and the loss of this customer could have a material adverse impact on our results of operations.
TUPRAS purchases the majority of our oil production from Turkey, representing 76.1% of our total revenues in 2016. If TUPRAS reduces its oil purchases or fails to purchase our oil production, or there is a material non-payment, our results of operations could be materially and adversely affected. TUPRAS may be subject to its own operating risks that could increase the risk that it could default on its obligations to us. Under Turkish law, TUPRAS is obligated to purchase all of our oil production in Turkey, and we are prohibited from selling any of our oil produced in Turkey to any other customer. Pursuant to a purchase and sale agreement with TUPRAS, the price of oil delivered to TUPRAS is determined under the Petroleum Market Law No. 5015 under the laws of the Republic of Turkey. Changes to Turkish law could adversely affect our business and results of operations.
A significant failure of our computer systems may increase our operating costs or otherwise adversely affect our business.
We depend upon our computer systems to perform accounting and administrative functions as well as manage other aspects of our operations. We maintain normal backup polices with respect to our computer systems and networks. Nevertheless, our computer systems and networks are subject to risks that may cause interruptions in service, including, but not limited to, security breaches, physical damage, power loss, software defects, hacking attempts, computer viruses and malware, lost data and programming and/or human errors. Significant interruptions in service, security breaches or lost data may have a material adverse effect on our business, financial condition or results of operations.
Our indebtedness could adversely affect our financial condition and prevent us from fulfilling our debt service and other obligations.
Our indebtedness could have significant effects on our business. For example, it could:
|
|
• |
make it more difficult for us to satisfy our financial obligations, including with respect to our indebtedness, and any failure to comply with the obligations of any of our debt agreements, including financial and other restrictive covenants, could result in an event of default under the agreements governing our indebtedness; |
|
|
• |
increase our vulnerability to general adverse economic, industry and competitive conditions, especially declines in oil and natural gas prices; |
13
|
|
• |
limit our financial flexibility |
Each of these factors may have a material and adverse effect on our financial condition and viability. Our ability to make payments with respect to our indebtedness and to satisfy any other debt obligations will depend on commodity prices and our future operating performance, which will be affected by prevailing economic conditions and financial, business and other factors affecting our company and industry, many of which are beyond our control.
We could experience labor disputes that could disrupt our business in the future.
As of February 27, 2017, approximately 40 of our employees at one of our subsidiaries operating in Turkey were represented by collective bargaining agreements with PETROL-IS. Potential work disruptions from labor disputes with these employees could disrupt our business and adversely affect our financial condition and results of operations.
We could be assessed for Canadian federal tax as a result of our 2009 continuance under the Bermuda Companies Act 1981.
For Canadian tax purposes, we were deemed, immediately before the completion of our 2009 continuance under the Bermuda Companies Act 1981, to have disposed of each property owned by us for proceeds equal to the fair market value of that property, and will be subject to tax on any resulting net income. In addition, we were required to pay a special “branch tax” equal to 25% of any excess of the fair market value of our property over the “paid-up capital” (as defined in the Income Tax Act (Canada)) of our outstanding common shares and our liabilities. However, management, together with its professional advisors, has determined that the paid-up capital of our common shares and our liabilities exceeded the fair market value of our property, resulting in no “branch tax” being payable. The Canada Revenue Agency (“CRA”) may not accept our determination of the fair market value of our property. In the event that CRA’s determination of fair market value is significantly higher than our valuation and such determination is final, we may be subject to material amounts of tax resulting from the deemed disposition.
Risks Related to the Oil and Natural Gas Industry
Oil and natural gas prices are volatile. Continued or further declines in prices could adversely affect our financial condition, results of operations, cash flows, access to capital, and ability to grow.
Oil and natural gas prices historically have been volatile and may continue to be volatile in the future. Therefore, even if oil prices recover for a period of time, volatility will remain, and prices could move downward or upward on a rapid or repeated basis. The decline since late 2014 in oil and natural gas prices has reduced our revenue, cash flows and access to capital and, unless commodity prices improve, this trend will likely continue or worsen. Lower oil and natural gas prices also potentially reduce the amount of oil and natural gas that we can economically produce resulting in a reduction in the proved oil and natural gas reserves we could recognize. Thus, significant and sustained commodity price reductions could materially and adversely affect our financial condition and results of operations which could impact our ability to maintain or increase our current levels of borrowing, our ability to repay current or future indebtedness, our ability to refinance our current indebtedness or obtain additional capital on attractive terms.
The markets for crude oil and natural gas have historically been, and are likely to continue to be, volatile and subject to wide fluctuations in response to numerous factors, including the following:
|
|
• |
worldwide and domestic supplies of oil and gas, and the productive capacity of the oil and gas industry as a whole; |
|
|
• |
changes in the supply and the level of consumer demand for such fuels; |
|
|
• |
overall global and domestic economic conditions; |
|
|
• |
political conditions in oil, natural gas, and other fuel-producing and fuel-consuming areas; |
|
|
• |
the availability and capacity of gathering, transportation, processing, and/or refining facilities in regional or localized areas that may affect the realized price for crude oil or natural gas; |
|
|
• |
the price and level of imports of crude oil, refined petroleum products, and liquefied natural gas; |
|
|
• |
weather conditions, including effects of weather conditions on prices and supplies in worldwide energy markets; |
|
|
• |
technological advances affecting energy consumption and conservation; |
|
|
• |
the ability of the members of the Organization of Petroleum Exporting Countries and other exporting countries to agree to and maintain crude oil prices and production controls; |
14
|
|
• |
the competitive position of each such fuel as a source of energy as compared to other energy sources; |
|
|
• |
strengthening and weakening of the U.S. Dollar relative to other currencies; and |
|
|
• |
the effect of governmental regulations and taxes on the production, transportation, and sale of oil, natural gas, and other fuels. |
These factors and the volatility of the energy markets make it extremely difficult to predict future oil and gas price movements with any certainty, but in general we expect oil and gas prices to continue to fluctuate significantly.
Reserves estimates depend on many assumptions that may turn out to be inaccurate.
Any material inaccuracies in our reserves estimates or underlying assumptions could materially affect the quantities and present values of our reserves. The process of estimating oil and natural gas reserves is complex. It requires interpretations of available technical data and various assumptions, including assumptions relating to economic factors. Any significant inaccuracies in these interpretations or assumptions could materially affect the estimated quantities and present value of reserves that we may report. In order to prepare these estimates, we must project production rates and timing of development expenditures. We must also analyze available geological, geophysical, production and engineering data, and the extent, quality and reliability of this data can vary. The process also requires economic assumptions relating to matters such as oil and natural gas prices, drilling and operating expenses, capital expenditures, taxes and availability of funds.
Actual future production, oil and natural gas prices, revenues, taxes, development expenditures, operating expenses and quantities of recoverable oil and natural gas reserves most likely will vary from our estimates. Any significant variance could materially affect the estimated quantities and pre-tax net present value of reserves that we may report. In addition, we may adjust estimates of proved, probable and possible reserves to reflect production history, results of exploration and development, prevailing oil and natural gas prices and other factors, many of which are beyond our control. Moreover, there can be no assurance that our reserves will ultimately be produced or that our proved undeveloped, probable and possible reserves will be developed within the periods anticipated. Any significant variance in the assumptions could materially affect the estimated quantity and value of our reserves.
Investors should not assume that the pre-tax net present value of our proved, probable and possible reserves is the current market value of our estimated oil and natural gas reserves. We base the pre-tax net present value of future net cash flows from our proved, probable and possible reserves on prices and costs on the date of the estimate. Actual future prices, costs, and the volume of produced reserves may differ materially from those used in the pre-tax net present value estimate.
Future commodity price declines may result in write-downs of our asset carrying values.
We follow the successful efforts method of accounting for our oil and gas operations. Under this method, all property acquisition costs and costs of exploratory and development wells are capitalized when incurred, pending determination of whether proved reserves have been discovered. If proved reserves are not discovered with an exploratory well, the costs of drilling the well are expensed.
The capitalized costs of our oil and natural gas properties, on a depletion pool basis, cannot exceed the estimated undiscounted future net cash flows of that depletion pool. If net capitalized costs exceed undiscounted future net revenues, we generally must write down the costs of each depletion pool to the estimated fair value (discounted future net cash flows of that depletion pool). Any such charge will not affect our cash flow from operating activities or liquidity, but will reduce our earnings and shareholders’ equity. A decline in oil or natural gas prices from current levels, or other factors, could cause an impairment write-down of capitalized costs and a non-cash charge against future earnings. Once incurred, a write-down of oil and natural gas properties cannot be reversed at a later date, even if oil or natural gas prices increase.
We may be unable to acquire or develop additional reserves, which would reduce our cash flow and income.
In general, production from oil and natural gas properties declines over time as reserves are depleted, with the rate of decline depending on reservoir characteristics. If we are not successful in our exploration and development activities or in acquiring properties containing reserves, our reserves will generally decline as reserves are produced. Our oil and natural gas production is highly dependent upon our access to capital and our ability to economically find, develop or acquire reserves in commercial quantities.
15
To the extent cash flow from operations is reduced, either by a decrease in prevailing prices for oil and natural gas or an increase in finding and development costs, and external sources of capital become limited or unavailable, our ability to make the necessary capital investment to maintain or expand our asset base of oil and natural gas reserves would be impaired. Even with sufficient available capital, our future exploration and development activities may not result in additional reserves, and we might not be able to drill productive wells at acceptable costs.
Our future exploration, development and production activities may not be profitable or achieve our expected returns.
The long-term performance of our business depends upon our ability to identify, acquire and develop additional oil and natural gas reserves that are economically recoverable. Future success depends upon our ability to acquire working and revenue interests in properties upon which oil and natural gas reserves are ultimately discovered in commercial quantities, and the ability to develop prospects that contain additional proven oil and natural gas reserves to the point of production. Without successful acquisition and exploration activities, we will not be able to develop additional oil and natural gas reserves or generate additional revenues. There are no assurances that additional oil and natural gas reserves will be identified or acquired on acceptable terms, or that oil and natural gas reserves will be discovered in sufficient quantities to enable us to recover our exploration and development costs or sustain our business.
The successful acquisition and development of oil and natural gas properties requires an assessment of recoverable reserves, future oil and natural gas prices and operating costs, potential environmental and other liabilities, and other factors. Such assessments are inherently uncertain. In addition, no assurance can be given that our exploration and development activities will result in the discovery of additional reserves. Operations may be curtailed, delayed or canceled as a result of lack of adequate capital and other factors, such as lack of availability of rigs and other equipment, title problems, weather, compliance with governmental regulations or price controls, mechanical difficulties, or unusual or unexpected formations, pressures and/or work interruptions. In addition, the costs of exploration and development may materially exceed our internal estimates.
Drilling for and producing oil and natural gas are high-risk activities with many uncertainties that could adversely affect our business, financial condition or results of operations.
Our long-term success depends on the success of our exploration, development and production activities in each of our prospects. These activities are subject to numerous risks beyond our control, including the risk that we will be unable to economically produce our reserves or be able to find commercially productive oil or natural gas reservoirs. Our decisions to purchase, explore, develop or otherwise exploit prospects or properties will depend in part on the evaluation of data obtained through geophysical and geological analyses, production data and engineering studies, the results of which are often inconclusive or subject to varying interpretations. The cost of drilling, completing and operating wells is often uncertain before drilling commences. Overruns in budgeted expenditures are common risks that can make a particular project unprofitable. Further, many factors may curtail, delay or prevent drilling operations, including:
|
|
• |
unexpected drilling conditions; |
|
|
• |
pressure or irregularities in geological formations; |
|
|
• |
equipment failures or accidents; |
|
|
• |
pipeline and processing interruptions or unavailability; |
|
|
• |
title problems; |
|
|
• |
adverse weather conditions; |
|
|
• |
lack of market demand for oil and natural gas; |
|
|
• |
delays imposed by, or resulting from, compliance with environmental laws and other regulatory requirements; |
|
|
• |
declines in oil and natural gas prices; and |
|
|
• |
shortages or delays in the availability of drilling rigs, equipment and qualified personnel. |
Our future drilling activities might not be successful, and drilling success rates overall or within a particular area could decline. We could incur losses by drilling unproductive wells. Shut-in wells, curtailed production and other production interruptions may materially adversely affect our business, financial condition and results of operations.
16
The development of proved undeveloped reserves is uncertain. In addition, there are no assurances that our probable and possible reserves will be converted to proved reserves.
At December 31, 2016, approximately 60.6% of our total estimated net proved reserves in Turkey, excluding TBNG, were proved undeveloped reserves. Undeveloped reserves, by their nature, are significantly less certain than developed reserves. At December 31, 2016, we also had a significant amount of unproved reserves, which consist of probable and possible reserves. There is significant uncertainty attached to unproved reserves estimates. The discovery, determination and exploitation of undeveloped or unproved reserves requires significant capital expenditures and successful drilling and exploration programs. We do not currently have the funds available to develop our undeveloped reserves. We may not be able to raise the additional capital that we need to develop these reserves. There is no certainty that we will be able to convert undeveloped reserves to developed reserves or unproved reserves into proved reserves or that our undeveloped or unproved reserves will be economically viable or technically feasible to produce.
Legislative and regulatory initiatives and increased public scrutiny relating to fracture simulation activities could result in increased costs and additional operating restrictions or delays.
Fracture stimulation is an important and commonly used process for the completion of oil and natural gas wells and involves the pressurized injection of water, sand and chemicals into rock formations to stimulate production. Recently, there has been increased public concern regarding the potential environmental impact of fracture stimulation activities. Most of these concerns have raised questions regarding the drilling fluids used in the fracturing process, their effect on drinking water supplies, the use of water in connection with completion operations, and the potential for impact to surface water, groundwater and the environment generally.
The increased attention regarding fracture stimulation could lead to greater opposition, including litigation, to oil and natural gas production activities using fracture stimulation techniques. Increased public scrutiny may also lead to additional levels of regulation in the countries in which we operate that could cause operational restrictions or delays, make it more difficult to perform fracture stimulation or could increase our costs of compliance and doing business. Additional legislation or regulation, such as a requirement to disclose the chemicals used in fracture stimulation, could make it easier for third parties opposing fracture stimulation to initiate legal proceedings based on allegations that specific chemicals used in the fracturing process could adversely affect groundwater. A substantial portion of our operations rely on fracture stimulation, and the adoption of legislation in Bulgaria have placed restrictions on our fracture stimulation activities, causing us to suspend our fracture stimulation activities in Bulgaria. The adoption of legislative or regulatory initiatives in Turkey restricting fracture stimulation could impose operational delays, increased operations costs and additional related burdens on our exploration and production activities which could suspend or make it more difficult to perform fracture stimulation, cause a material decrease in the drilling of new wells and related completion activities and increase our costs of compliance and doing business, which could materially impact our business and profitability.
We are subject to operating hazards.
The oil and natural gas exploration and production business involves a variety of operating risks, including the risk of fire, explosion, blowout, pipe failure, casing collapse, stuck tools, uncontrollable flows of oil or natural gas, abnormally pressured formations and environmental hazards such as oil spills, surface cratering, natural gas leaks, pipeline ruptures, discharges of toxic gases, underground migration, surface spills, mishandling of fracture stimulation fluids, including chemical additives, and natural disasters. The occurrence of any of these events could result in substantial losses to us due to injury and loss of life, loss of or damage to well bores and/or drilling or production equipment, costs of overcoming downhole problems, severe damage to and destruction of property, natural resources and equipment, pollution and other environmental damage, clean-up responsibilities, regulatory investigation and penalties and suspension of operations. Gathering systems and processing facilities are subject to many of the same hazards and any significant problems related to those facilities could adversely affect our ability to market our production.
Our oil and natural gas operations are subject to extensive and complex laws and government regulation in the jurisdictions in which we operate and compliance with existing and future laws may increase our costs or impair our operations.
Our oil and natural gas operations are subject to numerous federal, state, local, foreign and provincial laws and regulations, including those related to the environment, employment, immigration, labor, oil and natural gas exploration and development, payments to local, foreign and provincial officials, taxes and the repatriation of foreign earnings. If we fail to adhere to any applicable federal, state, local, foreign and provincial laws or regulations, or if such laws or regulations restrict exploration or production, or negatively affect the sale, of oil and natural gas, our business, prospects, results of operations, financial condition or cash flows may be impaired. We may be subject to governmental sanctions, such as fines or penalties, as well as potential liability for personal injury, property or natural resource damage and might be required to make significant capital expenditures to comply with federal, state or international laws or regulations. In addition, existing laws or regulations, as currently interpreted or reinterpreted in the future, or future laws or regulations could adversely affect our business or operations, or substantially increase our costs and associated liabilities.
17
In addition, exploration for, and exploitation, production and sale of, oil and natural gas in each country in which we operate is subject to extensive national and local laws and regulations requiring various licenses, permits and approvals from various governmental agencies. If these licenses or permits are not issued or unfavorable restrictions or conditions are imposed on our exploration or drilling activities, we might not be able to conduct our operations as planned. Alternatively, failure to comply with these laws and regulations, including the requirements of any licenses or permits, might result in the suspension or termination of operations and subject us to penalties. Our costs to comply with these numerous laws, regulations, licenses and permits are significant.
Specifically, our oil and natural gas operations are subject to stringent laws and regulations relating to the release or disposal of materials into the environment or otherwise relating to environmental protection. Failure to comply with these laws and regulations may result in the imposition of administrative, civil and/or criminal penalties, incurring investigatory or remedial obligations and the imposition of injunctive relief.
Changes in environmental laws and regulations occur frequently, and any changes that result in more stringent or costly waste handling, storage, transport, disposal or cleanup requirements could require us to make significant expenditures to attain and maintain compliance and may otherwise have a material adverse effect on our industry in general and on our own results of operations, competitive position or financial condition. Although we intend to comply in all material respects with applicable environmental laws and regulations, we cannot assure you that we will be able to comply with existing or new regulations. In addition, the risk of accidental spills, leakages or other circumstances could expose us to extensive liability. We are unable to predict the effect of additional environmental laws and regulations that may be adopted in the future, including whether any such laws or regulations would materially adversely increase our cost of doing business or affect operations in any area.
Under certain environmental laws that impose strict, joint and several liability, we may be required to remediate our contaminated properties regardless of whether such contamination resulted from the conduct of others or from consequences of our own actions that were or were not in compliance with all applicable laws at the time those actions were taken. In addition, claims for damages to persons or property may result from environmental and other impacts of our operations. Moreover, new or modified environmental, health or safety laws, regulations or enforcement policies could be more stringent and impose unforeseen liabilities or significantly increase compliance costs. Therefore, the costs to comply with environmental, health or safety laws or regulations or the liabilities incurred in connection with them could significantly and adversely affect our business, financial condition or results of operations.
In addition, many countries have agreed to regulate emissions of “greenhouse gases.” Methane, a primary component of natural gas, and carbon dioxide, a byproduct of burning of oil and natural gas, are greenhouse gases. Regulation of greenhouse gases could adversely impact some of our operations and demand for some of our services or products in the future.
We do not plan to insure against all potential operating risks. We might incur substantial losses from, and be subject to substantial liability claims for, uninsured or underinsured risks related to our oil and natural gas operations.
We do not intend to insure against all risks. Our oil and natural gas exploration and production activities are subject to numerous hazards and risks associated with drilling for, producing and transporting oil and natural gas, and storing, transporting and using explosive materials, and any of the following risks can cause substantial losses:
|
|
• |
environmental hazards, such as uncontrollable flows of natural gas, oil, brine, well fluids, toxic gas or other pollution into the environment, including groundwater contamination, underground migration and surface spills or mishandling of fracture stimulation fluids, including chemical additives; |
|
|
• |
abnormally pressured formations; |
|
|
• |
leaks of oil, natural gas and other hydrocarbons or losses of these hydrocarbons as a result of accidents during drilling and completion operations, including fracture stimulation activities, or from the gathering and transportation of oil, natural gas and other hydrocarbons, malfunctions of pipelines, processing or other facilities in our operations or at delivery points to third parties; |
|
|
• |
spillage or mishandling of oil, natural gas, brine, well fluids, hydraulic fracturing fluids, toxic gas or other pollutants by third-party service providers; |
|
|
• |
mechanical difficulties, such as stuck oil field drilling and service tools and casing collapse; |
|
|
• |
fires and explosions; |
|
|
• |
personal injuries and death; |
|
|
• |
regulatory investigations and penalties; and |
|
|
• |
natural disasters or other catastrophic events. |
18
As is customary in the oil and natural gas industry, we maintain insurance against some, but not all, of our operating risks. Our insurance may not be adequate to cover potential losses or liabilities and insurance coverage may not continue to be available at commercially acceptable premium levels or at all. We might not elect to obtain insurance if we believe that the cost of available insurance is excessive relative to the risks presented. Losses and liabilities arising from uninsured or under-insured events could require us to make large unbudgeted cash expenditures that could adversely impact our business, financial condition or results of operations.
We might not be able to identify liabilities associated with properties or obtain protection from sellers against them, which could cause us to incur losses.
Our review and evaluation of prospects and future acquisitions might not necessarily reveal all existing or potential problems. For example, inspections may not always be performed on every well, and environmental problems, such as groundwater contamination, may not be readily identified even when an inspection is undertaken. Even when problems are identified, a seller may be unwilling or unable to provide effective contractual protection against all or part of those problems, and we may assume environmental and other risks and liabilities in connection with acquired properties.
We might not be able to obtain necessary permits, approvals or agreements from one or more government agencies, surface owners, or other third parties, which could hamper our exploration, development or production activities.
There are numerous permits, approvals, and agreements with third parties, which will be necessary in order to enable us to proceed with our exploration, development or production activities and otherwise accomplish our objectives. The government agencies in each country in which we operate have discretion in interpreting various laws, regulations, and policies governing operations under the licenses. Further, we may be required to enter into agreements with private surface owners to obtain access to, and agreements for, the location of surface facilities. In addition, because many of the laws governing oil and natural gas operations in the international countries in which we operate have been enacted relatively recently, there is only a relatively short history of the government agencies handling and interpreting those laws, including the various regulations and policies relating to those laws. This short history does not provide extensive precedents or the level of certainty that allows us to predict whether such agencies will act favorably toward us. The governments have broad discretion to interpret requirements for the issuance of drilling permits. Our inability to meet any such requirements could have a material adverse effect on our exploration, development or production activities.
Our hedging transactions expose us to counterparty credit risk.
Our hedging transactions expose us to risk of financial loss if a counterparty fails to perform under a derivative contract. Disruptions in the financial markets could lead to sudden decreases in a counterparty’s liquidity, which could make them unable to perform under the terms of the derivative contract and we may not be able to realize the benefit of the derivative contract. As of December 31, 2016, all of our commodity derivative contracts were with DenizBank, A.S (“DenizBank”), our primary secured lender.
Competition in the oil and natural gas industry is intense, and many of our competitors have greater financial, technological and other resources than we do, which may adversely affect our ability to compete.
We operate in the highly competitive areas of oil and natural gas exploration, development, production and acquisition with a number of other companies, including U.S.-based and foreign companies doing business in each of the countries in which we operate. We face intense competition from independent, technology-driven companies as well as from both major and other independent oil and natural gas companies in seeking oil and natural gas exploration licenses and production licenses, and acquiring desirable producing properties or new leases for future exploration.
Many of our competitors have substantially greater financial, managerial, technological and other resources than we do. These companies are able to pay more for exploratory prospects and productive oil and natural gas properties than we can. To the extent competitors are able to pay more for properties than we are paying, we will be at a competitive disadvantage. Further, many of our competitors enjoy technological advantages over us and may be able to implement new technologies more rapidly than we can. Our ability to explore for and produce oil and natural gas prospects and to acquire additional properties in the future will depend upon our ability to successfully conduct operations, implement advanced technologies, evaluate and select suitable properties and consummate transactions in this highly competitive environment.
19
Risks Related to Our Common Shares
The interests of our controlling shareholder may not coincide with yours and such controlling shareholder may make decisions with which you may disagree.
As of March 17, 2017, Mr. Mitchell beneficially owned approximately 47% of our outstanding common shares. In addition, persons and entities affiliated with Mr. Mitchell participated in our offering of $46.1 million aggregate principal amount of 12.0% Series A Convertible Redeemable Preferred Shares (the “Series A Preferred Shares”) and have the right to convert their Series A Preferred Shares to common shares subject to the terms and conditions of the Series A Preferred Shares. Dalea Partners, LP, an affiliate of Mr. Mitchell, exchanged $2.1 million of the 2017 Notes for 41,000 Series A Preferred Shares and purchased $50,000 in a private placement of the Series A Preferred Shares; trusts benefitting Mr. Mitchell’s four children each exchanged $2.0 million of the 2017 Notes for 40,000 Series A Convertible Shares and purchased $50,000 of the Series A Preferred Shares in a private placement; Pinon Foundation, a non-profit charitable organization directed by Mr. Mitchell’s spouse, exchanged $10.0 million of the 2017 Notes for 200,000 Series A Preferred Shares and purchased $250,000 of the Series A Preferred Shares in a private placement; and a trust benefitting Barbara and Terry Pope, Mr. Mitchell’s sister-in-law and brother-in-law, purchased $200,000 of the 2017 Notes. As a result, Mr. Mitchell could control substantially all matters requiring shareholder approval, including the election of directors and approval of significant corporate transactions. In addition, this concentration of ownership may delay or prevent a change in control of our company and make some future transactions more difficult or impossible without the support of Mr. Mitchell. The interests of Mr. Mitchell may not coincide with your interests or the interests of our other shareholders.
We may seek to raise additional funds or restructure our debt by issuing securities that would dilute your ownership. Depending on the terms available to us, if these activities result in significant dilution, it may negatively impact the trading price of our common shares.
We may seek to raise additional funds or restructure our debt by issuing common shares, preferred shares, or securities convertible into or exercisable for common shares, that would dilute your ownership. Depending on the terms available to us, if these activities result in significant dilution, it may negatively impact the trading price of our common shares. Further, any additional financing that we secure may require the granting of rights, preferences or privileges senior to, or pari passu with, those of our common shares. Any issuances by us of equity securities may be at or below the prevailing market price of our common shares and in any event may have a dilutive impact on your ownership interest, which could cause the market price of our common shares to decline. We may also raise additional funds through the incurrence of convertible debt or the issuance or sale of other securities or instruments senior to our common shares. If we experience dilution from the issuance of additional securities and we grant superior rights to new securities over common shareholders, it may negatively impact the trading price of our common shares and you may lose all or part of your investment.
The value of our common shares may be affected by matters not related to our own operating performance.
The value of our common shares may be affected by matters that are not related to our operating performance and which are outside of our control. These matters include the following:
|
|
• |
general economic conditions in the United States, Turkey, Bulgaria, Albania and globally; |
|
|
• |
industry conditions, including fluctuations in the price of oil and natural gas; |
|
|
• |
governmental regulation of the oil and natural gas industry, including environmental regulation and regulation of fracture stimulation activities; |
|
|
• |
fluctuation in foreign exchange or interest rates; |
|
|
• |
liabilities inherent in oil and natural gas operations; |
|
|
• |
geological, technical, drilling and processing problems; |
|
|
• |
unanticipated operating events which can reduce production or cause production to be shut in or delayed; |
|
|
• |
failure to obtain industry partner and other third-party consents and approvals, when required; |
|
|
• |
stock market volatility and market valuations; |
|
|
• |
competition for, among other things, capital, acquisition of reserves, undeveloped land and skilled personnel; |
|
|
• |
the need to obtain required approvals from regulatory authorities; |
|
|
• |
worldwide supplies and prices of, and demand for, oil and natural gas; |
20
|
|
• |
political conditions in oil and natural gas producing regions; |
|
|
• |
revenue and operating results failing to meet expectations in any particular period; |
|
|
• |
investor perception of the oil and natural gas industry; |
|
|
• |
limited trading volume of our common shares; |
|
|
• |
announcements relating to our business or the business of our competitors; |
|
|
• |
the sale of assets; |
|
|
• |
the issuance of common shares, debt or other securities; |
|
|
• |
our liquidity; |
|
|
• |
our ability to raise additional funds or restructure our debt; and |
|
|
• |
loss of key management. |
In the past, companies that have experienced volatility in the trading price of their common shares have been the subject of securities class action litigation. We might become involved in securities class action litigation in the future. Such litigation often results in substantial costs and diversion of management’s attention and resources and could have a material adverse effect on our business, financial condition and results of operation.
U.S. shareholders who hold common shares during a period when we are classified as a passive foreign investment company may be subject to certain adverse U.S. federal income tax consequences.
Management believes that we are not currently a passive foreign investment company. However, we may have been a passive foreign investment company during one or more of our prior taxable years and could become a passive foreign investment company in the future. In general, classification of our company as a passive foreign investment company during a period when a U.S. shareholder holds common shares could result in certain adverse U.S. federal income tax consequences to such shareholder.
Certain U.S. shareholders who hold common shares during a period when we are classified as a controlled foreign corporation may be subject to certain adverse U.S. federal income tax rules.
Management believes that we currently are a controlled foreign corporation for U.S. federal income tax purposes and that we will continue to be so treated. Consequently, a U.S. shareholder that owns 10% or more of the total combined voting power of all classes of our shares entitled to vote on the last day of our taxable year may be subject to certain adverse U.S. federal income tax rules with respect to the shareholder’s investment in us.
Item 1B. Unresolved Staff Comments
Not applicable.
21
Turkey
The following disclosure regarding our properties in Turkey excludes the properties of TBNG, which we sold in February 2017.
General. As of December 31, 2016, we held interests in 11 onshore and offshore exploration licenses and 25 onshore production leases covering a total of approximately 507,000 gross acres (approximately 395,000 net acres) in Turkey. We acquired our interests in Turkey through acquisitions, as well as through farm-in agreements with existing third-party license holders and through applications submitted to the Turkish General Directorate for Petroleum Affairs (the “GDPA”), the agency responsible for the regulation of oil and natural gas activities under the Ministry of Energy and Natural Resources in Turkey. The following map shows our interests in Turkey:
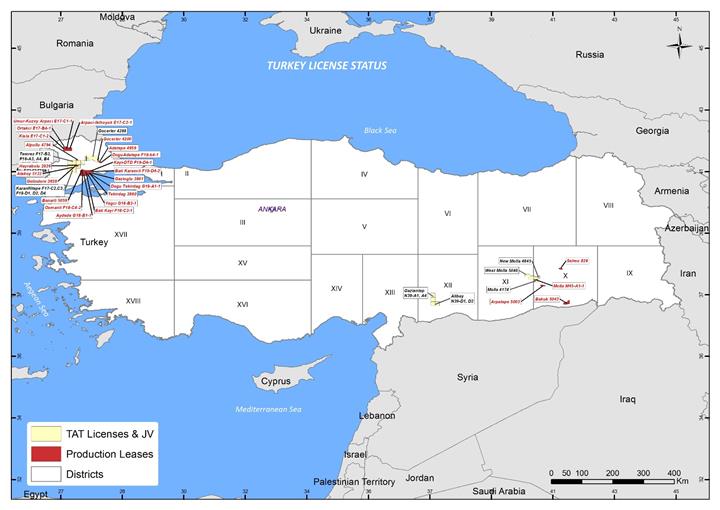
Reserves. As of December 31, 2016, we had total net proved reserves of 12,730 Mbbl of oil and 5,212 Mmcf of natural gas, net probable reserves of 11,519 Mbbl of oil and 3,300 Mmcf of natural gas and net possible reserves of 11,579 Mbbl of oil and 52,881 Mmcf of natural gas in Turkey.
Equipment Yards. As of December 31, 2016, we leased equipment yards in Muratli and Diyarbakir and owned equipment yards at Selmo and Edirne.
Commercial Terms. Turkey’s fiscal regime for oil and natural gas licenses is presently comprised of royalties and income tax. The royalty rate is 12.5% and the corporate income tax rate is 20%. There is a 5% net profits interest burden for certain of our non-core wells in the Thrace region of Turkey. Dividends repatriated from Turkey would be subject to a withholding tax rate of 15% unless reduced by a tax treaty. There is also an 18% value added tax. However, for exploration licenses, no value added tax is assessed on drilling, completion, workover, seismic and geologic activities.
22
Licensing Regime. The licensing process in Turkey for oil and natural gas concessions occurs in three stages: permit, license and lease. Under a permit, the government grants the non-exclusive right to conduct a geological investigation over an area. The size of the area and the term of the permit are subject to the discretion of the GDPA. A new petroleum law was passed by the Turkish government in May 2013, amending some of the processes related to licensing and operations in Turkey. The regulations concerning implementation were passed by the Turkish government in January 2014. The existing licenses and future licensing processes are currently in a transition phase from the old petroleum law to the new petroleum law. The new law provides that operators have the option to maintain their licenses under the old petroleum law for the duration of the existing terms of a license or to convert their licenses to the new petroleum law prior to the expiration of the license.
The GDPA awards a license after it approves the applicant’s work program, which may include obligations such as geological and geophysical work, seismic reprocessing and interpretation and contingent shooting of seismic and drilling of wells. A license grants exclusive rights over an area for the exploration for and production of petroleum.
Licensing Under the Old Petroleum Law. A license has a term of four years and requires drilling activities by the third year, but this obligation may be deferred into the fourth year by posting a bond. A license is eligible for two separate two-year extensions by fulfilling prior work commitments and subscribing to additional work commitments. A final three-year term may be granted as an appraisal period for any oil or natural gas discovery registered in the previous terms. No single company may own more than an aggregate of 100% of eight licenses within a district. Rentals are due annually based on the size of the license.
Once a discovery is made, the license holder may apply to convert the area, not to exceed 25,000 hectares (approximately 62,000 acres), to a lease. Under a lease, the lessee may produce oil and natural gas. The term of a lease is for 20 years and may be extended for two further terms of 10 years each. Annual rentals are due based on the size of the lease. The production lease holder is typically able to apply for a new exploration license covering the area of the original exploration license, minus the area of the newly-granted production lease.
Licensing Under the New Petroleum Law. A license has a term of five years and requires the license holder to post a bond equal to 2% of the cost of the work commitments to secure the fulfillment of the work commitments. Licenses shall be based on map sections of scale equal to 1/50,000 (approximately 148,000 acres) or 1/25,000 (approximately 37,000 acres). A license is eligible for two separate two-year extensions by fulfilling prior work commitments and subscribing to additional work commitments, including the drilling of at least one well in each separate extension period, and providing a bond to secure fulfillment of the additional work commitments. A final two-year term may be granted to appraise a petroleum discovery made during the prior terms. An additional six-month extension may be granted during any of the foregoing terms in order to complete the drilling or testing of a well.
Once a discovery is made, the license holder may apply to convert part of the license area, covering the prospective petroleum field, to a production lease. Under a lease, the lessee may produce oil and natural gas. The term of a lease is for 20 years and may be extended for two further terms of 10 years each. The production lease holder is typically able to apply for a new exploration license covering the area of the original exploration license, minus the area of the newly-granted production lease.
The expiration dates reported on our exploration licenses and production leases below are subject to various extensions available under the old petroleum law and the new petroleum law. Those portions of exploration licenses with production are available during any term for conversion to a production lease with a term of 20 years plus two further 10 year extensions if production is maintained. We have converted some of our qualifying acreage into the new petroleum law regulations. Conversion into the new petroleum law provides for the renewal of the exploration license terms for qualifying acreage.
23
Southeastern Turkey. The following map shows our interests in Southeastern Turkey at December 31, 2016:
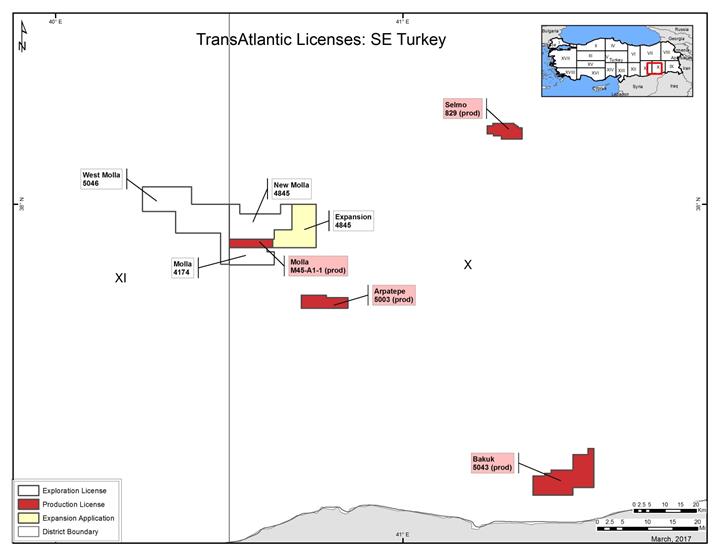
Arpatepe (Production Lease 5003). We own a 50% working interest in Production Lease 5003, which covers approximately 11,200 gross acres. For 2016, our wellhead production of oil from the Arpatepe field was 54,036 Bbls of oil, at an average rate of approximately 148 Bbl/d. We are the operator of Production Lease 5003, which expires in November 2028, with extensions available under the new petroleum laws. We expect to workover several wells and commence water injection to increase production in 2017.
Bakuk (Production Lease 5043). We own a 50% working interest in Production Lease 5043. The production lease covers approximately 34,400 gross acres. Tiway Turkey, Ltd. (“Tiway”) is the operator of Production Lease 5043, which expires in January 2032, with extensions available under the new petroleum laws.
Bati Yasince Production Lease (Lease M45A1-1). We own a 100% working interest in the Bati Yasince Production Lease, which covers approximately 7,200 gross acres. We are the operator of the lease, which expires in 2019 with extensions available under the new petroleum laws. We expect to reenter and drill a horizontal lateral during 2017.
Göksu Production Lease (Lease M45-a4-1). We own a 100% working interest in the the Göksu Production Lease, which covers approximately 14,500 gross acres. For 2016, our wellhead production of oil from the Göksu Production Lease was approximately 36,043 Bbls of oil, at an average rate of approximately 98 Bbls/d. We are the operator of the production lease, which expires in December 2020, with extensions available under the new petroleum laws. We expect to reenter a producing well and redrill a horizontal lateral during 2017. We may drill an additional well or wells in 2017.
24
New Molla License 4845. We own a 100% working interest in the Bahar appraisal wells in this license, which covers approximately 32,700 gross acres. For 2016, our wellhead production of oil from the Bahar appraisal wells was approximately 548,004 Bbls of oil, at an average rate of approximately 1,498 Bbl/d. We are the operator of Exploration License 4845, which expires in March 2019, with extensions available under the new petroleum laws. On December 1, 2016, we filed a petition with the GDPA for the addition of approximately 27,600 gross acres to Exploration License 4845, which was awarded on January 31, 2017. We expect to drill several wells in the Bahar field, an exploration well on the Cavuslu Prospect, and acquire 3D seismic on our expanded license, and reprocess additional 3D seismic from our inventory.
West Molla License 5046. We own a 100% working interest in Exploration License 5046, which covers approximately 61,600 gross acres. We are the operator of Exploration License 5046, which expires in June 2018, with extensions available under the new petroleum laws. We will redrill the Pinar well from approximately 7,400 feet through Bedinan shows encountered in the original wellbore that was not cased and tested due to wellbore conditions. We may drill an additional well or wells in 2017.
Selmo (Production Lease 829). We own a 100% working interest in Production Lease 829, which covers 8,900 acres and includes the Selmo oil field. For 2016, our wellhead production of oil in the Selmo field was approximately 735,562 Bbls of oil, at an average rate of approximately 2,010 Bbl/d. We are the operator of Production Lease 829, which expires in June 2025. We expect to recomplete, deepen and drill one or more wells in 2017.
Northwestern Turkey. The following map shows our interests in northwestern Turkey at December 31, 2016:
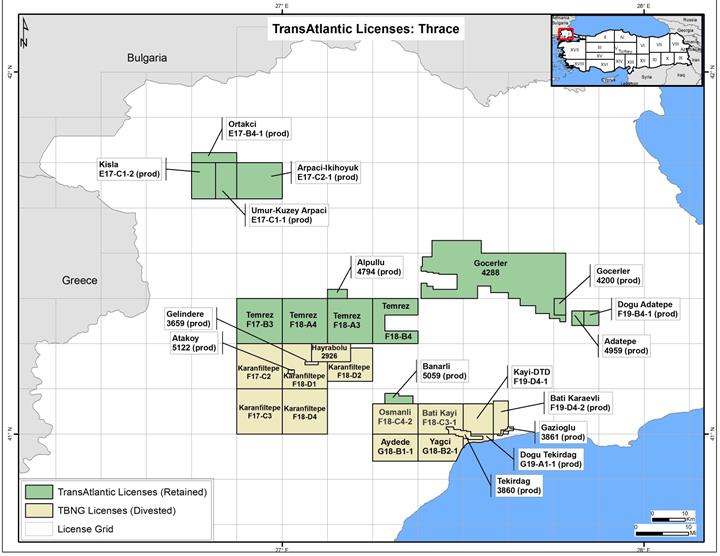
Adatepe (Production Lease 4959). We own a 50% working interest in Production Lease 4959, which covers approximately 3,086 gross acres. We are the operator of Production Lease 4959 which expires in September 2031, with extensions available under the new petroleum laws.
25
Alpullu (Production Lease 4794) and Temrez (Licenses F17B3, F18A3, F18A4, and F18B4). We own a 100% working interest in the Alpullu Production Lease and the Temrez Licenses, which cover approximately 3,158 acres and 134,296 acres, respectively. We are the operator of the Alpullu Production Lease and the Temrez Licenses, which expire in September 2028 and July 2020, respectively, with extensions available under the new petroleum laws.
Banarli (Production Lease 5059). We own a 50% working interest in Production Lease 5059, which covers approximately 4,608 gross acres. We plan to maintain production to satisfy our obligation on Production Lease 5059. We are the operator of Production Lease 5059, which expires in February 2032, with extensions available under the new petroleum laws.
Dogu Adatepe (Production Lease F19-b4-1). We own a 50% working interest in the Dogu Adatepe Production Lease, which covers part of our former Cayirdere license. The lease covers approximately 4,000 gross acres and expires in October 2017, with an additional 28 years of extensions under the new petroleum laws available with the maintenance of production on the production lease. We are currently evaluating extension options for Production Lease F19-b4-1.
Edirne Production Leases and Habiller Production Lease. We own a 55% working interest in three Edirne Production Leases and a 100% working interest in the Habiller Production Lease, which cover an aggregate of approximately 65,000 gross acres. We are the operator of the Edirne Production Leases and the Habiller Production Lease which expire in 2034 and March 2020, respectively, with extensions available under the new petroleum laws.
Gocerler (Production Lease 4200 and License 4288). We own a 50% working interest in Production Lease 4200 and License 4288, which cover approximately 3,363 gross acres and 119,000 gross acres, respectively. We are the operator of Production Lease 4200 and License 4288, which expire in May 2023 and August 2017, respectively, with extensions available under the new petroleum laws.
26
General. As of December 31, 2016, we held interests in one production concession and one exploration permit in Bulgaria. In January 2012, the Bulgarian Parliament enacted legislation that banned the fracture stimulation of oil and natural gas wells in the Republic of Bulgaria. The legislation also had the effect of preventing conventional drilling and completion activities. In June 2012, the Bulgarian Parliament amended the legislation to clarify that conventional drilling and completion activities were not intended to be affected by the law. As long as this legislation remains in effect, our unconventional natural gas exploration, development and production activities in Bulgaria will be significantly constrained. The following map shows our interests in Bulgaria at December 31, 2016:
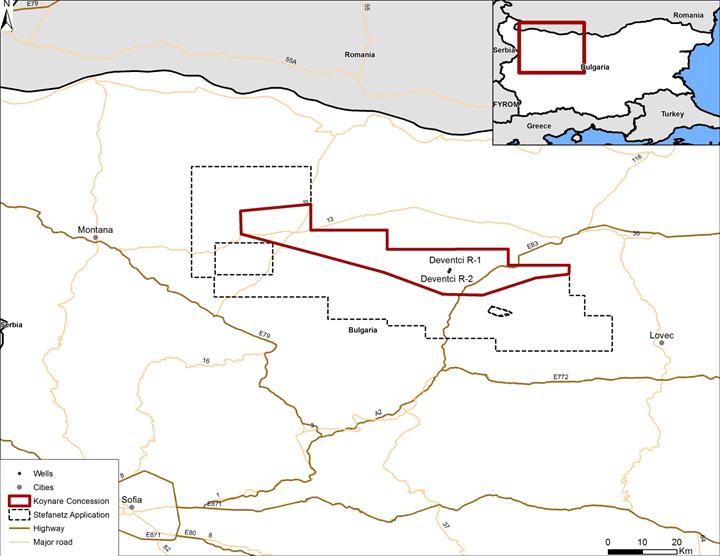
Reserves. As of December 31, 2016, there were no reserves associated with our properties in Bulgaria.
Commercial Terms. Bulgaria’s petroleum laws provide a framework for investment and operation that allows foreign investors to retain the proceeds from the sale of petroleum production. The fiscal regime is comprised of royalties and income tax.
The royalty ranges from 2.5% to 30%, based on an “R factor” which is particular to each production concession agreement, but is typically calculated by dividing the total cumulative revenues from a production concession by the total cumulative costs incurred for that production concession.
The production concession holder pays Bulgarian corporate income tax, which is assessed at a rate of 10%. All costs incurred in connection with exploration, development and production operations are deductible for corporate income tax purposes.
27
Resident companies which remit dividends outside of Bulgaria are subject to a dividend withholding tax between 10% and 15%, depending on the proportion of the capital owned by the recipient. No customs duty is payable on the export of petroleum, however a customs duty may be payable on the import of material necessary to conduct petroleum operations in certain conditions. There is also a 20% value added tax. Oil is priced at market while natural gas is tied to a bundle pricing based in part on the import price and in part on the domestic price.
Licensing Regime. The licensing process in Bulgaria for oil and natural gas concessions occurs in two stages: exploration permit and then production concession.
Under an exploration permit, the government grants exploration rights for a term of up to five years to conduct seismic and other exploratory activities, including drilling. The recipient of an exploration permit commits to a work program and posts a bank guarantee in the amount of the estimated cost for the program. The area covered by an onshore exploration permit may be as large as 5,000 square kilometers. The exploration permit may be extended for up to two additional two-year terms, subject to fulfillment of minimum work programs, and may be extended for an additional one-year term in order to appraise potential geologic discoveries. Interests under an exploration permit are transferable, subject to government approval. The permit holder is required to pay an annual area fee equal to 40 Bulgarian Lev (approximately $22 at December 31, 2016) per square kilometer, or 40 Bulgarian Lev (approximately $22 at December 31, 2016) per square kilometer in the event the permit term is extended.
Upon the registration of a commercial discovery, an exploration permit holder may apply for a production concession. The production concession size corresponds to the area of the commercial discovery. The duration of a production concession is 35 years and may be extended by a further 15 years subject to the terms and conditions of the production concession agreement. Interests under a production concession are transferable, subject to government approval. No bonus is paid to the government by the company upon conversion to a production concession.
Koynare. We own a 100% working interest, subject to a 3.02% overriding royalty interest, in the Koynare production concession covering approximately 163,000 acres. The Koynare Concession Area contains the Deventci-R1 well, where we discovered a reservoir in the Jurassic-aged Ozirovo formation at a depth of approximately 13,800 feet, which the Bulgarian government has certified as a geologic and commercial discovery. In 2017, we expect to redrill the Deventci-R1 well from approximately 10,000 feet to attempt to encounter oil and gas production upthrown from the original wellbore as interpreted from 3D seismic acquired by the Company after the Deventci-R1 well was drilled. For purposes of our royalty conversion under the “R” factor, we have a cost recovery pool of approximately $40.0 million at December 31, 2016.
Aglen. We have applied to retain the Aglen exploration permit, which covers approximately 1,700 acres within the boundaries of the former A-Lovech exploration permit and lies within the boundary of the Stefenetz Concession Area. If confirmed, we would reenter one or more existing wells to reestablish gas production.
28
General. As of December 31, 2016, we owned a 25% interest in one onshore gas field through a joint venture. The following map shows our interests in Albania at December 31, 2016:
Reserves. As of December 31, 2016, we had total net proved reserves of 52 Mbbl of oil and 1,411 Mmcf of natural gas, net probable reserves of 182 Mbbl of oil and 3,634 Mmcf of natural gas and net possible reserves of 299 Mbbl of oil and 6,090 Mmcf of natural gas in Albania.
29
Commercial Terms. The Delvina gas field is subject to a License Agreement between Agjencia Kombëtare e Burimeve Natyrore, the Albanian National Agency of Natural Resources (“AKBN”), and Albpetrol, the state owned oil company in Albania, and a Petroleum Agreement with Albpetrol, which together give the owner the right to access and develop the onshore gas field. The License Agreement has a 25-year term, with unlimited five-year renewal options.
The operator is required to submit annual work programs and budgets to Albpetrol each year, including the nature and amount of capital expenditures, which is required to be consistent with the approved plan of development (“PODs”) for the Delvina gas field. Significant deviations from the PODs are subject to the approval of AKBN and Albpetrol.
Pursuant to the terms of the Petroleum Agreement, the operator pays a 2% to 7.2% gross overriding royalty to Albpetrol, which may be paid in kind or cash. In addition, the operator is required to pay a royalty to Albpetrol based on the amount of pre-existing production (“PEP”) from the wells taken over from Albpetrol. The PEP royalty is calculated on a well by well basis and is initially equal to 65% to 70% of the PEP preceding the takeover of the well from Albpetrol. The PEP royalty declines at a rate of 5% per year.
In 2008, a new 10% mineral tax was enacted by the Albanian Ministry of Finance. The new mineral tax is equal to 10% of gross sales after deducting any PEP royalties paid. Under the Petroleum Agreement, any new financial burdens (including new mineral taxes) are to be neutralized by amendments to the Petroleum Agreement.
Delvina Field. The Delvina natural gas field was discovered in 1987 and produces natural gas and natural gas liquids from fractured carbonates of Cretaceous-Paleocene age at a depth of 2,800 to 3,500 meters. The Delvina natural gas field is connected to potential markets by an existing pipeline. Additional downstream capacity will be required to fully develop the field. We plan to workover the previously producing Delvina D4 and D12 vertical wells and return them to production in 2017.
Delvina Joint Venture Transaction. On September 1, 2016, we completed a joint venture transaction with respect to the assets in the Delvina gas field in Albania (the “Delvina Assets”). We transferred (the “Transfer”) 75% of the outstanding shares of Delvina Gas Company Ltd. (“DelvinaCo”), which owns the Delvina Assets, to Ionian Gas Company Ltd. (“Ionian”).
After the Transfer, we retained a 25% equity interest in DelvinaCo and have agreed to pay 25% of the operating costs of DelvinaCo, subject to a three-year deferral of capital expenditures. For the next three years, Ionian will be responsible for all agreed upon capital expenditures with respect to the Delvina Assets. At the end of the three-year period, the Company will be required to either reimburse Ionian for its 25% share of such capital expenditures or face dilution in its ownership of DelvinaCo.
30
Summary of Oil and Natural Gas Reserves
The following table summarizes our net proved, probable and possible reserves at December 31, 2016. In the following table, we have separately reported our net proved, probable and possible reserves for TBNG (which were not evaluated by DeGolyer and MacNaughton), which we sold in February 2017 and which was held for sale at December 31, 2016.
|
|
Reserves |
|
|||||||||
|
|
Oil and Condensate (Mbbl) |
|
|
Natural Gas (Mmcf) |
|
|
Total (Mboe) |
|
|||
|
Reserves Category |
|
|
|
|
|
|
|
|
|
|
|
|
Turkey (excluding TBNG) |
|
|
|
|
|
|
|
|
|
|
|
|
Proved reserves |
|
|
|
|
|
|
|
|
|
|
|
|
Proved developed |
|
4,785 |
|
|
|
3,405 |
|
|
|
5,353 |
|
|
Proved undeveloped |
|
7,945 |
|
|
|
1,807 |
|
|
|
8,246 |
|
|
Total proved |
|
12,730 |
|
|
|
5,212 |
|
|
|
13,599 |
|
|
Probable reserves |
|
|
|
|
|
|
|
|
|
|
|
|
Probable developed |
|
832 |
|
|
|
1,307 |
|
|
|
1,050 |
|
|
Probable undeveloped |
|
10,687 |
|
|
|
1,993 |
|
|
|
11,019 |
|
|
Total probable |
|
11,519 |
|
|
|
3,300 |
|
|
|
12,069 |
|
|
Possible reserves |
|
|
|
|
|
|
|
|
|
|
|
|
Possible developed |
|
973 |
|
|
|
1,065 |
|
|
|
1,151 |
|
|
Possible undeveloped |
|
10,606 |
|
|
|
51,816 |
|
|
|
19,242 |
|
|
Total possible |
|
11,579 |
|
|
|
52,881 |
|
|
|
20,393 |
|
|
Albania |
|
|
|
|
|
|
|
|
|
|
|
|
Proved reserves |
|
|
|
|
|
|
|
|
|
|
|
|
Proved developed |
|
8 |
|
|
|
233 |
|
|
|
47 |
|
|
Proved undeveloped |
|
44 |
|
|
|
1,178 |
|
|
|
240 |
|
|
Total proved |
|
52 |
|
|
|
1,411 |
|
|
|
287 |
|
|
Probable reserves |
|
|
|
|
|
|
|
|
|
|
|
|
Probable developed |
|
11 |
|
|
|
309 |
|
|
|
63 |
|
|
Probable undeveloped |
|
171 |
|
|
|
3,325 |
|
|
|
725 |
|
|
Total probable |
|
182 |
|
|
|
3,634 |
|
|
|
788 |
|
|
Possible reserves |
|
|
|
|
|
|
|
|
|
|
|
|
Possible developed |
|
22 |
|
|
|
625 |
|
|
|
126 |
|
|
Possible undeveloped |
|
277 |
|
|
|
5,465 |
|
|
|
1,188 |
|
|
Total possible |
|
299 |
|
|
|
6,090 |
|
|
|
1,314 |
|
|
TBNG |
|
|
|
|
|
|
|
|
|
|
|
|
Proved reserves |
|
|
|
|
|
|
|
|
|
|
|
|
Proved developed |
|
3 |
|
|
|
3,838 |
|
|
|
643 |
|
|
Proved undeveloped |
|
- |
|
|
|
5,199 |
|
|
|
867 |
|
|
Total proved |
|
3 |
|
|
|
9,037 |
|
|
|
1,510 |
|
|
Probable reserves |
|
|
|
|
|
|
|
|
|
|
|
|
Probable developed |
|
2 |
|
|
|
1,398 |
|
|
|
235 |
|
|
Probable undeveloped |
|
- |
|
|
|
15,244 |
|
|
|
2,541 |
|
|
Total probable |
|
2 |
|
|
|
16,642 |
|
|
|
2,776 |
|
|
Possible reserves |
|
|
|
|
|
|
|
|
|
|
|
|
Possible developed |
|
3 |
|
|
|
1,615 |
|
|
|
272 |
|
|
Possible undeveloped |
|
- |
|
|
|
16,023 |
|
|
|
2,671 |
|
|
Total possible |
|
3 |
|
|
|
17,638 |
|
|
|
2,943 |
|
|
Total |
|
|
|
|
|
|
|
|
|
|
|
|
Proved reserves |
|
|
|
|
|
|
|
|
|
|
|
|
Proved developed |
|
4,796 |
|
|
|
7,476 |
|
|
|
6,043 |
|
|
Proved undeveloped |
|
7,989 |
|
|
|
8,184 |
|
|
|
9,353 |
|
|
Total proved |
|
12,785 |
|
|
|
15,660 |
|
|
|
15,396 |
|
|
Probable reserves |
|
|
|
|
|
|
|
|
|
|
|
|
Probable developed |
|
845 |
|
|
|
3,014 |
|
|
|
1,348 |
|
|
Probable undeveloped |
|
10,858 |
|
|
|
20,562 |
|
|
|
14,285 |
|
|
Total probable |
|
11,703 |
|
|
|
23,576 |
|
|
|
15,633 |
|
|
Possible reserves |
|
|
|
|
|
|
|
|
|
|
|
|
Possible developed |
|
998 |
|
|
|
3,305 |
|
|
|
1,549 |
|
|
Possible undeveloped |
|
10,883 |
|
|
|
73,304 |
|
|
|
23,101 |
|
|
Total possible |
|
11,881 |
|
|
|
76,609 |
|
|
|
24,650 |
|
31
The following table shows our estimated future net revenue, Standardized Measure and PV-10 as of December 31, 2016:
|
|
Turkey |
|
|
Albania |
|
|
TBNG (1) |
|
|
Total |
|
||||
|
|
(in thousands) |
|
|||||||||||||
|
Future net revenue |
$ |
219,306 |
|
|
$ |
3,502 |
|
|
$ |
33,680 |
|
|
$ |
256,488 |
|
|
Total Standardized Measure (2) |
$ |
126,538 |
|
|
$ |
738 |
|
|
$ |
17,658 |
|
|
$ |
144,934 |
|
|
Total PV-10 (3) |
$ |
137,490 |
|
|
$ |
738 |
|
|
$ |
20,990 |
|
|
$ |
159,218 |
|
|
|
(1) |
Represents our TBNG assets that were sold in February 2017. As of December 31, 2016, our TBNG assets and liabilities were classified as held for sale on our consolidated balance sheets. |
|
|
(2) |
DeGolyer and MacNaughton did not estimate the Standardized Measure. |
|
|
(3) |
The PV-10 value of the estimated future net revenue is not intended to represent the current market value of the estimated oil and natural gas reserves we own. Management believes that the presentation of PV-10, while not a financial measure in accordance with U.S. GAAP, provides useful information to investors because it is widely used by professional analysts and sophisticated investors in evaluating oil and natural gas companies. Because many factors that are unique to each individual company impact the amount of future income taxes estimated to be paid, the use of a pre-tax measure is valuable when comparing companies based on reserves. PV-10 is not a measure of financial or operating performance under U.S. GAAP. PV-10 should not be considered as an alternative to the Standardized Measure as defined under U.S. GAAP. The Standardized Measure represents the PV-10 after giving effect to income taxes. The following table provides a reconciliation of our PV-10 to our Standardized Measure: |
|
|
Turkey |
|
|
Albania |
|
|
TBNG (1) |
|
|
Total |
|
||||
|
|
(in thousands) |
|
|||||||||||||
|
Total PV-10 |
$ |
137,490 |
|
|
$ |
738 |
|
|
$ |
20,990 |
|
|
$ |
159,218 |
|
|
Future income taxes (2) |
|
(12,395 |
) |
|
|
- |
|
|
|
(4,070 |
) |
|
|
(16,465 |
) |
|
Discount of future income taxes at 10% per annum (2) |
|
1,443 |
|
|
|
- |
|
|
|
738 |
|
|
|
2,181 |
|
|
Standardized Measure (2) |
$ |
126,538 |
|
|
$ |
738 |
|
|
$ |
17,658 |
|
|
$ |
144,934 |
|
|
|
(1) |
Represents our TBNG assets that were sold in February 2017. As of December 31, 2016, our TBNG assets and liabilities were classified as held for sale on our consolidated balance sheets. |
|
|
(2) |
DeGolyer and MacNaughton did not estimate future income taxes, the discount of future income taxes at 10% per annum or the Standardized Measure. |
Proved Reserves
Estimates of proved developed and undeveloped reserves are inherently imprecise and are continually subject to revision based on production history, results of additional exploration and development, price changes and other factors. See “—Oil and Natural Gas Reserves under U.S. Law.”
At December 31, 2016, our estimated proved reserves, excluding TBNG, were 13,886 Mboe, a decrease of 2,930 Mboe, or 17.4%, compared to 16,816 Mboe at December 31, 2015. This decrease was primarily attributable to the sale of all our Albanian oil fields and 75% of our Albanian natural gas field and a 19% decline in the SEC oil price in 2016. Additionally, proved reserves decreased due to sales volumes of 1,449 Mboe, consisting of 1,374 Mbbls of oil and 449 Mmcf of natural gas. This was partially offset by an increase in proved reserves in the Bahar and Selmo oil fields of 3,519 Mbbls of oil due primarily to production outperforming previous estimates. The estimated undiscounted capital costs associated with our proved reserves in Turkey is $166.3 million.
Proved Undeveloped Reserves
At December 31, 2016, our estimated proved undeveloped reserves were 8,486 Mboe, an increase of 2,094 Mboe, or 32.8%, compared to 6,392 Mboe at December 31, 2015. The increase in proved undeveloped reserves was primarily due to a combination of additional planned wells for the Bahar oil field and type curve revisions attributable to improved production performance in the Selmo and Bahar oil fields. All of our proved undeveloped reserves as of December 31, 2016 will be developed within five years of the date the reserve was first disclosed as a proved undeveloped reserve. The estimated undiscounted capital costs associated with our proved undeveloped reserves in Turkey is $165.0 million, of which $23.7 million is expected to be incurred in 2017.
The proved undeveloped reserves assume development costs will be funded from future cash flows from operations and financing activities, which may not be sufficient or available at commercially economic terms and could impact the timing of these development activities.
32
Estimates of probable reserves are inherently imprecise. When producing an estimate of the amount of oil and natural gas that is recoverable from a particular reservoir, an estimated quantity of probable reserves is an estimate of those additional reserves that are less certain to be recovered than proved reserves but which, together with proved reserves, are as likely as not to be recovered. Estimates of probable reserves are also continually subject to revisions based on production history, results of additional exploration and development, price changes and other factors. See “—Oil and Natural Gas Reserves under U.S. Law.”
When deterministic methods are used, it is as likely as not that actual remaining quantities recovered will exceed the sum of estimated proved plus probable reserves. When probabilistic methods are used, there should be at least a 50% probability that the actual quantities recovered will equal or exceed the proved plus probable reserves estimates. Probable reserves may be assigned to areas of a reservoir adjacent to proved reserves where data control or interpretations of available data are less certain, even if the interpreted reservoir continuity of structure or productivity does not meet the reasonable certainty criterion. Probable reserves may be assigned to areas that are structurally higher than the proved area if these areas are in communication with the proved reservoir. Probable reserves estimates also include potential incremental quantities associated with a greater percentage recovery of the hydrocarbons in place than assumed for proved reserves.
Possible Reserves
Estimates of possible reserves are also inherently imprecise. When producing an estimate of the amount of oil and natural gas that is recoverable from a particular reservoir, an estimated quantity of possible reserves is an estimate that might be achieved, but only under more favorable circumstances than are likely. Estimates of possible reserves are also continually subject to revisions based on production history, results of additional exploration and development, price changes and other factors. See “—Oil and Natural Gas Reserves under U.S. Law.”
When deterministic methods are used, the total quantities ultimately recovered from a project have a low probability of exceeding proved plus probable plus possible reserves. When probabilistic methods are used, there should be at least a 10% probability that the total quantities ultimately recovered will equal or exceed the proved plus probable plus possible reserves estimates. Possible reserves may be assigned to areas of a reservoir adjacent to probable reserves where data control and interpretations of available data are progressively less certain. Frequently, this will be in areas where geoscience and engineering data are unable to define clearly the area and vertical limits of commercial production from the reservoir by a defined project. Possible reserves also include incremental quantities associated with a greater percentage recovery of the hydrocarbons in place than the recovery quantities assumed for probable reserves.
Possible reserves may be assigned where geoscience and engineering data identify directly adjacent portions of a reservoir within the same accumulation that may be separated from proved areas by faults with displacement less than formation thickness or other geological discontinuities and that have not been penetrated by a wellbore, and the registrant believes that such adjacent portions are in communication with the known (proved) reservoir. Possible reserves may be assigned to areas that are structurally higher or lower than the proved area if these areas are in communication with the proved reservoir.
Internal Controls
Management has established, and is responsible for, a number of internal controls designed to provide reasonable assurance that the estimates of proved, probable and possible reserves are computed and reported in accordance with rules and regulations provided by the SEC as well as established industry practices used by independent engineering firms and our peers. These internal controls consist of documented process workflows and qualified professional engineering and geological personnel with specific reservoir experience. We also retained an outside independent engineering firm to prepare estimates of our proved, probable and possible reserves for Turkey, excluding TBNG, Bulgaria and Albania. We work closely with this firm, and management is responsible for providing accurate operating and technical data to it. Management has tested the processes and controls regarding our reserves estimates for 2016. Senior management reviews and approves our reserves estimates, whether prepared internally or by third parties. In addition, our audit committee serves as our reserves committee and is composed of three outside directors, all of whom have experience in the review of energy company reserves evaluations. The audit committee reviews the final reserves estimate and also meets with representatives from the outside engineering firm to discuss their process and findings.
33
Oil and Natural Gas Reserves under U.S. Law
In the United States, we are required to disclose proved reserves, and we are permitted to disclose probable and possible reserves, using the standards contained in Rule 4-10(a) of the SEC’s Regulation S-X. The estimates of proved, probable and possible reserves presented as of December 31, 2016 for Turkey (excluding TBNG), Bulgaria and Albania, have been prepared by DeGolyer and MacNaughton, our external engineers. The technical person at DeGolyer and MacNaughton that is primarily responsible for overseeing the preparation of our reserves estimates is a Registered Professional Engineer in the State of Texas and has a Bachelor of Science degree in Mechanical Engineering from Kansas State University. He has over 34 years of experience in oil and natural gas reservoir studies and evaluations and is a member of the Society of Petroleum Engineers.
We maintain an internal staff of petroleum engineers and geoscience professionals who work closely with DeGolyer and MacNaughton to ensure the integrity, accuracy and timeliness of data furnished to them for the preparation of their reserves estimates. Our vice president of engineering has over 10 years of experience in oil and natural gas reservoir studies and evaluations. He has a BASC. (Engineering) from the University of British Columbia, and is a registered Professional Engineer (Alberta).
Estimates of oil and natural gas reserves are projections based on a process involving an independent third-party engineering firm’s collection of all required geologic, geophysical, engineering and economic data, and such firm’s complete external preparation of all required estimates and are forward-looking in nature. These reports rely upon various assumptions, including assumptions required by the SEC, such as constant oil and natural gas prices, operating expenses and future capital costs. We also make assumptions relating to availability of funds and timing of capital expenditures for development of our proved undeveloped, probable and possible reserves. These reports should not be construed as the current market value of our reserves. The process of estimating oil and natural gas reserves is also dependent on geological, engineering and economic data for each reservoir. Because of the uncertainties inherent in the interpretation of this data, we cannot ensure that the reserves will ultimately be realized. Our actual results could differ materially. See “Supplemental Information —Supplemental oil and natural gas reserves information (unaudited)” to our consolidated financial statements for additional information regarding our oil and natural gas reserves.
The technologies and economic data used in the estimation of our proved, probable and possible reserves include, but are not limited to, electrical logs, radioactivity logs, core analyses, geologic maps and available downhole and production data, seismic data and well test data. Reserves attributable to producing wells with sufficient production history were estimated using appropriate decline curves or other performance relationships. Reserves attributable to producing wells with limited production history were estimated using performance from analogous wells in the surrounding area and geologic data to assess the reservoir continuity. These wells were considered to be analogous based on production performance from the same formation and completion using similar techniques.
The estimates of proved, probable and possible reserves prepared by DeGolyer and MacNaughton for the year ended December 31, 2016 included a detailed evaluation of our Selmo, Arpatepe, Bakuk, Molla and certain Thrace Basin properties in Turkey, our Delvina field in Albania and our West Koynare field in Bulgaria. DeGolyer and MacNaughton determined that their estimates of reserves conform to the guidelines of the SEC, including the criteria of “reasonable certainty,” as it pertains to expectations about whether proved reserves are economically producible from a given date forward, under existing economic conditions, operating methods and government regulations, consistent with the definition in Rule 4-10(a)(24) of SEC Regulation S-X.
TBNG Reserves
Our December 31, 2016 TBNG reserves were based on estimates made by our internal staff of petroleum and geoscience professionals.
Oil and Natural Gas Reserves under Canadian Law
As a reporting issuer under Alberta, British Columbia and Ontario securities laws, we are required under Canadian law to comply with National Instrument 51-101 “Standards of Disclosure for Oil and Gas Activities” (“NI 51-101”) implemented by the members of the Canadian Securities Administrators in all of our reserves related disclosures. DeGolyer and MacNaughton evaluated the Company’s reserves as of December 31, 2016 for Turkey (excluding TBNG), Bulgaria and Albania in accordance with the reserves definitions of NI 51-101 and the Canadian Oil and Gas Evaluators Handbook (“COGEH”). Our annual oil and natural gas reserves disclosures prepared in accordance with NI 51-101 and COGEH and filed in Canada are available at www.sedar.com.
34
Oil and Natural Gas Sales Volumes
The following table sets forth our sales volumes of oil and natural gas (including by field for any field that contained 15% or more of our total proved reserves) for 2016, 2015 and 2014:
|
|
Sales Volumes |
|
|||||||||
|
|
Oil (1) |
|
|
Natural Gas |
|
|
Total |
|
|||
|
Year |
(Bbls) |
|
|
(Mcf) |
|
|
(Boe) |
|
|||
|
2016 |
|
|
|
|
|
|
|
|
|
|
|
|
Turkey (excluding TBNG) |
|
1,374,190 |
|
|
|
448,976 |
|
|
|
1,449,019 |
|
|
Selmo field |
|
735,562 |
|
|
|
– |
|
|
|
735,562 |
|
|
Bahar field |
|
548,004 |
|
|
|
– |
|
|
|
548,004 |
|
|
Total TBNG |
|
1,776 |
|
|
|
982,161 |
|
|
|
165,470 |
|
|
Total Turkey |
|
1,375,966 |
|
|
|
1,431,137 |
|
|
|
1,614,489 |
|
|
2015 |
|
|
|
|
|
|
|
|
|
|
|
|
Turkey (excluding TBNG) |
|
1,417,254 |
|
|
|
602,031 |
|
|
|
1,517,593 |
|
|
Selmo field |
|
933,925 |
|
|
|
– |
|
|
|
933,925 |
|
|
Bahar field |
|
431,199 |
|
|
|
– |
|
|
|
431,199 |
|
|
Total TBNG |
|
2,781 |
|
|
|
1,888,986 |
|
|
|
317,612 |
|
|
Total Turkey |
|
1,420,035 |
|
|
|
2,491,017 |
|
|
|
1,835,205 |
|
|
Total Albania |
|
230,855 |
|
|
|
– |
|
|
|
230,855 |
|
|
2014 |
|
|
|
|
|
|
|
|
|
|
|
|
Turkey (excluding TBNG) |
|
1,299,857 |
|
|
|
1,062,191 |
|
|
|
1,476,889 |
|
|
Selmo field |
|
1,023,877 |
|
|
|
– |
|
|
|
1,023,877 |
|
|
Total TBNG |
|
2,582 |
|
|
|
2,196,346 |
|
|
|
368,640 |
|
|
Total Turkey |
|
1,302,439 |
|
|
|
3,258,537 |
|
|
|
1,845,529 |
|
|
Total Albania |
|
36,200 |
|
|
|
– |
|
|
|
36,200 |
|
|
Gorisht-Kocul field |
|
19,306 |
|
|
|
– |
|
|
|
19,306 |
|
|
|
(1) |
“Oil” volumes include condensate (light oil) and medium crude oil. |
Average Sales Price and Production Costs
The following table sets forth the average sales price per Bbl of oil and Mcf of natural gas and the average production cost, not including ad valorem and severance taxes, per unit of production for each of 2016, 2015 and 2014:
|
|
2016 |
|
|
2015 |
|
|
2014 |
|
|||
|
Turkey: |
|
|
|
|
|
|
|
|
|
|
|
|
Average Sales Price Oil ($/Bbl) |
$ |
39.07 |
|
|
$ |
44.69 |
|
|
$ |
82.92 |
|
|
Natural Gas ($/Mcf) |
$ |
6.75 |
|
|
$ |
7.73 |
|
|
$ |
8.67 |
|
|
Unit Costs Production ($/Boe) |
$ |
6.68 |
|
|
$ |
6.10 |
|
|
$ |
8.56 |
|
|
Albania: |
|
|
|
|
|
|
|
|
|
|
|
|
Average Sales Price Oil ($/Bbl) |
$ |
– |
|
|
$ |
37.10 |
|
|
$ |
52.43 |
|
|
Unit Costs Production ($/Boe) |
$ |
– |
|
|
$ |
26.02 |
|
|
$ |
31.15 |
|
35
The following table sets forth the number of net productive and dry exploratory wells and net productive and dry development wells we drilled in 2016, 2015 and 2014:
|
|
Development Wells |
|
|
Exploratory Wells |
|
||||||||||||
|
|
Productive |
|
|
Dry |
|
|
Productive |
|
|
|
|
Dry |
|
||||
|
Turkey: |
|
|
|
|
|
|
|
|
|
|
|
|
|
|
|
|
|
|
2016 |
|
1.0 |
|
|
|
– |
|
|
|
– |
|
|
|
|
|
0.5 |
|
|
2015 |
|
2.4 |
|
|
|
– |
|
|
|
– |
|
|
|
|
|
1.4 |
|
|
2014 |
|
14.7 |
|
|
|
2.0 |
|
|
|
4.6 |
|
|
|
|
|
0.4 |
|
|
Bulgaria: |
|
|
|
|
|
|
|
|
|
|
|
|
|
|
|
|
|
|
2016 |
|
– |
|
|
|
– |
|
|
|
– |
|
|
|
|
|
– |
|
|
2015 |
|
– |
|
|
|
– |
|
|
|
– |
|
|
|
|
|
0.3 |
|
|
2014 |
|
– |
|
|
|
– |
|
|
|
– |
|
|
|
|
|
– |
|
|
Albania: |
|
|
|
|
|
|
|
|
|
|
|
|
|
|
|
|
|
|
2016 |
|
– |
|
|
|
– |
|
|
|
– |
|
|
|
|
|
– |
|
|
2015 |
|
– |
|
|
|
– |
|
|
|
– |
|
|
|
|
|
– |
|
|
2014 |
|
– |
|
|
|
– |
|
|
|
– |
|
|
|
|
|
– |
|
Oil and Natural Gas Properties, Wells, Operations and Acreage
Productive Wells. The following table sets forth the number of productive wells (wells that were producing oil or natural gas or were capable of production) in which we held a working interest as of December 31, 2016:
|
|
Oil |
|
|
Natural Gas |
|
||||||||||
|
|
Gross (1) |
|
|
Net (2) |
|
|
Gross (1) |
|
|
Net (2) |
|
||||
|
Turkey (excluding TBNG) |
|
67.0 |
|
|
|
64.0 |
|
|
|
25.0 |
|
|
|
12.5 |
|
|
Bulgaria |
|
– |
|
|
|
– |
|
|
|
– |
|
|
|
– |
|
|
Albania |
|
– |
|
|
|
– |
|
|
|
– |
|
|
|
– |
|
|
TBNG |
|
1.0 |
|
|
|
0.4 |
|
|
|
101.0 |
|
|
|
41.9 |
|
|
|
(1) |
“Gross wells” means the wells in which we held a working interest (operating or non-operating). |
|
|
(2) |
“Net wells” means the sum of the fractional working interests owned in gross wells. |
Developed Acreage. The following table sets forth our total gross and net developed acreage as of December 31, 2016:
|
|
Developed Acres |
|
|||||
|
|
Gross (1) |
|
|
Net (2) |
|
||
|
Turkey (excluding TBNG) |
|
144,939 |
|
|
|
92,225 |
|
|
Bulgaria |
|
– |
|
|
|
– |
|
|
Albania |
|
– |
|
|
|
– |
|
|
TBNG |
|
133,199 |
|
|
|
55,277 |
|
|
Total |
|
278,138 |
|
|
|
147,502 |
|
|
|
(1) |
“Gross” means the total number of acres in which we had a working interest. |
|
|
(2) |
“Net” means the sum of the fractional working interests owned in gross acres. |
36
Undeveloped Acreage. The following table sets forth our undeveloped land position as of December 31, 2016:
|
|
Undeveloped Acres |
|
|||||
|
|
Gross (1) |
|
|
Net (2) |
|
||
|
Turkey (excluding TBNG) |
|
362,394 |
|
|
|
302,749 |
|
|
Bulgaria |
|
164,700 |
|
|
|
164,700 |
|
|
Albania |
|
57,872 |
|
|
|
14,468 |
|
|
TBNG |
|
312,572 |
|
|
|
161,660 |
|
|
Total |
|
897,538 |
|
|
|
643,577 |
|
|
|
(1) |
“Gross” means the total number of acres in which we had a working interest. |
|
|
(2) |
“Net” means the sum of the fractional working interests owned in gross acres. |
Undeveloped Acreage Expirations. The following table summarizes by year our undeveloped acreage (excluding TBNG) as of December 31, 2016 that is scheduled to expire in the next five years:
|
|
Undeveloped Acres |
|
|
% of Total Undeveloped Acres |
|
||||||
|
|
Gross (1) |
|
|
Net (2) |
|
|
Net (2) |
|
|||
|
2017 |
|
166,538 |
|
|
|
106,893 |
|
|
|
22.2 |
|
|
2018 |
|
61,560 |
|
|
|
61,560 |
|
|
|
12.8 |
|
|
2019 |
|
– |
|
|
|
– |
|
|
|
– |
|
|
2020 |
|
134,296 |
|
|
|
134,296 |
|
|
|
27.9 |
|
|
2021 |
|
– |
|
|
|
– |
|
|
|
– |
|
|
|
(1) |
“Gross” means the total number of acres in which we had a working interest. |
|
|
(2) |
“Net” means the sum of the fractional working interests owned in gross acres. |
We anticipate that we will be able to extend the license terms for substantially all of our undeveloped acreage in Turkey scheduled to expire in 2017 through the execution of our current work commitments.
TEMI Litigation. TEMI has been involved in a number of lawsuits with a group of villagers living around the Selmo oil field who claim ownership of a portion of the surface at Selmo. These cases are being vigorously defended by TEMI and Turkish government authorities. We do not have enough information to estimate the potential additional operating costs we could incur in the event the purported surface owners’ claims are ultimately successful. The following is a summary of these cases.
In 2003, the villagers applied to the Kozluk Civil Court of First Instance in Turkey with seven title survey certificates dating back to Ottoman times. These villagers were granted title registration certificates, and in 2005, these villagers applied to the Kozluk Civil Court of First Instance to enlarge the areas covered by the certificates to approximately 20 square kilometers. Neither we nor, to our knowledge, any ministry in the Turkish government received notice of this court proceeding. Almost all of our production wells at the Selmo oil field lie within this enlarged area. In 2009, the Supreme Court overruled the Kozluk Civil Court of First Instance and directed it to re-examine the case (the “Surface Litigation”).
In 2006, the Turkish Forestry Authority filed a claim in the Kozluk Cadastre Court against the villagers for attempting to register land that is registered with the Turkish government as forest. TEMI joined the Turkish government as a plaintiff in that case. In February 2011, the Kozluk Cadastre Court decided to suspend the case until there is a resolution of the Surface Litigation.
In addition, TEMI is a defendant in two nuisance cases filed in the Kozluk Cadastre Court and one claim for damages filed in the Kozluk Civil Court of First Instance. The plaintiffs in each of these cases are the same villagers in the Surface Litigation. The Turkish Treasury Department and the Turkish Forestry Authority have joined TEMI as defendants in each of these cases. The Kozluk Cadastre Court has decided to suspend each of these nuisance cases until there is a resolution of the Surface Litigation. On December 27, 2012, the Kozluk Civil Court of First Instance dismissed the damages case, and the plaintiffs appealed that decision.
37
On June 27, 2012, the Kozluk Civil Court of First Instance dismissed the Surface Litigation. The court issued its formal decision on August 8, 2012, and the plaintiffs filed an appeal with the Court of Appeal. The file was reversed by the Court of Appeal and sent back to the Kozluk Civil Court of First Instance in August 2014. The Court of Appeals ruled that the Kozluk Civil Court of First Instance investigate the merits of the dispute to determine the ownership position of the parties, that TPAO should be added as a party to the litigation, and that the cadastral map sheet depicting the real properties at issue must be investigated. The parties then appealed to the Court of Appeals for correction of judgment.
We continue to operate on the surface at Selmo, and have paid surface damages for locations at Selmo from the time we began operating the Selmo lease to present.
Bulgarian Ministry of Energy and Economy. In October 2015, the Bulgarian Ministry of Energy and Economy filed a suit against Direct Bulgaria, claiming a $200,000 penalty for Direct Bulgaria’s alleged failure to fulfill the work program associated with the Aglen exploration permit. Direct Bulgaria received a force majeure recognition in 2012 from the Bulgarian Ministry of Energy and Economy, and the force majeure event has not been rectified. We believe that Direct Bulgaria is not under any obligation to fulfill the work program until the force majeure event is rectified, and continue to vigorously defend this claim.
Item 4. Mine Safety Disclosures
Not applicable.
38
Item 5. Market for Registrant’s Common Equity, Related Stockholder Matters and Issuer Purchases of Equity Securities
Canada
Our common shares are traded in Canada on the Toronto Stock Exchange (the “TSX”) under the trading symbol “TNP”. The following table sets forth the quarterly high and low sales prices per common share in Canadian dollars on the TSX for the periods indicated.
|
|
High |
|
|
Low |
|
||
|
2016: |
|
|
|
|
|
|
|
|
Fourth Quarter |
$ |
1.75 |
|
|
$ |
1.12 |
|
|
Third Quarter |
$ |
1.96 |
|
|
$ |
0.93 |
|
|
Second Quarter |
$ |
1.52 |
|
|
$ |
0.80 |
|
|
First Quarter |
$ |
2.56 |
|
|
$ |
0.71 |
|
|
2015: |
|
|
|
|
|
|
|
|
Fourth Quarter |
$ |
4.30 |
|
|
$ |
1.41 |
|
|
Third Quarter |
$ |
6.79 |
|
|
$ |
3.22 |
|
|
Second Quarter |
$ |
7.50 |
|
|
$ |
5.78 |
|
|
First Quarter |
$ |
6.80 |
|
|
$ |
5.30 |
|
United States
Our common shares are traded in the United States on the NYSE MKT exchange under the trading symbol “TAT”. The following table sets forth the high and low sales price per common share in U.S. Dollars on the NYSE MKT for the periods indicated.
|
|
High |
|
|
Low |
|
||
|
2016: |
|
|
|
|
|
|
|
|
Fourth Quarter |
$ |
1.36 |
|
|
$ |
0.86 |
|
|
Third Quarter |
$ |
1.52 |
|
|
$ |
0.71 |
|
|
Second Quarter |
$ |
1.21 |
|
|
$ |
0.60 |
|
|
First Quarter |
$ |
1.86 |
|
|
$ |
0.52 |
|
|
2015: |
|
|
|
|
|
|
|
|
Fourth Quarter |
$ |
3.31 |
|
|
$ |
1.02 |
|
|
Third Quarter |
$ |
5.40 |
|
|
$ |
2.38 |
|
|
Second Quarter |
$ |
6.18 |
|
|
$ |
4.81 |
|
|
First Quarter |
$ |
5.65 |
|
|
$ |
4.04 |
|
Common Shares and Dividends
As of March 17, 2017, we had 47,312,231 common shares issued and outstanding and held by 161 record holders, including nominee holders such as banks and brokerage firms who hold shares for beneficial owners.
We have not declared any dividends to date on our common shares. We have no present intention of paying any cash dividends on our common shares in the foreseeable future, as we intend to use cash flow from operations to invest in our business.
39
The following graph compares the cumulative total shareholder return on TransAtlantic Petroleum Ltd. common shares with the Russell 2000 Index and the S&P/TSX Capped Energy Sector Index. The graph assumes an investment of $100 on December 31, 2011 in our common shares, the Russell 2000 Index and the S&P/TSX Capped Energy Sector Index, and assumes the reinvestment of dividends where applicable. The share price performance shown on the graph below is not intended and does not necessarily indicate future price performance.
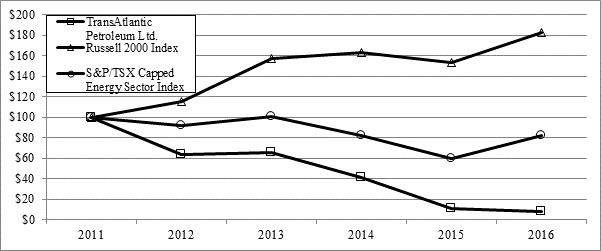
Company/Index
|
|
|
2011 |
|
|
2012 |
|
|
2013 |
|
|
2014 |
|
|
2015 |
|
|
2016 |
|
|
TransAtlantic Petroleum Ltd. |
$ |
100 |
|
$ |
63 |
|
$ |
65 |
|
$ |
41 |
|
$ |
11 |
|
$ |
8 |
|
|
Russell 2000 Index |
$ |
100 |
|
$ |
115 |
|
$ |
157 |
|
$ |
163 |
|
$ |
153 |
|
$ |
183 |
|
|
S&P/TSX Capped Energy Sector Index |
$ |
100 |
|
$ |
92 |
|
$ |
101 |
|
$ |
82 |
|
$ |
60 |
|
$ |
82 |
|
Foreign Exchange Control Regulations
We have been designated as a non-resident for Bermuda exchange control purposes by the Bermuda Monetary Authority. Because of this designation, there are no restrictions on our ability to transfer funds in and out of Bermuda.
The transfer of shares between persons regarded as residents outside Bermuda for exchange control purposes and the sale of our common shares to or by such persons may take place without specific consent under the Exchange Control Act 1972. Issuances and transfers of shares involving any person regarded as a resident in Bermuda for exchange control purposes require specific approval under the Exchange Control Act 1972.
As an “exempted company,” we are exempt from Bermuda laws which restrict the percentage of share capital that may be held by non-Bermuda residents, but as an exempted company, we may not participate in certain business transactions, including: (1) the acquisition or holding of land in Bermuda (except that required for our business and held by way of lease or tenancy for terms of not more than 50 years) without the express authorization of the Bermuda legislature, (2) the taking of mortgages on land in Bermuda to secure an amount in excess of $50,000 without the consent of the Minister of Finance, (3) the acquisition of any bonds or debentures secured by any land in Bermuda, other than certain types of Bermuda government securities or (4) the carrying on of business of any kind in Bermuda, except in furtherance of our business carried on outside Bermuda.
40
Item 6. Selected Financial Data
The following table summarizes selected consolidated financial information from continuing operations for each of the five years in the period ended December 31, 2016. All periods presented have been adjusted to reflect our oilfield services business segment, Moroccan segment, and the Albanian segment as discontinued operations. You should read the information set forth below in conjunction with “Item 7. Management’s Discussion and Analysis of Financial Condition and Results of Operations” and the consolidated financial statements and notes thereto included elsewhere in this Annual Report on Form 10-K.
|
|
Year Ended December 31, |
|
|||||||||||||||||
|
|
2016 |
|
|
2015 |
|
|
2014 |
|
|
2013 |
|
|
2012 |
|
|||||
|
|
(amounts in thousands, except per share amounts) |
|
|||||||||||||||||
|
Total revenues |
$ |
68,595 |
|
|
$ |
85,064 |
|
|
$ |
138,830 |
|
|
$ |
130,827 |
|
|
$ |
143,908 |
|
|
Seismic and other exploration |
|
104 |
|
|
|
370 |
|
|
|
4,285 |
|
|
|
14,009 |
|
|
|
5,040 |
|
|
Net (loss) income from continuing operations |
|
(22,445 |
) |
|
|
(26,665 |
) |
|
|
29,214 |
|
|
|
(13,271 |
) |
|
|
(6,373 |
) |
|
Net income (loss) from discontinued operations |
|
16,202 |
|
|
|
(80,873 |
) |
|
|
(138 |
) |
|
|
(442 |
) |
|
|
22,619 |
|
|
Comprehensive (loss) income |
|
(24,969 |
) |
|
|
(149,818 |
) |
|
|
14,751 |
|
|
|
(50,686 |
) |
|
|
38,470 |
|
|
Basic net (loss) income per common share from continuing operations |
|
(0.51 |
) |
|
|
(0.65 |
) |
|
|
0.77 |
|
|
|
(0.36 |
) |
|
|
(0.17 |
) |
|
Basic weighted average number of shares outstanding |
|
43,885 |
|
|
|
40,841 |
|
|
|
37,829 |
|
|
|
37,069 |
|
|
|
36,742 |
|
|
|
As of December 31, |
|
|||||||||||||||||
|
|
2016 |
|
|
2015 |
|
|
2014 |
|
|
2013 |
|
|
2012 |
|
|||||
|
|
(amounts in thousands) |
|
|||||||||||||||||
|
Total assets |
$ |
196,393 |
|
|
$ |
298,189 |
|
|
$ |
546,236 |
|
|
$ |
346,586 |
|
|
$ |
358,258 |
|
|
Long-term liabilities |
|
35,757 |
|
|
|
103,537 |
|
|
|
185,782 |
|
|
|
63,619 |
|
|
|
72,819 |
|
|
Shareholders' equity |
|
38,486 |
|
|
|
58,922 |
|
|
|
211,464 |
|
|
|
167,317 |
|
|
|
213,827 |
|
|
Capital expenditures, including acquisitions(1) |
|
10,186 |
|
|
|
22,466 |
|
|
|
111,501 |
|
|
|
99,951 |
|
|
|
81,824 |
|
|
|
(1) |
Excludes seismic and other exploration expenditures. |
41
Item 7. Management’s Discussion and Analysis of Financial Condition and Results of Operations
We are an international oil and natural gas company engaged in acquisition, exploration, development and production. We have focused our operations in countries that have established, yet underexplored, petroleum systems, are net importers of petroleum, have an existing petroleum transportation infrastructure and provide favorable commodity pricing, royalty rates and tax rates to exploration and production companies. As of December 31, 2016, excluding TBNG, we held interests in approximately 395,000 and 165,000 net acres of developed and undeveloped oil and natural gas properties in Turkey and Bulgaria, respectively. As of March 17, 2017, approximately 47% of our outstanding common shares were beneficially owned by N. Malone Mitchell 3rd, the chairman of our board of directors and our chief executive officer.
Financial Restructuring and Elimination of Going Concern Assumption
During 2016, we focused on several transactions to deleverage our balance sheet, repay our defaulted senior credit facility (the “Senior Credit Facility”) with BNP Paribas (Suisse) SA and the International Finance Corporation, obtain new debt financing, raise cash from asset sales and refinance our 13.0% Senior Convertible Notes due 2017 (the “2017 Notes”). The following discussion explains these transactions, the improvement to our balance sheet and the elimination of the going concern assumption.
At December 31, 2015, we had $55.0 million in long-term debt, $35.5 million in short-term, $5.7 million in cash and a $24.5 million working capital deficit (excluding assets and liabilities held for sale). In addition, we had a $15.5 million borrowing base deficiency under the Senior Credit Facility, and we were not in compliance with the current ratio financial covenant in the Senior Credit Facility.
In February 2016, we sold all of the outstanding equity in our wholly-owned subsidiary, Stream Oil & Gas Ltd. (“Stream”), to GBC Oil Company Ltd. (“GBC Oil”) in exchange for (i) the future payment of $2.3 million to Raiffeisen Bank Sh.A (“Raiffeisen”) to pay down a term loan facility (the “Term Loan Facility”) dated as of September 17, 2014 between Stream’s wholly-owned subsidiary, TransAtlantic Albania Ltd. (“TransAtlantic Albania”), and Raiffeisen, and (ii) the assumption of $29.2 million of liabilities owed by Stream, consisting of $23.1 million of accounts payable and accrued liabilities and $6.1 million of debt.
On August 31, 2016, the our wholly-owned subsidiary, TransAtlantic Exploration Mediterranean International Pty Ltd ("TEMI"), entered into a $30.0 million term loan (the "Term Loan") with DenizBank. TEMI used $22.9 million of the proceeds from the Term Loan to repay the Senior Credit Facility in full (including accrued interest), which was terminated upon repayment, and $1.5 million of the proceeds to repay other short-term debt. The Term Loan is payable in six monthly installments of $1.25 million each through February 2017 and thereafter in twelve monthly installments of $1.88 million each through February 2018.
On October 13, 2016, TransAtlantic Worldwide, Ltd. (“TransAtlantic Worldwide”), a wholly-owned subsidiary of the Company, entered into a share purchase agreement for the sale of all of the equity interests in Thrace Basin Natural Gas (Turkiye) Corporation (“TBNG”). TBNG owns a portion of our interests in the Thrace Basin area in Turkey.
On November 4, 2016, we issued 921,000 shares of our 12.0% Series A Convertible Redeemable Preferred Shares (the “Series A Preferred Shares”). Of the 921,000 Series A Preferred Shares, (i) 815,000 shares were issued in exchange for $40.75 million principal amount of 2017 Notes at an exchange rate of 20 Series A Preferred Shares for each $1,000 principal amount of 2017 Notes, and (ii) 106,000 shares were sold for $5.3 million of cash to certain holders of the 2017 Notes. We are required to redeem the Series A Preferred Shares on November 4, 2024, unless converted to common shares prior to that date or we elect to redeem the Series A Preferred Shares sooner. We used $4.3 million of the cash proceeds to redeem additional 2017 Notes on January 1, 2017, reducing the amount of outstanding 2017 Note to $10.0 million.
As of December 31, 2016, we had reduced our long-term debt to $3.8 million and our short-term debt to $38.2 million, increased our cash to $10.0 million and reduced our working capital deficit to $17.3 million (excluding assets and liabilities held for sale).
Subsequent to year end, on February 24, 2017, we closed the sale of TBNG for gross proceeds of $20.9 million, and approximate net cash proceeds of $16.3 million. The purchase price is subject to post-closing adjustments, and we agreed to escrow $3.1 million of the purchase price for 30 days to satisfy any agreed upon purchase price adjustments. We used $2.7 million of the net proceeds to repay short-term debt.
As a result of these transactions, we have eliminated the going concern assumption in our financial statements. Based on current forecasted oil prices for 2017 and beyond, we believe that our cash flows from operations and existing cash on hand are sufficient to conduct our planned operations and meet our contractual requirements, including license obligations through March 31, 2018.
42
For additional information on our recent developments, see “Item 1. Business—Recent Developments.”
2016 Financial and Operational Performance
|
|
• |
We derived 78.4% of our revenues from the production of oil, 14.1% of our revenues from the production of natural gas and 7.5% of our revenues from other sources during the year ended December 31, 2016. |
|
|
• |
Total oil and natural gas sales revenues decreased 23.3% to $63.4 million for the year ended December 31, 2016, from $82.7 million in 2015. The decrease was primarily the result of a decrease in the average sales price of $5.79 per Boe, and a decrease in sales volumes of 220 Mboe. |
|
|
• |
Wellhead production was 1,376 Mbbls of oil and 1,431 Mmcf of natural gas for the year ended December 31, 2016, as compared to 1,420 Mbbls of oil and 2,491 Mmcf of natural gas for 2015. |
|
|
• |
In 2016, we incurred $10.3 million in total capital expenditures, including license acquisition, seismic and corporate expenditures, from continuing operations, as compared to $22.8 million in 2015. |
|
|
• |
As of December 31, 2016, we had $3.8 million in long-term debt, $38.2 million in short-term debt and $46.1 million in Series A Preferred Shares, as compared to $55.0 million in long-term debt, $41.9 million in short-term debt and no preferred stock as of December 31, 2015. |
2016 Operations
During 2016, we pursued a reduced development plan that consisted of maintaining our acreage position by drilling obligation wells and performing low cost, high return well optimizations. In January 2016, we completed the Bahar-7 well which had an initial production rate of approximately 570 Bbl/d of oil and 300 Mcf/d of natural gas. In February 2016, we completed the Bahar-9 well in a northern, untested, fault block. We tested oil and water and, subsequently, temporarily isolated and recompleted the Bahar-9 well in the Hazro F4 formation with an initial production of 100 Bbl/d of oil.
In August 2016, we drilled an obligation well in our jointly held licenses with TPAO in the Thrace Basin. Although there were gas shows while drilling, following open-hole log interpretations, the well was deemed to be uneconomic and was subsequently plugged and abandoned.
In December 2016, we drilled the Selmo-86H2 well in our Selmo oil field in Southeastern Turkey. We completed the well with an 870 foot lateral with an initial production rate of 75 Bbl/d of oil.
Planned Operations
We expect our net field capital expenditures for 2017 to range between $25.0 million and $35.0 million. We expect net field capital expenditures during 2017 to include approximately $ 24.0 million of drilling and completion expense for between five and six gross wells, between $3.0 million and $4.5 million for 3D seismic, and $1.0 million in infrastructure improvements and other capital investments in Southeast Turkey. Most of the remaining 2017 expenditures are expected to be invested in our Selmo, Bahar and Molla areas of Southeast Turkey and the Koynare license in Bulgaria. We expect cash on hand and cash flow from operations will be sufficient to fund our 2017 net field capital expenditures. If not, we will either curtail our discretionary capital expenditures or seek other funding sources. Our projected 2017 capital expenditure budget is subject to change. For more information on our planned 2017 operations, see “Item 1. Business—Planned Operations.”
Critical Accounting Policies
Our discussion and analysis of our financial condition and results of operations is based upon our consolidated financial statements, which have been prepared in accordance with U.S. GAAP. The preparation of these consolidated financial statements requires management to make estimates and judgments that affect the reported amounts of assets, liabilities, revenue and expenses, and related disclosures. Our significant accounting policies are described in “Note 3—Significant accounting policies” to our consolidated financial statements included in this Annual Report on Form 10-K. We have identified below policies that are of particular importance to the portrayal of our financial position and results of operations and which require the application of significant judgment by management. These estimates are based on historical experience, information received from third parties, and on various other assumptions that are believed to be reasonable under the circumstances, the results of which form the basis for making judgments about the carrying values of assets and liabilities that are not readily apparent from other sources. Actual results may differ from these estimates under different assumptions or conditions.
43
We believe the following critical accounting policies affect the significant judgments and estimates used in the preparation of our consolidated financial statements.
Oil and Natural Gas Properties. In accordance with the successful efforts method of accounting for oil and natural gas properties, costs of productive wells, developmental dry holes and productive leases are capitalized into appropriate groups of properties based on geographical and geological similarities. Acquisition costs of proved properties are amortized using the unit-of-production method based on total proved reserves, and exploration well costs and additional development costs are amortized using the unit-of-production method based on proved developed reserves. Proceeds from the sale of properties are credited to property costs, and a gain or loss is recognized when a significant portion of an amortization base is sold or abandoned. Exploration costs, such as exploratory geological and geophysical costs, delay rentals and exploration overhead, are charged to expense as incurred. Exploratory drilling costs, including the cost of stratigraphic test wells, are initially capitalized but charged to exploration expense if and when the well is determined to be non-productive. The determination of an exploratory well’s ability to produce generally must be made within one year from the completion of drilling activities. The acquisition costs of unproved acreage are initially capitalized and are carried at cost, net of accumulated impairment provisions, until such leases are transferred to proved properties or charged to exploration expense as impairments of unproved properties.
Impairment of Long-Lived Assets. We follow the provisions of Accounting Standards Codification (“ASC”) 360, Property, Plant and Equipment (“ASC 360”). ASC 360 requires that our long-lived assets be assessed for potential impairment of their carrying values whenever events or changes in circumstances indicate such impairment may have occurred. Proved oil and natural gas properties are evaluated by field for potential impairment. An impairment on proved properties is recognized when the estimated undiscounted future net cash flows of a field are less than its carrying value. If an impairment occurs, the carrying value of the impaired field is reduced to its estimated fair value, which is generally estimated using a discounted cash flow approach.
Unproved oil and natural gas properties do not have producing properties and are valued on acquisition by management, with the assistance of an independent expert when necessary. As reserves are proved through the successful completion of exploratory wells, the cost is transferred to proved properties. The cost of the remaining unproved basis is periodically evaluated by management to assess whether the value of a property has diminished. To do this assessment, management considers (i) estimated potential reserves and future net revenues from an independent expert, (ii) the Company’s history in exploring the area, (iii) the Company’s future drilling plans per its capital drilling program prepared by the Company’s reservoir engineers and operations management, and (iv) other factors associated with the area. Impairment is taken on the unproved property value if it is determined that the costs are not likely to be recoverable. The valuation is subjective and requires management to make estimates and assumptions which, with the passage of time, may prove to be materially different from actual results.
Business Combinations. We follow ASC 805, Business Combinations (“ASC 805”), and ASC 810-10-65, Consolidation (“ASC 810-10-65”). ASC 805 requires most identifiable assets, liabilities, non-controlling interests, and goodwill acquired in a business combination to be recorded at “fair value.” The statement applies to all business combinations, including combinations among mutual entities and combinations by contract alone. Under ASC 805, all business combinations will be accounted for by applying the acquisition method.
Foreign Currency Translation and Remeasurement. We follow ASC 830, Foreign Currency Matters (“ASC 830”) which requires the assets, liabilities, and results of operations of a foreign operation to be measured using the functional currency of that foreign operation. The functional currency for each of our subsidiaries in Turkey and Bulgaria is the local currency and is the U.S. Dollar in Albania. For certain entities, translation adjustments result from the process of translating the functional currency of the foreign operation’s financial statements into our U.S. Dollar reporting currency, which is a non-cash transaction. These translation adjustments are reported separately and accumulated in the consolidated balance sheets as a component of accumulated other comprehensive loss.
ASC 830 requires the assets, liabilities, and results of operations of a foreign operation to be measured using the functional currency of that foreign operation. Exchange gains or losses from re-measuring transactions and monetary accounts in a currency other than the functional currency are included in earnings.
Oil and Gas Reserves. The estimates of proved oil and natural gas reserves utilized in the preparation of the consolidated and combined financial statements are estimated in accordance with the rules established by the SEC and the Financial Accounting Standards Board (“FASB”). These rules require that reserve estimates be prepared under existing economic and operating conditions using a trailing 12-month average price with no provision for price and cost escalations in future years except by contractual arrangements. We engaged DeGolyer and MacNaughton, our independent reserve engineers, to independently evaluate our Turkey (excluding TBNG), Bulgaria and Albania properties that result in estimates for all of our estimated proved reserves at December 31, 2016.
44
Reserve estimates are inherently imprecise. Accordingly, the estimates are expected to change as more current information becomes available. It is possible that, because of changes in market conditions or the inherent imprecision of reserve estimates, the estimates of future cash inflows, future gross revenues, the amount of oil and natural gas reserves, the remaining estimated lives of oil and natural gas properties, or any combination of the above may be increased or decreased. Increases in recoverable economic volumes generally reduce per unit depletion rates while decreases in recoverable economic volumes generally increase per unit depletion rates.
Income Taxes. We follow the asset and liability method prescribed by ASC 740, Income Taxes (“ASC 740”). Under this method of accounting for income taxes, deferred tax assets and liabilities are recognized for the future tax consequences attributable to differences between the financial statement carrying amounts of existing assets and liabilities and their respective tax bases. Deferred tax assets and liabilities are measured using enacted tax rates expected to apply to taxable income in the years in which those temporary differences are expected to be recovered or settled. Under ASC 740, the effect on deferred tax assets and liabilities of a change in enacted tax rates is recognized in earnings in the period that includes the enactment date.
Other Recent Accounting Pronouncements and Reporting Rules
In March 2016, the FASB issued Accounting Standards Update (“ASU”) 2016-08, Revenue from Contracts with Customers (Topic 606): Principal versus Agent Considerations (Reporting Revenue Gross versus Net) (“ASU 2016-08”). ASU 2016-08 does not change the core principle of Topic 606 but clarifies the implementation guidance on principal versus agent considerations. ASU 2016-08 is effective for the annual and interim periods beginning after December 15, 2017. We are currently assessing the potential impact of ASU 2016-08 on our consolidated financial statements and results of operations.
In April 2016, the FASB issued ASU 2016-10, Revenue from Contracts with Customers (Topic 606): Identifying Performance Obligations and Licensing (“ASU 2016-10”). ASU 2016-10 does not change the core principle of Topic 606 but clarifies the following two aspects of Topic 606: identifying performance obligations and the licensing implementation guidance, while retaining the related principles for those areas. ASU 2016-10 is effective for annual and interim periods beginning after December 15, 2017. We are currently assessing the potential impact of ASU 2016-10 on our consolidated financial statements and results of operations.
In June 2016, the FASB issued ASU 2016-13, Financial Instruments - Credit Losses (“ASU 2016-13”). ASU 2016-13 changes the impairment model for most financial assets and certain other instruments, including trade and other receivables, held-to-maturity debt securities and loans, and requires entities to use a new forward-looking expected loss model that will result in the earlier recognition of allowance for losses. This update is effective for fiscal years beginning after December 15, 2019, including interim periods within those fiscal years. Early adoption is permitted for a fiscal year beginning after December 15, 2018, including interim periods within that fiscal year. Entities will apply the standard's provisions as a cumulative-effect adjustment to retained earnings as of the beginning of the first reporting period in which the guidance is adopted. We are currently assessing the potential impact of ASU 2016-13 on our consolidated financial statements and results of operations.
In August 2016, the FASB issued ASU 2016-15, Statement of Cash Flows (Topic 230): Classification of Certain Cash Receipts and Cash Payments ("ASU 2016-15"). ASU 2016-15 reduces diversity in practice in how certain transactions are classified in the statement of cash flows. The amendments in ASU 2016-15 provide guidance on specific cash flow issues including debt prepayment or debt extinguishment costs, settlement of zero-coupon debt instruments or other debt instruments with coupon interest rates that are insignificant in relation to the effective interest rate of the borrowing, contingent consideration payments made after a business combination, proceeds from the settlement of insurance claims, proceeds from the settlement of corporate-owned life insurance policies, and distributions received from equity method investees. ASU 2016-15 is effective for annual and interim periods beginning after December 15, 2017. We are currently assessing the potential impact of ASU 2016-15 on our consolidated financial statements and results of operations.
In November 2016, the FASB issued ASU 2016-18, Statement of Cash Flows (Topic 230): Restricted Cash (“ASU 2016-18”). ASU 2016-18 requires that a statement of cash flows explain the change during the period in the total of cash, cash equivalents and amounts generally described as restricted cash or restricted cash equivalents. The amounts generally described as restricted cash and restricted cash equivalents should be included with cash and cash equivalents when reconciling the beginning-of-period and end-of-period total amounts shown on the statements of cash flows. The amended guidance will be effective for annual periods beginning after December 15, 2017. The amendments should be applied using a retrospective transition method to each period presented. Early adoption is permitted for any entity in any interim or annual period. We are currently evaluating the potential impact of ASU 2016-18 on our consolidated financial statements and results of operations.
We have reviewed other recently issued, but not yet adopted, accounting standards in order to determine their effects, if any, on our results of operations, financial position and cash flows. Based on that review, we believe that none of these recent pronouncements will have a significant effect on our current or future earnings or operations.
45
Results of Continuing Operations—Year Ended December 31, 2016 Compared to Year Ended December 31, 2015
|
|
Year Ended December 31, |
|
|
Change |
|
||||||
|
|
2016 |
|
|
2015 |
|
|
2016-2015 |
|
|||
|
|
(in thousands of U.S. Dollars, except per unit amounts and production volumes) |
|
|||||||||
|
Sales volumes: |
|
|
|
|
|
|
|
|
|
|
|
|
Oil (Mbbl) |
|
1,376 |
|
|
|
1,420 |
|
|
|
(44 |
) |
|
Natural gas (Mmcf) |
|
1,431 |
|
|
|
2,491 |
|
|
|
(1,060 |
) |
|
Total production (Mboe) |
|
1,615 |
|
|
|
1,835 |
|
|
|
(220 |
) |
|
Average daily sales volumes (Boepd) |
|
4,411 |
|
|
|
5,028 |
|
|
|
(617 |
) |
|
Average prices: |
|
|
|
|
|
|
|
|
|
|
|
|
Oil (per Bbl) |
$ |
39.07 |
|
|
$ |
44.69 |
|
|
$ |
(5.62 |
) |
|
Natural gas (per Mcf) |
$ |
6.75 |
|
|
$ |
7.73 |
|
|
$ |
(0.98 |
) |
|
Oil equivalent (per Boe) |
$ |
39.28 |
|
|
$ |
45.07 |
|
|
$ |
(5.79 |
) |
|
Revenues: |
|
|
|
|
|
|
|
|
|
|
|
|
Oil and natural gas sales |
$ |
63,424 |
|
|
$ |
82,716 |
|
|
$ |
(19,292 |
) |
|
Sales of purchased natural gas |
|
5,038 |
|
|
|
2,189 |
|
|
|
2,849 |
|
|
Other |
|
133 |
|
|
|
159 |
|
|
|
(26 |
) |
|
Total revenues |
|
68,595 |
|
|
|
85,064 |
|
|
|
(16,469 |
) |
|
Costs and expenses: |
|
|
|
|
|
|
|
|
|
|
|
|
Production |
|
12,368 |
|
|
|
12,873 |
|
|
|
(505 |
) |
|
Exploration, abandonment and impairment |
|
5,963 |
|
|
|
21,544 |
|
|
|
(15,581 |
) |
|
Cost of purchased natural gas |
|
4,418 |
|
|
|
2,082 |
|
|
|
2,336 |
|
|
Seismic and other exploration |
|
104 |
|
|
|
370 |
|
|
|
(266 |
) |
|
General and administrative |
|
16,320 |
|
|
|
24,138 |
|
|
|
(7,818 |
) |
|
Depletion |
|
27,421 |
|
|
|
35,093 |
|
|
|
(7,672 |
) |
|
Depreciation and amortization |
|
1,604 |
|
|
|
2,614 |
|
|
|
(1,010 |
) |
|
Interest and other expense |
|
11,841 |
|
|
|
13,077 |
|
|
|
(1,236 |
) |
|
Foreign exchange loss |
|
3,871 |
|
|
|
5,653 |
|
|
|
(1,782 |
) |
|
Deferred income tax (benefit) expense |
|
(25 |
) |
|
|
18,642 |
|
|
|
(18,667 |
) |
|
(Loss) gain on commodity derivative contracts: |
|
|
|
|
|
|
|
|
|
|
|
|
Cash settlements on commodity derivative contracts |
|
4,188 |
|
|
|
57,076 |
|
|
|
(52,888 |
) |
|
Change in fair value on commodity derivative contracts |
|
(7,445 |
) |
|
|
(29,619 |
) |
|
|
22,174 |
|
|
Total (loss) gain on commodity derivative contracts |
|
(3,257 |
) |
|
|
27,457 |
|
|
|
(30,714 |
) |
|
Oil and natural gas costs per Boe: |
|
|
|
|
|
|
|
|
|
|
|
|
Production |
$ |
6.70 |
|
|
$ |
6.14 |
|
|
$ |
0.56 |
|
|
Depletion |
$ |
16.04 |
|
|
$ |
16.73 |
|
|
$ |
(0.69 |
) |
Oil and Natural Gas Sales. Excluding sales of purchased natural gas, total oil and natural gas sales decreased to $63.4 million in 2016, from $82.7 million in 2015. Of this decrease, $9.4 million resulted from a lower average realized price per Boe in 2016. Our average price received decreased $5.79 to $39.28 per Boe in 2016, compared to $45.07 per Boe in 2015. Additionally, sales volumes decreased 220 Mboe, primarily from natural gas volumes, which resulted in lower revenues of $9.9 million.
Production. Production expenses for the year ended December 31, 2016, decreased to $12.4 million or $6.70 per Boe (WI), from $12.9 million or $6.14 per Boe (WI) for the year ended December 31, 2015. This decrease was primarily due to the devaluation of the TRY compared to the U.S. Dollar in 2016, fewer workovers, reduced headcount and successful cost-cutting measures in our field operations for the year ended December 31, 2016. The increase of $0.56 per Boe was primarily due to a decrease in production volumes during 2016, compared to the same period in 2015.
Exploration, Abandonment and Impairment. Exploration, abandonment and impairment costs decreased to $6.0 million in 2016, compared to $21.5 million for 2015. The decrease was primarily due to a decrease in unproved impairment and exploratory expense of $7.9 million, a decrease in proved property impairment of $3.3 million and in decrease in other impairments of $4.4 million.
Seismic and Other Exploration. Seismic and other exploration costs decreased to $0.1 million for 2016, compared to $0.4 million for 2015. The decrease was primarily due to a decrease in seismic activities during 2016.
46
General and Administrative. General and administrative expense decreased $7.8 million to $16.3 million for 2016, compared to $24.1 million for 2015. The decrease was primarily due to the Company’s cost reduction initiatives which included a decrease in salary and personnel expenses of $5.8 million due to a reduction in salaries and headcount, a decrease in office and rent expense of $0.6 million, a decrease in accounting and other services of $0.5 million, a decrease in bad debt expense of $0.4 million, and a decrease in travel expense of $0.3 million.
Depletion. Depletion expense decreased to $27.4 million or $16.04 per Boe for 2016, compared to $35.1 million or $16.73 per Boe for 2015. The decrease was due primarily to fewer additions to proved properties on our Selmo and Bahar fields, a decrease in production volumes during 2016 and a devaluation of the TRY compared to the U.S. Dollar in 2016.
Interest and Other Expense. Interest and other expense decreased to $11.8 million in 2016, compared to $13.1 million in 2015. The decrease was primarily due to the termination of our Senior Credit Facility in August 2016 and replacing it with a Term Loan with DenizBank that has a lower interest rate.
Foreign Exchange Loss. We recorded a foreign exchange loss of $3.9 million in 2016, compared to $5.7 million in 2015. The change in foreign exchange is primarily unrealized (non-cash) in nature and results from the re-measuring of specific transactions and monetary accounts in a currency other than the functional currency. For example, a U.S. Dollar transaction which occurs in Turkey is re-measured at the period-end to the TRY amount if it has not been settled previously. The decrease in foreign exchange loss in 2016 was due to a 21.0% devaluation of the TRY compared to the U.S. Dollar in 2016, compared to a 25.4% devaluation during 2015 and is offset by fluctuations in our U.S. Dollar denominated balances in Turkey.
Deferred Income Tax (Benefit) Expense. Deferred income tax (benefit) expense decreased to a benefit of $25,000 for the year ended December 31, 2016, compared to an $18.6 million expense for 2015. The decrease was primarily due to changes in our deferred tax liabilities related to our permanent reinvestment assertion in Turkey and increases in uncertain tax positions, which were partially offset by changes in temporary differences between our U.S. GAAP and statutory balances in Turkey.
(Loss) Gain on Commodity Derivative Contracts. During 2016, we recorded a net loss on commodity derivative contracts of $3.3 million, compared to a net gain of $27.5 million for 2015. In 2016, we recorded a $4.2 million gain on settled contracts and a $7.4 million loss to mark our commodity derivative contracts to their fair value. In 2015, we recorded a $29.6 million loss to mark our commodity derivative contracts to their fair value and a $57.1 million gain on settled contracts.
Discontinued Operations. All revenues and expenses associated with our prior Albanian and Moroccan operations have been classified as discontinued operations. Our operating results from discontinued operations in Albania and Morocco are summarized as follows:
|
|
Albania |
|
|
Morocco |
|
|
Total |
|
|||
|
|
(in thousands) |
|
|||||||||
|
For the year ended December 31, 2016 |
|
|
|
|
|
|
|
|
|
|
|
|
Total revenues |
$ |
626 |
|
|
$ |
- |
|
|
$ |
626 |
|
|
Production and transportation expense |
|
1,138 |
|
|
|
- |
|
|
|
1,138 |
|
|
Total other costs and expenses |
|
561 |
|
|
|
- |
|
|
|
561 |
|
|
Total other income |
|
10,168 |
|
|
|
6,903 |
|
|
|
17,071 |
|
|
Income before income taxes |
$ |
9,095 |
|
|
$ |
6,903 |
|
|
$ |
15,998 |
|
|
Income tax benefit |
|
204 |
|
|
|
- |
|
|
|
204 |
|
|
Income from discontinued operations |
$ |
9,299 |
|
|
$ |
6,903 |
|
|
$ |
16,202 |
|
|
|
|
|
|
|
|
|
|
|
|
|
|
|
For the year ended December 31, 2015 |
|
|
|
|
|
|
|
|
|
|
|
|
Total revenues |
$ |
8,565 |
|
|
$ |
- |
|
|
$ |
8,565 |
|
|
Production and transportation expense |
|
11,615 |
|
|
|
- |
|
|
|
11,615 |
|
|
Exploration, abandonment and impairment |
|
86,577 |
|
|
|
- |
|
|
|
86,577 |
|
|
Total other costs and expenses |
|
9,229 |
|
|
|
5 |
|
|
|
9,234 |
|
|
Total other income |
|
1,819 |
|
|
|
- |
|
|
|
1,819 |
|
|
Loss before income taxes |
$ |
(97,037 |
) |
|
$ |
(5 |
) |
|
$ |
(97,042 |
) |
|
Income tax benefit |
|
16,169 |
|
|
|
- |
|
|
|
16,169 |
|
|
Loss from discontinued operations |
$ |
(80,868 |
) |
|
$ |
(5 |
) |
|
$ |
(80,873 |
) |
47
Results of Continuing Operations—Year Ended December 31, 2015 Compared to Year Ended December 31, 2014
|
|
Year Ended December 31, |
|
|
Change |
|
||||||
|
|
2015 |
|
|
2014 |
|
|
2015-2014 |
|
|||
|
|
(in thousands of U.S. Dollars, except per unit amounts and production volumes) |
|
|||||||||
|
Sales volumes: |
|
|
|
|
|
|
|
|
|
|
|
|
Oil (Mbbl) |
|
1,420 |
|
|
|
1,303 |
|
|
|
117 |
|
|
Natural gas (Mmcf) |
|
2,491 |
|
|
|
3,262 |
|
|
|
(771 |
) |
|
Total production (Mboe) |
|
1,835 |
|
|
|
1,846 |
|
|
|
(11 |
) |
|
Average daily sales volumes (Boepd) |
|
5,028 |
|
|
|
5,058 |
|
|
|
(30 |
) |
|
Average prices: |
|
|
|
|
|
|
|
|
|
|
|
|
Oil (per Bbl) |
$ |
44.69 |
|
|
$ |
82.93 |
|
|
$ |
(38.24 |
) |
|
Natural gas (per Mcf) |
$ |
7.73 |
|
|
$ |
8.66 |
|
|
$ |
(0.93 |
) |
|
Oil equivalent (per Boe) |
$ |
45.07 |
|
|
$ |
73.82 |
|
|
$ |
(28.75 |
) |
|
Revenues: |
|
|
|
|
|
|
|
|
|
|
|
|
Oil and natural gas sales |
$ |
82,716 |
|
|
$ |
136,276 |
|
|
$ |
(53,560 |
) |
|
Sales of purchased natural gas |
|
2,189 |
|
|
$ |
2,127 |
|
|
|
62 |
|
|
Other |
|
159 |
|
|
$ |
427 |
|
|
|
(268 |
) |
|
Total revenues |
|
85,064 |
|
|
|
138,830 |
|
|
|
(53,766 |
) |
|
Costs and expenses: |
|
|
|
|
|
|
|
|
|
|
|
|
Production |
|
12,873 |
|
|
|
18,193 |
|
|
|
(5,320 |
) |
|
Exploration, abandonment and impairment |
|
21,544 |
|
|
|
19,864 |
|
|
|
1,680 |
|
|
Cost of purchased natural gas |
|
2,082 |
|
|
|
2,055 |
|
|
|
27 |
|
|
Seismic and other exploration |
|
370 |
|
|
|
4,285 |
|
|
|
(3,915 |
) |
|
Revaluation of contingent consideration |
|
- |
|
|
|
(2,500 |
) |
|
|
2,500 |
|
|
General and administrative |
|
24,138 |
|
|
|
31,071 |
|
|
|
(6,933 |
) |
|
Depletion |
|
35,093 |
|
|
|
46,479 |
|
|
|
(11,386 |
) |
|
Depreciation and amortization |
|
2,614 |
|
|
|
2,115 |
|
|
|
499 |
|
|
Interest and other expense |
|
13,077 |
|
|
|
6,044 |
|
|
|
7,033 |
|
|
Foreign exchange loss |
|
5,653 |
|
|
|
6,523 |
|
|
|
(870 |
) |
|
Deferred income tax expense |
|
18,642 |
|
|
|
11,875 |
|
|
|
6,767 |
|
|
Gain (loss) on commodity derivative contracts: |
|
|
|
|
|
|
|
|
|
|
|
|
Cash settlements on commodity derivative contracts |
|
57,076 |
|
|
|
(2,100 |
) |
|
|
59,176 |
|
|
Change in fair value on commodity derivative contracts |
|
(29,619 |
) |
|
|
39,554 |
|
|
|
(69,173 |
) |
|
Total gain (loss) on commodity derivative contracts |
|
27,457 |
|
|
|
37,454 |
|
|
|
(9,997 |
) |
|
Oil and natural gas costs per Boe: |
|
|
|
|
|
|
|
|
|
|
|
|
Production |
$ |
6.14 |
|
|
$ |
8.62 |
|
|
$ |
(2.48 |
) |
|
Depletion |
$ |
16.73 |
|
|
$ |
22.03 |
|
|
$ |
(5.30 |
) |
Oil and Natural Gas Sales. Excluding sales of purchased natural gas, total oil and natural gas sales decreased to $82.7 million in 2015, from $136.3 million in 2014. Of this decrease, $52.8 million resulted from a lower average realized price per Boe in 2015. Our average price received decreased $28.75 to $45.07 per Boe in 2015, compared to $73.82 per Boe in 2014. Additionally, sales volumes decreased 11 Mboe which resulted in lower revenues of $0.8 million.
Production. Production expenses for the year ended December 31, 2015, decreased to $12.9 million or $6.14 per Boe (WI), from $18.2 million or $8.62 per Boe (WI) for the year ended December 31, 2014. This decrease was primarily due to a higher devaluation of the TRY compared to the U.S. Dollar in 2015, fewer workovers, reduced headcount and successful cost-cutting measures in our field operations for the year ended December 31, 2015.
Exploration, Abandonment and Impairment. Exploration, abandonment and impairment costs increased to $21.5 million in 2015, compared to $19.9 million for 2014. The increase was primarily due to $5.5 million of goodwill impairment, partially offset by a $3.9 million decrease in proved property impairment and impairment of exploratory well costs in 2015.
Seismic and Other Exploration. Seismic and other exploration costs decreased to $0.4 million for 2015, compared to $4.3 million for 2014. The decrease was primarily due to a decrease in seismic activities, which were conducted on our West Molla license during 2014.
48
Revaluation of Contingent Consideration. We completed the drilling and testing requirements pursuant to an amendment to the purchase agreement with Direct Petroleum LLC (“Direct”), which resulted in the reversal in 2014 of a $2.5 million contingent liability that was originally recorded in 2011.
General and Administrative. General and administrative expense decreased $6.9 million to $24.1 million for 2015, compared to $31.1 million for 2014. The decrease was primarily due to a decrease in legal, accounting and other services of $2.6 million, a decrease in office expense of $1.7 million, a decrease in bad debt expense of $1.2 million, a decrease in personnel expenses of $0.9, decrease in travel expense of $0.6 million and a decrease in vehicle expense of $0.2 million. In addition, severance expense was $1.3 million for 2015 compared to $0.3 million for 2014.
Depletion. Depletion expense decreased to $35.1 million or $16.73 per Boe for 2015, compared to $46.5 million or $22.03 per Boe for 2014. The decrease was due primarily to fewer additions to proved properties on our Selmo and Bahar fields, a 25.4% devaluation of the TRY compared to the U.S. Dollar in 2015 compared to an 8.6% devaluation during 2014 and a decrease in production volumes during 2015.
Interest and Other Expense. Interest and other expense increased to $13.1 million in 2015, compared to $6.0 million in 2014. The increase was primarily due to interest expense on $55.0 million aggregate principal amount of 2017 Notes, which were issued in December 2014 and January 2015.
Foreign Exchange Loss. We recorded a foreign exchange loss of $5.7 million in 2015, compared to $6.5 million in 2014. The change in foreign exchange is primarily unrealized (non-cash) in nature and results from the re-measuring of specific transactions and monetary accounts in a currency other than the functional currency. For example, a U.S. Dollar transaction which occurs in Turkey is re-measured at the period-end to the TRY amount if it has not been settled previously. The decrease in foreign exchange loss in 2015 was due to a 25.4% devaluation of the TRY compared to the U.S. Dollar in 2015, compared to an 8.6% devaluation during 2014 and is offset by fluctuations in our U.S. Dollar denominated balances in Turkey.
Deferred Income Tax Expense. Deferred income tax expense increased to $18.6 million for the year ended December 31, 2015, compared to $11.9 million for 2014. The increase was primarily due to changes in our deferred tax liabilities related to our permanent reinvestment assertion in Turkey and increases in uncertain tax positions, which were partially offset by changes in temporary differences between our U.S. GAAP and statutory balances in Turkey.
Gain (Loss) on Commodity Derivative Contracts. During 2015, we recorded a net gain on commodity derivative contracts of $27.5 million, compared to a net gain of $37.5 million for 2014. In 2015, we recorded a $57.1 million gain on settled contracts and a $29.6 million loss to mark our commodity derivative contracts to their fair value. In 2014, we recorded a $39.6 million gain to mark our commodity derivative contracts to their fair value and a $2.1 million loss on settled contracts.
49
Discontinued Operations. All revenues and expenses associated with our Albanian and Moroccan operations have been classified as discontinued operations. Our operating results from discontinued operations in Albania and Morocco are summarized as follows:
|
|
Albania |
|
|
Morocco |
|
|
Total |
|
|||
|
|
(in thousands) |
|
|||||||||
|
For the year ended December 31, 2015 |
|
|
|
|
|
|
|
|
|
|
|
|
Total revenues |
$ |
8,565 |
|
|
$ |
- |
|
|
$ |
8,565 |
|
|
Production and transportation expense |
|
11,615 |
|
|
|
- |
|
|
|
11,615 |
|
|
Exploration, abandonment and impairment |
|
86,577 |
|
|
|
- |
|
|
|
86,577 |
|
|
Total other costs and expenses |
|
9,229 |
|
|
|
5 |
|
|
|
9,234 |
|
|
Total other income |
|
1,819 |
|
|
|
- |
|
|
|
1,819 |
|
|
Loss before income taxes |
$ |
(97,037 |
) |
|
$ |
(5 |
) |
|
$ |
(97,042 |
) |
|
Income tax benefit |
|
16,169 |
|
|
|
- |
|
|
|
16,169 |
|
|
Loss from discontinued operations |
$ |
(80,868 |
) |
|
$ |
(5 |
) |
|
$ |
(80,873 |
) |
|
|
|
|
|
|
|
|
|
|
|
|
|
|
For the year ended December 31, 2014 |
|
|
|
|
|
|
|
|
|
|
|
|
Total revenues |
$ |
1,898 |
|
|
$ |
- |
|
|
$ |
1,898 |
|
|
Total costs and expenses |
|
2,984 |
|
|
|
20 |
|
|
|
3,004 |
|
|
Total other income |
|
356 |
|
|
|
- |
|
|
|
356 |
|
|
Loss before income taxes |
$ |
(730 |
) |
|
$ |
(20 |
) |
|
$ |
(750 |
) |
|
Income tax benefit |
|
612 |
|
|
|
- |
|
|
|
612 |
|
|
Loss from discontinued operations |
$ |
(118 |
) |
|
$ |
(20 |
) |
|
$ |
(138 |
) |
|
|
(1) |
Our Albanian segment was acquired on November 18, 2014. Actual results include revenues and expenses from November 18, 2014 to December 31, 2014. |
Capital Expenditures
For 2016, we incurred $10.3 million in total capital expenditures, including license acquisition, seismic and corporate expenditures from continuing operations, compared to $22.8 million for 2015.
We expect our net field capital expenditures for 2017 to range between $25.0 million and $35.0 million. We expect net field capital expenditures during 2017 to include approximately $24.0 million of drilling and completion expense for between five and six gross wells, between $3.0 million and $4.5 million for 3D seismic, and $1.0 million in infrastructure improvements and other capital investments in Southeast Turkey. Most of the remaining 2017 expenditures are expected to be invested in our Selmo, Bahar and Molla areas of Southeast Turkey and the Koynare license in Bulgaria. We expect cash on hand and cash flow from operations will be sufficient to fund our 2017 net field capital expenditures. If not, we will either curtail our discretionary capital expenditures or seek other funding sources. Our projected 2017 capital expenditure budget is subject to change.
Liquidity and Capital Resources
Our primary sources of liquidity for 2016 were our cash and cash equivalents, cash flow from operations, borrowings under the Term Loan, and the net proceeds from the sale of Series A Preferred Shares. At December 31, 2016, we had cash and cash equivalents of $10.0 million, $3.8 million in long-term debt, $38.2 million in short-term debt and a working capital deficit of $17.3 million (excluding assets and liabilities held for sale), compared to cash and cash equivalents of $5.7 million, $55.0 million in long-term debt, $35.5 million in short-term debt and a working capital deficit of $24.5 million (excluding assets and liabilities held for sale) at December 31, 2015.
During 2016, we focused on several transactions to deleverage our balance sheet, repay our Senior Credit Facility with BNP and IFC, obtain new debt financing, raise cash from asset sales and refinance a portion of the 2017 Notes. Subsequent to year end, on February 24, 2017, we closed the sale of TBNG for gross proceeds of $20.9 million, and approximate net cash proceeds of $16.3 million. We will continue to focus on reducing our outstanding indebtedness during 2017.
Based on current forecasted oil prices for 2017 and beyond, we believe that our cash flows from operations and existing cash on hand are sufficient to conduct our planned operations and meet our contractual requirements, including license obligations through March 31, 2018.
50
Net cash provided by operating activities from continuing operations during 2016 was $21.4 million, a decrease from net cash provided by operating activities from continuing operations of $86.5 million in 2015, due primarily to a decrease in cash settlements on our commodity derivative contracts and a decrease in our oil and natural gas revenues, which was partially offset by a decrease in general and administrative expenses.
Net cash used in investing activities from continuing operations during 2016 decreased to $8.5 million, compared to net cash used in investing activities from continuing operations of $31.7 million in 2015, due primarily to a decrease in drilling operations in light of the low oil price environment. Additionally, net cash used in financing activities from continuing operations was $7.4 million in 2016, compared to net cash used in financing activities from continuing operations of $40.3 million in 2015. The decrease was due primarily to an increase in our borrowings and the proceeds from the Series A Preferred Shares offering.
As of December 31, 2016, we had $41.9 million of debt and $46.1 million of Series A Preferred Shares outstanding, which are discussed below.
Series A Preferred Shares. On November 4, 2016, we issued 921,000 shares of our Series A Preferred Shares. Of the 921,000 Series A Preferred Shares, (i) 815,000 shares were issued in exchange for $40.75 million aggregate principal amount of our 2017 Notes, at an exchange rate of 20 Series A Preferred Shares for each $1,000 principal amount of 2017 Notes, and (ii) 106,000 shares were issued and sold to certain holders of the 2017 Notes. All of the Series A Preferred Shares were issued at a value of $50.00 per share, raising gross proceeds of $5.3 million. We used $4.3 million of the gross proceeds to redeem a portion of the remaining 2017 Notes. The remaining proceeds were used for general corporate purposes. The Series A Preferred Shares contain a substantive conversion option, are mandatorily redeemable and convert into a fixed number of common shares. As a result, under U.S GAAP, we have classified the Series A Preferred Shares within mezzanine equity in our consolidated balance sheet.
Pursuant to the Certificate of Designations for the Series A Preferred Shares (the “Certificate of Designations”), each Series A Preferred Share may be converted at any time, at the option of the holder, into 45.754 common shares (which is equal to an initial conversion price of approximately $1.0928 per common share and is subject to customary adjustment for stock splits, stock dividends, recapitalizations or other fundamental changes). During the period ending on November 4, 2017, the conversion rate will be adjusted on an economic weighted average anti-dilution basis for the issuance of common shares for cash at a price below the conversion price then in effect. Such anti-dilution protection shall exclude (i) dividends paid on the Series A Preferred Shares in common shares, (ii) issuances of common shares in connection with acquisitions, (iii) issuances of common shares under currently outstanding convertible notes and warrants and (iv) issuances of common shares in connection with employee compensation arrangements and employee benefit plans. This non-standard dilution adjustment clause will result in a contingent beneficial conversion feature.
If not converted sooner, on November 4, 2024, we are required to redeem the outstanding Series A Preferred Shares in cash at a price per share equal to the liquidation preference plus accrued and unpaid dividends. At any time on or after November 4, 2020, we may redeem all or a portion of the Series A Preferred Shares at the redemption prices listed below (expressed as a percentage of the liquidation preference amount per share) plus accrued and unpaid dividends to the date of redemption, if the closing sale price of the common shares equals or exceeds 150% of the conversion price then in effect for at least 10 trading days (whether or not consecutive) in a period of 20 consecutive trading days, including the last trading day of such 20 trading day period, ending on, and including, the trading day immediately preceding the business day on which we issue a notice of optional redemption. The redemption prices for the 12-month period starting on the date below are:
|
Period Commencing |
Redemption Price |
|
November 4, 2020 |
105.000% |
|
November 4, 2021 |
103.000% |
|
November 4, 2022 |
101.000% |
|
November 4, 2023 and thereafter |
100.000% |
Additionally, upon the occurrence of a change of control, we are required to offer to redeem the Series A Preferred Shares within 120 days after the first date on which such change of control occurred, for cash at a redemption price equal to the liquidation preference per share, plus any accrued and unpaid dividends.
Dividends on the Series A Preferred Shares are payable quarterly at our election in cash, common shares or a combination of cash and common shares at an annual dividend rate of 12.0% of the liquidation preference if paid all in cash or 16.0% of the liquidation preference if paid in common shares. If paid partially in cash and partially in common shares, the dividend rate on the cash portion is 12.0%, and the dividend rate on the common share portion is 16.0%. Dividends are payable quarterly, on June 30, September 30, December 31, and March 31 of each year. The holders of the Series A Preferred Shares are also entitled to participate pro-rata in any dividends paid on the common shares on an as-converted-to-common shares basis. For the year ended December 31, 2016, we paid $0.9 million in cash dividends on the Series A Preferred Shares.
51
Except as required by Bermuda law, the holders of Series A Preferred Shares have no voting rights, except that for so long as at least 400,000 Series A Preferred Shares are outstanding, the holders of the Series A Preferred Shares voting as a separate class have the right to elect two directors to the Company’s Board of Directors. For so long as between 80,000 and 399,999 Series A Preferred Shares are outstanding, the holders of the Series A Preferred Shares voting as a separate class have the right to elect one director to the Company’s Board of Directors. Upon less than 80,000 Series A Preferred Shares remaining outstanding, any directors elected by the holders of Series A Preferred Shares shall immediately resign from the Company’s Board of Directors.
The Certificate of Designation also provides that without the approval of the holders of a majority of the outstanding Series A Preferred Shares, we will not issue indebtedness for money borrowed or other securities which are senior to the Series A Preferred Shares in excess of the greater of (i) $100 million or (ii) 35% of Company’s PV-10 of proved reserves as disclosed in its most recent independent reserve report filed or furnished on EDGAR. In addition, until the 2017 Notes are repaid in full, we will not issue indebtedness for money borrowed (other than ordinary trade indebtedness and up to $30.0 million borrowed from DenizBank) unless the net proceeds thereof are used (i) to redeem, retire or repay the 2017 Notes, (ii) spud, drill or complete two designated wells, or (iii) used in connection with collateralization or guarantees with respect to hedging efforts.
We have agreed to use commercially reasonable efforts to file a shelf registration statement for the resale of the Series A Preferred Shares and the common shares issuable upon conversion of the Series A Preferred Shares prior to November 5, 2017 and have such shelf registration statement declared effective by the SEC as soon as practicable after filing.
Term Loan. On August 31, 2016, DenizBank entered into a $30.0 million Term Loan with TransAtlantic Exploration Mediterranean International Pty Ltd (“TEMI”). In addition, we and DenizBank entered into additional agreements with respect to up to $20.0 million of non-cash facilities, including guarantee letters and treasury instruments for future hedging transactions. On September 7, 2016, TEMI used approximately $22.9 million of the proceeds from the Term Loan to repay in full the Senior Credit Facility.
The Term Loan bears interest at a fixed rate of 5.25% (plus 0.2625% for Banking and Insurance Transactions Tax per the Turkish government) per annum and is payable in six monthly installments of $1.25 million each through February 2017 and thereafter in twelve monthly installments of $1.88 million each through February 2018. The Term Loan matures in February 2018. Amounts repaid under the Term Loan may not be re-borrowed, and early repayments under the Term Loan are subject to early repayment fees.
The Term Loan is guaranteed by DMLP, TransAtlantic Turkey, Ltd. (“TransAtlantic Turkey”), Talon Exploration, Ltd. (“Talon Exploration”) and TransAtlantic Worldwide (collectively, the “Guarantors”). Each of the Guarantors is a wholly-owned subsidiary of the Company.
The Term Loan contains standard prohibitions on the activities of TEMI as the borrower, including prohibitions on granting of liens on its assets, incurring additional debt, dissolving, liquidating, merging, consolidating, paying dividends, making certain investments, selling assets or transferring revenue, and other similar matters. In addition, the Term Loan prohibits Amity Oil International Pty Ltd (“Amity”) and Petrogas Petrol Gaz ve Petrokimya Urunleri Insaat Sanayi ve Ticaret A.S. (“Petrogas”) from incurring additional debt. An event of default under the Term Loan includes, among other events, failure to pay principal or interest when due, breach of certain covenants, representations, warranties and obligations, bankruptcy or insolvency and the occurrence of a material adverse effect.
The Term Loan is secured by a pledge of (i) the stock of TEMI, DMLP, TransAtlantic Turkey and Talon Exploration, (ii) substantially all of the assets of TEMI, (iii) certain real estate owned by Petrogas, (iv) the Gundem real estate and Muratli real estate owned by Gundem Turizm Yatirim ve Isletmeleri A.S. (“Gundem”) and (v) the Diyarbakir real estate owned 80% by N. Malone Mitchell 3rd and 20% by Selami Erdem Uras. In addition, TEMI assigned its Turkish collection accounts and its receivables from the sale of oil to the Lender as additional security for the Term Loan. Gundem is beneficially owned by Mr. Mitchell, his adult children, and Mr. Uras. Mr. Mitchell is our chief executive officer and chairman of our board of directors. Mr. Uras is our vice president, Turkey.
At December 31, 2016, we had $25.0 million outstanding under the Term Loan and no availability, and we were in compliance with the covenants in the Term Loan.
2017 Notes. As of December 31, 2016, we had $14.3 million aggregate principal amount of outstanding 2017 Notes. The 2017 Notes were issued pursuant to an indenture, dated as of February 20, 2015 (the “Indenture”), between us and U.S. Bank National Association, as trustee (the “Trustee”). In addition, in January 2017, we redeemed $4.3 million of 2017 Notes with the proceeds from our offering of Series A Preferred Shares.
52
The 2017 Notes bear interest at an annual rate of 13.0%, payable semi-annually, in arrears, on January 1 and July 1 of each year. The 2017 Notes mature on July 1, 2017, unless earlier redeemed or converted.
On November 4, 2016, we exchanged $40.75 million of 2017 Notes for 815,000 of our Series A preferred Shares. After consummation of the exchange offer, we had $14.3 million aggregate principal amount of 2017 Notes outstanding.
Holders may from time to time at such holder’s option, convert, subject to certain terms and conditions, any or all of the principal of any 2017 Note into fully paid and nonassessable common shares at the conversion price. The initial conversion price is $6.80 per common share, subject to adjustment as described in the Indenture. Prior to or contemporaneously with the conversion of any of the principal of a 2017 Note, all accrued but unpaid interest on the principal amount being converted will be paid in cash. The 2017 Notes may not be converted into common shares on the maturity date or the redemption date. We may redeem all or part of the 2017 Notes at par, plus accrued and unpaid interest to the redemption date.
If we experience a fundamental change (as defined in the Indenture), we will be required to make an offer to repurchase the 2017 Notes at a price equal to 100% of the principal amount thereof, plus accrued and unpaid interest, if any, up to but excluding the date of repurchase. Additionally, if we sell certain assets for $50.0 million or more in cash consideration, in certain circumstances, we will be required to use a portion of the net cash proceeds of such sale to make an offer to repurchase 2017 Notes at a price equal to the price we would be required to pay for an optional redemption at such time, plus accrued and unpaid interest, if any, up to but excluding the date of repurchase. The Indenture provides for customary events of default. The Indenture contains limited covenants.
ANBE Promissory Note. On December 30, 2015, TransAtlantic USA entered into a $5.0 million draw down convertible promissory note (the “Note”) with ANBE Holdings, L.P. (“ANBE”), an entity owned by the children of our chairman and chief executive officer, N. Malone Mitchell, 3rd, and controlled by an entity managed by Mr. Mitchell and his wife. The Note bears interest at a rate of 13.0% per annum. On December 30, 2015, we borrowed $3.6 million under the Note for general corporate purposes. On June 30, 2016, we issued 355,826 common shares in a private placement to ANBE in lieu of paying cash interest on the Note.
On October 31, 2016, TransAtlantic USA entered into an amendment of the Note with ANBE (the “ANBE Amendment”). The ANBE Amendment extended the maturity date of the Note from October 31, 2016 to September 30, 2017, provided for the Note to be repaid in four quarterly installments of $0.9 million each in December 2016 and March, June and September 2017, and provided for monthly payments of interest. In addition, pursuant to the ANBE Amendment, if the sale of TBNG is completed prior to the extended maturity date of the Note, then we will repay the Note in full with proceeds from the sale of TBNG within five business days from the closing of the sale. As of December 31, 2016, we had borrowed $2.7 million under the Note and had no availability. On February 27, 2017, we repaid the Note in full with a portion of the proceeds from the sale of TBNG.
Contractual Obligations
The following table presents a summary of our contractual obligations at December 31, 2016:
|
|
|
Payments Due By Year |
|
|
|||||||||||||||||||||||||
|
|
|
(in thousands) |
|
|
|||||||||||||||||||||||||
|
|
|
Total |
|
|
2017 |
|
|
2018 |
|
|
2019 |
|
|
2020 |
|
|
2021 |
|
|
Thereafter |
|
|
|||||||
|
Debt |
|
$ |
41,944 |
|
|
$ |
38,194 |
|
|
$ |
3,750 |
|
|
$ |
- |
|
|
$ |
- |
|
|
$ |
- |
|
|
$ |
- |
|
|
|
Series A Preferred Shares |
|
|
46,050 |
|
|
|
- |
|
|
|
- |
|
|
|
- |
|
|
|
- |
|
|
|
- |
|
|
|
46,050 |
|
(1) |
|
Series A Preferred Shares dividends (2) |
|
|
43,348 |
|
|
|
5,526 |
|
|
|
5,526 |
|
|
|
5,526 |
|
|
|
5,526 |
|
|
|
5,526 |
|
|
|
15,718 |
|
|
|
Interest |
|
|
2,962 |
|
|
|
2,874 |
|
|
|
88 |
|
|
|
- |
|
|
|
- |
|
|
|
- |
|
|
|
- |
|
|
|
Leases |
|
|
1,370 |
|
|
|
698 |
|
|
|
603 |
|
|
|
69 |
|
|
|
- |
|
|
|
- |
|
|
|
- |
|
|
|
Total |
|
$ |
135,674 |
|
|
$ |
47,292 |
|
|
$ |
9,967 |
|
|
$ |
5,595 |
|
|
$ |
5,526 |
|
|
$ |
5,526 |
|
|
$ |
61,768 |
|
|
|
|
(1) |
Represents the redemption amount of the Series A Preferred Shares payable on November 4, 2024 and assumes no conversion of the Series A Preferred Shares into common shares or redemption of the Series A Preferred Shares, in each case, prior to November 4, 2024. |
|
|
(2) |
Dividends on the Series A Preferred Shares may be paid by the Company, in its sole discretion, in cash at a rate of 12% per annum or in common shares at a rate of 16% per annum or in a combination of cash and common shares. The amounts in the table assume that the Company pays all future dividend payments solely in cash. |
Off-Balance Sheet Arrangements
We did not have any off-balance sheet arrangements at December 31, 2016.
53
Item 7A. Quantitative and Qualitative Disclosures about Market Risk
We are exposed to market risk from changes in foreign currency exchange and hedging contracts. A discussion of the market risk exposures follows. Our market risk sensitive instruments were entered into for hedging and investment purposes, not for trading purposes.
Foreign Currency Risk
We are subject to changes in foreign currency exchange rates as a result of our operations in foreign countries. The assets, liabilities and results of operations of our foreign operations are measured using the functional currency of such foreign operations. The functional currency for each of our subsidiaries in Turkey and Bulgaria is the local currency. As a result, translation adjustments will result from the process of translating the functional currency of our foreign operations’ financial statements into the U.S. Dollar reporting currency, which is a non-cash transaction. Such non-cash translation adjustments accumulate on our consolidated balance sheets as a component of accumulated other comprehensive loss and are recorded in our consolidated statements of comprehensive income (loss).
The functional currency of our operations in Turkey and Bulgaria is the TRY and the Bulgarian Lev, respectively. The exchange rates used to translate the financial position of our Turkish and Bulgarian operations at December 31, 2016, 2015 and 2014 are shown below:
|
|
Year Ended December 31, |
|
|||||||||
|
|
2016 |
|
|
2015 |
|
|
2014 |
|
|||
|
New Turkish Lira per $1.00 U.S Dollar |
|
3.5192 |
|
|
|
2.9076 |
|
|
|
2.3189 |
|
|
Bulgarian Lev per $1.00 U.S. Dollar |
|
1.8555 |
|
|
|
1.7901 |
|
|
|
1.6084 |
|
We are also subject to foreign currency exposures as a result of our operations in the other foreign countries in which we operate. We record foreign exchange (gain) loss on our consolidated statements of comprehensive income (loss) as a component of other (expense) income for gains and losses which result from re-measuring transactions and monetary accounts into our functional currency in earnings. The change in foreign exchange (gain) loss is primarily unrealized (non-cash) in nature and results from the re-measuring of specific transactions and monetary accounts in a currency other than the functional currency. For example, a U.S. Dollar transaction which occurs in Turkey is re-measured at the period-end to the TRY amount if it has not been settled previously. For 2016 and 2015, we recorded a foreign exchange loss of $3.9 million and $5.7 million, respectively. We estimate that a 10% change in the exchange rates would impact our cash balances and our net loss by approximately $0.8 million. We have not used foreign currency forward contracts to manage exchange rate fluctuations.
Commodity Price Risk
Our revenues are derived from the sale of oil and natural gas. The prices for oil and natural gas are extremely volatile and sometimes experience large fluctuations as a result of relatively small changes in supplies, weather conditions, economic conditions and government actions. As a result, the Company has entered into collar contracts with DenizBank. The derivative contracts economically hedge against the variability in cash flows associated with the forecasted sale of our future oil production. While the use of the hedging arrangements will limit the downside risk of adverse price movements, it may also limit future gains from favorable movements. We continuously evaluate the trading price of Brent crude oil and may enter into additional hedges in the future.
We have elected not to designate our derivative financial instruments as hedges for accounting purposes, and accordingly, we record such contracts at fair value and recognize changes in such fair value in current earnings as they occur. We recognize gains and losses related to these contracts on a mark-to-market basis in our consolidated statements of comprehensive income (loss) under the caption “Gain (loss) on commodity derivative contracts.” Cash settlements of derivative contracts are included in operating activities on our consolidated statements of cash flows. All of our oil derivative contracts are settled based upon Brent crude oil pricing. If commodity prices decrease, this commodity price change could have a positive impact to our earnings. Conversely, if commodity prices increase, this commodity price change could have a negative effect on our earnings. Each derivative contract is evaluated separately to determine its own fair value. During 2016 and 2015, we recorded a net loss on commodity derivative contracts of $3.3 million and a net gain of $27.5 million, respectively.
54
The following tables summarize our outstanding commodity derivatives contracts with respect to our future oil production as of December 31, 2016:
|
|
|
|
|
|
|
|
|
Weighted |
|
|
Weighted |
|
|
|
|
|
||
|
|
|
|
|
|
|
|
|
Average |
|
|
Average |
|
|
|
|
|
||
|
|
|
|
|
Quantity |
|
|
Minimum |
|
|
Maximum Price |
|
|
Estimated Fair |
|
||||
|
Type |
|
Period |
|
(Bbl/day) |
|
|
Price (per Bbl) |
|
|
(per Bbl) |
|
|
Value of Liability |
|
||||
|
|
|
|
|
|
|
|
|
|
|
|
|
|
|
|
|
(in thousands) |
|
|
|
Collar |
|
January 1, 2017— December 31, 2017 |
|
|
296 |
|
|
$ |
47.50 |
|
|
$ |
61.00 |
|
|
$ |
(289 |
) |
|
Collar |
|
January 2, 2017— December 31, 2017 |
|
|
445 |
|
|
$ |
50.00 |
|
|
$ |
61.50 |
|
|
|
(307 |
) |
|
Collar |
|
January 1, 2018— February 28, 2018 |
|
|
458 |
|
|
$ |
50.00 |
|
|
$ |
61.50 |
|
|
|
(74 |
) |
|
Collar |
|
January 1, 2018— May 31, 2018 |
|
|
298 |
|
|
$ |
47.50 |
|
|
$ |
61.00 |
|
|
|
(168 |
) |
|
Total Estimated Fair Value of Liability |
|
|
|
|
|
|
|
|
|
|
|
|
|
|
|
$ |
(838 |
) |
Item 8. Financial Statements and Supplementary Data
See Index to Financial Statements on page F-1.
Item 9. Changes in and Disagreements with Accountants on Accounting and Financial Disclosure
None.
Item 9A. Controls and Procedures
Evaluation of Disclosure Controls and Procedures
Disclosure controls and procedures are designed to ensure that information required to be disclosed in reports filed or submitted under the Exchange Act is recorded, processed, summarized, and reported within the time periods specified in the SEC’s rules and forms. Disclosure controls and procedures include, without limitation, controls and procedures designed to ensure that information required to be disclosed in our reports filed or submitted under the Exchange Act is accumulated and communicated to management, including our chief executive officer and our chief financial officer, as appropriate to allow timely decisions regarding required disclosure.
As of December 31, 2016, management carried out an evaluation, under the supervision and with the participation of our chief executive officer and principal accounting and financial officer, of the effectiveness of our disclosure controls and procedures. Based upon the evaluation, our chief executive officer and principal accounting and financial officer concluded that, as of December 31, 2016, our disclosure controls and procedures were effective.
Management’s Annual Report on Internal Control Over Financial Reporting
Our management is responsible for establishing and maintaining adequate internal control over financial reporting. Internal control over financial reporting, as defined in Rules 13a-15(f) and 15d-15(f) under the Exchange Act, is a process designed by, or under the supervision of, the chief executive officer and principal accounting and financial officer, or persons performing similar functions, and effected by the board of directors, management and other personnel, to provide reasonable assurance regarding the reliability of financial reporting and the preparation of financial statements for external purposes in accordance with U.S. GAAP and includes those policies and procedures that (i) pertain to the maintenance of records that in reasonable detail accurately and fairly reflect the transactions and dispositions of assets, (ii) provide reasonable assurance that transactions are recorded as necessary to permit preparation of financial statements in accordance with U.S. GAAP, (iii) provide reasonable assurance that receipts and expenditures are being made only in accordance with appropriate authorizations of management and the board of directors, and (iv) provide reasonable assurance regarding prevention or timely detection of unauthorized acquisition, use or disposition of assets that could have a material effect on the financial statements.
55
Because of inherent limitations, internal control over financial reporting may not prevent or detect misstatements. Also, projections of any evaluation of effectiveness to future periods are subject to the risk that controls may become inadequate because of changes in conditions or that the degree of compliance with the policies or procedures may deteriorate.
Our management, under the supervision and with the participation of our chief executive officer and principal accounting and financial officer, conducted an evaluation of the effectiveness of our internal control over financial reporting based on the framework and criteria established in Internal Control – Integrated Framework (2013) issued by the Committee of Sponsoring Organizations of the Treadway Commission. Based on its evaluation, our management concluded that our internal control over financial reporting was effective as of December 31, 2016.
Changes in Internal Control Over Financial Reporting
There were no changes in our internal control over financial reporting that occurred during the quarter ended December 31, 2016 that have materially affected, or are reasonably likely to materially affect, our internal control over financial reporting.
None.
56
Item 10. Directors, Executive Officers and Corporate Governance
Certain information required in response to this Item 10 is contained under the heading “Executive Officers of the Registrant” in Part I of this Annual Report on Form 10-K. Other information required in response to this Item 10 is incorporated herein by reference to our definitive proxy statement to be filed with the SEC pursuant to Regulation 14A promulgated under the Exchange Act, not later than 120 days after the end of the fiscal year covered by this Annual Report on Form 10-K.
Code of Business Conduct
We have adopted a code of ethics that applies to all our officers, directors and employees, including our principal executive officer, principal financial officer, principal accounting officer and controller. The full text of our Code of Conduct is published on our website at www.transatlanticpetroleum.com, on the Corporate Governance page under the About tab. We intend to disclose future amendments to certain provisions of the Code of Conduct, or waivers of such provisions granted to executive officers and directors, on our website within four business days following the date of such amendment or waiver.
Item 11. Executive Compensation
The information required in response to this Item 11 is incorporated herein by reference to our definitive proxy statement to be filed with the SEC pursuant to Regulation 14A promulgated under the Exchange Act not later than 120 days after the end of the fiscal year covered by this Annual Report on Form 10-K.
Item 12. Security Ownership of Certain Beneficial Owners and Management and Related Stockholder Matters
The information required in response to this Item 12 is incorporated herein by reference to our definitive proxy statement to be filed with the SEC pursuant to Regulation 14A promulgated under the Exchange Act not later than 120 days after the end of the fiscal year covered by this Annual Report on Form 10-K.
Item 13. Certain Relationships and Related Transactions, and Director Independence
The information required in response to this Item 13 is incorporated herein by reference to our definitive proxy statement to be filed with the SEC pursuant to Regulation 14A promulgated under the Exchange Act not later than 120 days after the end of the fiscal year covered by this Annual Report on Form 10-K.
Item 14. Principal Accountant Fees and Services
The information required in response to this Item 14 is incorporated herein by reference to our definitive proxy statement to be filed with the SEC pursuant to Regulation 14A promulgated under the Exchange Act not later than 120 days after the end of the fiscal year covered by this Annual Report on Form 10-K.
57
Item 15. Exhibits and Financial Statement Schedules
|
(a) |
Documents filed as part of the Report. |
|
1. |
Reports of Independent Registered Public Accounting Firms |
|
|
Consolidated Balance Sheets as of December 31, 2016 and 2015 |
|
|
Consolidated Statements of Comprehensive Income (Loss) for the years ended December 31, 2016, 2015 and 2014 |
|
|
Consolidated Statements of Equity for the years ended December 31, 2016, 2015 and 2014 |
|
|
Consolidated Statements of Cash Flows for the years ended December 31, 2016, 2015 and 2014 |
|
|
Notes to Consolidated Financial Statements |
|
2. |
Exhibits required to be filed by Item 601 of Regulation S-K |
The exhibits required to be filed by this Item 15 are set forth in the Exhibit Index accompanying this report.
58
Pursuant to the requirements of Section 13 or 15(d) of the Securities Exchange Act of 1934, the registrant has duly caused this report to be signed on its behalf by the undersigned, thereunto duly authorized.
March 22, 2017
|
TRANSATLANTIC PETROLEUM LTD. |
|
|
|
/S/ N. MALONE MITCHELL 3rd |
|
N. Malone Mitchell 3rd Chief Executive Officer |
Pursuant to the requirements of the Securities Exchange Act of 1934, this report has been signed below by the following persons on behalf of the registrant and in the capacities and on the dates indicated.
|
Signature |
|
Capacity |
|
Date |
|
|
|
|
|
|
|
/S/ N. MALONE MITCHELL 3rd |
|
Chairman and Chief Executive Officer |
|
March 22, 2017 |
|
N. Malone Mitchell 3rd |
|
(Principal Executive Officer) |
|
|
|
|
|
|
|
|
|
/S/ CHRISTOPHER R. ELMORE |
|
Chief Accounting Officer and Controller |
|
March 22, 2017 |
|
Christopher R. Elmore |
|
(Principal Accounting and Financial Officer) |
|
|
|
|
|
|
|
|
|
/S/ BOB G. ALEXANDER |
|
Director |
|
March 22, 2017 |
|
Bob G. Alexander |
|
|
|
|
|
|
|
|
|
|
|
/S/ BRIAN E. BAYLEY |
|
Director |
|
March 22, 2017 |
|
Brian Bayley |
|
|
|
|
|
|
|
|
|
|
|
/S/ CHARLES J. CAMPISE |
|
Director |
|
March 22, 2017 |
|
Charles J. Campise |
|
|
|
|
|
|
|
|
|
|
|
/S/ MARLAN W. DOWNEY |
|
Director |
|
March 22, 2017 |
|
Marlan W. Downey |
|
|
|
|
|
|
|
|
|
|
|
/S/ JONATHON T. FITE |
|
Director |
|
March 22, 2017 |
|
Jonathon T. Fite |
|
|
|
|
|
|
|
|
|
|
|
/S/ GREGORY K. RENWICK |
|
Director |
|
March 22, 2017 |
|
Gregory K. Renwick |
|
|
|
|
|
|
|
|
|
|
|
/S/ MEL G. RIGGS |
|
Director |
|
March 22, 2017 |
|
Mel G. Riggs |
|
|
|
|
|
|
|
|
|
|
|
/S/ RANDY I. ROCHMAN |
|
Director |
|
March 22, 2017 |
|
Randy I. Rochman |
|
|
|
|
59
INDEX TO CONSOLIDATED FINANCIAL STATEMENTS
F-1
Report of Independent Registered Public Accounting Firm
Board of Directors and Stockholders
TransAtlantic Petroleum Ltd.
We have audited the accompanying consolidated balance sheets of TransAtlantic Petroleum Ltd. (a Delaware corporation) and subsidiaries as of December 31, 2016, and the related consolidated statements of comprehensive income (loss), equity, and cash flows for the year ended December 31, 2016. These financial statements are the responsibility of the Company’s management. Our responsibility is to express an opinion on these financial statements based on our audit.
We conducted our audit in accordance with the standards of the Public Company Accounting Oversight Board (United States). Those standards require that we plan and perform the audit to obtain reasonable assurance about whether the financial statements are free of material misstatement. We were not engaged to perform an audit of the Company’s internal control over financial reporting. Our audit included consideration of internal control over financial reporting as a basis for designing audit procedures that are appropriate in the circumstances, but not for the purpose of expressing an opinion on the effectiveness of the Company’s internal control over financial reporting. Accordingly, we express no such opinion. An audit also includes examining, on a test basis, evidence supporting the amounts and disclosures in the financial statements, assessing the accounting principles used and significant estimates made by management, as well as evaluating the overall financial statement presentation. We believe that our audit provides a reasonable basis for our opinion.
In our opinion, the consolidated financial statements referred to above present fairly, in all material respects, the consolidated financial position of TransAtlantic Petroleum Ltd. and subsidiaries as of December 31, 2016, and the results of their operations and their cash flows for the year ended December 31, 2016, in conformity with accounting principles generally accepted in the United States of America.
We also have audited the adjustments to the 2015 financial statements to retrospectively apply the application of accounting for assets held for sale, as described in Note 17. In our opinion, such adjustments are appropriate and have been properly applied. We were not engaged to audit, review, or apply any procedures to the 2015 financial statements of the Company other than with respect to the adjustments and, accordingly, we do not express an opinion or any other form of assurance on the 2015 financial statements taken as a whole.
/s/ PMB HELIN DONOVAN, LLP
Dallas, Texas
March 22, 2017
F-2
Report of Independent Registered Public Accounting Firm
The Board of Directors and Stockholders
TransAtlantic Petroleum, Ltd.:
We have audited, before the effects of the adjustments to retrospectively apply the application of accounting for assets held for sale described in note 17, the accompanying consolidated balance sheets of TransAtlantic Petroleum, Ltd. and subsidiaries as of December 31, 2015, and the related consolidated statements of comprehensive income (loss), equity and cash flows for each of the years in the two-year period ended December 31, 2015. The 2015 financial statements before the effects of the adjustments described in note 17 are not presented herein. These consolidated financial statements are the responsibility of the Company’s management. Our responsibility is to express an opinion on these consolidated financial statements based on our audits.
We conducted our audits in accordance with the standards of the Public Company Accounting Oversight Board (United States). Those standards require that we plan and perform the audit to obtain reasonable assurance about whether the financial statements are free of material misstatement. An audit includes examining, on a test basis, evidence supporting the amounts and disclosures in the financial statements. An audit also includes assessing the accounting principles used and significant estimates made by management, as well as evaluating the overall financial statement presentation. We believe that our audits provide a reasonable basis for our opinion.
In our opinion, the 2015 financial statements, before the effects of the adjustments to retrospectively apply the application of accounting for assets held for sale described in note 17, present fairly, in all material respects, the financial position of TransAtlantic Petroleum Ltd. and subsidiaries as of December 31, 2015, and the results of their operations and their cash flows for each of the years in the two-year period ended December 31, 2015 in conformity with U.S. generally accepted accounting principles.
We were not engaged to audit, review, or apply any procedures to the adjustments to retrospectively apply the application of accounting for assets held for sale described in note 17 and, accordingly, we do not express an opinion or any other form of assurance about whether such adjustments are appropriate and have been properly applied. Those adjustments were audited by a successor auditor.
The accompanying consolidated financial statements for the year ended December 31, 2015 have been prepared assuming that the Company will continue as a going concern. As discussed in note 2 to the consolidated financial statements for the year ended December 31, 2015, the Company had significant debt obligations and non-compliance with certain debt covenants that raise substantial doubt about its ability to continue as a going concern. Management’s plans in regard to these matters are also described in note 2 to the consolidated financial statements for the year ended December 31, 2015. The consolidated financial statements for the year ended December 31, 2015 do not include any adjustments that might result from the outcome of this uncertainty.
/s/ KPMG LLP
Dallas, Texas
March 30, 2016
F-3
As of December 31, 2016 and 2015
(in thousands of U.S. Dollars, except share data)
|
|
2016 |
|
|
2015 |
|
||
|
ASSETS |
|
|
|
|
|
|
|
|
Current assets: |
|
|
|
|
|
|
|
|
Cash and cash equivalents |
$ |
10,034 |
|
|
$ |
5,700 |
|
|
Restricted cash |
|
2,555 |
|
|
|
3,758 |
|
|
Accounts receivable, net |
|
|
|
|
|
|
|
|
Oil and natural gas sales |
|
17,885 |
|
|
|
10,300 |
|
|
Joint interest and other |
|
3,230 |
|
|
|
2,548 |
|
|
Related party |
|
762 |
|
|
|
408 |
|
|
Prepaid and other current assets |
|
4,756 |
|
|
|
2,063 |
|
|
Derivative asset |
|
– |
|
|
|
3,235 |
|
|
Inventory |
|
3,647 |
|
|
|
– |
|
|
Assets held for sale |
|
25,217 |
|
|
|
61,247 |
|
|
Total current assets |
|
68,086 |
|
|
|
89,259 |
|
|
Property and equipment: |
|
|
|
|
|
|
|
|
Oil and natural gas properties (successful efforts method) |
|
|
|
|
|
|
|
|
Proved |
|
197,214 |
|
|
|
233,143 |
|
|
Unproved |
|
21,109 |
|
|
|
25,630 |
|
|
Equipment and other property |
|
20,273 |
|
|
|
32,173 |
|
|
|
|
238,596 |
|
|
|
290,946 |
|
|
Less accumulated depreciation, depletion and amortization |
|
(120,638 |
) |
|
|
(122,533 |
) |
|
Property and equipment, net |
|
117,958 |
|
|
|
168,413 |
|
|
Other long-term assets: |
|
|
|
|
|
|
|
|
Other assets |
|
2,725 |
|
|
|
1,455 |
|
|
Note receivable - related party |
|
7,624 |
|
|
|
11,500 |
|
|
Derivative asset |
|
– |
|
|
|
3,370 |
|
|
Assets held for sale |
|
– |
|
|
|
24,192 |
|
|
Total other assets |
|
10,349 |
|
|
|
40,517 |
|
|
Total assets |
$ |
196,393 |
|
|
$ |
298,189 |
|
|
|
|
|
|
|
|
|
|
|
LIABILITIES, SERIES A PREFERRED SHARES AND SHAREHOLDERS' EQUITY |
|
|
|
|
|
|
|
|
Current liabilities: |
|
|
|
|
|
|
|
|
Accounts payable |
$ |
7,036 |
|
|
$ |
6,159 |
|
|
Accounts payable - related party |
|
1,844 |
|
|
|
2,553 |
|
|
Accrued liabilities |
|
12,492 |
|
|
|
8,366 |
|
|
Derivative liability |
|
596 |
|
|
|
– |
|
|
Loans payable |
|
35,000 |
|
|
|
31,874 |
|
|
Loan payable - related party |
|
3,194 |
|
|
|
3,593 |
|
|
Liabilities held for sale - related party |
|
– |
|
|
|
3,671 |
|
|
Liabilities held for sale |
|
15,938 |
|
|
|
79,514 |
|
|
Total current liabilities |
|
76,100 |
|
|
|
135,730 |
|
|
Long-term liabilities: |
|
|
|
|
|
|
|
|
Asset retirement obligations |
|
4,833 |
|
|
|
5,521 |
|
|
Accrued liabilities |
|
8,126 |
|
|
|
10,908 |
|
|
Deferred income taxes |
|
18,806 |
|
|
|
22,603 |
|
|
Loans payable |
|
3,750 |
|
|
|
34,400 |
|
|
Derivative liability |
|
242 |
|
|
|
– |
|
|
Loan payable - related party |
|
– |
|
|
|
20,600 |
|
|
Liabilities held for sale |
|
– |
|
|
|
9,505 |
|
|
Total long-term liabilities |
|
35,757 |
|
|
|
103,537 |
|
|
Total liabilities |
|
111,857 |
|
|
|
239,267 |
|
|
Commitments and contingencies |
|
|
|
|
|
|
|
|
Series A preferred shares, $0.10 par value, 510,000 shares authorized; 510,000 shares issued and outstanding with a liquidation preference of $50 per share as of December 31, 2016 |
|
25,500 |
|
|
|
– |
|
|
Series A preferred shares-related party, $0.10 par value, 411,000 shares authorized; 411,000 shares issued and outstanding with a liquidation preference of $50 per share as of December 31, 2016 |
|
20,550 |
|
|
|
– |
|
|
Shareholders' equity: |
|
|
|
|
|
|
|
|
Common shares, $0.10 par value, 100,000,000 shares authorized; 47,220,525 shares and 41,017,777 shares issued and outstanding as of December 31, 2016 and December 31, 2015, respectively |
|
4,722 |
|
|
|
4,102 |
|
|
Treasury stock |
|
(970 |
) |
|
|
(970 |
) |
|
Additional paid-in-capital |
|
573,278 |
|
|
|
569,365 |
|
|
Accumulated other comprehensive loss |
|
(140,316 |
) |
|
|
(121,590 |
) |
|
Accumulated deficit |
|
(398,228 |
) |
|
|
(391,985 |
) |
|
Total shareholders' equity |
|
38,486 |
|
|
|
58,922 |
|
|
Total liabilities, Series A preferred shares and shareholders' equity |
$ |
196,393 |
|
|
$ |
298,189 |
|
The accompanying notes are an integral part of these consolidated financial statements.
F-4
Consolidated Statements of Comprehensive (Loss) Income
For the years ended December 31, 2016, 2015 and 2014
(U.S. Dollars and shares in thousands, except per share amounts)
|
|
2016 |
|
|
2015 |
|
|
2014 |
|
|||
|
Revenues: |
|
|
|
|
|
|
|
|
|
|
|
|
Oil and natural gas sales |
$ |
63,424 |
|
|
$ |
82,716 |
|
|
$ |
136,276 |
|
|
Sales of purchased natural gas |
|
5,038 |
|
|
|
2,189 |
|
|
|
2,127 |
|
|
Other |
|
133 |
|
|
|
159 |
|
|
|
427 |
|
|
Total revenues |
|
68,595 |
|
|
|
85,064 |
|
|
|
138,830 |
|
|
Costs and expenses: |
|
|
|
|
|
|
|
|
|
|
|
|
Production |
|
12,368 |
|
|
|
12,873 |
|
|
|
18,193 |
|
|
Exploration, abandonment and impairment |
|
5,963 |
|
|
|
21,544 |
|
|
|
19,864 |
|
|
Cost of purchased natural gas |
|
4,418 |
|
|
|
2,082 |
|
|
|
2,055 |
|
|
Seismic and other exploration |
|
104 |
|
|
|
370 |
|
|
|
4,285 |
|
|
Revaluation of contingent consideration |
|
– |
|
|
|
– |
|
|
|
(2,500 |
) |
|
General and administrative |
|
16,320 |
|
|
|
24,138 |
|
|
|
31,071 |
|
|
Depreciation, depletion and amortization |
|
29,025 |
|
|
|
37,707 |
|
|
|
48,594 |
|
|
Accretion of asset retirement obligations |
|
373 |
|
|
|
368 |
|
|
|
406 |
|
|
Total costs and expenses |
|
68,571 |
|
|
|
99,082 |
|
|
|
121,968 |
|
|
Operating (loss) income |
|
24 |
|
|
|
(14,018 |
) |
|
|
16,862 |
|
|
Other income (expense): |
|
|
|
|
|
|
|
|
|
|
|
|
Interest and other expense |
|
(11,841 |
) |
|
|
(13,077 |
) |
|
|
(6,044 |
) |
|
Interest and other income |
|
2,546 |
|
|
|
855 |
|
|
|
1,124 |
|
|
(Loss) gain on commodity derivative contracts |
|
(3,257 |
) |
|
|
27,457 |
|
|
|
37,454 |
|
|
Foreign exchange loss |
|
(3,871 |
) |
|
|
(5,653 |
) |
|
|
(6,523 |
) |
|
Total other income (expense) |
|
(16,423 |
) |
|
|
9,582 |
|
|
|
26,011 |
|
|
Income (loss) from continuing operations before income taxes |
|
(16,399 |
) |
|
|
(4,436 |
) |
|
|
42,873 |
|
|
Current income tax expense |
|
(6,071 |
) |
|
|
(3,587 |
) |
|
|
(1,784 |
) |
|
Deferred income tax benefit (expense) |
|
25 |
|
|
|
(18,642 |
) |
|
|
(11,875 |
) |
|
Net (loss) income from continuing operations |
|
(22,445 |
) |
|
|
(26,665 |
) |
|
|
29,214 |
|
|
Income (loss) from discontinued operations before income taxes |
|
15,998 |
|
|
|
(97,042 |
) |
|
|
(750 |
) |
|
Income tax benefit |
|
204 |
|
|
|
16,169 |
|
|
|
612 |
|
|
Net income (loss) from discontinued operations |
|
16,202 |
|
|
|
(80,873 |
) |
|
|
(138 |
) |
|
Net (loss) income |
|
(6,243 |
) |
|
|
(107,538 |
) |
|
|
29,076 |
|
|
Other comprehensive (loss) income: |
|
|
|
|
|
|
|
|
|
|
|
|
Foreign currency translation adjustment |
|
(18,726 |
) |
|
|
(42,280 |
) |
|
|
(14,325 |
) |
|
Comprehensive (loss) income |
$ |
(24,969 |
) |
|
$ |
(149,818 |
) |
|
$ |
14,751 |
|
|
|
|
|
|
|
|
|
|
|
|
|
|
|
Net (loss) income per common share: |
|
|
|
|
|
|
|
|
|
|
|
|
Basic net income (loss) per common share |
|
|
|
|
|
|
|
|
|
|
|
|
Continuing operations |
$ |
(0.51 |
) |
|
$ |
(0.65 |
) |
|
$ |
0.77 |
|
|
Discontinued operations |
$ |
0.37 |
|
|
$ |
(1.98 |
) |
|
$ |
– |
|
|
Weighted average common shares outstanding |
|
43,885 |
|
|
|
40,841 |
|
|
|
37,829 |
|
|
Diluted net income (loss) per common share |
|
|
|
|
|
|
|
|
|
|
|
|
Continuing operations |
$ |
(0.51 |
) |
|
$ |
(0.65 |
) |
|
$ |
0.77 |
|
|
Discontinued operations |
$ |
0.37 |
|
|
$ |
(1.98 |
) |
|
$ |
– |
|
|
Weighted average common and common equivalent shares outstanding |
|
43,885 |
|
|
|
40,841 |
|
|
|
38,031 |
|
The accompanying notes are an integral part of these consolidated financial statements.
F-5
Consolidated Statements of Equity
For the years ended December 31, 2016, 2015 and 2014
(U.S. Dollars and shares in thousands)
|
|
|
|
|
|
|
|
|
|
|
|
|
|
|
|
|
|
|
|
|
|
|
|
|
|
Accumulated |
|
|
|
|
|
|
|
|
|
|
|
|
|
|
|
|
|
|
|
|
|
|
|
|
|
|
|
|
|
|
|
|
Additional |
|
|
Other |
|
|
|
|
|
|
Total |
|
|||
|
|
Common |
|
|
Treasury |
|
|
|
|
|
|
Common |
|
|
Treasury |
|
|
Paid-in |
|
|
Comprehensive |
|
|
Accumulated |
|
|
Shareholders' |
|
||||||||
|
|
Shares |
|
|
Shares |
|
|
Warrants |
|
|
Shares (at par) |
|
|
Stock |
|
|
Capital |
|
|
Income (Loss) |
|
|
Deficit |
|
|
Equity |
|
|||||||||
|
Balances at December 31, 2013 |
|
37,340 |
|
|
|
– |
|
|
|
– |
|
|
$ |
3,734 |
|
|
$ |
- |
|
|
$ |
542,091 |
|
|
$ |
(64,985 |
) |
|
$ |
(313,523 |
) |
|
$ |
167,317 |
|
|
Issuance of common shares |
|
3,219 |
|
|
|
– |
|
|
|
– |
|
|
|
322 |
|
|
|
– |
|
|
|
23,528 |
|
|
|
– |
|
|
|
– |
|
|
|
23,850 |
|
|
Contingent payment event |
|
– |
|
|
|
– |
|
|
|
– |
|
|
|
– |
|
|
|
– |
|
|
|
4,188 |
|
|
|
– |
|
|
|
– |
|
|
|
4,188 |
|
|
Issuance of warrants |
|
– |
|
|
|
– |
|
|
|
233 |
|
|
|
– |
|
|
|
– |
|
|
|
– |
|
|
|
– |
|
|
|
– |
|
|
|
- |
|
|
Issuance of restricted stock units |
|
149 |
|
|
|
– |
|
|
|
– |
|
|
|
15 |
|
|
|
– |
|
|
|
(15 |
) |
|
|
– |
|
|
|
– |
|
|
|
- |
|
|
Tax withholding on restricted stock units |
|
– |
|
|
|
– |
|
|
|
– |
|
|
|
– |
|
|
|
– |
|
|
|
(76 |
) |
|
|
– |
|
|
|
– |
|
|
|
(76 |
) |
|
Share-based compensation |
|
– |
|
|
|
– |
|
|
|
– |
|
|
|
– |
|
|
|
– |
|
|
|
1,434 |
|
|
|
– |
|
|
|
– |
|
|
|
1,434 |
|
|
Foreign currency translation adjustment |
|
– |
|
|
|
– |
|
|
|
– |
|
|
|
– |
|
|
|
– |
|
|
|
– |
|
|
|
(14,325 |
) |
|
|
– |
|
|
|
(14,325 |
) |
|
Net income |
|
– |
|
|
|
– |
|
|
|
– |
|
|
|
– |
|
|
|
– |
|
|
|
– |
|
|
|
– |
|
|
|
29,076 |
|
|
|
29,076 |
|
|
Balances at December 31, 2014 |
|
40,708 |
|
|
|
– |
|
|
|
233 |
|
|
$ |
4,071 |
|
|
$ |
- |
|
|
$ |
571,150 |
|
|
$ |
(79,310 |
) |
|
$ |
(284,447 |
) |
|
$ |
211,464 |
|
|
Issuance of common shares |
|
– |
|
|
|
– |
|
|
|
– |
|
|
|
– |
|
|
|
– |
|
|
|
– |
|
|
|
– |
|
|
|
– |
|
|
|
- |
|
|
Contingent payment event |
|
– |
|
|
|
– |
|
|
|
– |
|
|
|
– |
|
|
|
– |
|
|
|
(4,188 |
) |
|
|
– |
|
|
|
– |
|
|
|
(4,188 |
) |
|
Issuance of warrants |
|
– |
|
|
|
– |
|
|
|
466 |
|
|
|
– |
|
|
|
– |
|
|
|
– |
|
|
|
– |
|
|
|
– |
|
|
|
- |
|
|
Issuance of restricted stock units |
|
310 |
|
|
|
– |
|
|
|
– |
|
|
|
31 |
|
|
|
– |
|
|
|
1,106 |
|
|
|
– |
|
|
|
– |
|
|
|
1,137 |
|
|
Tax withholding on restricted stock units |
|
– |
|
|
|
– |
|
|
|
– |
|
|
|
– |
|
|
|
– |
|
|
|
(391 |
) |
|
|
– |
|
|
|
– |
|
|
|
(391 |
) |
|
Repurchase of treasury stock |
|
– |
|
|
|
333 |
|
|
|
– |
|
|
|
– |
|
|
|
(970 |
) |
|
|
– |
|
|
|
– |
|
|
|
– |
|
|
|
(970 |
) |
|
Share-based compensation |
|
– |
|
|
|
– |
|
|
|
– |
|
|
|
– |
|
|
|
– |
|
|
|
1,688 |
|
|
|
– |
|
|
|
– |
|
|
|
1,688 |
|
|
Foreign currency translation adjustment |
|
– |
|
|
|
– |
|
|
|
– |
|
|
|
– |
|
|
|
– |
|
|
|
– |
|
|
|
(42,280 |
) |
|
|
– |
|
|
|
(42,280 |
) |
|
Net loss |
|
– |
|
|
|
– |
|
|
|
– |
|
|
|
– |
|
|
|
– |
|
|
|
– |
|
|
|
– |
|
|
|
(107,538 |
) |
|
|
(107,538 |
) |
|
Balances at December 31, 2015 |
|
41,018 |
|
|
|
333 |
|
|
|
699 |
|
|
$ |
4,102 |
|
|
$ |
(970 |
) |
|
$ |
569,365 |
|
|
$ |
(121,590 |
) |
|
$ |
(391,985 |
) |
|
$ |
58,922 |
|
|
Issuance of common shares |
|
5,998 |
|
|
|
– |
|
|
|
– |
|
|
|
600 |
|
|
|
– |
|
|
|
3,370 |
|
|
|
– |
|
|
|
– |
|
|
|
3,970 |
|
|
Issuance of restricted stock units |
|
204 |
|
|
|
– |
|
|
|
– |
|
|
|
20 |
|
|
|
– |
|
|
|
(20 |
) |
|
|
– |
|
|
|
– |
|
|
|
- |
|
|
Tax withholding on restricted stock units |
|
– |
|
|
|
– |
|
|
|
– |
|
|
|
– |
|
|
|
– |
|
|
|
(66 |
) |
|
|
– |
|
|
|
– |
|
|
|
(66 |
) |
|
Share-based compensation |
|
– |
|
|
|
– |
|
|
|
– |
|
|
|
– |
|
|
|
– |
|
|
|
629 |
|
|
|
– |
|
|
|
– |
|
|
|
629 |
|
|
Foreign currency translation adjustment |
|
– |
|
|
|
– |
|
|
|
– |
|
|
|
– |
|
|
|
– |
|
|
|
– |
|
|
|
(18,726 |
) |
|
|
– |
|
|
|
(18,726 |
) |
|
Net loss |
|
– |
|
|
|
– |
|
|
|
– |
|
|
|
– |
|
|
|
– |
|
|
|
– |
|
|
|
– |
|
|
|
(6,243 |
) |
|
|
(6,243 |
) |
|
Balances at December 31, 2016 |
|
47,220 |
|
|
|
333 |
|
|
|
699 |
|
|
$ |
4,722 |
|
|
$ |
(970 |
) |
|
$ |
573,278 |
|
|
$ |
(140,316 |
) |
|
$ |
(398,228 |
) |
|
$ |
38,486 |
|
The accompanying notes are an integral part of these consolidated financial statements.
F-6
Consolidated Statements of Cash Flows
For the years ended December 31, 2016, 2015 and 2014
(in thousands of U.S. Dollars)
|
|
2016 |
|
|
2015 |
|
|
2014 |
|
|||
|
Operating activities: |
|
|
|
|
|
|
|
|
|
|
|
|
Net (loss) income |
$ |
(6,243 |
) |
|
$ |
(107,538 |
) |
|
$ |
29,076 |
|
|
Adjustment for net (income) loss from discontinued operations |
|
(16,202 |
) |
|
|
80,873 |
|
|
|
138 |
|
|
Net (loss) income from continuing operations |
|
(22,445 |
) |
|
|
(26,665 |
) |
|
|
29,214 |
|
|
Adjustments to reconcile net income to net cash provided by operating activities: |
|
|
|
|
|
|
|
|
|
|
|
|
Share-based compensation |
|
629 |
|
|
|
1,688 |
|
|
|
1,434 |
|
|
Foreign currency loss |
|
3,091 |
|
|
|
5,910 |
|
|
|
6,448 |
|
|
Loss (gain) on commodity derivative contracts |
|
3,257 |
|
|
|
(27,457 |
) |
|
|
(37,454 |
) |
|
Cash settlement on commodity derivative contracts |
|
4,188 |
|
|
|
57,076 |
|
|
|
(2,100 |
) |
|
Amortization on loan financing costs |
|
1,201 |
|
|
|
1,677 |
|
|
|
1,025 |
|
|
Bad debt expense |
|
– |
|
|
|
422 |
|
|
|
1,487 |
|
|
Deferred income tax (benefit) expense |
|
(25 |
) |
|
|
18,642 |
|
|
|
11,875 |
|
|
Exploration, abandonment and impairment |
|
5,963 |
|
|
|
21,544 |
|
|
|
19,864 |
|
|
Depreciation, depletion and amortization |
|
29,025 |
|
|
|
37,707 |
|
|
|
48,594 |
|
|
Accretion of asset retirement obligations |
|
373 |
|
|
|
368 |
|
|
|
406 |
|
|
Gain on sale of gas gathering facility |
|
(620 |
) |
|
|
– |
|
|
|
– |
|
|
Derivative put costs |
|
– |
|
|
|
(4,638 |
) |
|
|
– |
|
|
Revaluation of contingent consideration |
|
– |
|
|
|
– |
|
|
|
(2,500 |
) |
|
Changes in operating assets and liabilities: |
|
|
|
|
|
|
|
|
|
|
|
|
Accounts receivable |
|
(8,180 |
) |
|
|
18,274 |
|
|
|
(3,326 |
) |
|
Prepaid expenses and other assets |
|
(4,040 |
) |
|
|
1,341 |
|
|
|
(1,777 |
) |
|
Accounts payable and accrued liabilities |
|
8,936 |
|
|
|
(19,380 |
) |
|
|
4,734 |
|
|
Net cash provided by operating activities from continuing operations |
|
21,353 |
|
|
|
86,509 |
|
|
|
77,924 |
|
|
Net cash provided by (used in) operating activities from discontinued operations |
|
220 |
|
|
|
(14,483 |
) |
|
|
(264 |
) |
|
Net cash provided by operating activities |
|
21,573 |
|
|
|
72,026 |
|
|
|
77,660 |
|
|
Investing activities: |
|
|
|
|
|
|
|
|
|
|
|
|
Acquisitions, net of cash |
|
– |
|
|
|
– |
|
|
|
66 |
|
|
Additions to oil and natural gas properties |
|
(9,512 |
) |
|
|
(22,843 |
) |
|
|
(107,353 |
) |
|
Additions to equipment and other properties |
|
(1,204 |
) |
|
|
(3,572 |
) |
|
|
(6,318 |
) |
|
Proceeds from asset sale |
|
1,104 |
|
|
|
– |
|
|
|
– |
|
|
Restricted cash |
|
1,094 |
|
|
|
(5,261 |
) |
|
|
(1,917 |
) |
|
Net cash used in investing activities from continuing operations |
|
(8,518 |
) |
|
|
(31,676 |
) |
|
|
(115,522 |
) |
|
Net cash used in investing activities from discontinued operations |
|
– |
|
|
|
(12,329 |
) |
|
|
(1,174 |
) |
|
Net cash used in investing activities |
|
(8,518 |
) |
|
|
(44,005 |
) |
|
|
(116,696 |
) |
|
Financing activities: |
|
|
|
|
|
|
|
|
|
|
|
|
Issuance of common shares |
|
1,658 |
|
|
|
– |
|
|
|
– |
|
|
Issuance of Series A Preferred Shares |
|
5,300 |
|
|
|
– |
|
|
|
– |
|
|
Tax withholding on restricted share units |
|
(66 |
) |
|
|
(391 |
) |
|
|
(76 |
) |
|
Treasury stock purchases |
|
– |
|
|
|
(970 |
) |
|
|
– |
|
|
Loan proceeds |
|
33,778 |
|
|
|
12,378 |
|
|
|
73,237 |
|
|
Loan proceeds - related party |
|
– |
|
|
|
3,593 |
|
|
|
20,800 |
|
|
Loan repayment |
|
(47,123 |
) |
|
|
(54,834 |
) |
|
|
(28,096 |
) |
|
Loan repayment - related party |
|
(898 |
) |
|
|
– |
|
|
|
– |
|
|
Loan financing costs |
|
– |
|
|
|
(30 |
) |
|
|
(2,630 |
) |
|
Net cash (used in) provided by financing activities from continuing operations |
|
(7,351 |
) |
|
|
(40,254 |
) |
|
|
63,235 |
|
|
Net cash used in financing activities from discontinued operations |
|
– |
|
|
|
(13,709 |
) |
|
|
(1,674 |
) |
|
Net cash (used in) provided by financing activities |
|
(7,351 |
) |
|
|
(53,963 |
) |
|
|
61,561 |
|
|
Effect of exchange rate on cash flows and cash equivalents |
|
(1,599 |
) |
|
|
(1,318 |
) |
|
|
(666 |
) |
|
Net increase (decrease) in cash and cash equivalents |
|
4,105 |
|
|
|
(27,260 |
) |
|
|
21,859 |
|
|
Cash and cash equivalents, beginning of year |
|
7,480 |
|
|
|
34,740 |
|
|
|
12,881 |
|
|
Cash and cash equivalents, end of year (1) |
$ |
11,585 |
|
|
$ |
7,480 |
|
|
$ |
34,740 |
|
|
Supplemental disclosures: |
|
|
|
|
|
|
|
|
|
|
|
|
Cash paid for interest |
$ |
6,576 |
|
|
$ |
9,522 |
|
|
$ |
3,490 |
|
|
Cash paid for taxes |
$ |
4,842 |
|
|
$ |
3,044 |
|
|
$ |
– |
|
|
Supplemental non-cash financing activities: |
|
|
|
|
|
|
|
|
|
|
|
|
Issuance of Series A Preferred Shares |
$ |
40,750 |
|
|
$ |
– |
|
|
$ |
– |
|
|
Issuance of common shares |
$ |
2,312 |
|
|
$ |
– |
|
|
$ |
23,850 |
|
|
Repayment of the Prepayment Agreement |
$ |
– |
|
|
$ |
3,043 |
|
|
$ |
– |
|
|
Contingent payment event |
$ |
– |
|
|
$ |
(4,188 |
) |
|
$ |
4,188 |
|
|
|
(1) |
Includes TBNG cash held for sale of $1.6 million and $1.8 million at December 31, 2016 and 2015, respectively. |
The accompanying notes are an integral part of these consolidated financial statements.
F-7
Notes to Consolidated Financial Statements
1. General
Nature of operations
TransAtlantic Petroleum Ltd. (together with its subsidiaries, “we,” “us,” “our,” the “Company” or “TransAtlantic”) is an international oil and natural gas company engaged in acquisition, exploration, development and production. We have focused our operations in countries that have established, yet underexplored petroleum systems, have stable governments, are net importers of petroleum, have an existing petroleum transportation infrastructure and provide favorable commodity pricing, royalty rates and tax rates to exploration and production companies. We hold interests in developed and undeveloped oil and natural gas properties in Turkey and Bulgaria and an operated interest in a joint venture in Albania. As of March 17, 2017, approximately 47% of our outstanding common shares were beneficially owned by N. Malone Mitchell 3rd, our chief executive officer and chairman of our board of directors.
TransAtlantic is a holding company with two operating segments – Turkey and Bulgaria. Its assets consist of its ownership interests in subsidiaries that primarily own assets in Turkey and Bulgaria and an operated interest in a joint venture in Albania.
Basis of presentation
Our consolidated financial statements are expressed in U.S. Dollars and have been prepared by management in accordance with accounting principles generally accepted in the United States (“U.S. GAAP”). All amounts in these notes to the consolidated financial statements are in U.S. Dollars unless otherwise indicated. In preparing financial statements, management makes informed judgments and estimates that affect the reported amounts of assets and liabilities as of the date of the financial statements and affect the reported amounts of revenues and expenses during the reporting period. On an ongoing basis, management reviews estimates, including those related to fair value measurements associated with acquisitions and financial derivatives, the recoverability and impairment of long-lived assets, contingencies and income taxes. Changes in facts and circumstances may result in revised estimates and actual results may differ from these estimates.
2. Financial Restructuring and Elimination of Going Concern Assumption
During 2016, we focused on several transactions to deleverage our balance sheet, repay our defaulted senior credit facility (the “Senior Credit Facility”) with BNP Paribas (Suisse) SA (“BNP”) and the International Finance Corporation (“IFC”) (see Note 9, “Loans Payable”), obtain new debt financing (see Note 9, “Loans Payable”), raise cash from asset sales (see Notes 17 & 18, “Assets and liabilities held for sale and discontinued operations” and “Subsequent events”, respectively) and refinance our 13.0% Senior Convertible Notes due 2017 (the “2017 Notes”) (see Note 5, “Series A Preferred Shares”).
At December 31, 2015, we had $55.0 million in long-term debt, $35.5 million in short-term, $5.7 million in cash and a $24.5 million working capital deficit (excluding assets and liabilities held for sale). In addition, we had a $15.5 million borrowing base deficiency under the Senior Credit Facility, and we not in compliance with the current ratio financial covenant in the Senior Credit Facility.
As of December 31, 2016, we had reduced our long-term debt to $3.8 million and our short-term debt to $38.2 million, increased our cash to $10.0 million and reduced our working capital deficit to $17.3 million (excluding assets and liabilities held for sale).
Subsequent to year end, on February 24, 2017, we closed the sale of our ownership interests in our subsidiary Thrace Basin Natural Gas (Turkiye) Corporation (“TBNG”) for gross proceeds of $20.9 million, and approximate net cash proceeds of $16.3 million. The purchase price is subject to post-closing adjustments, and we agreed to escrow $3.1 million of the purchase price for 30 days to satisfy any agreed upon purchase price adjustments. We used $2.7 million of the net proceeds to repay short-term debt (see Note 18, “Subsequent events”).
As a result of these transactions, we no longer believe there is substantial doubt about our ability to continue as a going concern, and we have eliminated the going concern assumption in our consolidated financial statements. Based on current forecasted oil prices for 2017 and beyond, we believe that our cash flows from operations and existing cash on hand are sufficient to conduct our planned operations and meet our contractual requirements, including license obligations through March 31, 2018.
F-8
3. Significant accounting policies
Basis of preparation
Our reporting standard for the presentation of our consolidated financial statements is U.S. GAAP. The consolidated financial statements include the accounts of the Company and all majority-owned, controlled subsidiaries. All significant intercompany balances and transactions have been eliminated in consolidation. During the year ended December 31, 2016, we reclassified certain balance sheet amounts previously reported on our consolidated balance sheet at December 31, 2015 to conform to current year presentation.
Cash and cash equivalents
Cash and cash equivalents include term deposits and investments with original maturities of three months or less at the date of acquisition. We consider all highly liquid debt instruments purchased with an original maturity of three months or less to be cash equivalents. We determine the appropriate classification of our investments in cash and cash equivalents and marketable securities at the time of purchase and reevaluate such designation at each balance sheet date.
Commodity derivative instruments
Financial Accounting Standards Board (“FASB”) Accounting Standards Codification (“ASC”) 815, Derivatives and Hedging (“ASC 815”), requires derivative instruments to be recognized as either assets or liabilities in the balance sheet at fair value. We do not designate our derivative financial instruments as hedging instruments and, as a result, we recognize the change in a derivative contract’s fair value currently in earnings as a component of other income (expense).
Fair value measurements
We follow ASC 820, Fair Value Measurements and Disclosures (“ASC 820”). This standard defines fair value, establishes a framework for measuring fair value and expands disclosures about fair value measurements. ASC 820 does not require any new fair value measurements, but applies to assets and liabilities that are required to be recorded at fair value under other accounting standards.
ASC 820 characterizes inputs used in determining fair value according to a hierarchy that prioritizes those inputs based upon the degree to which they are observable. The three levels of the fair value measurement hierarchy are as follows:
|
|
Level 1: |
Unadjusted quoted prices in active markets that are accessible at the measurement date for identical, unrestricted assets or liabilities. |
|
|
Level 2: |
Quoted prices in markets that are not active, or inputs which are observable, either directly or indirectly, for substantially the full term of the asset or liability. |
|
|
Level 3: |
Measured based on prices or valuation models that required inputs that are both significant to the fair value measurement and less observable for objective sources (i.e., supported by little or no market activity). |
As required by ASC 820, financial assets and liabilities are classified based on the lowest level of input that is significant to the fair value measurement. Our assessment of the significance of a particular input to the fair value measurement requires judgment, which may affect the valuation of the fair value of assets and liabilities and their placement within the fair value hierarchy levels. The determination of the fair values takes into account the market for our financial assets and liabilities, the associated credit risk and other factors as required by ASC 820. We consider active markets as those in which transactions for the assets or liabilities occur in sufficient frequency and volume to provide pricing information on an ongoing basis.
Foreign currency remeasurement and translation
The functional currency of our subsidiaries in Turkey, Bulgaria, Romania, Morocco, and Albania is the New Turkish Lira (“TRY”), the Bulgarian Lev, the Romanian New Leu, the Moroccan Dirham, and the U.S. Dollar (“USD”) respectively. We follow ASC 830, Foreign Currency Matters (“ASC 830”). ASC 830 requires the assets, liabilities, and results of operations of a foreign operation to be measured using the functional currency of that foreign operation. Exchange gains or losses from remeasuring transactions and monetary accounts in a currency other than the functional currency are included in earnings.
For certain subsidiaries, translation adjustments result from the process of translating the functional currency of subsidiary financial statements into the U.S. Dollar reporting currency. These translation adjustments are reported separately and accumulated in the consolidated balance sheets as a component of accumulated other comprehensive loss.
F-9
Oil and natural gas properties
In accordance with the successful efforts method of accounting for oil and natural gas properties, costs of productive wells, developmental dry holes and productive leases are capitalized into appropriate groups of properties based on geographical and geological similarities. Acquisition costs of proved properties are amortized using the unit-of-production method based on total proved reserves, and exploration well costs and additional development costs are amortized using the unit-of-production method based on proved developed reserves. Proceeds from the sale of properties are credited to property costs, and a gain or loss is recognized when a significant portion of an amortization base is sold or abandoned.
Exploration costs, such as exploratory geological and geophysical costs, delay rentals and exploration overhead, are charged to expense as incurred. Exploratory drilling costs, including the cost of stratigraphic test wells, are initially capitalized but charged to exploration expense if and when the well is determined to be non-productive. The determination of an exploratory well’s ability to produce must be made within one year from the completion of drilling activities. The acquisition costs of unproved acreage are initially capitalized and are carried at cost, net of accumulated impairment provisions, until such leases are transferred to proved properties or charged to exploration expense as impairments of unproved properties.
Equipment and other property
Equipment and other property are stated at cost, and inventory is stated at weighted average cost which does not exceed replacement cost. Depreciation is calculated using the straight-line method over the estimated useful lives (ranging from 3 to 7 years) of the respective assets. The costs of normal maintenance and repairs are charged to expense as incurred. Material expenditures that increase the life of an asset are capitalized and depreciated over the estimated remaining useful life of the asset. The cost of equipment sold, or otherwise disposed of, and the related accumulated depreciation, are removed from the accounts and any gain or loss is reflected in current earnings.
Impairment of long-lived assets
We follow the provisions of ASC 360, Property, Plant, and Equipment (“ASC 360”). ASC 360 requires that our long-lived assets be assessed for potential impairment of their carrying values whenever events or changes in circumstances indicate such impairment may have occurred. Proved oil and natural gas properties are evaluated by field for potential impairment. An impairment on proved properties is recognized when the estimated undiscounted future net cash flows of a field are less than its carrying value. If an impairment occurs, the carrying value of the impaired field is reduced to its estimated fair value, which is generally estimated using a discounted cash flow approach.
Unproved oil and natural gas properties do not have producing properties and are valued on acquisition by management, with the assistance of an independent expert when necessary. As reserves are proved through the successful completion of exploratory wells, the cost is transferred to proved properties. The cost of the remaining unproved basis is periodically evaluated by management to assess whether the value of a property has diminished. To do this assessment, management considers (i) estimated potential reserves and future net revenues from an independent expert, (ii) the Company’s history in exploring the area, (iii) the Company’s future drilling plans per its capital drilling program prepared by the Company’s reservoir engineers and operations management and (iv) other factors associated with the area. Impairment is taken on the unproved property value if it is determined that the costs are not likely to be recoverable. The valuation is subjective and requires management to make estimates and assumptions which, with the passage of time, may prove to be materially different from actual results.
Joint interest activities
Certain of our exploration, development and production activities are conducted jointly with other entities and, accordingly, the consolidated financial statements reflect only our proportionate interest in such activities.
Asset retirement obligations
We recognize a liability for the fair value of all legal obligations associated with the retirement of tangible, long-lived assets and capitalize an equal amount as a cost of the asset. The cost associated with the abandonment obligation is included in the computation of depreciation, depletion and amortization. The liability accretes until we settle the obligation. We use a credit-adjusted risk-free interest rate in our calculation of asset retirement obligations.
F-10
Revenue from the sale of crude oil and natural gas is recognized upon delivery to the purchaser when title passes. During the years ended December 31, 2016, 2015 and 2014, we sold $52.2 million, $63.0 million and $102.8 million, respectively, of oil to Türkiye Petrol Rafinerileri A.Ş. (“TUPRAS”), a privately owned oil refinery in Turkey, which represented approximately 76.1%, 74.0% and 74.1% of our total revenues, respectively.
Share-based compensation
We follow ASC 718, Compensation—Stock Compensation (“ASC 718”), which requires the measurement and recognition of compensation expense for all share-based payment awards, including restricted stock units, based on estimated grant date fair values. Restricted stock units are valued using the market price of our common shares on the date of grant. We record compensation expense, net of estimated forfeitures, over the requisite service period.
Series A Preferred Shares
On November 4, 2016, we issued 921,000 shares of 12.0% Series A Convertible Redeemable Preferred Shares (the “Series A Preferred Shares”). Of the 921,000 Series A Preferred Shares, (i) 815,000 shares were issued in exchange for $40.75 million of our 2017 Notes, at an exchange rate of 20 Series A Preferred Shares for each $1,000 principal amount of 2017 Notes, and (ii) 106,000 shares were issued and sold for $5.3 million of cash to certain holders of the 2017 Notes. All of the Series A Preferred Shares were issued at a value of $50.00 per share (See Note 5, “Series A Preferred Shares”).
Income taxes
We follow the asset and liability method prescribed by ASC 740, Income Taxes (“ASC 740”). Under this method of accounting for income taxes, deferred tax assets and liabilities are recognized for the future tax consequences attributable to differences between the financial statement carrying amounts of existing assets and liabilities and their respective tax bases. Deferred tax assets and liabilities are measured using enacted tax rates expected to apply to taxable income in the years in which those temporary differences are expected to be recovered or settled. Under ASC 740, the effect on deferred tax assets and liabilities of a change in enacted tax rates is recognized in earnings in the period that includes the enactment date.
As of December 31, 2016 and 2015, we have recorded an $8.1 million and $10.9 million liability, respectively, primarily due to uncertain tax positions related to the unwinding of all of our crude oil hedge collars and three-way contracts, which are included in long-term accrued liabilities on our consolidated balance sheet.
We do not believe there will be any material changes in our unrecognized tax positions over the next twelve months. Our policy is that we recognize interest and penalties accrued on any unrecognized tax positions as a component of income tax expense.
We are a Bermuda exempted company, and under current Bermuda law, we are not subject to tax on profits, income or dividends, nor is there any capital gains tax applicable to us in Bermuda.
Comprehensive income
ASC 220, Comprehensive Income, establishes standards for reporting and displaying comprehensive income and its components (revenue, expenses, gains and losses) in a full set of general-purpose financial statements.
Business combinations
We follow ASC 805, Business Combinations (“ASC 805”), and ASC 810-10-65, Consolidation (“ASC 810-10-65”). ASC 805 requires most identifiable assets, liabilities, non-controlling interests, and goodwill acquired in a business combination to be recorded at “fair value.” The statement applies to all business combinations, including combinations among mutual entities and combinations by contract alone. Under ASC 805, all business combinations are accounted for by applying the acquisition method.
Per share information
Basic per share amounts are calculated using the weighted average common shares outstanding during the year, excluding unvested restricted stock units. We use the treasury stock method to determine the dilutive effect of stock options and other dilutive instruments. Under the treasury stock method, only “in the money” dilutive instruments impact the diluted calculations in computing diluted earnings per share. Diluted calculations reflect the weighted average incremental common shares that would be issued upon exercise of dilutive options assuming the proceeds would be used to repurchase shares at average market prices for the period.
F-11
4. New accounting pronouncements
In March 2016, the FASB issued Accounting Standards Update (“ASU”) 2016-08, Revenue from Contracts with Customers (Topic 606): Principal versus Agent Considerations (Reporting Revenue Gross versus Net) (“ASU 2016-08”). ASU 2016-08 does not change the core principle of Topic 606 but clarifies the implementation guidance on principal versus agent considerations. ASU 2016-08 is effective for the annual and interim periods beginning after December 15, 2017. We are currently assessing the potential impact of ASU 2016-08 on our consolidated financial statements and results of operations.
In April 2016, the FASB issued ASU 2016-10, Revenue from Contracts with Customers (Topic 606): Identifying Performance Obligations and Licensing (“ASU 2016-10”). ASU 2016-10 does not change the core principle of Topic 606 but clarifies the following two aspects of Topic 606: identifying performance obligations and the licensing implementation guidance, while retaining the related principles for those areas. ASU 2016-10 is effective for annual and interim periods beginning after December 15, 2017. We are currently assessing the potential impact of ASU 2016-10 on our consolidated financial statements and results of operations.
In June 2016, the FASB issued ASU 2016-13, Financial Instruments - Credit Losses (“ASU 2016-13”). ASU 2016-13 changes the impairment model for most financial assets and certain other instruments, including trade and other receivables, held-to-maturity debt securities and loans, and requires entities to use a new forward-looking expected loss model that will result in the earlier recognition of allowance for losses. This update is effective for fiscal years beginning after December 15, 2019, including interim periods within those fiscal years. Early adoption is permitted for a fiscal year beginning after December 15, 2018, including interim periods within that fiscal year. Entities will apply the standard's provisions as a cumulative-effect adjustment to retained earnings as of the beginning of the first reporting period in which the guidance is adopted. We are currently assessing the potential impact of ASU 2016-13 on our consolidated financial statements and results of operations.
In August 2016, the FASB issued ASU 2016-15, Statement of Cash Flows (Topic 230): Classification of Certain Cash Receipts and Cash Payments (“ASU 2016-15”). ASU 2016-15 reduces diversity in practice in how certain transactions are classified in the statement of cash flows. The amendments in ASU 2016-15 provide guidance on specific cash flow issues including debt prepayment or debt extinguishment costs, settlement of zero-coupon debt instruments or other debt instruments with coupon interest rates that are insignificant in relation to the effective interest rate of the borrowing, contingent consideration payments made after a business combination, proceeds from the settlement of insurance claims, proceeds from the settlement of corporate-owned life insurance policies, and distributions received from equity method investees. ASU 2016-15 is effective for annual and interim periods beginning after December 15, 2017. We are currently assessing the potential impact of ASU 2016-15 on our consolidated financial statements and results of operations.
In November 2016, the FASB issued ASU 2016-18, Statement of Cash Flows (Topic 230): Restricted Cash (“ASU 2016-18”). ASU 2016-18 requires that a statement of cash flows explain the change during the period in the total of cash, cash equivalents and amounts generally described as restricted cash or restricted cash equivalents. The amounts generally described as restricted cash and restricted cash equivalents should be included with cash and cash equivalents when reconciling the beginning-of-period and end-of-period total amounts shown on the statements of cash flows. The amended guidance will be effective for annual periods beginning after December 15, 2017. The amendments should be applied using a retrospective transition method to each period presented. Early adoption is permitted for any entity in any interim or annual period. We are currently evaluating the potential impact of ASU 2016-18 on our consolidated financial statements and results of operations.
We have reviewed other recently issued, but not yet adopted, accounting standards in order to determine their effects, if any, on our consolidated results of operations, financial position and cash flows. Based on that review, we believe that none of these pronouncements will have a significant effect on current or future earnings or operations.
F-12
Series A Preferred Shares
On November 4, 2016, we issued 921,000 Series A Preferred Shares. Of the 921,000 Series A Preferred Shares, (i) 815,000 shares were issued in exchange for $40.75 million of the 2017 Notes, at an exchange rate of 20 Series A Preferred Shares for each $1,000 principal amount of 2017 Notes, and (ii) 106,000 shares were issued and sold for $5.3 million of cash to certain holders of the 2017 Notes. All of the Series A Preferred Shares were issued at a value of $50.00 per share. We used $4.3 million of the gross proceeds to redeem a portion of the remaining 2017 Notes on January 1, 2017. The remaining proceeds were used for general corporate purposes. The Series A Preferred Shares contain a substantive conversion option, are mandatorily redeemable and convert into a fixed number of common shares. As a result, under U.S GAAP, we have classified the Series A Preferred Shares within mezzanine equity in our consolidated balance sheet. As of December 31, 2016, there were $25.5 million of Series A Preferred Shares and $20.6 million of Series A Preferred Shares – related party outstanding.
Pursuant to the Certificate of Designations for the Series A Preferred Shares (the “Certificate of Designations”), each Series A Preferred Share may be converted at any time, at the option of the holder, into 45.754 common shares of the Company (which is equal to an initial conversion price of approximately $1.0928 per common share and is subject to customary adjustment for stock splits, stock dividends, recapitalizations or other fundamental changes). During the period ending on November 4, 2017, the conversion rate will be adjusted on an economic weighted average anti-dilution basis for the issuance of common shares for cash at a price below the conversion price then in effect. Such anti-dilution protection excludes (i) dividends paid on the Series A Preferred Shares in common shares, (ii) issuances of common shares in connection with acquisitions, (iii) issuances of common shares under currently outstanding convertible notes and warrants and (iv) issuances of common shares in connection with employee compensation arrangements and employee benefit plans. This non-standard dilution adjustment clause results in a contingent beneficial conversion feature.
If not converted sooner, on November 4, 2024, we are required to redeem the outstanding Series A Preferred Shares in cash at a price per share equal to the liquidation preference plus accrued and unpaid dividends. At any time on or after November 4, 2020, we may redeem all or a portion of the Series A Preferred Shares at the redemption prices listed below (expressed as a percentage of the liquidation preference amount per share) plus accrued and unpaid dividends to the date of redemption, if the closing sale price of the common shares equals or exceeds 150% of the conversion price then in effect for at least 10 trading days (whether or not consecutive) in a period of 20 consecutive trading days, including the last trading day of such 20 trading day period, ending on, and including, the trading day immediately preceding the business day on which we issue a notice of optional redemption. The redemption prices for the 12-month period starting on the date below are:
|
Period Commencing |
Redemption Price |
|
November 4, 2020 |
105.000% |
|
November 4, 2021 |
103.000% |
|
November 4, 2022 |
101.000% |
|
November 4, 2023 and thereafter |
100.000% |
Additionally, upon the occurrence of a change of control, we are required to offer to redeem the Series A Preferred Shares within 120 days after the first date on which such change of control occurred, for cash at a redemption price equal to the liquidation preference per share, plus any accrued and unpaid dividends.
Dividends on the Series A Preferred Shares are payable quarterly at our election in cash, common shares or a combination of cash and common shares at an annual dividend rate of 12.0% of the liquidation preference if paid all in cash or 16.0% of the liquidation preference if paid in common shares. If paid partially in cash and partially in common shares, the dividend rate on the cash portion is 12.0%, and the dividend rate on the common share portion is 16.0%. Dividends are payable quarterly, on June 30, September 30, December 31, and March 31 of each year. The holders of the Series A Preferred Shares also are entitled to participate pro-rata in any dividends paid on the common shares on an as-converted-to-common shares basis. For the year ended December 31, 2016, we paid $0.9 million in cash dividends on the Series A Preferred Shares.
Except as required by Bermuda law the holders of Series A Preferred Shares have no voting rights, except that for so long as at least 400,000 Series A Preferred Shares are outstanding, the holders of the Series A Preferred Shares voting as a separate class have the right to elect two directors to our Board of Directors. For so long as between 80,000 and 399,999 Series A Preferred Shares are outstanding, the holders of the Series A Preferred Shares voting as a separate class have the right to elect one director to our Board of Directors. Upon less than 80,000 Series A Preferred Shares remaining outstanding, any directors elected by the holders of Series A Preferred Shares shall immediately resign from our Board of Directors.
F-13
The Certificate of Designation also provides that without the approval of the holders of a majority of the outstanding Series A Preferred Shares, we will not issue indebtedness for money borrowed or other securities which are senior to the Series A Preferred Shares in excess of the greater of (i) $100 million or (ii) 35% of our PV-10 of proved reserves as disclosed in its most recent independent reserve report filed or furnished by us on EDGAR. In addition, until our 2017 Notes are repaid in full, we will not issue indebtedness for money borrowed (other than ordinary trade indebtedness and up to $30.0 million borrowed from DenizBank, A.S. (“DenizBank”)) unless the net proceeds thereof are used (i) to redeem, retire or repay the 2017 Notes, (ii) spud, drill or complete two designated wells, or (iii) used in connection with collateralization or guarantees with respect to our hedging efforts.
We have agreed to use commercially reasonable efforts to file a shelf registration statement for the resale of the Series A Preferred Shares and the common shares issuable upon conversion of the Series A Preferred Shares prior to November 5, 2017 and have such shelf registration statement declared effective by the Securities and Exchange Commission (the “SEC”) as soon as practicable after filing.
6. Property and equipment
Oil and natural gas properties
The following table sets forth the capitalized costs under the successful efforts method for oil and natural gas properties:
|
|
2016 |
|
|
2015 |
|
||
|
|
(in thousands) |
|
|||||
|
Oil and natural gas properties, proved: |
|
|
|
|
|
|
|
|
Turkey |
$ |
196,743 |
|
|
$ |
232,654 |
|
|
Bulgaria |
|
471 |
|
|
|
489 |
|
|
Total oil and natural gas properties, proved |
|
197,214 |
|
|
|
233,143 |
|
|
Oil and natural gas properties, unproved: |
|
|
|
|
|
|
|
|
Turkey |
|
21,109 |
|
|
|
25,630 |
|
|
Bulgaria |
|
- |
|
|
|
- |
|
|
Total oil and natural gas properties, unproved |
|
21,109 |
|
|
|
25,630 |
|
|
Gross oil and natural gas properties |
|
218,323 |
|
|
|
258,773 |
|
|
Accumulated depletion |
|
(115,401 |
) |
|
|
(113,732 |
) |
|
Net oil and natural gas properties |
$ |
102,922 |
|
|
$ |
145,041 |
|
The decline in oil and natural gas properties during the year ended December 31, 2016 was primarily driven by the devaluation of the Turkish Lira (“TRY”) versus the U.S. Dollar. For the year ended December 31, 2016 and 2015, we have recorded foreign currency translation adjustments which reduced oil and natural gas properties and increased accumulated other comprehensive loss within shareholders’ equity on our consolidated balance sheet.
At December 31, 2016 and 2015, we excluded $1.9 million and $0.7 million of costs, respectively, from the depletion calculation for development wells in progress.
At December 31, 2016, the capitalized costs of our oil and natural gas properties included $13.2 million relating to acquisition costs of proved properties, which are being amortized by the unit-of-production method using total proved reserves, and $66.7 million relating to well costs, and additional development costs, which are being amortized by the unit-of-production method using proved developed reserves.
At December 31, 2015, the capitalized costs of our oil and natural gas properties included $18.0 million relating to acquisition costs of proved properties, which are being amortized by the unit-of-production method using total proved reserves, and $100.7 million relating to well costs, and additional development costs, which are being amortized by the unit-of-production method using proved developed reserves.
Impairments of proved properties and impairment of exploratory well costs
Proved oil and natural gas properties are reviewed for impairment when events and circumstances indicate the carrying value of such properties may not be recoverable. The factors used to determine fair value include (Level 3 inputs), but are not limited to, estimates of proved reserves, future commodity prices, the timing and amount of future production and capital expenditures and discount rates commensurate with the risk reflective of the lives remaining for the respective oil and natural gas properties.
F-14
During the year ended December 31, 2016, we recorded $4.5 million of impairment of proved properties and exploratory well costs which are primarily measured using Level 3 inputs. Of the $4.5 million of impairment of proved properties and exploratory well costs incurred during the year ended December 31, 2016, $2.5 million primarily related to proved property impairments in our non-core Thrace region, specifically the Edirne and Redy natural gas fields and our non-core Alibey oil field due to reductions in reserve volumes. The remaining charges during the year ended December 31, 2016 were due to $1.7 million related to exploratory well impairments and $0.3 million of license impairments. Approximately $1.5 million of the amount impaired was cash spent during the period.
During the year ended December 31, 2015, we recorded $16.0 million of impairment of proved properties and exploratory well costs, of which $5.8 million primarily related to proved property impairments on our Goksu, Molla and Bakuk fields in Turkey where we wrote the properties down to their estimated fair value which was primarily due to the decline in the Brent oil price and a reduction in the reserve volumes. The remaining charges during the year ended December 31, 2015 were due to $3.7 million related to exploratory well impairment on our Deventci-R2 well in Bulgaria, $3.5 million related to impairment on our Pinar-1 well and $0.7 million related to the South Goksu-1 well, which is part of our joint venture in the Arpatepe field in Turkey.
During the year ended December 31, 2014, we recorded $19.9 million in impairment on our proved and unproved properties. Of the $19.9 million, approximately $13.8 million relates to unproved exploratory well impairment on the following wells: $3.5 million related to impairment on the Catak-1 well, $2.8 million related to the Kazanci-5 well, and $7.5 million related to the Bahar-2 side track well.
Capitalized costs greater than one year
As of December 31, 2016, we had $1.0 million and $1.8 million of exploratory well costs capitalized for the Hayrabolu-10 and Pinar-1 wells, respectively, in Turkey, which we spud in February 2013 and December 2014, respectively. The Hayrabolu-10 well was sold as part of the TBNG sale in February 2017. The Company expects to side-track the Pinar-1 well in the second quarter of 2017.
Equipment and other property
The historical cost of equipment and other property, presented on a gross basis with accumulated depreciation, is summarized as follows:
|
|
2016 |
|
|
2015 |
|
||
|
|
(in thousands) |
|
|||||
|
Other equipment |
$ |
1,780 |
|
|
$ |
2,148 |
|
|
Inventory |
|
10,704 |
|
|
|
17,348 |
|
|
Gas gathering system and facilities |
|
145 |
|
|
|
4,790 |
|
|
Vehicles |
|
364 |
|
|
|
400 |
|
|
Leasehold improvements, office equipment and software |
|
7,280 |
|
|
|
7,487 |
|
|
Gross equipment and other property |
|
20,273 |
|
|
|
32,173 |
|
|
|
|
(5,237 |
) |
|
|
(8,801 |
) |
|
Net equipment and other property |
$ |
15,036 |
|
|
$ |
23,372 |
|
At December 31, 2016, we have classified $3.6 million of inventory as a current asset, which represents our expected inventory consumption in the next twelve months. We classify the remainder of our materials and supply inventory as a long-term asset because such materials will ultimately be classified as a long-term asset when the material is used in the drilling of a well.
At December 31, 2016 and 2015, we excluded $14.4 million and $21.3 million (including TBNG), of inventory, respectively, from depreciation as the inventory had not been placed into service.
F-15
7. Commodity derivative instruments
We have used collar and put derivative contracts to economically hedge against the variability in cash flows associated with the forecasted sale of a portion of our future oil production. We have not designated the derivative contracts as hedges for accounting purposes, and accordingly, we record the derivative contracts at fair value and recognize changes in fair value in earnings as they occur.
To the extent that a legal right of offset exists, we net the value of our derivative contracts with the same counterparty in our consolidated balance sheets. All of our oil derivative contracts are settled based upon Brent crude oil pricing. We recognize gains and losses related to these contracts on a fair value basis in our consolidated statements of comprehensive income (loss) under the caption “Gain (loss) on commodity derivative contracts.” Settlements of derivative contracts are included in operating activities on our consolidated statements of cash flows under the caption “Cash settlement on commodity derivative contracts.”
During the years ended December 31, 2016, 2015 and 2014, we recorded a net loss on commodity derivative contracts of $3.3 million, a net gain of $27.5 million and net gain of $37.5 million, respectively.
On September 7, 2016 and September 9, 2016, in connection with our repayment and termination of our prior senior credit facility, we unwound all of our existing crude oil hedges for the periods September 10, 2016 through March 31, 2019 with one of the lenders. The unwinding of these hedging transactions resulted in proceeds of $2.6 million and was used for general corporate purposes.
On October 6, 2016 and December 22, 2016, we entered into costless collars with DenizBank to hedge a portion of our oil production in Turkey.
At December 31, 2016, we had outstanding commodity derivative contracts with respect to our future crude oil production as set forth in the tables below:
Fair Value of Derivative Instruments as of December 31, 2016
|
|
|
|
|
|
|
|
|
Weighted |
|
|
Weighted |
|
|
|
|
|
||
|
|
|
|
|
|
|
|
|
Average |
|
|
Average |
|
|
|
|
|
||
|
|
|
|
|
Quantity |
|
|
Minimum |
|
|
Maximum Price |
|
|
Estimated Fair |
|
||||
|
Type |
|
Period |
|
(Bbl/day) |
|
|
Price (per Bbl) |
|
|
(per Bbl) |
|
|
Value of Liability |
|
||||
|
|
|
|
|
|
|
|
|
|
|
|
|
|
|
|
|
(in thousands) |
|
|
|
Collar |
|
January 1, 2017— December 31, 2017 |
|
|
296 |
|
|
$ |
47.50 |
|
|
$ |
61.00 |
|
|
$ |
(289 |
) |
|
Collar |
|
January 2, 2017— December 31, 2017 |
|
|
445 |
|
|
$ |
50.00 |
|
|
$ |
61.50 |
|
|
|
(307 |
) |
|
Collar |
|
January 1, 2018— February 28, 2018 |
|
|
458 |
|
|
$ |
50.00 |
|
|
$ |
61.50 |
|
|
|
(74 |
) |
|
Collar |
|
January 1, 2018— May 31, 2018 |
|
|
298 |
|
|
$ |
47.50 |
|
|
$ |
61.00 |
|
|
|
(168 |
) |
|
Total Estimated Fair Value of Liability |
|
|
|
|
|
|
|
|
|
|
|
|
|
|
|
$ |
(838 |
) |
F-16
At December 31, 2015, we had outstanding commodity derivative contracts with respect to our future crude oil production as set forth in the tables below:
Fair Value of Derivative Instruments as of December 31, 2015
|
|
|
|
|
Puts |
|
|
|||||||||
|
|
|
|
|
|
|
|
|
Weighted |
|
|
|
|
|
|
|
|
|
|
|
|
|
|
|
|
Average |
|
|
|
|
|
|
|
|
|
|
|
|
|
|
|
|
Minimum |
|
|
Estimated Fair |
|
|
||
|
|
|
|
|
Quantity |
|
|
Price |
|
|
Value of |
|
|
|||
|
Type |
|
Period |
|
(Bbl/day) |
|
|
(per Bbl) |
|
|
Asset |
|
|
|||
|
|
|
|
|
|
|
|
|
|
|
|
|
(in thousands) |
|
|
|
|
Put |
|
January 1, 2016— December 31, 2016 |
|
|
808 |
|
|
$ |
50.00 |
|
|
$ |
3,235 |
|
|
|
Put |
|
January 1, 2017— December 31, 2017 |
|
|
610 |
|
|
$ |
50.00 |
|
|
|
1,798 |
|
|
|
Put |
|
January 1, 2018— December 31, 2018 |
|
|
494 |
|
|
$ |
50.00 |
|
|
|
1,292 |
|
|
|
Put |
|
January 1, 2019— March 31, 2019 |
|
|
443 |
|
|
$ |
50.00 |
|
|
|
280 |
|
|
|
Total Estimated Fair Value of Asset |
|
|
|
|
|
|
|
|
|
|
|
$ |
6,605 |
|
|
Balance sheet presentation
The following table summarizes both: (i) the gross fair value of our commodity derivative instruments by the appropriate balance sheet classification even when the commodity derivative instruments are subject to netting arrangements and qualify for net presentation in our consolidated balance sheets at December 31, 2016 and December 31, 2015, and (ii) the net recorded fair value as reflected on our consolidated balance sheets at December 31, 2016 and December 31, 2015.
|
|
|
|
|
As of December 31, 2016 |
|
|||||||||
|
|
|
|
|
|
|
|
|
Gross |
|
|
|
|
|
|
|
|
|
|
|
|
|
|
|
Amount |
|
|
Net Amount of |
|
||
|
|
|
|
|
Gross |
|
|
Offset in the |
|
|
Liabilities |
|
|||
|
|
|
|
|
Amount of |
|
|
Consolidated |
|
|
Presented in the |
|
|||
|
|
|
|
|
Recognized |
|
|
Balance |
|
|
Consolidated |
|
|||
|
Underlying Commodity |
|
Location on Balance Sheet |
|
Liabilities |
|
|
Sheet |
|
|
Balance Sheet |
|
|||
|
|
|
|
|
(in thousands) |
|
|||||||||
|
Crude oil |
|
Current liabilities |
|
$ |
596 |
|
|
$ |
– |
|
|
$ |
596 |
|
|
Crude oil |
|
Long-term liabilities |
|
|
242 |
|
|
|
– |
|
|
|
242 |
|
|
|
|
|
|
As of December 31, 2015 |
|
|||||||||
|
|
|
|
|
|
|
|
|
Gross |
|
|
|
|
|
|
|
|
|
|
|
|
|
|
|
Amount |
|
|
Net Amount of |
|
||
|
|
|
|
|
Gross |
|
|
Offset in the |
|
|
Assets |
|
|||
|
|
|
|
|
Amount of |
|
|
Consolidated |
|
|
Presented in the |
|
|||
|
|
|
|
|
Recognized |
|
|
Balance |
|
|
Consolidated |
|
|||
|
Underlying Commodity |
|
Location on Balance Sheet |
|
Assets |
|
|
Sheet |
|
|
Balance Sheet |
|
|||
|
|
|
|
|
(in thousands) |
|
|||||||||
|
Crude oil |
|
Current assets |
|
$ |
3,235 |
|
|
$ |
– |
|
|
$ |
3,235 |
|
|
Crude oil |
|
Long-term assets |
|
|
3,370 |
|
|
|
– |
|
|
|
3,370 |
|
F-17
8. Asset retirement obligations
As part of our development of oil and natural gas properties, we incur asset retirement obligations (“ARO”). Our ARO results from our responsibility to abandon and reclaim our net share of all working interest properties and facilities. At December 31, 2016, the net present value of our total ARO was estimated to be $8.0 million, with the undiscounted value being $12.6 million. Total ARO at December 31, 2016 shown in the table below consists of amounts for future plugging and abandonment liabilities on our wellbores and facilities based on third-party estimates of such costs, adjusted for inflation at a rate of approximately 6.75% per annum for Turkey. These values are discounted to present value using our credit-adjusted risk-free rate of 5.51% per annum for Turkey for the year ended December 31, 2016. The following table summarizes the changes in our ARO for the years ended December 31, 2016 and 2015:
|
|
2016 |
|
|
2015 |
|
||
|
|
(in thousands) |
|
|||||
|
Asset retirement obligations at beginning of period |
$ |
9,237 |
|
|
$ |
10,543 |
|
|
Change in estimates |
|
– |
|
|
|
385 |
|
|
Liabilities settled |
|
(7 |
) |
|
|
– |
|
|
Foreign exchange change effect |
|
(1,604 |
) |
|
|
(2,137 |
) |
|
Additions |
|
16 |
|
|
|
78 |
|
|
Accretion expense |
|
373 |
|
|
|
368 |
|
|
Asset retirement obligations at end of period |
|
8,015 |
|
|
|
9,237 |
|
|
Less: TBNG asset retirement obligations held for sale |
|
3,182 |
|
|
|
3,716 |
|
|
Long-term portion |
$ |
4,833 |
|
|
$ |
5,521 |
|
Our ARO is measured using primarily Level 3 inputs. The significant unobservable inputs to this fair value measurement include estimates of plugging costs, remediation costs, inflation rate and well life. The inputs are calculated based on historical data as well as current estimated costs.
9. Loans payable
As of the dates indicated, our third-party debt consisted of the following:
|
|
December 31, |
|
|
December 31, |
|
||
|
|
2016 |
|
|
2015 |
|
||
|
Fixed and floating rate loans |
(in thousands) |
|
|||||
|
Term Loan |
$ |
25,000 |
|
|
$ |
- |
|
|
2017 Notes |
|
13,750 |
|
|
|
34,400 |
|
|
2017 Notes - Related Party |
|
500 |
|
|
|
20,600 |
|
|
Senior Credit Facility |
|
– |
|
|
|
32,075 |
|
|
Unamortized deferred financing costs - Senior Credit Facility and 2017 Notes |
|
– |
|
|
|
(1,200 |
) |
|
ANBE Note |
|
2,694 |
|
|
|
3,592 |
|
|
West Promissory Notes |
|
– |
|
|
|
1,000 |
|
|
Loans payable |
|
41,944 |
|
|
|
90,467 |
|
|
Less: current portion |
|
38,194 |
|
|
|
35,467 |
|
|
Long-term portion |
$ |
3,750 |
|
|
$ |
55,000 |
|
Term Loan
On August 23, 2016, the Turkish branch of TransAtlantic Exploration Mediterranean International Pty Ltd (“TEMI”) entered into a Credit Agreement with DenizBank. The Credit Agreement is a master agreement pursuant to which DenizBank may make loans to TEMI from time to time pursuant to additional loan agreements.
On August 31, 2016, DenizBank entered into a $30.0 million term loan with TEMI under the Credit Agreement (the “Term Loan”). In addition, we and DenizBank entered into additional agreements with respect to up to $20.0 million of non-cash facilities, including guarantee letters and treasury instruments for future hedging transactions.
On September 7, 2016, TEMI used approximately $22.9 million of the proceeds from the Term Loan to repay the Senior Credit Facility with BNP and IFC in full.
F-18
The Term Loan bears interest at a fixed rate of 5.25% (plus 0.2625% for Banking and Insurance Transactions Tax per the Turkish government) per annum and is payable in six monthly installments of $1.25 million each through February 2017 and thereafter in twelve monthly installments of $1.88 million each through February 2018. The Term Loan matures in February 2018. Amounts repaid under the Term Loan may not be re-borrowed, and early repayments under the Term Loan are subject to early repayment fees.
The Term Loan is guaranteed by DMLP, Ltd. (“DMLP”), TransAtlantic Turkey, Ltd. (“TransAtlantic Turkey”), Talon Exploration, Ltd. (“Talon Exploration”) and TransAtlantic Worldwide, Ltd. (“TransAtlantic Worldwide”), (collectively, the “Guarantors”). Each of the Guarantors is a wholly-owned subsidiary of the Company.
The Term Loan contains standard prohibitions on the activities of TEMI as the borrower, including prohibitions on granting of liens on its assets, incurring additional debt, dissolving, liquidating, merging, consolidating, paying dividends, making certain investments, selling assets or transferring revenue, and other similar matters. In addition, the Term Loan prohibits Amity Oil International Pty Ltd (“Amity”) and Petrogas Petrol Gaz ve Petrokimya Urunleri Insaat Sanayi ve Ticaret A.S. (“Petrogas”) from incurring additional debt. An event of default under the Term Loan includes, among other events, failure to pay principal or interest when due, breach of certain covenants, representations, warranties and obligations, bankruptcy or insolvency and the occurrence of a material adverse effect.
The Term Loan is secured by a pledge of (i) the stock of TEMI, DMLP, TransAtlantic Turkey and Talon Exploration, (ii) substantially all of the assets of TEMI, (iii) certain real estate owned by Petrogas, (iv) the Gundem real estate and Muratli real estate owned by Gundem Turizm Yatirim ve Isletmeleri A.S. (“Gundem”) and (v) the Diyarbakir real estate owned 80% by N. Malone Mitchell 3rd and 20% by Selami Erdem Uras. In addition, TEMI assigned its Turkish collection accounts and its receivables from the sale of oil to DenizBank as additional security for the Term Loan. Gundem is beneficially owned by Mr. Mitchell, his adult children, and Mr. Uras. Mr. Mitchell is our chief executive officer and chairman of our board of directors. Mr. Uras is our vice president, Turkey.
At December 31, 2016, we had $25.0 million outstanding under the Term Loan and no availability, and were in compliance with the covenants in the Term Loan.
2017 Notes
As of December 31, 2016, we had $14.3 million aggregate principal amount of outstanding 2017 Notes. The 2017 Notes were issued pursuant to an indenture, dated as of February 20, 2015 (the “Indenture”), between us and U.S. Bank National Association, as trustee (the “Trustee”).
The 2017 Notes bear interest at an annual rate of 13.0%, payable semi-annually, in arrears, on January 1 and July 1 of each year. The 2017 Notes mature on July 1, 2017, unless earlier redeemed or converted. On June 30, 2016, we issued 2,511,742 common shares to certain holders of the 2017 Notes in lieu of paying cash interest on the 2017 Notes.
On November 4, 2016, we exchanged $40.75 million of 2017 Notes for 815,000 Series A Preferred Shares. In addition, in January 2017, we redeemed $4.3 million of 2017 Notes with proceeds of our offering of Series A Preferred Shares.
Holders may from time to time at such holder’s option, convert, subject to certain terms and conditions, any or all of the principal of any 2017 Note into fully paid and nonassessable common shares at the conversion price. The conversion price is $6.80 per common share, subject to adjustment as described in the Indenture. Prior to or contemporaneously with the conversion of any of the principal of a 2017 Note, all accrued but unpaid interest on the principal amount being converted will be paid in cash. The 2017 Notes may not be converted into common shares on the maturity date or the redemption date.
We may redeem all or part of the 2017 Notes at 100% of the principal amount thereof, plus accrued and unpaid interest to the redemption date.
If we experience a fundamental change (as defined in the Indenture), we will be required to make an offer to repurchase the 2017 Notes at a price equal to 100% of the principal amount thereof, plus accrued and unpaid interest, if any, up to but excluding the date of repurchase. Additionally, if we sell certain assets for $50.0 million or more in cash consideration, in certain circumstances, we will be required to use a portion of the net cash proceeds of such sale to make an offer to repurchase 2017 Notes at a price equal to the price we would be required to pay for an optional redemption at such time, plus accrued and unpaid interest, if any, up to but excluding the date of repurchase. The Indenture provides for customary events of default. The Indenture contains limited covenants.
F-19
On May 6, 2014, certain of our wholly-owned subsidiaries entered into the Senior Credit Facility. The Senior Credit Facility was guaranteed by us and each of TransAtlantic Petroleum (USA) Corp. (“TransAtlantic USA”) and TransAtlantic Worldwide. On September 7, 2016, we repaid the Senior Credit Facility in full and terminated it.
West Promissory Notes
In August 2015, TransAtlantic USA entered into promissory notes (the “Promissory Notes”) with each of Mary West CRT 2 LLC and Gary West CRT 2 LLC, shareholders of the Company (collectively, the “Holders”), whereby TransAtlantic USA could borrow up to $1.5 million under each Promissory Note to fund a share repurchase program. The Holders were managed by Randy Rochman, a former observer of our board of directors at the time, who is now a director of our board. On September 9, 2016, the Promissory Notes were repaid in full with proceeds from the Term Loan and were terminated.
ANBE Promissory Note
On December 30, 2015, TransAtlantic USA entered into a $5.0 million draw down convertible promissory note (the “Note”) with ANBE Holdings, L.P. (“ANBE”), an entity owned by the children of the Company’s chairman and chief executive officer, N. Malone Mitchell, 3rd, and controlled by an entity managed by Mr. Mitchell and his wife. The Note bears interest at a rate of 13.0% per annum. On December 30, 2015, the Company borrowed $3.6 million under the Note (the “Initial Advance”) for general corporate purposes. On June 30, 2016, we issued 355,826 common shares in a private placement to ANBE in lieu of paying cash interest on the Note.
On October 31, 2016, TransAtlantic USA entered into an amendment of the Note with ANBE (the “ANBE Amendment”). The ANBE Amendment extended the maturity date of the Note from October 31, 2016 to September 30, 2017, provided for the Note to be repaid in four quarterly installments of $0.9 million each in December 2016 and March, June and September 2017, and provided for monthly payments of interest. In addition, pursuant to the ANBE Amendment, if the sale of TBNG is completed prior to the extended maturity date of the Note, then the Company will repay the Note in full with proceeds from the sale of TBNG within five business days from the closing of the sale. As of December 31, 2016, the Company had borrowed $2.7 million under the Note and had no availability (See Note 18, “Subsequent Events”).
Unsecured lines of credit
Our wholly-owned subsidiaries operating in Turkey are party to unsecured, non-interest bearing lines of credit with a Turkish bank. At December 31, 2016, we had no outstanding borrowings under these lines of credit.
Loan financing costs
We capitalize certain costs in connection with obtaining our borrowings, such as lender’s fees and related attorney’s fees. These costs are amortized on a straight line basis, which approximates the effective interest method over the term of the loan as a component of interest expense. Loan financing costs, which are netted against current loans payable, totaled approximately zero and $1.2 million as of December 31, 2016 and 2015, respectively. Amortization of loan financing costs totaled approximately $1.2 million, $1.6 million and $1.0 million during 2016, 2015 and 2014, respectively.
10. Shareholders’ equity
June 2016 share issuance
On June 30, 2016, we issued an aggregate of 5,773,305 common shares in private placements under the Securities Act of 1933, as amended (the “Securities Act”). Of the 5,773,305 common shares, (i) 2,905,737 common shares were issued to holders of the 2017 Notes at the election of such holders to receive common shares in lieu of cash interest on the 2017 Notes; (ii) 355,826 common shares were issued to ANBE in lieu of cash interest on the Note; and (iii) 2,511,742 common shares were issued for cash, which was used to pay cash interest to certain holders of the 2017 Notes. All of the shares were issued at a value of $0.6599 per share, which was equal to 75% of the 10-day volume weighted average price through the close of trading of the common shares on the NYSE MKT on June 29, 2016.
Direct settlement
On April 17, 2016, we issued 225,000 common shares to Direct Petroleum Inc. (“Direct”) pursuant to a settlement agreement for a mutual release of all current and future claims against the other party.
F-20
In November 2014, we issued 3,218,641 common shares at a deemed price of $7.41 per common share for the acquisition of Stream Oil & Gas Ltd. (“Stream”).
Restricted stock units
Under our 2009 Long-Term Incentive Plan (the “Incentive Plan”), we award restricted stock units (“RSUs”) and other share-based compensation to certain of our directors, officers, employees and consultants. Each RSU is equal in value to one of our common shares on the grant date. Upon vesting, an award recipient is entitled to a number of common shares equal to the number of vested RSUs. The RSU awards can only be settled in common shares. As a result, RSUs are classified as equity. At the grant date, we make an estimate of the forfeitures expected to occur during the vesting period and record compensation cost, net of the estimated forfeitures, over the requisite service period. The current forfeiture rate is estimated to be 12.5%.
Under the Incentive Plan, RSUs vest over specified periods of time ranging from immediately to four years. RSUs are deemed full value awards and their value is equal to the market price of our common shares on the grant date. ASC 718 requires that the Incentive Plan be approved in order to establish a grant date. Under ASC 718, the approval date for the Incentive Plan was February 9, 2009, the date our board of directors approved the Incentive Plan.
Share-based compensation of approximately $0.6 million, $1.1 million and $1.4 million with respect to awards of RSUs was recorded for the years ended December 31, 2016, 2015 and 2014, respectively. As of December 31, 2016, we had approximately $0.5 million of unrecognized compensation expense related to unvested RSUs, which is expected to be recognized over a weighted average period of 1.5 years. The following table sets forth RSU activity for the year ended December 31, 2016:
|
|
|
Number of RSUs (in thousands) |
|
|
Weighted Average Grant Date Fair Value Per RSU |
|
||
|
Unvested RSUs outstanding at December 31, 2015 |
|
|
429 |
|
|
$ |
5.60 |
|
|
Granted |
|
|
698 |
|
|
|
0.81 |
|
|
Forfeited |
|
|
(103 |
) |
|
|
4.46 |
|
|
Vested |
|
|
(263 |
) |
|
|
5.16 |
|
|
Unvested RSUs outstanding at December 31, 2016 |
|
|
761 |
|
|
$ |
1.52 |
|
Earnings per share
We account for earnings per share in accordance with ASC Subtopic 260-10, Earnings Per Share (“ASC 260-10”). ASC 260-10 requires companies to present two calculations of earnings per share: basic and diluted. Basic earnings per common share for the years ended December 31, 2016, 2015 and 2014 equals net income divided by the weighted average shares outstanding during the periods. Weighted average shares outstanding are equal to the weighted average of all shares outstanding for the period, excluding RSUs. Diluted earnings per common share for the years ended December 31, 2016, 2015 and 2014 are computed in the same manner as basic earnings per common share after assuming the issuance of common shares for all potentially dilutive common share equivalents, which includes stock options, RSUs, preferred shares and warrants, whether exercisable or not. The computation of diluted earnings per common share excluded 17.3 million and 8.9 million antidilutive common share equivalents from the year ended December 31, 2016 and 2015, respectively. There were no antidilutive common share equivalents for the year ended December 31, 2014.
F-21
The following table presents the basic and diluted earnings per common share computations:
|
(in thousands, except per share amounts) |
|
2016 |
|
|
2015 |
|
|
2014 |
|
|||
|
Net (loss) income from continuing operations |
|
$ |
(22,445 |
) |
|
$ |
(26,665 |
) |
|
$ |
29,214 |
|
|
Net income (loss) from discontinued operations |
|
$ |
16,202 |
|
|
$ |
(80,873 |
) |
|
$ |
(138 |
) |
|
Basic net (loss) income per common share: |
|
|
|
|
|
|
|
|
|
|
|
|
|
Shares: |
|
|
|
|
|
|
|
|
|
|
|
|
|
Weighted average common shares outstanding |
|
|
43,885 |
|
|
|
40,841 |
|
|
|
37,829 |
|
|
Basic net (loss) income per common share: |
|
|
|
|
|
|
|
|
|
|
|
|
|
Continuing operations |
|
$ |
(0.51 |
) |
|
$ |
(0.65 |
) |
|
$ |
0.77 |
|
|
Discontinued operations |
|
$ |
0.37 |
|
|
$ |
(1.98 |
) |
|
$ |
– |
|
|
Diluted net (loss) income per common share: |
|
|
|
|
|
|
|
|
|
|
|
|
|
Shares: |
|
|
|
|
|
|
|
|
|
|
|
|
|
Weighted average shares outstanding |
|
|
43,885 |
|
|
|
40,841 |
|
|
|
37,829 |
|
|
Dilutive effect of: |
|
|
|
|
|
|
|
|
|
|
|
|
|
Restricted share units |
|
|
– |
|
|
|
– |
|
|
|
152 |
|
|
Convertible notes |
|
|
– |
|
|
|
– |
|
|
|
50 |
|
|
Weighted average common and common equivalent shares outstanding |
|
|
43,885 |
|
|
|
40,841 |
|
|
|
38,031 |
|
|
Diluted net (loss) income per common share: |
|
|
|
|
|
|
|
|
|
|
|
|
|
Continuing operations |
|
$ |
(0.51 |
) |
|
$ |
(0.65 |
) |
|
$ |
0.77 |
|
|
Discontinued operations |
|
$ |
0.37 |
|
|
$ |
(1.98 |
) |
|
$ |
– |
|
Warrants
On December 31, 2014, we issued 134,169 common share purchase warrants (“Warrants”) to Mr. Mitchell and 23,333 common share purchase warrants to each of Mr. Mitchell’s children pursuant to warrant agreements. These Warrants were issued to Mr. Mitchell and his children as shareholders of Gundem, which agreed to pledge Turkish real estate in exchange for an extension of the maturity date of a credit agreement between us and a Turkish bank. As consideration for the pledge of Turkish real estate, the independent members of our board of directors approved the issuance of the Warrants to be allocated in accordance with each shareholder’s ownership percentage of Gundem. Pursuant to the warrant agreements, the Warrants are immediately exercisable, expire on January 6, 2018, and entitle the holder to purchase one common share for each Warrant at an exercise price of $5.99 per share.
On each of April 24, 2015 and August 13, 2015, we issued 233,333 Warrants to Mr. Mitchell and certain other related parties as shareholders of Gundem, as consideration for the pledge of Turkish real estate in exchange for an extension of the maturity of a credit agreement between TBNG and a Turkish bank. As consideration for the pledge of Turkish real estate, the independent members of our board of directors approved the issuance of the Warrants to be allocated in accordance with each shareholder’s ownership percentage of Gundem. The Warrants were issued pursuant to a warrant agreement, whereby the Warrants are immediately exercisable, expire on January 6, 2018, and entitle the holder to purchase one common share for each Warrant. The Warrants were issued in April 2015 and August 2015 at an exercise price of $5.65 and $2.99 per share, respectively. For the year ended December 31, 2015, we incurred $0.5 million of compensation expense for these Warrants. The fair value of the Warrants was determined using the Black-Scholes Model.
F-22
The income tax provision differs from the amount that would be obtained by applying the Bermuda statutory income tax rate of 0% for 2016, 2015 and 2014 to income (loss) from continuing operations for the year as follows:
|
|
2016 |
|
|
2015 |
|
|
2014 |
|
|||
|
|
(in thousands except rates) |
|
|||||||||
|
Statutory rate |
|
0.00 |
% |
|
|
0.00 |
% |
|
|
0.00 |
% |
|
|
|
|
|
|
|
|
|
|
|
|
|
|
(Loss) income from continuing operations before income taxes |
$ |
(16,399 |
) |
|
$ |
(4,436 |
) |
|
$ |
42,873 |
|
|
Increase (decrease) resulting from: |
|
|
|
|
|
|
|
|
|
|
|
|
Foreign tax rate differentials |
$ |
(1,018 |
) |
|
$ |
1,676 |
|
|
$ |
9,262 |
|
|
Uncertain tax position |
|
(958 |
) |
|
|
10,066 |
|
|
|
1,260 |
|
|
Unremitted earnings |
|
4,777 |
|
|
|
11,561 |
|
|
|
– |
|
|
Derivative contracts |
|
– |
|
|
|
(5,038 |
) |
|
|
– |
|
|
Change in valuation allowance |
|
(147 |
) |
|
|
3,232 |
|
|
|
228 |
|
|
Expiration of non-capital tax loss carryovers |
|
2,056 |
|
|
|
1,740 |
|
|
|
1,841 |
|
|
Other |
|
1,336 |
|
|
|
(1,008 |
) |
|
|
1,068 |
|
|
Total |
$ |
6,046 |
|
|
$ |
22,229 |
|
|
$ |
13,659 |
|
The components of the net deferred income tax liability at December 31, 2016 and 2015 were as follows:
|
|
2016 |
|
|
2015 |
|
||
|
|
(in thousands) |
|
|||||
|
Deferred tax assets |
|
|
|
|
|
|
|
|
Property and equipment |
$ |
3,003 |
|
|
$ |
3,749 |
|
|
Unrealized gains on derivative contracts |
|
168 |
|
|
|
– |
|
|
Timing of accruals |
|
162 |
|
|
|
351 |
|
|
Non-capital loss carryovers |
|
22,364 |
|
|
|
24,098 |
|
|
Valuation allowance |
|
(25,452 |
) |
|
|
(27,870 |
) |
|
Total deferred tax assets |
$ |
245 |
|
|
$ |
328 |
|
|
Deferred tax liabilities |
|
|
|
|
|
|
|
|
Property and equipment |
$ |
(9,986 |
) |
|
$ |
(15,514 |
) |
|
Unremitted earnings |
|
(8,586 |
) |
|
|
(6,981 |
) |
|
Timing of accruals |
|
(479 |
) |
|
|
(436 |
) |
|
Total deferred tax liabilities |
|
(19,051 |
) |
|
|
(22,931 |
) |
|
Net deferred tax liabilities |
$ |
(18,806 |
) |
|
$ |
(22,603 |
) |
|
Components of net deferred tax liabilities |
|
|
|
|
|
|
|
|
Non-current assets |
$ |
245 |
|
|
$ |
- |
|
|
Non-current liabilities |
|
(19,051 |
) |
|
|
(22,603 |
) |
|
Net deferred tax liabilities |
$ |
(18,806 |
) |
|
$ |
(22,603 |
) |
We have accumulated losses or resource-related deductions available for income tax purposes in Turkey, Romania, Bulgaria and the United States. As of December 31, 2016, we had non-capital tax losses in Turkey of approximately 63.2 million TRY (approximately $18.0 million), which will begin to expire in 2017; non-capital tax losses in Romania of approximately 8.1 million Romanian New Leu (approximately $1.9 million), which will begin to expire in 2018; non-capital losses in Bulgaria of approximately 7.1 million Bulgarian Lev (approximately $3.9 million), which will begin to expire in 2017; and non-capital tax losses in the United States of approximately $51.7 million, which will begin to expire in 2018. As of December 31, 2016 and 2015, we reflected a valuation allowance of $25.5 million and $27.9 million, respectively, as a reduction to our net operating losses and deferred tax assets.
Effective October 1, 2009, we continued to the jurisdiction of Bermuda. We have determined that no taxes were payable upon the continuance. However, our tax filing positions are still subject to review by taxation authorities who may successfully challenge our interpretation of the applicable tax legislation and regulations, with the result that additional taxes could be payable by us.
F-23
We file income tax returns in the United States, Turkey, Romania, Bulgaria and Cyprus, with Turkey being the only jurisdiction with significant amounts of taxes due. Except for the outstanding examination of the 2011 income tax filings for Petrogas, Turkish income tax filings before 2012 are no longer subject to examination. As the result of 2016 Turkish legislation allowing us the option to enter into an agreement to exempt corporate income tax filings from examination, we were able to close additional years from examination.
During the year ended December 2016, the Turkish Ministry of Finance completed their audits of Amity for the year ended December 31, 2011, and Talon Exploration for the year ended December 31, 2014, with no significant findings.
As of December 31, 2016 and 2015, we recorded an $8.1 million and $10.9 million liability, respectively, primarily due to uncertain tax positions related to the unwinding of all our crude oil hedge collars and three-way contracts, which are included in long-term accrued liabilities on our consolidated balance sheet. The unrecognized tax benefits at December 31, 2016 and 2015 were as follows:
|
|
2016 |
|
|
2015 |
|
||
|
|
(in thousands) |
|
|||||
|
Unrecognized tax benefits at beginning of period |
$ |
11,014 |
|
|
$ |
1,188 |
|
|
Gross increases - tax positions in prior period |
|
910 |
|
|
|
– |
|
|
Gross decreases - tax positions in prior period |
|
(3,087 |
) |
|
|
– |
|
|
Gross increases - tax positions in current period |
|
1,219 |
|
|
|
10,066 |
|
|
Gross decreases - tax positions in current period |
|
– |
|
|
|
– |
|
|
Foreign exchange change effect |
|
(1,914 |
) |
|
|
(240 |
) |
|
Unrecognized tax benefits at end of period |
|
8,142 |
|
|
|
11,014 |
|
|
Less: TBNG liability held for sale |
|
(63 |
) |
|
|
(76 |
) |
|
Unrecognized tax benefits at end of period |
$ |
8,079 |
|
|
$ |
10,938 |
|
As of December 31, 2016, there were no material uncertain tax positions for which the total amounts of unrecognized tax benefits will significantly increase or decrease within the next 12 months.
Unremitted Earnings
Our foreign subsidiaries generate earnings that are not subject to Turkish dividend withholding taxes so long as they are permanently reinvested in our operations in Turkey. Pursuant to ASC Topic No. 740-30 (formerly APB 23), undistributed earnings of foreign subsidiaries that are no longer permanently reinvested would become subject to Turkish dividend withholding taxes. Prior to fiscal year 2015, we asserted that the undistributed earnings of our foreign Turkish subsidiaries were permanently reinvested.
Primarily due to the increase in our U.S. debt service obligations resulting from the issuance of the 2017 Notes in the aggregate principal amount of $55.0 million in 2015 (see Note 9, “Loans payable”), management concluded that the ability to access certain amounts of foreign earnings would provide greater flexibility to meet corporate cash flow needs without constraining foreign objectives. Accordingly, in the fourth quarter of fiscal year 2015, we withdrew the permanent reinvestment assertion on 135.2 million TRY of cumulative earnings generated by certain of our Turkish foreign subsidiaries through fiscal year 2015. We provided for Turkish dividend withholding taxes on the 135.2 million TRY of cumulative undistributed foreign Turkish earnings, resulting in the recognition of a deferred tax liability. As of December 31, 2016, we maintain the same position and we provided for Turkish dividend withholding taxes on 201.3 million TRY of cumulative undistributed foreign Turkish earnings, resulting in an additional increase in our deferred tax liability.
There is no certainty as to the timing of when such Turkish foreign earnings will be distributed to TransAtlantic Worldwide in whole or in part.
F-24
In accordance with ASC 280, Segment Reporting (“ASC 280”), we have two reportable geographic segments: Turkey and Bulgaria. Summarized financial information from continuing operations concerning our geographic segments is shown in the following tables:
|
|
Corporate |
|
|
Turkey |
|
|
Bulgaria |
|
|
Total |
|
|
||||
|
|
(in thousands) |
|
|
|||||||||||||
|
For the year ended December 31, 2016 |
|
|
|
|
|
|
|
|
|
|
|
|
|
|
|
|
|
Total revenues |
$ |
– |
|
|
$ |
68,595 |
|
|
$ |
– |
|
|
$ |
68,595 |
|
|
|
Production |
|
– |
|
|
|
12,293 |
|
|
|
75 |
|
|
|
12,368 |
|
|
|
Exploration, abandonment, and impairment |
|
1,417 |
|
|
|
4,546 |
|
|
|
– |
|
|
|
5,963 |
|
|
|
Cost of purchased gas |
|
– |
|
|
|
4,418 |
|
|
|
– |
|
|
|
4,418 |
|
|
|
Seismic and other exploration |
|
– |
|
|
|
91 |
|
|
|
13 |
|
|
|
104 |
|
|
|
General and administrative |
|
8,170 |
|
|
|
7,948 |
|
|
|
202 |
|
|
|
16,320 |
|
|
|
Depreciation, depletion and amortization |
|
264 |
|
|
|
28,761 |
|
|
|
– |
|
|
|
29,025 |
|
|
|
Accretion of asset retirement obligations |
|
– |
|
|
|
354 |
|
|
|
19 |
|
|
|
373 |
|
|
|
Total costs and expenses |
|
9,851 |
|
|
|
58,411 |
|
|
|
309 |
|
|
|
68,571 |
|
|
|
Operating (loss) income |
|
(9,851 |
) |
|
|
10,184 |
|
|
|
(309 |
) |
|
|
24 |
|
|
|
Interest and other expense |
|
(8,633 |
) |
|
|
(3,208 |
) |
|
|
– |
|
|
|
(11,841 |
) |
|
|
Interest and other income |
|
656 |
|
|
|
1,888 |
|
|
|
2 |
|
|
|
2,546 |
|
|
|
Loss on commodity derivative contracts |
|
– |
|
|
|
(3,257 |
) |
|
|
– |
|
|
|
(3,257 |
) |
|
|
Foreign exchange gain (loss) |
|
428 |
|
|
|
(4,293 |
) |
|
|
(6 |
) |
|
|
(3,871 |
) |
|
|
(Loss) income from continuing operations before income taxes |
|
(17,400 |
) |
|
|
1,314 |
|
|
|
(313 |
) |
|
|
(16,399 |
) |
|
|
Income tax expense |
|
– |
|
|
|
(6,046 |
) |
|
|
– |
|
|
|
(6,046 |
) |
|
|
Net loss from continuing operations |
$ |
(17,400 |
) |
|
$ |
(4,732 |
) |
|
$ |
(313 |
) |
|
$ |
(22,445 |
) |
|
|
Total assets at December 31, 2016 |
$ |
17,007 |
|
|
$ |
153,560 |
|
|
$ |
609 |
|
|
$ |
171,176 |
|
(1) |
|
Capital expenditures for the year ended December 31, 2016 |
$ |
– |
|
|
$ |
10,186 |
|
|
$ |
– |
|
|
$ |
10,186 |
|
|
|
For the year ended December 31, 2015 |
|
|
|
|
|
|
|
|
|
|
|
|
|
|
|
|
|
Total revenues |
$ |
– |
|
|
$ |
85,064 |
|
|
$ |
– |
|
|
$ |
85,064 |
|
|
|
Production |
|
– |
|
|
|
12,804 |
|
|
|
69 |
|
|
|
12,873 |
|
|
|
Exploration, abandonment, and impairment |
|
– |
|
|
|
17,778 |
|
|
|
3,766 |
|
|
|
21,544 |
|
|
|
Cost of purchased gas |
|
– |
|
|
|
2,082 |
|
|
|
– |
|
|
|
2,082 |
|
|
|
Seismic and other exploration |
|
55 |
|
|
|
264 |
|
|
|
51 |
|
|
|
370 |
|
|
|
General and administrative |
|
12,729 |
|
|
|
11,132 |
|
|
|
277 |
|
|
|
24,138 |
|
|
|
Depreciation, depletion and amortization |
|
306 |
|
|
|
37,401 |
|
|
|
– |
|
|
|
37,707 |
|
|
|
Accretion of asset retirement obligations |
|
– |
|
|
|
350 |
|
|
|
18 |
|
|
|
368 |
|
|
|
Total costs and expenses |
|
13,090 |
|
|
|
81,811 |
|
|
|
4,181 |
|
|
|
99,082 |
|
|
|
Operating (loss) income |
|
(13,090 |
) |
|
|
3,253 |
|
|
|
(4,181 |
) |
|
|
(14,018 |
) |
|
|
Interest and other expense |
|
(7,383 |
) |
|
|
(5,694 |
) |
|
|
– |
|
|
|
(13,077 |
) |
|
|
Interest and other income |
|
354 |
|
|
|
500 |
|
|
|
1 |
|
|
|
855 |
|
|
|
Gain on commodity derivative contracts |
|
– |
|
|
|
27,457 |
|
|
|
– |
|
|
|
27,457 |
|
|
|
Foreign exchange loss |
|
(58 |
) |
|
|
(5,589 |
) |
|
|
(6 |
) |
|
|
(5,653 |
) |
|
|
(Loss) income from continuing operations before income taxes |
|
(20,177 |
) |
|
|
19,927 |
|
|
|
(4,186 |
) |
|
|
(4,436 |
) |
|
|
Income tax expense |
|
– |
|
|
|
(22,229 |
) |
|
|
– |
|
|
|
(22,229 |
) |
|
|
Net loss from continuing operations |
$ |
(20,177 |
) |
|
$ |
(2,302 |
) |
|
$ |
(4,186 |
) |
|
$ |
(26,665 |
) |
|
|
Total assets at December 31, 2015 |
$ |
14,205 |
|
|
$ |
197,944 |
|
|
$ |
601 |
|
|
$ |
212,750 |
|
(2) |
|
Capital expenditures for the year ended December 31, 2015 |
$ |
163 |
|
|
$ |
22,262 |
|
|
$ |
41 |
|
|
$ |
22,466 |
|
|
|
For the year ended December 31, 2014 |
|
|
|
|
|
|
|
|
|
|
|
|
|
|
|
|
|
Total revenues |
$ |
– |
|
|
$ |
138,807 |
|
|
$ |
23 |
|
|
$ |
138,830 |
|
|
|
Production |
|
– |
|
|
|
18,059 |
|
|
|
134 |
|
|
|
18,193 |
|
|
|
Exploration, abandonment, and impairment |
|
– |
|
|
|
19,820 |
|
|
|
44 |
|
|
|
19,864 |
|
|
|
Cost of purchased gas |
|
– |
|
|
|
2,055 |
|
|
|
– |
|
|
|
2,055 |
|
|
|
Seismic and other exploration |
|
178 |
|
|
|
4,106 |
|
|
|
1 |
|
|
|
4,285 |
|
|
|
Revaluation of contingent consideration |
|
– |
|
|
|
– |
|
|
|
(2,500 |
) |
|
|
(2,500 |
) |
|
|
General and administrative |
|
14,418 |
|
|
|
14,984 |
|
|
|
1,669 |
|
|
|
31,071 |
|
|
F-25
|
|
Corporate |
|
|
Turkey |
|
|
Bulgaria |
|
|
Total |
|
|
||||
|
|
(in thousands) |
|
|
|||||||||||||
|
|
124 |
|
|
|
48,452 |
|
|
|
18 |
|
|
|
48,594 |
|
|
|
|
Accretion of asset retirement obligations |
|
– |
|
|
|
387 |
|
|
|
19 |
|
|
|
406 |
|
|
|
Total costs and expenses |
|
14,720 |
|
|
|
107,863 |
|
|
|
(615 |
) |
|
|
121,968 |
|
|
|
Operating (loss) income |
|
(14,720 |
) |
|
|
30,944 |
|
|
|
638 |
|
|
|
16,862 |
|
|
|
Interest and other expense |
|
(36 |
) |
|
|
(6,007 |
) |
|
|
(1 |
) |
|
|
(6,044 |
) |
|
|
Interest and other income |
|
350 |
|
|
|
770 |
|
|
|
4 |
|
|
|
1,124 |
|
|
|
Loss on commodity derivative contracts |
|
– |
|
|
|
37,454 |
|
|
|
– |
|
|
|
37,454 |
|
|
|
Foreign exchange loss |
|
(4 |
) |
|
|
(6,497 |
) |
|
|
(22 |
) |
|
|
(6,523 |
) |
|
|
(Loss) income loss from continuing operations before income Taxes |
|
(14,410 |
) |
|
|
56,664 |
|
|
|
619 |
|
|
|
42,873 |
|
|
|
Income tax expense |
|
– |
|
|
|
(13,659 |
) |
|
|
– |
|
|
|
(13,659 |
) |
|
|
Net (loss) income from continuing operations |
$ |
(14,410 |
) |
|
$ |
43,005 |
|
|
$ |
619 |
|
|
$ |
29,214 |
|
|
|
Total assets at December 31, 2014 |
$ |
51,429 |
|
|
$ |
306,578 |
|
|
$ |
4,675 |
|
|
$ |
362,682 |
|
(2) |
|
Goodwill at December 31, 2014 |
$ |
– |
|
|
$ |
6,935 |
|
|
$ |
– |
|
|
$ |
6,935 |
|
|
|
Capital expenditures for the year ended December 31, 2014 |
$ |
545 |
|
|
$ |
109,563 |
|
|
$ |
1,393 |
|
|
$ |
111,501 |
|
|
|
|
|
|
(1) |
Excludes assets of TBNG of $25.2 million. |
|
|
(2) |
Excludes assets of TBNG and our discontinued Albanian and Moroccan operations of $85.4 million and $181.0 million at December 31, 2015 and 2014, respectively. |
13. Financial instruments
Foreign currency risk
We have underlying foreign currency exchange rate exposure. Our currency exposures primarily relate to transactions denominated in the Bulgarian Lev, European Union Euro, Albanian Lek, and TRY. We are also subject to foreign currency exposures resulting from translating the functional currency of our subsidiary financial statements into the U.S. Dollar reporting currency. We have not used foreign currency forward contracts to manage exchange rate fluctuations. At December 31, 2016, we had 30.6 million TRY (approximately $8.7 million) in cash and cash equivalents, which exposes us to exchange rate risk based on fluctuations in the value of the TRY.
Commodity price risk
We are exposed to fluctuations in commodity prices for oil and natural gas. Commodity prices are affected by many factors, including but not limited to, supply and demand. At December 31, 2016 and 2015, we were a party to commodity derivative contracts.
Concentration of credit risk
The majority of our receivables are within the oil and natural gas industry, primarily from our industry partners and from government agencies. Included in receivables are amounts due from Turkiye Petrolleri Anonim Ortakligi (“TPAO”), the national oil company of Turkey, Zorlu Dogal Gaz Ithalat Ihracat ve Toptan Ticaret A.S. (“Zorlu”), a privately owned natural gas distributor in Turkey, and TUPRAS, which purchase the majority of our oil and natural gas production. The receivables are not collateralized. To date, we have experienced minimal bad debts and have no allowance for doubtful accounts. The majority of our cash and cash equivalents are held by three financial institutions in the United States and Turkey.
Fair value measurements
Cash and cash equivalents, receivables, notes receivable, accounts payable, accrued liabilities, the Note and the Promissory Notes were each estimated to have a fair value approximating the carrying amount at December 31, 2016 and 2015 due to the short maturity of those instruments.
F-26
The financial assets and liabilities measured on a recurring basis at December 31, 2016 and 2015 consisted of our commodity derivative contracts. Fair values for options are based on counterparty market prices. The counterparties use market standard valuation methodologies incorporating market inputs for volatility and risk free interest rates in arriving at a fair value for each option contract. Prices are verified by us using analytical tools. There are no performance obligations related to the collar contracts purchased to hedge our oil production.
We utilize models based on a range of observable market inputs, including pricing models, quoted market prices of publicly traded securities with similar duration and yield, time value, yield curve, prepayment spreads, default rates and discounted cash flow and the values for these contracts are disclosed in Level 2 of the fair value hierarchy to determine the fair value of our commodity derivative contracts. We review prices received from our counterparty for unusual fluctuations to ensure that the prices represent a reasonable estimate of fair value.
At December 31, 2016, the fair value of our Term Loan and 2017 Notes were estimated using a discounted cash flow analysis based on unobservable Level 3 inputs, including our own credit risk associated with the loans payable. At December 31, 2016, the carrying value approximated the fair value for the Term Loan and 2017 Notes. The following table summarizes the valuation of our financial liabilities as of December 31, 2016:
|
|
Fair Value Measurement Classification |
|
|||||||||||||
|
|
Quoted Prices in |
|
|
|
|
|
|
|
|
|
|
|
|
|
|
|
|
Active Markets for |
|
|
|
|
|
|
|
|
|
|
|
|
|
|
|
|
Identical Assets or |
|
|
Significant Other |
|
|
Significant |
|
|
|
|
|
|||
|
|
Liabilities |
|
|
Observable Inputs |
|
|
Unobservable Inputs |
|
|
|
|
|
|||
|
|
(Level 1) |
|
|
(Level 2) |
|
|
(Level 3) |
|
|
Total |
|
||||
|
|
(in thousands) |
|
|||||||||||||
|
Measured on a recurring basis |
|
|
|
|
|
|
|
|
|
|
|
|
|
|
|
|
Liabilities: |
|
|
|
|
|
|
|
|
|
|
|
|
|
|
|
|
Commodity derivative contracts |
$ |
– |
|
|
$ |
(838 |
) |
|
$ |
– |
|
|
$ |
(838 |
) |
|
Disclosed but not carried at fair value |
|
|
|
|
|
|
|
|
|
|
|
|
|
|
|
|
Liabilities: |
|
|
|
|
|
|
|
|
|
|
|
|
|
|
|
|
Term Loan |
|
– |
|
|
|
– |
|
|
|
(22,500 |
) |
|
|
(22,500 |
) |
|
2017 Notes |
|
– |
|
|
|
– |
|
|
|
(13,554 |
) |
|
|
(13,554 |
) |
|
Total |
$ |
– |
|
|
$ |
(838 |
) |
|
$ |
(36,054 |
) |
|
$ |
(36,892 |
) |
The following table summarizes the valuation of our financial assets and liabilities as of December 31, 2015:
|
|
Fair Value Measurement Classification |
|
|||||||||||||
|
|
Quoted Prices in |
|
|
|
|
|
|
|
|
|
|
|
|
|
|
|
|
Active Markets for |
|
|
|
|
|
|
|
|
|
|
|
|
|
|
|
|
Identical Assets or |
|
|
Significant Other |
|
|
Significant |
|
|
|
|
|
|||
|
|
Liabilities |
|
|
Observable Inputs |
|
|
Unobservable Inputs |
|
|
|
|
|
|||
|
|
(Level 1) |
|
|
(Level 2) |
|
|
(Level 3) |
|
|
Total |
|
||||
|
|
(in thousands) |
|
|||||||||||||
|
Measured on a recurring basis |
|
|
|
|
|
|
|
|
|
|
|
|
|
|
|
|
Assets: |
|
|
|
|
|
|
|
|
|
|
|
|
|
|
|
|
Commodity derivative contracts |
$ |
– |
|
|
$ |
6,605 |
|
|
$ |
– |
|
|
$ |
6,605 |
|
|
Disclosed but not carried at fair value |
|
|
|
|
|
|
|
|
|
|
|
|
|
|
|
|
Liabilities: |
|
|
|
|
|
|
|
|
|
|
|
|
|
|
|
|
Senior Credit Facility |
|
– |
|
|
|
– |
|
|
|
(30,050 |
) |
|
|
(30,050 |
) |
|
2017 Notes |
|
– |
|
|
|
– |
|
|
|
(44,489 |
) |
|
|
(44,489 |
) |
|
Total |
$ |
– |
|
|
$ |
6,605 |
|
|
$ |
(74,539 |
) |
|
$ |
(67,934 |
) |
F-27
Our aggregate annual commitments, other than our loans payable, as of December 31, 2016 were as follows:
|
|
|
Payments Due By Year |
|
|||||||||||||||||||||||||
|
|
|
Total |
|
|
2017 |
|
|
2018 |
|
|
2019 |
|
|
2020 |
|
|
2021 |
|
|
Thereafter |
|
|||||||
|
|
|
(in thousands) |
|
|||||||||||||||||||||||||
|
Series A Preferred Shares dividends (1) |
|
$ |
43,348 |
|
|
$ |
5,526 |
|
|
$ |
5,526 |
|
|
$ |
5,526 |
|
|
$ |
5,526 |
|
|
$ |
5,526 |
|
|
$ |
15,718 |
|
|
Interest |
|
|
2,962 |
|
|
|
2,874 |
|
|
|
88 |
|
|
|
- |
|
|
|
- |
|
|
|
- |
|
|
|
- |
|
|
Leases |
|
|
1,370 |
|
|
|
698 |
|
|
|
603 |
|
|
|
69 |
|
|
|
- |
|
|
|
- |
|
|
|
- |
|
|
Total |
|
$ |
47,680 |
|
|
$ |
9,098 |
|
|
$ |
6,217 |
|
|
$ |
5,595 |
|
|
$ |
5,526 |
|
|
$ |
5,526 |
|
|
$ |
15,718 |
|
|
|
(1) |
Dividends on the Series A Preferred Shares may be paid by the Company, in its sole discretion, in cash at a rate of 12% per annum or in common shares at a rate of 16% per annum or in a combination of cash and common shares. The amounts in the table assume that the Company pays all future dividend payments solely in cash. |
Normal operations purchase arrangements are excluded from the table as they are discretionary or being performed under contracts which are cancelable immediately or with a 30-day notice period.
We lease office space in Dallas, Texas, Bulgaria, and Turkey. We also lease apartments in Turkey, as well as operations yards in Turkey. Rent expense for the years ended December 31, 2016, 2015 and 2014 was $1.4 million, $1.8 million and $2.2 million, respectively.
15. Contingencies
Contingencies relating to production leases and exploration permits
Selmo
We are involved in litigation with persons who claim ownership of a portion of the surface at the Selmo oil field in Turkey. These cases are being vigorously defended by TEMI and Turkish governmental authorities. We do not have enough information to estimate the potential additional operating costs we would incur in the event the purported surface owners’ claims are ultimately successful. Any adjustment arising out of the claims will be recorded when it becomes probable and measurable.
Morocco
During 2012, we were notified that the Moroccan government may seek to recover approximately $5.5 million in contractual obligations under our Tselfat exploration permit work program. In February 2013, the Moroccan government drew down our $1.0 million bank guarantee that was put in place to ensure our performance of the Tselfat exploration permit work program. Although we believe that the bank guarantee satisfies our contractual obligations, we recorded $5.0 million in accrued liabilities relating to our Tselfat exploration permit during 2012 for this contingency. In September 2016, management determined that, because it had received no communication from the Moroccan government since early 2013, the probability of payment of this contingency is remote, and therefore the Company reversed the $6.0 million in contingent liabilities previously classified as liabilities held for sale.
Bulgaria
During 2012, we were notified that the Bulgarian government may seek to recover approximately $2.0 million in contractual obligations under our Aglen exploration permit work program. Due to the Bulgarian government’s January 2012 ban on fracture stimulation and related activities, a force majeure event under the terms of the exploration permit was recognized by the government. Although we invoked force majeure, we recorded $2.0 million in general and administrative expense relating to our Aglen exploration permit during 2012 for this contractual obligation.
In October 2015, the Bulgarian Ministry of Energy and Economy filed a suit against our subsidiary, Direct Petroleum Bulgaria EOOD (“Direct Bulgaria”), claiming a $200,000 penalty for Direct Bulgaria’s alleged failure to fulfill the work program associated with the Aglen exploration permit. Direct Bulgaria received a force majeure recognition in 2012 from the Bulgarian Ministry of Energy and Economy, and the force majeure event has not been rectified. We believe that Direct Bulgaria is not under any obligation to fulfill the work program until the force majeure event is rectified, and continue to vigorously defend this claim.
F-28
16. Related party transactions
Series A Preferred Shares transactions
On November 4, 2016, we issued 921,000 Series A Preferred Shares. Of the 921,000 Series A Preferred Shares, (i) 815,000 shares were issued in exchange for $40.75 million of our 2017 Notes, at an exchange rate of 20 Series A Preferred Shares for each $1,000 principal amount of 2017 Notes (the “Exchange Offer”), and (ii) 106,000 shares were issued and sold for $5.3 million of cash to certain holders of the 2017 Notes (the “Offering”). In the Exchange Offer, Pinon Foundation, a non-profit charitable organization directed by Mr. Mitchell’s spouse exchanged $10.0 million of the 2017 Notes for 200,000 Series A Preferred Shares; Dalea Partners, LP (“Dalea”), an affiliate of Mr. Mitchell, exchanged $2.1 million of the 2017 Notes for 41,000 Series A Preferred Shares; and trusts benefitting Mr. Mitchell’s four adult children each exchanged $2.0 million of the 2017 Notes for 40,000 Series A Preferred Shares. In the Offering, the Pinon Foundation purchased 5,000 Series A Preferred Shares for $250,000; and each of Mr. Mitchell’s four adult children purchased 1,000 Series A Preferred Shares for $50,000. For more information see Note 5, “Series A Preferred Shares”.
Equity transactions
On December 31, 2014, the Company issued 134,169 Warrants to Mr. Mitchell and 23,333 common share purchase warrants to each of Mr. Mitchell’s children pursuant to warrant agreements. These Warrants were issued to Mr. Mitchell and his children as shareholders of Gundem, which agreed to pledge Turkish real estate in exchange for an extension of the maturity date of a credit agreement between us and a Turkish bank. As consideration for the pledge of Turkish real estate, the independent members of our board of directors approved the issuance of the Warrants to be allocated in accordance with each shareholder’s ownership percentage of Gundem. Pursuant to the warrant agreements, the Warrants are immediately exercisable, expire on January 6, 2018, and entitle the holder to purchase one common share for each Warrant at an exercise price of $5.99 per share.
On each of April 24, 2015 and August 13, 2015, we issued 233,333 Warrants to Mr. Mitchell and certain other related parties as shareholders of Gundem, as consideration for the pledge of Turkish real estate in exchange for an extension of the maturity of a credit agreement between TBNG and a Turkish bank. As consideration for the pledge of Turkish real estate, the independent members of our board of directors approved the issuance of the Warrants to be allocated in accordance with each shareholder’s ownership percentage of Gundem. The Warrants were issued pursuant to a warrant agreement, whereby the Warrants are immediately exercisable, expire on January 6, 2018, and entitle the holder to purchase one common share for each Warrant. The Warrants issued in April 2015 and August 2015 an exercise price of $5.65 and $2.99 per share, respectively. For the year ended December 31, 2015, we incurred $0.5 million of compensation expense for these Warrants. The fair value of the Warrants was determined using the Black-Scholes Model.
On June 30, 2016, we issued an aggregate of 5,773,305 common shares in private placements under the Securities Act. Of the 5,773,305 common shares, (i) 1,974,452 common shares were issued to Dalea, the trusts of Mr. Mitchell’s four adult children and Pinon Foundation, at their election to receive common shares in lieu of cash interest on the 2017 Notes; (ii) 355,826 common shares were issued to ANBE in lieu of cash interest on the Note and (iii) 814,627 common shares were issued to Dalea and the trusts of Mr. Mitchell’s four adult children for cash, which was used to pay cash interest to certain holders of the 2017 Notes (see Note 10, “Shareholders’ equity”).
Dalea Amended Note and Pledge Agreement
On April 19, 2016, we entered into a note amendment agreement (the “Note Amendment Agreement”) with Mr. Mitchell, and Dalea, pursuant to which Dalea agreed to deliver an amended and restated promissory note (the “Amended Note”) in favor of us, in the principal sum of $7,964,053, which Amended Note would amend and restate that certain promissory note, dated June 13, 2012, made by Dalea in favor of us in the principal amount of $11.5 million (the “Original Note”). The Note Amendment Agreement reduced the principal amount of the Original Note to $8.0 million in exchange for the cancellation of an account payable of approximately $3.5 million (the “Account Payable”) owed by TransAtlantic Albania Ltd. (“TransAtlantic Albania”), a former subsidiary of the Company, to Viking International Limited (“Viking International”). We have indemnified a third party for any liability relating to the payment of the Account Payable.
F-29
Pursuant to the Note Amendment Agreement, on April 19, 2016, we entered into the Amended Note, which amended and restated the Original Note that was issued in connection with our sale of our former subsidiaries, Viking International and Viking Geophysical Services Ltd., (“Viking Geophysical”) to a joint venture owned by Dalea and Abraaj Investment Management Limited in June 2012. In the Amended Note, we and Dalea acknowledged that (i) while the sale of Dalea’s interest in Viking Services B.V., the beneficial owner of Viking International, VOS and Viking Geophysical (“Viking Services”) enabled us to take the position that the Original Note was accelerated in accordance with its terms, the principal purpose of including the acceleration events in the Original Note was to ensure that certain oilfield services provided by Viking Services to us would continue to be available to us, and (ii) such services will now be provided pursuant to the master services agreement between Production Solutions International Petrol Arama Hizmetleri Anonim Sirketi (“PSIL”) and the Company (the “PSIL MSA”). PSIL is beneficially owned by Dalea Investment Group, LLC, which is controlled by Mr. Mitchell. As a result, the Amended Note revised the events triggering acceleration of the repayment of the Original Note to the following: (i) a reduction of ownership by Dalea (and other controlled affiliates of Mr. Mitchell) of equity interest in PSIL to less than 50%; (ii) the sale or transfer by Dalea or PSIL of all or substantially all of its assets to any person (a “Transferee”) that does not own a controlling interest in Dalea or PSIL and is not controlled by Mr. Mitchell (an “Unrelated Person”), or the subsequent transfer by any Transferee that is not an Unrelated Person of all or substantially all of its assets to an Unrelated Person; (iii) the acquisition by an Unrelated Person of more than 50% of the voting interests of Dalea or PSIL; (iv) termination of the PSIL MSA other than as a result of an uncured default thereunder by TEMI; (v) default by PSIL under the PSIL MSA, which default is not remedied within a period of 30 days after notice thereof to PSIL; and (vi) insolvency or bankruptcy of PSIL. The maturity date of the Amended Note was extended to June 13, 2019. The interest rate on the Amended Note remains at 3.0% per annum and continues to be guaranteed by Mr. Mitchell. The Amended Note contains customary events of default.
In addition, pursuant to the Note Amendment Agreement, on April 19, 2016, we entered into a pledge agreement (the “Pledge Agreement”) with Dalea, whereby Dalea pledged the $2.0 million principal amount of the 2017 Notes owned by Dalea (the “Dalea Convertible Notes”), including any future securities for which the Dalea Convertible Notes are converted or exchanged, as security for the performance of Dalea’s obligations under the Amended Note. The Pledge Agreement provides that interest payable to Dalea under the Dalea Convertible Notes (or any future securities for which the Dalea Convertible Notes are converted or exchanged) will be credited first against the outstanding principal balance of the Amended Note and, upon full repayment of the outstanding principal balance of the Amended Note, any accrued and unpaid interest on the Amended Note. The Pledge Agreement contains customary events of default. On November 4, 2016, Dalea exchanged $2.0 million of the 2017 Notes for 40,000 Series A Preferred Shares.
On June 30, 2016, we entered into a waiver with Dalea, whereby we waived our right under the Pledge Agreement to receive the interest payment due July 1, 2016 under the Dalea Convertible Notes in connection with the payment of 201,459 common shares to Dalea with respect to the 2017 Note interest payment paid on June 30, 2016. As of December 31, 2016, the amount receivable under the Amended Note was $7.6 million.
Pledge fee agreements
In connection with the pledge of the Gundem real estate and Muratli real estate to DenizBank as collateral for the Term Loan, on August 31, 2016, the Company entered into a pledge fee agreement with Gundem (the “Gundem Fee Agreement”) pursuant to which the Company will pay Gundem a fee equal to 5% per annum of the collateral value of the Gundem real estate and Muratli real estate. Pursuant to the Gundem Fee Agreement, the Gundem real estate has a deemed collateral value of $10.0 million and the Muratli real estate has a deemed collateral value of $5.0 million.
In connection with the pledge of the Diyarbakir real estate to DenizBank as collateral for the Term Loan, on August 31, 2016, the Company entered into a pledge fee agreement with Messrs. Mitchell and Uras (the “Diyarbakir Fee Agreement”) pursuant to which the Company will pay Messrs. Mitchell and Uras a fee of 5% per annum of the collateral value of the Diyarbakir real estate. Pursuant to the Diyarbakir Fee Agreement, the Diyarbakir real estate has a deemed collateral value of $5.0 million.
Amounts payable to Mr. Mitchell under the Gundem Fee Agreement and the Diyarbakir Fee Agreement will be used to reduce the outstanding principal amount of the Amended Note. During the year ended December 31, 2016, we reduced the principal amount of the Amended Note by $0.2 million for amounts earned under the pledge fee agreements.
Service transactions
Effective May 1, 2008, we entered into a service agreement, as amended (the “Service Agreement”), with Longfellow Energy, LP (“Longfellow”), Viking Drilling LLC (“Viking Drilling”), MedOil Supply, LLC and Riata Management, LLC (“Riata Management”). Mr. Mitchell and his wife own 100% of Riata Management. In addition, Mr. Mitchell, his wife and his children indirectly own 100% of Longfellow. Riata Management owns 100% of MedOil Supply, LLC. Dalea owns 85% of Viking Drilling. Under the terms of the Service Agreement, we pay, or are paid, for the actual cost of the services rendered plus the actual cost of reasonable expenses on a monthly basis.
F-30
Effective January 1, 2011, our wholly owned subsidiary, TEMI, entered into an accommodation agreement under which it leased rooms, flats and office space at a facility owned by Gundem. Under the accommodation agreement, TEMI leases six rooms and pays the TRY equivalent of $6,000 per month.
On August 23, 2011, the Company’s wholly owned subsidiary, TransAtlantic USA, entered into an office lease with Longfellow to lease approximately 5,300 square feet of corporate office space in Addison, Texas. The initial lease term under the lease commenced on July 1, 2013, the date that TransAtlantic USA subleased a portion of its previous office space in Dallas, Texas (the “Commencement Date”). The lease expires five years after the Commencement Date, unless earlier terminated in accordance with the lease. During the initial lease term, TransAtlantic USA will pay monthly rent of $6,625 to Longfellow, plus utilities, real property taxes and liability insurance.
On June 13, 2012, we entered into separate master services agreements with each of Viking International, Viking Petrol Sahasi Hizmetleri AS (“VOS”) and Viking Geophysical in connection with the sale of our oilfield services business to a joint venture owned by Dalea and funds managed by Abraaj Investment Management Limited. Pursuant to the master services agreements with Viking International and VOS, we are entitled to receive certain oilfield services and materials, including, but not limited to, drilling rigs and fracture stimulation that are needed for our operations in Bulgaria and Turkey. Pursuant to the master services agreement with Viking Geophysical, we are also entitled to receive geophysical services and materials that are needed for our operations in those countries. Each master services agreement is for a five-year term. Currently, we can contract for services and materials on a firm basis and, to the extent that we do not contract for all of their services or materials, Viking International, VOS and Viking Geophysical are allowed to contract with third parties for any remaining capacity.
On March 3, 2016, Mr. Mitchell closed a transaction whereby he sold his interest in Viking Services to a third party. As part of the transaction, Mr. Mitchell acquired certain equipment used in the performance of stimulation, wireline, workover and similar services, which equipment is owned and operated by PSIL. PSIL is beneficially owned by Dalea Investment Group, LLC, which is controlled by Mr. Mitchell. Consequently, on March 3, 2016, we entered into the PSIL MSA on substantially similar terms to our prior master services agreements with Viking International, VOS and VGS. Pursuant to the PSIL MSA, PSIL will perform services on behalf of TEMI and its affiliates. The master services agreements with each of Viking International, VOS and Viking Geophysical will remain in effect through the remainder of the five-year term of the agreements.
On April 5, 2013 (the “First Floor Commencement Date”), TransAtlantic USA entered into an office lease with Longfellow to lease approximately 4,700 square feet of additional corporate office space in Addison, Texas. The initial lease term commenced on the First Floor Commencement Date and expires five years after the First Floor Commencement Date, unless earlier terminated in accordance with the lease. TransAtlantic USA pays monthly rent of $8,120 to Longfellow plus utilities, real property taxes and liability insurance.
For the years ended December 31, 2016 and 2015, we incurred capital and operating expenditures of $7.0 million and $20.0 million, respectively, related to our various related party agreements.
Debt transactions
Between December 2014 and February 2015, we sold $55.0 million of convertible notes in a non-brokered private placement, which were exchanged for the 2017 Notes on February 20, 2015. Dalea purchased $2.0 million of the notes; trusts benefitting Mr. Mitchell’s four children each purchased $2.0 million of the notes; Pinon Foundation, purchased $10.0 million of the notes; the three children of Brian Bailey, a director of the Company, each purchased $100,000 of the notes; and a trust benefitting Barbara and Terry Pope, Mr. Mitchell’s sister-in-law and brother-in-law, purchased $200,000 of the notes.
ANBE Promissory Note
On December 30, 2015, TransAtlantic USA entered into the $5.0 million Note with ANBE, an entity owned by the children of the Company’s chairman and chief executive officer, N. Malone Mitchell, 3rd, and controlled by an entity managed by Mr. Mitchell and his wife. The Note bears interest at a rate of 13.0% per annum. On December 30, 2015, the Company borrowed the Initial Advance of $3.6 million for general corporate purposes. On June 30, 2016, the Company issued 355,826 common shares in a private placement to ANBE in lieu of paying cash interest on the Note.
On October 31, 2016, TransAtlantic USA entered into an amendment of the Note with ANBE (the “ANBE Amendment”). The ANBE Amendment extended the maturity date of the Note from October 31, 2016 to September 30, 2017, provided for the Note to be repaid in four quarterly installments of $0.9 million each in December 2016 and March, June and September 2017, and provided for monthly payments of interest. In addition, pursuant to the ANBE Amendment, if the sale of TBNG is completed prior to the extended maturity date of the Note, then the Company will repay the Note in full with proceeds from the sale of TBNG within five business days from the closing of the sale. As of December 31, 2016, the Company had borrowed $2.7 million under the Note and had no availability (See Note 18, “Subsequent Events”).
F-31
The following table summarizes related party accounts receivable and accounts payable as of December 31, 2016 and December 31, 2015:
|
|
2016 |
|
|
2015 |
|
||
|
|
(in thousands) |
|
|||||
|
Related party accounts receivable: |
|
|
|
|
|
|
|
|
Riata Management Service Agreement |
$ |
528 |
|
|
$ |
194 |
|
|
PSIL MSA |
|
234 |
|
|
|
– |
|
|
Viking International master services agreement |
|
– |
|
|
|
214 |
|
|
Total related party accounts receivable |
$ |
762 |
|
|
$ |
408 |
|
|
Related party accounts payable: |
|
|
|
|
|
|
|
|
Riata Management Service Agreement |
$ |
346 |
|
|
$ |
384 |
|
|
PSIL MSA |
|
1,315 |
|
|
|
– |
|
|
Interest payable on 2017 Notes |
|
183 |
|
|
|
– |
|
|
Viking International master services agreement |
|
– |
|
|
|
2,169 |
|
|
Total related party accounts payable |
$ |
1,844 |
|
|
$ |
2,553 |
|
17. Assets and liabilities held for sale and discontinued operations
TBNG assets and liabilities held for sale
On October 13, 2016, we entered into a share purchase agreement (the “Purchase Agreement”) with Valeura Energy Netherlands B.V. (“Valeura”) for the sale of all of the equity interests in TBNG, our wholly-owned subsidiary. TBNG owns a portion of the Company’s interests in the Thrace Basin area in Turkey.
The sale of TBNG resulted in the classification of the assets and liabilities of TBNG to the caption “Assets held for sale” and “Liabilities held for sale” for the periods ending December 31, 2016 and 2015. Although the sale of TBNG met the threshold to classify its assets and liabilities as held for sale, it didn’t meet the requirements to classify its operations as discontinued as the sale wasn’t considered a strategic shift in the Company’s operations. As such, TBNG’s results of operations are classified as continuing operations for all periods presented (See Note 18, “Subsequent Events”).
Discontinued operations in Albania
As of December 31, 2015 we classified our Albania segment as assets and liabilities held for sale and presented the operating results within discontinued operations for all periods presented.
In February 2016, we sold all of the outstanding equity in Stream to GBC Oil Company Ltd. (“GBC Oil”) in exchange for (i) the future payment of $2.3 million to Raiffeisen Bank Sh.A. (“Raiffeisen”) to pay down a Term Loan Facility dated as of September 17, 2014 (the “Term Loan Facility”) between TransAtlantic Albania and Raiffeisen, and (ii) the assumption of $29.2 million of liabilities owed by Stream, consisting of $23.1 million of accounts payable and accrued liabilities and $6.1 million of debt. We believe that GBC Oil has failed to pay the amounts required under the purchase agreement, and we are evaluating our legal remedies to enforce the provisions of the purchase agreement. TransAtlantic Albania owns all of our former Albanian assets and operations. In addition, GBC Oil issued us a warrant pursuant to which we have the option to acquire up to 25% of the fully diluted equity interests in TransAtlantic Albania for nominal consideration at any time on or before March 1, 2019. In February 2016, we valued the warrant from GBC Oil at approximately $1.6 million. At December 31, 2016, we reduced the value of the warrant to zero due to GBC Oil’s failure to comply with its obligations under the purchase agreement. We recognized this loss under the caption “Exploration, abandonment and impairment” on our consolidated statement of comprehensive (loss) income for the year ended December 31, 2016.
On September 1, 2016, the Company completed a joint venture transaction with respect to the assets in the Delvina gas field in Albania (the “Delvina Assets”). The Company transferred (the “Transfer”) 75% of the outstanding shares of Delvina Gas Company Ltd. (“DelvinaCo”), which owns the Delvina Assets, to Ionian Gas Company Ltd. (“Ionian”) in exchange for Ionian’s agreement to pay $12.0 million to DelvinaCo, which will be used primarily to repay debt and for general corporate purposes with respect to the Delvina Assets. These payments will be made each quarter over an 18-month period, with the first payment of $1.0 million to be completed by November 2016. As a result of this transaction, we have recorded a gain on disposal of discontinued operations of $9.4 million during the year ended December 31, 2016.
F-32
After the Transfer, the Company retained a 25% equity interest in DelvinaCo and has agreed to pay 25% of the operating costs of DelvinaCo, subject to a three-year deferral of capital expenditures. For the next three years, Ionian will be responsible for all agreed upon capital expenditures with respect to the Delvina Assets. At the end of the three-year period, the Company will be required to either reimburse Ionian for its 25% share of such capital expenditures or face dilution in its ownership of DelvinaCo. As of December 31, 2016, we no longer hold our 25% interest in DelvinaCo as assets held for sale, and have consolidated our interest using proportionate consolidation.
An impairment charge of $73.0 million was recorded to write down the net book value of the assets held for sale to their fair value as of December 31, 2015. The assumptions used in our assessment of fair value included the transaction discussed above with GBC Oil.
Discontinued operations in Morocco
On June 27, 2011, we decided to discontinue our operations in Morocco. We have substantially completed the process of winding down our operations in Morocco. We have presented the Moroccan segment operating results as discontinued operations for all periods presented.
Assets and liabilities held for sale
The assets and liabilities held for sale at December 31, 2016 and 2015 are as shown below. As a result of the joint venture transaction related to the Delvina Assets and the reassessment of the Moroccan contingent liabilities, there were no remaining assets or liabilities held for sale at December 31, 2016 for Albania or Morocco.
|
|
TBNG |
|
|
Albania |
|
|
Morocco |
|
|
Total Held for Sale |
|
||||
|
|
|
|
|
|
(in thousands) |
|
|||||||||
|
For the year ended December 31, 2016 |
|
|
|
|
|
|
|
|
|
|
|
|
|
|
|
|
Assets |
|
|
|
|
|
|
|
|
|
|
|
|
|
|
|
|
Cash |
$ |
1,551 |
|
|
$ |
– |
|
|
$ |
– |
|
|
$ |
1,551 |
|
|
Other current assets |
|
7,511 |
|
|
|
– |
|
|
|
– |
|
|
|
7,511 |
|
|
Property and equipment, net |
|
16,155 |
|
|
|
– |
|
|
|
– |
|
|
|
16,155 |
|
|
Total current assets held for sale |
$ |
25,217 |
|
|
$ |
– |
|
|
$ |
– |
|
|
$ |
25,217 |
|
|
|
|
|
|
|
|
|
|
|
|
|
|
|
|
|
|
|
Liabilities |
|
|
|
|
|
|
|
|
|
|
|
|
|
|
|
|
Accounts payable and other accrued liabilities |
$ |
11,240 |
|
|
$ |
– |
|
|
$ |
– |
|
|
$ |
11,240 |
|
|
Deferred tax liability |
|
4,698 |
|
|
|
– |
|
|
|
– |
|
|
|
4,698 |
|
|
Total current liabilities held for sale |
$ |
15,938 |
|
|
$ |
– |
|
|
$ |
– |
|
|
$ |
15,938 |
|
|
|
|
|
|
|
|
|
|
|
|
|
|
|
|
|
|
|
For the year ended December 31, 2015 |
|
|
|
|
|
|
|
|
|
|
|
|
|
|
|
|
Assets |
|
|
|
|
|
|
|
|
|
|
|
|
|
|
|
|
Cash |
$ |
1,780 |
|
|
$ |
1,201 |
|
|
$ |
16 |
|
|
$ |
2,997 |
|
|
Other current assets |
|
7,956 |
|
|
|
1,853 |
|
|
|
11 |
|
|
|
9,820 |
|
|
Property and equipment, net |
|
– |
|
|
|
48,430 |
|
|
|
– |
|
|
|
48,430 |
|
|
Total current assets held for sale |
|
9,736 |
|
|
|
51,484 |
|
|
|
27 |
|
|
|
61,247 |
|
|
Property and equipment, net |
|
22,292 |
|
|
|
– |
|
|
|
– |
|
|
|
22,292 |
|
|
Other long-term assets |
|
1,900 |
|
|
|
– |
|
|
|
– |
|
|
|
1,900 |
|
|
Total assets held for sale |
$ |
33,928 |
|
|
$ |
51,484 |
|
|
$ |
27 |
|
|
$ |
85,439 |
|
|
|
|
|
|
|
|
|
|
|
|
|
|
|
|
|
|
|
Liabilities |
|
|
|
|
|
|
|
|
|
|
|
|
|
|
|
|
Accounts payable and other accrued liabilities |
$ |
8,733 |
|
|
$ |
37,888 |
|
|
$ |
6,352 |
|
|
$ |
52,973 |
|
|
Accounts payable - related party |
|
131 |
|
|
|
3,540 |
|
|
|
– |
|
|
|
3,671 |
|
|
Loan payable |
|
5,132 |
|
|
|
6,123 |
|
|
|
– |
|
|
|
11,255 |
|
|
Deferred tax liability |
|
– |
|
|
|
15,286 |
|
|
|
– |
|
|
|
15,286 |
|
|
Total current liabilities held for sale |
$ |
13,996 |
|
|
$ |
62,837 |
|
|
$ |
6,352 |
|
|
$ |
83,185 |
|
|
Deferred tax liability |
|
4,757 |
|
|
|
– |
|
|
|
– |
|
|
|
4,757 |
|
|
Other long-term liabilities |
|
4,748 |
|
|
|
– |
|
|
|
– |
|
|
|
4,748 |
|
|
Total liabilities held for sale |
$ |
23,501 |
|
|
$ |
62,837 |
|
|
$ |
6,352 |
|
|
$ |
92,690 |
|
F-33
As of December 31, 2015, our third-party debt held for sale consisted of the following:
|
|
December 31, |
|
|
|
|
2015 |
|
|
|
|
(in thousands) |
|
|
|
Fixed and floating rate loans |
|
|
|
|
Term Loan Facility |
$ |
6,123 |
|
|
TBNG credit facility |
|
5,192 |
|
|
Unamortized deferred financing costs - TBNG credit facility |
|
(60 |
) |
|
Loan payable |
$ |
11,255 |
|
TransAtlantic Albania was a party to the Term Loan Facility with Raiffeisen. The loan was scheduled to mature on December 31, 2016 and bore interest at the rate of LIBOR plus 5.5%, with a minimum interest rate of 7.0%. TransAtlantic Albania was required to pay 1/16th of the total commitment each quarter on the last business day of each of March, June, September and December each year. The loan was guaranteed by TransAtlantic Albania’s parent company, Stream. TransAtlantic Albania could prepay the loan at its option in whole or in part, subject to a 3.0% penalty plus breakage costs. The Term Loan Facility was secured by substantially all of the assets of TransAtlantic Albania.
As of December 31, 2015, TransAtlantic Albania had $6.1 million outstanding under the Term Loan Facility and no availability. As of December 31, 2015, TransAtlantic Albania was in default under the Term Loan Facility for failure to repay $1.1 million due on December 31, 2015. On February 29, 2016, we sold all the equity interest in Stream, the parent company of TransAtlantic Albania, to GBC Oil, who assumed the Term Loan Facility.
TBNG had a fully-drawn credit facility with a Turkish bank. The facility was secured by a lien on a Turkish real estate property owned by Gundem, which is 97.5% beneficially owned by Mr. Mitchell and his children. At December 31, 2015, TBNG had a balance of $5.2 million under the credit facility and no availability. In August 2016, TBNG repaid the credit facility in full and terminated it.
Our operating results from discontinued operations for the years ended December 31, 2016, 2015 and 2014 are summarized as follows:
|
|
Albania |
|
|
Morocco |
|
|
Total |
|
|||
|
|
(in thousands) |
|
|||||||||
|
For the year ended December 31, 2016 |
|
|
|
|
|
|
|
|
|
|
|
|
Total revenues |
$ |
626 |
|
|
$ |
- |
|
|
$ |
626 |
|
|
Production and transportation expense |
|
1,138 |
|
|
|
- |
|
|
|
1,138 |
|
|
Total other costs and expenses |
|
561 |
|
|
|
- |
|
|
|
561 |
|
|
Total other income |
|
10,168 |
|
|
|
6,903 |
|
|
|
17,071 |
|
|
Income before income taxes |
$ |
9,095 |
|
|
$ |
6,903 |
|
|
$ |
15,998 |
|
|
Income tax benefit |
|
204 |
|
|
|
- |
|
|
|
204 |
|
|
Income from discontinued operations |
$ |
9,299 |
|
|
$ |
6,903 |
|
|
$ |
16,202 |
|
|
For the year ended December 31, 2015 |
|
|
|
|
|
|
|
|
|
|
|
|
Total revenues |
$ |
8,565 |
|
|
$ |
- |
|
|
$ |
8,565 |
|
|
Production and transportation expense |
|
11,615 |
|
|
|
- |
|
|
|
11,615 |
|
|
Exploration, abandonment and impairment |
|
86,577 |
|
|
|
- |
|
|
|
86,577 |
|
|
Total other costs and expenses |
|
9,229 |
|
|
|
5 |
|
|
|
9,234 |
|
|
Total other income |
|
1,819 |
|
|
|
- |
|
|
|
1,819 |
|
|
Loss before income taxes |
$ |
(97,037 |
) |
|
$ |
(5 |
) |
|
$ |
(97,042 |
) |
|
Income tax benefit |
|
16,169 |
|
|
|
- |
|
|
|
16,169 |
|
|
Loss from discontinued operations |
$ |
(80,868 |
) |
|
$ |
(5 |
) |
|
$ |
(80,873 |
) |
|
For the year ended December 31, 2014 |
|
|
|
|
|
|
|
|
|
|
|
|
Total revenues |
$ |
1,898 |
|
|
$ |
- |
|
|
$ |
1,898 |
|
|
Total costs and expenses |
|
2,984 |
|
|
|
20 |
|
|
|
3,004 |
|
|
Total other income |
|
356 |
|
|
|
- |
|
|
|
356 |
|
|
Loss before income taxes |
$ |
(730 |
) |
|
$ |
(20 |
) |
|
$ |
(750 |
) |
|
Income tax benefit |
|
612 |
|
|
|
- |
|
|
|
612 |
|
|
Loss from discontinued operations |
$ |
(118 |
) |
|
$ |
(20 |
) |
|
$ |
(138 |
) |
F-34
18. Subsequent events
Optional redemption of 2017 Notes
On January 1, 2017 (the “Redemption Date”), we redeemed $4.3 million in aggregate principal amount of 2017 Notes at a cash redemption price equal to 100% of the principal amount thereof plus accrued and unpaid interest thereon to the Redemption Date. After the optional redemption, we had $10.0 million of 2017 Notes outstanding.
TBNG Sale
On February 24, 2017, we sold TBNG for gross proceeds of $20.9 million, and approximate net cash proceeds of $16.3 million, effective as of March 31, 2016. The purchase price is subject to post-closing adjustments, and we agreed to escrow $3.1 million of the purchase price for 30 days to satisfy any agreed upon purchase price adjustments.
We used $2.7 million of the net proceeds from the sale to pay off our Note with ANBE pursuant to the terms of the ANBE Amendment.
Amendment to Master Services Agreement
On March 20, 2017, the Company entered into a second amendment to the Master Services Agreement among the Company and Longfellow Energy, LP, a Texas limited partnership, Viking Drilling, LLC, a Nevada limited liability company, RIATA Management, LLC, an Oklahoma limited liability company, Longfellow Nemaha, LLC, a Texas limited liability company, Red Rock Minerals, LP, a Delaware limited partnership, Red Rock Advisors, LLC, a Texas limited liability company, Production Solutions International Limited , a Bermuda exempted company, and Nexlube Operating, LLC, a Delaware limited liability company, and their subsidiaries (collectively, the "Riata Entities"), adding and removing certain of the Riata Entities and expanding the scope of services. As this agreement is a related party transaction, the independent members of the Board of Directors reviewed and approved this amendment.
F-35
Supplemental Information
(unaudited)
Supplemental quarterly financial data (unaudited)
The following table summarizes results for each of the four quarters in the years ended December 31, 2016 and 2015.
|
|
Three Months Ended (1) |
|
|||||||||||||
|
|
March 31, |
|
|
June 30, |
|
|
September 30, |
|
|
December 31, |
|
||||
|
|
(in thousands, except per share data) |
|
|||||||||||||
|
For the year ended December 31, 2016: |
|
|
|
|
|
|
|
|
|
|
|
|
|
|
|
|
Revenues |
$ |
15,566 |
|
|
$ |
17,698 |
|
|
$ |
16,659 |
|
|
$ |
18,672 |
|
|
Net loss from continuing operations |
|
(5,566 |
) |
|
|
(6,544 |
) |
|
|
(4,636 |
) |
|
|
(5,699 |
) |
|
Net income (loss) from discontinued operations |
|
15 |
|
|
|
(118 |
) |
|
|
16,305 |
|
|
|
- |
|
|
Net (loss) income |
|
(5,551 |
) |
|
|
(6,662 |
) |
|
|
11,669 |
|
|
|
(5,699 |
) |
|
Comprehensive (loss) income |
|
(2,577 |
) |
|
|
(8,927 |
) |
|
|
7,683 |
|
|
|
(21,148 |
) |
|
Basic and diluted net (loss) income per common share from continuing operations |
$ |
(0.14 |
) |
|
$ |
(0.16 |
) |
|
$ |
(0.10 |
) |
|
$ |
(0.12 |
) |
|
Basic and diluted net (loss) income per common share from discontinuing operations |
$ |
0.00 |
|
|
$ |
(0.00 |
) |
|
$ |
0.35 |
|
|
$ |
0.00 |
|
|
Basic and diluted net (loss) income per common share |
$ |
(0.14 |
) |
|
$ |
(0.16 |
) |
|
$ |
0.25 |
|
|
$ |
(0.12 |
) |
|
For the year ended December 31, 2015: |
|
|
|
|
|
|
|
|
|
|
|
|
|
|
|
|
Revenues |
$ |
25,757 |
|
|
$ |
25,053 |
|
|
$ |
18,337 |
|
|
$ |
15,917 |
|
|
Net (loss) income from continuing operations |
|
(4,023 |
) |
|
|
(5,689 |
) |
|
|
15,633 |
|
|
|
(32,586 |
) |
|
Net loss from discontinued operations |
|
(1,471 |
) |
|
|
(1,561 |
) |
|
|
(10,731 |
) |
|
|
(67,110 |
) |
|
Net (loss) income |
|
(5,494 |
) |
|
|
(7,250 |
) |
|
|
4,902 |
|
|
|
(99,696 |
) |
|
Comprehensive loss |
|
(29,113 |
) |
|
|
(12,167 |
) |
|
|
(16,841 |
) |
|
|
(91,697 |
) |
|
Basic and diluted net (loss) income per common share from continuing operations |
$ |
(0.10 |
) |
|
$ |
(0.14 |
) |
|
$ |
0.38 |
|
|
$ |
(0.80 |
) |
|
Basic and diluted net loss per common share from discontinuing operations |
$ |
(0.04 |
) |
|
$ |
(0.04 |
) |
|
$ |
(0.26 |
) |
|
$ |
(1.65 |
) |
|
Basic and diluted net (loss) income per common share |
$ |
(0.13 |
) |
|
$ |
(0.18 |
) |
|
$ |
0.12 |
|
|
$ |
(2.45 |
) |
|
|
|
|
(1) |
The sum of the individual quarterly net (loss) income amounts per share may not agree with full year net (loss) income per share as each quarterly computation is based on the net income or loss for that quarter and the weighted-average number of shares outstanding during that quarter. |
During the fourth quarter of 2015, we identified an error related to our deferred tax liability and deferred tax benefit that originated in prior periods and concluded that the error was not material to any of the previously reported periods or to the period in which the error was corrected. The impact of the error resulted in a decrease to our net loss of $4.7 million for each of the three and nine months ended September 30, 2015. This immaterial error was corrected in our third quarter of 2015 results of operations.
Supplemental oil and natural gas reserves information (unaudited)
As required by the FASB and the SEC, the standardized measure of discounted future net cash flows (the “Standardized Measure”) presented below is computed by applying first-day-of-the-month average prices, year-end costs and legislated tax rates and a discount factor of 10% to proved reserves. We do not believe the Standardized Measure provides a reliable estimate of the Company’s expected future cash flows to be obtained from the development and production of its oil and natural gas properties or of the value of its proved oil and natural gas reserves. The Standardized Measure is prepared on the basis of certain prescribed assumptions including first-day-of-the-month average prices, which represent discrete points in time and therefore may cause significant variability in cash flows from year-to-year as prices change.
F-36
Users of this information should be aware that the process of estimating quantities of proved and proved developed oil and natural gas reserves is very complex, requiring significant subjective decisions in the evaluation of all available geological, engineering and economic data for each reservoir. The data for a given reservoir also may change substantially over time as a result of numerous factors, including additional development activity, evolving production history and continual reassessment of the viability of production under varying economic conditions. Consequently, revisions to existing reserves estimates may occur from time to time. Although every reasonable effort is made to ensure reserves estimates reported represent the most accurate assessments possible, the subjective decisions and variances in available data for various reservoirs make these estimates generally less precise than other estimates included in the financial statement disclosures.
Proved reserves are those quantities of oil and natural gas that by analysis of geoscience and engineering data can be estimated with reasonable certainty to be economically producible—from a given date forward, from known reservoirs, and under existing economic conditions, operating methods and government regulations—prior to the time at which contracts providing the right to operate expire, unless evidence indicates that renewal is reasonably certain, regardless of whether deterministic or probabilistic methods are used for the estimation. The project to extract the hydrocarbons must have commenced or the operator must be reasonably certain that it will commence the project within a reasonable time. We engaged DeGolyer & MacNaughton to prepare our reserves estimates in Turkey, excluding TBNG, Albania and Bulgaria.
The following unaudited schedules are presented in accordance with required disclosures about oil and natural gas producing activities to provide users with a common base for preparing estimates of future cash flows and comparing reserves among companies.
All of our proved reserves are located in Turkey and Albania, and all prices are held constant in accordance with SEC rules. As of December 31, 2016, we have classified TBNG’s assets and liabilities as held for sale. As of December 31, 2015, we have classified our Albania segment as assets and liabilities held for sale and presented the operating results within discontinued operations for all periods presented.
Oil and natural gas prices used to estimate reserves were computed by applying the volume-weighted, arithmetic average of the closing price on the first day of each month for the 12-month period prior to December 2016, 2015 and 2014. The oil and natural gas prices used to estimate reserves are shown in the table below.
|
|
12-Month |
|
|||||
|
|
Average Price |
|
|||||
|
|
Oil |
|
|
Natural Gas |
|
||
|
|
per (Bbl) |
|
|
per (Mcf) |
|
||
|
Turkey |
|
|
|
|
|
|
|
|
2016 |
$ |
37.22 |
|
|
$ |
5.71 |
|
|
2015 |
$ |
48.65 |
|
|
$ |
7.65 |
|
|
2014 |
$ |
94.53 |
|
|
$ |
8.71 |
|
|
|
|
|
|
|
|
|
|
|
Albania |
|
|
|
|
|
|
|
|
2016 |
$ |
44.42 |
|
|
$ |
7.50 |
|
|
2015 |
$ |
38.77 |
|
|
$ |
7.37 |
|
|
2014 |
$ |
69.55 |
|
|
$ |
10.00 |
|
F-37
The following table sets forth our estimated net proved reserves, including changes therein, and proved developed reserves:
Disclosure of reserves quantities
|
|
Turkey |
|
|
Albania(1) |
|
|
TBNG(2) |
|
|
Total |
|
||||
|
|
Oil (Mbbls) |
|
|||||||||||||
|
Total proved reserves |
|
|
|
|
|
|
|
|
|
|
|
|
|
|
|
|
December 31, 2013 |
|
9,551 |
|
|
|
- |
|
|
|
163 |
|
|
|
9,714 |
|
|
Acquisitions |
|
- |
|
|
|
14,296 |
|
|
|
- |
|
|
|
14,296 |
|
|
Extensions and discoveries |
|
4,740 |
|
|
|
- |
|
|
|
- |
|
|
|
4,740 |
|
|
Revisions of previous estimates |
|
1,250 |
|
|
|
- |
|
|
|
4 |
|
|
|
1,254 |
|
|
Sales volumes |
|
(1,300 |
) |
|
|
(36 |
) |
|
|
(3 |
) |
|
|
(1,339 |
) |
|
December 31, 2014 |
|
14,241 |
|
|
|
14,260 |
|
|
|
164 |
|
|
|
28,665 |
|
|
Extensions and discoveries |
|
362 |
|
|
|
- |
|
|
|
- |
|
|
|
362 |
|
|
Revisions of previous estimates |
|
(2,525 |
) |
|
|
(9,771 |
) |
|
|
(7 |
) |
|
|
(12,303 |
) |
|
Sales volumes |
|
(1,417 |
) |
|
|
(231 |
) |
|
|
(3 |
) |
|
|
(1,651 |
) |
|
December 31, 2015 |
|
10,661 |
|
|
|
4,258 |
|
|
|
154 |
|
|
|
15,073 |
|
|
Revisions of previous estimates |
|
3,443 |
|
|
|
- |
|
|
|
(149 |
) |
|
|
3,294 |
|
|
Sale of reserves |
|
- |
|
|
|
(4,206 |
) |
|
|
- |
|
|
|
(4,206 |
) |
|
Sales volumes |
|
(1,374 |
) |
|
|
- |
|
|
|
(2 |
) |
|
|
(1,376 |
) |
|
December 31, 2016 |
|
12,730 |
|
|
|
52 |
|
|
|
3 |
|
|
|
12,785 |
|
|
|
|
|
|
|
|
|
|
|
|
|
|
|
|
|
|
|
Proved developed reserves |
|
|
|
|
|
|
|
|
|
|
|
|
|
|
|
|
December 31, 2014: |
|
|
|
|
|
|
|
|
|
|
|
|
|
|
|
|
Proved developed producing |
|
6,147 |
|
|
|
4,630 |
|
|
|
6 |
|
|
|
10,783 |
|
|
Proved developed non-producing |
|
630 |
|
|
|
9,270 |
|
|
|
74 |
|
|
|
9,974 |
|
|
Total |
|
6,777 |
|
|
|
13,900 |
|
|
|
80 |
|
|
|
20,757 |
|
|
December 31, 2015: |
|
|
|
|
|
|
|
|
|
|
|
|
|
|
|
|
Proved developed producing |
|
4,377 |
|
|
|
2,096 |
|
|
|
5 |
|
|
|
6,478 |
|
|
Proved developed non-producing |
|
1,141 |
|
|
|
1,989 |
|
|
|
75 |
|
|
|
3,205 |
|
|
Total |
|
5,518 |
|
|
|
4,085 |
|
|
|
80 |
|
|
|
9,683 |
|
|
December 31, 2016: |
|
|
|
|
|
|
|
|
|
|
|
|
|
|
|
|
Proved developed producing |
|
4,241 |
|
|
|
- |
|
|
|
3 |
|
|
|
4,244 |
|
|
Proved developed non-producing |
|
544 |
|
|
|
8 |
|
|
|
- |
|
|
|
552 |
|
|
Total |
|
4,785 |
|
|
|
8 |
|
|
|
3 |
|
|
|
4,796 |
|
|
|
|
|
|
|
|
|
|
|
|
|
|
|
|
|
|
|
Proved undeveloped reserves |
|
|
|
|
|
|
|
|
|
|
|
|
|
|
|
|
|
|
|
|
|
|
|
|
|
|
|
|
|
|
|
|
|
As of December 31, 2014 |
|
7,464 |
|
|
|
360 |
|
|
|
84 |
|
|
|
7,908 |
|
|
As of December 31, 2015 |
|
5,143 |
|
|
|
173 |
|
|
|
74 |
|
|
|
5,390 |
|
|
As of December 31, 2016 |
|
7,945 |
|
|
|
44 |
|
|
|
- |
|
|
|
7,989 |
|
F-38
|
|
Turkey |
|
|
Albania(1) |
|
|
TBNG(2) |
|
|
Total |
|
||||
|
|
Gas (Mmcf) |
|
|||||||||||||
|
Total proved reserves |
|
|
|
|
|
|
|
|
|
|
|
|
|
|
|
|
December 31, 2013 |
|
6,762 |
|
|
|
- |
|
|
|
8,277 |
|
|
|
15,039 |
|
|
Acquisitions |
|
- |
|
|
|
8,249 |
|
|
|
- |
|
|
|
8,249 |
|
|
Extensions and discoveries |
|
- |
|
|
|
- |
|
|
|
2,809 |
|
|
|
2,809 |
|
|
Revisions of previous estimates |
|
70 |
|
|
|
- |
|
|
|
1,598 |
|
|
|
1,668 |
|
|
Sales volumes |
|
(1,065 |
) |
|
|
- |
|
|
|
(2,197 |
) |
|
|
(3,262 |
) |
|
December 31, 2014 |
|
5,767 |
|
|
|
8,249 |
|
|
|
10,487 |
|
|
|
24,503 |
|
|
Extensions and discoveries |
|
- |
|
|
|
- |
|
|
|
- |
|
|
|
- |
|
|
Revisions of previous estimates |
|
686 |
|
|
|
(2,722 |
) |
|
|
1,398 |
|
|
|
(638 |
) |
|
Sales volumes |
|
(602 |
) |
|
|
- |
|
|
|
(1,889 |
) |
|
|
(2,491 |
) |
|
December 31, 2015 |
|
5,851 |
|
|
|
5,527 |
|
|
|
9,996 |
|
|
|
21,374 |
|
|
Revisions of previous estimates |
|
(190 |
) |
|
|
- |
|
|
|
23 |
|
|
|
(167 |
) |
|
Sale of reserves |
|
- |
|
|
|
(4,116 |
) |
|
|
- |
|
|
|
(4,116 |
) |
|
Sales volumes |
|
(449 |
) |
|
|
- |
|
|
|
(982 |
) |
|
|
(1,431 |
) |
|
December 31, 2016 |
|
5,212 |
|
|
|
1,411 |
|
|
|
9,037 |
|
|
|
15,660 |
|
|
|
|
|
|
|
|
|
|
|
|
|
|
|
|
|
|
|
Proved developed reserves |
|
|
|
|
|
|
|
|
|
|
|
|
|
|
|
|
December 31, 2014: |
|
|
|
|
|
|
|
|
|
|
|
|
|
|
|
|
Proved developed producing |
|
2,160 |
|
|
|
- |
|
|
|
3,412 |
|
|
|
5,572 |
|
|
Proved developed non-producing |
|
1,767 |
|
|
|
- |
|
|
|
2,212 |
|
|
|
3,979 |
|
|
Total |
|
3,927 |
|
|
|
- |
|
|
|
5,624 |
|
|
|
9,551 |
|
|
December 31, 2015: |
|
|
|
|
|
|
|
|
|
|
|
|
|
|
|
|
Proved developed producing |
|
2,238 |
|
|
|
- |
|
|
|
2,864 |
|
|
|
5,102 |
|
|
Proved developed non-producing |
|
1,749 |
|
|
|
935 |
|
|
|
1,925 |
|
|
|
4,609 |
|
|
Total |
|
3,987 |
|
|
|
935 |
|
|
|
4,789 |
|
|
|
9,711 |
|
|
December 31, 2016: |
|
|
|
|
|
|
|
|
|
|
|
|
|
|
|
|
Proved developed producing |
|
1,886 |
|
|
|
- |
|
|
|
1,927 |
|
|
|
3,813 |
|
|
Proved developed non-producing |
|
1,519 |
|
|
|
233 |
|
|
|
1,911 |
|
|
|
3,663 |
|
|
Total |
|
3,405 |
|
|
|
233 |
|
|
|
3,838 |
|
|
|
7,476 |
|
|
|
|
|
|
|
|
|
|
|
|
|
|
|
|
|
|
|
Proved undeveloped reserves |
|
|
|
|
|
|
|
|
|
|
|
|
|
|
|
|
As of December 31, 2014 |
|
1,840 |
|
|
|
8,249 |
|
|
|
4,863 |
|
|
|
14,952 |
|
|
As of December 31, 2015 |
|
1,864 |
|
|
|
4,592 |
|
|
|
5,207 |
|
|
|
11,663 |
|
|
As of December 31, 2016 |
|
1,807 |
|
|
|
1,178 |
|
|
|
5,199 |
|
|
|
8,184 |
|
|
|
|
|
(1) |
As of December 31, 2015, we have classified our Albanian segment as assets and liabilities held for sale and presented the operating results within discontinued operations for all periods presented. DeGolyer and MacNaughton did not evaluate the Albania properties for December 31, 2014. |
|
|
(2) |
Consists of amounts related to our TBNG assets that were sold in February 2017. As of December 31, 2016, our TBNG assets and liabilities were classified as held for sale. DeGolyer and MacNaughton did not evaluate the TBNG properties for December 31, 2016. |
Proved Reserves
Estimates of proved developed and undeveloped reserves are inherently imprecise and are continually subject to revision based on production history, results of additional exploration and development, price changes and other factors. See “—Oil and Natural Gas Reserves under U.S. Law.”
At December 31, 2016, our estimated proved reserves, excluding TBNG, were 13,886 Mboe, a decrease of 2,930 Mboe, or 17.4%, compared to 16,816 Mboe at December 31, 2015. This decrease was primarily attributable to the sale of all our Albanian oil fields and 75% of our Albanian natural gas field and a 19% decline in the SEC oil price in 2016. Additionally, proved reserves decreased due to sales volumes of 1,449 Mboe, consisting of 1,374 Mbbls of oil and 449 Mmcf of natural gas. This was partially offset by an increase in proved reserves in the Bahar and Selmo oil fields of 3,519 Mbbls of oil due primarily to production outperforming previous estimates. The estimated undiscounted capital costs associated with our proved reserves in Turkey is $166.3 million.
F-39
At December 31, 2016, our estimated proved undeveloped reserves, excluding TBNG, were 8,486 Mboe, an increase of 2,094 Mboe, or 32.8%, compared to 6,392 Mboe at December 31, 2015. The increase in proved undeveloped reserves was primarily due to a combination of additional planned wells for the Bahar oil field and type curve revisions attributable to improved production performance in the Selmo and Bahar oil fields. All of our proved undeveloped reserves as of December 31, 2016 will be developed within five years of the date the reserve was first disclosed as a proved undeveloped reserve. The estimated undiscounted capital costs associated with our proved undeveloped reserves in Turkey is $165.0 million, of which $23.7 million is expected to be incurred in 2017.
The proved undeveloped reserves assume development costs will be funded from future cash flows from operations and financing activities, which may not be sufficient or available at commercially economic terms and could impact the timing of these development activities.
Standardized measure of discounted future net cash flows
The Standardized Measure relating to estimated proved reserves as of December 31, 2016, 2015 and 2014 are shown in the table below. In our calculation of Standardized Measure, we have utilized statutory tax rates of 20% and 50% for Turkey and Albania, respectively. DeGolyer and MacNaughton did not estimate the Standardized Measure or future income tax expense.
|
|
Turkey |
|
|
Albania(1) |
|
|
TBNG(2) |
|
|
Total |
|
||||
|
|
(in thousands) |
|
|||||||||||||
|
As of and for the year ended December 31, 2016 |
|
|
|
|
|
|
|
|
|
|
|
|
|
|
|
|
Future cash inflows |
$ |
504,191 |
|
|
$ |
12,922 |
|
|
$ |
65,247 |
|
|
$ |
582,360 |
|
|
Future production costs |
|
(118,632 |
) |
|
|
(4,420 |
) |
|
|
(7,012 |
) |
|
|
(130,064 |
) |
|
Future development costs |
|
(166,253 |
) |
|
|
(5,000 |
) |
|
|
(24,555 |
) |
|
|
(195,808 |
) |
|
Future income tax expense |
|
(12,395 |
) |
|
|
- |
|
|
|
(4,070 |
) |
|
|
(16,465 |
) |
|
Future net cash flows |
|
206,911 |
|
|
|
3,502 |
|
|
|
29,610 |
|
|
|
240,023 |
|
|
10% annual discount for estimated timing of cash flows |
|
(80,373 |
) |
|
|
(2,764 |
) |
|
|
(11,952 |
) |
|
|
(95,089 |
) |
|
Standardized measure of discounted future net cash flows related to proved reserves |
$ |
126,538 |
|
|
$ |
738 |
|
|
$ |
17,658 |
|
|
$ |
144,934 |
|
|
As of and for the year ended December 31, 2015 |
|
|
|
|
|
|
|
|
|
|
|
|
|
|
|
|
Future cash inflows |
$ |
558,092 |
|
|
$ |
205,829 |
|
|
$ |
90,156 |
|
|
$ |
854,077 |
|
|
Future production costs |
|
(130,186 |
) |
|
|
(116,617 |
) |
|
|
(9,905 |
) |
|
|
(256,708 |
) |
|
Future development costs |
|
(141,381 |
) |
|
|
(26,474 |
) |
|
|
(26,533 |
) |
|
|
(194,388 |
) |
|
Future income tax expense |
|
(21,446 |
) |
|
|
- |
|
|
|
(7,454 |
) |
|
|
(28,900 |
) |
|
Future net cash flows |
|
265,079 |
|
|
|
62,738 |
|
|
|
46,264 |
|
|
|
374,081 |
|
|
10% annual discount for estimated timing of cash flows |
|
(93,956 |
) |
|
|
(35,851 |
) |
|
|
(18,160 |
) |
|
|
(147,967 |
) |
|
Standardized measure of discounted future net cash flows related to proved reserves |
$ |
171,123 |
|
|
$ |
26,887 |
|
|
$ |
28,104 |
|
|
$ |
226,114 |
|
|
As of and for the year ended December 31, 2014 |
|
|
|
|
|
|
|
|
|
|
|
|
|
|
|
|
Future cash inflows |
$ |
1,393,103 |
|
|
$ |
921,237 |
|
|
$ |
111,266 |
|
|
$ |
2,425,606 |
|
|
Future production costs |
|
(296,325 |
) |
|
|
(239,149 |
) |
|
|
(13,203 |
) |
|
|
(548,677 |
) |
|
Future development costs |
|
(206,041 |
) |
|
|
(123,085 |
) |
|
|
(28,634 |
) |
|
|
(357,760 |
) |
|
Future income tax expense |
|
(138,604 |
) |
|
|
(243,774 |
) |
|
|
(9,833 |
) |
|
|
(392,211 |
) |
|
Future net cash flows |
|
752,133 |
|
|
|
315,229 |
|
|
|
59,596 |
|
|
|
1,126,958 |
|
|
10% annual discount for estimated timing of cash flows |
|
(253,777 |
) |
|
|
(182,228 |
) |
|
|
(18,872 |
) |
|
|
(454,877 |
) |
|
Standardized measure of discounted future net cash flows related to proved reserves |
$ |
498,356 |
|
|
$ |
133,001 |
|
|
$ |
40,724 |
|
|
$ |
672,081 |
|
|
|
(1) |
As of December 31, 2015, we have classified our Albanian segment as assets and liabilities held for sale and presented the operating results within discontinued operations for all periods presented. |
|
|
(2) |
Consists of amounts related to our TBNG assets that were sold in February 2017. As of December 31, 2016, our TBNG assets and liabilities were classified as held for sale. |
F-40
Changes in the standardized measure of discounted future net cash flows
The following are the principal sources of changes in the Standardized Measure applicable to proved oil and natural gas reserves for the years ended December 31, 2016, 2015 and 2014.
|
|
Turkey |
|
|
Albania(1) |
|
|
TBNG(2) |
|
|
Total |
|
||||
|
|
(in thousands) |
|
|||||||||||||
|
For the year ended December 31, 2016 |
|
|
|
|
|
|
|
|
|
|
|
|
|
|
|
|
Standardized measure, January 1, |
$ |
171,123 |
|
|
$ |
26,887 |
|
|
$ |
28,104 |
|
|
$ |
226,114 |
|
|
Net change in sales and transfer prices and in production (lifting) costs related to future production |
|
(75,216 |
) |
|
|
- |
|
|
|
(7,696 |
) |
|
|
(82,912 |
) |
|
Changes in future estimated development costs |
|
(25,496 |
) |
|
|
- |
|
|
|
1,678 |
|
|
|
(23,818 |
) |
|
Sales and transfers of oil and natural gas during the period |
|
(45,306 |
) |
|
|
36 |
|
|
|
(5,766 |
) |
|
|
(51,036 |
) |
|
Net change due to sales of reserves |
|
- |
|
|
|
(28,768 |
) |
|
|
- |
|
|
|
(28,768 |
) |
|
Net change due to revisions in quantity estimates |
|
81,546 |
|
|
|
- |
|
|
|
(4,789 |
) |
|
|
76,757 |
|
|
Previously estimated development costs incurred during the period |
|
6,959 |
|
|
|
- |
|
|
|
- |
|
|
|
6,959 |
|
|
Accretion of discount |
|
15,115 |
|
|
|
2,017 |
|
|
|
2,683 |
|
|
|
19,815 |
|
|
Other |
|
(9,818 |
) |
|
|
566 |
|
|
|
575 |
|
|
|
(8,677 |
) |
|
Net change in income taxes |
|
7,631 |
|
|
|
- |
|
|
|
2,869 |
|
|
|
10,500 |
|
|
Standardized measure, December 31, |
$ |
126,538 |
|
|
$ |
738 |
|
|
$ |
17,658 |
|
|
$ |
144,934 |
|
|
For the year ended December 31, 2015 |
|
|
|
|
|
|
|
|
|
|
|
|
|
|
|
|
Standardized measure, January 1, |
$ |
498,357 |
|
|
$ |
133,001 |
|
|
$ |
40,724 |
|
|
$ |
672,082 |
|
|
Net change in sales and transfer prices and in production (lifting) costs related to future production |
|
(426,902 |
) |
|
|
(223,406 |
) |
|
|
(10,445 |
) |
|
|
(660,753 |
) |
|
Changes in future estimated development costs |
|
44,004 |
|
|
|
52,914 |
|
|
|
687 |
|
|
|
97,605 |
|
|
Sales and transfers of oil and natural gas during the period |
|
(56,387 |
) |
|
|
2,499 |
|
|
|
(13,456 |
) |
|
|
(67,344 |
) |
|
Net change due to extensions and discoveries |
|
12,219 |
|
|
|
- |
|
|
|
- |
|
|
|
12,219 |
|
|
Net change due to revisions in quantity estimates |
|
(79,900 |
) |
|
|
(96,727 |
) |
|
|
6,203 |
|
|
|
(170,424 |
) |
|
Previously estimated development costs incurred during the period |
|
15,718 |
|
|
|
281 |
|
|
|
1,000 |
|
|
|
16,999 |
|
|
Accretion of discount |
|
48,477 |
|
|
|
17,689 |
|
|
|
3,406 |
|
|
|
69,572 |
|
|
Other |
|
10,270 |
|
|
|
(1,930 |
) |
|
|
(1,501 |
) |
|
|
6,839 |
|
|
Net change in income taxes |
|
105,267 |
|
|
|
142,566 |
|
|
|
1,486 |
|
|
|
249,319 |
|
|
Standardized measure, December 31, |
$ |
171,123 |
|
|
$ |
26,887 |
|
|
$ |
28,104 |
|
|
$ |
226,114 |
|
|
For the year ended December 31, 2014 |
|
|
|
|
|
|
|
|
|
|
|
|
|
|
|
|
Standardized measure, January 1, |
$ |
442,946 |
|
|
$ |
- |
|
|
$ |
52,823 |
|
|
$ |
495,769 |
|
|
Net change in sales and transfer prices and in production (lifting) costs related to future production |
|
(59,709 |
) |
|
|
- |
|
|
|
(16,203 |
) |
|
|
(75,912 |
) |
|
Changes in future estimated development costs |
|
(137,920 |
) |
|
|
- |
|
|
|
(13,318 |
) |
|
|
(151,238 |
) |
|
Sales and transfers of oil and natural gas during the period |
|
(102,693 |
) |
|
|
- |
|
|
|
(15,390 |
) |
|
|
(118,083 |
) |
|
Net change due to extensions and discoveries |
|
228,819 |
|
|
|
- |
|
|
|
16,824 |
|
|
|
245,643 |
|
|
Net change due to purchases of minerals in place |
|
- |
|
|
|
235,855 |
|
|
|
- |
|
|
|
235,855 |
|
|
Net change due to revisions in quantity estimates |
|
62,464 |
|
|
|
- |
|
|
|
9,758 |
|
|
|
72,222 |
|
|
Previously estimated development costs incurred during the period |
|
51,671 |
|
|
|
- |
|
|
|
11,579 |
|
|
|
63,250 |
|
|
Accretion of discount |
|
39,973 |
|
|
|
- |
|
|
|
4,466 |
|
|
|
44,439 |
|
|
Other |
|
(11,097 |
) |
|
|
- |
|
|
|
(8,243 |
) |
|
|
(19,340 |
) |
|
Net change in income taxes |
|
(16,097 |
) |
|
|
(102,854 |
) |
|
|
(1,572 |
) |
|
|
(120,523 |
) |
|
Standardized measure, December 31, |
$ |
498,357 |
|
|
$ |
133,001 |
|
|
$ |
40,724 |
|
|
$ |
672,082 |
|
|
|
(1) |
As of December 31, 2015, we have classified our Albanian segment as assets and liabilities held for sale and presented the operating results within discontinued operations for all periods presented in our consolidated financial statements in this Annual Report on Form 10-K. |
|
|
(2) |
Consists of amounts related to our TBNG assets that were sold in February 2017. As of December 31, 2016, our TBNG assets and liabilities were classified as held for sale. |
F-41
Costs incurred in oil and natural gas property acquisition, exploration and development
Costs incurred in oil and natural gas property acquisition, exploration and development activities for the years ended December 31, 2016, 2015 and 2014 are summarized as follows:
|
|
Turkey |
|
|
Albania |
|
|
Bulgaria |
|
|
TBNG |
|
|
Total |
|
|||||
|
|
(in thousands) |
|
|||||||||||||||||
|
For the year ended December 31, 2016 |
|
|
|
|
|
|
|
|
|
|
|
|
|
|
|
|
|
|
|
|
Exploration |
$ |
2,094 |
|
|
$ |
- |
|
|
$ |
- |
|
|
$ |
3 |
|
|
$ |
2,097 |
|
|
Development |
|
6,959 |
|
|
|
- |
|
|
|
- |
|
|
|
- |
|
|
|
6,959 |
|
|
Total costs incurred |
$ |
9,053 |
|
|
$ |
- |
|
|
$ |
- |
|
|
$ |
3 |
|
|
$ |
9,056 |
|
|
For the year ended December 31, 2015 |
|
|
|
|
|
|
|
|
|
|
|
|
|
|
|
|
|
|
|
|
Exploration |
$ |
6,312 |
|
|
$ |
10,022 |
|
|
$ |
- |
|
|
$ |
- |
|
|
$ |
16,334 |
|
|
Development |
|
14,654 |
|
|
|
285 |
|
|
|
41 |
|
|
|
1,000 |
|
|
|
15,980 |
|
|
Total costs incurred |
$ |
20,966 |
|
|
$ |
10,307 |
|
|
$ |
41 |
|
|
$ |
1,000 |
|
|
$ |
32,314 |
|
|
For the year ended December 31, 2014 |
|
|
|
|
|
|
|
|
|
|
|
|
|
|
|
|
|
|
|
|
Acquisitions of properties |
|
|
|
|
|
|
|
|
|
|
|
|
|
|
|
|
|
|
|
|
Proved |
$ |
- |
|
|
$ |
99,927 |
|
|
$ |
- |
|
|
$ |
- |
|
|
$ |
99,927 |
|
|
Unproved |
|
- |
|
|
|
16,140 |
|
|
|
- |
|
|
|
- |
|
|
|
16,140 |
|
|
Exploration |
|
37,905 |
|
|
|
2,161 |
|
|
|
1,291 |
|
|
|
1,238 |
|
|
|
42,595 |
|
|
Development |
|
54,034 |
|
|
|
110 |
|
|
|
44 |
|
|
|
9,216 |
|
|
|
63,404 |
|
|
Total costs incurred |
$ |
91,939 |
|
|
$ |
118,338 |
|
|
$ |
1,335 |
|
|
$ |
10,454 |
|
|
$ |
222,066 |
|
F-42
|
2.1 |
|
Share Purchase Agreement, dated February 29, 2016, among TransAtlantic Holdings B.C. Ltd. and Continental Oil & Gas (incorporated by reference to Exhibit 2.1 to the Company’s Current Report on Form 8-K dated February 29, 2016, filed with the SEC on March 4, 2016). |
|
|
|
|
|
2.2 |
|
Share Purchase Agreement, dated October 13, 2016, by and between TransAtlantic Worldwide, Ltd. and Valeura Energy Netherlands B.V. (Pursuant to Item 601(b)(2) of Regulation S-K, the registrant agrees to furnish supplementally a copy of any omitted schedule to the SEC upon request.) (incorporated by reference to Exhibit 2.1 to the Company’s Current Report on Form 8-K dated October 13, 2016, filed with the SEC on October 13, 2016. |
|
|
|
|
|
3.1 |
|
Certificate of Continuance of TransAtlantic Petroleum Ltd., dated October 1, 2009 (incorporated by reference to Exhibit 3.1 to the Company’s Current Report on Form 8-K dated October 1, 2009, filed with the SEC on October 7, 2009). |
|
|
|
|
|
3.2 |
|
Altered Memorandum of Continuance of TransAtlantic Petroleum Ltd., dated March 4, 2014 (incorporated by reference to Exhibit 3.1 to the Company’s Current Report on Form 8-K dated March 6, 2014, filed with the SEC on March 6, 2014). |
|
|
|
|
|
3.3 |
|
Amended Bye-Laws of TransAtlantic Petroleum Ltd., dated March 4, 2014 (incorporated by reference to Exhibit 3.2 to the Company’s Current Report on Form 8-K dated March 6, 2014, filed with the SEC on March 6, 2014). |
|
|
|
|
|
3.4 |
|
Certificate of Designations of 12.0% Series A Convertible Redeemable Preferred Shares of TransAtlantic Petroleum Ltd. (incorporated by reference to Exhibit 3.1 to the Company’s Current Report on Form 8-K dated October 31, 2016, filed with the SEC on November 4, 2016). |
|
|
|
|
|
4.1 |
|
Amended and Restated Registration Rights Agreement, dated December 30, 2008, by and between TransAtlantic Petroleum Corp. and Riata Management, LLC (incorporated by reference to Exhibit 4.1 to the Company’s Current Report on Form 8-K dated December 30, 2008, filed with the SEC on January 6, 2009). |
|
|
|
|
|
4.2 |
|
Specimen Common Share certificate (incorporated by reference to Exhibit 3.3 to the Company’s Current Report on Form 8-K dated March 4, 2014, filed with the SEC on March 6, 2014). |
|
|
|
|
|
4.3 |
|
Indenture, dated as of February 20, 2015, between TransAtlantic Petroleum Ltd. and U.S. Bank National Association, as trustee (incorporated by reference to Exhibit 4.1 to the Company’s Current Report on Form 8-K dated February 20, 2015, filed with the SEC on February 25, 2015). |
|
|
|
|
|
4.4 |
|
Form of 13.0% Convertible Note due 2017 (incorporated by reference to Exhibit 4.2 to the Company’s Current Report on Form 8-K dated February 20, 2015, filed with the SEC on February 25, 2015). |
|
|
|
|
|
10.1 |
|
Service Agreement, effective as of May 1, 2008, by and among TransAtlantic Petroleum Corp., Longfellow Energy, LP, Viking Drilling, LLC, Longe Energy Limited and Riata Management, LLC (incorporated by reference to Exhibit 10.1 to the Company’s Current Report on Form 8-K dated August 6, 2008, filed with the SEC on February 12, 2009). |
|
|
|
|
|
10.2 |
|
Amendment to Service Agreement, effective as of October 1, 2008, by and among TransAtlantic Petroleum Corp., Longfellow Energy, LP, Viking Drilling, LLC, Longe Energy Limited, MedOil Supply LLC and Riata Management, LLC (incorporated by reference to Exhibit 10.2 to the Company’s Current Report on Form 8-K dated August 6, 2008, filed with the SEC on February 12, 2009). |
|
|
|
|
|
10.3 |
|
Domestic Crude Oil Purchase/Sale Agreement, dated as of January 26, 2009, by and between Türkiye Petrol Rafinerileri A.Ş. and TransAtlantic Exploration Mediterranean International Pty. Ltd. (incorporated by reference to Exhibit 10.13 to the Company’s Annual Report on Form 10-K, filed with the SEC on April 21, 2011). |
|
|
|
|
|
10.4† |
|
TransAtlantic Petroleum Corp. 2009 Long-Term Incentive Plan (incorporated by reference to Appendix B to the Definitive Proxy Statement filed by TransAtlantic Petroleum Corp. with the SEC on April 30, 2009). |
|
|
|
|
|
10.5† |
|
Form of Restricted Stock Unit Award Agreement (incorporated by reference to Exhibit 10.2 to the Company’s Current Report on Form 8-K dated June 16, 2009, filed with the SEC on June 22, 2009). |
|
|
|
|
|
10.6 |
|
Office Lease, dated August 23, 2011, by and between TransAtlantic Petroleum (USA) Corp. and Longfellow Energy, LP (incorporated by reference to Exhibit 10.1 to the Company’s Current Report on Form 8-K, dated August 23, 2011, filed with the SEC on August 25, 2011). |
|
|
|
|
|
10.7† |
|
Form of Indemnification Agreement (incorporated by reference to Exhibit 10.1 to the Company’s Current Report on Form 8-K, dated July 13, 2011, filed with the SEC on July 19, 2011). |
|
|
|
|
|
10.8 |
|
Office Lease, dated April 5, 2013, by and between TransAtlantic Petroleum (USA) Corp. and Longfellow Energy, LP (incorporated by reference to Exhibit 10.1 to the Company’s Current Report on Form 8-K, dated May 8, 2013, filed with the SEC on May 14, 2013). |
|
|
|
|
|
10.9 |
|
Convertible Promissory Note, by and between TransAtlantic Petroleum Ltd. and ANBE Holdings, LP, dated December 30, 2015 (incorporated by reference to Exhibit 10.1 to the Company’s Current Report on Form 8-K, filed with the SEC on January 6, 2016). |
|
|
|
|
|
10.10 |
|
Master Services Agreement, dated March 3, 2016, among TransAtlantic Exploration Mediterranean International Pty Ltd and Production Solutions International Petrol Arama Hizmetleri Anonim Sirketi (incorporated by reference to Exhibit 2.1 to the Company’s Current Report on Form 8-K dated February 29, 2016, filed with the SEC on March 4, 2016). |
|
|
|
|
|
10.11 |
|
Form of General Credit Agreement between DenizBank A.S. and each of TransAtlantic Exploration Mediterranean International Pty Ltd, TransAtlantic Turkey, Ltd., DMLP, Ltd. and Talon Exploration, Ltd, dated August 23, 2016 (incorporated by reference to Exhibit 10.1 to the Company’s Current Report on Form 10-Q dated September 30, 2016, filed with the SEC on November 9, 2016). |
|
|
|
|
|
10.12 |
|
Current Account Loan Agreement between TransAtlantic Exploration Mediterranean International Pty Ltd and DenizBank A.S., dated August 31, 2016 (incorporated by reference to Exhibit 10.2 to the Company’s Current Report on Form 10-Q dated September 30, 2016, filed with the SEC on November 9, 2016). |
|
|
|
|
|
10.13 |
|
Note Amendment Agreement, dated April 19, 2016, by and among TransAtlantic Petroleum Ltd., Dalea Partners, LP., and N. Malone Mitchell, 3rd (incorporated by reference to Exhibit 10.1 to the Company’s Current Report on Form 8-K dated April 19, 2016, filed with the SEC on April 22, 2016). |
|
|
|
|
|
10.14 |
|
Amended and Restated Promissory Note, dated April 19, 2016, by and between TransAtlantic Petroleum Ltd. and Dalea Partners, LP (incorporated by reference to Exhibit 10.2 to the Company’s Current Report on Form 8-K dated April 19, 2016, filed with the SEC on April 22, 2016). |
|
|
|
|
|
10.15 |
|
Pledge Agreement, dated April 19, 2016, by and between TransAtlantic Petroleum Ltd. and Dalea Partners, LP (incorporated by reference to Exhibit 10.3 to the Company’s Current Report on Form 8-K dated April 19, 2016, filed with the SEC on April 22, 2016). |
|
|
|
|
|
10.16 |
|
Extension of Convertible Promissory Note, dated June 30, 2016, by and between ANBE Holdings, L.P. and TransAtlantic Petroleum Ltd. (incorporated by reference to Exhibit 10.1 to the Company’s Current Report on Form 8-K dated June 30, 2016, filed with the SEC on July 5, 2016). |
|
|
|
|
|
10.17 |
|
Extension of Convertible Promissory Note, dated August 31, 2016, by and between ANBE Holdings, L.P. and TransAtlantic Petroleum Ltd. (incorporated by reference to Exhibit 10.1 to the Company’s Current Report on Form 8-K dated August 31, 2016, filed with the SEC on September 7, 2016). |
|
|
|
|
|
10.18 |
|
Amendment of Convertible Promissory Note, dated October 31, 2016, by and between ANBE Holdings, L.P. and TransAtlantic Petroleum Ltd. (incorporated by reference to Exhibit 10.1 to the Company’s Current Report on Form 8-K dated October 31, 2016, filed with the SEC on November 4, 2016). |
|
|
|
|
|
10.19 |
|
Indemnity Agreement, dated May 9, 2016, by and between TransAtlantic Petroleum Ltd. and N. Malone Mitchell 3rd (incorporated by reference to Exhibit 10.2 to the Company’s Current Report on Form 10-Q dated March 31, 2016, filed with the SEC on May 10, 2016). |
|
|
|
|
|
10.20* |
|
Gundem Pledge Agreement, dated August 31, 2016, by and between Gundem Turizm Yatirim Ve Isletmeleri A.S. and TransAtlantic Petroleum Ltd. |
|
|
|
|
|
10.21* |
|
Diyarbakir Pledge Agreement, dated August 31, 2016, by and between Noah Malone Mitchell, 3rd, Selami Erdem Uras and TransAtlantic Petroleum Ltd. |
|
|
|
|
|
10.22* |
|
Second Amendment to Service Agreement, dated March 20, 2017, by and between TransAltantic Petroleum Ltd. and Longfellow Energy, LP, Riata Management, LLC, Longfellow Nemaha, LLC, Red Rock Minerals, LP, Red Rock Advisors, LLC, Production Solutions International Limited and Nexlube Operating, LLC. |
|
|
|
|
|
21.1* |
|
Subsidiaries of the Company. |
|
|
|
|
|
23.1* |
|
Consent of PMB Helin Donovan, LLP. |
|
|
|
|
|
23.2* |
|
Consent of KPMG LLP. |
|
|
|
|
|
23.3* |
|
Consent of DeGolyer and MacNaughton. |
|
|
|
|
|
|
Certification of the Chief Executive Officer of the Company, pursuant to Section 302 of the Sarbanes-Oxley Act of 2002. |
|
|
|
|
|
|
31.2* |
|
Certification of the Principal Accounting and Financial Officer of the Company, pursuant to Section 302 of the Sarbanes-Oxley Act of 2002. |
|
|
|
|
|
32.1** |
|
Certification of the Chief Executive Officer of the Company, pursuant to Section 906 of the Sarbanes-Oxley Act of 2002. |
|
|
|
|
|
32.2** |
|
Certification of the Principal Accounting and Financial Officer of the Company, pursuant to Section 906 of the Sarbanes-Oxley Act of 2002. |
|
|
|
|
|
99.1* |
|
Report of DeGolyer and MacNaughton, dated February 24, 2017. |
|
|
|
|
|
101.INS* |
|
XBRL Instance Document. |
|
|
|
|
|
101.SCH* |
|
XBRL Taxonomy Extension Schema Document. |
|
|
|
|
|
101.CAL* |
|
XBRL Taxonomy Extension Calculation Linkbase Document. |
|
|
|
|
|
101.DEF* |
|
XBRL Taxonomy Extension Definition Linkbase Document. |
|
|
|
|
|
101.LAB* |
|
XBRL Taxonomy Extension Label Linkbase Document. |
|
|
|
|
|
101.PRE* |
|
XBRL Taxonomy Extension Presentation Linkbase Document. |
|
† |
Management contract or compensatory plan arrangement. |
|
* |
Filed herewith. |
|
** |
Furnished herewith. |