Attached files
| file | filename |
|---|---|
| 8-K - PORTER BANCORP, INC. 8-K - LIMESTONE BANCORP, INC. | a6812814.htm |
Exhibit 99.1
June 30, 2011
Disclaimer This presentation contains forward-looking statements that involve risks and uncertainties. These forward-looking statements are based on management’s current expectations. Porter Bancorp’s actual results in future periods may differ materially from those currently expected due to various factors, including those risk factors described in documents that the Company files with the Securities and Exchange Commission, including the Company’s most recent Annual Report on Form 10-K and Quarterly Report on Form 10-Q. The forward-looking statements in this presentation are made as of the date of the presentation and Porter Bancorp does not assume any responsibility to update these statements.
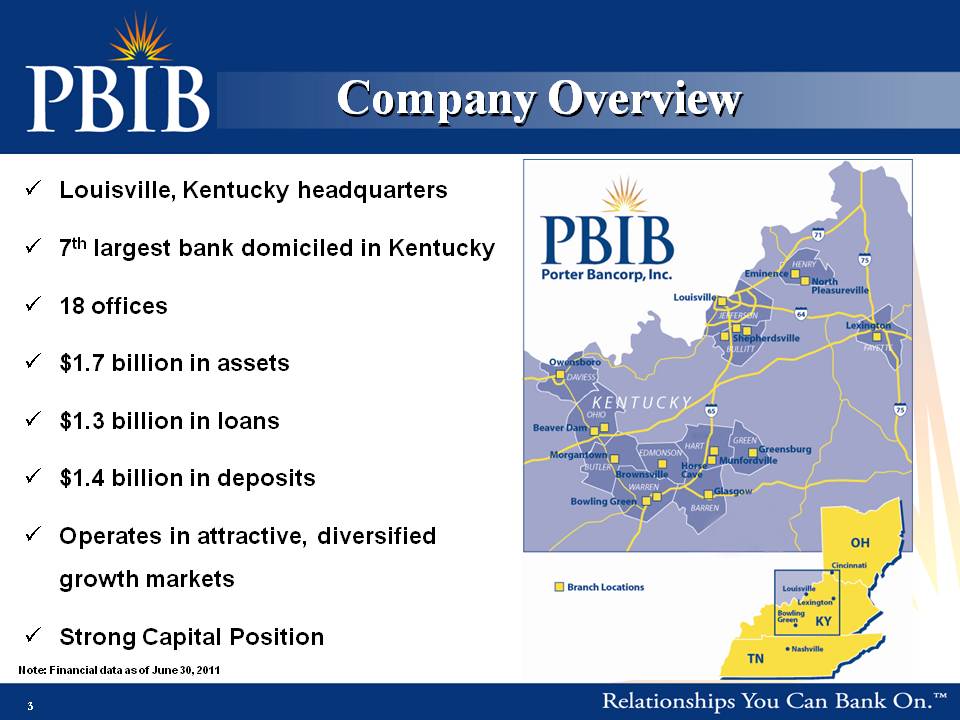
Company Overview Louisville, Kentucky headquarters7th largest bank domiciled in Kentucky18 offices $1.7 billion in assets$1.3 billion in loans$1.4 billion in depositsOperates in attractive, diversified growth marketsStrong Capital Position Note: Financial data as of June 30, 2011
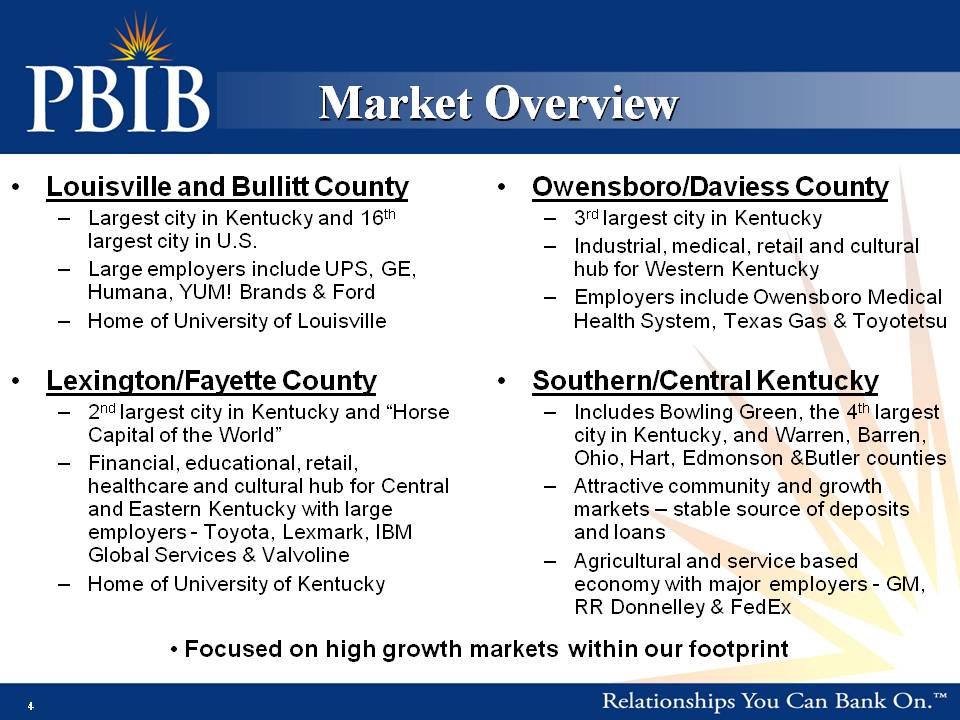
Market Overview Louisville and Bullitt CountyLargest city in Kentucky and 16th largest city in U.S. Large employers include UPS, GE, Humana, YUM! Brands & FordHome of University of LouisvilleLexington/Fayette County2nd largest city in Kentucky and “Horse Capital of the World”Financial, educational, retail, healthcare and cultural hub for Central and Eastern Kentucky with large employers - Toyota, Lexmark, IBM Global Services & ValvolineHome of University of KentuckyBody: Owensboro/Daviess County3rd largest city in KentuckyIndustrial, medical, retail and cultural hub for Western KentuckyEmployers include Owensboro Medical Health System, Texas Gas & ToyotetsuSouthern/Central KentuckyIncludes Bowling Green, the 4th largest city in Kentucky, and Warren, Barren, Ohio, Hart, Edmonson &Butler countiesAttractive community and growth markets – stable source of deposits and loansAgricultural and service based economy with major employers - GM, RR Donnelley & FedEx Focused on high growth markets within our footprint
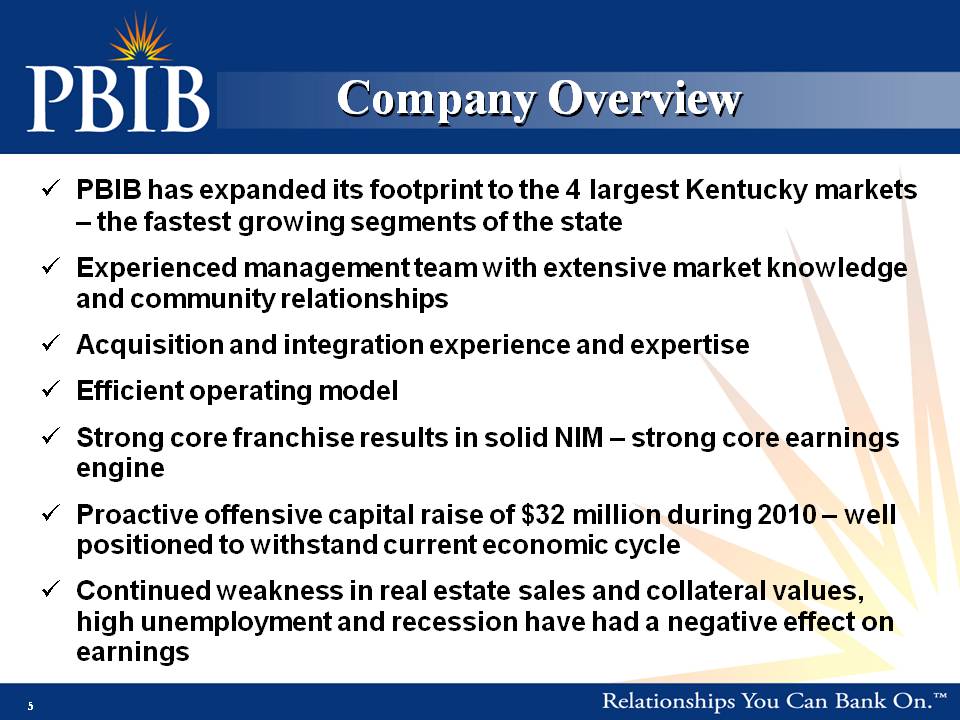
Company Overview PBIB has expanded its footprint to the 4 largest Kentucky markets – the fastest growing segments of the stateExperienced management team with extensive market knowledge and community relationshipsAcquisition and integration experience and expertiseEfficient operating modelStrong core franchise results in solid NIM – strong core earnings engineProactive offensive capital raise of $32 million during 2010 – well positioned to withstand current economic cycleContinued weakness in real estate sales and collateral values, high unemployment and recession have had a negative effect on earnings

Financial Highlights
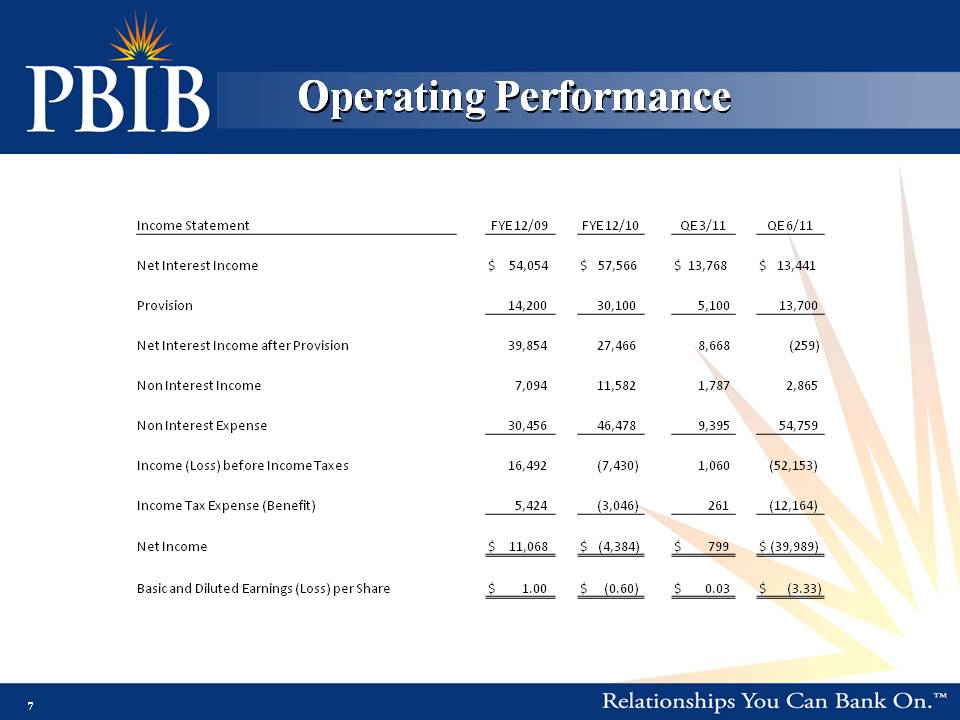
Income Statement FYE 12/09 FYE 12/10 QE 3/11 QE 6/11 Net Interest Income $ 54,054 $ 57,566 $ 13,768 $ 13,441 Provision 14,200 30,100 5,100 13,700 Net Interest Income after Provision 39,854 27,466 8,668 (259) Non Interest Income 7,094 11,582 1,787 2,865 Non Interest Expense 30,456 46,478 9,395 54,759 Income (Loss) before Income Taxes 16,492 (7,430) 1,060 (52,153) Income Tax Expense (Benefit) 5,424 (3,046) 261 (12,164) Net Income $ 11,068 $ (4,384) $ 799 $ (39,989) Basic and Diluted Earnings (Loss) per Share $ 1.00 $ (0.60) $ 0.03 $ (3.33)
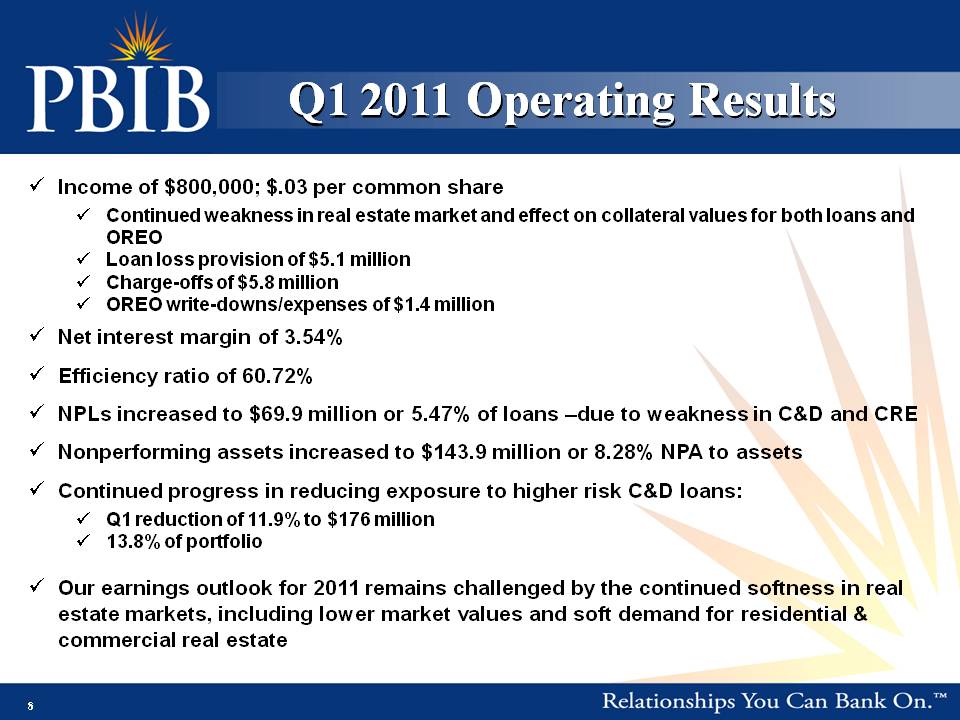
Q1 2011 Operating Results Income of $800,000; $.03 per common shareContinued weakness in real estate market and effect on collateral values for both loans and OREO Loan loss provision of $5.1 million Charge-offs of $5.8 millionOREO write-downs/expenses of $1.4 million Net interest margin of 3.54%Efficiency ratio of 60.72%NPLs increased to $69.9 million or 5.47% of loans –due to weakness in C&D and CRENonperforming assets increased to $143.9 million or 8.28% NPA to assetsContinued progress in reducing exposure to higher risk C&D loans:Q1 reduction of 11.9% to $176 million13.8% of portfolioOur earnings outlook for 2011 remains challenged by the continued softness in real estate markets, including lower market values and soft demand for residential & commercial real estate
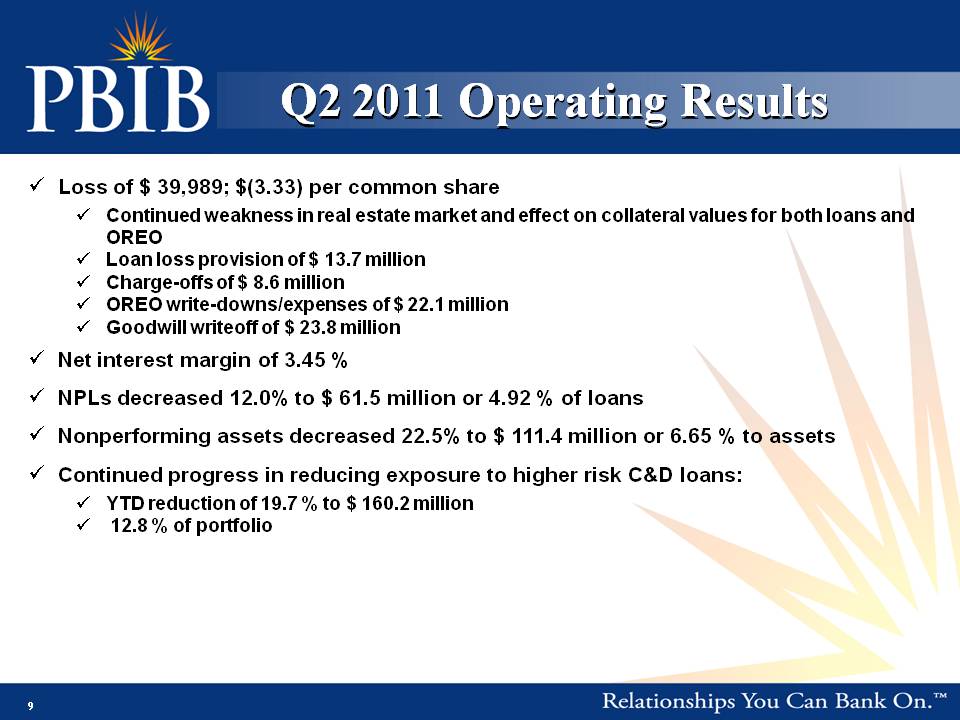
Q2 2011 Operating Results Loss of $ 39,989; $(3.33) per common shareContinued weakness in real estate market and effect on collateral values for both loans and OREO Loan loss provision of $ 13.7 million Charge-offs of $ 8.6 millionOREO write-downs/expenses of $ 22.1 million Goodwill writeoff of $ 23.8 millionNet interest margin of 3.45 %NPLs decreased 12.0% to $ 61.5 million or 4.92 % of loans Nonperforming assets decreased 22.5% to $ 111.4 million or 6.65 % to assetsContinued progress in reducing exposure to higher risk C&D loans:YTD reduction of 19.7 % to $ 160.2 million 12.8 % of portfolio
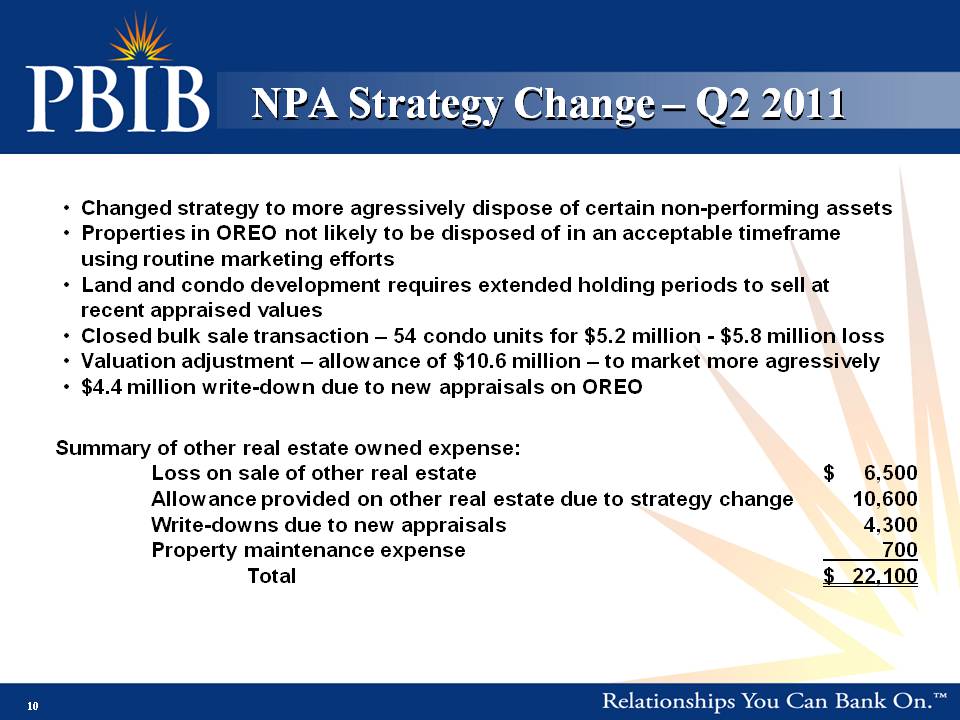
Changed strategy to more agressively dispose of certain non-performing assetsProperties in OREO not likely to be disposed of in an acceptable timeframe using routine marketing effortsLand and condo development requires extended holding periods to sell at recent appraised valuesClosed bulk sale transaction – 54 condo units for $5.2 million - $5.8 million lossValuation adjustment – allowance of $10.6 million – to market more agressively$4.4 million write-down due to new appraisals on OREO Summary of other real estate owned expense: Loss on sale of other real estate $ 6,500 Allowance provided on other real estate due to strategy change 10,600 Write-downs due to new appraisals 4,300 Property maintenance expense 700 Total $ 22,100
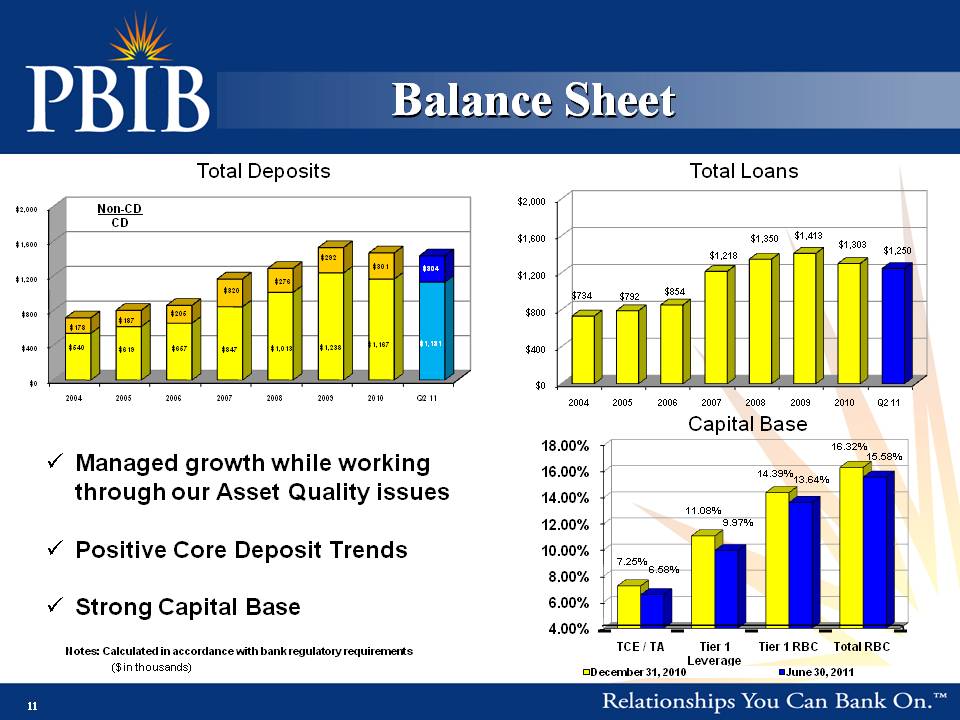
Balance Sheet Capital Base Total Deposits Total Loans ($ in thousands) Managed growth while working through our Asset Quality issuesPositive Core Deposit TrendsStrong Capital Base Notes: Calculated in accordance with bank regulatory requirements Non-CDCD
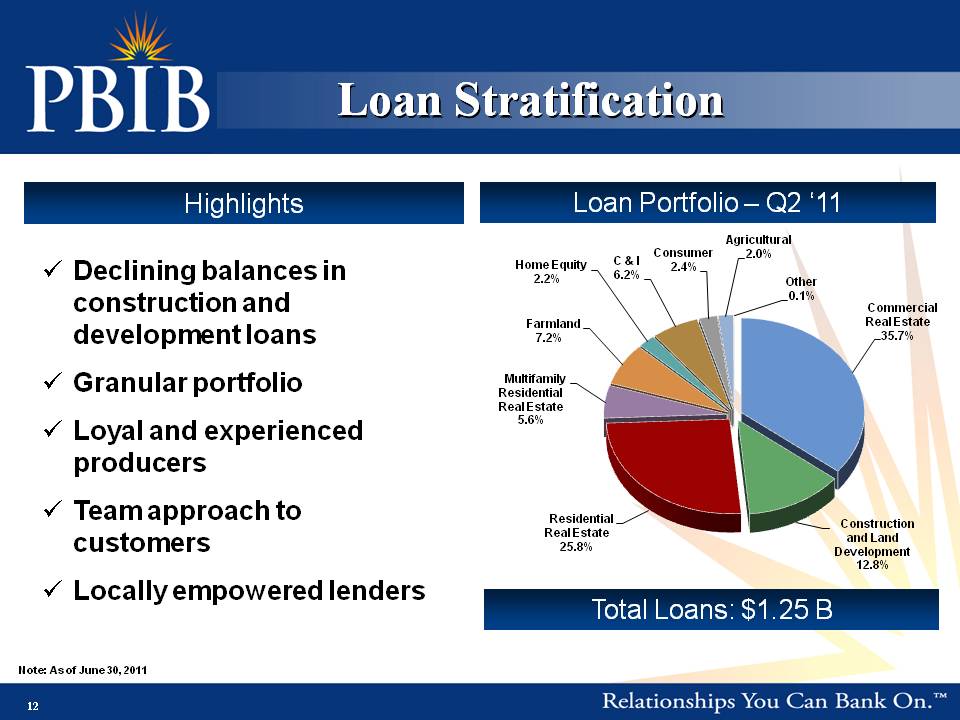
Declining balances in construction and development loansGranular portfolioLoyal and experienced producersTeam approach to customersLocally empowered lenders Loan Portfolio – Q2 ‘11 Total Loans: $1.25 B Loan Stratification Highlights Note: As of June 30, 2011
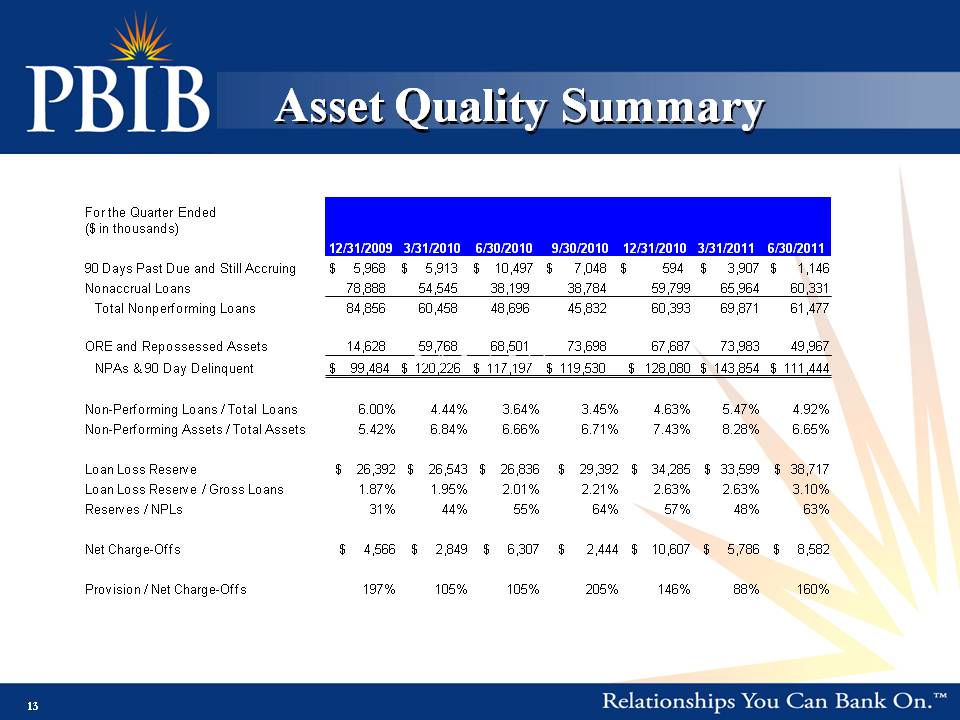
For the Quarter Ended ($ in thousands) 90 Days Past Due and Still Accruing $ 5,968 $ 5,913 $ 10,497 $ 7,048 $ 594 $ 3,907 $ 1,146 Nonaccrual Loans 78,888 54,545 38,199 38,784 59,799 65,964 60,331 Total Nonperforming Loans 84 856 60 458 48 696 45 832 60 393 69 871 61 477 84,856 60,458 48,696 45,832 60,393 69,871 61,477 ORE and Repossessed Assets 14,628 59,768 68,501 73,698 67,687 73,983 49,967 NPAs & 90 Day Delinquent $ 99,484 $ 120,226 $ 117,197 $ 119,530 $ 128,080 $ 143,854 $ 111,444 Non-Total 6 00% 4 44% 3 64% 3 45% 4 63% 5 47% 4 92% Non Performing Loans / Loans 6.00% 4.44% 3.64% 3.45% 4.63% 5.47% 4.92% Non-Performing Assets / Total Assets 5.42% 6.84% 6.66% 6.71% 7.43% 8.28% 6.65% Loan Loss Reserve $ 26,392 $ 26,543 $ 26,836 $ 29,392 $ 34,285 $ 33,599 $ 38,717 Loan Loss Reserve / Gross Loans 1.87% 1.95% 2.01% 2.21% 2.63% 2.63% 3.10% Reserves / NPLs 31% 44% 55% 64% 57% 48% 63% 3 % % 6 % 5 % 8% Net Charge-Offs $ 4,566 $ 2,849 $ 6,307 $ 2,444 $ 10,607 $ 5,786 $ 8,582 Provision / Net Charge-Offs 197% 105% 105% 205% 146% 88% 160%
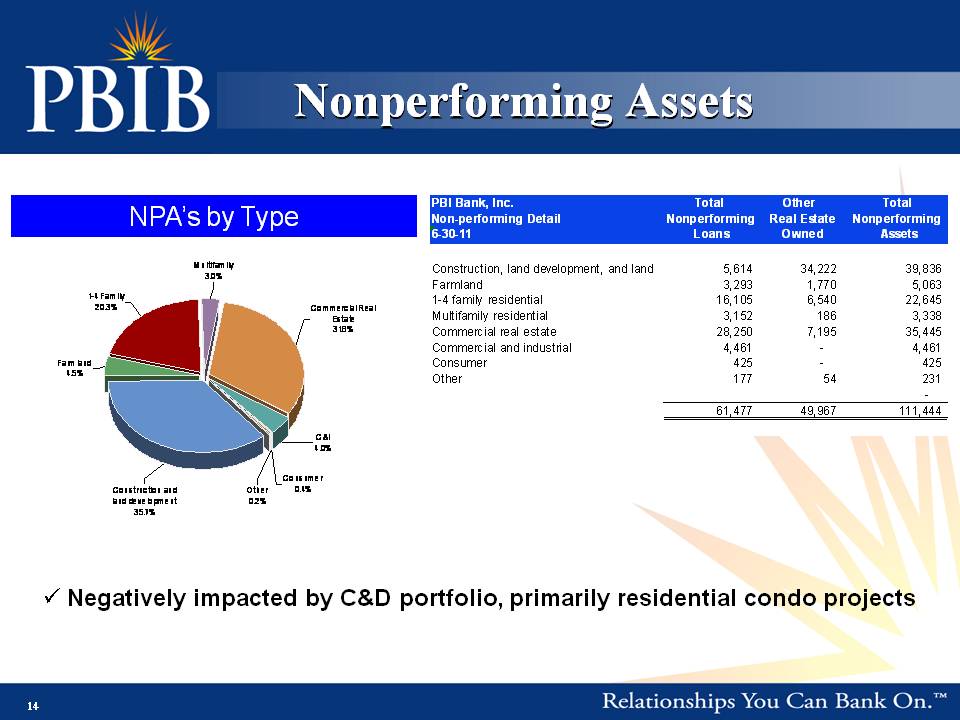
Nonperforming Assets NPA’s by Type Negatively impacted by C&D portfolio, primarily residential condo projects
Focus on Asset Quality Improvement #1 strategic priority – OREO disposition and NPL reductionsSignificant expansion and reorganization of Credit DivisionNew Chief Credit OfficerExpansion of dedicated workout specialists - OREO/Special Assets team Underwriting/Credit Analysis – expanded portfolio management team to assist loan officers Continued critical review of loan portfolio valuations (new appraisals)Solid workout plans in placeFocus on reducing C&D and CRE loan concentrationsWork with borrowers on understanding project viability and gaining control of collateralEssential problem solving as it helps to avoid the lagging legal systemProtects equity in the property and allows us to control ultimate disposition of propertyPBIB is a motivated seller with buyer programs availableContinued negative economic factors (unemployment, growth, etc.) could result in slower pace of improvement and continued decline in collateral valuesOur markets are still challenged and borrowers continue to struggle
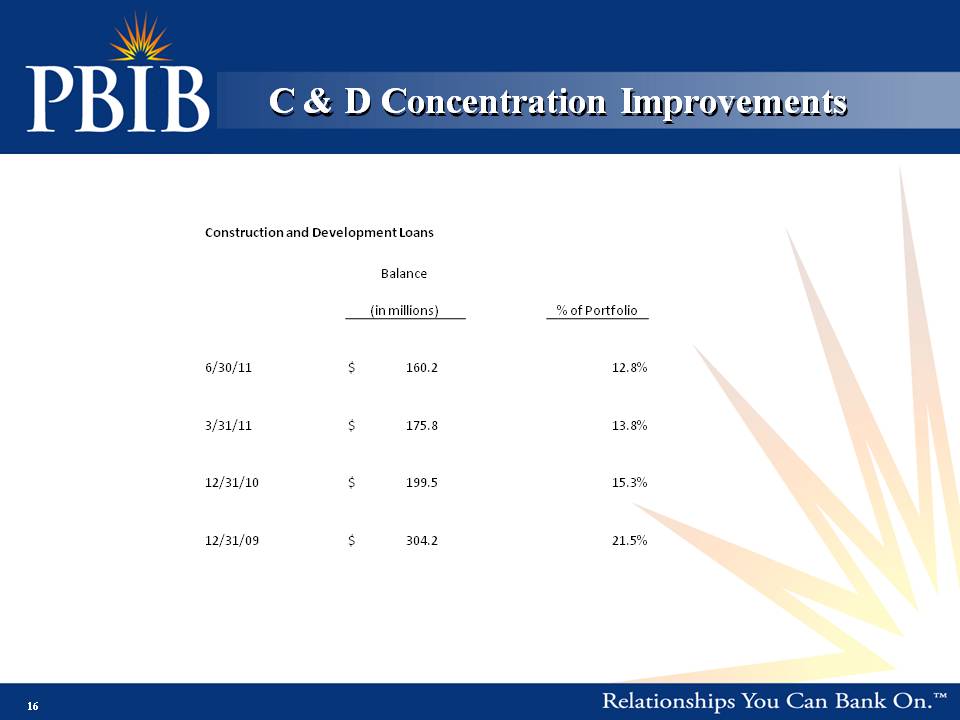
Construction and Development Loans Balance (in millions) % of Portfolio 6/30/11 $ 160.2 12.8% 3/31/11 $ 175.8 13.8% 12/31/10 $ 199.5 15.3% 12/31/09 $ 304.2 21.5%
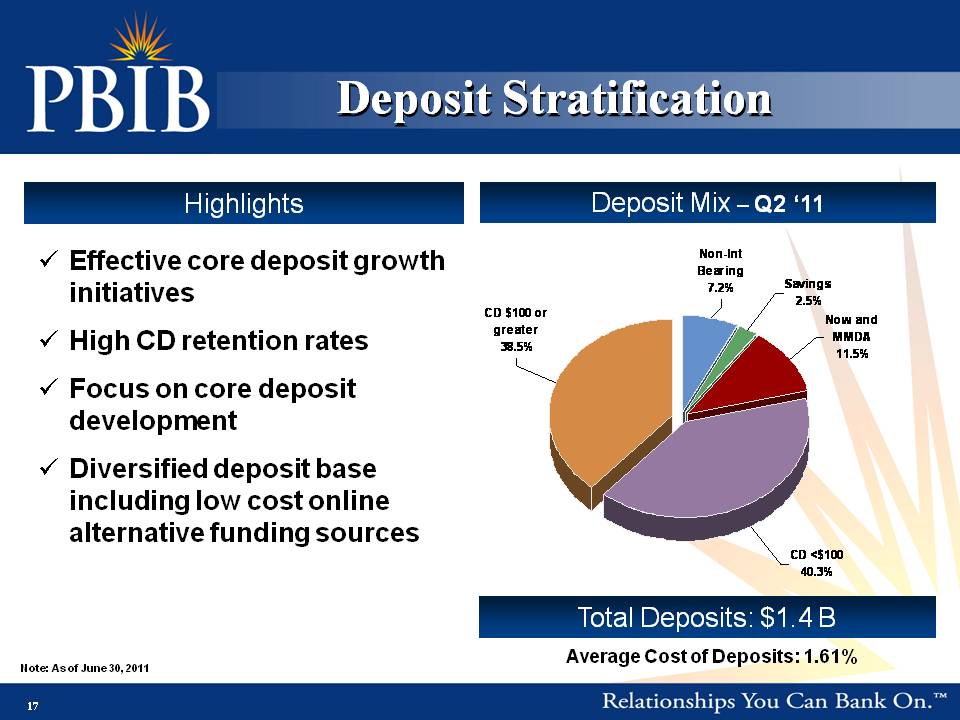
Deposit Mix – Q2 ‘11 Total Deposits: $1.4 B Effective core deposit growth initiativesHigh CD retention ratesFocus on core deposit developmentDiversified deposit base including low cost online alternative funding sources Deposit Stratification Highlights Note: As of June 30, 2011 Average Cost of Deposits: 1.61%
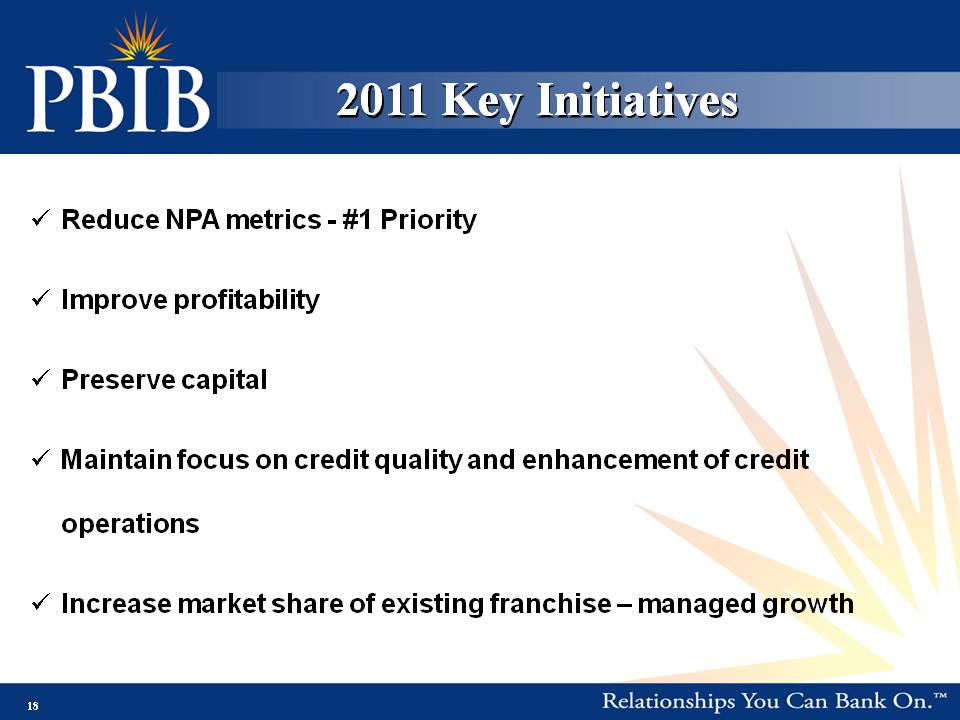
2011 Key Initiatives Reduce NPA metrics - #1 PriorityImprove profitabilityPreserve capitalMaintain focus on credit quality and enhancement of credit operationsIncrease market share of existing franchise – managed growth
Addendum
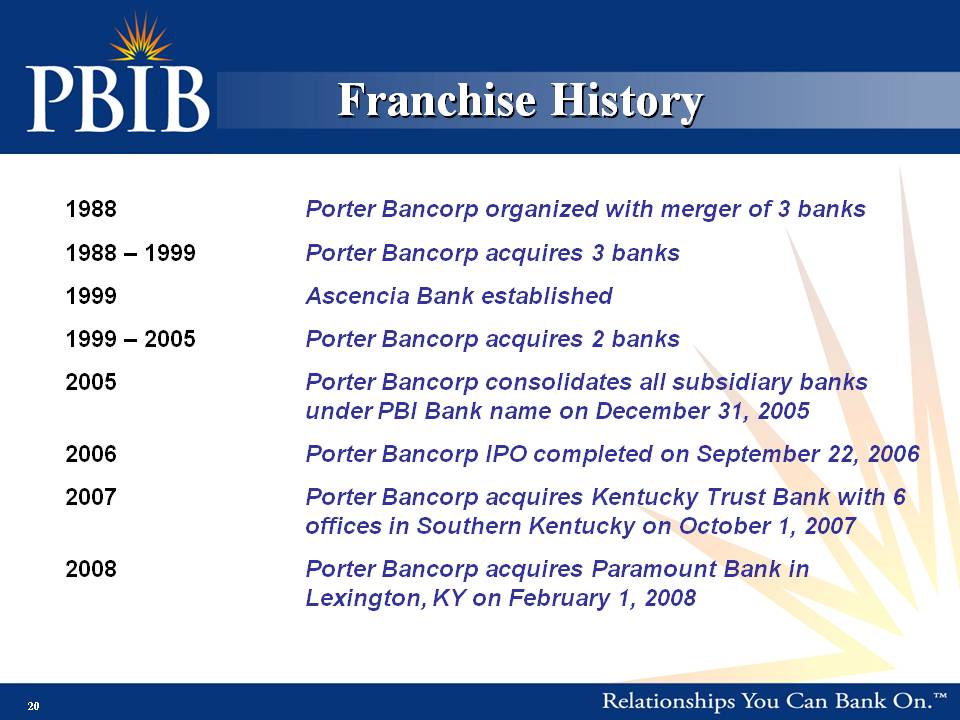
Franchise History Porter Bancorp organized with merger of 3 banks1988 – 1999 Porter Bancorp acquires 3 banks Ascencia Bank established1999 – 2005 Porter Bancorp acquires 2 banks Porter Bancorp consolidates all subsidiary banks under PBI Bank name on December 31, 2005 Porter Bancorp IPO completed on September 22, 2006 Porter Bancorp acquires Kentucky Trust Bank with 6 offices in Southern Kentucky on October 1, 2007 Porter Bancorp acquires Paramount Bank in Lexington, KY on February 1, 2008
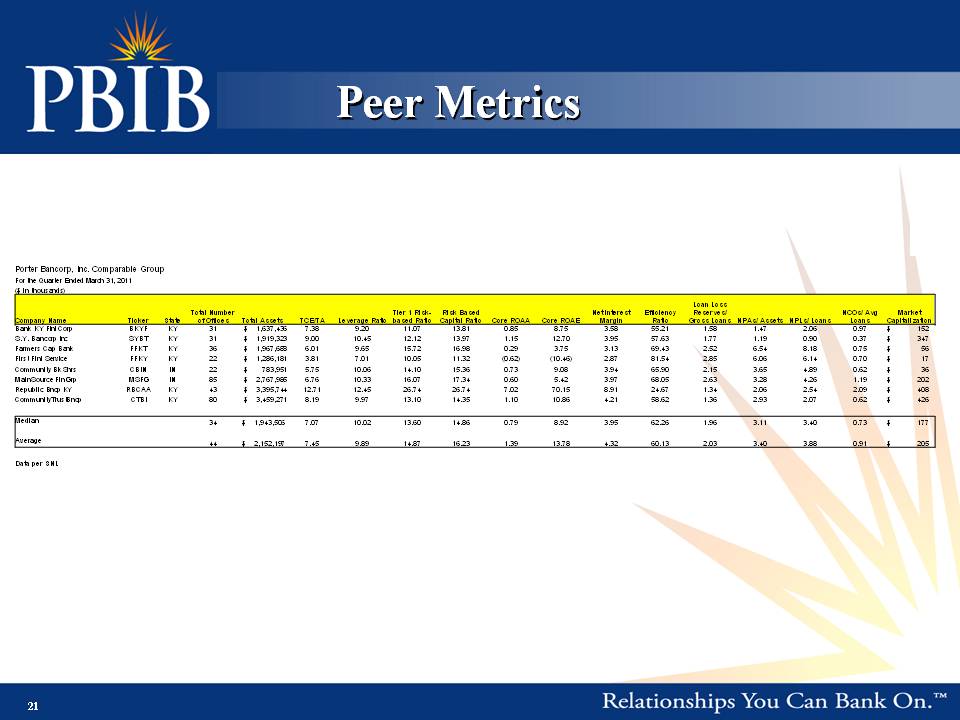
Porter Bancorp, Inc. Comparable Group For the Quarter Ended March 31, 2011 ($ in thousands) Loan Loss Company Name Ticker State Total Number of Offices Total Assets TCE/TA Leverage Ratio Tier 1 Riskbased Ratio Risk Based Capital Ratio Core ROAA Core ROAE Net Interest Margin Efficiency Ratio Reserves/ Gross Loans NPAs/ Assets NPLs/ Loans NCOs/ Avg Loans Market Capitalization Bank KY Finl Corp BKYF KY 31 $ 1,637,436 7.38 9.20 11.07 13.81 0.85 8.75 3.58 55.21 1.58 1.47 2.06 0.97 $ 152 S.Y. Bancorp Inc SYBT KY 31 $ 1,919,323 9.00 10.45 12.12 13.97 1.15 12.70 3.95 57.63 1.77 1.19 0.90 0.37 $ 347 Farmers Cap Bank FFKT KY 36 $ 1,967,688 6.01 9.65 15.72 16.98 0.29 3.75 3.13 69.43 2.52 6.54 8.18 0.75 $ 56 First Finl Service FFKY KY 22 $ 1,286,181 3.81 7.01 10.05 11.32 (0.62) (10.46) 2.87 81.54 2.85 6.06 6.14 0.70 $ 17 Community Bk Shrs CBIN IN 22 $ 783,951 5.75 10.06 14.10 15.36 0.73 9.08 3.94 65.90 2.15 3.65 4.89 0.62 $ 36 MainSource Fin Grp MSFG IN 85 $ 2,767,985 6.76 10.33 16.07 17.34 0.60 5.42 3.97 68.05 2.63 3.28 4.26 1.19 $ 202 Republic Bncp KY RBCAA KY 43 $ 3,395,744 12.71 12.45 26.74 26.74 7.02 70.15 8.91 24.67 1.34 2.06 2.54 2.09 $ 408 CommunityTrustBncp CTBI KY 80 $ 3,459,271 8.19 9.97 13.10 14.35 1.10 10.86 4.21 58.62 1.36 2.93 2.07 0.62 $ 426 Median 34 $ 1,943,506 7.07 10.02 13.60 14.86 0.79 8.92 3.95 62.26 1.96 3.11 3.40 0.73 $ 177 Average 44 $ 2,152,197 7.45 9.89 14.87 16.23 1.39 13.78 4.32 60.13 2.03 3.40 3.88 0.91 $ 205
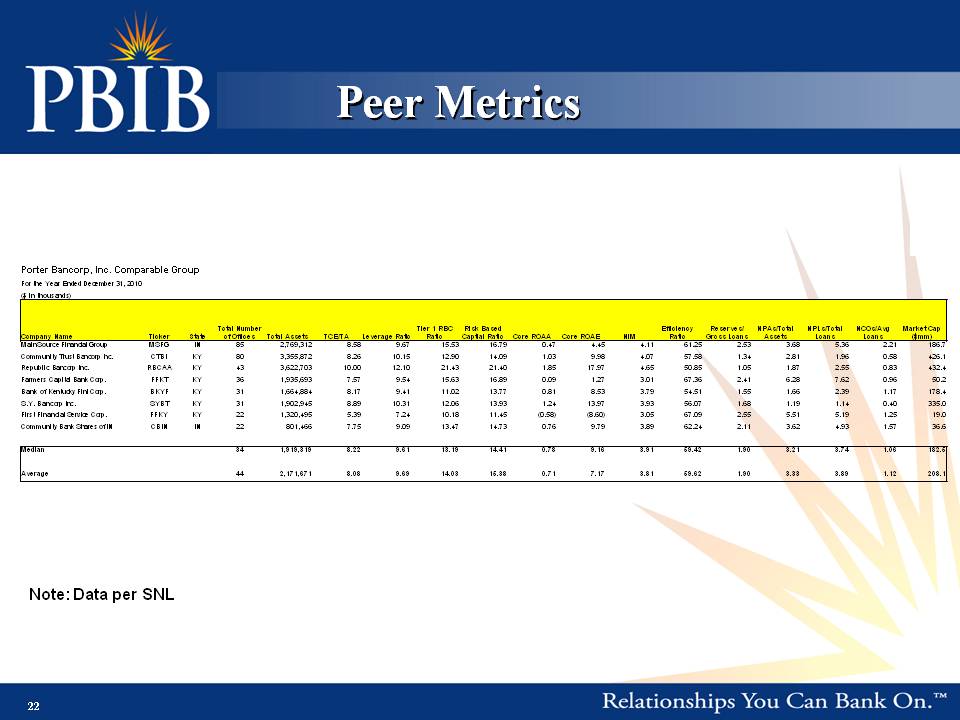
Porter Bancorp, Inc. Comparable Group For the Year Ended December 31, 2010 ($ in thousands) Company Name Ticker State Total Number of Offices Total Assets TCE/TA Leverage Ratio Tier 1 RBC Ratio Risk Based Captial Ratio Core ROAA Core ROAE NIM Efficiency Ratio Reserves/ Gross Loans NPAs/Total Assets NPLs/Total Loans NCOs/Avg Loans Market Cap ($mm) MainSource Financial Group MSFG IN 85 2,769,312 8.58 9.67 15.53 16.79 0.47 4.45 4.11 61.25 2.53 3.68 5.36 2.21 186.7 Community Trust Bancorp Inc. CTBI KY 80 3,355,872 8.26 10.15 12.90 14.09 1.03 9.98 4.07 57.58 1.34 2.81 1.96 0.58 426.1 Republic Bancorp Inc. RBCAA KY 43 3,622,703 10.00 12.10 21.43 21.40 1.85 17.97 4.65 50.85 1.05 1.87 2.55 0.83 432.4 Farmers Capital Bank Corp. FFKT KY 36 1,935,693 7.57 9.54 15.63 16.89 0.09 1.27 3.01 67.36 2.41 6.28 7.62 0.96 50.2 Bank of Kentucky Finl Corp. BKYF KY 31 1,664,884 8.17 9.41 11.02 13.77 0.81 8.53 3.79 54.51 1.55 1.66 2.39 1.17 178.4 S.Y. Bancorp Inc. SYBT KY 31 1,902,945 8.89 10.31 12.06 13.93 1.24 13.97 3.93 56.07 1.68 1.19 1.14 0.40 335.0 First Financial Service Corp. FFKY KY 22 1,320,495 5.39 7.24 10.18 11.45 (0.58) (8.60) 3.05 67.09 2.55 5.51 5.19 1.25 19.0 Community Bank Shares of IN CBIN IN 22 801,466 7.75 9.09 13.47 14.73 0.76 9.79 3.89 62.24 2.11 3.62 4.93 1.57 36.6 Median 34 1,919,319 8.22 9.61 13.19 14.41 0.78 9.16 3.91 59.42 1.90 3.21 3.74 1.06 182.5 Average 44 2,171,671 8.08 9.69 14.03 15.38 0.71 7.17 3.81 59.62 1.90 3.33 3.89 1.12 208.1 Note: Data per SNL 22
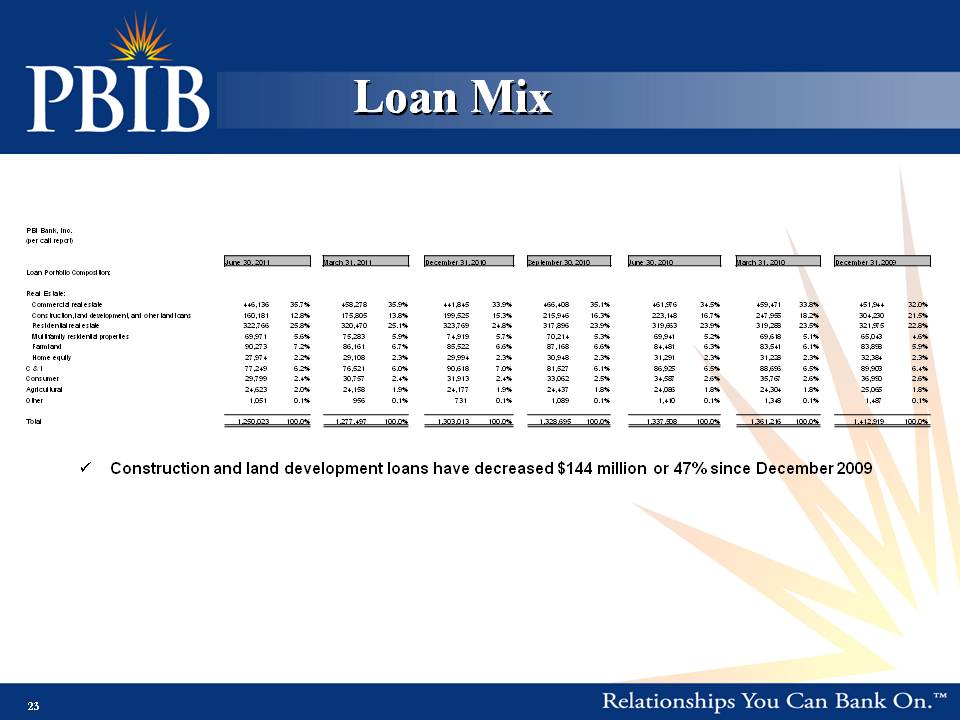
PBI Bank, Inc. (per call report) June 30, 2011 March 31, 2011 December 31, 2010 September 30, 2010 June 30, 2010 March 31, 2010 December 31, 2009 Loan Portfolio Composition: Real Estate: Commercial real estate 446,136 35.7% 458,278 35.9% 441,845 33.9% 466,408 35.1% 461,976 34.5% 459,471 33.8% 451,944 32.0% Construction, land development, and other land loans 160,181 12.8% 175,805 13.8% 199,525 15.3% 215,946 16.3% 223,148 16.7% 247,955 18.2% 304,230 21.5% Residential real estate 322,766 25.8% 320,470 25.1% 323,769 24.8% 317,896 23.9% 319,663 23.9% 319,288 23.5% 321,975 22.8% Multifamily residential properties 69,971 5.6% 75,283 5.9% 74,919 5.7% 70,214 5.3% 69,941 5.2% 69,618 5.1% 65,043 4.6% Farmland 90,273 7.2% 86,161 6.7% 85,522 6.6% 87,168 6.6% 84,481 6.3% 83,541 6.1% 83,898 5.9% Home equity 27,974 2.2% 29,108 2.3% 29,994 2.3% 30,948 2.3% 31,291 2.3% 31,228 2.3% 32,384 2.3% C & I 77,249 6.2% 76,521 6.0% 90,618 7.0% 81,527 6.1% 86,925 6.5% 88,696 6.5% 89,903 6.4% Consumer 29,799 2.4% 30,757 2.4% 31,913 2.4% 33,062 2.5% 34,587 2.6% 35,767 2.6% 36,990 2.6% Agricultural 24,623 2.0% 24,158 1.9% 24,177 1.9% 24,437 1.8% 24,086 1.8% 24,304 1.8% 25,065 1.8% Other 1,051 0.1% 956 0.1% 731 0.1% 1,089 0.1% 1,410 0.1% 1,348 0.1% 1,487 0.1% �� Construction and land development loans have decreased $144 million or 47% since December 2009
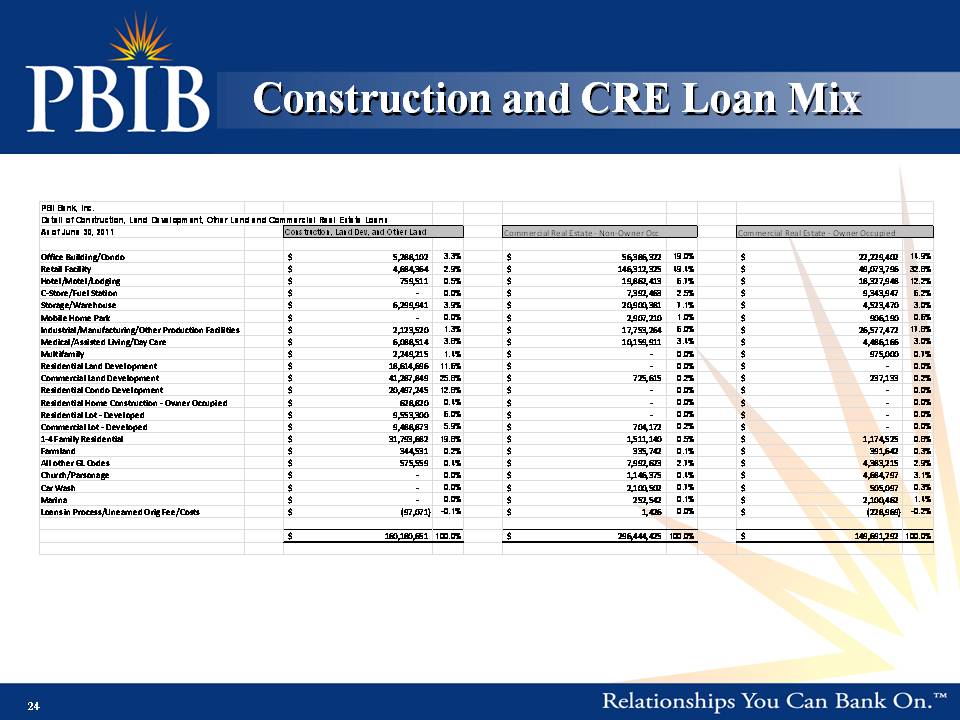
PBI B k I Bank, Inc. Detail of Construction, Land Development, Other Land and Commercial Real Estate Loans As of June 30, 2011 Construction, Land Dev, and Other Land Commercial Real Estate ‐ Non‐Owner Occ Commercial Real Estate ‐ Owner Occupied Office Building/Condo 5,288,102 $ 3.3% 56,386,322 $ 19.0% 22,229,402 $ 14.9% Retail Facility 4,684,364 $ 2.9% 146,312,325 $ 49.4% 49,073,796 $ 32.8% Hotel/Motel/Lodging 759,511 $ 0.5% 19,862,413 $ 6.7% 18,327,948 $ 12.2% C‐Store/Fuel Station ‐ $ 0.0% 7,392,463 $ 2.5% 9,343,947 $ 6.2% Storage/Warehouse 6,299,941 $ 3.9% 20,900,381 $ 7.1% 4,523,470 $ 3.0% Mobile Home Park ‐ $ 0.0% 2,907,210 $ 1.0% 906,190 $ 0.6% Industrial/Manufacturing/Other Production Facilities 2,123,520 $ 1.3% 17,753,264 $ 6.0% 26,577,472 $ 17.8% Medical/Assisted Living/Day Care 6,088,514 $ 3.8% 10,159,911 $ 3.4% 4,486,166 $ 3.0% Multifamily 2,249,215 $ 1.4% ‐ $ 0.0% 975,000 $ 0.7% Residential Land Development 18,614,696 $ 11.6% ‐ $ 0.0% ‐ $ 0.0% Commercial Land Development 41,287,849 $ 25.8% 725,615 $ 0.2% 237,133 $ 0.2% Residential Condo Development 20,497,245 $ 12.8% ‐ $ 0.0% ‐ $ 0.0% Residential Home Construction ‐ Owner Occupied 628,820 $ 0.4% ‐ $ 0.0% ‐ $ 0.0% Residential Lot ‐ Developed 9,553,300 $ 6.0% ‐ $ 0.0% ‐ $ 0.0% Commercial Lot ‐ Developed 9,488,873 $ 5.9% 704,172 $ 0.2% ‐ $ 0.0% 1‐4 Family Residential 31,793,682 $ 19.8% 1,511,140 $ 0.5% 1,174,525 $ 0.8% Farmland 344,531 $ 0.2% 335,742 $ 0.1% 391,642 $ 0.3% All other GL Codes 575,559 $ 0.4% 7,992,623 $ 2.7% 4,383,215 $ 2.9% Church/Parsonage ‐ $ 0.0% 1,146,375 $ 0.4% 4,684,797 $ 3.1% Car Wash ‐ $ 0.0% 2,100,502 $ 0.7% 505,097 $ 0.3% Marina ‐ $ 0.0% 252,542 $ 0.1% 2,100,462 $ 1.4% Loans Process/Unearned (97 071) $ -0.1% 1 426 $ 0.0% (228 969) $ -0.2% in Orig Fee/Costs 97,071) 1,426 228,969) 160,180,651 $ 100.0% 296,444,425 $ 100.0% 149,691,292 $ 100.0%