Attached files
Table of Contents
UNITED STATES
SECURITIES AND EXCHANGE COMMISSION
WASHINGTON, D.C. 20549
FORM 10-K
(Mark One)
| x | ANNUAL REPORT PURSUANT TO SECTION 13 OR 15(d) OF THE SECURITIES EXCHANGE ACT OF 1934 |
For the Fiscal Year Ended December 31, 2009
OR
| ¨ | TRANSITION REPORT PURSUANT TO SECTION 13 OR 15(d) OF THE SECURITIES EXCHANGE ACT OF 1934 |
For the transition period from to
Commission file number: 001-33033
PORTER BANCORP, INC.
(Exact name of registrant as specified in its charter)
| Kentucky | 61-1142247 | |
| (State or other jurisdiction of incorporation or organization) |
(I.R.S. Employer Identification No.) |
| 2500 Eastpoint Parkway, Louisville, Kentucky | 40223 | |
| (Address of principal executive offices) | (Zip Code) |
Registrant’s telephone number, including area code: (502) 499-4800
Securities registered pursuant to Section 12(b) of the Act:
| Title of each class |
Name of each exchange on which registered | |
| Common Stock, no par value | NASDAQ Global Market |
Securities registered pursuant to Section 12(g) of the Act:
None
Indicate by check mark if the registrant is a well-known seasoned issuer (as defined in Rule 405 of the Securities Act). Yes ¨ No x
Indicate by check mark if the registrant is not required to file reports pursuant to Section 13 or Section 15(d) of the Act. Yes ¨ No x
Indicate by check mark whether the registrant (1) has filed all reports required to be filed by Section 13 or 15(d) of the Securities Exchange Act of 1934 during the preceding 12 months (or for shorter period that the registrant was required to file such reports), and (2) has been subject to such filing requirements for the past 90 days. Yes x No ¨
Indicate by check mark whether the registrant has submitted electronically and posted on its corporate Web site, if any, every Interactive Data File required to be submitted and posted pursuant to Rule 405 of Regulation S-T (§ 232.405 of this chapter) during the preceding 12 months (or for such shorter period that the registrant was required to submit and post such files). Yes ¨ No ¨
Indicate by check mark if disclosure of delinquent filers pursuant to Item 405 of Regulation S-K is not contained herein, and will not be contained, to the best of registrant’s knowledge, in definitive proxy or information statements incorporated by reference in Part III of this Form 10-K or any amendment to this Form 10-K. ¨
Indicate by check mark whether the registrant is a large accelerated filer, an accelerated filer, a non-accelerated filer, or a smaller reporting company. See definition of “accelerated filer”, “large accelerated filer” and “smaller reporting company” in Rule 12b-2 of the Exchange Act. (Check one):
Large accelerated filer ¨ Accelerated filer ¨ Non-accelerated filer x Smaller reporting company ¨
Indicate by check mark whether the registrant is a shell company (as defined in Rule 12b-2 of the Exchange Act). Yes ¨ No x
The aggregate market value of the voting common equity held by non-affiliates computed by reference to the price at which the common equity was last sold as of the close of business on June 30, 2009, was $41,673,750 based upon the last sales price reported for such date on the NASDAQ Global Market.
The number of shares outstanding of the registrant’s Common Stock, no par value, as of February 28, 2010, was 8,756,259.
DOCUMENTS INCORPORATED BY REFERENCE
Portions of the registrant’s Proxy Statement for the Annual Meeting of Shareholders to be held May 20, 2010 are incorporated by reference into Part III of this Form 10-K.
Table of Contents
Table of Contents
Preliminary Note Concerning Forward-Looking Statements
This report contains statements about the future expectations, activities and events that constitute forward-looking statements. Forward-looking statements express our beliefs, assumptions and expectations of our future financial and operating performance and growth plans, taking into account information currently available to us. These statements are not statements of historical fact. The words “believe,” “may,” “should,” “anticipate,” “estimate,” “expect,” “intend,” “objective,” “seek,” “plan,” “strive” or similar words, or the negatives of these words, identify forward-looking statements.
Forward-looking statements involve risks and uncertainties that may cause our actual results to differ materially from the expectations of future results we expressed or implied in any forward-looking statements. These risks and uncertainties can be difficult to predict and may be out of our control. Factors that could contribute to differences in our results include, but are not limited to our ability to expand and grow our business and operations, including the establishment of additional banking offices and acquisition of additional banks, and our ability to realize the cost savings and revenue enhancements we expect from such activities; changes in the interest rate environment, which may reduce our margins or impact the value of securities, loans, deposits and other financial instruments; general economic or business conditions, either nationally, regionally or locally in the communities we serve, may be worse than expected, resulting in, among other things, a deterioration in credit quality or a reduced demand for credit; the continued service of key management personnel; our ability to attract, motivate and retain qualified employees; factors that increase the competitive pressure among depository and other financial institutions, including product and pricing pressures; the ability of our competitors with greater financial resources to develop and introduce products and services that enable them to compete more successfully than us; legislative or regulatory developments, including changes in laws concerning taxes, banking, securities, insurance and other aspects of the financial services industry; and fiscal and governmental policies of the United States federal government.
Other risks are detailed in Item 1A. “Risk Factors” of this Form 10-K all of which are difficult to predict and many of which are beyond our control.
Forward-looking statements are not guarantees of performance or results. A forward-looking statement may include the assumptions or bases underlying the forward-looking statement. We have made our assumptions and bases in good faith and believe they are reasonable. We caution you however, that estimates based on such assumptions or bases frequently differ from actual results, and the differences can be material. The forward-looking statements included in this report speak only as of the date of the report. We do not intend to update these statements unless applicable laws require us to do so.
| Item 1. | Business |
Overview
We are a bank holding company headquartered in Louisville, Kentucky. We are the sixth largest independent banking organization domiciled in the state of Kentucky based on total assets. Through our subsidiary PBI Bank, we operate 18 full-service banking offices in 12 counties in Kentucky. Our markets include metropolitan Louisville in Jefferson County and the surrounding counties of Henry and Bullitt, and extend south along the Interstate 65 corridor to Tennessee. We serve south central Kentucky and southern Kentucky from banking offices in Butler, Green, Hart, Edmonson, Barren, Warren, Ohio, and Daviess Counties. We also have an office in Lexington, Kentucky, the second largest city in Kentucky. PBI Bank is both a traditional community bank with a wide range of commercial and personal banking products, with a focus on commercial real estate and residential real estate lending, and an innovative on-line bank which delivers competitive deposit products and services through an on-line banking division operating under the name of Ascencia. As of December 31, 2009, we had total assets of $1.8 billion, total net loans of $1.4 billion, total deposits of $1.5 billion and stockholders’ equity of $169 million.
History
We were organized in 1988, and historically conducted our banking business through separate community banks under the common control of J. Chester Porter, our chairman, and Maria L. Bouvette, our president and chief executive officer. In 2004, we began to streamline our operations by consolidating our subsidiary banks under common control into a single bank. We completed our reorganization on December 31, 2005, when we acquired the interests of other shareholders in our three partially owned subsidiary bank holding companies in exchange for shares of our common stock, cash and indebtedness. Before December 31, 2005, our company and one of our subsidiary banks were S corporations for federal income tax purposes. Following the consolidation of our four subsidiary banks and the termination of our S corporation elections on December 31, 2005, all of our taxable income became subject to federal income taxes beginning in 2006, which caused our income tax expense to increase compared to the preceding years. See “Item 6. Selected Financial Data – Unaudited Pro Forma Selected Consolidated Financial Data” for more about the consolidation. On December 31, 2005, we also renamed our consolidated subsidiary PBI Bank to create a single brand name for our banking operations throughout our market area.
1
Table of Contents
On September 21, 2006, we completed an initial public offering of 1,550,000 shares of common stock. We sold 1,250,000 newly issued shares of common stock for an aggregate purchase price of $30.0 million, and J. Chester Porter and Maria L. Bouvette, our controlling shareholders, together sold 300,000 shares of common stock for an aggregate purchase price of $7.2 million for their own accounts. We received proceeds of $26.6 million, after deducting total expenses of $3.4 million, which consisted of $2.1 million in underwriters’ discounts and commissions and $1.3 million of other expenses.
We completed the acquisition of Ohio County Bancshares, Inc., the holding company for Kentucky Trust Bank, effective October 1, 2007. At the time of the closing, Kentucky Trust Bank operated six retail banking offices in three Kentucky counties, including the Bowling Green and Owensboro markets, and had assets of approximately $120 million. The total acquisition price paid was $12 million, approximately 50% in cash and 50% in Porter Bancorp shares totaling 263,409 shares.
We completed the acquisition of Paramount Bank in Lexington, Kentucky, effective February 1, 2008. Paramount had approximately $75 million in assets and $76 million in deposits. The total acquisition price paid was approximately $5 million in cash.
Our Markets
We operate in markets that include the four largest cities in Kentucky – Louisville, Lexington, Owensboro and Bowling Green – and in other communities along the I-65 corridor.
| • | Louisville/Jefferson, Bullitt and Henry Counties: Our headquarters are in Louisville, the largest city in Kentucky and the sixteenth largest city in the United States. The Louisville metropolitan area includes the consolidated Louisville/Jefferson County and 12 surrounding Kentucky and Southern Indiana counties with an estimated 1.2 million residents in 2007. We also have banking offices in Bullitt County, south of Louisville, and Henry County, east of Louisville. Our six banking offices in these counties also serve the contiguous counties of Spencer, Shelby and Oldham to the east and northeast of Louisville. The area’s employers are diversified across many industries and include the air hub for United Parcel Service (“UPS”), two Ford assembly plants, General Electric’s Consumer and Industrial division, Humana, Norton Healthcare, Brown-Forman and YUM! Brands. |
| • | Lexington/Fayette County: Lexington, located in Fayette County, is the second largest city in Kentucky with an estimated countywide population of over 270,000 in 2006, an increase of 3.9% since the 2000 census. Lexington is the financial, educational, retail, healthcare and cultural hub for Central and Eastern Kentucky. It is known worldwide for its Bluegrass horse farms and Keeneland Race Track, and proudly boasts of itself as “The Horse Capital of the World.” It is also the home of the University of Kentucky and Transylvania University. The area’s employers include Toyota, Lexmark, IBM Global Services and Valvoline. |
| • | Owensboro/Daviess County: Owensboro, located on the banks of the Ohio River, is Kentucky’s third largest city. Daviess County had an estimated countywide population of approximately 94,000 in 2006. The city is called a festival city, with over 20 annual community celebrations that attract visitors from around the world, including its world famous Bar-B-Q Festival which attracts over 80,000 visitors giving Owensboro recognition as “The Bar-B-Q Capital of the World”. It is an industrial, medical, retail and cultural hub for Western Kentucky and the area employers include Owensboro Medical System, Texas Gas, US Bank Home Mortgage and Toyotetsu. |
| • | Southern Kentucky: This market includes Bowling Green, the fourth largest city in Kentucky, located about 60 miles north of Nashville, Tennessee. Bowling Green, located in Warren County, is the home of Western Kentucky University and is the economic hub of an estimated labor market of over 425,000 in 2004. This market also includes thriving communities in the contiguous Barren County, including the city of Glasgow. Major employers in Barren and Warren Counties include GM’s Corvette plant and several other automotive facilities and R.R. Donnelley’s regional printing facility. |
| • | South Central Kentucky: South of the Louisville metropolitan area, we have banking offices in Butler, Edmonson, Green, Hart, and Ohio Counties, which had a combined population of approximately 79,000 in 2006. This region includes stable community markets comprised primarily of agricultural and service-based businesses. Each of our banking offices in these markets has a stable customer base and core deposits that are less sensitive to market competition, which provide us a lower cost source of funds for our lending operations. |
Our Products and Services
We meet our customers’ banking needs with a broad range of financial products and services. Our lending services include real estate, commercial, mortgage and consumer loans to small to medium-sized businesses located in our markets, the owners and employees of those businesses, as well as other executives and professionals. We complement our lending operations with an array of retail and commercial deposit products. In addition, we offer our customers drive-through banking facilities, automatic teller machines, night depository, personalized checks, credit cards, debit cards, internet
2
Table of Contents
banking, electronic funds transfers through ACH services, domestic and foreign wire transfers, travelers’ checks, cash management, vault services, loan and deposit sweep accounts and lock box services. Through our trust division, we offer personal trust services, employer retirement plan services and personal financial and retirement planning services.
Employees
At December 31, 2009, the Company had 278 full-time equivalent employees. Our employees are not subject to a collective bargaining agreement, and management considers the Company’s relationship with employees to be good.
Competition
The banking business is highly competitive, and we experience competition in our market from many other financial institutions. Competition among financial institutions is based upon interest rates offered on deposit accounts, interest rates charged on loans, other credit and service charges relating to loans, the quality and scope of the services offered, the convenience of banking facilities and, in the case of loans to commercial borrowers, relative lending limits. We compete with commercial banks, credit unions, savings and loan associations, mortgage banking firms, consumer finance companies, securities brokerage firms, insurance companies, money market funds and other mutual funds, as well as super-regional, national and international financial institutions that operate offices within our market area and beyond.
There are a number of banks that offer services exclusively over the internet, such as ING Bank and E*TRADE Bank, and other banks, such as Bank of America and Wells Fargo Bank that market their internet services to their customers nationwide. We believe that only the very largest of the commercial banks with which we compete offer the comprehensiveness of internet banking services that we are able to offer. However, many of the larger banks do have greater market presence and greater financial resources to market their internet banking services. Additionally, new competitors and competitive factors are likely to emerge, particularly in view of the rapid development of internet commerce. On the other hand, there have been some recently published reports indicating that the actual rate of growth in the use of internet banking services by consumers and businesses is lower than had been previously predicted and that many customers still prefer to be able to conduct at least some of their banking transactions at local banking offices. We believe that these findings support our strategic decision to complement our traditional community bank with our uniquely branded online bank to offer customers the benefits of both traditional and internet banking services. We believe that this strategy will contribute to our growth in the future.
Supervision and Regulation
The following is a summary description of the relevant laws, rules and regulations governing banks and bank holding companies. The descriptions of, and references to, the statutes and regulations below are brief summaries and do not purport to be complete. The descriptions are qualified in their entirety by reference to the specific statutes and regulations discussed.
Porter Bancorp. Porter Bancorp is registered as a bank holding company under the Bank Holding Company Act of 1956, as amended, and is subject to supervision and regulation by the Board of Governors of the Federal Reserve System. As such, we must file with the Federal Reserve Board annual and quarterly reports and other information regarding our business operations and the business operations of our subsidiaries. We are also subject to examination by the Federal Reserve Board and to operational guidelines established by the Federal Reserve Board. We are subject to the Bank Holding Company Act and other federal laws on the types of activities in which we may engage, and to other supervisory requirements, including regulatory enforcement actions for violations of laws and regulations.
Acquisitions. A bank holding company must obtain Federal Reserve Board approval before acquiring, directly or indirectly, ownership or control of more than 5% of the voting stock or all or substantially all of the assets of a bank, merging or consolidating with any other bank holding company and before engaging, or acquiring a company that is not a bank but is engaged in certain non-banking activities. Federal law also prohibits a person or group of persons from acquiring “control” of a bank holding company without notifying the Federal Reserve Board in advance, and then only if the Federal Reserve Board does not object to the proposed transaction. The Federal Reserve Board has established a rebuttable presumptive standard that the acquisition of 10% or more of the voting stock of a bank holding company with a class of securities registered under the Securities Exchange Act of 1934 would constitute an acquisition of control of the bank holding company. In addition, any company is required to obtain the approval of the Federal Reserve Board before acquiring 25% (5% in the case of an acquirer that is a bank holding company) or more of any class of a bank holding company’s voting securities, or otherwise obtaining control or a “controlling influence” over a bank holding company.
Permissible Activities. A bank holding company is generally permitted under the Bank Holding Company Act to engage in or acquire direct or indirect control of more than 5% of the voting shares of any bank, bank holding company or company engaged in any activity that the Federal Reserve Board determines to be so closely related to banking as to be a proper incident to the business of banking.
3
Table of Contents
Under current federal law, a bank holding company may elect to become a financial holding company, which enables the holding company to conduct activities that are “financial in nature.” Activities that are “financial in nature” include securities underwriting, dealing and market making; sponsoring mutual funds and investment companies; insurance underwriting and agency; merchant banking activities; and activities that the Federal Reserve Board has determined to be closely related to banking. No regulatory approval will be required for a financial holding company to acquire a company, other than a bank or savings association, engaged in activities that are financial in nature or incidental to activities that are financial in nature, as determined by the Federal Reserve Board. We have not filed an election to become a financial holding company.
U.S. Treasury Capital Purchase Program. On November 21, 2008, pursuant to the U.S. Department of the Treasury’s (the “U.S. Treasury”) Capital Purchase Program (the “CPP”), established under the Emergency Economic Stabilization Act of 2008 (“EESA”), Porter Bancorp issued and sold to the U.S. Treasury in an offering exempt from registration under Section 4(2) of the Securities Act of 1933, (i) 35,000 shares of Porter Bancorp’ Fixed Rate Cumulative Perpetual Preferred Stock, Series A, no par value and liquidation preference $1,000 per share ($35 million aggregate liquidation preference) (the “Series A Preferred Stock”) and (ii) a warrant (the “Warrant”) to purchase 314,820 shares (adjusted for stock dividend) of Porter Bancorp’s common stock, at an exercise price of $16.68 per share (adjusted for stock dividend), subject to certain anti-dilution and other adjustments for an aggregate purchase price of $35 million in cash. The securities purchase agreement, dated November 21, 2008, pursuant to which the securities issued to the U.S. Treasury under the CPP were sold, limits the payment of dividends on Porter Bancorp’s common stock to the current quarterly dividend of $0.20 per share without prior approval of the U.S. Treasury, limits Porter Bancorp’s ability to repurchase shares of its common stock (with certain exceptions, including the repurchase of our common stock to offset share dilution from equity-based compensation awards) and grants the holders of the Series A Preferred Stock, the Warrant and the common stock of Porter Bancorp to be issued under the Warrant certain registration rights.
The American Recovery and Reinvestment Act (“ARRA”) was enacted on February 17, 2009. ARRA imposes certain new executive compensation and corporate governance obligations on all current and future CPP recipients, including Porter Bancorp, until the institution has redeemed the preferred stock. On June 10, 2009, under the authority granted to it under EESA and ARRA, the U. S. Treasury issued an interim final rule under Section 111 of EESA, as amended by ARRA, regarding compensation and corporate governance restrictions that would be imposed on CPP recipients, effective June 15, 2009. As a CPP recipient with currently outstanding CPP obligations, we are subject to the compensation and corporate governance restrictions and requirements set forth in the interim final rule. The restrictions and requirements provided for in the implementing regulations are generally as follows: (1) required us to establish an independent compensation committee, (2) required us to adopt a corporate policy on luxury or excessive expenditures; (3) requires our compensation committee to conduct semi-annual risk assessments to assure that our compensation arrangements do not encourage “unnecessary and excessive risks” or the manipulation of earnings to increase compensation; (4) requires us to recoup or “clawback” any bonus, retention award or incentive compensation paid by us to a senior executive officer or any of our next 20 most highly compensated employees, if the payment was based on financial statements or other performance criteria that are later found to be materially inaccurate; (5) prohibits us from making severance payments or “golden parachutes” to any of our senior executive officers or next five most highly compensated employees; (6) prohibits us from paying or accruing bonuses, retention awards or incentive compensation, except for certain long-term stock awards, to our five most highly compensated employees; (7) prohibits us from providing tax gross-ups to any of our senior executive officers or next 20 most highly compensated employees; (8) requires us to provide enhanced disclosure of perquisites to the FDIC and the U.S. Treasury; (9) requires us to disclose to the FDIC and the U.S. Treasury the use and role of compensation consultants; (10) requires our chief executive officer and chief financial officer to provide period certifications about our compensation practices and compliance with the interim final rule; and (11) requires us to provide an annual non-binding shareholder vote, or “say-on-pay” proposal, to approve the compensation of our executives, consistent with regulations promulgated by the Securities and Exchange Commission. On January 12, 2010, the SEC adopted final regulations setting forth the parameters for such say-on pay proposals for public company CPP participants.
Capital Adequacy Requirements. The Federal Reserve Board has adopted a system using risk-based capital guidelines to evaluate the capital adequacy of bank holding companies. Under the guidelines, specific categories of assets are assigned different risk weights, based generally on the perceived credit risk of the asset. These risk weights are multiplied by corresponding asset balances to determine a “risk-weighted” asset base. The guidelines require a minimum total risk-based capital ratio of 8.0%. At least half of the total capital must be composed of common equity, retained earnings, senior perpetual preferred stock issued to the U. S. Treasury under the CPP and qualifying perpetual preferred stock and certain hybrid capital instruments, less certain intangible assets (“Tier 1 capital”). The remainder may consist of certain subordinated debt, certain hybrid capital instruments, qualifying preferred stock and a limited amount of the allowance for loan losses (“Tier 2 capital”). Total capital is the sum of Tier 1 and Tier 2 capital. To be considered well-capitalized under the risk-based capital guidelines, an institution must maintain a total capital to total risk-weighted assets ratio of at least 10% and a Tier 1 capital to total risk-weighted assets ratio of 6% or greater. As of December 31, 2009, our ratio of total capital to total risk-weighted assets was 13.8% and our ratio of Tier 1 capital to total risk-weighted assets was 11.9%, both ratios significantly above the required amounts.
4
Table of Contents
In addition to the risk-based capital guidelines, the Federal Reserve Board uses a leverage ratio as an additional tool to evaluate the capital adequacy of bank holding companies. The leverage ratio is a company’s Tier 1 capital divided by its average total consolidated assets. Certain highly rated bank holding companies may maintain a minimum leverage ratio of 3.0%, but other bank holding companies may be required to maintain a leverage ratio of 4.0%. As of December 31, 2009, our leverage ratio of 9.6% was significantly above the required amount.
The federal banking agencies’ risk-based and leverage ratios are minimum supervisory ratios generally applicable to banking organizations that meet certain specified criteria, assuming that they have the highest regulatory rating. Banking organizations not meeting these criteria are expected to operate with capital positions well above the minimum ratios. The federal bank regulatory agencies may set capital requirements for a particular banking organization that are higher than the minimum ratios when circumstances warrant. Federal Reserve Board guidelines also provide that banking organizations experiencing internal growth or making acquisitions will be expected to maintain strong capital positions substantially above the minimum supervisory levels, without significant reliance on intangible assets.
Dividends. Under Federal Reserve policy, bank holding companies should pay cash dividends on common stock only out of income available over the past year and only if prospective earnings retention is consistent with the organization’s expected future needs and financial condition. The policy provides that bank holding companies should not declare a level of cash dividends that undermines the bank holding company’s ability to serve as a source of strength to its banking subsidiaries.
Porter Bancorp is a legal entity separate and distinct from PBI Bank. The majority of our revenue is from dividends paid to us by PBI Bank. PBI Bank is subject to laws and regulations that limit the amount of dividends it can pay. If, in the opinion of a federal regulatory agency, an institution under its jurisdiction is engaged in or is about to engage in an unsafe or unsound practice, the agency may require, after notice and hearing, that the institution cease and desist from such practice. The federal banking agencies have indicated that paying dividends that deplete an institution’s capital base to an inadequate level would be an unsafe and unsound banking practice. Under FDICIA, an insured institution may not pay any dividend if payment would cause it to become undercapitalized or if it already is undercapitalized. Moreover, the Federal Reserve and the FDIC have issued policy statements providing that bank holding companies and banks should generally pay dividends only out of current operating earnings. A bank holding company may still declare and pay a dividend if it does not have current operating earnings if the bank holding company expects profits for the entire year and the bank holding company obtains the prior consent of the Federal Reserve.
Under Kentucky law, dividends by Kentucky banks may be paid only from current or retained net profits. Before any dividend may be declared for any period (other than with respect to preferred stock), a bank must increase its capital surplus by at least 10% of the net profits of the bank for the period until the bank’s capital surplus equals the amount of its stated capital attributable to its common stock. Moreover, the Kentucky Department of Financial Institutions must approve the declaration of dividends if the total dividends to be declared by a bank for any calendar year would exceed the bank’s total net profits for such year combined with its retained net profits for the preceding two years, less any required transfers to surplus or a fund for the retirement of preferred stock or debt. We are also subject to the Kentucky Business Corporation Act, which generally prohibits dividends to the extent they result in the insolvency of the corporation from a balance sheet perspective or in the corporation becoming unable to pay debts as they come due. PBI Bank did not pay any dividends in 2009.
Prior to November 21, 2011, unless Porter Bancorp has redeemed all of the Series A Preferred Stock issued to the U.S. Treasury on November 21, 2008 or unless the U.S. Treasury has transferred all the preferred securities to a third party, the consent of the U.S. Treasury will be required for Porter Bancorp to declare or pay any dividend or make any distribution on common stock other than (i) regular quarterly cash dividends of not more than the current level of $0.20 per share, as adjusted for any stock split, stock dividend, reverse stock split, reclassification or similar transaction, (ii) dividends payable solely in shares of common stock and (iii) dividends or distributions of rights or junior stock in connection with a shareholders’ rights plan.
Imposition of Liability for Undercapitalized Subsidiaries. Bank regulators are required to take “prompt corrective action” to resolve problems associated with insured depository institutions whose capital declines below certain levels. In the event an institution becomes “undercapitalized,” it must submit a capital restoration plan. The capital restoration plan will not be accepted by the regulators unless each company having control of the undercapitalized institution guarantees the subsidiary’s compliance with the capital restoration plan up to a certain specified amount. Any such guarantee from a depository institution’s holding company is entitled to a priority of payment in bankruptcy.
5
Table of Contents
The aggregate liability of the holding company of an undercapitalized bank is limited to the lesser of 5% of the institution’s assets at the time it became undercapitalized or the amount necessary to cause the institution to be “adequately capitalized.” The bank regulators have greater power in situations where an institution becomes “significantly” or “critically” undercapitalized or fails to submit a capital restoration plan. For example, a bank holding company controlling such an institution can be required to obtain prior Federal Reserve Board approval of proposed dividends, or might be required to consent to a consolidation or to divest the troubled institution or other affiliates.
Source of Financial Strength. Under Federal Reserve policy, a bank holding company is expected to act as a source of financial strength to, and to commit resources to support, its bank subsidiaries. This support may be required at times when, absent such a policy, the bank holding company may not be inclined to provide it. In addition, any capital loans by the bank holding company to its bank subsidiaries are subordinate in right of payment to deposits and to certain other indebtedness of the bank subsidiary. In the event of a bank holding company’s bankruptcy, any commitment by the bank holding company to a federal bank regulatory agency to maintain the capital of subsidiary banks will be assumed by the bankruptcy trustee and entitled to a priority of payment.
PBI Bank. PBI Bank, a Kentucky chartered commercial bank, is subject to regular bank examinations and other supervision and regulation by both the FDIC and the Kentucky Department of Financial Institutions (“KDFI”). Kentucky’s banking statutes contain a “super-parity” provision that permits a well-rated Kentucky banking corporation to engage in any banking activity which could be engaged in by a national bank operating in any state; a state bank, a thrift or savings bank operating in any other state; or a federal chartered thrift or federal savings association meeting the qualified thrift lender test and operating in any state could engage, provided the Kentucky bank first obtains a legal opinion specifying the statutory or regulatory provisions that permit the activity.
Capital Requirements. Similar to the Federal Reserve Board’s requirements for bank holding companies, the FDIC has adopted risk-based capital requirements for assessing state non-member banks’ capital adequacy. The FDIC’s risk-based capital guidelines require that all banks maintain a minimum ratio of total capital to total risk-weighted assets of 8.0% and a minimum ratio of Tier 1 capital to total risk-weighted assets of 4.0%. To be well-capitalized, a bank must have a ratio of total capital to total risk-weighted assets of at least 10.0% and a ratio of Tier 1 capital to total risk-weighted assets of 6.0%. PBI Bank has agreed with its primary regulators to maintain a ratio of total capital to total risk-weighted assets of at least 12.0% and a ratio of Tier 1 capital to total risk-weighted assets of 9% by June 30,2010. As of December 31, 2009, PBI Bank’s ratio of total capital to total risk-weighted assets was 12.6% and its ratio of Tier 1 capital to total risk-weighted assets was 10.7%.
The FDIC also requires a minimum leverage ratio of 3.0% of Tier 1 capital to total assets for the highest rated banks and an additional cushion of approximately 100-200 basis points for all other banks. As of December 31, 2009, PBI Bank’s leverage ratio was 8.6%. The leverage ratio operates in tandem with the FDIC’s risk-based capital guidelines and places a limit on the amount of leverage a bank can undertake by requiring a minimum level of capital to total assets.
Prompt Corrective Action. Pursuant to the Federal Deposit Insurance Act (“FDIA”), the FDIC must take prompt corrective action to resolve the problems of undercapitalized institutions. FDIC regulations define the levels at which an insured institution would be considered “well capitalized,” “adequately capitalized,” “undercapitalized,” “significantly undercapitalized” and “critically undercapitalized.” A “well-capitalized” bank has a total risk-based capital ratio of 10.0% or higher; a Tier 1 risk- based capital ratio of 6.0% or higher; a leverage ratio of 5.0% or higher; and is not subject to any written agreement, order or directive requiring it to maintain a specific capital level for any capital measure. An “adequately capitalized” bank has a total risk-based capital ratio of 8.0% or higher; a Tier 1 risk-based capital ratio of 4.0% or higher; a leverage ratio of 4.0% or higher (3.0% or higher if the bank was rated a composite 1 in its most recent examination report and is not experiencing significant growth); and does not meet the criteria for a well-capitalized bank. A bank is “undercapitalized” if it fails to meet any one of the ratios required to be adequately capitalized. As of December 31, 2009, PBI Bank was “well capitalized” as defined by the FDIC. A depository institution may be deemed to be in a capitalization category that is lower than is indicated by its actual capital position if it receives an unsatisfactory examination rating. The degree of regulatory scrutiny increases and the permissible activities of a bank decreases, as the bank moves downward through the capital categories. Depending on a bank’s level of capital, the FDIC’s corrective powers include:
| • | requiring a capital restoration plan; |
| • | placing limits on asset growth and restriction on activities; |
| • | requiring the bank to issue additional voting or other capital stock or to be acquired; |
| • | placing restrictions on transactions with affiliates; |
| • | restricting the interest rate the bank may pay on deposits; |
| • | ordering a new election of the bank’s board of directors; |
6
Table of Contents
| • | requiring that certain senior executive officers or directors be dismissed; |
| • | prohibiting the bank from accepting deposits from correspondent banks; |
| • | requiring the bank to divest certain subsidiaries; |
| • | prohibiting the payment of principal or interest on subordinated debt; and |
| • | ultimately, appointing a receiver for the bank. |
In the event an institution is required to submit a capital restoration plan, the institution’s holding company must guaranty the subsidiary’s compliance with the capital restoration plan up to a certain specified amount. Any such guarantee from a depository institution’s holding company is entitled to a priority of payment in bankruptcy. The aggregate liability of the holding company of an undercapitalized bank is limited to the lesser of 5% of the institution’s assets at the time it became undercapitalized or the amount necessary to cause the institution to be “adequately capitalized.” The bank regulators have greater power in situations where an institution becomes “significantly” or “critically” undercapitalized or fails to submit a capital restoration plan. For example, a bank holding company controlling such an institution can be required to obtain prior Federal Reserve Board approval of proposed dividends, or might be required to consent to a consolidation or to divest the troubled institution or other affiliates.
Deposit Insurance Assessments. The deposits of PBI Bank are insured by the DIF of the FDIC up to the limits set forth under applicable law and are subject to the deposit insurance premium assessments of the DIF. The FDIC imposes a risk-based deposit premium assessment system, which was amended pursuant to the Federal Deposit Insurance Reform Act of 2005 (the “Reform Act”). Under this system, as amended, the assessment rates for an insured depository institution vary according to the level of risk incurred in its activities. To arrive at an assessment rate for a banking institution, the FDIC places it in one of four risk categories determined by reference to its capital levels and supervisory ratings. The assessment rate schedule can change from time to time, at the discretion of the FDIC, subject to certain limits.
On May 22, 2009, the FDIC also implemented a special assessment equal to five basis points of each insured depository institution’s assets minus Tier 1 capital as of June 30, 2009, but no more than ten basis points multiplied by the institution’s assessment base for the second quarter of 2009. As a result, PBI Bank paid a special assessment of $781,000 on September 30, 2009.
On November 12, 2009, the FDIC amended the final rule adopted on May 22, 2009 to restore losses to the DIF. The new rule required insured institutions to prepay on December 30, 2009, an estimated quarterly risk-based assessment for the 4th quarter of 2009 and for all 2010, 2011, and 2012. An institution’s assessment is calculated by taking the institution’s actual September 30, 2009 assessment and adjusting it quarterly by an estimated 5% annual growth rate through the end of 2012. Further, the FDIC incorporated a uniform 3 basis point increase effective January 1, 2011. On December 30, 2009, PBI Bank prepaid $7.9 million of FDIC insurance premiums for the next three years. The entire amount of the prepaid assessment was recorded as a prepaid expense. As of December 31, 2009, and each quarter thereafter, each institution is to record an expense, or a charge to earnings, for its quarterly assessment invoiced on its quarterly statement and an offsetting credit to the prepaid assessment until the asset is exhausted.
Safety and Soundness Standards. The FDIA requires the federal bank regulatory agencies to prescribe standards, by regulations or guidelines, relating to internal controls, information systems and internal audit systems, loan documentation, credit underwriting, interest rate risk exposure, asset growth, asset quality, earnings, stock valuation and compensation, fees and benefits, and such other operational and managerial standards as the agencies deem appropriate. Guidelines adopted by the federal bank regulatory agencies establish general standards relating to internal controls and information systems, internal audit systems, loan documentation, credit underwriting, interest rate exposure, asset growth and compensation, fees and benefits. In general, the guidelines require, among other things, appropriate systems and practices to identify and manage the risk and exposures specified in the guidelines. The guidelines prohibit excessive compensation as an unsafe and unsound practice and describe compensation as excessive when the amounts paid are unreasonable or disproportionate to the services performed by an executive officer, employee, director or principal stockholder. In addition, the agencies adopted regulations that authorize, but do not require, an agency to order an institution that has been given notice by an agency that it is not satisfying any of such safety and soundness standards to submit a compliance plan. If, after being so notified, an institution fails to submit an acceptable compliance plan or fails in any material respect to implement an acceptable compliance plan, the agency must issue an order directing action to correct the deficiency and may issue an order directing other actions of the types to which an undercapitalized institution is subject under the “prompt corrective action” provisions of FDIA. See “Prompt Corrective Actions” above. If an institution fails to comply with such an order, the agency may seek to enforce such order in judicial proceedings and to impose civil money penalties.
Branching. Kentucky law permits Kentucky chartered banks to establish a banking office in any county in Kentucky. A Kentucky bank may also establish a banking office outside of Kentucky. Well capitalized Kentucky banks that have been in operation at least three years and that satisfy certain criteria relating to, among other things, their composite and management
7
Table of Contents
ratings, may establish a banking office in Kentucky without the approval of the KDFI upon notice to the KDFI and any other state bank with its main office located in the county where the new banking office will be located. Branching by all other banks requires the approval of the KDFI, who must ascertain and determine that the public convenience and advantage will be served and promoted and that there is reasonable probability of the successful operation of the banking office.
The transaction must also be approved by the FDIC, which considers a number of factors, including financial history, capital adequacy, earnings prospects, character of management, needs of the community and consistency with corporate powers.
An out-of-state bank is permitted to establish banking offices in Kentucky only by merging with a Kentucky bank. De novo branching into Kentucky by an out-of-state bank is not permitted. This difficulty for out-of-state banks to branch in Kentucky may limit the ability of a Kentucky bank to branch into many states, as several states have reciprocity requirements for interstate branching.
Insider Credit Transactions. The restrictions on loans to directors, executive officers, principal shareholders and their related interests (collectively referred to herein as “insiders”) contained in the Federal Reserve Act and Regulation O apply to all insured depository institutions and their subsidiaries. These restrictions include limits on loans to one borrower and conditions that must be met before such a loan can be made. There is also an aggregate limitation on all loans to insiders and their related interests. These loans cannot exceed the institution’s total unimpaired capital and surplus.
Consumer Protection Laws. PBI Bank is subject to consumer laws and regulations that are designed to protect consumers in transactions with banks. While the list set forth herein is not exhaustive, these laws and regulations include the Truth in Lending Act, the Truth in Savings Act, the Electronic Funds Transfer Act, the Expedited Funds Availability Act, the Equal Credit Opportunity Act, the Fair Housing Act, the Real Estate Settlement and Procedures Act, the Fair Credit Reporting Act, and the Federal Trade Commission Act, among others. These laws and regulations mandate certain disclosure requirements and regulate the manner in which financial institutions must deal with customers when taking deposits or making loans to such customers.
Privacy. Federal law currently contains extensive customer privacy protections provisions. Under these provisions, a financial institution must provide to its customers, at the inception of the customer relationship and annually thereafter, the institution’s policies and procedures regarding the handling of customers’ nonpublic personal financial information. These provisions also provide that, except for certain limited exceptions, an institution may not provide such personal information to unaffiliated third parties unless the institution discloses to the customer that such information may be so provided and the customer is given the opportunity to opt out of such disclosure. Federal law makes it a criminal offense, except in limited circumstances, to obtain or attempt to obtain customer information of a financial nature by fraudulent or deceptive means.
Community Reinvestment Act. The Community Reinvestment Act (“CRA”) requires the FDIC to assess our record in meeting the credit needs of the communities we serve, including low- and moderate-income neighborhoods and persons. The FDIC’s assessment of our record is made available to the public. The assessment also is part of the Federal Reserve Board’s consideration of applications to acquire, merge or consolidate with another banking institution or its holding company, to establish a new banking office or to relocate an office.
Bank Secrecy Act. The Bank Secrecy Act of 1970 (“BSA”) was enacted to deter money laundering, establish regulatory reporting standards for currency transactions and improve detection and investigation of criminal, tax and other regulatory violations. BSA and subsequent laws and regulations require us to take steps to prevent the use of PBI Bank in the flow of illegal or illicit money, including, without limitation, ensuring effective management oversight, establishing sound policies and procedures, developing effective monitoring and reporting capabilities, ensuring adequate training and establishing a comprehensive internal audit of BSA compliance activities. In recent years, federal regulators have increased the attention paid to compliance with the provisions of BSA and related laws, with particular attention paid to “Know Your Customer” practices. Banks have been encouraged by regulators to enhance their identification procedures prior to accepting new customers in order to deter criminal elements from using the banking system to move and hide illegal and illicit activities.
USA Patriot Act. The USA PATRIOT Act of 2001 (the “Patriot Act”) contains anti-money laundering measures affecting insured depository institutions, broker-dealers and certain other financial institutions. The Patriot Act requires financial institutions to implement policies and procedures to combat money laundering and the financing of terrorism, including standards for verifying customer identification at account opening, and rules to promote cooperation among financial institutions, regulators and law enforcement entities in identifying parties that may be involved in terrorism or money laundering, and grants the Secretary of the Treasury broad authority to establish regulations and to impose requirements and restrictions on financial institutions’ operations. In addition, the Patriot Act requires the federal bank regulatory agencies to consider the effectiveness of a financial institution’s anti-money laundering activities when reviewing bank mergers and bank holding company acquisitions.
8
Table of Contents
Temporary Liquidity Guarantee Program. Under the FDIC’s Temporary Liquidity Guarantee Program (TLGP), the FDIC guarantees U.S. depository institutions’ transaction accounts and certain qualifying senior unsecured debt. We are a participant in the TLGP’s Transaction Account Guarantee Program (TAGP), which applies to, among others, all U.S. depository institutions insured by the FDIC and all United States bank holding companies, unless they have opted out. Under the TAGP, all non-interest bearing transaction accounts maintained at PBI Bank are insured in full by the FDIC until June 30, 2010, regardless of the standard maximum deposit insurance amounts. Although the TAGP was originally scheduled to expire on December 31, 2009, the FDIC implemented a final rule, effective as of October 1, 2009, extending the transaction account guarantee program by six months until June 30, 2010 (subject to the option of participating institutions to opt out of such six-month extension). PBI Bank chose to remain in the TAGP during the six month extension. Separately, Congress extended the temporary increase in the standard coverage limit to $250,000 until December 31, 2013.
The TLGP’s Debt Guarantee Program guarantees certain qualifying senior unsecured debt of U.S. depository institutions. The program has been extended for senior unsecured debt issued after April 1, 2009 and before October 31, 2009 and maturing on or before December 31, 2012. On October 20, 2009, the FDIC established a limited, six-month emergency guarantee facility upon expiration of the Debt Guarantee Program. Under this emergency guarantee facility, certain participating entities can apply to the FDIC for permission to issue FDIC-guaranteed debt during the period starting October 31, 2009 through April 30, 2010. The fee for issuing debt under the emergency facility will be at least 300 basis points, which the FDIC reserves the right to increase on a case-by-case basis, depending upon the risks presented by the issuing entity. We have not participated in this program.
Effect on Economic Environment. The policies of regulatory authorities, including the monetary policy of the Federal Reserve Board, have a significant effect on the operating results of bank holding companies and their subsidiaries. Among the means available to the Federal Reserve Board to affect the money supply are open market operations in U.S. government securities, changes in the discount rate on member bank borrowings and changes in reserve requirements against member bank deposits. These means are used in varying combinations to influence overall growth and distribution of bank loans, investments and deposits, and their use may affect interest rates charged on loans or paid for deposits.
Federal Reserve Board monetary policies have materially affected the operating results of commercial banks in the past and are expected to continue to do so in the future. The nature of future monetary policies and the effect of such policies on our business and earnings and those of our subsidiaries cannot be predicted.
Recently Enacted and Future Legislation. Various laws, regulations and governmental programs affecting financial institutions and the financial industry are from time to time introduced in Congress or otherwise promulgated by regulatory agencies. Such measures may change the operating environment of Porter Bancorp and its subsidiaries in substantial and unpredictable ways. The nature and extent of future legislative, regulatory or other changes affecting financial institutions is very unpredictable at this time.
On February 18, 2009 the U.S. Treasury outlined the Homeowner Affordability and Stability Plan, which includes measures that could impact Porter Bancorp, including measures to (i) implement a comprehensive homeowner stability initiative that incentivizes financial institutions to reduce homeowners’ monthly mortgage payments, (ii) develop clear and consistent guidelines for loan modifications that participants will be obligated to use and (iii) authorize judicial modifications of home mortgages in personal bankruptcy cases, which modifications must be accepted by the loan servicer or lender. During the course of 2009, the Treasury Department announced numerous programs in implementation of the plan, and sent various legislative proposals to the Congress for consideration. We continue to monitor these developments and assess their potential impact on our business.
In November 2009, the Federal Reserve Board adopted its final rule under Regulation E regarding overdraft fees, which becomes effective for new accounts on July 1, 2010, and for existing accounts on August 15, 2010. This rule generally prohibits financial institutions from charging overdraft fees for ATM and one-time debit card transactions that overdraw consumer deposit accounts, unless the consumer “opts in” to having such overdrafts authorized and paid. The change will impact the amount of overdraft fees banks will be able to charge in the future.
We cannot predict what other legislation or economic policies of the various regulatory authorities might be enacted or adopted or what other regulations might be adopted or the effects thereof. Future legislation and policies and the effects thereof might have a significant influence on overall growth and distribution of loans, investments and deposits and affect interest rates charged on loans or paid on time and savings deposits. Such legislation and policies have had a significant effect on the operating results of commercial banks in the past and are expected to continue to do so in the future.
9
Table of Contents
Available Information
We file reports with the SEC including our annual report on Form 10-K, quarterly reports on Form 10-Q, current event reports on Form 8-K and proxy statements, as well as any amendments to those reports. The public may read and copy any materials the Registrant files with the SEC at the SEC’s Public Reference Room at 100 F Street, NE, Washington, DC 20549. The public may obtain information on the operation of the Public Reference Room by calling the SEC at 1-800-SEC-0330. The SEC maintains an internet site that contains reports, proxy and information statements and other information regarding issuers that file electronically with the SEC at http://www.sec.gov. Our annual report on Form 10-K, quarterly reports on Form 10-Q, current reports on Form 8-K, and amendments to those reports filed or furnished pursuant to section 13(a) or 15(d) of the Exchange Act are accessible at no cost on our web site at http://www.pbibank.com, under the Investors Relations section, once they are electronically filed with or furnished to the SEC. A shareholder may also request a copy of our Annual Report or Form 10-K free of charge upon written request to: Corporate General Counsel, Porter Bancorp, Inc., 2500 Eastpoint Parkway, Louisville, Kentucky 40223.
| Item 1A. | Risk Factors |
An investment in our common stock involves a number of risks. Realization of any of the risks described below could have a material adverse effect on our business, financial condition, results of operations, cash flow and/or future prospects.
Our business has been and may continue to be adversely affected by current conditions in the financial markets and by economic conditions generally.
The capital and credit markets have been experiencing unprecedented levels of volatility and disruption for more than a year. In some cases, the markets have produced downward pressure on stock prices and credit availability for certain issuers without regard to those issuers’ underlying financial strength. Reduced consumer spending and the absence of liquidity in the global credit markets during the current recession have depressed business activity across a wide range of industries. Unemployment has also increased significantly. Ongoing weakness in business and economic conditions generally or specifically in our markets has had, and could continue to have one or more of the following adverse effects on our business:
| • | A decrease in the demand for loans and other products and services offered by us; |
| • | A decrease in the value of collateral securing our loans; |
| • | An impairment of certain intangible assets, such as goodwill; |
| • | An increase in the number of customers who become delinquent, file for protection under bankruptcy laws or default on their loans. |
Overall, during the past two years, the general business environment has had an adverse effect on our business, and it is not certain that the environment will improve in the near term. Until conditions improve, we expect our businesses, financial condition and results of operations to be adversely affected.
Current market developments could continue to adversely affect our industry, businesses and results of operations.
Over the past two years, the financial services industry as a whole, as well as the securities markets generally, have been materially and adversely affected by very significant declines in the values of nearly all asset classes and by a very serious lack of liquidity. Financial institutions in particular have been subject to increased volatility and an overall loss in investor confidence. The loss of confidence in the financial sector, increased volatility in the financial markets and reduced business activity could continue to adversely affect our business, financial condition and results of operations. Further negative market developments may affect consumer confidence levels and may cause adverse changes in payment patterns, causing increases in delinquencies and default rates, which may impact our charge-offs and provisions for credit losses. A worsening of these conditions would likely exacerbate the adverse effects of these difficult market conditions on us and others in the financial services industry.
A large percentage of our loans are collateralized by real estate, and further disruptions in the real estate market may result in losses and adversely affect our profitability.
Approximately 89.1% of our loan portfolio as of December 31, 2009 was comprised of loans collateralized by real estate. The declining economic conditions have caused a decrease in demand for real estate which has resulted in flat to declining real estate values in our markets. Further disruptions in the real estate market could significantly impair the value of our collateral and our ability to sell the collateral upon foreclosure. The real estate collateral in each case provides an alternate source of repayment in the event of default by the borrower and may deteriorate in value during the time the credit is extended. If real estate values decline further, it will become more likely that we would be required to increase our allowance for loan losses. If during a period of reduced real estate values, we are required to liquidate the collateral securing a loan to satisfy the debt or to increase our allowance for loan losses, it could materially reduce our profitability and adversely affect our financial condition.
10
Table of Contents
We have a significant percentage of real estate construction and development loans, which carry a higher degree of risk. The poor condition of the residential construction and commercial development real estate markets may lead to increased non-performing assets in our loan portfolio and increased provision expense for losses on loans, which could have a material adverse effect on our capital, financial condition and results of operations.
Approximately 21.5% of our loan portfolio as of December 31, 2009 consisted of real estate construction and development loans. These loans generally carry a higher degree of risk than long-term financing of existing properties because repayment depends on the ultimate completion of the project and usually on the sale of the property. If we are forced to foreclose on a project prior to completion, we may not be able to recover the entire unpaid portion of the loan or we may be required to fund additional money to complete the project or hold the property for an indeterminate period of time. Any of these outcomes may result in losses and adversely affect our profitability.
The residential construction and commercial development real estate markets continue to experience challenging economic conditions. Further disruptions in these markets may lead to additional valuation adjustments on our loan portfolios and real estate owned as we continue to reassess the fair value of our non-performing assets, the loss severities of loans in default and the fair value of real estate owned. We also may realize additional losses in connection with our disposition of non-performing assets. A weak real estate market could further reduce demand for residential housing, which, in turn, could adversely affect the development and construction activities of residential real estate developers. Consequently, the longer the current economic conditions persist, the more likely they are to adversely affect the ability of residential real estate developer borrowers to repay these loans and the value of property used as collateral for such loans. If these economic conditions and market factors negatively affect some of our larger loans, then we could see a sharp increase in our total net-charge offs and also be required to significantly increase our allowance for loan losses. Any further increase in our non-performing assets and related increases in our provision expense for losses on loans could negatively affect our business and could have a material adverse effect on our capital, financial condition and results of operations.
Our decisions regarding credit risk may not be accurate, and our allowance for loan losses may not be sufficient to cover actual losses, which could adversely affect our business, financial condition and results of operations.
We maintain an allowance for loan losses at a level we believe is adequate to absorb probable incurred losses in our loan portfolio based on historical loan loss experience, specific problem loans, value of underlying collateral and other relevant factors. If our assessment of these factors is ultimately inaccurate, the allowance may not be sufficient to cover actual future loan losses, which would adversely affect our operating results. Our estimates are subjective and their accuracy depends on the outcome of future events. Changes in economic, operating and other conditions that are generally beyond our control could cause actual loan losses to increase significantly. In addition, bank regulatory agencies, as an integral part of their supervisory functions, periodically review the adequacy of our allowance for loan losses. Regulatory agencies have from time to time required us to increase our provision for loan losses or to recognize further loan charge-offs when their judgment has differed from ours, which could have a material negative impact on our operating results.
We may experience additional classified loans and non-performing assets in the foreseeable future if the real estate markets remain weak and cause more borrowers to default. Further, the value of the collateral underlying a given loan, and the realizable value of such collateral in a foreclosure sale, likely will be negatively affected if the real estate market remains weak, and therefore may result in an inability to realize a full recovery in the event that a borrower defaults on a loan. Any additional non-performing assets, loan charge-offs, increases in the provision for loan losses or any inability by us to realize the full value of underlying collateral in the event of a loan default, could negatively affect our business, financial condition, and results of operations and the price of our securities.
Our profitability depends significantly on local economic conditions.
Because most of our business activities are conducted in central Kentucky and most of our credit exposure is in that region, we are at risk from adverse economic or business developments affecting this area, including declining regional and local business activity, a downturn in real estate values and agricultural activities and natural disasters. To the extent the central Kentucky economy remains weak, the rates of delinquencies, foreclosures, bankruptcies and losses in our loan portfolio will likely increase. Moreover, the value of real estate or other collateral that secures our loans could be adversely affected by the economic downturn or a localized natural disaster. The economic downturn has had a negative impact on our financial results and may continue to have a negative impact on our business, financial condition, results of operations and future prospects.
11
Table of Contents
Our small to medium-sized business target market may have fewer resources to weather the downturn in the economy.
Our strategy includes lending to small and medium-sized businesses and other commercial enterprises. Small and medium-sized businesses frequently have smaller market shares than their competitors, may be more vulnerable to economic downturns, often need substantial additional capital to expand or compete and may experience substantial variations in operating results, any of which may impair a borrower’s ability to repay a loan. In addition, the success of a small or medium-sized business often depends on the management talents and efforts of one or two persons or a small group of persons, and the death, disability or resignation of one or more of these persons could have a material adverse impact on the business and its ability to repay our loan. A continued economic downturn could have a more pronounced negative impact on our target market, which could cause us to incur substantial credit losses that could materially harm our operating results.
Our profitability is vulnerable to fluctuations in interest rates.
Changes in interest rates could harm our financial condition or results of operations. Our results of operations depend substantially on net interest income, the difference between interest earned on interest-earning assets (such as investments and loans) and interest paid on interest-bearing liabilities (such as deposits and borrowings). Interest rates are highly sensitive to many factors, including governmental monetary policies and domestic and international economic and political conditions. Factors beyond our control, such as inflation, recession, unemployment and money supply may also affect interest rates. If our interest-earning assets mature or reprice more quickly than our interest-bearing liabilities in a given period as a result of decreasing interest rates, our net interest income may decrease. Likewise, our net interest income may decrease if interest-bearing liabilities mature or reprice more quickly than interest-earning assets in a given period as a result of increasing interest rates.
Fixed-rate loans increase our exposure to interest rate risk in a rising rate environment because interest-bearing liabilities would be subject to repricing before assets become subject to repricing. Adjustable-rate loans decrease the risk associated with changes in interest rates but involve other risks, such as the inability of borrowers to make higher payments in an increasing interest rate environment. At the same time, for secured loans, the marketability of the underlying collateral may be adversely affected by higher interest rates. In a declining interest rate environment, there may be an increase in prepayments on loans as the borrowers refinance their loans at lower interest rates, which could reduce net interest income and harm our results of operations.
If we cannot obtain adequate funding, we may not be able to meet the cash flow requirements of our depositors and borrowers, or meet the operating cash needs of the Company to fund corporate expansion or other activities.
Our liquidity policies and limits are established by the Board of Directors of PBI Bank, with operating limits set by the Asset Liability Committee (“ALCO”), based upon analyses of the ratio of loans to deposits and the percentage of assets funded with non-core or wholesale funding. The ALCO regularly monitors the overall liquidity position of PBI Bank and the Company to ensure that various alternative strategies exist to cover unanticipated events that could affect liquidity. Liquidity is the ability to meet cash flow needs on a timely basis at a reasonable cost. If our liquidity policies and strategies don’t work as well as intended, then we may be unable to make loans and to repay deposit liabilities as they become due or are demanded by customers. The ALCO follows established board approved policies and monitors guidelines to diversify our wholesale funding sources to avoid concentrations in any one-market source. Wholesale funding sources include Federal funds purchased, securities sold under repurchase agreements, non-core brokered deposits, and Federal Home Loan Bank (“FHLB”) advances that are collateralized with mortgage-related assets.
We maintain a portfolio of securities that can be used as a secondary source of liquidity. There are other available sources of liquidity, including the ability to acquire additional non-core brokered deposits, additional collateralized borrowings such as FHLB advances, the issuance of debt securities, and the issuance of preferred or common securities in public or private transactions. If we were unable to access any of these funding sources when needed, we might not be able to meet the needs of our customers, which could adversely impact our financial condition, our results of operations, cash flows and our level of regulatory-qualifying capital.
We may need to raise additional capital in the future, but that capital may not be available when needed or at all.
We may need to raise additional capital in the future to provide us with sufficient capital resources and liquidity to meet our commitments and business needs. Our ability to raise additional capital, if needed, will depend on, among other things, conditions in the capital markets at that time, which are outside of our control, and our financial performance. Capital may not be available to us on acceptable terms or at all. An inability to raise additional capital on acceptable terms when needed could have a materially adverse effect on our businesses, financial condition and results of operations.
12
Table of Contents
There may be future sales or other dilution of our equity, which may adversely affect the market price of our common stock.
We are not restricted from issuing additional common stock, including securities that are convertible into or exchangeable for, or that represent the right to receive, common stock. The issuance of additional shares of common stock or the issuance of convertible securities would dilute the ownership interest of our existing common shareholders. The market price of our common stock could decline as a result of this offering as well as other sales of a large block of shares of our common stock or similar securities in the market after this offering, or the perception that such sales could occur.
Our issuance of securities to the U.S. Department of the Treasury may limit our ability to return capital to our shareholders and is dilutive to our common shares. In addition, the dividend rate increases substantially after five years if we cannot redeem the shares by that time.
On November 21, 2008, as part of the Capital Purchase Program established under the Emergency Economic Stabilization Act of 2008 (“EESA”), we sold $35 million of senior preferred stock to the U.S. Treasury. We also issued to the U.S. Treasury a warrant to purchase 299,829 shares of our common stock at $17.51 per share, subject to certain anti-dilution and other adjustments. The warrant is now exercisable for 314,821 shares at an exercise price of $16.68, based on our 5% stock dividend paid on November 19, 2009. The terms of the transaction with the U.S. Treasury limit our ability to pay dividends and repurchase our shares. For three years after issuance or until the U.S. Treasury no longer holds any preferred shares, we will not be able to increase our dividends above the current quarterly amount nor repurchase any of our shares without the U.S. Treasury’s approval with limited exceptions, most significantly the repurchase of our common stock to offset share dilution from equity-based compensation awards. Also, we will not be able to pay any dividends at all unless we are current on our dividend payments on the preferred shares. These restrictions, as well as the dilutive impact of the warrant, may have an adverse effect on the market price of our common stock.
Unless we are able to redeem the preferred stock during the first five years, the dividends on this capital will increase substantially at that point, from 5% (approximately $1.75 million annually) to 9% (approximately $3.15 million annually). Depending on market conditions and our financial performance at the time, this increase in dividends could significantly impact our capital and liquidity.
The U.S. Treasury has the unilateral ability to change some of the restrictions imposed on us by virtue of our sale of securities to it.
Our agreement with the U.S. Treasury under which it purchased our senior preferred stock imposes restrictions on the conduct of our business, including restrictions related to our payment of dividends, repurchases of our stock and our executive compensation and corporate governance. The U.S. Treasury has the right under this agreement to unilaterally amend it to the extent required to comply with any future changes in federal statutes. The American Recovery and Reinvestment Act of 2009 (“ARRA”) amended provisions of EESA relating to compensation and governance as they affect companies that have participated in the CPP. In some cases, these amendments require action by the U.S. Treasury to implement them. These amendments could have an adverse impact on the conduct of our business, as could additional amendments in the future that impose further requirements or amend existing requirements.
Our chairman and our president and chief executive officer together have sufficient voting power to elect or remove our directors, to determine the vote on any matter that requires shareholder approval, and otherwise control our company. In exercising their voting power, they may act according to their own interests, which may be adverse to your interests.
As of December 31, 2009, J. Chester Porter and Maria L. Bouvette beneficially owned approximately 5,768,398 shares, or 65.7% of our outstanding common stock. Mr. Porter and Ms. Bouvette each have made testamentary arrangements that provide for the other to retain voting control of his or her common stock in the event of death. Accordingly, they will be able to exercise control over our business and affairs and will be able to determine the outcome of any matter submitted to a vote of our shareholders, including the election and removal of our entire board of directors, any amendment of our articles of incorporation (including any amendment that changes the rights of our common stock) and any merger, consolidation or sale of all or substantially all of our assets. Mr. Porter and Ms. Bouvette could take actions or make decisions in their self-interest that are opposed to your best interests. They could remove directors who take actions or make decisions they oppose but are favored by our other shareholders. They may be less receptive to the desires communicated by shareholders. Neither our articles of incorporation, our bylaws, nor Kentucky law requires the vote of more than a simple majority of our outstanding shares of common stock to approve a matter submitted for shareholder approval, subject to the general statutory requirement that any transaction in which one or more directors have a direct or indirect interest (other than as a shareholder) must be “fair” to the corporation. Mr. Porter and Ms. Bouvette have a level of concentrated control that could discourage others from initiating any potential merger, takeover or other change of control transaction that may otherwise give you the opportunity to realize a premium over the then-prevailing market price of our common stock. As a result, the market price of our common stock could be adversely affected.
13
Table of Contents
We are a “controlled company” within the meaning of the NASDAQ corporate governance rules because J. Chester Porter and Maria L. Bouvette together own more than 50% of our sole class of voting stock. As a controlled company, our controlling shareholders have greater power to make decisions in their own self-interest and against the interests of other shareholders, and investors and other shareholders will have fewer procedural and substantive protections against the exercise of this power.
A “controlled company” may elect not to comply with the following NASDAQ corporate governance rules, which require that:
| • | a majority of its board of directors consists of “independent directors,” which the NASDAQ rules define as persons who are not either officers or employees of the company and have no relationships that, in the opinion of the board of directors, would interfere with the exercise of independent judgment in carrying out their responsibilities as directors; |
| • | decisions regarding the compensation paid to executive officers are made either by a compensation committee composed entirely of independent directors or by a majority of the independent directors; |
| • | nominations for election to the board of directors are made either by a nominating committee composed entirely of independent directors with a written charter addressing the committee’s purpose and responsibilities or by a majority of the independent directors. |
As a result of our controlled company status Mr. Porter, a non-independent director, serves on our nominating and governance committee. We expect Mr. Porter to continue to serve on our nominating and corporate governance committee for the foreseeable future. Although a majority of our directors are independent directors, they have all been selected by Mr. Porter and Ms. Bouvette, who together have the voting power to remove directors who oppose actions or decisions they favor. Mr. Porter and Ms. Bouvette also have the power to elect a majority of directors who are not independent directors. Our board may elect to dispense with the nominating and governance committee at any time without shareholder consent. Accordingly, our shareholders have fewer procedural and substantive protections than shareholders of companies subject to all of the NASDAQ corporate governance requirements.
If we are unable to manage our growth effectively, our operations could be negatively affected.
Financial institutions like us that have experience rapid growth face various risks and difficulties, including:
| • | attracting funding to support additional growth; |
| • | maintaining asset quality; |
| • | attracting and retaining qualified management; and |
| • | maintaining adequate regulatory capital. |
In addition, in order to manage our growth and maintain adequate information and reporting systems within our organization, we must identify, hire and retain additional qualified employees, particularly in the accounting and operational areas of our business.
If we do not manage our growth effectively, our business, financial condition, results of operations and future prospects could be negatively affected, and we may not be able to continue to implement our business strategy and successfully conduct our operations.
We may not be able to maintain our historical earnings trends if we are not able to continue to grow.
We have expanded our business through both organic growth and a number of strategic acquisitions. Our ability to continue our organic growth depends, in part, upon our ability to expand our market presence, successfully attract core deposits and identify attractive commercial lending opportunities. If we are not able to do this successfully, we may not be able to maintain our historical earnings trends.
Our ability to implement our strategy for continued growth also depends on our ability to continue to identify and integrate acquisition targets profitably. We may not be able to continue this trend, nor may future acquisitions always be profitable. In addition, increased regulatory scrutiny may limit the ability to make future acquisitions. We also expect that competition for suitable acquisition candidates will be significant. We compete with other banks or financial service companies with similar acquisition strategies, many of which are larger and have greater financial and other resources than we do. We may not be able to successfully identify and acquire suitable acquisition targets on acceptable terms and conditions.
14
Table of Contents
Higher FDIC deposit insurance premiums and assessments could significantly increase our non-interest expense.
FDIC insurance premiums increased significantly in 2009 and we expect to pay higher FDIC premiums in the future. Recent bank failures have substantially depleted the insurance fund of the FDIC and reduced the fund’s ratio of reserves to insured deposits. The FDIC adopted a revised risk-based deposit insurance assessment schedule on February 27, 2009, which raised deposit insurance premiums. On May 22, 2009, the FDIC also implemented a special assessment equal to five basis points of each insured depository institution’s assets minus Tier 1 capital as of June 30, 2009, but no more than ten basis points multiplied by the institution’s assessment base for the second quarter of 2009. As a result, PBI Bank paid a special assessment of $781,000 on September 30, 2009.
On November 12, 2009, the FDIC adopted a new rule which required insured institutions to prepay on December 30, 2009, an estimated quarterly risk-based assessment for the 4th quarter of 2009 and for all 2010, 2011, and 2012. On December 30, 2009, PBI Bank prepaid $7.9 million of FDIC insurance premiums for the next three years. See the “Supervision – PBI Bank – Deposit Insurance Assessment” section of Item 1. “Business.”
We participate in the FDIC’s Transaction Account Guarantee Program, or TAGP, for non-interest-bearing transaction deposit accounts. The TAGP is a component of the FDIC’s Temporary Liquidity Guarantee Program, or TLGP. Banks that participate in the TAGP paid the FDIC annualized fees of ten basis points on the amounts in such accounts above the amounts covered by FDIC deposit insurance through December 31, 2009. The FDIC has established an extension period for the TAGP to run from January 1, 2010 through June 30, 2010. During the extension period, the fees for participating banks will range from 15 to 25 basis points, depending on the risk category to which the bank is assigned for deposit insurance assessment purposes.
To the extent that assessments under the TAGP are insufficient to cover any loss or expenses arising from the TLGP, the FDIC is authorized to impose an emergency special assessment on all FDIC-insured depository institutions. The FDIC has authority to impose charges for the TLGP upon depository institution holding companies, as well. These charges would cause the premiums and TAGP assessments charged by the FDIC to increase. These actions could significantly increase our non-interest expense for the foreseeable future.
We are a holding company and depend on our subsidiaries for dividends and distributions.
We are a legal entity separate and distinct from our banking and other subsidiaries. Our principal source of cash flow, from which we fund any dividends paid to our shareholders, is dividends from PBI Bank. There are statutory and regulatory limitations on the payment of dividends by PBI Bank to us, as well as by us to our shareholders. Regulations of the Federal Reserve affect our ability to pay dividends and other distributions to our shareholders. Regulations of the FDIC and the KDFI affect the ability of PBI Bank to pay dividends and other distributions to us, which requires the consent of those regulators. See the “Supervision-Porter Bancorp-Dividends” section of Item 1. “Business” and the “Dividends” section of Item 5. “Market for Registrant’s Common Equity, Related Stockholder Matters and Issuer Purchases of Equity Securities” of this Annual Report on Form 10-K.
We face strong competition from other financial institutions and financial service companies, which could adversely affect our results of operations and financial condition.
We compete with other financial institutions in attracting deposits and making loans. Our competition in attracting deposits comes principally from other commercial banks, credit unions, savings and loan associations, securities brokerage firms, insurance companies, money market funds and other mutual funds. Our competition in making loans comes principally from other commercial banks, credit unions, savings and loan associations, mortgage banking firms and consumer finance companies. In addition, competition for business in the Louisville metropolitan area has grown in recent years as changes in banking law have allowed several banks to enter the market by establishing new branches. Likewise, competition is increasing in the other growing markets we have targeted, which may adversely affect our ability to execute our plans for expansion. Moreover, our advantage from having operated a nationally recognized online banking division since 1999 may diminish, as nearly all of our competitors now offer online banking and may become more successful in attracting online business over time as they become more experienced.
15
Table of Contents
Competition in the banking industry may also limit our ability to attract and retain banking clients. We maintain smaller staffs of associates and have fewer financial and other resources than larger institutions with which we compete. Financial institutions that have far greater resources and greater efficiencies than we do may have several marketplace advantages resulting from their ability to:
| • | offer higher interest rates on deposits and lower interest rates on loans than we can; |
| • | offer a broader range of services than we do; |
| • | maintain more branch locations than we do; and |
| • | mount extensive promotional and advertising campaigns. |
In addition, banks and other financial institutions with larger capitalization and other financial intermediaries may not be subject to the same regulatory restrictions as we are and may have larger lending limits than we do. Some of our current commercial banking clients may seek alternative banking sources as they develop needs for credit facilities larger than we can accommodate. If we are unable to attract and retain customers, we may not be able to maintain growth and our results of operations and financial condition may otherwise be negatively impacted.
We depend on our senior management team, and the unexpected loss of one or more of our senior executives could impair our relationship with customers and adversely affect our business and financial results.
Our future success significantly depends on the continued services and performance of our key management personnel, particularly J. Chester Porter, chairman of the board, Maria L. Bouvette, president and chief executive officer, and David B. Pierce, chief financial officer. We do not have employment agreements with any of our senior executives. Our future performance will depend on our ability to motivate and retain these and other key officers. The loss of the services of members of our senior management or other key officers or the inability to attract additional qualified personnel as needed could materially harm our business.
While management continually monitors and improves our system of internal controls, data processing systems, and corporate wide processes and procedures, we may suffer losses from operational risk in the future.
Management maintains internal operational controls and we have invested in technology to help us process large volumes of transactions. However, we may not be able to continue processing at the same or higher levels of transactions. If our systems of internal controls should fail to work as expected, if our systems were to be used in an unauthorized manner, or if employees were to subvert the system of internal controls, significant losses could occur.
We process large volumes of transactions on a daily basis and are exposed to numerous types of operation risk, which could cause us to incur substantial losses. Operational risk resulting from inadequate or failed internal processes, people, and systems includes the risk of fraud by employees or persons outside of our company, the execution of unauthorized transactions by employees, errors relating to transaction processing and systems, and breaches of the internal control system and compliance requirements. This risk of loss also includes potential legal actions that could arise as a result of the operational deficiency or as a result of noncompliance with applicable regulatory standards.
We establish and maintain systems of internal operational controls that provide management with timely and accurate information about our level of operational risk. While not foolproof, these systems have been designed to manage operational risk at appropriate, cost effective levels. We have also established procedures that are designed to ensure that policies relating to conduct, ethics and business practices are followed. Nevertheless, we experience loss from operational risk from time to time, including the effects of operational errors, and these losses may be substantial.
We operate in a highly regulated environment and, as a result, are subject to extensive regulation and supervision that could adversely affect our financial performance and our ability to implement our growth and operating strategies.
We are subject to examination, supervision and comprehensive regulation by federal and state regulatory agencies, which is described under “Item 1 - Business—Supervision and Regulation.” Regulatory oversight of banks is primarily intended to protect depositors, the federal deposit insurance funds, and the banking system as a whole, not our shareholders. Compliance with these regulations is costly and may make it more difficult to operate profitably.
Federal and state banking laws and regulations govern numerous matters including the payment of dividends, the acquisition of other banks and the establishment of new banking offices. We must also meet specific regulatory capital requirements. Our failure to comply with these laws, regulations and policies or to maintain our capital requirements could affect our ability to pay dividends on common stock, our ability to grow through the development of new offices and our ability to make acquisitions. These limitations may prevent us from successfully implementing our growth and operating strategies.
16
Table of Contents
In addition, the laws and regulations applicable to banks could change at any time, which could significantly impact our business and profitability. For example, new legislation or regulation could limit the manner in which we may conduct our business, including our ability to attract deposits and make loans. Events that may not have a direct impact on us, such as the bankruptcy or insolvency of a prominent U.S. corporation, can cause legislators and banking regulators and other agencies such as the Financial Accounting Standards Board, the SEC, the Public Company Accounting Oversight Board and various taxing authorities to respond by adopting and or proposing substantive revisions to laws, regulations, rules, standards, policies and interpretations. The nature, extent, and timing of the adoption of significant new laws and regulations, or changes in or repeal of existing laws and regulations may have a material impact on our business and results of operations. Changes in regulation may cause us to devote substantial additional financial resources and management time to compliance, which may negatively affect our operating results.
Changes in banking laws could have a material adverse effect on us.
We are subject to changes in federal and state laws as well as changes in banking and credit regulations, and governmental economic and monetary policies. We cannot predict whether any of these changes may adversely and materially affect us. The current regulatory environment for financial institutions entails significant potential increases in compliance requirements and associated costs. Federal and state banking regulators also possess broad powers to take supervisory actions as they deem appropriate. These supervisory actions may result in higher capital requirements, higher insurance premiums and limitations on our activities that could have a material adverse effect on our business and profitability.
Legislative and regulatory actions taken now or in the future to address the current liquidity and credit crisis in the financial industry may significantly affect our financial condition, results of operation, liquidity or stock price.
Recent events in the financial services industry and, more generally, in the financial markets and the economy, have led to various proposals for changes in the regulation of the financial services industry. Earlier in 2009, legislation proposing significant structural reforms to the financial services industry was introduced in the U.S. Congress. Among other things, the legislation proposes the establishment of a Consumer Financial Protection Agency, which would have broad authority to regulate providers of credit, savings, payment and other consumer financial products and services. Additional legislative proposals include the Federal Reserve’s proposed guidance on incentive compensation policies at banking organizations and the FDIC’s proposed rules tying employee compensation to assessments for deposit insurance. Proposals have also been introduced to limit a lender’s ability to foreclose on mortgages or make such foreclosures less economically viable, including by allowing Chapter 13 bankruptcy plans to “cram down” the value of certain mortgages on a consumer’s principal residence to its market value and/or reset interest rates and monthly payments to permit defaulting debtors to remain in their home.
While there can be no assurance that any or all of these regulatory or legislative changes will ultimately be adopted, any such changes, if enacted or adopted, may impact the profitability of our business activities, require we change certain of our business practices or affect retention of key personnel, and could expose us to additional costs (including increased compliance costs). These changes may also require us to invest significant management attention and resources to make any necessary changes, and could therefore also adversely affect our business and operations.
As a result of our participation in the TARP Capital Purchase Program, we are subject to significant restrictions on compensation payable to our executive officers and other key employees.
Our ability to attract and retain key officers and employees may be further impacted by legislation and regulation affecting the financial services industry. As noted above, in early 2009, the ARRA was signed into law. The ARRA, through the implementing regulations of the U.S. Treasury, significantly expanded the executive compensation restrictions originally imposed on TARP participants. Among other things, these restrictions limit our ability to pay bonuses and other incentive compensation and make severance payments. These restrictions will continue to apply to us for as long as the preferred stock we issued pursuant to the TARP Capital Purchase Program remains outstanding. These restrictions may negatively affect our ability to compete with financial institutions that are not subject to the same limitations.
| Item 1B. | Unresolved Staff Comments |
Not applicable.
17
Table of Contents
| Item 2. | Properties |
PBI Bank has 18 full-service banking offices. The following table shows the location, square footage and ownership of each property. We believe that each of these locations is adequately insured. Data processing and support operations are located in the Main office in Louisville and the Glasgow office building on Columbia Avenue. Trust services and operations are located in the Campbell Lane office in Bowling Green.
| Markets |
Square Footage | Owned/Leased | ||
| Louisville/Jefferson, Bullitt and Henry Counties |
||||
| Main Office: 2500 Eastpoint Parkway, Louisville |
30,000 | Owned | ||
| Eminence Office: 645 Elm Street, Eminence |
1,500 | Owned | ||
| Hillview Office: 11998 Preston Highway, Hillview |
3,500 | Owned | ||
| Pleasureville Office: 5440 Castle Highway, Pleasureville |
10,000 | Owned | ||
| Shepherdsville Office: 340 South Buckman Street, Shepherdsville |
10,000 | Owned | ||
| Conestoga Office: 155 Conestoga Parkway, Shepherdsville |
3,900 | Owned | ||
| Lexington/Fayette County |
||||
| Lexington Office: 2424 Harrodsburg Road, Suite 100, Lexington |
8,500 | Leased | ||
| South Central Kentucky |
||||
| Brownsville Office: 113 East Main, Brownsville |
8,500 | Owned | ||
| Greensburg Office: 202-04 North Main Street, Greensburg |
11,000 | Owned | ||
| Horse Cave Office: 210 East Main Street, Horse Cave |
5,000 | Owned | ||
| Morgantown Office: 112 West Logan Street, Morgantown |
7,500 | Owned | ||
| Munfordville Office: 949 South Dixie Highway, Munfordville |
9,000 | Owned | ||
| Northside Office: 1300 North Main Street, Beaver Dam |
3,200 | Owned | ||
| Wal-Mart Office: 1701 North Main Street, Beaver Dam |
500 | Leased | ||
| Owensboro/Davies County |
||||
| Owensboro Office: 1819 Frederica Street, Owensboro |
3,000 | Owned | ||
| Southern Kentucky |
||||
| Fairview Office: 1042 Fairview Avenue, Bowling Green |
3,300 | Leased | ||
| Campbell Lane Office: 751 Campbell Lane, Bowling Green |
7,500 | Owned | ||
| Glasgow Office: 1006 West Main Street, Glasgow |
12,000 | Owned | ||
| Other Properties |
||||
| Office Building: 701 Columbia Avenue, Glasgow |
19,000 | Owned | ||
| Canmer Office: 2708 North Jackson Highway, Canmer |
5,000 | Owned | ||
| Item 3. | Legal Proceedings |
In the normal course of operations, we are defendants in various legal proceedings. In the opinion of management, there is no proceeding pending or, to the knowledge of our management, threatened litigation in which an adverse decision could result in a material adverse change in our business or consolidated financial position.
| Item 4. | Reserved |
18
Table of Contents
| Item 5. | Market for Registrant’s Common Equity, Related Stockholder Matters and Issuer Purchases of Equity Securities |
Market Information
Our common stock is traded on the NASDAQ Global Market under the ticker symbol “PBIB”. The following table presents the high and low sales prices for our common stock reported on the NASDAQ Global Market for the periods indicated. All per share data has been restated to reflect stock dividends.
| 2009 | |||||||||
| Market Value | Dividend | ||||||||
| Quarter Ended |
High | Low | |||||||
| Fourth Quarter |
$ | 16.65 | $ | 13.61 | $ | 0.20 | |||
| Third Quarter |
17.24 | 13.92 | 0.20 | ||||||
| Second Quarter |
14.91 | 11.19 | 0.20 | ||||||
| First Quarter |
15.11 | 9.29 | 0.20 | ||||||
| 2008 | |||||||||
| Market Value | Dividend | ||||||||
| Quarter Ended |
High | Low | |||||||
| Fourth Quarter |
$ | 17.91 | $ | 13.97 | $ | 0.20 | |||
| Third Quarter |
17.84 | 13.33 | 0.19 | ||||||
| Second Quarter |
16.87 | 13.62 | 0.19 | ||||||
| First Quarter |
18.12 | 15.52 | 0.19 | ||||||
As of December 31, 2009, we had approximately 998 shareholders, including 208 shareholders of record and approximately 790 beneficial owners whose shares are held in “street” name by securities broker-dealers or other nominees.
19
Table of Contents
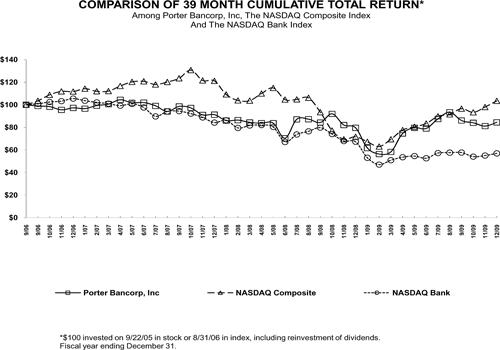
Dividends
Shareholders of a Kentucky corporation are entitled to receive such dividends and other distributions when, as and if declared from time to time by the board of directors out of funds legally available for distributions to shareholders. Any future determination relating to the payment of dividends will be made at the discretion of our Board of Directors and will depend on a number of factors, including our future earnings, capital requirements, financial condition, future prospects and other factors that our board of directors may deem relevant. Also, Porter Bancorp is a bank holding company, and its ability to declare and pay dividends depends on certain federal regulatory considerations, including the guidelines of the Federal Reserve regarding capital adequacy and dividends.
As a bank holding company, our principal source of revenue is the dividends that may be declared from time to time by PBI Bank out of funds legally available for payment of dividends. PBI Bank must obtain the prior written consent of its primary regulators prior to declaring or paying any future dividends. In addition to this current restriction, various banking laws applicable to PBI Bank limit its payment of dividends to us. A Kentucky chartered bank may declare a dividend of an amount of the bank’s net profits as the board deems appropriate. The approval of the KDFI is required if the total of all dividends declared by the bank in any calendar year exceeds the total of its net profits for that year combined with its retained net profits for the preceding two years, less any required transfers to surplus or a fund for the retirement of preferred stock or debt. On July 1, 2008, PBI Bank sold a $9 million subordinated capital note to Silverton Bank, N.A., which has been assumed by the FDIC as receiver for Silverton Bank, N.A. The capital note provides that if PBI Bank is in default under the terms of the capital note, PBI Bank would be prohibited from paying dividends on its common stock.
On November 21, 2008, we sold $35 million of senior preferred stock to the U.S. Treasury pursuant to the CPP. The terms of the transaction with the U.S. Treasury limit our ability to pay dividends. For three years after issuance or until the U.S. Treasury no longer holds any preferred shares, we will not be able to increase our dividends above the current quarterly level of $0.20 per common share without the U.S. Treasury’s approval with limited exceptions, most significantly the repurchase of our common stock to offset share dilution from equity-based compensation awards. Also, we will not be able to pay any dividends at all unless we are current on our dividend payments on the preferred shares.
20
Table of Contents
In addition, we have issued an aggregate of approximately $25.0 million in our junior subordinated debentures to our subsidiary trusts. We pay interest on the debentures, which is used by the trusts to pay distributions on the trust preferred securities issued by them. The indenture governing the issuance of each of these debentures provides that if we fail to make an interest payment on the debentures, we would be prohibited from paying dividends on our common stock until all debenture interest payments are current. Accordingly, if we are unable to pay interest on these debentures, we will be contractually restricted from paying dividends on our common stock.
Purchases of Equity Securities by Issuer
In December 2006, the Company’s Board of Directors approved the repurchase of shares of Porter Bancorp’s common stock in an amount not to exceed $3 million, exclusive of any fees or commissions. As of December 31, 2009, Porter Bancorp had approximately $2.5 million remaining to purchase shares under the current stock repurchase program. The program authorizes Porter Bancorp to repurchase shares from time to time in open market transactions or privately negotiated transactions at its discretion, subject to market conditions and other factors. The Company did not repurchase any shares in the fourth quarter of 2009. The terms of the $35 million senior preferred stock transaction with the U.S. Treasury limit our ability repurchase shares of common stock until after November 21, 2011, unless the preferred shares sold to the U.S. Treasury have been redeemed in whole or transferred to an unaffiliated third party.
21
Table of Contents
| Item 6. | Selected Financial Data |
The following table summarizes our selected historical consolidated financial data from 2005 to 2009. You should read this information in conjunction with Item 7. “Management’s Discussion and Analysis of Financial Condition and Results of Operations” and Item 8. “Financial Statements and Supplementary Data.” Since 2004, we have combined several banks and bank holding companies in which we or our principal shareholders have held a controlling interest. Our company and its surviving bank subsidiary also terminated their elections to be subchapter S corporations as a result of this reorganization, which was completed effective December 31, 2005. Under U.S. generally accepted accounting principles (“GAAP”), entities that are more than 50% owned by another person or entity are generally consolidated for financial reporting purposes. Accordingly, for all periods presented, all of the assets and liabilities of our former subsidiaries, regardless of our previous percentage of ownership in these entities, are included in our consolidated balance sheet. Our consolidated net income, however, includes our subsidiaries’ net income only to the extent of our previous ownership percentage. In addition, financial data as of dates before and for periods ended through December 31, 2005 have been derived from both S corporations and C corporations within our consolidated group. Beginning on December 31, 2005, and for all subsequent periods, our financial data will reflect that our consolidated group consists entirely of C corporations.
Selected Consolidated Financial Data
| As of and for the Years Ended December 31, | |||||||||||||||
| (Dollars in thousands except per share data) |
2009 | 2008 | 2007 | 2006 | 2005 | ||||||||||
| Income Statement Data: |
|||||||||||||||
| Interest income |
$ | 94,466 | $ | 100,107 | $ | 91,800 | $ | 72,863 | $ | 62,054 | |||||
| Interest expense |
40,412 | 52,881 | 49,404 | 35,622 | 25,665 | ||||||||||
| Net interest income |
54,054 | 47,226 | 42,396 | 37,241 | 36,389 | ||||||||||
| Provision for loan losses |
14,200 | 5,400 | 4,025 | 1,405 | 3,645 | ||||||||||
| Non-interest income |
7,094 | 6,868 | 5,556 | 5,196 | 5,433 | ||||||||||
| Non-interest expense |
30,456 | 27,757 | 22,474 | 19,785 | 20,047 | ||||||||||
| Income before minority interest and taxes |
16,492 | 20,937 | 21,453 | 21,247 | 18,130 | ||||||||||
| Minority interest in net income of consolidated subsidiaries |
— | — | — | — | 1,314 | ||||||||||
| Income before income taxes |
16,492 | 20,937 | 21,453 | 21,247 | 16,816 | ||||||||||
| Income tax expense |
5,424 | 6,927 | 7,224 | 6,908 | 2,201 | ||||||||||
| Net income |
11,068 | 14,010 | 14,229 | 14,339 | 14,615 | ||||||||||
| Less: |
|||||||||||||||
| Dividends on preferred stock |
1,750 | 194 | — | — | — | ||||||||||
| Accretion on preferred stock |
176 | 20 | — | — | — | ||||||||||
| Net income available to common |
$ | 9,142 | $ | 13,796 | $ | 14,229 | $ | 14,339 | $ | 14,615 | |||||
| Common Share Data (1): |
|||||||||||||||
| Basic and diluted earnings per common share |
$ | 1.05 | $ | 1.59 | $ | 1.68 | $ | 1.94 | $ | 2.26 | |||||
| Cash dividends declared per common share |
0.80 | 0.77 | 0.74 | 0.73 | 1.52 | ||||||||||
| Book value per common share |
15.34 | 14.85 | 14.07 | 12.89 | 10.30 | ||||||||||
| Tangible book value per common share |
12.01 | 11.74 | 11.61 | 11.29 | 8.45 | ||||||||||
| Balance Sheet Data (at period end): |
|||||||||||||||
| Total assets |
$ | 1,835,090 | $ | 1,647,857 | $ | 1,456,020 | $ | 1,051,006 | $ | 991,481 | |||||
| Debt obligations: |
|||||||||||||||
| FHLB advances |
82,980 | 142,776 | 121,767 | 47,562 | 63,563 | ||||||||||
| Junior subordinated debentures |
25,000 | 25,000 | 25,000 | 25,000 | 25,000 | ||||||||||
| Subordinated capital note |
9,000 | 9,000 | — | — | — | ||||||||||
| Notes payable |
— | — | — | — | 9,600 | ||||||||||
| Average Balance Data: |
|||||||||||||||
| Average assets |
$ | 1,714,131 | $ | 1,572,599 | $ | 1,221,649 | $ | 995,018 | $ | 942,733 | |||||
| Average loans |
1,371,034 | 1,324,658 | 1,019,628 | 814,202 | 776,207 | ||||||||||
| Average deposits |
1,385,572 | 1,250,614 | 997,287 | 810,419 | 771,677 | ||||||||||
| Average FHLB advances |
106,259 | 138,954 | 69,276 | 57,847 | 54,342 | ||||||||||
| Average junior subordinated debentures |
25,000 | 25,000 | 25,000 | 25,000 | 25,000 | ||||||||||
| Average subordinated capital note |
9,000 | 4,525 | — | — | — | ||||||||||
| Average notes payable |
— | — | 14 | 7,329 | 100 | ||||||||||
| Average stockholders’ equity |
168,752 | 131,706 | 114,797 | 83,428 | 68,922 | ||||||||||
| (1) | Common share data has been adjusted to reflect a 5% stock dividend effective November 19, 2009 and November 10, 2008. |
| (2) | Efficiency ratio is computed by dividing non-interest expense by the sum of net interest income and non-interest income excluding gains (losses) on sales of securities. |
22
Table of Contents
| Item 7. | Management’s Discussion and Analysis of Financial Condition and Results of Operation |
Management’s discussion and analysis of financial condition and results of operations analyzes the consolidated financial condition and results of operations of Porter Bancorp Inc. and its wholly owned subsidiary, PBI Bank. Porter Bancorp, Inc. is a Louisville, Kentucky-based bank holding company which operates 18 full-service banking offices in twelve counties through its wholly-owned subsidiary, PBI Bank. Our markets include metropolitan Louisville in Jefferson County and the surrounding counties of Henry and Bullitt, and extend south along the Interstate 65 corridor to Tennessee. We serve south central Kentucky and southern Kentucky from banking offices in Butler, Green, Hart, Edmonson, Barren, Warren, Ohio, and Daviess Counties. We also have an office in Lexington, Kentucky, the second largest city in Kentucky. Our markets have experienced annual positive deposit growth rates in recent years with the trend expected to continue for the next few years. The Bank is both a traditional community bank with a wide range of commercial and personal banking products and an innovative online bank which delivers competitive deposit products and services through an on-line banking division operating under the name of Ascencia.
We focus on commercial and commercial real estate lending, both in markets where we have banking offices and other growing markets in our region. Commercial, commercial real estate and real estate construction loans accounted for 65.8% of our total loan portfolio as of December 31, 2009, and 67.9% as of December 31, 2008, and contributed significantly to our earnings. Commercial lending generally produces higher yields than residential lending, but requires more rigorous underwriting standards and credit quality monitoring.
Overview
The following discussion should be read in conjunction with our consolidated financial statements and accompanying notes and other schedules presented elsewhere in the report.
For the year ended December 31, 2009, we reported net income of $11.1 million compared to net income of $14.0 million for the year ended December 31, 2008. Basic and diluted earnings per common share were $1.05 for the year ended December 31, 2009, compared to $1.59 for 2008. While we are pleased to report profitable results for 2009, we remain challenged by the overall economic environment and credit trends in our loan portfolio. Non-performing loans climbed to 6.0% of total loans and nonperforming assets stand at 5.42% of total assets at December 31, 2009. We remain diligent in the management of our portfolio and are striving to improve credit quality by working throughout our markets with our clients to balance selective new customer acquisition, customer service for our existing clients and prudent risk management.
Significant developments for the year ended December 31, 2009 were:
| • | Loans grew 4.7% to $1.41 billion compared to $1.35 billion at December 31, 2008. |
| • | Total assets increased 11.4% to $1.8 billion since the 2008 year-end. |
| • | Deposits grew 18.7% to $1.5 billion compared with $1.3 billion at December 31, 2008. |
| • | Our efficiency ratio improved to 50.1% for 2009 compared with 50.7% for 2008 and continued to outperform our peer group. |
| • | Net interest margin increased to 3.33% for 2009 compared to 3.20% for 2009 as a result of increased average earning assets and decreased cost of funds. |
| • | Provision for loan losses increased $8.8 million in comparison to 2008 as the result of loan growth, an increase in non-performing loans, and increased net loan charge-offs of $7.5 million, or 0.54% of average loans for 2009, compared with $3.5 million, or 0.27% of average loans for 2008. |
| • | Porter Bancorp’s stock was added to the Russell 2000 and Russell 3000 indexes effective June 29, 2009. |
These items are discussed in further detail throughout this “Management’s Discussion and Analysis of Financial Condition and Results of Operations” Section.
On October 1, 2007, we completed the acquisition of Ohio County Bancshares, and its wholly owned subsidiary Kentucky Trust Bank. The aggregate purchase price was $12 million paid in cash and stock. We acquired $120.1 million in assets and $94.5 million in deposits and recorded $5.3 million in goodwill and $3.0 million in core deposit intangibles. This acquisition established our presence in Ohio and Daviess counties and improved our market position in Warren County.
On February 1, 2008, we completed the acquisition of Paramount Bank in Lexington, Kentucky, in a $5 million all cash transaction. We acquired $75 million in assets and $76 million in deposits and recorded goodwill of $6.0 million and $631,000 in core deposit intangibles. This acquisition established our physical presence in Lexington, Kentucky, Fayette County, the second largest market in the state.
23
Table of Contents
Application of Critical Accounting Policies
Our accounting and reporting policies comply with GAAP and conform to general practices within the banking industry. We believe that of our significant accounting policies, the following may involve a higher degree of management assumptions and judgments that could result in materially different amounts to be reported if conditions or underlying circumstances were to change.
Allowance for Loan Losses – PBI Bank maintains an allowance for loan losses believed to be sufficient to absorb probable incurred credit losses existing in the loan portfolio, and the senior loan committee evaluates the adequacy of the allowance for loan losses on a quarterly basis. We evaluate the adequacy of the allowance using, among other things, historical loan loss experience, known and inherent risks in the portfolio, adverse situations that may affect the borrower’s ability to repay, estimated value of the underlying collateral and current economic conditions. While we evaluate the allowance for loan losses, in part, based on historical losses within each loan category, estimates for losses within the commercial real estate portfolio depend more on credit analysis and recent payment performance. The allowance may be allocated for specific loans or loan categories, but the entire allowance is available for any loan that, in management’s judgment, should be charged off. The allowance consists of specific and general components. The specific component relates to loans that are individually classified as impaired or loans otherwise classified as substandard or doubtful. The general component covers non-classified loans and is based on historical loss experience adjusted for current factors. The methodology for allocating the allowance for loan and lease losses takes into account our increase in commercial and consumer lending. We increase the amount of the allowance allocated to commercial loans and consumer loans in response to the growth of the commercial and consumer loan portfolios and management’s recognition of the higher risks and loan losses in these lending areas. We develop allowance estimates based on actual loss experience adjusted for current economic conditions. Allowance estimates are a prudent measurement of the risk in the loan portfolio which we apply to individual loans based on loan type. If the mix and amount of future charge-off percentages differ significantly from those assumptions used by management in making its determination, we may be required to materially increase our allowance for loan losses and provision for loan losses, which could adversely affect our results.
Goodwill and Intangible Assets – We test goodwill and intangible assets that have indefinite useful lives for impairment at least annually and more frequently if circumstances indicate their value may not be recoverable. We test goodwill for impairment by comparing the fair value of the reporting unit to the book value of the reporting unit. If the fair value, net of goodwill, exceeds book value, then goodwill is not considered to be impaired. Intangible assets that are not amortized will be tested for impairment at least annually by comparing the fair values of those assets to their carrying values. Other identifiable intangible assets that are subject to amortization are amortized on an accelerated basis over the years expected to be benefited, which we believe is 10 years. We review these amortizable intangible assets for impairment if circumstances indicate their value may not be recoverable based on a comparison of fair value to carrying value. Based on the annual goodwill impairment test as of December 31, 2009, management does not believe any of the goodwill is impaired as of that date. While management believes no impairment existed at December 31, 2009 under accounting standards applicable at that date, different conditions or assumptions, or changes in cash flows or profitability, if significantly negative or unfavorable, could have a material adverse effect on the outcome of the impairment evaluation and financial condition or future results of operations.
Stock-based Compensation – Compensation cost is recognized for stock options and restricted stock awards issued to employees, based on the fair value of these awards at the date of grant. A Black-Scholes model, which requires the input of highly subjective assumptions, such as volatility, risk-free interest rates and dividend pay-out rates, is utilized to estimate the fair value of stock options, while the market price of the Company’s common stock at the date of grant is used for restricted stock awards. Compensation cost is recognized over the required service period, generally defined as the vesting period. For awards with graded vesting, compensation cost is recognized on a straight-line basis over the requisite service period for the entire award.
Valuation of Deferred Tax Asset –We evaluate deferred tax assets quarterly. We will realize this asset to the extent it is profitable or carry back tax losses to periods in which we paid income taxes. Our determination of the realization of the deferred tax asset will be based upon management’s judgment of various future events and uncertainties, including the timing and amount of future income we will earn and the implementation of various tax plans to maximize realization of the deferred tax assets. Management believes we will generate sufficient operating earnings to realize the deferred tax benefits. Examinations of our income tax returns or changes in tax law may impact the tax liabilities and resulting provisions for income taxes.
24
Table of Contents
Results of Operations
The following table summarizes components of income and expense and the change in those components for 2009 compared with 2008:
| For the Years Ended December 31, |
Change from Prior Period | |||||||||||||
| 2009 | 2008 | Amount | Percent | |||||||||||
| (dollars in thousands) | ||||||||||||||
| Gross interest income |
$ | 94,466 | $ | 100,107 | $ | (5,641 | ) | (5.6 | )% | |||||
| Gross interest expense |
40,412 | 52,881 | (12,469 | ) | (23.6 | ) | ||||||||
| Net interest income |
54,054 | 47,226 | 6,828 | 14.5 | ||||||||||
| Provision for credit losses |
14,200 | 5,400 | 8,800 | 163.0 | ||||||||||
| Non-interest income |
6,779 | 7,475 | (696 | ) | (9.3 | ) | ||||||||
| Gains (losses) on sale of securities, net |
315 | (136 | ) | 451 | 331.6 | |||||||||
| Other than temporary impairment on securities |
— | (471 | ) | 471 | 100.0 | |||||||||
| Non-interest expense |
30,456 | 27,757 | 2,699 | 9.7 | ||||||||||
| Net income before taxes |
16,492 | 20,937 | (4,445 | ) | (21.2 | ) | ||||||||
| Income tax expense |
5,424 | 6,927 | (1,503 | ) | (21.7 | ) | ||||||||
| Net income |
11,068 | 14,010 | (2,942 | ) | (21.0 | ) | ||||||||
| Dividends on preferred stock |
1,750 | 194 | 1,556 | 802.1 | ||||||||||
| Accretion on preferred stock |
176 | 20 | 156 | 780.0 | ||||||||||
| Net income available to common |
9,142 | 13,796 | (4,654 | ) | (33.7 | ) | ||||||||
Net income of $11.1 million for the year ended December 31, 2009 decreased $2.9 million, or 21.0%, from $14.0 million for 2008. Net income available to common of $9.1 million for the year ended December 31, 2009 decreased $4.7 million, or 33.7%, from $13.8 million for 2008. This decrease in earnings was primarily attributable to increased provision for loan losses expense. Provision for loan losses expense increased $8.8 million, or 163.0%, in comparison to 2008 as a result of an increase in non-performing loans, increased net loan charge-offs of $7.5 million, or 0.54% of average loans for 2009, compared with $3.5 million, or 0.27% of average loans for 2008, and modest loan growth. Non-interest income decreased $696,000, or 9.3%, in comparison to 2008 primarily as a result of decreased service charges on deposit accounts, and decreased income from fiduciary activities. These decreases were partially offset by increased gains on sales of investment securities and no recurrence of other than temporary impairment write-downs on investment securities during 2009. Non-interest expense increased $2.7 million, or 9.7%, in comparison to 2008 as a result of increased salary and benefits expense, increased occupancy and equipment expense, and increased expense related to other real estate owned. Professional fees increased due to costs associated with our abandoned tender offer to acquire Citizens First Corporation of Bowling Green, Kentucky, that was terminated in December. In addition, FDIC insurance premiums rose significantly due to amendments made by the FDIC in 2007 to its risk-based deposit premium assessment systems and increases in premium rates and a special assessment in 2009. The increased dividends and accretion on preferred stock of $1.6 million and $156,000, respectively, from 2008 was the result of preferred stock being outstanding for 12 months during 2009 versus 41 days during 2008.
The following table summarizes components of income and expense and the change in those components for 2008 compared with 2007:
| For the Years Ended December 31, |
Change from Prior Period | |||||||||||||
| 2008 | 2007 | Amount | Percent | |||||||||||
| (dollars in thousands) | ||||||||||||||
| Gross interest income |
$ | 100,107 | $ | 91,800 | $ | 8,307 | 9.0 | % | ||||||
| Gross interest expense |
52,881 | 49,404 | 3,477 | 7.0 | ||||||||||
| Net interest income |
47,226 | 42,396 | 4,830 | 11.4 | ||||||||||
| Provision for credit losses |
5,400 | 4,025 | 1,375 | 34.2 | ||||||||||
| Non-interest income |
7,475 | 5,449 | 2,026 | 37.2 | ||||||||||
| Gains (losses) on sale of securities, net |
(136 | ) | 107 | (243 | ) | (227.1 | ) | |||||||
| Other than temporary impairment on securities |
(471 | ) | — | (471 | ) | (100.0 | ) | |||||||
| Non-interest expense |
27,757 | 22,474 | 5,283 | 23.5 | ||||||||||
| Net income before taxes |
20,937 | 21,453 | (516 | ) | (2.4 | ) | ||||||||
| Income tax expense |
6,927 | 7,224 | (297 | ) | (4.1 | ) | ||||||||
| Net income |
14,010 | 14,229 | (219 | ) | (1.5 | ) | ||||||||
| Dividends on preferred stock |
194 | — | 194 | 100.0 | ||||||||||
| Accretion on preferred stock |
20 | — | 20 | 100.0 | ||||||||||
| Net income available to common |
13,796 | 14,229 | (433 | ) | (3.0 | ) | ||||||||
25
Table of Contents
Net income of $14.0 million for the year ended December 31, 2008 decreased $219,000, or 1.5%, from $14.2 million for 2007. Net income available to common of $13.8 million for the year ended December 31, 2008 decreased $433,000, or 3.0%, from $14.2 million for 2007. This decrease in earnings was primarily attributable to increased provision for loan losses expense. Provision for loan losses expense increased $1.4 million, or 34.2%, in comparison to 2007 as a result of our loan growth, an increase in non-performing loans, and increased net loan charge-offs of $3.5 million, or 0.27% of average loans for 2008, compared with $2.1 million, or 0.21% of average loans for 2007. Non-interest income increased $2.0 million, or 37.2%, in comparison to 2007 primarily as a result of increased service charges on deposit accounts, income from fiduciary activities originating from the trust operation acquired with Kentucky Trust Bank, and the gain on sale of our Burkesville branch. These increases were partially offset by reduced gains on sales of investment securities and other than temporary impairment write-downs on investment securities. Non-interest expense increased $5.3 million, or 23.5%, in comparison to 2007 as a result of increased salary and benefits expense and an increase in occupancy and equipment expense primarily related to the Kentucky Trust Bank acquisition. In addition, FDIC insurance premiums rose significantly due to amendments made by the FDIC in 2007 to its risk-based deposit premium assessment systems. Dividends and accretion on preferred stock for 2008 resulted from our issuance of $35 million of preferred stock on November 21, 2008 in accordance with the Capital Purchase Program established under the Emergency Economic Stabilization Act of 2008.
Net Interest Income – Our net interest income was $54.1 million for the year ended December 31, 2009, an increase of $6.8 million, or 14.5%, compared with $47.2 million for the same period in 2008. Net interest spread and margin were 2.99% and 3.33%, respectively, for 2009, compared with 2.79% and 3.20%, respectively, for 2008. The increase in net interest income was primarily the result of higher loan and investment securities volume, but was partially offset by higher volume of certificates of deposit. In addition, our cost of interest bearing liabilities decreased 114 basis points for 2009 while our yield on average earning assets decreased 94 basis points.
Our average interest-earning assets were $1.6 billion for 2009, compared with $1.5 billion for 2008, a 9.8% increase, primarily attributable to loan growth and growth in our investment securities portfolio. Average loans were $1.4 billion for 2009, compared with $1.3 billion for 2008, a 3.5% increase. Average investment securities were $172 million for 2009, compared with $117 million for 2008, a 46.7% increase. Our total interest income decreased 5.6% to $94.5 million for 2009, compared with $100.1 million for 2008. The change was due primarily to lower interest rates on loan volume.
Our average interest-bearing liabilities also increased by 7.3% to $1.4 billion for 2009, compared with $1.3 billion for 2008. Our total interest expense decreased by 23.6% to $40.4 million for 2009, compared with $52.9 million during 2008, due primarily to lower interest rates paid on certificates of deposit, interest-bearing transaction accounts, and FHLB advances. Our average volume of certificates of deposit increased 15.1% to $1.1 billion for 2009, compared with $946.5 million for 2008. The average interest rate paid on certificates of deposits decreased to 3.01% for 2009, compared with 4.31% for 2008.
Our average volume of NOW and money market deposit accounts decreased 8.3% to $162 million for 2009, compared with $177 million for 2008. The average interest paid on these deposits decreased to 1.21% for 2009, compared with 2.16% for 2008. Our average volume of FHLB advances decreased 23.5% to $106.3 million for 2009, compared with $139.0 million for 2008. The average interest rate paid on FHLB advances decreased to 3.47% for 2009, compared with 4.02% for 2008. The decrease in cost of funds was the result of the continued re-pricing of certificates of deposit at maturity at lower interest rates, and decreased rates on interest-bearing transaction accounts and FHLB advances.
Our net interest income was $47.2 million for the year ended December 31, 2008, an increase of $4.8 million, or 11.4%, compared with $42.4 million for the same period in 2007. Net interest spread and margin were 2.79% and 3.20%, respectively, for 2008, compared with 3.11% and 3.67%, respectively, for 2007. The increase in net interest income was primarily the result of higher loan volume, but was partially offset by the reduction in net interest margin due to short-term pressure from the Federal Reserve’s actions to reduce short-term interest rates during 2008. The increase of $305.0 million in average loans for 2008, compared to the same period in 2007, was due to the acquisitions of Kentucky Trust Bank and Paramount Bank, and organic growth in our loan portfolio.
Our average interest-earning assets were $1.5 billion for 2008, compared with $1.2 billion for 2007, a 28.1% increase primarily attributable to loan growth and the Kentucky Trust Bank and Paramount Bank acquisitions. Average loans were $1.3 billion for 2008, compared with $1.0 billion for 2007, a 30% increase. Our total interest income increased 9.0% to $100.1 million for 2008, compared with $91.8 million for 2007. The change was due primarily to higher loan volume.
Our average interest-bearing liabilities also increased by 30.6% to $1.3 billion for 2008, compared with $1.0 billion for 2007. Our total interest expense increased by 7.0% to $52.9 million for 2008, compared with $49.4 million during 2007, due primarily to increases in the volume of certificates of deposit and FHLB advances. Our average volume of certificates of deposit increased 27.8% to $946.5 million for 2008, compared with $740.7 million for 2007. The average interest rate paid on certificates of deposits decreased to 4.31% for 2008, compared with 5.09% for 2007. Our average volume of FHLB advances increased 100.6% to $139.0 million for 2008, compared with $69.3 million for 2007. The average interest rate paid on FHLB advances decreased to 4.02% for 2008, compared with 4.71% for 2007. The decrease in cost of funds was the result of the continued re-pricing of certificates of deposit at maturity at lower interest rates, and decreased rates on FHLB advances.
26
Table of Contents
Average Balance Sheets
The following table sets forth the average daily balances, the interest earned or paid on such amounts, and the weighted average yield on interest-earning assets and weighted average cost of interest-bearing liabilities for the periods indicated. Dividing income or expense by the average daily balance of assets or liabilities, respectively, derives such yields and costs for the periods presented.
| For the Years Ended December 31, | ||||||||||||||||||||
| 2009 | 2008 | |||||||||||||||||||
| Average Balance |
Interest Earned/Paid |
Average Yield/Cost |
Average Balance |
Interest Earned/Paid |
Average Yield/Cost |
|||||||||||||||
| (dollars in thousands) | ||||||||||||||||||||
| ASSETS |
||||||||||||||||||||
| Interest-earning assets: |
||||||||||||||||||||
| Loans receivables (1)(2) |
||||||||||||||||||||
| Real estate |
$ | 1,226,403 | $ | 73,843 | 6.02 | % | $ | 1,164,892 | $ | 81,125 | 6.96 | % | ||||||||
| Commercial |
89,010 | 5,705 | 6.41 | 102,726 | 7,238 | 7.05 | ||||||||||||||
| Consumer |
36,848 | 3,209 | 8.71 | 38,786 | 3,637 | 9.38 | ||||||||||||||
| Agriculture |
16,559 | 1,117 | 6.75 | 15,555 | 1,181 | 7.59 | ||||||||||||||
| Other |
2,214 | 96 | 4.34 | 2,699 | 36 | 1.33 | ||||||||||||||
| U.S. Treasury and agencies |
1,279 | 57 | 4.46 | 11,000 | 482 | 4.38 | ||||||||||||||
| Mortgage-backed securities |
134,779 | 7,978 | 5.92 | 76,227 | 3,828 | 5.02 | ||||||||||||||
| State and political subdivision securities (3) |
21,813 | 878 | 6.19 | 20,272 | 818 | 6.21 | ||||||||||||||
| State and political subdivision securities |
2,826 | 154 | 5.45 | 2,455 | 133 | 5.42 | ||||||||||||||
| Corporate bonds |
10,423 | 681 | 6.53 | 6,499 | 382 | 5.88 | ||||||||||||||
| FHLB stock |
10,072 | 466 | 4.63 | 9,876 | 518 | 5.25 | ||||||||||||||
| Other debt securities |
704 | 46 | 6.53 | 704 | 46 | 6.53 | ||||||||||||||
| Other equity securities |
1,901 | 55 | 2.89 | 3,474 | 112 | 3.22 | ||||||||||||||
| Federal funds sold |
21,591 | 18 | 0.08 | 21,138 | 405 | 1.92 | ||||||||||||||
| Interest-bearing deposits in other financial institutions |
60,681 | 163 | 0.27 | 14,853 | 166 | 1.12 | ||||||||||||||
| Total interest-earning assets |
1,637,103 | 94,466 | 5.80 | % | 1,491,156 | 100,107 | 6.74 | % | ||||||||||||
| Less: Allowance for loan losses |
(21,130 | ) | (18,087 | ) | ||||||||||||||||
| Non-interest-earning assets |
98,158 | 99,530 | ||||||||||||||||||
| Total assets |
$ | 1,714,131 | $ | 1,572,599 | ||||||||||||||||
| LIABILITIES AND STOCKHOLDERS’ EQUITY |
||||||||||||||||||||
| Interest-bearing liabilities |
||||||||||||||||||||
| Certificates of deposit and other time deposits |
$ | 1,089,798 | $ | 32,816 | 3.01 | % | $ | 946,477 | $ | 40,811 | 4.31 | % | ||||||||
| NOW and money market deposits |
162,221 | 1,962 | 1.21 | 176,812 | 3,822 | 2.16 | ||||||||||||||
| Savings accounts |
34,386 | 310 | 0.90 | 33,969 | 440 | 1.30 | ||||||||||||||
| Federal funds purchased and repurchase agreements |
11,042 | 476 | 4.31 | 14,045 | 555 | 3.95 | ||||||||||||||
| FHLB advances |
106,259 | 3,691 | 3.47 | 138,954 | 5,589 | 4.02 | ||||||||||||||
| Junior subordinated debentures |
34,000 | 1,157 | 3.40 | 29,525 | 1,664 | 5.64 | ||||||||||||||
| Total interest-bearing liabilities |
1,437,706 | 40,412 | 2.81 | % | 1,339,782 | 52,881 | 3.95 | % | ||||||||||||
| Non-interest-bearing liabilities |
||||||||||||||||||||
| Non-interest-bearing deposits |
99,167 | 93,356 | ||||||||||||||||||
| Other liabilities |
8,506 | 7,755 | ||||||||||||||||||
| Total liabilities |
1,545,379 | 1,440,893 | ||||||||||||||||||
| Stockholders’ equity |
168,752 | 131,706 | ||||||||||||||||||
| Total liabilities and stockholders’ equity |
$ | 1,714,131 | $ | 1,572,599 | ||||||||||||||||
| Net interest income |
$ | 54,054 | $ | 47,226 | ||||||||||||||||
| Net interest spread |
2.99 | % | 2.79 | % | ||||||||||||||||
| Net interest margin |
3.33 | % | 3.20 | % | ||||||||||||||||
| Ratio of average interest-earning assets to average interest-bearing liabilities |
113.87 | % | 111.30 | % | ||||||||||||||||
| (1) | Includes loan fees in both interest income and the calculation of yield on loans. |
| (2) | Calculations include non-accruing loans in average loan amounts outstanding. |
| (3) | Taxable equivalent yields are calculated assuming a 35% federal income tax rate. |
27
Table of Contents
| For the Years Ended December 31, | ||||||||||||||||||||
| 2008 | 2007 | |||||||||||||||||||
| Average Balance |
Interest Earned/Paid |
Average Yield/Cost |
Average Balance |
Interest Earned/Paid |
Average Yield/Cost |
|||||||||||||||
| (dollars in thousands) | ||||||||||||||||||||
| ASSETS |
||||||||||||||||||||
| Interest-earning assets: |
||||||||||||||||||||
| Loans receivables (1)(2) |
||||||||||||||||||||
| Real estate |
$ | 1,164,892 | $ | 81,125 | 6.96 | % | $ | 892,104 | $ | 73,667 | 8.26 | % | ||||||||
| Commercial |
102,726 | 7,238 | 7.05 | 80,795 | 6,727 | 8.33 | ||||||||||||||
| Consumer |
38,786 | 3,637 | 9.38 | 31,453 | 2,969 | 9.44 | ||||||||||||||
| Agriculture |
15,555 | 1,181 | 7.59 | 14,187 | 1,262 | 8.90 | ||||||||||||||
| Other |
2,699 | 36 | 1.33 | 1,089 | 56 | 5.14 | ||||||||||||||
| U.S. Treasury and agencies |
11,000 | 482 | 4.38 | 21,529 | 927 | 4.31 | ||||||||||||||
| Mortgage-backed securities |
76,227 | 3,828 | 5.02 | 59,507 | 3,016 | 5.07 | ||||||||||||||
| State and political subdivision securities (3) |
20,272 | 818 | 6.21 | 16,578 | 684 | 6.35 | ||||||||||||||
| State and political subdivision securities |
2,455 | 133 | 5.42 | 2,458 | 133 | 5.41 | ||||||||||||||
| Corporate bonds |
6,499 | 382 | 5.88 | 2,259 | 143 | 6.33 | ||||||||||||||
| FHLB stock |
9,876 | 518 | 5.25 | 9,155 | 604 | 6.60 | ||||||||||||||
| Other debt securities |
704 | 46 | 6.53 | 217 | 23 | 10.60 | ||||||||||||||
| Other equity securities |
3,474 | 112 | 3.22 | 3,911 | 163 | 4.17 | ||||||||||||||
| Federal funds sold |
21,138 | 405 | 1.92 | 26,575 | 1,331 | 5.01 | ||||||||||||||
| Interest-bearing deposits in other financial institutions |
14,853 | 166 | 1.12 | 2,031 | 95 | 4.68 | ||||||||||||||
| Total interest-earning assets |
1,491,156 | 100,107 | 6.74 | % | 1,163,848 | 91,800 | 7.92 | % | ||||||||||||
| Less: Allowance for loan losses |
(18,087 | ) | (14,130 | ) | ||||||||||||||||
| Non-interest-earning assets |
99,530 | 71,931 | ||||||||||||||||||
| Total assets |
$ | 1,572,599 | $ | 1,221,649 | ||||||||||||||||
| LIABILITIES AND STOCKHOLDERS’ EQUITY |
||||||||||||||||||||
| Interest-bearing liabilities |
||||||||||||||||||||
| Certificates of deposit and other time deposits |
$ | 946,477 | $ | 40,811 | 4.31 | % | $ | 740,693 | $ | 37,711 | 5.09 | % | ||||||||
| NOW and money market deposits |
176,812 | 3,822 | 2.16 | 157,645 | 5,800 | 3.68 | ||||||||||||||
| Savings accounts |
33,969 | 440 | 1.30 | 25,766 | 371 | 1.44 | ||||||||||||||
| Federal funds purchased and repurchase agreements |
14,045 | 555 | 3.95 | 7,858 | 337 | 4.29 | ||||||||||||||
| FHLB advances |
138,954 | 5,589 | 4.02 | 69,276 | 3,260 | 4.71 | ||||||||||||||
| Junior subordinated debentures |
29,525 | 1,664 | 5.64 | 25,000 | 1,924 | 7.70 | ||||||||||||||
| Other borrowing |
— | — | — | 14 | 1 | 7.14 | ||||||||||||||
| Total interest-bearing liabilities |
1,339,782 | 52,881 | 3.95 | % | 1,026,252 | 49,404 | 4.81 | % | ||||||||||||
| Non-interest-bearing liabilities |
||||||||||||||||||||
| Non-interest-bearing deposits |
93,356 | 73,183 | ||||||||||||||||||
| Other liabilities |
7,755 | 7,417 | ||||||||||||||||||
| Total liabilities |
1,440,893 | 1,106,852 | ||||||||||||||||||
| Stockholders’ equity |
131,706 | 114,797 | ||||||||||||||||||
| Total liabilities and stockholders’ equity |
$ | 1,572,599 | $ | 1,221,649 | ||||||||||||||||
| Net interest income |
$ | 47,226 | $ | 42,396 | ||||||||||||||||
| Net interest spread |
2.79 | % | 3.11 | % | ||||||||||||||||
| Net interest margin |
3.20 | % | 3.67 | % | ||||||||||||||||
| Ratio of average interest-earning assets to average interest-bearing liabilities |
111.30 | % | 113.41 | % | ||||||||||||||||
| (1) | Includes loan fees in both interest income and the calculation of yield on loans. |
| (2) | Calculations include non-accruing loans in average loan amounts outstanding. |
| (3) | Taxable equivalent yields are calculated assuming a 35% federal income tax rate. |
28
Table of Contents
Rate/Volume Analysis
The table below sets forth information regarding changes in interest income and interest expense for the periods indicated. For each category of interest-earning assets and interest-bearing liabilities, information is provided on changes attributable to (1) changes in rate (changes in rate multiplied by old volume); (2) changes in volume (changes in volume multiplied by old rate); and (3) changes in rate-volume (change in rate multiplied by change in volume). Changes in rate-volume are proportionately allocated between rate and volume variance.
| Year Ended December 31, 2009 vs. 2008 | Year Ended December 31, 2008 vs. 2007 | |||||||||||||||||||||||
| Increase (decrease) due to change in |
Increase (decrease) due to change in |
|||||||||||||||||||||||
| Rate | Volume | Net Change |
Rate | Volume | Net Change |
|||||||||||||||||||
| (in thousands) | ||||||||||||||||||||||||
| Interest-earning assets: |
||||||||||||||||||||||||
| Loan receivables |
$ | (12,421 | ) | $ | 3,174 | $ | (9,247 | ) | $ | (14,236 | ) | $ | 22,772 | $ | 8,536 | |||||||||
| U.S. Treasury and agencies |
8 | (433 | ) | (425 | ) | 16 | (461 | ) | (445 | ) | ||||||||||||||
| Mortgage-backed securities |
525 | 3,625 | 4,150 | (28 | ) | 840 | 812 | |||||||||||||||||
| State and political subdivision securities |
1 | 80 | 81 | (20 | ) | 154 | 134 | |||||||||||||||||
| Corporate bonds |
37 | 262 | 299 | (11 | ) | 250 | 239 | |||||||||||||||||
| FHLB stock |
(62 | ) | 10 | (52 | ) | (131 | ) | 45 | (86 | ) | ||||||||||||||
| Other debt securities |
— | — | — | (12 | ) | 35 | 23 | |||||||||||||||||
| Other equity securities |
(10 | ) | (47 | ) | (57 | ) | (34 | ) | (17 | ) | (51 | ) | ||||||||||||
| Federal funds sold |
(396 | ) | 9 | (387 | ) | (696 | ) | (230 | ) | (926 | ) | |||||||||||||
| Interest-bearing deposits in other financial institutions |
(203 | ) | 200 | (3 | ) | (121 | ) | 192 | 71 | |||||||||||||||
| Total increase (decrease) in interest income |
(12,521 | ) | 6,880 | (5,641 | ) | (15,273 | ) | 23,580 | 8,307 | |||||||||||||||
| Interest-bearing liabilities: |
||||||||||||||||||||||||
| Certificates of deposit and other time deposits |
(13,552 | ) | 5,557 | (7,995 | ) | (6,343 | ) | 9,443 | 3,100 | |||||||||||||||
| NOW and money market accounts |
(1,513 | ) | (347 | ) | (1,860 | ) | (2,617 | ) | 639 | (1,978 | ) | |||||||||||||
| Savings accounts |
(135 | ) | 5 | (130 | ) | (40 | ) | 109 | 69 | |||||||||||||||
| Federal funds purchased and repurchase agreements |
47 | (126 | ) | (79 | ) | (28 | ) | 246 | 218 | |||||||||||||||
| FHLB advances |
(1,009 | ) | (889 | ) | (1,898 | ) | (534 | ) | 2,863 | 2,329 | ||||||||||||||
| Junior subordinated debentures |
(731 | ) | 224 | (507 | ) | (570 | ) | 310 | (260 | ) | ||||||||||||||
| Other borrowings |
— | — | — | — | (1 | ) | (1 | ) | ||||||||||||||||
| Total increase (decrease) in interest expense |
(16,893 | ) | 4,424 | (12,469 | ) | (10,132 | ) | 13,609 | 3,477 | |||||||||||||||
| Increase (decrease) in net interest income |
$ | 4,372 | $ | 2,456 | $ | 6,828 | $ | (5,141 | ) | $ | 9,971 | $ | 4,830 | |||||||||||
Non-Interest Income – The following table presents for the periods indicated the major categories of non-interest income:
| For the Years Ended December 31, | ||||||||||
| 2009 | 2008 | 2007 | ||||||||
| (in thousands) | ||||||||||
| Service charges on deposit accounts |
$ | 3,112 | $ | 3,424 | $ | 2,760 | ||||
| Income from fiduciary activities |
875 | 1,079 | 206 | |||||||
| Secondary market brokerage fees |
235 | 365 | 296 | |||||||
| Title insurance commissions |
130 | 157 | 186 | |||||||
| Gains on sales of loans originated for sale |
411 | — | — | |||||||
| Gains (losses) on sales of investment securities, net |
315 | (136 | ) | 107 | ||||||
| Other than temporary impairment on securities |
— | (471 | ) | — | ||||||
| Gain on sale of branch |
— | 410 | — | |||||||
| Other |
2,016 | 2,040 | 2,001 | |||||||
| Total non-interest income |
$ | 7,094 | $ | 6,868 | $ | 5,556 | ||||
Non-interest income increased by $226,000 to $7.1 million for 2009 compared with $6.9 million for 2008. Our non-interest income increased due to increased gains on sales of loans originated for sale of $411,000, or 100%, and increased gains on sales of investment securities, net, of $451,000, or 331.6%. PBI Bank began originating residential real estate loans for sale in the secondary market late in the first quarter of 2009. These increases were partially offset by decreased service charges on deposit accounts of $312,000, or 9.1%, and decreased income from fiduciary activities of $204,000, or 18.9%. Fewer service charges on deposit account fees were the result of lower transaction volume. Trust account fees are based on account assets values which declined during 2009 due to the lower stock market. In addition, 2008 non-interest income included a one-time gain of $410,000 on the sale of a branch and a one-time other-than-temporary impairment charge of $471,000 related to equity securities that were not repeated in 2009.
29
Table of Contents
Non-interest income increased by $1.3 million to $6.9 million for 2008 compared with $5.6 million for 2007. Our non-interest income increased due to increased service charges on deposit accounts of $664,000, or 24.1%, attributable to the acquisitions of Paramount Bank in 2008 and Kentucky Trust Bank in 2007, increased income from fiduciary activities of $873,000 arising from the trust operation acquired with Kentucky Trust Bank, and gain of $410,000 on the sale of our Burkesville branch. These increases were partially offset by decreased gains on sales of investment securities and the $471,000 write-down of other than temporary impairment of financial market sector equity securities with an original cost of $832,000. Gains on sales of investment securities decreased $243,000, or 227.1%, to a net loss of $136,000 for 2008 compared with a net gain of $107,000 for 2007.
Non-interest Expense – The following table presents the major categories of non-interest expense:
| For the Years Ended December 31, | |||||||||
| 2009 | 2008 | 2007 | |||||||
| (in thousands) | |||||||||
| Salary and employee benefits |
$ | 15,009 | $ | 14,792 | $ | 12,470 | |||
| Occupancy and equipment |
3,918 | 3,587 | 2,727 | ||||||
| FDIC insurance |
2,984 | 1,051 | 298 | ||||||
| State franchise tax |
1,800 | 1,740 | 1,336 | ||||||
| Other real estate owned expense |
1,155 | 881 | 833 | ||||||
| Professional fees |
901 | 787 | 829 | ||||||
| Postage and delivery |
752 | 748 | 546 | ||||||
| Communications |
729 | 711 | 466 | ||||||
| Advertising |
492 | 463 | 544 | ||||||
| Office supplies |
429 | 569 | 474 | ||||||
| Other |
2,287 | 2,428 | 1,951 | ||||||
| Total non-interest expense |
$ | 30,456 | $ | 27,757 | $ | 22,474 | |||
Non-interest expense for the year ended December 31, 2009 of $30.5 million represented a 9.7% increase from $27.8 million for the same period last year. Salaries and employee benefits are the largest component of non-interest expense. This expense increased $217,000, or 1.5%, in comparison with the same period of 2008 as a result of staff additions and increased stock-based compensation expense.
Occupancy expense increased $331,000, or 9.2%, to $3.9 million in 2009 from $3.6 million in 2008 to support a new branch built to replace a leased facility in Beaver Dam, increased real estate taxes, and increased maintenance and repairs costs related to buildings and equipment. FDIC insurance premiums rose significantly in 2009 due to amendments made by the FDIC in 2007 to its risk-based deposit premium assessment system and due to a one-time special assessment. FDIC insurance increased $1.9 million to $3.0 million in 2009 from $1.1 million in 2008. The one-time special assessment was 40.4% of this increase, or $781,000. Other real estate owned expense increased $274,000, or 31.1%, to $1.2 million in 2009 from $881,000 in 2008 due to higher costs related to foreclosing on nonperforming credits, repossessing collateral, and collecting amounts due. Professional fees increased $114,000, or 14.5%, to $901,000 in 2009 from $787,000 in 2008 due to costs associated with our abandoned tender offer to acquire Citizens First Corporation of Bowling Green, Kentucky, that was terminated in December.
Non-interest expense increases were partially offset by a decrease in office supplies expense. Office supplies decreased $140,000, or 24.6%, to $429,000 in 2009 from $569,000 in 2008 due to cost control measures.
Non-interest expense for the year ended December 31, 2008 of $27.8 million represented a 23.5% increase from $22.5 million in 2007. Salaries and employee benefits are the largest component of non-interest expense. This expense increased $2.3 million, or 18.6%, in comparison with 2007 as a result of cost of living wage increases, and the addition of staff from the Paramount and Kentucky Trust Bank acquisitions.
Occupancy expense increased $860,000, or 31.5%, to $3.6 million in 2008 from $2.7 million in 2007 to support the addition of a new office opened in 2008 and the acquisitions of Paramount and Kentucky Trust Bank. State franchise taxes are based primarily on average capital levels. These taxes increased 30.2% from 2007 to 2008 as our capital grew. State franchise tax increased $404,000 to $1.7 million in 2008 from $1.3 million in 2007. FDIC insurance premiums rose significantly in 2008 due to amendments made by the FDIC in 2007 to its risk-based deposit premium assessment system and because we no longer had the deposit insurance credits which were used during the first nine months of 2007 thereby reducing deposit insurance payments in fiscal year 2007. FDIC insurance increased $753,000 to $1.1 million in 2008 from $298,000 in 2007.
30
Table of Contents
Other real estate owned expense increased $48,000, or 5.8%, to $881,000 in 2008 from $833,000 in 2007 due to higher costs related to foreclosing on nonperforming credits, repossessing collateral, and collecting amounts due. Postage and delivery expense increased $202,000, or 37.0%, to $748,000 in 2008 from $546,000 in 2007 as account statement mailings increased due to the Paramount and Kentucky Trust Bank acquisitions. Expenses also increased for communications from $466,000 in 2007 to $711,000 in 2008 due to additional costs related to communication lines with new and acquired branches. Office supplies increased $95,000 to $569,000 in 2008 from $474,000 in 2007 due to higher costs related to increased staff from the Paramount and Kentucky Trust Bank acquisitions.
Non-interest expense increases were partially offset by decreases in professional fees and advertising expense. Professional fees decreased $42,000, or 5.1%, to $787,000 in 2008 from $829,000 in 2007 due to lower data processing fees as the data processing operations of Kentucky Trust Bank were merged with our data center in the first quarter of 2008. Advertising expenses decreased $81,000, or 14.9%, to $463,000 in 2008 from $544,000 in 2007. We decreased spending on media advertising in 2008 to focus more on internal programs designed to grow accounts through increased customer service and in-house marketing efforts.
Income Tax Expense – Income tax expense was $5.4 million for 2009 compared with $6.9 million for 2008. Our statutory federal tax rate was 35% in both 2009 and 2008. Our effective federal tax rate decreased to 32.9% in 2009 from 33.1% in 2008, as the percentage of our tax exempt income to total income increased.
Income tax expense was $6.9 million for 2008 compared with $7.2 million for 2007. Our statutory federal tax rate was 35% in both 2008 and 2007. Our effective federal tax rate decreased to 33.1% in 2008 from 33.7% in 2007, as the percentage of our tax exempt income to total income increased.
Analysis of Financial Condition
Total assets at December 31, 2009 were $1.8 billion compared with $1.6 billion at December 31, 2008, an increase of $187.2 million or 11.4%. This increase was primarily attributable to an increase of $56.1 million in net loans from organic growth and an increase of $118.9 million in federal funds sold and interest bearing deposits.
Total assets at December 31, 2008 increased to $1.65 billion compared with $1.46 billion at December 31, 2007, an increase of $191.8 million or 13.2%. This increase was primarily attributable to an increase of $129.1 million in net loans from organic loan growth and the acquisition of Paramount Bank. We also had an increase of $45.0 million in securities available for sale.
Loans Receivable – Loans receivable increased $62.8 million or 4.7% during the year ended December 31, 2009 to $1.4 billion. Our commercial, commercial real estate, and real estate construction portfolios increased by an aggregate of $13.1 million or 1.4% during 2009 and comprised 65.8% of the total loan portfolio at December 31, 2009.
Loans receivable increased $132.4 million or 10.9% to $1.4 billion at December 31, 2008 compared with $1.2 billion at December 31, 2007. Our commercial, commercial real estate, and real estate construction portfolios increased $67.4 million, or 7.9%, to $916.9 million at December 31, 2008. At December 31, 2008, these loans comprised 67.9% of the total loan portfolio compared with 69.8% of the loan portfolio at December 31, 2007.
Loan Portfolio Composition – The following table presents a summary of the loan portfolio at the dates indicated, net of deferred loan fees, by type. There are no foreign loans in our portfolio and other than the categories noted, there is no concentration of loans in any industry exceeding 10% of total loans.
| As of December 31, | ||||||||||||
| 2009 | 2008 | |||||||||||
| Amount | Percent | Amount | Percent | |||||||||
| (dollars in thousands) | ||||||||||||
| Type of Loan: |
||||||||||||
| Real estate: |
||||||||||||
| Commercial |
$ | 535,843 | 37.93 | % | $ | 454,634 | 33.68 | % | ||||
| Construction |
304,230 | 21.53 | 371,301 | 27.50 | ||||||||
| Residential |
387,017 | 27.39 | 342,835 | 25.39 | ||||||||
| Home equity |
32,384 | 2.29 | 33,249 | 2.46 | ||||||||
| Commercial |
89,903 | 6.36 | 90,978 | 6.74 | ||||||||
| Consumer |
36,989 | 2.62 | 37,783 | 2.80 | ||||||||
| Agriculture |
25,064 | 1.77 | 16,181 | 1.20 | ||||||||
| Other |
1,488 | 0.11 | 3,145 | 0.23 | ||||||||
| Total loans |
$ | 1,412,918 | 100.00 | % | $ | 1,350,106 | 100.00 | % | ||||
31
Table of Contents
| As of December 31, | ||||||||||||||||||
| 2007 | 2006 | 2005 | ||||||||||||||||
| Amount | Percent | Amount | Percent | Amount | Percent | |||||||||||||
| (dollars in thousands) | ||||||||||||||||||
| Type of Loan: |
||||||||||||||||||
| Real estate: |
||||||||||||||||||
| Commercial |
$ | 422,405 | 34.69 | % | $ | 324,354 | 37.96 | % | $ | 305,099 | 38.52 | % | ||||||
| Construction |
318,462 | 26.15 | 211,973 | 24.81 | 190,080 | 24.00 | ||||||||||||
| Residential |
288,703 | 23.71 | 195,591 | 22.89 | 177,683 | 22.44 | ||||||||||||
| Home equity |
25,382 | 2.08 | 19,099 | 2.24 | 22,707 | 2.87 | ||||||||||||
| Commercial |
108,619 | 8.92 | 59,113 | 6.92 | 50,626 | 6.39 | ||||||||||||
| Consumer |
38,061 | 3.13 | 29,709 | 3.48 | 30,808 | 3.89 | ||||||||||||
| Agriculture |
14,855 | 1.22 | 13,436 | 1.57 | 13,625 | 1.72 | ||||||||||||
| Other |
1,211 | 0.10 | 1,092 | 0.13 | 1,323 | 0.17 | ||||||||||||
| Total loans |
$ | 1,217,698 | 100.00 | % | $ | 854,367 | 100.00 | % | $ | 791,951 | 100.00 | % | ||||||
Our lending activities are subject to a variety of lending limits imposed by state and federal law. PBI Bank’s secured legal lending limit to a single borrower was approximately $31.1 million at December 31, 2009.
At December 31, 2009, we had seventeen loan relationships with aggregate extensions of credit in excess of $10 million. Eight of the seventeen relationships include loans that have been classified as substandard by the Bank’s internal loan review process. For further discussion of classified loans refer to the asset quality discussion in our “Allowance for Loan Losses” section.
Our real estate construction portfolio declined approximately $67 million from 2008 to 2009 as construction projects were completed and sold to end users or refinanced under permanent financing arrangements. We also had loans in this category that were transferred to OREO through the normal progression of collection, workout, and ultimate disposition.
As of December 31, 2009, we had $17.7 million of participations in real estate loans purchased from, and $108.9 million of participations in real estate loans sold to, other banks. As of December 31, 2008, we had $21.4 million of participations in real estate loans purchased from, and $108.3 million of participations in real estate loans sold to, other banks.
Our loan participation totals include participations in real estate loans purchased from and sold to two affiliate banks, The Peoples Bank, Mt. Washington and The Peoples Bank, Taylorsville. Our chairman, J. Chester Porter and his brother, William G. Porter, each own a 50% interest in Lake Valley Bancorp, Inc., the parent holding company of The Peoples Bank, Taylorsville, Kentucky. J. Chester Porter, William G. Porter and our president and chief executive officer, Maria L. Bouvette, serve as directors of The Peoples Bank, Taylorsville. Our chairman, J. Chester Porter owns an interest of approximately 36.0% and his brother, William G. Porter, owns an interest of approximately 3.0% in Crossroads Bancorp, Inc., the parent holding company of The Peoples Bank, Mount Washington, Kentucky. J. Chester Porter and Maria L. Bouvette, serve as directors of The Peoples Bank, Mount Washington. We have entered into management services agreements with each of these banks. Each agreement provides that our executives and employees provide management and accounting services to the subject bank, including overall responsibility for establishing and implementing policy and strategic planning. These entities are not consolidated in the financial statements of the Company. Maria Bouvette also serves as chief financial officer of each of the banks. We receive a $4,000 monthly fee from The Peoples Bank, Taylorsville and a $2,000 monthly fee from The Peoples Bank, Mount Washington for these services.
As of December 31, 2009, we had $4.9 million of participations in real estate loans purchased from, and $23.8 million of participations in real estate loans sold, to these affiliate banks. As of December 31, 2008, we had $6.0 million of participations in real estate loans purchased from, and $23.7 million of participations in real estate loans sold to, these affiliate banks.
We have analyzed our relationship with these affiliates and determined that we do not have the power to direct the activities of the affiliates that significantly impact their economic performance nor do we govern their absorption of losses or use of their economic resources. As such, these entities are not consolidated in our financial statements.
32
Table of Contents
Loan Maturity Schedule – The following table sets forth information at December 31, 2009, regarding the dollar amount of loans, net of deferred loan fees, maturing in the loan portfolio based on their contractual terms to maturity:
| As of December 31, 2009 | ||||||||||||
| Maturing Within One Year |
Maturing 1 through 5 Years |
Maturing Over 5 Years |
Total Loans | |||||||||
| (dollars in thousands) | ||||||||||||
| Loans with fixed rates: |
||||||||||||
| Real estate: |
||||||||||||
| Commercial |
$ | 104,951 | $ | 194,593 | $ | 28,677 | $ | 328,221 | ||||
| Construction |
45,872 | 37,978 | 9,584 | 93,434 | ||||||||
| Residential |
58,954 | 193,437 | 62,641 | 315,032 | ||||||||
| Home equity |
59 | 149 | 138 | 346 | ||||||||
| Commercial |
21,939 | 28,376 | 1,187 | 51,502 | ||||||||
| Consumer |
9,762 | 21,612 | 2,478 | 33,852 | ||||||||
| Agriculture |
7,608 | 4,067 | 209 | 11,884 | ||||||||
| Other |
1,006 | 8 | — | 1,014 | ||||||||
| Total fixed rate loans |
$ | 250,151 | $ | 480,220 | $ | 104,914 | $ | 835,285 | ||||
| Loans with floating rates: |
||||||||||||
| Real estate: |
||||||||||||
| Commercial |
$ | 72,206 | $ | 94,667 | $ | 40,749 | $ | 207,622 | ||||
| Construction |
130,547 | 79,903 | 346 | 210,796 | ||||||||
| Residential |
33,836 | 14,573 | 23,576 | 71,985 | ||||||||
| Home equity |
1,286 | 7,361 | 23,391 | 32,038 | ||||||||
| Commercial |
24,397 | 6,229 | 7,775 | 38,401 | ||||||||
| Consumer |
1,794 | 795 | 548 | 3,137 | ||||||||
| Agriculture |
11,793 | 919 | 468 | 13,180 | ||||||||
| Other |
— | 427 | 47 | 474 | ||||||||
| Total floating rate loans |
$ | 275,859 | $ | 204,874 | $ | 96,900 | $ | 577,633 | ||||
Non-Performing Assets – Non-performing assets consist of certain restructured loans for which interest rate or other terms have been renegotiated, loans past due 90 days or more still on accrual, loans on which interest is no longer accrued, real estate acquired through foreclosure and repossessed assets. Loans, including impaired loans, are placed on non-accrual status when they become past due 90 days or more as to principal or interest, unless they are adequately secured and in the process of collection. Loans are considered impaired if full principal or interest payments are not anticipated in accordance with the contractual loan terms. Impaired loans are carried at the present value of expected future cash flows discounted at the loan’s effective interest rate or at the fair value of the collateral if the loan is collateral dependent. Loans are reviewed on a regular basis and normal collection procedures are implemented when a borrower fails to make a required payment on a loan. If the delinquency on a mortgage loan exceeds 90 days and is not cured through normal collection procedures or an acceptable arrangement is not worked out with the borrower, we institute measures to remedy the default, including commencing a foreclosure action. Consumer loans generally are charged off when a loan is deemed uncollectible by management and any available collateral has been disposed of. Commercial business and real estate loan delinquencies are handled on an individual basis by management with the advice of legal counsel.
Interest income on loans is recognized on the accrual basis except for those loans placed on non-accrual status. The accrual of interest on impaired loans is discontinued when management believes, after consideration of economic and business conditions and collection efforts, that the borrowers’ financial condition is such that collection of interest is doubtful, which typically occurs after the loan becomes 90 days delinquent. When interest accrual is discontinued, existing accrued interest is reversed and interest income is subsequently recognized only to the extent cash payments are received.
Real estate acquired as a result of foreclosure or by deed in lieu of foreclosure is classified as real estate owned until such time as it is sold. New and used automobile, motorcycle and all terrain vehicles acquired as a result of foreclosure are classified as repossessed assets until they are sold. When such property is acquired it is recorded at its fair market value less costs to sell. Any write-down of the property at the time of acquisition is charged to the allowance for loan losses. Subsequent gains and losses are included in non-interest expense.
33
Table of Contents
The following table sets forth information with respect to non-performing assets as of the dates indicated:
| As of December 31, | ||||||||||||||||||||
| 2009 | 2008 | 2007 | 2006 | 2005 | ||||||||||||||||
| (dollars in thousands) | ||||||||||||||||||||
| Past due 90 days or more still on accrual |
$ | 5,968 | $ | 11,598 | $ | 2,145 | $ | 2,010 | $ | 1,969 | ||||||||||
| Loans on non-accrual status |
78,888 | 9,725 | 10,524 | 6,930 | 5,045 | |||||||||||||||
| Total non-performing loans |
84,856 | 21,323 | 12,669 | 8,940 | 7,014 | |||||||||||||||
| Real estate acquired through foreclosure |
14,548 | 7,839 | 4,309 | 2,415 | 1,781 | |||||||||||||||
| Other repossessed assets |
80 | 96 | 30 | 9 | 1 | |||||||||||||||
| Total non-performing assets |
$ | 99,484 | $ | 29,258 | $ | 17,008 | $ | 11,364 | $ | 8,796 | ||||||||||
| Non-performing loans to total loans |
6.00 | % | 1.58 | % | 1.04 | % | 1.05 | % | 0.89 | % | ||||||||||
| Non-performing assets to total assets |
5.42 | % | 1.78 | % | 1.17 | % | 1.08 | % | 0.89 | % | ||||||||||
Interest income that would have been earned on non-performing loans was $1.0 million, $601,000 and $586,000 for the years ended December 31, 2009, 2008 and 2007 respectively. Interest income recognized on accruing non-performing loans was $225,000, $181,000, and $140,000 for the years ended December 31, 2009, 2008, and 2007, respectively.
At December 31, 2009 we had restructured loans totaling $25.2 million with borrowers who experienced deterioration in financial condition. These loans are secured by 1 to 4 family residential or commercial real estate properties. Concessions generally take the form of a reduction in interest rate or temporary curtailment of contractual principal payments on amortizing loans for periods ranging from three to six months. Management believes these loans are well secured and the borrowers have the ability to repay the loans in accordance with the renegotiated terms.
Loans more than 90 days past due decreased $5.6 million from December 31, 2008 to December 31, 2009, and non-accrual loans increased $69.2 million from December 31, 2008 to December 31, 2009. The $84.9 million in nonperforming loans at December 31, 2009, and $21.3 million at December 31, 2008, were primarily construction, land development, other land, and commercial real estate loans. The protracted slowdown in housing unit sales and loss of tenants or inability to lease vacant office and retail space has placed inordinate stress on these customers and their ability to repay according to the contractual terms of the loans. As such, we have placed these credits on non-accrual and have begun the appropriate collection actions to resolve them. Management believes it has established adequate loan loss reserves for these credits.
Allowance for Loan Losses – The allowance for loan losses is based on management’s continuing review and evaluation of individual loans, loss experience, current economic conditions, risk characteristics of various categories of loans and such other factors that, in management’s judgment, require current recognition in estimating loan losses.
34
Table of Contents
The following table sets forth an analysis of loan loss experience as of and for the periods indicated:
| As of December 31, | ||||||||||||||||||||
| 2009 | 2008 | 2007 | 2006 | 2005 | ||||||||||||||||
| (dollars in thousands) | ||||||||||||||||||||
| Balances at beginning of period |
$ | 19,652 | $ | 16,342 | $ | 12,832 | $ | 12,197 | $ | 10,261 | ||||||||||
| Loans charged-off: |
||||||||||||||||||||
| Real estate |
6,519 | 2,711 | 1,777 | 467 | 1,411 | |||||||||||||||
| Commercial |
301 | 347 | 299 | 132 | 1,117 | |||||||||||||||
| Consumer |
875 | 749 | 267 | 436 | 519 | |||||||||||||||
| Agriculture |
36 | 27 | 31 | 1 | — | |||||||||||||||
| Other |
— | — | — | — | 37 | |||||||||||||||
| Total charge-offs |
7,731 | 3,834 | 2,374 | 1,036 | 3,084 | |||||||||||||||
| Recoveries: |
||||||||||||||||||||
| Real estate |
133 | 145 | 84 | 59 | 246 | |||||||||||||||
| Commercial |
55 | 85 | 54 | 121 | 222 | |||||||||||||||
| Consumer |
76 | 85 | 88 | 83 | 100 | |||||||||||||||
| Agriculture |
7 | 8 | 8 | 3 | — | |||||||||||||||
| Other |
— | — | — | — | — | |||||||||||||||
| Total recoveries |
271 | 323 | 234 | 266 | 568 | |||||||||||||||
| Net charge-offs |
7,460 | 3,511 | 2,140 | 770 | 2,516 | |||||||||||||||
| Provision for loan losses |
14,200 | 5,400 | 4,025 | 1,405 | 3,645 | |||||||||||||||
| Balance acquired in bank acquisition |
— | 1,421 | 1,625 | — | 807 | |||||||||||||||
| Balance at end of period |
$ | 26,392 | $ | 19,652 | $ | 16,342 | $ | 12,832 | $ | 12,197 | ||||||||||
| Allowance for loan losses to total loans |
1.87 | % | 1.46 | % | 1.34 | % | 1.50 | % | 1.54 | % | ||||||||||
| Net charge-offs to average loans outstanding |
0.56 | % | 0.27 | % | 0.21 | % | 0.09 | % | 0.32 | % | ||||||||||
| Allowance for loan losses to total non-performing loans |
31.10 | % | 92.16 | % | 128.99 | % | 143.53 | % | 173.90 | % | ||||||||||
Our allowance for loan losses is a reserve established through charges to earnings in the form of a provision for loan losses. The allowance for loan losses is comprised of three components: specific reserves, general reserves and unallocated reserves. Generally, all loans that have been identified as impaired are reviewed on a quarterly basis in order to determine whether a specific allowance is required. A loan is considered impaired when, based on current information, it is probable that we will not receive all amounts due in accordance with the contractual terms of the loan agreement. Once a loan has been identified as impaired, management measures impairment in accordance with ASC 310.10. When management’s measured value of the impaired loan is less than the recorded investment in the loan, the amount of the impairment is recorded as a specific reserve. These specific reserves are determined on an individual loan basis based on management’s current evaluation of our loss exposure for each credit, given the payment status, financial condition of the borrower and value of any underlying collateral. Loans for which specific reserves are provided are excluded from the general reserve and unallocated allowance calculations described below. Changes in specific reserves from period to period are the result of changes in the circumstances of individual loans such as charge-offs, pay-offs, changes in collateral values or other factors.
The allowance for loan losses represents management’s estimate of the amount necessary to provide for known and inherent losses in the loan portfolio in the normal course of business. Due to the uncertainty of risks in the loan portfolio, management’s judgment of the amount of the allowance necessary to absorb loan losses is approximate. The allowance for loan losses is also subject to regulatory examinations and determination by the regulatory agencies as to its adequacy in comparison with peer institutions.
We make specific allowances for each impaired loan based on its type and classification as discussed above. At year-end 2009, our allowance for loan losses to total non-performing loans decreased to 31.10% from 92.16% at year-end 2008. We have assessed these loans for collectability and considered, among other things, the borrower’s ability to repay, the value of the underlying collateral, and other market conditions to ensure that the allowance for loan losses is adequate to absorb probable incurred losses. We also maintain a general reserve for each loan type in the loan portfolio. In determining the amount of the general reserve portion of our allowance for loan losses, management considers factors such as our historical loan loss experience, the growth, composition and diversification of our loan portfolio, current delinquency levels, the results of recent regulatory examinations and general economic conditions. Based on these factors we apply estimated percentages to the various categories of loans, not including any loan that has a specific allowance allocated to it, based on our historical experience, portfolio trends and economic and industry trends. This information is used by management to set the general reserve portion of the allowance for loan losses at a level it deems prudent.
35
Table of Contents
Our portfolio is comprised primarily of loans secured by real estate. A decline in the value of the real estate serving as collateral for our loans may impact our ability to collect those loans. In general, we obtain updated appraisals on property securing our loans when circumstances are warranted such as at the time of renewal or when market conditions have significantly changed. We use qualified licensed appraisers approved by our Board of Directors. These appraisers possess prerequisite certifications and knowledge of the local and regional marketplace.
Because there are additional risks of losses that cannot be quantified precisely or attributed to particular loans or types of loans, including general economic and business conditions and credit quality trends, we have established an unallocated portion of the allowance for loan losses based on our evaluation of these risks. The unallocated portion of our allowance is determined based on various factors including, but not limited to, general economic conditions of our market area, the growth, composition and diversification of our loan portfolio, types of collateral securing our loans, the experience level of our lending officers and staff, the quality of our credit risk management and the results of independent third party reviews of our classification of credits. As of December 31, 2009 and 2008, the unallocated portions of the allowance for loan losses were $282,000, or 1.1% of the total allowance, and $742,000, or 3.8% of the total allowance, respectively.
Based on an evaluation of the loan portfolio, management presents a quarterly review of the allowance for loan losses to our board of directors, indicating any change in the allowance for loan losses since the last review and any recommendations as to adjustments in the allowance for loan losses.
This evaluation is inherently subjective as it requires estimates that are susceptible to significant revision as more information becomes available or as events change. We used the same methodology and generally similar assumptions in assessing the allowance for both comparison periods. We increased the allowance for loan losses as a percentage of loans outstanding to 1.87% at December 31, 2009 from 1.46% at December 31, 2008. The level of the allowance is based on estimates and the ultimate losses may vary from these estimates.
We follow a loan review program designed to evaluate the credit risk in our loan portfolio. Through this loan review process, we maintain an internally classified watch list which helps management assess the overall quality of the loan portfolio and the adequacy of the allowance for loan losses. Loans categorized as watch list loans show warning elements where the present status exhibits one or more deficiencies that require attention in the short term or where pertinent ratios of the loan account have weakened to a point where more frequent monitoring is warranted. These loans do not have all of the characteristics of a classified loan (substandard or doubtful) but do show weakened elements as compared with those of a satisfactory credit. We review these loans to assist in assessing the adequacy of the allowance for loan losses.
In establishing the appropriate classification for specific assets, management considers, among other factors, the estimated value of the underlying collateral, the borrower’s ability to repay, the borrower’s repayment history and the current delinquent status. As a result of this process, loans are categorized as special mention, substandard or doubtful.
Loans classified as “special mention” do not have all of the characteristics of substandard or doubtful loans. They have one or more deficiencies which warrant special attention and which corrective action, such as accelerated collection practices, may remedy.
Loans classified as “substandard” are those loans with clear and defined weaknesses such as a highly leveraged position, unfavorable financial ratios, uncertain repayment sources or poor financial condition which may jeopardize the repayment of the debt as contractually agreed. They are characterized by the distinct possibility that we will sustain some losses if the deficiencies are not corrected.
Loans classified as “doubtful” are those loans which have characteristics similar to substandard loans but with an increased risk that collection or liquidation in full is highly questionable and improbable.
Once a loan is deemed impaired or uncollectible as contractually agreed, the loan is charged-off either partially or in-full against the allowance for loan losses, based upon the expected future cash flows discounted at the loan’s effective interest rate, or the fair value of collateral with respect to collateral-based loans.
As of December 31, 2009, we had $208.3 million of loans classified as substandard, $7,000 classified as doubtful, $15.5 million classified as special mention and none classified as loss. This compares with $84.1 million of loans classified as substandard, $10,000 classified as doubtful, $49.4 million classified as special mention and none classified as loss as of December 31, 2008. The $124.3 million increase in loans classified as substandard is primarily attributable to the downgrade of credits displaying financial weakness indicated by inconsistent payments. Factors affecting each credit are specific to the borrowers business or related to macro economic events and we continue to monitor these credits regularly. In particular, these credits are primarily construction, land development, and commercial real estate loans for projects in or adjacent to our market areas. While these credits have been properly managed through the construction phase and secured by collateral in accordance with our policies, the protracted slowdown in housing unit sales and loss of tenants or inability to lease up vacant office and retail space has placed inordinate stress on these customers and their ability to repay according to the contractual
36
Table of Contents
terms of the loans. As of December 31, 2009 we had allocations of $15.9 million in the allowance for loan losses related to these classified loans. This compares to allocations of $7.6 million in the allowance for loan losses related to classified loans at December 31, 2008.
We recorded a provision for loan losses of $14.2 million for the year ended December 31, 2009, compared with $5.4 million for 2008 and $4.0 million for 2007. The total allowance for loan losses was $26.4 million or 1.87% of total loans at December 31, 2009, compared with $19.7 million or 1.46% of total loans at December 31, 2008, and $16.3 million or 1.34% of total loans at December 31, 2007. The increased allowance is consistent with the increase in our loan portfolio of $62.8 million from December 31, 2008 to December 31, 2009, the increase of $63.5 million in non-performing loans to $84.9 million at December 31, 2009 from $21.3 million at December 31, 2008, and increased loan charge-offs. Net charge-offs were $7.5 million for the year ended December 31, 2009 compared with $3.5 million for 2008 and $2.1 million for 2007. We acquired a banking office in 2008 and a financial institution in 2007, and applied generally accepted accounting principles in connection with these acquisitions. More specifically, we applied the provisions of the guidance issued by the FASB with respect to accounting for certain loans or debt securities acquired in a transfer to the 2008 and 2007 transactions. We identified no substantial loan or homogenous group of loans having evidence of deterioration of credit quality as defined by the statement. As a result, the existing allowance for loan loss in the amount of $1.4 million and $1.6 million, respectively, were recorded as of the dates of acquisition.
The following table depicts management’s allocation of the allowance for loan losses by loan type. Allowance funding and allocation is based on management’s current evaluation of risk in each category, economic conditions, past loss experience, loan volume, past due history and other factors. Since these factors and management’s assumptions are subject to change, the allocation is not necessarily predictive of future portfolio performance. The allocation is made by analytical purposes and is not necessarily indicative of the categories in which future losses may occur. The total allowance is available to absorb losses from any segment of loans.
| As of December 31, | ||||||||||||
| 2009 | 2008 | |||||||||||
| Amount of Allowance |
Percent of Loans to Total Loans |
Amount of Allowance |
Percent of Loans to Total Loans |
|||||||||
| (dollars in thousands) | ||||||||||||
| Real estate: |
||||||||||||
| Commercial |
$ | 9,266 | 37.93 | % | $ | 6,770 | 33.68 | % | ||||
| Residential |
4,662 | 29.68 | 2,271 | 27.85 | ||||||||
| Construction |
8,215 | 21.53 | 5,907 | 27.50 | ||||||||
| Commercial |
2,040 | 6.36 | 1,623 | 6.74 | ||||||||
| Consumer |
539 | 2.62 | 603 | 2.80 | ||||||||
| Other |
1,388 | 1.88 | 1,736 | 1.43 | ||||||||
| Unallocated |
282 | — | 742 | — | ||||||||
| Total |
$ | 26,392 | 100.00 | % | $ | 19,652 | 100.00 | % | ||||
| As of December 31, | ||||||||||||||||||
| 2007 | 2006 | 2005 | ||||||||||||||||
| Amount of Allowance |
Percent of Loans to Total Loans |
Amount of Allowance |
Percent of Loans to Total Loans |
Amount of Allowance |
Percent of Loans to Total Loans |
|||||||||||||
| (dollars in thousands) | ||||||||||||||||||
| Real estate: |
||||||||||||||||||
| Commercial |
$ | 6,606 | 34.69 | % | $ | 6,519 | 37.96 | % | $ | 5,529 | 38.52 | % | ||||||
| Residential |
1,580 | 25.79 | 1,103 | 25.13 | 1,194 | 25.31 | ||||||||||||
| Construction |
3,653 | 26.15 | 2,000 | 24.81 | 1,950 | 24.00 | ||||||||||||
| Commercial |
1,655 | 8.92 | 896 | 6.92 | 1,020 | 6.39 | ||||||||||||
| Consumer |
574 | 3.13 | 460 | 3.48 | 563 | 3.89 | ||||||||||||
| Other |
1,731 | 1.32 | 1,245 | 1.70 | 1,373 | 1.89 | ||||||||||||
| Unallocated |
543 | — | 609 | — | 568 | — | ||||||||||||
| Total |
$ | 16,342 | 100.00 | % | $ | 12,832 | 100.00 | % | $ | 12,197 | 100.00 | % | ||||||
37
Table of Contents
Investment Securities – The securities portfolio serves as a source of liquidity and earnings and contributes to the management of interest rate risk. We have the authority to invest in various types of liquid assets, including short-term United States Treasury obligations and securities of various federal agencies, obligations of states and political subdivisions, corporate bonds, certificates of deposit at insured savings and loans and banks, bankers’ acceptances and federal funds. We may also invest a portion of our assets in certain commercial paper and corporate debt securities. We are also authorized to invest in mutual funds and stocks whose assets conform to the investments that we are authorized to make directly. The investment portfolio decreased by $4.4 million, or 2.5%, to $168.7 million at December 31, 2009 compared with $173.1 million at December 31, 2008. We focused new investments in 2009 primarily in the mortgage-backed securities category.
The following table sets forth the carrying value of our securities portfolio at the dates indicated. There were no securities classified as held-to-maturity at either period end.
| December 31, 2009 | December 31, 2008 | |||||||||||||||||||||||||
| Amortized Cost |
Gross Unrealized Gains |
Gross Unrealized Losses |
Fair Value |
Amortized Cost |
Gross Unrealized Gains |
Gross Unrealized Losses |
Fair Value | |||||||||||||||||||
| (dollars in thousands) | ||||||||||||||||||||||||||
| Securities available-for-sale |
||||||||||||||||||||||||||
| U.S. Treasury and agencies |
$ | 586 | $ | 33 | $ | — | $ | 619 | $ | 2,938 | $ | 22 | $ | — | $ | 2,960 | ||||||||||
| Agency mortgage-backed: residential |
91,127 | 4,028 | — | 95,155 | 119,807 | 1,293 | (118 | ) | 120,982 | |||||||||||||||||
| Private label mortgage-backed: residential |
33,516 | 279 | (2,156 | ) | 31,639 | 17,139 | — | (494 | ) | 16,645 | ||||||||||||||||
| State and municipal |
24,537 | 955 | (37 | ) | 25,455 | 24,493 | 330 | (415 | ) | 24,408 | ||||||||||||||||
| Corporate |
13,054 | 760 | (49 | ) | 13,765 | 6,489 | 39 | (451 | ) | 6,077 | ||||||||||||||||
| Other debt |
704 | — | (175 | ) | 529 | 704 | — | — | 704 | |||||||||||||||||
| Equity |
1,885 | 75 | (401 | ) | 1,559 | 1,900 | 28 | (627 | ) | 1,301 | ||||||||||||||||
| Total |
$ | 165,409 | $ | 6,130 | $ | (2,818 | ) | $ | 168,721 | $ | 173,470 | $ | 1,712 | $ | (2,105 | ) | $ | 173,077 | ||||||||
The following table sets forth the contractual maturities, fair values and weighted-average yields for our securities held at December 31, 2009:
| Due Within One Year |
After One Year But Within Five Years |
After Five Years But Within Ten Years |
After Ten Years | Total | ||||||||||||||||||||||||||
| Amount | Yield | Amount | Yield | Amount | Yield | Amount | Yield | Amount | Yield | |||||||||||||||||||||
| U.S. Treasury and agencies |
$ | — | — | % | $ | — | — | % | $ | 619 | 5.17 | % | $ | — | — | % | $ | 619 | 5.17 | % | ||||||||||
| Agency mortgage-backed |
370 | 4.54 | 2,003 | 4.76 | 17,858 | 4.76 | 74,924 | 4.82 | 95,155 | 4.81 | ||||||||||||||||||||
| Private label mortgage-backed |
— | — | — | — | 6,645 | 5.38 | 24,994 | 13.35 | 31,639 | 11.73 | ||||||||||||||||||||
| State and municipal |
86 | 4.95 | 3,575 | 5.84 | 12,184 | 5.55 | 9,610 | 6.39 | 25,455 | 5.91 | ||||||||||||||||||||
| Corporate bonds |
— | — | 2,875 | 7.50 | 10,890 | 6.59 | — | — | 13,765 | 6.78 | ||||||||||||||||||||
| Other debt |
— | — | — | — | — | — | 529 | 6.50 | 529 | 6.50 | ||||||||||||||||||||
| Total |
$ | 456 | 4.62 | % | $ | 8,453 | 6.16 | % | $ | 48,196 | 5.46 | % | $ | 110,057 | 7.07 | % | $ | 167,162 | 6.56 | % | ||||||||||
| Equity |
1,559 | |||||||||||||||||||||||||||||
| Total |
$ | 168,721 | ||||||||||||||||||||||||||||
Average yields in the table above were calculated on a tax equivalent basis using a federal income tax rate of 35%. Mortgage-backed securities are securities that have been developed by pooling a number of real estate mortgages. These securities are issued by federal agencies such as Government National Mortgage Association (“Ginnie Mae”), Fannie Mae and Freddie Mac as well as non-agency or private company issuers. These securities are deemed to have high credit ratings, and minimum regular monthly cash flows of principal and interest. Cash flows from agency backed mortgage-backed securities are guaranteed by the issuing agencies.
38
Table of Contents
Unlike U.S. Treasury and U.S. government agency securities, which have a lump sum payment at maturity, mortgage-backed securities provide cash flows from regular principal and interest payments and principal prepayments throughout the lives of the securities. Mortgage-backed securities that are purchased at a premium will generally suffer decreasing net yields as interest rates drop because home owners tend to refinance their mortgages. Thus, the premium paid must be amortized over a shorter period. Therefore, those securities purchased at a discount will obtain higher net yields in a decreasing interest rate environment. As interest rates rise, the opposite will generally be true. During a period of increasing interest rates, fixed rate mortgage-backed securities do not tend to experience heavy prepayments of principal and consequently, the average life of this security will not be shortened. If interest rates begin to fall, prepayments will increase. Non-agency and private issuer mortgage-backed securities do not carry a government guarantee. We limit our purchases of these securities to bank qualified issues with high credit ratings. We regularly monitor the performance and credit ratings of these securities and evaluate these securities, as we do all of our securities, for other than temporary impairment on a quarterly basis. At December 31, 2009, 78.7% of the agency mortgage-backed securities we held had contractual final maturities of more than ten years with a weighted average life of 19.11 years, and 79.0% of the private label mortgage-backed securities we held had contractual final maturities of more than ten years with a weighted average life of 26.4 years.
The Company held 44 equity securities at December 31, 2009. Of these securities, 10 had an unrealized loss of $12,000 and had been in an unrealized loss position for less than twelve months and 19 had an unrealized loss of $389,000 and had been in an unrealized loss position for more than 12 months. Management monitors the underlying financial condition of the issuers and current market pricing for these equity securities monthly. Management currently intends to hold all securities with unrealized losses until recovery, which for fixed income securities may be at maturity. During the 2008 fourth quarter, we recorded an other than temporary impairment charge totaling $471,000 for equity securities held in our portfolio with an original cost of $832,000. The market prices of the stocks had been below our initial investment for more than twelve months and after consideration of the companies financial conditions and the likelihood the market value would recover to our cost basis in a reasonable period of time, the investment was written down to fair value. As of December 31, 2009, management does not believe any of the remaining equity securities in our portfolio with unrealized losses should be classified as other than temporarily impaired.
Deposits – We attract both short-term and long-term deposits from the general public by offering a wide range of deposit accounts and interest rates. In recent years we have been required by market conditions to rely increasingly on short to mid-term certificate accounts and other deposit alternatives, including brokered and wholesale deposits, that are more responsive to market interest rates. We use forecasts based on interest rate risk simulations to assist management in monitoring our use of certificates of deposit and other deposit products as funding sources and the impact of their use on interest income and net interest margin in various rate environments.
We primarily rely on our banking office network to attract and retain deposits in our local markets and leverage our online Ascencia division to attract out-of-market deposits. Market interest rates and rates on deposit products offered by competing financial institutions can significantly affect our ability to attract and retain deposits. During 2009, total deposits increased $241.5 million compared with 2008. During 2008, total deposits increased by $122.0 million compared with 2007. The increase in deposits for 2009 was primarily in certificates of deposit balances and money market accounts. The 2008 increase was primarily in certificates of deposit balances and non-interest bearing demand accounts.
To evaluate our funding needs in light of deposit trends resulting from continually changing conditions, management and board committees evaluate simulated performance reports that forecast changes in margins along with other pertinent economic data. We continue to offer attractively priced deposit products along our product line to allow us to retain deposit customers and reduce interest rate risk during various rising and falling rate cycles.
We offer savings accounts, NOW accounts, money market accounts and fixed rate certificates with varying maturities. The flow of deposits is influenced significantly by general economic conditions, changes in interest rates and competition. Our management adjusts interest rates, maturity terms, service fees and withdrawal penalties on our deposit products periodically. The variety of deposit products allows us to compete more effectively in obtaining funds and to respond with more flexibility to the flow of funds away from depository institutions into outside investment alternatives. However, our ability to attract and maintain deposits and the costs of these funds has been, and will continue to be, significantly affected by market conditions.
39
Table of Contents
The following table sets forth the average daily balances and weighted average rates paid for our deposits for the periods indicated:
| For the Years Ended December 31, | ||||||||||||||||||
| 2009 | 2008 | 2007 | ||||||||||||||||
| Average Balance |
Average Rate |
Average Balance |
Average Rate |
Average Balance |
Average Rate |
|||||||||||||
| (dollars in thousands) | ||||||||||||||||||
| Demand |
$ | 99,167 | $ | 93,356 | $ | 73,183 | ||||||||||||
| Interest Checking |
75,602 | 0.84 | % | 92,496 | 1.71 | % | 60,600 | 2.05 | % | |||||||||
| Money Market |
86,619 | 1.53 | 84,316 | 2.66 | 97,045 | 4.69 | ||||||||||||
| Savings |
34,386 | 0.90 | 33,969 | 1.30 | 25,766 | 1.44 | ||||||||||||
| Certificates of Deposit |
1,089,798 | 3.01 | 946,477 | 4.31 | 740,693 | 5.09 | ||||||||||||
| Total Deposits |
$ | 1,385,572 | $ | 1,250,614 | $ | 997,287 | ||||||||||||
| Weighted Average Rate |
2.53 | % | 3.60 | % | 4.40 | % | ||||||||||||
The following table sets forth the average daily balances and weighted average rates paid for our certificates of deposit for the periods indicated:
| For the Years Ended December 31, | ||||||||||||||||||
| 2009 | 2008 | 2007 | ||||||||||||||||
| Average Balance |
Average Rate |
Average Balance |
Average Rate |
Average Balance |
Average Rate |
|||||||||||||
| (dollars in thousands) | ||||||||||||||||||
| Certificates of Deposit |
||||||||||||||||||
| Less than $100,000 |
$ | 611,011 | 3.03 | % | $ | 607,420 | 4.28 | % | $ | 529,114 | 5.04 | % | ||||||
| $100,000 or more |
478,787 | 2.98 | 339,057 | 4.36 | 211,579 | 5.22 | ||||||||||||
| Total |
$ | 1,089,798 | 3.01 | % | $ | 946,477 | 4.31 | % | $ | 740,693 | 5.09 | % | ||||||
The following table shows at December 31, 2009 the amount of our time deposits of $100,000 or more by time remaining until maturity:
| Maturity Period |
Amount | ||
| (dollars in thousands) | |||
| Three months or less |
$ | 154,365 | |
| Three months through six months |
162,828 | ||
| Six months through twelve months |
131,861 | ||
| Over twelve months |
167,236 | ||
| Total |
$ | 616,290 | |
We strive to maintain competitive pricing on our deposit products which we believe allows us to retain a substantial percentage of our customers when their time deposits mature.
Borrowing – Deposits are the primary source of funds for our lending and investment activities and for our general business purposes. We can also use advances (borrowings) from the FHLB of Cincinnati to supplement our pool of lendable funds, meet deposit withdrawal requirements and manage the terms of our liabilities. Advances from the FHLB are secured by our stock in the FHLB, certain commercial real estate loans and substantially all of our first mortgage residential loans. At December 31, 2009 we had $83.0 million in advances outstanding from the FHLB and the capacity to increase our borrowings an additional $138.3 million. The FHLB of Cincinnati functions as a central reserve bank providing credit for savings banks and other member financial institutions. As a member, we are required to own capital stock in the FHLB and are authorized to apply for advances on the security of such stock and certain of our home mortgages and other assets (principally, securities which are obligations of, or guaranteed by, the United States) provided that we meet certain standards related to creditworthiness.
40
Table of Contents
The following table sets forth information about our FHLB advances as of and for the periods indicated:
| December 31, | ||||||||||||
| 2009 | 2008 | 2007 | ||||||||||
| (dollars in thousands) | ||||||||||||
| Average balance outstanding |
$ | 106,259 | $ | 138,954 | $ | 69,276 | ||||||
| Maximum amount outstanding at any month-end during the period |
142,583 | 146,021 | 121,767 | |||||||||
| End of period balance |
82,980 | 142,776 | 121,767 | |||||||||
| Weighted average interest rate: |
||||||||||||
| At end of period |
3.46 | % | 3.31 | % | 4.58 | % | ||||||
| During the period |
3.47 | % | 4.02 | % | 4.71 | % | ||||||
Subordinated Capital Note – At December 31, 2009 our bank subsidiary, PBI Bank, had a subordinated capital note outstanding in the amount of $9 million. The note is unsecured, bears interest at the BBA three-month LIBOR floating rate plus 300 basis points, and qualifies as Tier 2 capital. Interest only is due quarterly through September 30, 2010, at which time quarterly principal payments of $225,000 plus interest will commence. The note is due July 1, 2020. At December 31, 2009, the interest rate on this note was 3.29%.
Junior Subordinated Debentures – At December 31, 2009, we had four issues of junior subordinated debentures outstanding totaling $25.0 million as shown in the table below.
| Description |
Liquidation Amount Trust Preferred Securities |
Issuance Date |
Optional Prepayment Date (2) |
Interest Rate (1) |
Junior Subordinated Debt and Investment in Trust |
Maturity Date | ||||||||
| (dollars in thousands) |
(dollars in thousands) |
|||||||||||||
| Porter Statutory Trust II |
$ | 5,000 | 2/13/2004 | 3/17/2009 | 3-month LIBOR + 2.85% | $ | 5,155 | 2/13/2034 | ||||||
| Porter Statutory Trust III |
3,000 | 4/15/2004 | 6/17/2009 | 3-month LIBOR + 2.79% | 3,093 | 4/15/2034 | ||||||||
| Porter Statutory Trust IV |
14,000 | 12/14/2006 | 3/1/2012 | 3-month LIBOR + 1.67% | 14,434 | 3/1/2037 | ||||||||
| Asencia Statutory Trust I |
3,000 | 2/13/2004 | 3/17/2009 | 3-month LIBOR + 2.85% | 3,093 | 2/13/2034 | ||||||||
| $ | 25,000 | $ | 25,775 | |||||||||||
| (1) | As of December 31, 2009 the 3-month LIBOR was 0.25%. |
| (2) | The debentures are callable on or after the optional prepayment date at their principal amount plus accrued interest. |
The trust preferred securities are subject to mandatory redemption, in whole or in part, upon repayment of the subordinated debentures at maturity or their earlier redemption at the liquidation preference. The subordinated debentures, which mature February 13, 2034, April 15, 2034, and March 1, 2037, are redeemable before the maturity date at our option on or after March 17, 2009, June 17, 2009, and March 1, 2012, respectively, at their principal amount plus accrued interest. We have the option to defer interest payments on the subordinated debentures from time to time for a period not to exceed 20 consecutive quarters. If we defer these interest payments, we would be prohibited from paying dividends on our common stock.
The trust preferred securities issued by our subsidiary trusts are currently included in our Tier 1 capital for regulatory purposes. On March 1, 2005, the Federal Reserve Board adopted final rules that continue to allow trust preferred securities to be included in Tier 1 capital, subject to stricter quantitative and qualitative limits. Currently, no more than 25% of our Tier I capital can consist of trust preferred securities and qualifying perpetual preferred stock. To the extent the amount of our trust preferred securities exceeds the 25% limit, the excess is includable in Tier 2 capital. The new quantitative limits will be fully effective March 31, 2011. As of December 31, 2009, Porter Bancorp’s trust preferred securities totaled 15.1% of its Tier 1 capital.
Each of the trusts issuing the trust preferred securities holds junior subordinated debentures we issued with a 30 year maturity. The final rules provide that in the last five years before the junior subordinated debentures mature, the associated trust preferred securities will be excluded from Tier 1 capital and included in Tier 2 capital. In addition, the trust preferred securities during this five-year period would be amortized out of Tier 2 capital by one-fifth each year and excluded from Tier 2 capital completely during the year before maturity.
41
Table of Contents
Liquidity
Liquidity risk arises from the possibility we may not be able to satisfy current or future financial commitments, or may become unduly reliant on alternative funding sources. The objective of liquidity risk management is to ensure that we meet the cash flow requirements of depositors and borrowers, as well as our operating cash needs, taking into account all on- and off-balance sheet funding demands. Liquidity risk management also involves ensuring that we meet our cash flow needs at a reasonable cost. We maintain an investment and funds management policy, which identifies the primary sources of liquidity, establishes procedures for monitoring and measuring liquidity, and establishes minimum liquidity requirements in compliance with regulatory guidance. Our Asset Liability Committee continually monitors and reviews our liquidity position.
Funds are available from a number of sources, including the sale of securities in the available-for-sale portion of the investment portfolio, principal pay-downs on loans and mortgage-backed securities, brokered deposits and other wholesale funding. During 2009 and 2008 we utilized brokered and wholesale deposits to supplement our funding strategy. At December 31, 2009, these deposits totaled $114.6 million. We also secured federal funds borrowing lines from major correspondent banks totaling $44 million on an unsecured basis and an additional $25.0 million on a secured basis.
Traditionally, we have borrowed from the FHLB to supplement our funding requirements. At December 31, 2009, we had an unused borrowing capacity with the FHLB of $138.3 million. Management believes our sources of liquidity are adequate to meet expected cash needs for the foreseeable future.
We use cash to pay dividends on common stock, if and when declared by the board of directors, and to service debt. The main sources of funding include dividends paid by PBI Bank, management fees received from PBI Bank and affiliated banks and financing obtained in the capital markets. See the “Supervision-Porter Bancorp-Dividends” section of Item 1. “Business” and the “Dividends” section of Item 5. “Market for Registrant’s Common Equity, Related Stockholder Matters and Issuer Purchases of Equity Securities” of this Annual Report on Form 10-K.
Capital
Stockholders’ equity increased $5.1 million to $169.3 million at December 31, 2009 compared with $164.2 million at December 31, 2008. The increase was primarily due to net income earned during 2009 reduced by dividends declared on preferred and common stock. Both our company and PBI Bank qualified as well capitalized under regulatory guidelines at December 31, 2009.
On November 21, 2008 we issued to the U.S. Treasury, in exchange for aggregate consideration of $35.0 million, (i) 35,000 shares of the Company’s Fixed Rate Cumulative Perpetual Preferred Stock, Series A, no par value per share and liquidation preference $1,000 per share (the “Series A Preferred Stock”), and (ii) a warrant (the “Warrant”) to purchase up to 314,820 shares (the “Warrant Common Stock”) of the Company’s common stock, no par value per share, at an exercise price of $16.68 per share.
The Series A Preferred Stock qualifies as Tier 1 capital and pays cumulative cash dividends quarterly at a rate of 5% per annum for the first five years, and 9% per annum thereafter. The Series A Preferred Stock is non-voting, other than class voting rights on certain matters that could adversely affect the Series A Preferred Stock. The Series A Preferred Stock may be redeemed by the Company at par on or after February 15, 2012. Prior to this date, the Series A Preferred Stock may not be redeemed unless the Company has received aggregate gross proceeds from one or more qualified equity offerings of any Tier 1 perpetual preferred or common stock of the Company (a “Qualified Equity Offering”) of not less than $8.75 million. Subject to certain limited exceptions, until November 21, 2011, or such earlier time as all Series A Preferred Stock has been redeemed or transferred by U.S. Treasury, the Company will not, without U.S. Treasury’s consent, be able to increase its dividend rate per share of common stock or repurchase its common stock.
The Warrant is immediately exercisable and has a 10-year term. The U.S. Treasury may not exercise voting power with respect to any shares of Warrant Common Stock until the Warrant has been exercised. If the Company receives aggregate gross cash proceeds of not less than $35,000,000 from one or more Qualified Equity Offerings on or prior to December 31, 2009, the number of shares of Warrant Common Stock underlying the Warrant then held by the U.S. Treasury will be reduced by one half of the original number of shares underlying the Warrant.
Kentucky banking laws limit the amount of dividends that may be paid to a holding company by its subsidiary banks without prior approval. These laws limit the amount of dividends that may be paid in any calendar year to current year’s net income, as defined in the laws, combined with the retained net income of the preceding two years, less any dividends declared during those periods. At December 31, 2009, without prior approval, PBI Bank had approximately $37.6 million of retained earnings that could be used to pay dividends.
42
Table of Contents
Each of the federal bank regulatory agencies has established minimum leverage capital requirements for banking organizations. Banking organizations must maintain a minimum ratio of Tier 1 capital to adjusted average quarterly assets equal to 3% to 5% subject to federal bank regulatory evaluation of an organization’s overall safety and soundness. At December 31, 2009, Porter Bancorp’s and PBI Bank’s ratios of Tier 1 capital and total capital to risk-adjusted assets, and leverage ratios exceeded the minimum regulatory requirements and the minimum requirements for well capitalized institutions.
The following table shows the ratios of Tier 1 capital and total capital to risk-adjusted assets and the leverage ratios for Porter Bancorp and PBI Bank at December 31, 2009:
| Regulatory Minimums |
Well-Capitalized Minimums |
Porter Bancorp |
PBI Bank |
|||||||||
| Tier 1 capital |
4.0 | % | 6.0 | % | 11.93 | % | 10.65 | % | ||||
| Total risk-based capital |
8.0 | 10.0 | 13.83 | 12.56 | ||||||||
| Tier 1 leverage ratio |
4.0 | 5.0 | 9.59 | 8.57 |
Off Balance Sheet Arrangements
In the normal course of business, we enter into various transactions, which, in accordance with GAAP, are not included in our consolidated balance sheets. We enter into these transactions to meet the financing needs of our customers. These transactions include commitments to extend credit and standby letters of credit, which involve, to varying degrees, elements of credit risk and interest rate risk in excess of the amounts recognized in the consolidated balance sheets.
Our commitments associated with outstanding standby letters of credit and commitments to extend credit as of December 31, 2009 are summarized below. Since commitments associated with letters of credit and commitments to extend credit may expire unused, the amounts shown do not necessarily reflect our actual future cash funding requirements:
| One year or less |
More than 1 year but less than 3 years |
3 years or more but less than 5 years |
5 years or more |
Total | |||||||||||
| (dollars in thousands) | |||||||||||||||
| Commitments to extend credit |
$ | 74,326 | $ | 24,775 | $ | 14,452 | $ | 23,904 | $ | 137,457 | |||||
| Standby letters of credit |
4,801 | — | — | — | 4,801 | ||||||||||
| Total |
$ | 79,127 | $ | 24,775 | $ | 14,452 | $ | 23,904 | $ | 142,258 | |||||
Standby Letters of Credit – Standby letters of credit are written conditional commitments we issue to guarantee the performance of a customer to a third party. If the customer does not perform in accordance with the terms of the agreement with the third party, we would be required to fund the commitment. The maximum potential amount of future payments we could be required to make is represented by the contractual amount of the commitment. If the commitment is funded, we would be entitled to seek recovery from the customer. Our policies generally require that standby letter of credit arrangements contain security and debt covenants similar to those contained in loan agreements.
Commitments to Extend Credit – We enter into contractual commitments to extend credit, normally with fixed expiration dates or termination clauses, at specified rates and for specific purposes. Substantially all of our commitments to extend credit are contingent upon customers maintaining specific credit standards at the time of loan funding. We minimize our exposure to loss under these commitments by subjecting them to credit approval and monitoring procedures.
Contractual Obligations
The following table summarizes our contractual obligations and other commitments to make future payments as of December 31, 2009:
| One year or less |
More than 1 year but less than 3 years |
3 years or more but less than 5 years |
5 years or more |
Total | |||||||||||
| (dollars in thousands) | |||||||||||||||
| Time deposits |
$ | 947,704 | $ | 108,836 | $ | 181,444 | $ | 205 | $ | 1,238,189 | |||||
| FHLB advances (1) |
65,000 | 5,000 | — | — | 70,000 | ||||||||||
| FHLB borrowing (2) |
2,684 | 3,896 | 2,045 | 4,355 | 12,980 | ||||||||||
| Subordinated capital note |
450 | 1,800 | 1,800 | 4,950 | 9,000 | ||||||||||
| Junior subordinated debentures |
— | — | — | 25,000 | 25,000 | ||||||||||
| Total |
$ | 1,015,838 | $ | 119,532 | $ | 185,289 | $ | 34,510 | $ | 1,355,169 | |||||
| (1) | Includes single maturity fixed rate advances with rates ranging from 0.38% to 4.96%, averaging 3.41%. |
| (2) | Fixed rate mortgage-matched borrowing with rates ranging from 0% to 9.10%, and maturities ranging from 2010 through 2035, averaging 3.71%. |
43
Table of Contents
Impact of Inflation and Changing Prices
The financial statements and related data presented herein have been prepared in accordance with U.S. generally accepted accounting principles, which require the measurement of financial position and operating results in historical dollars without considering changes in the relative purchasing power of money over time due to inflation.
We have an asset and liability structure that is essentially monetary in nature. As a result, interest rates have a more significant impact on our performance than the effects of general levels of inflation. Periods of high inflation are often accompanied by relatively higher interest rates, and periods of low inflation are accompanied by relatively lower interest rates. As market interest rates rise or fall in relation to the rates earned on our loans and investments, the value of these assets decreases or increases respectively.
| Item 7A. | Quantitative and Qualitative Disclosures About Market Risk |
To minimize the volatility of net interest income and exposure to economic loss that may result from fluctuating interest rates, we manage our exposure to adverse changes in interest rates through asset and liability management activities within guidelines established by our Asset Liability Committee (“ALCO”). The ALCO, which is comprised of senior management representatives, has the responsibility for approving and ensuring compliance with asset/liability management policies. Interest rate risk is the exposure to adverse changes in the net interest income as a result of market fluctuations in interest rates. The ALCO, on an ongoing basis, monitors interest rate and liquidity risk in order to implement appropriate funding and balance sheet strategies. Management considers interest rate risk to be our most significant market risk.
We utilize an earnings simulation model to analyze net interest income sensitivity. We then evaluate potential changes in market interest rates and their subsequent effects on net interest income. The model projects the effect of instantaneous movements in interest rates of both 100 and 200 basis points. While short-term interest rates are very low at present, we believe our 100 and 200 basis points scenarios remain appropriate in both rates up and rates down scenarios given that prime rate was 3.25% at year-end 2009. Assumptions based on the historical behavior of our deposit rates and balances in relation to changes in interest rates are also incorporated into the model. These assumptions are inherently uncertain and, as a result, the model cannot precisely measure future net interest income or precisely predict the impact of fluctuations in market interest rates on net interest income. Actual results will differ from the model’s simulated results due to timing, magnitude and frequency of interest rate changes as well as changes in market conditions and the application and timing of various management strategies.
Our interest sensitivity profile was asset sensitive at December 31, 2009 and December 31, 2008. Given an instantaneous 100 basis point decrease in rates that was sustained for 12 months, our base net interest income would decrease by an estimated 4.5% at December 31, 2009 compared with a decrease of 7.6% at December 31, 2008. Given a 100 basis point increase in interest rates our base net interest income would increase by an estimated 4.9% at December 31, 2009 compared with an increase of 5.1% at December 31, 2008.
The following table indicates the estimated impact on net interest income under various interest rate scenarios for the year ended December 31, 2009, as calculated using the static shock model approach:
| Change in Future Net Interest Income |
||||||
| Change in Interest Rates |
Dollar Change | Percentage Change | ||||
| (dollars in thousands) | ||||||
| + 200 basis points |
$ | 5,706 | 9.50 | % | ||
| + 100 basis points |
2,934 | 4.88 | ||||
We did not run a model simulation for declining interest rates as of December 31, 2009, because the Federal Reserve effectively lowered the federal funds target rate between 0.00% to 0.25% in December 2008. Therefore, no further short-term rate reductions can occur. As we implements strategies to mitigate the risk of rising interest rates in the future, these strategies will lessen our forecasted “base case” net interest income in the event of no interest rate changes.
Our interest sensitivity at any point in time will be affected by a number of factors. These factors include the mix of interest sensitive assets and liabilities as well as their relative pricing schedules. It is also influenced by market interest rates, deposit growth, loan growth, decay rates and prepayment speed assumptions.
The following table sets forth the amounts of our interest-earning assets and interest-bearing liabilities outstanding at December 31, 2009 which we anticipate, based upon certain assumptions, to reprice or mature in each of the future time periods shown. The projected repricing of assets and liabilities anticipates prepayments and scheduled rate adjustments, as well as contractual maturities under an interest rate unchanged scenario within the selected time intervals. While we believe such assumptions are reasonable, we cannot assure you that assumed repricing rates will approximate our actual future activity.
44
Table of Contents
| Volume Subject to Repricing Within | |||||||||||||||||||||||||||
| 0 – 90 Days |
91 – 181 Days |
182 – 365 Days |
1 – 5 Years |
Over 5 Years |
Non- Interest Sensitive |
Total | |||||||||||||||||||||
| (dollars in thousands) | |||||||||||||||||||||||||||
| Assets: |
|||||||||||||||||||||||||||
| Federal funds sold and short-term investments |
$ | 157,091 | $ | — | $ | — | $ | — | $ | — | — | $ | 157,091 | ||||||||||||||
| Investment securities |
21,469 | 6,847 | 13,123 | 83,644 | 41,550 | 2,088 | 168,721 | ||||||||||||||||||||
| FHLB stock |
10,072 | — | — | — | — | — | 10,072 | ||||||||||||||||||||
| Loans held for sale |
334 | — | — | — | — | — | 334 | ||||||||||||||||||||
| Loans, net of allowance |
835,304 | 112,129 | 154,597 | 290,933 | 19,955 | (26,392 | ) | 1,386,526 | |||||||||||||||||||
| Fixed and other assets |
— | — | — | — | — | 112,346 | 112,346 | ||||||||||||||||||||
| Total assets |
$ | 1,024,270 | $ | 118,976 | $ | 167,720 | $ | 374,577 | $ | 61,505 | $ | 88,042 | $ | 1,835,090 | |||||||||||||
| Liabilities and Stockholders’ Equity |
|||||||||||||||||||||||||||
| Interest-bearing checking, savings, and money market accounts |
$ | 194,644 | $ | — | $ | — | $ | — | $ | — | $ | — | $ | 194,644 | |||||||||||||
| Certificates of deposit |
308,346 | 345,130 | 291,418 | 291,586 | 1,709 | — | 1,238,189 | ||||||||||||||||||||
| Borrowed funds |
50,993 | 20,479 | 30,972 | 21,256 | 4,797 | — | 128,497 | ||||||||||||||||||||
| Other liabilities |
— | — | — | — | — | 104,426 | 104,426 | ||||||||||||||||||||
| Stockholders’ equity |
— | — | — | — | — | 169,334 | 169,334 | ||||||||||||||||||||
| Total liabilities and stockholders’ equity |
$ | 553,983 | $ | 365,609 | $ | 322,390 | $ | 312,842 | $ | 6,506 | $ | 273,760 | $ | 1,835,090 | |||||||||||||
| Period gap |
$ | 470,287 | $ | (246,633 | ) | $ | (154,670 | ) | $ | 61,735 | $ | 54,999 | |||||||||||||||
| Cumulative gap |
$ | 470,287 | $ | 223,654 | $ | 68,984 | $ | 130,719 | $ | 185,718 | |||||||||||||||||
| Period gap to total assets |
25.63 | % | (13.44 | %) | (8.43 | %) | 3.36 | % | 3.00 | % | |||||||||||||||||
| Cumulative gap to total assets |
25.63 | % | 12.19 | % | 3.76 | % | 7.12 | % | 10.12 | % | |||||||||||||||||
| Cumulative interest-earning assets to cumulative interest-bearing liabilities |
184.89 | % | 124.32 | % | 105.55 | % | 108.41 | % | 111.89 | % | |||||||||||||||||
Our one-year cumulative gap position as of December 31, 2009 was positive $223.6 million or 12.2% of assets. This is a one-day position that is continually changing and is not necessarily indicative of our position at any other time. Any gap analysis has inherent shortcomings because certain assets and liabilities may not move proportionally as interest rates change.
45
Table of Contents
| Item 8. | Financial Statements and Supplementary Data |
The following consolidated financial statements and reports are included in this section:
46
Table of Contents

MANAGEMENT’S REPORT ON INTERNAL CONTROL OVER FINANCIAL REPORTING
The Management of Porter Bancorp, Inc. (the “Company”) is responsible for the preparation, integrity, and fair presentation of the Company’s annual consolidated financial statements. All information has been prepared in accordance with U.S. generally accepted accounting principles and, as such, includes certain amounts that are based on Management’s best estimates and judgments.
Management is responsible for establishing and maintaining adequate internal control over financial reporting presented in conformity with U.S. generally accepted accounting principles. Internal control over financial reporting includes those policies and procedures that (1) pertain to the maintenance of records that, in reasonable detail, accurately and fairly reflect the transactions and dispositions of the assets of the Company; (2) provide reasonable assurance that transactions are recorded as necessary to permit preparation of financial statements in accordance with U.S. generally accepted accounting principles, and that receipts and expenditures of the Company are being made only in accordance with authorizations of management and directors of the Company; and (3) provide reasonable assurance regarding prevention or timely detection of unauthorized acquisition, use, or disposition of the Company’s assets that could have a material effect on the financial statements.
Two of the objectives of internal control are to provide reasonable assurance to Management and the Board of Directors that transactions are properly authorized and recorded in our financial records, and that the preparation of the Company’s financial statements and other financial reporting is done in accordance with U.S. generally accepted accounting principles.
Management has made its own assessment of the effectiveness of the Company’s internal control over financial reporting as of December 31, 2009, in relation to the criteria described in the report, Internal Control — Integrated Framework , issued by the Committee of Sponsoring Organizations of the Treadway Commission (“COSO”). Based on our assessment, Management concludes that as of December 31, 2009, the Company’s internal control over financial reporting is effective based on those criteria. This annual report does not include an attestation report of the Company’s registered public accounting firm regarding internal control over financial reporting pursuant to temporary rules of the Securities and Exchange Commission that permit the Company to provide only management’s report in this annual report.
There are inherent limitations in the effectiveness of internal control, including the possibility of human error and the circumvention or overriding of controls. Accordingly, even effective internal control can provide only reasonable assurance with respect to reliability of financial statements. Furthermore, the effectiveness of internal control can vary with changes in circumstances. Based on its assessment, Management believes that as of December 31, 2009, the Company’s internal control was effective in achieving the objectives stated above.
| /s/ Maria L. Bouvette |
/s/ David B. Pierce | |||
| Maria L. Bouvette President and Chief Executive Officer |
David B. Pierce Chief Financial Officer |
March 15, 2010
47
Table of Contents

REPORT OF INDEPENDENT REGISTERED PUBLIC ACCOUNTING FIRM
Porter Bancorp, Inc.
Louisville, Kentucky
We have audited the accompanying consolidated balance sheets of Porter Bancorp, Inc. as of December 31, 2009 and 2008, and the related consolidated statements of income, changes in stockholders’ equity, comprehensive income, and cash flows for each of the three years in the period ended December 31, 2009. These consolidated financial statements are the responsibility of the Company’s management. Our responsibility is to express an opinion on these consolidated financial statements based on our audits.
We conducted our audits in accordance with the standards of the Public Company Accounting Oversight Board (United States). Those standards require that we plan and perform the audit to obtain reasonable assurance about whether the financial statements are free of material misstatement. The Company is not required to have, nor were we engaged to perform, an audit of its internal control over financial reporting. Our audit included consideration of internal control over financial reporting as a basis for designing audit procedures that are appropriate in the circumstances, but not for the purpose of expressing an opinion on the effectiveness of the Company’s internal control over financial reporting. Accordingly, we express no such opinion. An audit includes examining, on a test basis, evidence supporting the amounts and disclosures in the financial statements. An audit also includes assessing the accounting principles used and significant estimates made by management, as well as evaluating the overall financial statement presentation. We believe that our audits provide a reasonable basis for our opinion.
In our opinion, the consolidated financial statements referred to above present fairly, in all material respects, the financial position of Porter Bancorp, Inc. as of December 31, 2009 and 2008, and the results of its operations and its cash flows for each of the three years in the period ended December 31, 2009, in conformity with U.S. generally accepted accounting principles.
Crowe Horwath, LLP
Louisville, Kentucky
March 15, 2010
48
Table of Contents
CONSOLIDATED BALANCE SHEETS
December 31,
(Dollar amounts in thousands except share data)
| 2009 | 2008 | ||||||
| Assets |
|||||||
| Cash and due from financial institutions |
$ | 169,328 | $ | 43,767 | |||
| Federal funds sold |
2,845 | 8,779 | |||||
| Cash and cash equivalents |
172,173 | 52,546 | |||||
| Interest-bearing deposits in other financial institutions |
— | 600 | |||||
| Securities available for sale |
168,721 | 173,077 | |||||
| Loans held for sale |
334 | — | |||||
| Loans, net of allowance of $26,392 and $19,652, respectively |
1,386,526 | 1,330,454 | |||||
| Premises and equipment |
23,610 | 22,543 | |||||
| Goodwill |
23,794 | 23,794 | |||||
| Accrued interest receivable and other assets |
59,932 | 44,843 | |||||
| Total assets |
$ | 1,835,090 | $ | 1,647,857 | |||
| Liabilities and Stockholders’ Equity |
|||||||
| Deposits |
|||||||
| Non-interest bearing |
$ | 97,263 | $ | 92,940 | |||
| Interest bearing |
1,432,833 | 1,195,609 | |||||
| Total deposits |
1,530,096 | 1,288,549 | |||||
| Repurchase agreements |
11,517 | 10,084 | |||||
| Federal Home Loan Bank advances |
82,980 | 142,776 | |||||
| Accrued interest payable and other liabilities |
7,163 | 8,235 | |||||
| Subordinated capital note |
9,000 | 9,000 | |||||
| Junior subordinated debentures |
25,000 | 25,000 | |||||
| Total liabilities |
1,665,756 | 1,483,644 | |||||
| Commitments and contingent liabilities (Note 17) |
— | — | |||||
| Stockholders’ equity |
|||||||
| Preferred stock, no par, 1,000,000 shares authorized, 35,000 issued and outstanding |
34,307 | 34,131 | |||||
| Common stock, no par, 10,000,000 shares authorized, 8,756,440 and 8,702,330 shares issued and outstanding, respectively |
83,104 | 76,897 | |||||
| Non-voting common stock, no par, 9,000,000 shares authorized |
— | — | |||||
| Additional paid-in capital |
14,959 | 13,483 | |||||
| Retained earnings |
34,811 | 39,957 | |||||
| Accumulated other comprehensive income (loss) |
2,153 | (255 | ) | ||||
| Total stockholders’ equity |
169,334 | 164,213 | |||||
| Total liabilities and stockholders’ equity |
$ | 1,835,090 | $ | 1,647,857 | |||
See accompanying notes.
49
Table of Contents
CONSOLIDATED STATEMENTS OF INCOME
Years Ended December 31,
(Dollar amounts in thousands except per share data)
| 2009 | 2008 | 2007 | |||||||||
| Interest income |
|||||||||||
| Loans, including fees |
$ | 83,970 | $ | 93,217 | $ | 84,681 | |||||
| Taxable securities |
8,971 | 4,983 | 4,405 | ||||||||
| Tax exempt securities |
878 | 818 | 684 | ||||||||
| Federal funds sold and other |
647 | 1,089 | 2,030 | ||||||||
| 94,466 | 100,107 | 91,800 | |||||||||
| Interest expense |
|||||||||||
| Deposits |
35,088 | 45,073 | 43,882 | ||||||||
| Federal Home Loan Bank advances |
3,691 | 5,589 | 3,260 | ||||||||
| Junior subordinated debentures |
795 | 1,368 | 1,924 | ||||||||
| Subordinated capital note |
362 | 296 | — | ||||||||
| Notes payable |
— | — | 1 | ||||||||
| Federal funds purchased and other |
476 | 555 | 337 | ||||||||
| 40,412 | 52,881 | 49,404 | |||||||||
| Net interest income |
54,054 | 47,226 | 42,396 | ||||||||
| Provision for loan losses |
14,200 | 5,400 | 4,025 | ||||||||
| Net interest income after provision for loan losses |
39,854 | 41,826 | 38,371 | ||||||||
| Non-interest income |
|||||||||||
| Service charges on deposit accounts |
3,112 | 3,424 | 2,760 | ||||||||
| Income from fiduciary activities |
875 | 1,079 | 206 | ||||||||
| Secondary market brokerage fees |
235 | 365 | 296 | ||||||||
| Title insurance commissions |
130 | 157 | 186 | ||||||||
| Net gain on sales of loans originated for sale |
411 | — | — | ||||||||
| Net (loss) gain on sales of securities |
315 | (136 | ) | 107 | |||||||
| Other than temporary impairment on securities |
— | (471 | ) | — | |||||||
| Gain on sale of branch |
— | 410 | — | ||||||||
| Other |
2,016 | 2,040 | 2,001 | ||||||||
| 7,094 | 6,868 | 5,556 | |||||||||
| Non-interest expense |
|||||||||||
| Salaries and employee benefits |
15,009 | 14,792 | 12,470 | ||||||||
| Occupancy and equipment |
3,918 | 3,587 | 2,727 | ||||||||
| FDIC insurance |
2,984 | 1,051 | 298 | ||||||||
| State franchise tax |
1,800 | 1,740 | 1,336 | ||||||||
| Other real estate owned expense |
1,155 | 881 | 833 | ||||||||
| Professional fees |
901 | 787 | 829 | ||||||||
| Postage and delivery |
752 | 748 | 546 | ||||||||
| Communications |
729 | 711 | 466 | ||||||||
| Advertising |
492 | 463 | 544 | ||||||||
| Other |
2,716 | 2,997 | 2,425 | ||||||||
| 30,456 | 27,757 | 22,474 | |||||||||
| Income before income taxes |
16,492 | 20,937 | 21,453 | ||||||||
| Income tax expense |
5,424 | 6,927 | 7,224 | ||||||||
| Net income |
11,068 | 14,010 | 14,229 | ||||||||
| Less: |
|||||||||||
| Dividends on preferred stock |
(1,750 | ) | (194 | ) | — | ||||||
| Accretion on preferred stock |
(176 | ) | (20 | ) | — | ||||||
| Net income available to common shareholders |
$ | 9,142 | $ | 13,796 | $ | 14,229 | |||||
| Basic and diluted earnings per common share |
$ | 1.05 | $ | 1.59 | $ | 1.68 | |||||
50
Table of Contents
CONSOLIDATED STATEMENTS OF CHANGES IN STOCKHOLDERS’ EQUITY
AND COMPREHENSIVE INCOME
Years Ended December 31,
(Dollar amounts in thousands except share and per share data)
| Shares | Amount | |||||||||||||||||||||||||
| Common | Preferred | Common | Preferred | Additional Paid-In Capital |
Retained Earnings |
Accumulated Other Comprehensive Income (Loss) |
Total | |||||||||||||||||||
| Balances, January 1, 2007 |
7,622,447 | — | $ | 64,820 | — | $ | 11,036 | $ | 32,355 | $ | 135 | $ | 108,346 | |||||||||||||
| Issuance of stock in acquisition, net |
263,409 | — | 6,119 | — | — | — | — | 6,119 | ||||||||||||||||||
| Issuance of unvested stock |
7,500 | — | — | — | — | — | — | — | ||||||||||||||||||
| Forfeited unvested stock |
(2,150 | ) | — | — | — | — | — | — | — | |||||||||||||||||
| Shares repurchased |
(10,000 | ) | — | (192 | ) | — | — | — | — | (192 | ) | |||||||||||||||
| Stock-based compensation expense |
— | — | — | — | 234 | — | — | 234 | ||||||||||||||||||
| Comprehensive income: |
||||||||||||||||||||||||||
| Net income |
— | — | — | — | — | 14,229 | — | 14,229 | ||||||||||||||||||
| Changes in net unrealized gain (loss) on securities held for sale, net of reclassifications and tax effects |
— | — | — | — | — | — | (214 | ) | (214 | ) | ||||||||||||||||
| Total comprehensive income |
— | — | — | — | — | — | — | 14,015 | ||||||||||||||||||
| Cash dividends declared ($0.73 per share) |
— | — | — | — | — | (6,233 | ) | — | (6,233 | ) | ||||||||||||||||
| Balances, December 31, 2007 |
7,881,206 | — | 70,747 | — | 11,270 | 40,351 | (79 | ) | 122,289 | |||||||||||||||||
| Issuance of preferred stock and a common stock warrant |
— | 35,000 | — | 34,111 | 889 | — | — | 35,000 | ||||||||||||||||||
| Issuance of unvested stock |
31,952 | — | — | — | — | — | — | — | ||||||||||||||||||
| Forfeited unvested stock |
(2,731 | ) | — | — | — | — | — | — | — | |||||||||||||||||
| Shares repurchased |
(17,371 | ) | — | (301 | ) | — | — | — | — | (301 | ) | |||||||||||||||
| Stock-based compensation expense |
— | — | — | — | 296 | — | — | 296 | ||||||||||||||||||
| Comprehensive income: |
||||||||||||||||||||||||||
| Net income |
— | — | — | — | — | 14,010 | — | 14,010 | ||||||||||||||||||
| Changes in net unrealized gain (loss) on securities held for sale, net of tax effects |
— | — | — | — | — | — | (176 | ) | (176 | ) | ||||||||||||||||
| Total comprehensive income |
— | — | — | — | — | — | — | 13,834 | ||||||||||||||||||
| Dividends on preferred stock |
— | — | — | — | — | (194 | ) | — | (194 | ) | ||||||||||||||||
| Amortization of preferred stock discount |
— | — | — | 20 | — | (20 | ) | — | — | |||||||||||||||||
| Cash dividends declared ($0.77 per share) |
— | — | — | — | — | (6,711 | ) | — | (6,711 | ) | ||||||||||||||||
| 5% stock dividend declared |
394,877 | — | 6,451 | — | 1,028 | (7,479 | ) | — | — | |||||||||||||||||
51
Table of Contents
| Shares | Amount | |||||||||||||||||||||||||
| Common | Preferred | Common | Preferred | Additional Paid-In Capital |
Retained Earnings |
Accumulated Other Comprehensive Income (Loss) |
Total | |||||||||||||||||||
| Balances, December 31, 2008 |
8,287,933 | 35,000 | 76,897 | 34,131 | 13,483 | 39,957 | (255 | ) | 164,213 | |||||||||||||||||
| Issuance of unvested stock |
51,684 | — | — | — | — | — | — | — | ||||||||||||||||||
| Forfeited unvested stock |
(515 | ) | — | — | — | — | — | — | — | |||||||||||||||||
| Stock-based compensation expense |
— | — | — | — | 388 | — | — | 388 | ||||||||||||||||||
| Comprehensive income: |
||||||||||||||||||||||||||
| Net income |
— | — | — | — | — | 11,068 | — | 11,068 | ||||||||||||||||||
| Changes in net unrealized gain (loss) on securities held for sale, net of tax effects |
— | — | — | — | — | — | 2,408 | 2,408 | ||||||||||||||||||
| Total comprehensive income |
— | — | — | — | — | — | — | 13,476 | ||||||||||||||||||
| Dividends on preferred stock |
— | — | — | — | — | (1,750 | ) | — | (1,750 | ) | ||||||||||||||||
| Amortization of preferred stock discount |
— | — | — | 176 | — | (176 | ) | — | — | |||||||||||||||||
| Cash dividends declared ($0.80 per share) |
— | — | — | — | — | (6,993 | ) | — | (6,993 | ) | ||||||||||||||||
| 5% stock dividend declared |
417,338 | — | 6,207 | — | 1,088 | (7,295 | ) | — | — | |||||||||||||||||
| Balances, December 31, 2009 |
8,756,440 | 35,000 | $ | 83,104 | $ | 34,307 | $ | 14,959 | $ | 34,811 | $ | 2,153 | $ | 169,334 | ||||||||||||
See accompanying notes.
52
Table of Contents
CONSOLIDATED STATEMENTS OF CASH FLOWS
Years Ended December 31,
(in thousands)
| 2009 | 2008 | 2007 | ||||||||||
| Cash flows from operating activities |
||||||||||||
| Net income |
$ | 11,068 | $ | 14,010 | $ | 14,229 | ||||||
| Adjustments to reconcile net income to net cash from operating activities |
||||||||||||
| Depreciation and amortization |
3,464 | 3,664 | 2,485 | |||||||||
| Provision for loan losses |
14,200 | 5,400 | 4,025 | |||||||||
| Net accretion on securities |
(558 | ) | (53 | ) | (32 | ) | ||||||
| Stock-based compensation expense |
386 | 280 | 234 | |||||||||
| Deferred income taxes |
(2,574 | ) | (486 | ) | (716 | ) | ||||||
| Net gain on sales of loans |
(411 | ) | — | — | ||||||||
| Loans originated for sale |
(20,529 | ) | — | — | ||||||||
| Proceeds from sales of loans held for sale |
20,439 | — | — | |||||||||
| Net loss on other real estate owned |
190 | 263 | 391 | |||||||||
| Net realized (gain) loss on sales of securities |
(315 | ) | 607 | (107 | ) | |||||||
| Net gain on sale of branch |
— | (410 | ) | — | ||||||||
| Earnings on bank owned life insurance |
(283 | ) | (300 | ) | (296 | ) | ||||||
| Federal Home Loan Bank stock dividends |
— | (393 | ) | — | ||||||||
| Net change in accrued interest receivable and other assets |
(5,031 | ) | 2,575 | 1,218 | ||||||||
| Net change in accrued interest payable and other liabilities |
(2,398 | ) | (942 | ) | (853 | ) | ||||||
| Net cash from operating activities |
17,648 | 24,215 | 20,578 | |||||||||
| Cash flows from investing activities |
||||||||||||
| Net change in interest-bearing deposits with banks |
600 | — | — | |||||||||
| Purchases of available-for-sale securities |
(36,979 | ) | (92,280 | ) | (37,171 | ) | ||||||
| Sales and calls of available-for-sale securities |
13,813 | 24,339 | 2,800 | |||||||||
| Maturities and prepayments of available-for-sale securities |
32,100 | 22,075 | 18,664 | |||||||||
| Proceeds from sale of other real estate owned |
13,121 | 12,119 | 8,260 | |||||||||
| Improvements to other real estate owned |
(293 | ) | (386 | ) | (1,066 | ) | ||||||
| Loan originations and payments, net |
(92,248 | ) | (82,186 | ) | (292,431 | ) | ||||||
| Purchases of premises and equipment, net |
(2,605 | ) | (2,415 | ) | (4,544 | ) | ||||||
| Redemption of bank owned life insurance |
— | 2,179 | — | |||||||||
| Acquisition of Ohio County Bancshares, net |
— | — | (5,881 | ) | ||||||||
| Acquisition of Paramount Bank, net |
— | (5,215 | ) | — | ||||||||
| Disposal of Burkesville branch, net |
— | (8,904 | ) | — | ||||||||
| Net cash from investing activities |
(72,491 | ) | (130,674 | ) | (311,369 | ) | ||||||
| Cash flows from financing activities |
||||||||||||
| Net change in deposits |
241,547 | 59,416 | 210,222 | |||||||||
| Net change in federal funds purchased and repurchase agreements |
1,433 | (1,201 | ) | 7,641 | ||||||||
| Repayment of notes payable |
— | — | (2,534 | ) | ||||||||
| Repayment of Federal Home Loan Bank advances |
(299,796 | ) | (53,991 | ) | (30,984 | ) | ||||||
| Advances from Federal Home Loan Bank |
240,000 | 75,000 | 99,595 | |||||||||
| Proceeds from subordinated capital note |
— | 9,000 | — | |||||||||
| Issuance of preferred stock, net |
— | 35,000 | — | |||||||||
| Repurchase of common stock |
— | (301 | ) | (192 | ) | |||||||
| Cash dividends paid on preferred stock |
(1,721 | ) | (194 | ) | — | |||||||
| Cash dividends paid on common stock |
(6,993 | ) | (6,711 | ) | (6,233 | ) | ||||||
| Net cash from financing activities |
174,470 | 116,018 | 277,515 | |||||||||
| Net change in cash and cash equivalents |
119,627 | 9,559 | (13,276 | ) | ||||||||
| Beginning cash and cash equivalents |
52,546 | 42,987 | 56,263 | |||||||||
| Ending cash and cash equivalents |
$ | 172,173 | $ | 52,546 | $ | 42,987 | ||||||
| Supplemental cash flow information: |
||||||||||||
| Interest paid |
$ | 41,055 | $ | 53,322 | $ | 48,161 | ||||||
| Income taxes paid |
8,150 | 6,700 | 8,150 | |||||||||
| Supplemental non-cash disclosure |
||||||||||||
| Transfer from loans to other real estate |
$ | 20,534 | $ | 16,004 | $ | 9,725 | ||||||
| Issuance of common stock in acquisition of Ohio County Bancshares, net |
— | — | 6,119 | |||||||||
| 5% Stock dividend |
7,295 | 7,479 | — | |||||||||
See accompanying notes.
53
Table of Contents
PORTER BANCORP, INC. AND SUBSIDIARY
NOTES TO CONSOLIDATED FINANCIAL STATEMENTS
December 31, 2009, 2008 and 2007
NOTE 1 – SUMMARY OF SIGNIFICANT ACCOUNTING POLICIES
Nature of Operations and Principles of Consolidation – The consolidated financial statements include Porter Bancorp, Inc. (Company or PBI) and its subsidiary, PBI Bank (Bank). The Company owns a 100% interest in the Bank.
The Company provides financial services through its offices in Central Kentucky and Louisville. Its primary deposit products are checking, savings, and term certificate accounts, and its primary lending products are residential mortgage, commercial, and real estate loans. Substantially all loans are collateralized by specific items of collateral including business assets, commercial real estate, and residential real estate. Commercial loans are expected to be repaid from cash flow from operations of businesses. There are no significant concentrations of loans to any one industry or customer. However, customers’ ability to repay their loans is dependent on the real estate and general economic conditions in the area. Other financial instruments which potentially represent concentrations of credit risk include deposit accounts in other financial institutions and federal funds sold. The Company also provides trust services.
Use of Estimates – To prepare financial statements in conformity with U.S. generally accepted accounting principles, management makes estimates and assumptions based on available information. These estimates and assumptions affect the amounts reported in the financial statements and the disclosures provided, and future results could differ. The allowance for loan losses, intangible assets, stock compensation, deferred tax assets, and fair values of financial instruments are particularly subject to change.
Cash Flows – Cash and cash equivalents include cash, deposits with other financial institutions under 90 days, and federal funds sold. Net cash flows are reported for customer and loan deposit transactions, interest-bearing deposits in other financial institutions, and federal funds purchased and repurchase agreements.
Securities – Debt securities are classified as available-for-sale when they might be sold before maturity. Equity securities with readily determined fair values are classified as available-for-sale. Securities available for sale are carried at fair value, with unrealized holding gains and losses reported in other comprehensive income.
Interest income includes amortization of purchase premium or discount. Premiums and discounts on securities are amortized on the level-yield method anticipating prepayments on mortgage backed securities. Gains and losses on sales are recorded on the trade date and determined using the specific identification method.
Management evaluates securities for other-than-temporary impairment (“OTTI”) at least on a quarterly basis, and more frequently when economic or market conditions warrant such an evaluation.
Loans Held for Sale – Mortgage loans originated and intended for sale in the secondary market are carried at the lower of aggregate cost or fair value, as determined by outstanding commitments from investors. Net unrealized losses, if any, are recorded as a valuation allowance and charged to earnings.
Mortgage loans held for sale are generally sold with servicing rights retained. The carrying value of mortgage loans sold is reduced by the amount allocated to the servicing right. Gains and losses on sales of mortgage loans are based on the difference between the selling price and the carrying value of the related loan sold.
Mortgage banking derivatives used in the ordinary course of business consist of mandatory forward sales contracts and rate lock loan commitments. Forward contracts represent future commitments to deliver loans at a specified price and date and are used to manage interest rate risk on loan commitments and mortgage loans held for sale. Rate lock commitments represent commitments to fund loans at a specific rate. These derivatives involve underlying items, such as interest rates, and are designed to transfer risk. Substantially all of these instruments expire within 60 days from the date of issuance. Notional amounts are amounts on which calculations and payments are based, but which do not represent credit exposure, as credit exposure is limited to the amounts required to be received or paid.
We adopted FASB ASC topic 815, “Derivative and Hedging” during the first quarter of 2009. Our commitments to deliver loans and our rate lock loan commitments were insignificant at year end.
Loans – Loans that management has the intent and ability to hold for the foreseeable future or until maturity or payoff are reported at the principal balance outstanding, net of deferred loan fees and costs, and an allowance for loan losses. Interest income is accrued on the unpaid principal balance. Loan origination fees, net of certain direct origination costs, are deferred and recognized in interest income using the level-yield method without anticipating prepayments.
54
Table of Contents
Interest income on mortgage and commercial loans is discontinued at the time the loan is 90 days delinquent unless the loan is well collateralized and in process of collection. Consumer and credit card loans are typically charged off no later than 120 days past due. Past due status is based on the contractual terms of the loan. In all cases, loans are placed on non-accrual or charged off at an earlier date if collection of principal or interest is considered doubtful.
All interest accrued but not received for loans placed on non-accrual is reversed against interest income. Interest received on such loans is accounted for on the cash-basis or cost-recovery method, until qualifying for return to accrual. Loans are returned to accrual status when all the principal and interest amounts contractually due are brought current and future payments are reasonably assured.
Allowance for Loan Losses – The allowance for loan losses is a valuation allowance for probable incurred credit losses. Loan losses are charged against the allowance when management believes the uncollectibility of a loan balance is confirmed. Subsequent recoveries, if any, are credited to the allowance. Management estimates the allowance balance required using past loan loss experience, the nature and volume of the portfolio, information about specific borrower situations and estimated collateral values, economic conditions, and other factors. Allocations of the allowance may be made for specific loans, but the entire allowance is available for any loan that, in management’s judgment, should be charged off. The allowance consists of specific and general components. The specific component relates to loans that are individually classified as impaired or loans otherwise classified as substandard or doubtful. The general component covers non-classified loans and is based on historical loss experience adjusted for current factors.
A loan is impaired when, based on current information and events, it is probable that the Company will be unable to collect the scheduled payments of principal or interest when due according to the contractual terms of the loan agreement. Factors considered by management in determining impairment include payment status, collateral value, and the probability of collecting scheduled principal and interest payments when due. Loans that experience insignificant payment delays and payment shortfalls generally are not classified as impaired. Management determines the significance of payment delays and payment shortfalls on case-by-case basis, taking into consideration all of the circumstances surrounding the loan and the borrower, including the length of the delay, the reasons for the delay, the borrower’s prior payment record, and the amount of the shortfall in relation to the principal and interest owed.
Commercial and commercial real estate loans are individually evaluated for impairment. If a loan is impaired, a portion of the allowance is allocated so that the loan is reported, net, at the present value of estimated future cash flows using the loan’s existing rate, or at the fair value of collateral if repayment is expected solely from the collateral. Large groups of smaller balance homogeneous loans, such as consumer and residential real estate loans are collectively evaluated for impairment, and accordingly, they are not separately identified for impairment disclosures.
Servicing Rights – Servicing rights are recognized separately when they are acquired through sales of loans. When mortgage loans are sold, servicing rights are initially recorded at fair value with the income statement effect recorded in gains on sales of loans. Fair value is based on market prices for comparable mortgage servicing contracts, when available or alternatively, is based on a valuation model that calculates the present value of estimated future net servicing income. Servicing assets are subsequently measured using the amortization method which requires servicing rights to be amortized into non-interest income in proportion to, and over the period of, the estimated future net servicing income of the underlying loans. To date, we have retained the servicing rights for all loans originated for sale and subsequently sold.
Servicing rights are evaluated for impairment based upon the fair value of the rights as compared to carrying amount. Impairment is recognized through a valuation allowance to the extent that fair value is less than the carrying amount. If the Company later determines that all or a portion of the impairment no longer exists, a reduction of the allowance may be recorded as an increase to income. The fair values of servicing rights are subject to significant fluctuations as a result of changes in estimated and actual prepayment speeds and default rates and losses.
Servicing fee income is recorded for fees earned for servicing loans. The fees are based on a contractual percentage of the outstanding principal or a fixed amount per loan and are recorded as income when earned. The amortization of mortgage servicing rights is netted against loan servicing fee income. Net amortization expense was $1,000 for the year ended December 31, 2009. Late fees and ancillary fees related to loan servicing were not material.
Transfers of Financial Assets – Transfers of financial assets are accounted for as sales, when control over the assets has been relinquished. Control over transferred assets is deemed to be surrendered when the assets have been isolated from the Company, the transferee obtains the right (free of conditions that constrain it from taking advantage of that right) to pledge or exchange the transferred assets, and the Company does not maintain effective control over the transferred assets through an agreement to repurchase them before their maturity.
55
Table of Contents
Other Real Estate Owned – Assets acquired through or instead of loan foreclosure are initially recorded at the lower of cost or fair value less costs to sell when acquired, establishing a new cost basis. If fair value declines subsequent to foreclosure, a valuation allowance is recorded through expense. Costs after acquisition are expensed. Other real estate owned of $14.5 million and $7.8 million is included in other assets on the balance sheet at December 31, 2009 and 2008, respectively.
Premises and Equipment – Land is carried at cost. Premises and equipment are stated at cost less accumulated depreciation. Buildings and related components are depreciated using the straight-line method with useful lives ranging from 5 to 33 years. Furniture, fixtures and equipment are depreciated using the straight-line or accelerated method with useful lives ranging from 3 to 7 years.
Federal Home Loan Bank (FHLB) Stock – The Bank is a member of the FHLB system. Members are required to own a certain amount of stock based on the level of borrowings and other factors, and may invest in additional amounts. FHLB stock is carried at cost, classified as a restricted security, and periodically evaluated for impairment. Because this stock is viewed as long term investment, impairment is based on ultimate recovery of par value. Both cash and stock dividends are reported as income.
Goodwill and Intangible Assets – Goodwill results from business acquisitions and represents the excess of the purchase price over the fair value of acquired tangible assets and liabilities, and identifiable intangible assets. Goodwill is assessed at least annually for impairment and any such impairment will be recognized in the period identified.
Other intangible assets consist of core deposit and trust account intangible assets arising from whole bank and branch acquisitions. They are initially measured at fair value and then are amortized on an accelerated or straight-line basis over their estimated useful lives.
Bank Owned Life Insurance – The Bank has purchased life insurance policies on certain key executives. Company owned life insurance is recorded at the amount that can be realized under the insurance contract at the balance sheet date, which is the cash surrender value adjusted for other charges or other amounts due that are probable at settlement.
Long-Term Assets – Premises and equipment, other intangible assets, and other long-term assets are reviewed for impairment when events indicate their carrying amount may not be recoverable from future undiscounted cash flows. If impaired, the assets are recorded at fair value.
Repurchase Agreements – Substantially all repurchase agreement liabilities represent amounts advanced by various customers. Securities are pledged to cover these liabilities, which are not covered by federal deposit insurance.
Benefit Plans – Employee 401(k) and profit sharing plan expense is the amount of matching contributions. Deferred compensation and supplemental retirement plan expense allocates the benefits over years of service.
Stock-Based Compensation – Compensation cost is recognized for stock options and restricted stock awards issued to employees, based on the fair value of these awards at the date of grant. A Black-Scholes model is utilized to estimate the fair value of stock options, while the market price of the Corporation’s common stock at the date of grant is used for restricted stock awards. Compensation cost is recognized over the required service period, generally defined as the vesting period. For awards with graded vesting, compensation cost is recognized on a straight-line basis over the requisite service period for the entire award.
Income Taxes – Income tax expense is the total of the current year income tax due or refundable and the change in deferred tax assets and liabilities. Deferred tax assets and liabilities are the expected future tax amounts for the temporary differences between carrying amounts and tax bases of assets and liabilities, computed using enacted tax rates. A valuation allowance, if needed, reduces deferred tax assets to the amount expected to be realized.
The Company adopted guidance issued by the FASB with respect to accounting for uncertainty in income taxes as of January 1, 2007. A tax position is recognized as a benefit only if it is “more likely than not” that the tax position would be sustained in a tax examination, with a tax examination being presumed to occur. The amount recognized is the largest amount of tax benefit that is greater than 50% likely of being realized on examination. For tax positions not meeting the “more likely than not” test, no tax benefit is recorded. The adoption had no affect on the Company’s financial statements.
The Company recognizes interest and/or penalties related to income tax matters in income tax expense.
Loan Commitments and Related Financial Instruments – Financial instruments include off-balance sheet credit instruments, such as commitments to make loans and commercial letters of credit, issued to meet customer-financing needs. The face amount for these items represents the exposure to loss, before considering customer collateral or ability to repay. Such financial instruments are recorded when they are funded.
56
Table of Contents
Comprehensive Income – Comprehensive income consists of net income and other comprehensive income. Other comprehensive income includes unrealized gains and losses on securities available for sale, which are also recognized as a separate component of equity.
Equity – Stock dividends in excess of 20% are reported by transferring the par value of the stock issued from retained earnings to common stock. Stock dividends for 20% or less are reported by transferring the fair value, as of the ex-dividend date, of the stock issued from retained earnings to common stock and additional paid-in capital. Fractional share amounts are paid in cash with a reduction in retained earnings.
Earnings Per Common Share – Basic earnings per common share are net income available to common shareholders divided by the weighted average number of common shares outstanding during the period. Diluted earnings per common share include the dilutive effect of additional potential common shares issuable under stock options and warrants. Earnings and dividends per share are restated for all stock splits and dividends through the date of issue of the financial statements.
Loss Contingencies – Loss contingencies, including claims and legal actions arising in the ordinary course of business, are recorded as liabilities when the likelihood of loss is probable and an amount or range of loss can be reasonably estimated. Management does not believe there now are such matters that will have a material effect on the financial statements.
Dividend Restriction – Banking regulations require maintaining certain capital levels and may limit the dividends paid by the Bank to the Company or by the Company to shareholders. (See Note 16 for more specific disclosure.)
Preferred Stock – Preferred stock was issued in 2008 and is outstanding under the United States Department of the Treasury’s Capital Purchase Program. Issued in conjunction with the Preferred Stock were common stock warrants. See footnote 15 for a discussion of all terms and conditions of that transaction. The proceeds received in the offering were allocated on a pro rata basis to the Preferred Stock and the Warrants based on relative fair values. In estimating the fair value of the Warrants, the Company utilized the Black-Scholes model which includes assumptions regarding the Company’s common stock prices, stock price volatility, dividend yield, the risk free interest rate and the estimated life of the Warrant. The fair value of the Preferred Stock was determined using a discounted cash flow methodology. The value assigned to the Preferred Stock will be amortized up to the $35.0 million liquidation value of such preferred stock, with the cost of such amortization being reported as additional preferred stock dividends. Dividends are accrued and paid quarterly.
Fair Value of Financial Instruments – Fair values of financial instruments are estimated using relevant market information and other assumptions, as more fully disclosed in Note 18. Fair value estimates involve uncertainties and matters of significant judgment regarding interest rates, credit risk, prepayments, and other factors, especially in the absence of broad markets for particular items. Changes in assumptions or in market conditions could significantly affect the estimates.
Reclassifications – Some items in the prior year financial statements were reclassified to conform to the current presentation.
Adoption of New Accounting Standards
In September 2006, the FASB issued guidance that defines fair value, establishes a framework for measuring fair value and expands disclosures about fair value measurements. This guidance also establishes a fair value hierarchy about the assumptions used to measure fair value and clarifies assumptions about risk and the effect of a restriction on the sale or use of an asset. The guidance was effective for fiscal years beginning after November 15, 2007. In February 2008, the FASB issued guidance that delayed the effective date of this fair value guidance for all nonfinancial assets and nonfinancial liabilities, except those that are recognized or disclosed at fair value on a recurring basis (at least annually) to fiscal years beginning after November 15, 2008, and interim periods within those fiscal years. (See Note 18 for more specific disclosure.)
In December 2007, the FASB issued guidance that establishes principles and requirements for how an acquirer recognizes and measures in its financial statements the identifiable assets acquired, the liabilities assumed, and any noncontrolling interest in an acquiree, including the recognition and measurement of goodwill acquired in a business combination. The guidance is effective for fiscal years beginning on or after December 15, 2008. The impact of adoption was not material.
In December 2007, the FASB issued guidance that changes the accounting and reporting for minority interests, which is recharacterized as noncontrolling interests and classified as a component of equity within the consolidated balance sheets. The guidance was effective as of the beginning of the first fiscal year beginning on or after December 15, 2008. The impact of adoption was not material.
57
Table of Contents
In June 2009, the FASB replaced The Hierarchy of Generally Accepted Accounting Principles, with the FASB Accounting Standards Codification TM (The Codification) as the source of authoritative accounting principles recognized by the FASB to be applied by nongovernmental entities in the preparation of financial statements in conformity with GAAP. Rules and interpretive releases of the Securities and Exchange Commission under authority of federal securities laws are also sources of authoritative GAAP for SEC registrants. The Codification was effective for financial statements issued for periods ending after September 15, 2009.
In June 2008, the FASB issued guidance which addresses whether instruments granted in share-based payment transactions are participating securities prior to vesting and, therefore, included in the earnings allocation in computing earnings per share (EPS) under the two-class method. Unvested share-based payment awards that contain non-forfeitable rights to dividends or dividend equivalents (whether paid or unpaid) are participating securities and shall be included in the computation of EPS pursuant to the two-class method. This guidance was effective for financial statements issued for fiscal years beginning after December 15, 2008, and interim periods within those years. All prior-period EPS data presented were to be adjusted retrospectively (including interim financial statements, summaries of earnings, and selected financial data) to conform to the provisions of this guidance. Management has adopted this statement for the period end December 31, 2009 and the impact has been retroactively presented in the 2008 and 2007 EPS disclosures.
In April 2009, the FASB amended existing guidance for determining whether impairment is other-than-temporary for debt securities. The guidance requires an entity to assess whether it intends to sell, or it is more likely than not that it will be required to sell, a security in an unrealized loss position before recovery of its amortized cost basis. If either of these criteria is met, the entire difference between amortized cost and fair value is recognized as impairment through earnings. For securities that do not meet the aforementioned criteria, the amount of impairment is split into two components as follows: 1) other-than-temporary impairment (OTTI) related to other factors, which is recognized in other comprehensive income and 2) OTTI related to credit loss, which must be recognized in the income statement. The credit loss is defined as the difference between the present value of the cash flows expected to be collected and the amortized cost basis. Additionally, disclosures about other-than-temporary impairments for debt and equity securities were expanded. This guidance was effective for interim and annual reporting periods ending after June 15, 2009, with early adoption permitted for periods ending after March 15, 2009. The impact of adoption was not material.
In April 2009, the FASB issued guidance that emphasizes that the objective of a fair value measurement does not change even when market activity for the asset or liability has decreased significantly. Fair value is the price that would be received for an asset sold or paid to transfer a liability in an orderly transaction (that is, not a forced liquidation or distressed sale) between market participants at the measurement date under current market conditions. When observable transactions or quoted prices are not considered orderly, then little, if any, weight should be assigned to the indication of the asset or liability’s fair value. Adjustments to those transactions or prices should be applied to determine the appropriate fair value. The guidance, which was applied prospectively, was effective for interim and annual reporting periods ending after June 15, 2009 early adoption for periods ending after March 15, 2009. The impact of adoption was not material.
In August 2009, the FASB amended existing guidance for the fair value measurement of liabilities by clarifying that in circumstances in which a quoted price in an active market for the identical liability is not available, a reporting entity is required to measure fair value using a valuation technique that uses the quoted price of the identical liability when traded as an asset, quoted prices for similar liabilities or similar liabilities when traded as assets, or that is consistent with existing fair value guidance. The amendments in this guidance also clarify that both a quoted price in an active market for the identical liability at the measurement date and the quoted price for the identical liability when traded as an asset in an active market when no adjustments to the quoted price of the asset are required are Level 1 fair value measurements. The guidance was effective for the first reporting period beginning after issuance. The impact of adoption was not material.
Effect of Newly Issued But Not Yet Effective Accounting Standards
In June 2009, the FASB issued Statement of Financial Accounting Standards No. 166, Accounting for Transfers of Financial Assets, an Amendment of FASB Statement No. 140 (ASC 810). The new accounting requirement amends previous guidance relating to the transfers of financial assets and eliminates the concept of a qualifying special purpose entity. This Statement must be applied as of the beginning of each reporting entity’s first annual reporting period that begins after November 15, 2009, for interim periods within that first annual reporting period and for interim and annual reporting periods thereafter. This Statement must be applied to transfers occurring on or after the effective date. Additionally, on and after the effective date, the concept of a qualifying special-purpose entity is no longer relevant for accounting purposes. Therefore, formerly qualifying special-purpose entities should be evaluated for consolidation by reporting entities on and after the effective date in accordance with the applicable consolidation guidance. Additionally, the disclosure provisions of this Statement were also amended and apply to transfers that occurred both before and after the effective date of this Statement. Management is currently evaluating this standard but does not expect the impact of adoption to be material to the results of operations or financial position of the Company.
58
Table of Contents
The FASB issued Statement of Financial Accounting Standards No. 167, Amendments to FASB Interpretation No. 46(R), which amended guidance for consolidation of variable interest entities by replacing the quantitative-based risks and rewards calculation for determining which enterprise, if any, has a controlling financial interest in a variable interest entity with an approach focused on identifying which enterprise has the power to direct the activities of a variable interest entity that most significantly impact the entity’s economic performance and (1) the obligation to absorb losses of the entity or (2) the right to receive benefits from the entity. This Statement also requires additional disclosures about an enterprise’s involvement in variable interest entities. This Statement will be effective as of the beginning of each reporting entity’s first annual reporting period that begins after November 15, 2009, for interim periods within that first annual reporting period, and for interim and annual reporting periods thereafter. Early adoption is prohibited. The effect of adopting this new guidance is expected to be immaterial.
NOTE 2 – STOCK PLANS AND STOCK BASED COMPENSATION
At December 31, 2009, the Company has a stock option plan and a stock incentive plan. On December 31, 2005, the Company assumed the 2000 Stock Option Plan of Ascencia Bank, Inc. when the Company acquired the minority interest of Ascencia Bancorp, Inc. On February 23, 2006, the Company adopted the Porter Bancorp, Inc. 2006 Stock Incentive Plan. With regard to the 2000 Option Plan, no additional grants were made after assumption of the plan and none are expected to be made in the future. The 2006 Plan permits the issuance of up to 400,000 shares of the Company’s common stock upon the exercise of stock options or upon the grant of stock awards. As of December 31, 2009, the Company had granted outstanding options to purchase 209,808 shares under the 2000 option plan and 40,037 shares under the 2006 plan. The Company also had granted under the 2006 plan 110,397 unvested shares net of forfeitures and vesting. The Company has 229,959 shares remaining available for issue under the 2006 Plan. All shares issued under the above mentioned plans came from authorized and unissued shares.
On May 15, 2006, the board of directors approved the Porter Bancorp, Inc. 2006 Non-Employee Directors Stock Ownership Incentive Plan, which was approved by holders of the Company’s voting common stock on June 8, 2006. On May 22, 2008, shareholders voted to amend the plan to change the form of incentive award from stock options to unvested shares. Under the terms of the plan, 100,000 shares are reserved for issuance to non-employee directors upon the exercise of stock options or upon the grant of unvested stock awards granted under the plan. Prior to the amendment, options were granted automatically under the plan at fair market value on the date of grant. The options vest over a three-year period and have a five year term. Unvested shares are granted automatically under the plan at fair market value on the date of grant and vest semi-annually on the anniversary date of the grant over three years. To date, the Company has granted options to purchase 47,413 shares and granted 3,420 unvested shares to non-employee directors. At December 31, 2009, 47,416 shares remain available for issue under this plan.
All stock options have an exercise price that is equal to or greater than the fair market value of the Company’s stock on the date the options were granted. Options granted generally become fully exercisable at the end of three years of continued employment. Options granted under the 2000 plan have a life of ten years while those granted under the 2006 plan have a life of five years.
The following table summarizes stock option activity as of and for the year indicated:
| December 31, 2009 | ||||||
| Options | Weighted Average Exercise Price | |||||
| Outstanding, beginning |
297,810 | $ | 22.89 | |||
| Forfeited |
(552 | ) | 23.13 | |||
| Outstanding, ending |
297,258 | $ | 22.89 | |||
The following table details stock options outstanding:
| December 31, 2009 | |||
| Stock options vested and currently exercisable: |
296,091 | ||
| Weighted average exercise price |
$ | 22.90 | |
| Aggregate intrinsic value |
$ | 0 | |
| Weighted average remaining life (in years) |
0.8 | ||
| Total Options Outstanding: |
297,258 | ||
| Aggregate intrinsic value |
$ | 0 | |
| Weighted average remaining life (in years) |
0.8 | ||
59
Table of Contents
The intrinsic value of stock options is calculated based on the exercise price of the underlying awards and the market price of our common stock as of the reporting date. The intrinsic value of the vested and expected to vest stock options is $0 at December 31, 2009. There were no options exercised during 2009 or 2008. The Company recorded $61,000 and $60,000 of stock option compensation during 2009 and 2008, respectively, to salaries and employee benefits. Since the stock options are non-qualified stock options, a tax benefit of $22,000 and $21,000, respectively, was recognized. No options were modified during either period. As of December 31, 2009, no stock options issued by the Company have been exercised.
The fair value of each stock option granted is estimated on the date of grant using the Black-Scholes based stock option valuation model. This model requires the input of subjective assumptions that will usually have a significant impact on the fair value estimate. Expected volatilities are based on volatilities of similar publicly traded companies due to the limited historical trading activity of the Company’s stock, and other factors. Expected dividends are based on dividend trends and the market price of the Company’s stock price at grant. The Company uses historical data to estimate option exercises within the valuation model. The risk-free rate for periods within the contractual life of the option is based on the U.S. Treasury yield curve in effect at the time of grant. No options were granted in 2009 or 2008.
From time-to-time, the Company grants unvested shares to employees and non-employee directors. The shares vest either semi-annually or annually over three to ten years on the anniversary date of the grant date provided the employee or director continues in such capacity at the vesting date. The fair value on the date of grant ranged from $10.85 to $13.52 per share. The Company recorded $325,000 and $220,000, respectively, of stock-based compensation during 2009 and 2008 to salaries and employee benefits. A deferred tax benefit of $114,000 and $77,000, respectively, was recognized related to this expense.
The following table summarizes unvested share activity as of and for the year indicated:
| December 31, 2009 | ||||||
| Shares | Weighted Average Grant Price | |||||
| Outstanding, beginning |
72,441 | $ | 19.83 | |||
| Granted |
54,268 | 10.97 | ||||
| Vested |
(12,351 | ) | 19.19 | |||
| Forfeited |
(541 | ) | 23.13 | |||
| Outstanding, ending |
113,817 | $ | 15.66 | |||
Unrecognized stock based compensation expense related to stock options and unvested shares for 2009 and beyond is estimated as follows (in thousands):
| 2010 |
$ | 357 | |
| 2011 |
346 | ||
| 2012 |
334 | ||
| 2013 |
250 | ||
| 2014 & thereafter |
282 |
60
Table of Contents
NOTE 3 – SECURITIES
The fair value of available for sale securities and the related gross unrealized gains and losses recognized in accumulated other comprehensive income (loss) were as follows:
| Amortized Cost |
Gross Unrealized Gains |
Gross Unrealized Losses |
Fair Value | ||||||||||
| (in thousands) | |||||||||||||
| December 31, 2009 |
|||||||||||||
| U.S. Government and federal agency |
$ | 586 | $ | 33 | $ | — | $ | 619 | |||||
| State and municipal |
24,537 | 955 | (37 | ) | 25,455 | ||||||||
| Agency mortgage-backed: residential |
91,127 | 4,028 | — | 95,155 | |||||||||
| Private label mortgage-backed: residential |
33,516 | 279 | (2,156 | ) | 31,639 | ||||||||
| Corporate bonds |
13,054 | 760 | (49 | ) | 13,765 | ||||||||
| Other |
704 | — | (175 | ) | 529 | ||||||||
| Total debt securities |
163,524 | 6,055 | (2,417 | ) | 167,162 | ||||||||
| Equity |
1,885 | 75 | (401 | ) | 1,559 | ||||||||
| Total |
$ | 165,409 | $ | 6,130 | $ | (2,818 | ) | $ | 168,721 | ||||
| December 31, 2008 |
|||||||||||||
| U.S. Government and federal agency |
$ | 2,938 | $ | 22 | $ | — | $ | 2,960 | |||||
| State and municipal |
24,493 | 330 | (415 | ) | 24,408 | ||||||||
| Agency mortgage-backed: residential |
119,807 | 1,293 | (118 | ) | 120,982 | ||||||||
| Private label mortgage-backed: residential |
17,139 | — | (494 | ) | 16,645 | ||||||||
| Corporate bonds |
6,489 | 39 | (451 | ) | 6,077 | ||||||||
| Other |
704 | — | — | 704 | |||||||||
| Total debt securities |
171,570 | 1,684 | (1,478 | ) | 171,776 | ||||||||
| Equity |
1,900 | 28 | (627 | ) | 1,301 | ||||||||
| Total |
$ | 173,470 | $ | 1,712 | $ | (2,105 | ) | $ | 173,077 | ||||
Sales and calls of available for sale securities were as follows:
| 2009 | 2008 | 2007 | |||||||
| (in thousands) | |||||||||
| Proceeds |
$ | 13,813 | $ | 24,339 | $ | 2,800 | |||
| Gross gains |
321 | 625 | 107 | ||||||
| Gross losses |
6 | 761 | — | ||||||
The tax benefit (provision) related to these net gains and losses realized on sales were $(110,000), $48,000 and $(37,000), respectively.
The amortized cost and fair value of the investment securities portfolio are shown by expected maturity. Expected maturities may differ from contractual maturities if borrowers have the right to call or prepay obligations with or without call or prepayment penalties.
| December 31, 2009 | ||||||
| Amortized Cost |
Fair Value | |||||
| (in thousands) | ||||||
| Maturity |
||||||
| Available-for-sale |
||||||
| Within one year |
$ | 34,327 | $ | 34,203 | ||
| One to five years |
87,276 | 90,638 | ||||
| Five to ten years |
26,122 | 27,260 | ||||
| Beyond ten years |
15,799 | 15,061 | ||||
| Total |
$ | 163,524 | $ | 167,162 | ||
61
Table of Contents
Securities pledged at year-end 2009 and 2008 had carrying values of approximately $67,329,000 and $74,201,000, respectively, and were pledged to secure public deposits, repurchase agreements, and Federal Home Loan Bank advances.
At year-end 2009 and 2008, there were no holdings of securities of any one issuer, other than the U.S. Government and its agencies, in an amount greater than 10% of stockholders’ equity.
Securities with unrealized losses at year-end 2009 and 2008, aggregated by investment category and length of time that individual securities have been in a continuous unrealized loss position, are as follows:
| Less than 12 Months | 12 Months or More | Total | |||||||||||||||||||
| Description of Securities |
Fair Value |
Unrealized Loss |
Fair Value |
Unrealized Loss |
Fair Value |
Unrealized Loss |
|||||||||||||||
| (in thousands) | |||||||||||||||||||||
| 2009 |
|||||||||||||||||||||
| State and municipal |
$ | 867 | $ | (5 | ) | $ | 1,033 | $ | (32 | ) | $ | 1,900 | $ | (37 | ) | ||||||
| Agency mortgage-backed: residential |
8 | — | — | — | 8 | — | |||||||||||||||
| Private label mortgage-backed: residential |
23,731 | (1,977 | ) | 4,091 | (179 | ) | 27,822 | (2,156 | ) | ||||||||||||
| Corporate bonds |
— | — | 1,997 | (49 | ) | 1,997 | (49 | ) | |||||||||||||
| Other |
529 | (175 | ) | — | — | 529 | (175 | ) | |||||||||||||
| Equity |
46 | (12 | ) | 701 | (389 | ) | 747 | (401 | ) | ||||||||||||
| Total temporarily impaired |
$ | 25,181 | $ | (2,169 | ) | $ | 7,822 | $ | (649 | ) | $ | 33,003 | $ | (2,818 | ) | ||||||
| 2008 |
|||||||||||||||||||||
| State and municipal |
$ | 12,240 | $ | (412 | ) | $ | 96 | $ | (3 | ) | $ | 12,336 | $ | (415 | ) | ||||||
| Agency mortgage-backed: residential |
34,119 | (61 | ) | 1,446 | (57 | ) | 35,565 | (118 | ) | ||||||||||||
| Private label mortgage-backed: residential |
9,730 | (494 | ) | — | — | 9,730 | (494 | ) | |||||||||||||
| Corporate bonds |
2,266 | (141 | ) | 2,776 | (310 | ) | 5,042 | (451 | ) | ||||||||||||
| Equity |
578 | (315 | ) | 447 | (312 | ) | 1,025 | (627 | ) | ||||||||||||
| Total temporarily impaired |
$ | 58,933 | $ | (1,423 | ) | $ | 4,765 | $ | (682 | ) | $ | 63,698 | $ | (2,105 | ) | ||||||
The Company’s mortgage-backed securities portfolio includes non-agency collateralized mortgage obligations with a market value of $31.6 million which had unrealized losses of approximately $2.2 million at December 31, 2009. These non-agency mortgage-backed securities were rated AAA at purchase. The Company monitors to insure it has adequate credit support and as of December 31, 2009, the Company believes there is no OTTI and does not have the intent to sell these securities and it is likely that it will not be required to sell the securities before their anticipated recovery.
The Company evaluates securities for other-than-temporary impairment at least on a quarterly basis, and more frequently when economic or market concerns warrant such evaluation. Consideration is given to the length of time and the extent to which the fair value has been less than cost, the financial condition and near-term prospects of the issuer, underlying credit quality of the issuer, and the intent and ability of the Company to retain its investment in the issuer for a period of time sufficient to allow for any anticipated recovery in fair value. In analyzing an issuer’s financial condition, the Company may consider whether the securities are issued by the federal government or its agencies, whether downgrades by bond rating agencies have occurred, the sector or industry trends and cycles affecting the issuer, and the results of reviews of the issuer’s financial condition. Management currently intends to hold all securities with unrealized losses until recovery, which for fixed income securities may be at maturity.
As of December 31, 2009, the Company holds 44 equity securities. Of these securities, 10 had an unrealized loss of $12,000 and had been in an unrealized loss position for less than twelve months and 19 had an unrealized loss of $389,000 and had been in an unrealized loss position for more than 12 months. Management monitors the underlying financial condition of the issuers and current market pricing for these equity securities monthly. During the 2008 fourth quarter, we recorded an other than temporary impairment charge totaling $471,000 for equity securities held in our portfolio with an original cost of $832,000. The market prices of the stocks had been below our initial investment for more than twelve months and after consideration of the companies financial conditions and the likelihood the market value would recover to our cost basis in a reasonable period of time, the investment was written down to fair value. As of December 31, 2009, management does not believe any of the remaining equity securities in our portfolio with unrealized losses should be classified as other than temporarily impaired.
62
Table of Contents
NOTE 4 – LOANS
Loans at year-end were as follows:
| 2009 | 2008 | |||||||
| (in thousands) | ||||||||
| Commercial |
$ | 89,903 | $ | 90,978 | ||||
| Real estate |
1,259,474 | 1,202,019 | ||||||
| Agriculture |
25,064 | 16,181 | ||||||
| Consumer |
36,989 | 37,783 | ||||||
| Other |
1,488 | 3,145 | ||||||
| Subtotal |
1,412,918 | 1,350,106 | ||||||
| Less: Allowance for loan losses |
(26,392 | ) | (19,652 | ) | ||||
| Loans, net |
$ | 1,386,526 | $ | 1,330,454 | ||||
Activity in the allowance for loan losses for the years indicated was as follows:
| 2009 | 2008 | 2007 | ||||||||||
| (in thousands) | ||||||||||||
| Beginning balance |
$ | 19,652 | $ | 16,342 | $ | 12,832 | ||||||
| Acquired in bank acquisition |
— | 1,421 | 1,625 | |||||||||
| Provision for loan losses |
14,200 | 5,400 | 4,025 | |||||||||
| Loans charged-off |
(7,731 | ) | (3,834 | ) | (2,374 | ) | ||||||
| Loan recoveries |
271 | 323 | 234 | |||||||||
| Ending balance |
$ | 26,392 | $ | 19,652 | $ | 16,342 | ||||||
Impaired loans were as follows:
| 2009 | 2008 | |||||
| (in thousands) | ||||||
| Loans with no allocated allowance for loan losses |
$ | 21,373 | $ | 3,479 | ||
| Loans with allocated allowance for loan losses |
84,766 | 16,249 | ||||
| Total |
$ | 106,139 | $ | 19,728 | ||
| Amount of the allowance for loan losses allocated |
$ | 5,453 | $ | 875 | ||
| 2009 | 2008 | 2007 | |||||||
| (in thousands) | |||||||||
| Average of impaired loans during the year |
$ | 44,041 | $ | 19,066 | $ | 4,842 | |||
| Interest income recognized during impairment |
1,094 | 793 | 98 | ||||||
| Cash basis interest income recognized |
987 | 647 | 98 | ||||||
Impaired loans include commercial, construction, agriculture, and commercial real estate loans on non-accrual or classified as doubtful, whereby collection of the total amount is improbable, or loss, whereby all or a portion of the loan has been written off or a specific allowance for loss had been provided.
Nonperforming loans were as follows:
| 2009 | 2008 | |||
| (in thousands) | ||||
| Loans past due 90 days or more still on accrual |
5,968 | 11,598 | ||
| Non-accrual loans |
78,888 | 9,725 | ||
Nonperforming loans include impaired loans and smaller balance homogeneous loans, such as residential mortgage and consumer loans, that are collectively evaluated for impairment. At December 31, 2009 we had restructured loans totaling $25.2 million with borrowers who experienced deterioration in financial condition. These loans are secured by 1-4 residential or commercial real estate properties. Management believes these loans are well secured and the borrowers have the ability to repay the loans in accordance with the renegotiated terms.
63
Table of Contents
NOTE 5 – PREMISES AND EQUIPMENT
Year-end premises and equipment were as follows:
| 2009 | 2008 | |||||||
| (in thousands) | ||||||||
| Land and buildings |
$ | 24,740 | $ | 22,363 | ||||
| Furniture and equipment |
17,253 | 16,581 | ||||||
| 41,993 | 38,944 | |||||||
| Accumulated depreciation |
(18,383 | ) | (16,401 | ) | ||||
| $ | 23,610 | $ | 22,543 | |||||
Depreciation expense was $1,486,000, $1,410,000 and $1,056,000 for 2009, 2008 and 2007, respectively.
NOTE 6 – GOODWILL AND INTANGIBLE ASSETS
Goodwill
The change in balance of goodwill during the years indicated was as follows:
| 2009 | 2008 | ||||||
| (in thousands) | |||||||
| Beginning of year |
$ | 23,794 | $ | 18,174 | |||
| Acquired goodwill |
— | 5,986 | |||||
| Adjustments |
— | (334 | ) | ||||
| Disposal of goodwill from sale of Burkesville branch |
— | (32 | ) | ||||
| End of year |
$ | 23,794 | $ | 23,794 | |||
Adjustments to goodwill in 2008 resulted from finalizing evaluations related to the Ohio County Bancshares acquisition in 2007.
Acquired Intangible Assets
Acquired intangible assets were as follows as of year end:
| 2009 | 2008 | |||||||||||
| Gross Carrying Amount |
Accumulated Amortization |
Gross Carrying Amount |
Accumulated Amortization | |||||||||
| (in thousands) | ||||||||||||
| Amortized intangible assets: |
||||||||||||
| Core deposit intangibles |
$ | 4,183 | $ | 1,207 | $ | 4,183 | $ | 748 | ||||
| Trust account intangibles |
100 | 23 | 100 | 13 | ||||||||
In 2008, core deposit intangibles of $631,000 were acquired in the Paramount Bank acquisition and $48,000 of core deposit intangibles were disposed of in the sale of the Burkesville branch.
Aggregate amortization expense was $469,000, $474,000 and $115,000 for 2009, 2008 and 2007, respectively.
Estimated aggregate amortization expense for intangible assets for each of the next five years is as follows (in thousands):
| 2010 |
$ | 469 | |
| 2011 |
469 | ||
| 2012 |
466 | ||
| 2013 |
437 | ||
| 2014 |
407 |
64
Table of Contents
NOTE 7 – DEPOSITS
Time deposits of $100,000 or more were approximately $616,290,000 and $410,331,000 at year-end 2009 and 2008, respectively.
Scheduled maturities of total time deposits for each of the next five years are as follows (in thousands):
| 2010 |
$ | 947,704 | |
| 2011 |
40,114 | ||
| 2012 |
68,722 | ||
| 2013 |
8,238 | ||
| 2014 |
173,206 | ||
| Thereafter |
205 | ||
| $ | 1,238,189 | ||
NOTE 8 – SECURITIES SOLD UNDER AGREEMENTS TO REPURCHASE
Securities sold under agreements to repurchase are financing arrangements that mature within two years. At maturity, the securities underlying the agreements are returned to the Company. Securities sold under agreements to repurchase are secured by agency, mortgage-backed, and municipal securities. Information concerning securities sold under agreements to repurchase is summarized as follows:
| 2009 | 2008 | |||||||
| (in thousands) | ||||||||
| Balance at year-end |
$ | 11,517 | $ | 10,084 | ||||
| Average daily balance during the year |
$ | 10,912 | $ | 10,715 | ||||
| Average interest rate during the year |
4.35 | % | 4.42 | % | ||||
| Maximum month-end balance during the year |
$ | 11,556 | $ | 11,369 | ||||
| Weighted average interest rate at year-end |
4.21 | % | 4.45 | % | ||||
| Fair value of securities sold under agreements to repurchase at year-end |
$ | 11,517 | $ | 10,084 | ||||
NOTE 9 – ADVANCES FROM FEDERAL HOME LOAN BANK
At year-end, advances from the Federal Home Loan Bank were as follows:
| 2009 | 2008 | |||||
| (in thousands) | ||||||
| Single maturity advances with fixed rates from 0.38% to 4.96% maturing from 2010 through 2012, averaging 3.41% for 2009 |
$ | 70,000 | $ | 126,595 | ||
| Monthly amortizing advances with fixed rates from 0.00% to 9.10% and maturities ranging from 2010 through 2035, averaging 3.71% for 2009 |
12,980 | 16,181 | ||||
| Total |
$ | 82,980 | $ | 142,776 | ||
Each advance is payable per terms on agreement, with a prepayment penalty. The advances were collateralized by approximately $470,541,000 and $464,992,000 of first mortgage loans, under a blanket lien arrangement at year-end 2009 and 2008. Based on this collateral and the Company’s holdings of Federal Home Loan Bank stock, the Company was eligible to borrow up to an additional $138,304,000 at year-end 2009.
Scheduled principal payments on the above during the next five years (in thousands):
| Advances | |||
| 2010 |
$ | 67,684 | |
| 2011 |
2,183 | ||
| 2012 |
6,713 | ||
| 2013 |
1,208 | ||
| 2014 |
837 | ||
| Thereafter |
4,355 | ||
| $ | 82,980 | ||
At year-end 2009, the Company had approximately $69 million of federal funds lines of credit available from correspondent institutions, and $138.3 million unused lines of credit with the Federal Home Loan Bank.
65
Table of Contents
NOTE 10 – SUBORDINATED CAPITAL NOTE
The subordinated capital note issued by PBI Bank totaled $9 million at December 31, 2009. The note is unsecured, bears interest at the BBA three-month LIBOR floating rate plus 300 basis points, and qualifies as Tier 2 capital. Interest only is due quarterly through September 30, 2010, at which time quarterly principal payments of $225,000 plus interest will commence. The note is due July 1, 2020. At December 31, 2009, the interest rate on this note was 3.29%.
NOTE 11 – JUNIOR SUBORDINATED DEBENTURES
The trust preferred securities are subject to mandatory redemption, in whole or in part, upon repayment of the junior subordinated debentures at maturity or their earlier redemption at the liquidation preference. The junior subordinated debentures are redeemable at par prior to the maturity dates of February 13, 2034, April 15, 2034, and March 1, 2037, at the option of the Company as defined within the trust indenture. The Company has the option to defer interest payments on the junior subordinated debentures from time to time for a period not to exceed twenty (20) consecutive quarters. If payments are deferred, the Company is prohibited from paying dividends to its common stockholders. A summary of the junior subordinated debentures is as follows:
| Description |
Issuance Date |
Optional Prepayment Date (2) |
Interest Rate (1) | Junior Subordinated Debt Owed to Trust |
Maturity Date | |||||||
| Porter Statutory Trust II |
02-13-2004 | 03-17-2009 | 3-month LIBOR + 2.85 | % | $ | 5,000,000 | 02-13-2034 | |||||
| Porter Statutory Trust III |
04-15-2004 | 06-17-2009 | 3-month LIBOR + 2.79 | % | 3,000,000 | 04-15-2034 | ||||||
| Porter Statutory Trust IV |
12-14-2006 | 03-01-2012 | 3-month LIBOR + 1.67 | % | 14,000,000 | 03-01-2037 | ||||||
| Asencia Statutory Trust I |
02-13-2004 | 03-17-2009 | 3-month LIBOR + 2.85 | % | 3,000,000 | 02-13-2034 | ||||||
| $ | 25,000,000 | |||||||||||
| (1) | As of December 31, 2009 the 3-month LIBOR was 0.25%. |
| (2) | The debentures are callable on or after the optional prepayment date at their principal amount plus accrued interest. |
NOTE 12 – OTHER BENEFIT PLANS
401(K) Plan – The Company 401(k) Savings Plan allows employees to contribute up to 15% of their compensation, which is matched equal to 50% of the first 4% of compensation contributed. The Company, at its discretion, may make an additional contribution. Total contributions made by the Company to the plan amounted to approximately $391,000, $395,000 and $295,000 in 2009, 2008 and 2007, respectively.
Supplemental Executive Retirement Plan – During 2004, the Company created a supplemental executive retirement plan covering certain executive officers. Under the plan, the Company pays each participant, or their beneficiary, a specific defined benefit amount over 10 years, beginning with the individual’s termination of service. A liability is accrued for the obligation under these plans. The expense incurred for the plan was $180,000, $180,000 and $180,000 for the years ended December 31, 2009, 2008 and 2007, respectively. The related liability was $897,000 and $717,000 at December 31, 2009 and 2008, respectively, and is included in other liabilities on the balance sheets.
The Company purchased life insurance on the participants to fund the benefits of these plans. Life insurance with a cash surrender value of $1,100,000 was purchased during 2006. The Company acquired life insurance with a cash surrender value in 2007 of $2,145,000 in the Ohio County Bancshares acquisition. The life insurance acquired in the Ohio County Bancshares acquisition was redeemed in 2008. It had a cash value of $2,179,000 at the time of redemption. The cash surrender value of all insurance policies was $7,509,000 and $7,227,000 at December 31, 2009 and 2008, respectively. Income earned from the cash surrender value of life insurance totaled $283,000, $300,000 and $296,000 for the years ended December 31, 2009, 2008 and 2007, respectively. The income is recorded as other non-interest income.
66
Table of Contents
NOTE 13 – INCOME TAXES
Income tax expense (benefit) was as follows:
| 2009 | 2008 | 2007 | ||||||||||
| (in thousands) | ||||||||||||
| Current |
$ | 7,943 | $ | 7,413 | $ | 7,940 | ||||||
| Deferred |
(2,519 | ) | (486 | ) | (716 | ) | ||||||
| $ | 5,424 | $ | 6,927 | $ | 7,224 | |||||||
Effective tax rates differ from federal statutory rate of 35% applied to income before income taxes due to the following.
| 2009 | 2008 | 2007 | ||||||||||
| (in thousands) | ||||||||||||
| Federal statutory rate times financial statement income |
$ | 5,772 | $ | 7,328 | $ | 7,509 | ||||||
| Effect of: |
||||||||||||
| Tax-exempt income |
(303 | ) | (289 | ) | (210 | ) | ||||||
| Non taxable life insurance income |
(99 | ) | (112 | ) | (111 | ) | ||||||
| Federal tax credits |
(45 | ) | (38 | ) | (38 | ) | ||||||
| Other, net |
99 | 38 | 74 | |||||||||
| Total |
$ | 5,424 | $ | 6,927 | $ | 7,224 | ||||||
Year-end deferred tax assets and liabilities were due to the following.
| 2009 | 2008 | |||||
| (in thousands) | ||||||
| Deferred tax assets: |
||||||
| Allowance for loan losses |
$ | 9,186 | $ | 6,757 | ||
| Net unrealized loss on securities available for sale |
— | 137 | ||||
| Other than temporary impairment write-down |
165 | 165 | ||||
| Net operating loss carryforward |
92 | 154 | ||||
| Amortization of non-compete agreements |
59 | 79 | ||||
| Other |
1,019 | 691 | ||||
| 10,521 | 7,983 | |||||
| Deferred tax liabilities: |
||||||
| Fixed assets |
575 | 424 | ||||
| Net unrealized gain on securities available for sale |
1,159 | — | ||||
| FHLB stock dividends |
1,276 | 1,276 | ||||
| Net assets from acquisitions |
1,679 | 1,720 | ||||
| Originated mortgage servicing rights |
55 | — | ||||
| Other |
716 | 724 | ||||
| 5,460 | 4,144 | |||||
| Net deferred tax asset |
$ | 5,061 | $ | 3,839 | ||
The Company does not have any beginning and ending unrecognized tax benefits. The Company does not expect the total amount of unrecognized tax benefits to significantly increase or decrease in the next twelve months. There were no interest and penalties recorded in the income statement or accrued for the year ending December 31, 2009 related to unrecognized tax benefits.
The Company and its subsidiaries are subject to U.S. federal income tax and the Company is subject to income tax in the state of Kentucky. The Company is no longer subject to examination by taxing authorities for years before 2006.
67
Table of Contents
NOTE 14 – RELATED PARTY TRANSACTIONS
Loans to principal officers, directors, and their affiliates in 2009 were as follows (in thousands):
| Beginning balance |
$ | 1,655 | ||
| New loans |
14,135 | |||
| Repayments |
(331 | ) | ||
| Ending balance |
$ | 15,459 | ||
Deposits from principal officers, directors, and their affiliates at year-end 2009 and 2008 were $4,300,000 and $9,775,000.
Our loan participation totals include participations in real estate loans purchased from and sold to two affiliate banks, The Peoples Bank, Mt. Washington and The Peoples Bank, Taylorsville. Our chairman, J. Chester Porter and his brother, William G. Porter, each own a 50% interest in Lake Valley Bancorp, Inc., the parent holding company of The Peoples Bank, Taylorsville, Kentucky. J. Chester Porter, William G. Porter and our president and chief executive officer, Maria L. Bouvette, serve as directors of The Peoples Bank, Taylorsville. Our chairman, J. Chester Porter owns an interest of approximately 36.0% and his brother, William G. Porter, owns an interest of approximately 3.0% in Crossroads Bancorp, Inc., the parent holding company of The Peoples Bank, Mount Washington, Kentucky. J. Chester Porter and Maria L. Bouvette, serve as directors of The Peoples Bank, Mount Washington. We have entered into management services agreements with each of these banks. Each agreement provides that our executives and employees provide management and accounting services to the subject bank, including overall responsibility for establishing and implementing policy and strategic planning. Maria Bouvette also serves as chief financial officer of each of the banks. We receive a $4,000 monthly fee from The Peoples Bank, Taylorsville and a $2,000 monthly fee from The Peoples Bank, Mount Washington for these services.
As of December 31, 2009, we had $4.9 million of participations in real estate loans purchased from, and $23.8 million of participations in real estate loans sold, to these affiliate banks. As of December 31, 2008, we had $6.0 million of participations in real estate loans purchased from, and $23.7 million of participations in real estate loans sold to, these affiliate banks.
NOTE 15 – PREFERRED STOCK
On November 21, 2008, as part of the United States Department of the Treasury’s (the “U.S. Treasury”) Capital Purchase Program made available to certain financial institutions in the U.S. pursuant to the Emergency Economic Stabilization Act of 2008 (“EESA”), the Company and the U.S. Treasury entered into a Letter Agreement including the Securities Purchase Agreement – Standard Terms incorporated therein (the “Purchase Agreement”) pursuant to which the Company issued to the U.S. Treasury, in exchange for aggregate consideration of $35.0 million, (i) 35,000 shares of the Company’s Fixed Rate Cumulative Perpetual Preferred Stock, Series A, no par value per share and liquidation preference $1,000 per share (the “Series A Preferred Stock”), and (ii) a warrant (the “Warrant”) to purchase up to 314,820 shares (the “Warrant Common Stock”) of the Company’s common stock, no par value per share, at an exercise price of $16.68 per share.
The Series A Preferred Stock qualifies as Tier 1 capital and pays cumulative cash dividends quarterly at a rate of 5% per annum for the first five years, and 9% per annum thereafter. The Series A Preferred Stock is non-voting, other than class voting rights on certain matters that could adversely affect the Series A Preferred Stock. The Series A Preferred Stock may be redeemed by the Company at par on or after February 15, 2012. Prior to this date, the Series A Preferred Stock may not be redeemed unless the Company has received aggregate gross proceeds from one or more qualified equity offerings of any Tier 1 perpetual preferred or common stock of the Company (a “Qualified Equity Offering”) of not less than $8.75 million. Subject to certain limited exceptions, until November 21, 2011, or such earlier time as all Series A Preferred Stock has been redeemed or transferred by U.S. Treasury, the Company will not, without U.S. Treasury’s consent, be able to increase its dividend rate per share of common stock or repurchase its common stock.
The Warrant is immediately exercisable and has a 10-year term. The U.S. Treasury may not exercise voting power with respect to any shares of Warrant Common Stock until the Warrant has been exercised.
Upon receipt of the aggregate consideration from the U.S. Treasury on November 21, 2008, the Company allocated the $35.0 million proceeds on a pro rata basis to the Series A Preferred Stock and the Warrant based on relative fair values. In estimating the fair value of the Warrant, the Company utilized the Black-Scholes model which includes assumptions regarding the Company’s common stock prices, stock price volatility, dividend yield, the risk free interest rate and the estimated life of the Warrant. The fair value of the Series A Preferred Stock was determined using a discounted cash flow methodology and a discount rate of 13%. As a result, the Company assigned $889,000 of the aggregate proceeds to the Warrant and $34.1 million to the Series A Preferred Stock. The value assigned to the Series A Preferred Stock will be
68
Table of Contents
amortized up to the $35.0 million liquidation value of such preferred stock, with the cost of such amortization being reported as additional preferred stock dividends. This results in a total dividend with a consistent effective yield of 5.40% over a five-year period, which is the expected life of the Series A Preferred Stock.
In addition, the Purchase Agreement (i) grants the holders of the Series A Preferred Stock, the Warrant and the Warrant Common Stock certain registration rights, (ii) subjects the Company to certain of the executive compensation limitations included in the EESA (which are discussed below) and (iii) allows the Treasury to unilaterally amend any of the terms of the Purchase Agreement to the extent required to comply with any changes after November 21, 2008 in applicable federal statutes.
On December 18, 2008 the Company filed a “shelf” registration statement with the Securities and Exchange Commission (the “Commission”) for the purpose of registering the Series A Preferred Stock, the Warrant and the Warrant Common Stock in order to permit the sale of such securities by the U.S. Treasury at any time after effectiveness of the registration statement. On January 5, 2009, the Company was notified by the Commission that the “shelf” registration statement was deemed effective.
Immediately prior to the execution of the Purchase Agreement, the Company amended its compensation, bonus, incentive and other benefit plans, arrangements and agreements to the extent necessary to comply with the executive compensation and corporate governance requirements of Section 111(b) of the EESA. The applicable executive compensation requirements apply to the compensation of the Company’s most senior executive officers (collectively, the “senior executive officers”). In addition, in connection with the closing of the U.S. Treasury’s purchase of the Series A Preferred Stock each of the senior executive officers was required to execute a waiver of any claim against the United States or the Company for any changes to his compensation or benefits that are required in order to comply with the regulation issued by the U.S. Treasury as published in the Federal Register on October 20, 2008.
On February 17, 2009, the America Reinvestment and Recovery Act of 2009 (“ARRA”) required the U.S. Treasury to enact additional compensation standards. Under the ARRA, the compensation standards now include (i) a prohibition on severance payments to our five most highly-compensated employees, other than payments for services performed or benefits accrued; (ii) a prohibition on paying any bonuses, retention awards and other incentive compensation to our five most highly-compensated employees, except in the form of long-term restricted stock that has a value not exceeding one-third of the employee’s total annual compensation and (iii) a prohibition on companies implementing any compensation plan that would encourage manipulation of the reported earnings of the Company in order to enhance the compensation of any of its employees. The executive compensation restrictions under the ARRA are more stringent than those currently in effect under the CPP, but it is yet unclear how these executive compensation standards will relate to the existing standards, or whether the standards will be considered effective immediately or only after implementing regulations are issued by the U.S. Treasury. The ARRA further provides that CPP recipients are permitted (subject to the U.S. Treasury’s consultation with the appropriate Federal banking agency, if any) to repay any assistance previously received without regard to any waiting periods and without regard to whether the financial institution has replaced the funds with funds from any other source. Upon repayment of assistance, the U.S. Treasury is to liquidate warrants associated with the assistance at the current market price and the financial institution will no longer be subject to any of the CPP compensation restrictions.
69
Table of Contents
NOTE 16 – CAPITAL REQUIREMENTS AND RESTRICTIONS ON RETAINED EARNINGS
Banks and bank holding companies are subject to regulatory capital requirements administered by federal banking agencies. Capital adequacy guidelines and, additionally for banks, prompt corrective action regulations involve quantitative measures of assets, liabilities, and certain off-balance-sheet items calculated under regulatory accounting practices. Capital amounts and classifications are also subject to qualitative judgments by regulators. Failure to meet capital requirements can initiate regulatory action.
Prompt corrective action regulations provide five classifications: well capitalized, adequately capitalized, undercapitalized, significantly undercapitalized, and critically undercapitalized, although these terms are not used to represent overall financial condition. If adequately capitalized, regulatory approval is required to accept brokered deposits. If undercapitalized, capital distributions are limited, as is asset growth and expansion, and capital restoration plans are required. At year-end 2009 and 2008, the most recent regulatory notifications categorized the Bank as well capitalized under the regulatory framework for prompt corrective action. There are no conditions or events since that notification that management believes have changed the Bank’s category.
Actual and required capital amounts (in millions) and ratios are presented below at year-end:
| Actual | Minimum Required For Capital Adequacy Purposes |
To be Categorized As Well Capitalized Under Prompt Corrective Action Provisions |
||||||||||||||||
| Amount | Ratio | Amount | Ratio | Amount | Ratio | |||||||||||||
| 2009 |
||||||||||||||||||
| Total Capital to risk-weighted assets |
||||||||||||||||||
| Consolidated |
$ | 191.8 | 13.8 | % | $ | 110.9 | 8.0 | % | N/A | N/A | ||||||||
| PBI Bank |
173.1 | 12.6 | 110.2 | 8.0 | $ | 137.8 | 10.0 | % | ||||||||||
| Tier 1 (Core) Capital to risk-weighted assets |
||||||||||||||||||
| Consolidated |
$ | 165.3 | 11.9 | % | $ | 55.5 | 4.0 | % | N/A | N/A | ||||||||
| PBI Bank |
146.8 | 10.7 | 55.1 | 4.0 | $ | 82.7 | 6.0 | % | ||||||||||
| Tier 1 Leverage Ratio |
||||||||||||||||||
| Consolidated |
$ | 165.3 | 9.6 | % | $ | 68.9 | 4.0 | % | N/A | N/A | ||||||||
| PBI Bank |
146.8 | 8.6 | 68.5 | 4.0 | $ | 85.6 | 5.0 | % | ||||||||||
| 2008 |
||||||||||||||||||
| Total Capital to risk-weighted assets |
||||||||||||||||||
| Consolidated |
$ | 187.6 | 14.1 | % | $ | 106.8 | 8.0 | % | N/A | N/A | ||||||||
| PBI Bank |
159.7 | 12.0 | 106.5 | 8.0 | $ | 133.2 | 10.0 | % | ||||||||||
| Tier 1 (Core) Capital to risk-weighted assets |
||||||||||||||||||
| Consolidated |
$ | 161.9 | 12.1 | % | $ | 53.4 | 4.0 | % | N/A | N/A | ||||||||
| PBI Bank |
134.0 | 10.1 | 53.3 | 4.0 | $ | 79.9 | 6.0 | % | ||||||||||
| Tier 1 Leverage Ratio |
||||||||||||||||||
| Consolidated |
$ | 161.9 | 10.1 | % | $ | 64.1 | 4.0 | % | N/A | N/A | ||||||||
| PBI Bank |
134.0 | 8.4 | 64.0 | 4.0 | $ | 80.0 | 5.0 | % | ||||||||||
The Company’s primary source of funds to pay dividends to stockholders is the dividends it receives from the Bank. The Bank is subject to certain regulations on the amount of dividends it may declare without prior regulatory approval. Under these regulations, the amount of dividends that may be paid in any year is limited to that year’s net profits, as defined, combined with the retained net profits of the preceding two years, less dividends declared during those periods. At year-end 2009, $37,575,000 of retained earnings was available to the Bank to pay dividends.
NOTE 17 – LOAN COMMITMENTS AND OTHER RELATED ACTIVITIES
Some financial instruments, such as loan commitments, lines of credit and letters of credit are issued to meet customer-financing needs. These are agreements to provide credit or to support the credit of others, as long as conditions established in the contract are met, and usually have expiration dates. Commitments may expire without being used. Off-balance-sheet risk to credit loss exists up to the face amount of these instruments, although material losses are not anticipated. The same credit policies are used to make such commitments as are used for loans, including obtaining collateral at exercise of the commitment.
70
Table of Contents
The Company holds instruments, in the normal course of business, with clients that are considered financial guarantees. Standby letters of credit guarantees are issued in connection with agreements made by clients to counterparties. Standby letters of credit are contingent upon failure of the client to perform the terms of the underlying contract. The Company evaluates each credit request of its customers in accordance with established lending policies. Based on these evaluations and the underlying policies, the amount of required collateral (if any) is established. Collateral held varies but may include negotiable instruments, accounts receivable, inventory, property, plant and equipment, income producing properties, residential real estate, and vehicles. The Company’s access to these collateral items is generally established through the maintenance of recorded liens or, in the case of negotiable instruments, possession. No liability is currently established for the standby letters of credit.
The contractual amounts of financial instruments with off-balance-sheet risk at year end were as follows:
| 2009 | 2008 | |||||||||||
| Fixed Rate |
Variable Rate |
Fixed Rate |
Variable Rate | |||||||||
| (in thousands) | ||||||||||||
| Commitments to make loans |
$ | 17,690 | $ | 35,501 | $ | 14,274 | $ | 47,763 | ||||
| Unused lines of credit |
16,267 | 67,999 | 15,401 | 72,197 | ||||||||
| Standby letters of credit |
563 | 4,238 | 2,654 | 7,182 | ||||||||
Commitments to make loans are generally made for periods of one year or less.
NOTE 18 – FAIR VALUES
In September 2006, the FASB issued guidance that defines fair value, establishes a framework for measuring fair value and expands disclosures about fair value measurements. This guidance also establishes a fair value hierarchy about the assumptions used to measure fair value and clarifies assumptions about risk and the effect of a restriction on the sale or use of an asset. The guidance was effective for fiscal years beginning after November 15, 2007. In February 2008, the FASB issued guidance that delayed the effective date of this fair value guidance for all nonfinancial assets and nonfinancial liabilities, except those that are recognized or disclosed at fair value on a recurring basis (at least annually) to fiscal years beginning after November 15, 2008, and interim periods within those fiscal years.
Fair value is the exchange price that would be received for an asset or paid to transfer a liability (exit price) in the principal or most advantageous market for the asset or liability in an orderly transaction between market participants on the measurement date. We use various valuation techniques to determine fair value, including market, income and cost approaches. There are three levels of inputs that may be used to measure fair values:
Level 1: Quoted prices (unadjusted) for identical assets or liabilities in active markets that an entity has the ability to access as of the measurement date, or observable inputs.
Level 2: Significant other observable inputs other than Level 1 prices, such as quoted prices for similar assets or liabilities, quoted prices in markets that are not active, and other inputs that are observable or can be corroborated by observable market data.
Level 3: Significant unobservable inputs that reflect an entity’s own assumptions about the assumptions that market participants would use in pricing an asset or liability.
In certain cases, the inputs used to measure fair value may fall into different levels of the fair value hierarchy. When that occurs, we classify the fair value hierarchy on the lowest level of input that is significant to the fair value measurement. We used the following methods and significant assumptions to estimate fair value.
Securities: The fair values of securities available for sale are determined by obtaining quoted prices on nationally recognized securities exchanges, if available. This valuation method is classified as Level 1 in the fair value hierarchy. For securities where quoted prices are not available, fair values are calculated on market prices of similar securities, or matrix pricing, which is a mathematical technique used widely in the industry to value debt securities without relying exclusively on quoted prices for the specific securities but rather by relying on the securities’ relationship to other benchmark quoted securities. Matrix pricing relies on the securities’ relationship to similarly traded securities, benchmark curves, and the benchmarking of like securities. Matrix pricing utilizes observable market inputs such as benchmark yields, reported trades, broker/dealer quotes, issuer spreads, two-sided markets, benchmark securities, bids, offers, reference data, and industry and economic events. In instances where broker
71
Table of Contents
quotes are used, these quotes are obtained from market makers or broker-dealers recognized to be market participants. This valuation method is classified as Level 2 in the fair value hierarchy. For securities where quoted prices or market prices of similar securities are not available, fair values are calculated using discounted cash flows or other market indicators. This valuation method is classified as Level 3 in the fair value hierarchy.
Impaired Loans: Impaired loans are evaluated at the time the loan is identified as impaired and are recorded at the lower of cost or market value. Fair value is measured based on the value of the collateral securing these loans and is classified as Level 3 in the fair value hierarchy. Fair value is determined using several methods. Generally the fair value of real estate is determined based on appraisals by qualified licensed appraisers. These appraisals may utilize a single valuation approach or a combination of approaches including comparable sales and the income approach. Adjustments are routinely made in the appraisal process by the appraisers to adjust for differences between the comparable sales and income data available. Such adjustments are typically significant and result in a Level 3 classification of the inputs for determining fair value. Impaired loans are evaluated quarterly for additional impairment.
Other Real Estate Owned (OREO): OREO is evaluated at the time of acquisition and recorded at fair value as determined by independent appraisal or internal market evaluation less cost to sell. OREO is further evaluated quarterly for impairment. The aggregate fair value of OREO acquired and/or written down to fair value during the period is disclosed below.
Financial assets measured at fair value on a recurring basis are summarized below:
| Fair Value Measurements at December 31, 2009 Using | ||||||||||||
| (in thousands) | ||||||||||||
| Description |
Carrying Value |
Quoted Prices In Active Markets for Identical Assets (Level 1) |
Significant Other Observable Inputs (Level 2) |
Significant Unobservable Inputs (Level 3) | ||||||||
| Available-for-sale securities |
||||||||||||
| U.S. Government and federal agency |
$ | 619 | $ | — | $ | 619 | $ | — | ||||
| State and municipal |
25,455 | — | 25,455 | — | ||||||||
| Agency mortgage-backed |
95,155 | — | 95,155 | — | ||||||||
| Private label mortgage-backed |
31,639 | — | — | 31,639 | ||||||||
| Corporate bonds |
13,765 | — | 13,765 | — | ||||||||
| Other debt securities |
529 | — | — | 529 | ||||||||
| Equity securities |
1,559 | 1,559 | — | — | ||||||||
| Total |
$ | 168,721 | $ | 1,559 | $ | 134,994 | $ | 32,168 | ||||
| Fair Value Measurements at December 31, 2008 Using | ||||||||||||
| (in thousands) | ||||||||||||
| Description |
Carrying Value |
Quoted Prices In Active Markets for Identical Assets (Level 1) |
Significant Other Observable Inputs (Level 2) |
Significant Unobservable Inputs (Level 3) | ||||||||
| Available-for-sale securities |
||||||||||||
| U.S. Government and federal agency |
$ | 2,960 | $ | — | $ | 2,960 | $ | — | ||||
| State and municipal |
24,408 | — | 24,408 | — | ||||||||
| Agency mortgage-backed |
120,982 | — | 120,982 | — | ||||||||
| Private label mortgage-backed |
16,645 | — | 16,645 | — | ||||||||
| Corporate bonds |
6,077 | — | 6,077 | — | ||||||||
| Other debt securities |
704 | — | 704 | — | ||||||||
| Equity |
1,301 | 1,301 | — | — | ||||||||
| Total |
$ | 173,077 | $ | 1,301 | $ | 171,776 | $ | — | ||||
72
Table of Contents
The table below presents a reconciliation of all assets measured at fair value on a recurring basis using significant unobservable inputs (Level 3) for the periods ended December 31, 2009:
| Investment Securities Available-for-sale |
||||
| Balance of recurring Level 3 assets at January 1, 2009 |
$ | 0 | ||
| Purchases |
23,168 | |||
| Transfers from Level 2 |
17,349 | |||
| Net accretion (amortization) |
1,084 | |||
| Principal paydowns |
(8,110 | ) | ||
| Net change in unrealized gain (loss) |
(1,323 | ) | ||
| Balance of recurring Level 3 assets at December 31, |
$ | 32,168 | ||
Financial assets measured at fair value on a non-recurring basis are summarized below:
| Fair Value Measurements at December 31, 2009 Using | ||||||||||||
| (in thousands) | ||||||||||||
| Description |
Carrying Value |
Quoted Prices In Active Markets for Identical Assets (Level 1) |
Significant Other Observable Inputs (Level 2) |
Significant Unobservable Inputs (Level 3) | ||||||||
| Impaired loans |
$ | 79,313 | $ | — | $ | — | $ | 79,313 | ||||
| Other real estate owned, net |
14,548 | — | — | 14,548 | ||||||||
| Fair Value Measurements at December 31, 2008 Using | ||||||||||||
| (in thousands) | ||||||||||||
| Description |
Carrying Value |
Quoted Prices In Active Markets for Identical Assets (Level 1) |
Significant Other Observable Inputs (Level 2) |
Significant Unobservable Inputs (Level 3) | ||||||||
| Impaired loans |
$ | 15,374 | $ | — | $ | — | $ | 15,374 | ||||
Impaired loans, which are measured for impairment using the fair value of the collateral for collateral dependent loans, had a carrying amount of $84.8 million, with a valuation allowance of $5.5 million, at December 31, 2009, resulting in an additional provision for loan losses of $4.0 million for the year ended December 31, 2009. At December 31, 2008, impaired loans had a carrying amount of $15.4 million, with a valuation allowance of $875,000, resulting in an additional provision for loan losses of $681,000 for the year ended December 31, 2008.
Other real estate owned which is measured at the lower of carrying or fair value less costs to sell, had a net had a carrying amount of $14.5 million. Write-downs of $807,000 were taken on other real estate owned for the year ended December 31, 2009.
73
Table of Contents
Carrying amount and estimated fair values of financial instruments were as follows at year-end:
| 2009 | 2008 | |||||||||||
| Carrying Amount |
Fair Value |
Carrying Amount |
Fair Value | |||||||||
| (in thousands) | ||||||||||||
| Financial assets |
||||||||||||
| Cash and cash equivalents |
$ | 172,173 | $ | 172,173 | $ | 52,546 | $ | 52,546 | ||||
| Interest-bearing deposits with banks |
— | — | 600 | 600 | ||||||||
| Securities available-for-sale |
168,721 | 168,721 | 173,077 | 173,077 | ||||||||
| Federal Home Loan Bank stock |
10,072 | N/A | 10,072 | N/A | ||||||||
| Loans, net |
1,386,526 | 1,396,465 | 1,330,454 | 1,342,446 | ||||||||
| Accrued interest receivable |
9,329 | 9,329 | 10,228 | 10,228 | ||||||||
| Financial liabilities |
||||||||||||
| Deposits |
$ | 1,530,096 | $ | 1,526,508 | $ | 1,288,549 | $ | 1,285,772 | ||||
| Federal funds purchased and securities sold under agreements to repurchase |
11,517 | 11,517 | 10,084 | 10,084 | ||||||||
| Federal Home Loan Bank advances |
82,980 | 83,217 | 142,776 | 144,030 | ||||||||
| Subordinated capital notes |
9,000 | 7,323 | 9,000 | 8,216 | ||||||||
| Junior subordinated debentures |
25,000 | 18,250 | 25,000 | 21,326 | ||||||||
| Accrued interest payable |
2,705 | 2,705 | 3,722 | 3,722 | ||||||||
The methods and assumptions used to estimate fair value are described as follows:
Carrying amount is the estimated fair value for cash and cash equivalents, interest-bearing deposits with banks, repurchase agreements, accrued interest receivable and payable, demand deposits, short-term borrowings, and variable rate loans or deposits that reprice frequently and fully. For fixed rate loans or deposits and for variable rate loans or deposits with infrequent repricing or repricing limits, fair value is based on discounted cash flows using current market rates applied to the estimated life and credit risk. . It was not practicable to determine the fair value of FHLB stock due to restrictions placed on its transferability. The fair value of debt is based on current rates for similar financing. The fair value of off-balance-sheet items is based on the current fees or cost that would be charged to enter into or terminate such arrangements, which is not material.
NOTE 19 – BUSINESS COMBINATIONS AND BRANCH DISPOSAL
Burkesville Branch
On November 14, 2008, our subsidiary bank, PBI Bank, sold its branch located in Burkesville, Kentucky to First & Farmers National Bank of Somerset, Kentucky. The sales price was $800,000 and was paid in cash. The branch had approximately $13.1 million in deposits and $3.4 million in loans at the time of sale.
Paramount Bank
On February 1, 2008, the Company completed the acquisition of Paramount Bank in Lexington, Kentucky in a $5 million all-cash transaction. Operating results of Paramount Bank are included in the consolidated financial statements since the date of the acquisition. As a result of this acquisition, we expect to further solidify our market share in the Lexington market, expand our customer base to enhance deposit fee income, provide an opportunity to market additional products and services to new customers and reduce operating costs through economies of scale.
The acquisition added approximately $73 million in loans and $76 million in deposits. The purchase price resulted in approximately $6 million in goodwill, and $631,000 in core deposit intangibles. The intangible assets will be amortized over 5-10 years, using an accelerated method. Goodwill will not be amortized but instead evaluated periodically for impairment. Goodwill and intangible assets will be deducted for tax purposes over 15 years using the straight-line method.
74
Table of Contents
The following table summarizes the estimated fair value of assets acquired and liabilities assumed at the date of acquisition.
| (in thousands) | ||||
| Loans, net |
$ | 73,420 | ||
| Goodwill |
5,986 | |||
| Core deposit intangibles |
631 | |||
| Other assets |
1,033 | |||
| Total assets acquired |
81,070 | |||
| Deposits |
(75,657 | ) | ||
| Other liabilities |
(198 | ) | ||
| Total liabilities assumed |
(75,855 | ) | ||
| Net assets acquired |
$ | 5,215 | ||
NOTE 20 – EARNINGS PER SHARE
The factors used in the earnings per share computation follow:
| 2009 | 2008 | 2007 | |||||||||
| (in thousands, except share and per share data) | |||||||||||
| Basic and diluted |
|||||||||||
| Net income |
$ | 11,068 | $ | 14,010 | $ | 14,229 | |||||
| Less: |
|||||||||||
| Preferred stock dividends |
(1,750 | ) | (194 | ) | — | ||||||
| Accretion of preferred stock discount |
(176 | ) | (20 | ) | — | ||||||
| Net income available to common shareholders |
$ | 9,142 | $ | 13,796 | $ | 14,229 | |||||
| Weighted average voting and convertible non-voting common shares outstanding |
8,745,226 | 8,697,792 | 8,481,337 | ||||||||
| Basic and diluted earnings per common share |
$ | 1.05 | $ | 1.59 | $ | 1.68 | |||||
All historical data has been adjusted to reflect the 5% stock dividends.
Stock options for 297,258 shares of common stock for 2009, 297,810 shares of common stock for 2008, and 313,723 shares of common stock for 2007, were not considered in computing diluted earnings per common share because they were anti-dilutive. Additionally, a warrant for the purchase of 314,821 shares of the Company’s common stock at an exercise price of $16.68 was outstanding at December 31, 2009 and 2008 (none at December 31, 2007) but was not included in the diluted EPS computation as inclusion would have been anti-dilutive.
NOTE 21 – OTHER COMPREHENSIVE INCOME (LOSS)
Other comprehensive income (loss) components and related tax effects were as follows:
| 2009 | 2008 | 2007 | ||||||||||
| (in thousands) | ||||||||||||
| Unrealized holding gains (losses) on available-for-sale securities |
$ | 4,020 | $ | (878 | ) | $ | (219 | ) | ||||
| Less: Reclassification adjustment for gains (losses) realized in income |
315 | (607 | ) | 107 | ||||||||
| Net unrealized gains (losses) |
3,705 | (271 | ) | (326 | ) | |||||||
| Tax effect |
(1,297 | ) | 95 | 112 | ||||||||
| Net-of-tax amount |
$ | 2,408 | $ | (176 | ) | $ | (214 | ) | ||||
75
Table of Contents
NOTE 22 – PARENT COMPANY ONLY CONDENSED FINANCIAL INFORMATION
Condensed financial information of Porter Bancorp Inc. is presented as follows:
CONDENSED BALANCE SHEETS
December 31,
| 2009 | 2008 | |||||
| (in thousands) | ||||||
| ASSETS |
||||||
| Cash and cash equivalents |
$ | 10,010 | $ | 24,148 | ||
| Securities available-for-sale |
7,554 | 2,005 | ||||
| Investment in banking subsidiaries |
174,647 | 160,439 | ||||
| Investment in and advances to other subsidiaries |
776 | 777 | ||||
| Other assets |
2,733 | 3,277 | ||||
| Total assets |
$ | 195,720 | $ | 190,646 | ||
| LIABILITIES AND SHAREHOLDERS’ EQUITY |
||||||
| Debt |
$ | 25,775 | $ | 25,775 | ||
| Accrued expenses and other liabilities |
611 | 658 | ||||
| Shareholders’ equity |
169,334 | 164,213 | ||||
| Total liabilities and shareholders’ equity |
$ | 195,720 | $ | 190,646 | ||
CONDENSED STATEMENTS OF INCOME
Years ended December 31,
| 2009 | 2008 | 2007 | ||||||||||
| (in thousands) | ||||||||||||
| Interest income |
$ | 741 | $ | 402 | $ | 1,010 | ||||||
| Dividends from subsidiaries |
24 | 43 | 6,059 | |||||||||
| Other income |
1,422 | 1,428 | 1,481 | |||||||||
| Interest expense |
(819 | ) | (1,410 | ) | (1,984 | ) | ||||||
| Other expense |
(3,023 | ) | (3,461 | ) | (2,677 | ) | ||||||
| Income before income tax and undistributed subsidiary income |
(1,655 | ) | (2,998 | ) | 3,889 | |||||||
| Income tax expense (benefit) |
(564 | ) | (1,081 | ) | (852 | ) | ||||||
| Equity in undistributed subsidiary income |
12,159 | 15,927 | 9,488 | |||||||||
| Net income |
$ | 11,068 | $ | 14,010 | $ | 14,229 | ||||||
CONDENSED STATEMENTS OF CASH FLOWS
Years ended December 31,
| 2009 | 2008 | 2007 | ||||||||||
| (in thousands) | ||||||||||||
| Cash flows from operating activities |
||||||||||||
| Net income |
$ | 11,068 | $ | 14,010 | $ | 14,229 | ||||||
| Adjustments: |
||||||||||||
| Equity in undistributed subsidiary income |
(12,159 | ) | (15,927 | ) | (9,488 | ) | ||||||
| Loss on sale of assets |
6 | 799 | — | |||||||||
| Change in other assets |
312 | 171 | 357 | |||||||||
| Change in other liabilities |
(76 | ) | (153 | ) | (1,388 | ) | ||||||
| Other |
390 | 321 | 215 | |||||||||
| Net cash (used in) from operating activities |
(459 | ) | (779 | ) | 3,925 | |||||||
| Cash flows from investing activities |
||||||||||||
| Investments in subsidiaries |
— | (12,000 | ) | (5,881 | ) | |||||||
| Purchase of securities |
(5,075 | ) | — | (3,823 | ) | |||||||
| Sales of securities |
110 | 3,760 | 150 | |||||||||
| Net cash (used in) from investing activities |
(4,965 | ) | (8,240 | ) | (9,554 | ) | ||||||
76
Table of Contents
| 2009 | 2008 | 2007 | ||||||||||
| (in thousands) | ||||||||||||
| Cash flows from financing activities |
||||||||||||
| Repayment of borrowings |
— | — | (2,534 | ) | ||||||||
| Proceeds from sale of preferred stock, net |
— | 35,000 | — | |||||||||
| Repurchase of common stock, net |
— | (301 | ) | (192 | ) | |||||||
| Dividends paid on preferred stock |
(1,721 | ) | (194 | ) | — | |||||||
| Dividends paid on common stock |
(6,993 | ) | (6,711 | ) | (6,233 | ) | ||||||
| Net cash from (used in) financing activities |
(8,714 | ) | 27,794 | (8,959 | ) | |||||||
| Net change in cash and cash equivalents |
(14,138 | ) | 18,775 | (14,588 | ) | |||||||
| Beginning cash and cash equivalents |
24,148 | 5,373 | 19,961 | |||||||||
| Ending cash and cash equivalents |
$ | 10,010 | $ | 24,148 | $ | 5,373 | ||||||
NOTE 23 – QUARTERLY FINANCIAL DATA (UNAUDITED)
| Interest Income |
Net Interest Income |
Net Income |
Earnings Per Share | |||||||||||||||
| Basic | Diluted | |||||||||||||||||
| (in thousands, except per share data) | ||||||||||||||||||
| 2009 |
||||||||||||||||||
| First quarter |
$ | 23,502 | $ | 11,967 | $ | 3,061 | $ | .30 | $ | .30 | ||||||||
| Second quarter |
23,645 | 12,813 | 3,245 | .31 | .31 | |||||||||||||
| Third quarter |
23,802 | 14,374 | 4,536 | .47 | .47 | |||||||||||||
| Fourth quarter |
23,517 | 14,900 | 226 | (1) | (.03 | ) | (.03 | ) | ||||||||||
| 2008 |
||||||||||||||||||
| First quarter |
$ | 25,674 | $ | 11,343 | $ | 3,597 | $ | .42 | $ | .42 | ||||||||
| Second quarter |
25,041 | 11,972 | 3,973 | .45 | .45 | |||||||||||||
| Third quarter |
25,106 | 12,433 | 4,100 | .47 | .47 | |||||||||||||
| Fourth quarter |
24,286 | 11,478 | 2,340 | .25 | .25 | |||||||||||||
| (1) | Fourth quarter net income was lower than previous quarters due to increased provision for loan losses expense during the quarter. |
All historical data has been adjusted for the 5% stock dividends.
NOTE 24 – SUBSEQUENT EVENTS
Subsequent to year end, we entered negotiations with a classified loan customer to obtain deed in lieu of foreclosure for a multi-unit residential condominium and patio home development located in our primary market area. The loans secured by this development totaled approximately $17 million at December 31, 2009 and were current at that time. The loans reached maturity in the first quarter of 2010 and during the renewal process adverse conditions affecting our customer’s global financial condition came to light that warranted our actions to seek a deed to protect our collateral from potential liens and litigation arising from projects in which we were not involved.
We received a deed to the property in March 2010 and transferred the property into Other Real Estate Owned at the carrying amount of our loans which approximated fair value less cost to sell. The transfer had no effect on our provision for loan losses and allowance for losses at December 31, 2009.
| Item 9. | Changes in and Disagreements With Accountants on Accounting and Financial Disclosure |
None
77
Table of Contents
| Item 9A. | Controls and Procedures |
Our management, under the supervision and with the participation of our Chief Executive Officer and our Chief Financial Officer, evaluated the effectiveness of the design and operation of our disclosure controls and procedures as of December 31, 2009. Based on that evaluation, our Chief Executive Officer and our Chief Financial Officer concluded that our disclosure controls and procedures were effective as of the end of the period covered by this report. Our Management’s Report on Internal Control Over Financial Reporting, set forth under Item 8 “Financial Statements and Supplementary Data,” identifies the framework used by management to evaluate the effectiveness of our internal control. This annual report does not include an attestation report of the company’s registered public accounting firm regarding internal control over financial reporting. Management’s report was not subject to attestation by the Company’s registered public accounting firm pursuant to temporary rules of the Securities and Exchange Commission that permit the Company to provide only management’s report in this annual report.
There was no change in our internal control over financial reporting during the fourth quarter of 2009 that has materially affected, or is reasonably likely to materially affect, the internal control over financial reporting.
| Item 9B. | Other Information |
None
| Item 10. | Directors and Executive Officers of the Registrant. |
We have adopted a code of ethics applicable to our Chief Executive Officer and our senior financial officers, which is posted on our website at http://www.pbibank.com. If we amend or waive any of the provisions of the Code of Ethics applicable to our Chief Executive Officer or senior financial officers, we intend to disclose the amendment or waiver on our website. We will provide to any person without charge, upon request, a copy of this Code of Ethics. You can request a copy by contacting Porter Bancorp, Inc., Corporate General Counsel, 2500 Eastpoint Parkway, Louisville, Kentucky, 40223, (telephone) 502-499-4800.
Additional information required by this Item 10 is omitted because we are filing a definitive proxy statement pursuant to Regulation 14A on or before April 30, 2010, which includes the required information. The required information contained in our proxy statement is incorporated herein by reference.
| Item 11. | Executive Compensation. |
The information required by this Item 11 is omitted because we are filing a definitive proxy statement pursuant to Regulation 14A on or before April 30, 2010, which includes the required information. The required information contained in our proxy statement is incorporated herein by reference.
| Item 12. | Security Ownership of Certain Beneficial Owners and Management and Related Stockholder Matters |
The information required by this Item 12 is omitted because we are filing a definitive proxy statement pursuant to Regulation 14A on or before April 30, 2010, which includes the required information. The required information contained in our proxy statement is incorporated herein by reference.
| Item 13. | Certain Relationships and Related Transactions. |
The information required by this Item 13 is omitted because we are filing a definitive proxy statement pursuant to Regulation 14A on or before April 30, 2010, which includes the required information. The required information contained in our proxy statement is incorporated herein by reference.
| Item 14. | Principal Accountant Fees and Services. |
The information required by this Item 14 is omitted because we are filing a definitive proxy statement pursuant to Regulation 14A on or before April 30, 2010, which includes the required information. The required information contained in our proxy statement is incorporated herein by reference.
78
Table of Contents
| Item 15. | Exhibits and Financial Statement Schedules |
| (a) 1. | The following financial statements are included in this Form 10-K: |
Consolidated Balance Sheets as of December 31, 2009 and 2008
Consolidated Statements of Income for the Years Ended December 31, 2009, 2008, and 2007
Consolidated Statements of Change in Stockholders’ Equity and Comprehensive Income for the Years Ended December 31, 2009, 2008, and 2007
Consolidated Statements of Cash Flows for the Years Ended December 31, 2009, 2008, and 2007
Notes to Consolidated Financial Statements
Report of Independent Registered Public Accounting Firm
| (a) 2. | List of Financial Statement Schedules |
Financial statement schedules are omitted because the information is not applicable.
| (a) 3. | List of Exhibits |
The Exhibit Index of this report is incorporated by reference. The compensatory plans or arrangement required to be filed as exhibits to this Form 10-K pursuant to Item 14(c) are noted with an asterisk in the Exhibit Index.
Pursuant to the requirements of Section 13 or 15(d) of the Securities Exchange Act of 1934, the Company has duly caused this report to be signed on its behalf by the undersigned, thereunto duly authorized.
| PORTER BANCORP, INC. | ||||
| March 15, 2010 |
By: | /s/ Maria L. Bouvette | ||
| Maria L. Bouvette | ||||
| President & Chief Executive Officer | ||||
Pursuant to the requirements of the Securities Exchange Act of 1934, this report has been signed below by the following persons on behalf of the registrant and in the capacities indicated.
| /s/ J. Chester Porter |
Chairman of the Board of Directors | March 15, 2010 | ||
| J. Chester Porter | ||||
| /s/ Maria L. Bouvette |
President and Chief Executive Officer | March 15, 2010 | ||
| Maria L. Bouvette | ||||
| /s/ David B. Pierce |
Chief Financial Officer | March 15, 2010 | ||
| David B. Pierce | ||||
| /s/ David L. Hawkins |
Director | March 15, 2010 | ||
| David L. Hawkins | ||||
| /s/ W. Glenn Hogan |
Director | March 15, 2010 | ||
| W. Glenn Hogan | ||||
| /s/ Sidney L. Monroe |
Director | March 15, 2010 | ||
| Sidney L. Monroe | ||||
| /s/ Stephen A. Williams |
Director | March 15, 2010 | ||
| Stephen A. Williams | ||||
79
Table of Contents
| Exhibit No. (1) |
Description | |
| 3.1 | Amended and Restated Articles of Incorporation of Registrant. Exhibit 3.1 to Form S-1 Registration Statement (Reg. No. 333-133198) filed April 11, 2006 is hereby incorporated by reference. | |
| 3.2 | Articles of Amendment to the Amended and Restated Articles of Incorporation. Exhibit 3.1 to Form 8-K filed November 24, 2008 is hereby incorporated by reference. | |
| 3.3 | Bylaws of the Registrant. Exhibit 3.2 to Form S-1 Registration Statement (Reg. No. 333-133198) filed April 11, 2006 is hereby incorporated by reference. | |
| 4.1 | Warrant to purchase up to 299,829 shares. Exhibit 4.1 to Form 8-K filed November 24, 2008 is hereby incorporated by reference. | |
| 10.1+ | USAccess Bank, Inc. (now known as PBI Bank) 2000 Stock Option Plan. Exhibit 10.1 to Form S-1 Registration Statement (Reg. No. 333-133198) filed April 11, 2006 is hereby incorporated by reference. | |
| 10.2+ | Amendment to PBI Bank 2000 Stock Option Plan. Exhibit 10.2 to Form 10-K filed March 26, 2009 is hereby incorporated by reference. | |
| 10.3+ | Porter Bancorp, Inc. Amended and Restated 2006 Stock Incentive Plan. Exhibit 10.2 to Form S-1 Registration Statement (Reg. No. 333-133198) filed April 11, 2006 is hereby incorporated by reference. | |
| 10.4+ | Form of Porter Bancorp, Inc. Stock Option Award Agreement. Exhibit 10.3 to Form S-1 Registration Statement (Reg. No. 333-133198) filed April 11, 2006 is hereby incorporated by reference. | |
| 10.5+ | Form of Porter Bancorp, Inc. Restricted Stock Award Agreement. Exhibit 10.4 to Form S-1 Registration Statement (Reg. No. 333-133198) filed April 11, 2006 is hereby incorporated by reference. | |
| 10.6+ | Form of Ascencia Bank (now known as PBI Bank) Supplemental Executive Retirement Plan. Exhibit 10.5 to Form S-1 Registration Statement (Reg. No. 333-133198) filed April 11, 2006 is hereby incorporated by reference. | |
| 10.7+ | Form of Amendment to PBI Bank Supplemental Executive Retirement Plan. Exhibit 10.7 to Form 10-K filed March 26, 2009 is hereby incorporated by reference. | |
| 10.8+ | Porter Bancorp, Inc. 2006 Non-Employee Directors Stock Ownership Incentive Plan, as amended May 22, 2008. Annex A Definitive Proxy Statement filed April 17, 2008 is hereby incorporated by reference. | |
| 10.9+ | Amendment to Porter Bancorp, Inc. 2006 Non-Employee Directors Stock Ownership Incentive Plan, as amended May 22, 2008. Exhibit 10.9 to Form 10-K filed March 26, 2009 is hereby incorporated by reference. | |
| 10.10 | Promissory Installment Note of Maria L. Bouvette and J. Chester Porter, as borrowers, to David L. Hawkins, as lender. Exhibit 10.7 to Form S-1/A Registration Statement (Reg. No. 333-133198) filed May 24, 2006 is hereby incorporated by reference. | |
| 10.11 | Letter Agreement, dated November 21, 2008 including the Securities Purchase Agreement – Standard Terms incorporated by reference therein, between the Company and the U.S. Treasury. Exhibit 10.1 to Form 8-K filed November 24, 2008 is hereby incorporated by reference. | |
| 10.12 | Form of Waiver of Senior Executive Officers. Exhibit 10.2 to Form 8-K filed November 24, 2008 is hereby incorporated by reference. | |
| 10.13+ | Porter Bancorp, Inc. 2008 Incentive Compensation Bonus Plan. Exhibit 10.13 to Form 10-K/A filed December 17, 2009 is hereby incorporated by reference. | |
| 21.1 | List of Subsidiaries of Porter Bancorp, Inc. | |
| 23.1 | Consent of Crowe Horwath LLP, Independent Registered Public Accounting Firm. | |
| 31.1 | Certification of Chief Executive Officer pursuant to Exchange Act Rules 13a-14 or 15d-14. | |
| 31.2 | Certification of Chief Financial Officer pursuant to Exchange Act Rules 13a-14 or 15d-14. | |
| 32.1 | Certification of Chief Executive Officer pursuant to Exchange Act Rules 13a-14(b) or 15d-14(b) and 18 U.S.C. Section 1350. | |
| 32.2 | Certification of Chief Financial Officer pursuant to Exchange Act Rules 13a-14(b) or 15d-14(b) and U.S.C. Section 1350. | |
| 99.1 | Certification of Principal Executive Officer pursuant to Section 30.15 of the U.S. Treasury’s Interim Final Rule on TARP Standards for Compensation and Corporate Governance. | |
| 99.2 | Certification of Principal Executive Officer pursuant to Section 30.15 of the U.S. Treasury’s Interim Final Rule on TARP Standards for Compensation and Corporate Governance. | |
| + | Management contract or compensatory plan or arrangement. |
| (1) | The Company has other long-term debt agreements that meet the exclusion set forth in Section 601(b)(4)(iii)(A) of Regulation S-K. The Company hereby agrees to furnish a copy of such agreements to the Securities and Exchange Commission upon request. |
80