Attached files
| file | filename |
|---|---|
| EX-32.2 - EXHIBIT 32.2 - LIMESTONE BANCORP, INC. | ex_105460.htm |
| EX-32.1 - EXHIBIT 32.1 - LIMESTONE BANCORP, INC. | ex_105459.htm |
| EX-31.2 - EXHIBIT 31.2 - LIMESTONE BANCORP, INC. | ex_105458.htm |
| EX-31.1 - EXHIBIT 31.1 - LIMESTONE BANCORP, INC. | ex_105457.htm |
| EX-23.1 - EXHIBIT 23.1 - LIMESTONE BANCORP, INC. | ex_105456.htm |
| EX-21.1 - EXHIBIT 21.1 - LIMESTONE BANCORP, INC. | ex_105455.htm |
UNITED STATES
SECURITIES AND EXCHANGE COMMISSION
WASHINGTON, D.C. 20549
FORM 10-K
(Mark One)
|
☒ |
ANNUAL REPORT PURSUANT TO SECTION 13 OR 15(d) OF THE SECURITIES EXCHANGE ACT OF 1934 |
For the Fiscal Year Ended December 31, 2017
OR
|
☐ |
TRANSITION REPORT PURSUANT TO SECTION 13 OR 15(d) OF THE SECURITIES EXCHANGE ACT OF 1934 |
| For the transition period from to |
Commission file number: 001-33033
PORTER BANCORP, INC.
(Exact name of registrant as specified in its charter)
|
Kentucky |
61-1142247 |
|
(State or other jurisdiction of incorporation or organization) |
(I.R.S. Employer Identification No.) |
|
2500 Eastpoint Parkway, Louisville, Kentucky |
40223 |
|
(Address of principal executive offices) |
(Zip Code) |
Registrant’s telephone number, including area code: (502) 499-4800
Securities registered pursuant to Section 12(b) of the Act:
|
Title of each class |
Name of each exchange on which registered |
|
Common Stock, no par value |
Nasdaq Capital Market |
Securities registered pursuant to Section 12(g) of the Act:
None
Indicate by check mark if the registrant is a well-known seasoned issuer (as defined in Rule 405 of the Securities Act). Yes ☐ No ☒
Indicate by check mark if the registrant is not required to file reports pursuant to Section 13 or Section 15(d) of the Act. Yes ☐ No ☒
Indicate by check mark whether the registrant (1) has filed all reports required to be filed by Section 13 or 15(d) of the Securities Exchange Act of 1934 during the preceding 12 months (or for shorter period that the registrant was required to file such reports), and (2) has been subject to such filing requirements for the past 90 days. Yes ☒ No ☐
Indicate by check mark whether the registrant has submitted electronically and posted on its corporate Web site, if any, every Interactive Data File required to be submitted and posted pursuant to Rule 405 of Regulation S-T (§ 232.405 of this chapter) during the preceding 12 months (or for such shorter period that the registrant was required to submit and post such files). Yes ☒ No ☐
Indicate by check mark if disclosure of delinquent filers pursuant to Item 405 of Regulation S-K is not contained herein, and will not be contained, to the best of registrant’s knowledge, in definitive proxy or information statements incorporated by reference in Part III of this Form 10-K or any amendment to this Form 10-K. ☐
Indicate by check mark whether the registrant is a large accelerated filer, an accelerated filer, a non-accelerated filer, smaller reporting company, or an emerging growth company. See definition of “accelerated filer,” “large accelerated filer,” “smaller reporting company,” and “emerging growth company” in Rule 12b-2 of the Exchange Act. (Check one):
Large accelerated filer ☐ Accelerated filer ☐ Non-accelerated filer ☐ Smaller reporting company ☒ Emerging growth company ☐
If an emerging growth company, indicate by check mark if the registrant has elected not to use the extended transition period for complying with any new or revised financial accounting standards pursuant to Section 13(a) of the Exchange Act. Yes ☐ No ☐
Indicate by check mark whether the registrant is a shell company (as defined in Rule 12b-2 of the Exchange Act). Yes ☐ No ☒
The aggregate market value of the voting common equity held by non-affiliates computed by reference to the price at which the common equity was last sold as of the close of business on June 30, 2017, was $22,183,313 based upon the last sales price reported for such date on the Nasdaq Capital Market.
6,039,864 Common Shares and 220,000 Non-Voting Common Shares were outstanding as of February 28, 2018.
DOCUMENTS INCORPORATED BY REFERENCE
Portions of the registrant’s Proxy Statement for the Annual Meeting of Shareholders to be held May 23, 2018 are incorporated by reference into Part III of this Form 10-K.
|
|
|
Page No. |
|
|
1 |
|
|
1 |
||
|
9 |
||
|
18 |
||
|
18 |
||
|
18 |
||
|
18 |
||
|
|
19 |
|
|
19 |
||
|
21 |
||
|
Management’s Discussion and Analysis of Financial Condition and Results of Operation |
22 |
|
|
52 |
||
|
54 |
||
|
Changes in and Disagreements With Accountants on Accounting and Financial Disclosure |
97 |
|
|
97 |
||
|
97 |
||
|
|
98 |
|
|
98 |
||
|
98 |
||
|
Security Ownership of Certain Beneficial Owners and Management and Related Stockholder Matters |
98 |
|
|
Certain Relationships and Related Transactions, and Director Independence |
98 |
|
|
98 |
||
|
|
99 |
|
|
99 |
||
|
|
100 |
|
|
|
102 |
Preliminary Note Concerning Forward-Looking Statements
This report contains statements about the future expectations, activities and events that constitute forward-looking statements. Forward-looking statements express our beliefs, assumptions and expectations of our future financial and operating performance and growth plans, taking into account information currently available to us. These statements are not statements of historical fact. The words “believe,” “may,” “should,” “anticipate,” “estimate,” “expect,” “intend,” “objective,” “seek,” “plan,” “strive” or similar words, or the negatives of these words, identify forward-looking statements.
Forward-looking statements involve risks and uncertainties that may cause our actual results to differ materially from the expectations of future results we expressed or implied in any forward-looking statements. These risks and uncertainties can be difficult to predict and may be beyond our control. Factors that could contribute to differences in our results include, but are not limited to deterioration in the financial condition of borrowers resulting in significant increases in loan losses and provisions for those losses; changes in the interest rate environment, which may reduce our margins or impact the value of securities, loans, deposits and other financial instruments; changes in loan underwriting, credit review or loss reserve policies associated with economic conditions, examination conclusions, or regulatory developments; general economic or business conditions, either nationally, regionally or locally in the communities we serve, may be worse than expected, resulting in, among other things, a deterioration in credit quality or a reduced demand for credit; the results of regulatory examinations; any matter that would cause us to conclude that there was impairment of any asset, including intangible assets; the continued service of key management personnel; our ability to attract, motivate and retain qualified employees; factors that increase the competitive pressure among depository and other financial institutions, including product and pricing pressures; the ability of our competitors with greater financial resources to develop and introduce products and services that enable them to compete more successfully than us; inability to comply with regulatory capital requirements and to secure any required regulatory approvals for capital actions; legislative or regulatory developments, including changes in laws concerning taxes, banking, securities, insurance and other aspects of the financial services industry; and fiscal and governmental policies of the United States federal government.
Other risks are detailed in Item 1A. “Risk Factors” of this Form 10-K all of which are difficult to predict and many of which are beyond our control.
Forward-looking statements are not guarantees of performance or results. A forward-looking statement may include the assumptions or bases underlying the forward-looking statement. We have made our assumptions and bases in good faith and believe they are reasonable. We caution you however, that estimates based on such assumptions or bases frequently differ from actual results, and the differences can be material. The forward-looking statements included in this report speak only as of the date of the report. We do not intend to update these statements unless applicable laws require us to do so.
|
Item 1. |
As used in this report, references to “the Company,” “we,” “our,” “us,” and similar terms refer to the consolidated entity consisting of Porter Bancorp, Inc. and its wholly-owned subsidiary. The “Bank” refers to Porter Bancorp, Inc.’s bank subsidiary, Limestone Bank, Inc.
The Company is a bank holding company headquartered in Louisville, Kentucky. The Company’s common stock is traded on Nasdaq’s Capital Market under the symbol PBIB. We operate the Bank, our wholly owned subsidiary and the fifteenth largest bank domiciled in the Commonwealth of Kentucky based on total assets (formerly known as PBI Bank). We operate banking offices in twelve counties in Kentucky. Our markets include metropolitan Louisville in Jefferson County and the surrounding counties of Henry and Bullitt. We serve south central Kentucky and southern Kentucky from banking offices in Butler, Green, Hart, Edmonson, Barren, Warren, Ohio, and Daviess Counties. We also have an office in Lexington, the second largest city in Kentucky. The Bank is a community bank with a wide range of commercial and personal banking products. As of December 31, 2017, we had total assets of $970.8 million, total loans of $712.1 million, total deposits of $847.0 million and stockholders’ equity of $72.7 million.
Our Markets
We operate in markets that include the four largest cities in Kentucky – Louisville, Lexington, Bowling Green and Owensboro – and in other communities along the I-65, Western Kentucky Parkway, and Natcher Parkway corridors.
|
■ |
Louisville/Jefferson, Bullitt and Henry Counties: Our headquarters are in Louisville, the largest city in Kentucky. We also have banking offices in Bullitt County, south of Louisville, and Henry County, east of Louisville. Our banking offices in these counties also serve the contiguous counties of Spencer, Shelby and Oldham to the east and northeast of Louisville. The area’s major employers are diversified across many industries and include the air hub for United Parcel Service (“UPS”), two Ford assembly plants, GE Appliances and Lighting, Humana, Norton Healthcare, Brown-Forman, YUM! Brands, Papa John’s Pizza, and Texas Roadhouse. |
|
■ |
Lexington/Fayette County: Lexington, located in Fayette County, is the second largest city in Kentucky. Lexington is the financial, educational, retail, healthcare and cultural hub for Central and Eastern Kentucky. It is known worldwide for its horse farms and Keeneland Race Track, and proudly boasts of itself as “The Horse Capital of the World”. It is also the home of the University of Kentucky and Transylvania University. The area’s major employers include Toyota, Lexmark, IBM Global Services and Valvoline. |
|
■ |
Southern Kentucky: This market includes Bowling Green, the third largest city in Kentucky, located about 60 miles north of Nashville, Tennessee. Bowling Green, located in Warren County, is the home of Western Kentucky University and is the economic hub of the area. This market also includes communities in the contiguous Barren County, including the city of Glasgow. Major employers in Barren and Warren Counties include GM’s Corvette plant, automotive supply chain manufacturers, and R.R. Donnelley’s regional printing facility. |
|
■ |
Owensboro/Daviess County: Owensboro, located on the banks of the Ohio River, is Kentucky’s fourth largest city. The city is called a festival city, with over 20 annual community celebrations that attract visitors from around the world, including its world famous Bar-B-Q Festival which attracts over 80,000 visitors. It is an industrial, medical, retail and cultural hub for Western Kentucky and the area employers include Owensboro Medical System, US Bank Home Mortgage, Titan Contracting and Specialty Food Group. |
|
■ |
South Central Kentucky: South of the Louisville metropolitan area, we have banking offices in Butler, Edmonson, Green, Hart, and Ohio Counties. This region includes stable community markets comprised primarily of agricultural and service-based businesses. Each of our banking offices in these markets has a stable customer and core deposit base. |
Our Products and Services
We meet our customers’ banking needs with a broad range of financial products and services. Our lending services include real estate, commercial, mortgage, agriculture, and consumer loans to those in our communities and to small to medium-sized businesses, the owners and employees of those businesses, as well as other executives and professionals. We complement our lending operations with an array of retail and commercial deposit products. In addition, we offer our customers drive-through banking facilities, automatic teller machines, night depository, personalized checks, credit cards, debit cards, internet banking, mobile banking, treasury management services, remote deposit services, electronic funds transfers through ACH services, domestic and foreign wire transfers, cash management, and vault services, along with loan and deposit sweep accounts.
Employees
At December 31, 2017, the Company had 217 full-time equivalent employees. Our employees are not subject to a collective bargaining agreement, and management considers the Company’s relationship with employees to be good.
Competition
The banking business is highly competitive, and we experience competition from many other financial institutions. Competition among financial institutions is based upon interest rates offered on deposit accounts, interest rates charged on loans, other credit and service charges relating to loans, the quality and scope of the services offered, the convenience of banking facilities and, in the case of loans to commercial borrowers, relative lending limits. We compete with commercial banks, credit unions, savings and loan associations, mortgage banking firms, consumer finance companies, securities brokerage firms, insurance companies, money market funds and other mutual funds, as well as super-regional, national and international financial institutions that operate offices within our market area and beyond.
Supervision and Regulation
Written Agreement. On September 21, 2011, we entered into a written agreement (“Written Agreement”) with the Federal Reserve Bank of St. Louis. The Company made formal commitments in the Written Agreement to use its financial and management resources to serve as a source of strength for the Bank and to assist the Bank in addressing weaknesses identified by the FDIC and the KDFI, to pay no dividends without prior written approval, to pay no interest or principal on subordinated debentures or trust preferred securities without written approval, and to submit an acceptable plan to maintain sufficient capital.
Bank and Holding Company Laws, Rules and Regulations. The following is a summary description of the relevant laws, rules and regulations governing banks and bank holding companies. The descriptions of, and references to, the statutes and regulations below are brief summaries and do not purport to be complete. The descriptions are qualified in their entirety by reference to the specific statutes and regulations discussed.
The Dodd-Frank Act. On July 21, 2010, the Dodd-Frank Wall Street Reform and Consumer Protection Act of 2010 (“Dodd-Frank Act”) was signed into law. The Dodd-Frank Act imposed new restrictions and an expanded framework of regulatory oversight for financial institutions, including depository institutions.
The Dodd-Frank Act represents a comprehensive overhaul of the financial services industry within the United States. There are a number of reform provisions that significantly impact the ways in which banks and bank holding companies, including the Company and the Bank, do business. For example, regulations issued under the Dodd-Frank Act changed the assessment base for federal deposit insurance premiums by modifying the assessment base calculation to be based on a depository institution’s consolidated assets less tangible capital instead of deposits, and permanently increased the standard maximum amount of deposit insurance per customer to $250,000. The Dodd-Frank Act also imposed more stringent capital requirements on bank holding companies by, among other things, imposing leverage ratios on bank holding companies and prohibiting new trust preferred security issuances from counting as Tier I capital. The Dodd-Frank Act also repealed the federal prohibition on the payment of interest on demand deposits, thereby permitting depository institutions to pay interest on business transaction and other accounts. The Dodd-Frank Act codified and expanded the Federal Reserve’s source of strength doctrine, which requires that all bank holding companies serve as a source of financial strength for its subsidiary banks. Other provisions of the Dodd-Frank Act include, but are not limited to: (i) the creation of a financial consumer protection agency that is empowered to promulgate new consumer protection regulations and revise existing regulations in many areas of consumer protection; (ii) enhanced regulation of financial markets, including derivatives and securitization markets; (iii) reform related to the regulation of credit rating agencies; (iv) the elimination of certain trading activities by banks; and (v) new disclosure and other requirements relating to executive compensation and corporate governance.
Many provisions of the Dodd-Frank Act require interpretation and rule-making by federal agencies. The Company monitors all relevant sections of the Dodd-Frank Act to ensure continued compliance with laws and regulations, which results in greater compliance costs and higher fees paid to regulators. Future implementation of the Dodd-Frank Act may result in restrictions on the Company’s operations.
Porter Bancorp. The Company is registered as a bank holding company under the Bank Holding Company Act of 1956, as amended, and is subject to supervision and regulation by the Board of Governors of the Federal Reserve System (the “Federal Reserve Board”). As such, we must file with the Federal Reserve Board annual and quarterly reports and other information regarding our business operations and the business operations of our subsidiaries. We are also subject to examination by the Federal Reserve Board and to operational guidelines established by the Federal Reserve Board. We are subject to the Bank Holding Company Act and other federal laws on the types of activities in which we may engage, and to other supervisory requirements, including regulatory enforcement actions for violations of laws and regulations.
Acquisitions. A bank holding company must obtain Federal Reserve Board approval before acquiring, directly or indirectly, ownership or control of more than 5% of the voting stock or all or substantially all of the assets of a bank, merging or consolidating with any other bank holding company and before engaging, or acquiring a company that is not a bank and is engaged in certain non-banking activities. Federal law also prohibits a person or group of persons from acquiring “control” of a bank holding company without notifying the Federal Reserve Board in advance, and then may only do so if the Federal Reserve Board does not object to the proposed transaction. The Federal Reserve Board has established a rebuttable presumptive standard that the acquisition of 10% or more of the voting stock of a bank holding company would constitute an acquisition of control of the bank holding company. In addition, approval of the Federal Reserve Board is required before acquiring 25% (5% in the case of an acquirer that is a bank holding company) or more of any class of a bank holding company’s voting securities, or otherwise obtaining control or a “controlling influence” over a bank holding company.
Permissible Activities. A bank holding company is generally permitted under the Bank Holding Company Act to engage in or acquire direct or indirect control of more than 5% of the voting shares of any bank, bank holding company or company engaged in any activity that the Federal Reserve Board determines to be so closely related to banking as to be a proper incident to the business of banking.
Under current federal law, a bank holding company may elect to become a financial holding company, which enables the holding company to conduct activities that are “financial in nature,” incidental to financial activity, or complementary to financial activity that do not pose a substantial risk to the safety and soundness of depository institutions or the financial system generally. Activities that are “financial in nature” include securities underwriting, dealing and market making in securities; sponsoring mutual funds and investment companies; insurance underwriting and agency; merchant banking activities; and activities that the Federal Reserve Board has determined to be closely related to banking. No regulatory approval is required for a financial holding company to acquire a company, other than a bank or savings association, engaged in activities that are financial in nature or incidental to activities that are financial in nature, as determined by the Federal Reserve Board. We have not filed an election to become a financial holding company.
Capital Adequacy Requirements. Both the Company and the Bank are required to comply with capital adequacy guidelines. Guidelines are established by the Federal Reserve Board for the Company and the FDIC for the Bank. Both the Federal Reserve Board and the FDIC have substantially similar risk based and leverage ratio guidelines for banking organizations, which are intended to ensure that banking organizations have adequate capital related to the risk levels of assets and off-balance sheet instruments. The capital adequacy guidelines are minimum supervisory ratios generally applicable to banking organizations that meet certain specified criteria, assuming they have the highest regulatory rating. Banking organizations not meeting these criteria are expected to operate with capital positions well above the minimum ratios. The federal bank regulatory agencies may set capital requirements for a particular banking organization that are higher than the minimum ratios when circumstances warrant. Federal Reserve Board guidelines also provide that banking organizations experiencing internal growth or making acquisitions will be expected to maintain strong capital positions substantially above the minimum supervisory levels, without significant reliance on intangible assets.
In July 2013, the Federal Reserve Board and the FDIC approved final rules that substantially amended the regulatory risk-based capital rules applicable to the Company and Bank. The final rules implement the regulatory capital reforms of the Basel Committee on Banking Supervision reflected in “Basel III: A Global Regulatory Framework for More Resilient Banks and Banking Systems” (“Basel III”) and changes required by the Dodd-Frank Act. The final rules implementing the Basel III regulatory capital reforms became effective for the Company and Bank on January 1, 2015, and include new minimum risk-based capital and leverage ratios. These rules refine the definition of what constitutes “capital” for purposes of calculating the capital ratios.
The Basel III minimum capital level requirements applicable to bank holding companies and banks subject to the rules are a common equity Tier 1 capital ratio of 4.5%, a Tier 1 risk-based capital ratio of 6%, a total risk-based capital ratio of 8%, and a Tier 1 leverage ratio of 4% for all institutions. The rules also establish a “capital conservation buffer” of 2.5%, to be phased in over three years, above the regulatory minimum risk-based capital ratios. Once the capital conservation buffer is fully phased in, the minimum ratios area common equity Tier 1 risk-based capital ratio of 7.0%, a Tier 1 risk-based capital ratio of 8.5%, and a total risk-based capital ratio of 10.5%.
The phase-in of the capital conservation buffer requirement began in January 2016 at 0.625% of risk-weighted assets and increases each year until fully implemented in January 2019. An institution is subject to limitations on paying dividends, engaging in share repurchases and paying discretionary bonuses if capital levels fall below minimum levels plus the buffer amounts. These limitations establish a maximum percentage of eligible retained income that could be utilized for such actions.
Under these new rules, Tier 1 capital generally consists of common stock (plus related surplus) and retained earnings, limited amounts of minority interest in the form of additional Tier 1 capital instruments, and non-cumulative preferred stock and related surplus, subject to certain eligibility standards, less goodwill and other specified intangible assets and other regulatory deductions. Tier 2 capital may consist of subordinated debt, certain hybrid capital instruments, qualifying preferred stock and a limited amount of the allowance for loan losses. Proceeds of trust preferred securities are excluded from Tier 1 capital unless issued before 2010 by an institution with less than $15 billion of assets. Total capital is the sum of Tier 1 and Tier 2 capital.
Prompt Corrective Action. Pursuant to the Federal Deposit Insurance Act (“FDIA”), the FDIC must take prompt corrective action to resolve the problems of undercapitalized institutions. FDIC regulations define the levels at which an insured institution would be considered “well capitalized,” “adequately capitalized,” “undercapitalized,” “significantly undercapitalized” and “critically undercapitalized”. A bank is “undercapitalized” if it fails to meet any one of the ratios required to be adequately capitalized. A depository institution may be deemed to be in a capitalization category that is lower than is indicated by its actual capital position if it receives an unsatisfactory examination rating. The degree of regulatory scrutiny increases and the permissible activities of a bank decrease, as the bank moves downward through the capital categories. Depending on a bank’s level of capital, the FDIC’s corrective powers include:
|
• |
requiring a capital restoration plan; |
|
• |
placing limits on asset growth and restriction on activities; |
|
• |
requiring the bank to issue additional voting or other capital stock or to be acquired; |
|
• |
placing restrictions on transactions with affiliates; |
|
• |
restricting the interest rate the bank may pay on deposits; |
|
• |
ordering a new election of the bank’s board of directors; |
|
• |
requiring that certain senior executive officers or directors be dismissed; |
|
• |
prohibiting the bank from accepting deposits from correspondent banks; |
|
• |
requiring the bank to divest certain subsidiaries; |
|
• |
prohibiting the payment of principal or interest on subordinated debt; and |
|
• |
ultimately, appointing a receiver for the bank. |
If an institution is required to submit a capital restoration plan, the institution’s holding company must guarantee the subsidiary’s compliance with the capital restoration plan up to a certain specified amount. Any such guarantee from a depository institution’s holding company is entitled to a priority of payment in bankruptcy. The aggregate liability of the holding company of an undercapitalized bank is limited to the lesser of 5% of the institution’s assets at the time it became undercapitalized or the amount necessary to cause the institution to be “adequately capitalized.” The bank regulators have greater power in situations where an institution becomes “significantly” or “critically” undercapitalized or fails to submit a capital restoration plan. For example, a bank holding company controlling such an institution can be required to obtain prior Federal Reserve Board approval of proposed dividends, or might be required to consent to a consolidation or to divest the troubled institution or other affiliates.
Dividends. Under Federal Reserve Board policy, bank holding companies should pay cash dividends on common stock only out of income available over the past year and only if prospective earnings retention is consistent with the organization’s expected future needs and financial condition. The policy provides that bank holding companies should not declare a level of cash dividends that undermines the bank holding company’s ability to serve as a source of strength to its banking subsidiaries.
The Company is a legal entity separate and distinct from the Bank. Historically, the majority of the Company’s revenue has been from dividends paid to it by the Bank. The Bank is subject to laws and regulations that limit the amount of dividends it can pay. If, in the opinion of a federal regulatory agency, an institution under its jurisdiction is engaged in or is about to engage in an unsafe or unsound practice, the agency may require, after notice and hearing, that the institution cease such practice. The federal banking agencies have indicated that paying dividends that deplete an institution’s capital base to an inadequate level would be an unsafe and unsound banking practice. Under the Federal Deposit Insurance Corporation Improvement Act (“FDICIA”), an insured institution may not pay any dividend if payment would cause it to become undercapitalized or if it already is undercapitalized. Moreover, the Federal Reserve and the FDIC have issued policy statements providing that bank holding companies and banks should generally pay dividends only out of current operating earnings. A bank holding company may still declare and pay a dividend if it does not have current operating earnings if the bank holding company expects profits for the entire year and the bank holding company obtains the prior consent of the Federal Reserve.
Under Kentucky law, dividends by Kentucky banks may be paid only from current or retained net profits. The KDFI must approve the declaration of dividends if the total dividends to be declared by a bank for any calendar year would exceed the bank’s total net profits for such year combined with its retained net profits for the preceding two years, less any required transfers to surplus or a fund for the retirement of preferred stock or debt. Additionally, retained earnings must be positive. We are also subject to the Kentucky Business Corporation Act, which generally prohibits dividends to the extent they result in the insolvency of the corporation from a balance sheet perspective or in the corporation becoming unable to pay its debts as they come due. The Bank did not pay any dividends in 2017 or 2016 and cannot currently pay any dividends without prior regulatory approval.
With respect to the payment of dividends, Porter Bancorp’s issued and outstanding Series E and Series F Preferred Shares rank senior to its common shares and non-voting common shares.
Source of Financial Strength. Under Federal Reserve policy, a bank holding company is expected to act as a source of financial strength to, and to commit resources to support, its bank subsidiaries. This support may be required at times when, absent such a policy, the bank holding company may not be inclined to provide it. In addition, any capital loans by the bank holding company to its bank subsidiaries are subordinate in right of payment to deposits and to certain other indebtedness of the bank subsidiary. In the event of a bank holding company’s bankruptcy, any commitment by the bank holding company to a federal bank regulatory agency to maintain the capital of subsidiary banks will be assumed by the bankruptcy trustee and entitled to a priority of payment. The Federal Reserve’s “Source of Financial Strength” policy was codified in the Dodd-Frank Act.
Limestone Bank. The Bank, a Kentucky chartered commercial bank, is subject to regular bank examinations and other supervision and regulation by both the FDIC and the KDFI. Kentucky’s banking statutes contain a “super-parity” provision that permits a well-rated Kentucky banking corporation to engage in any banking activity which could be engaged in by a national bank operating in Kentucky; a state bank, a thrift or savings bank operating in any other state; or a federal chartered thrift or federal savings association meeting the qualified thrift lender test and operating in any state could engage, provided the Kentucky bank first obtains a legal opinion specifying the statutory or regulatory provisions that permit the activity.
Capital Requirements. Please see capital adequacy requirements discussion above.
Deposit Insurance Assessments. The deposits of the Bank are insured by the Deposit Insurance Fund (“DIF”) of the FDIC up to the limits set forth under applicable law and are subject to the deposit insurance premium assessments of the DIF. The FDIC imposes a risk-based deposit premium assessment system, which was amended pursuant to the Federal Deposit Insurance Reform Act of 2005 (the “Reform Act”). Under this system, as amended, the assessment rates for an insured depository institution vary according to the level of risk incurred in its activities. To arrive at an assessment rate for a banking institution, the FDIC places it in one of four risk categories determined by reference to its capital levels and supervisory ratings. The assessment rate schedule can change from time to time, at the discretion of the FDIC, subject to certain limits.
The Dodd-Frank Act imposed additional assessments and costs with respect to deposits. Under the Dodd-Frank Act, the FDIC imposes deposit insurance assessments based on total assets rather than total deposits. Pursuant to the Dodd-Frank Act, the FDIC revised the deposit insurance assessment system and implemented a revised assessment rate process with the goal of differentiating insured depository institutions who pose greater risk to the DIF.
Safety and Soundness Standards. The FDIA requires the federal bank regulatory agencies to prescribe standards, by regulations or guidelines, relating to internal controls, information systems and internal audit systems, loan documentation, credit underwriting, interest rate risk exposure, asset growth, asset quality, earnings, stock valuation and compensation, fees and benefits, and such other operational and managerial standards as the agencies deem appropriate. Guidelines adopted by the federal bank regulatory agencies establish general standards relating to these matters. In general, the guidelines require, among other things, appropriate systems and practices to identify and manage the risk and exposures specified in the guidelines. The guidelines prohibit excessive compensation as an unsafe and unsound practice and describe compensation as excessive when the amounts paid are unreasonable or disproportionate to the services performed by an executive officer, employee, director or principal shareholder. In addition, the agencies adopted regulations that authorize, but do not require, an agency to order an institution that has been given notice by an agency that it is not satisfying any of such safety and soundness standards to submit a compliance plan. If, after being so notified, an institution fails to submit an acceptable compliance plan or fails in any material respect to implement an acceptable compliance plan, the agency must issue an order directing action to correct the deficiency and may issue an order directing other actions of the types to which an undercapitalized institution is subject under the “prompt corrective action” provisions of FDIA. See “Prompt Corrective Actions” above. If an institution fails to comply with such an order, the agency may seek to enforce such order in judicial proceedings and to impose civil money penalties.
Branching. Kentucky law permits Kentucky chartered banks to establish a banking office in any county in Kentucky. A Kentucky bank may also establish a banking office outside of Kentucky. Well capitalized Kentucky banks that have been in operation at least three years and satisfy certain criteria relating to, among other things, their composite and management ratings, may establish a banking office in Kentucky without the approval of the KDFI upon notice to the KDFI and any other state bank with its main office located in the county where the new banking office will be located. Otherwise, branching requires the approval of the KDFI, which must ascertain and determine that the public convenience and advantage will be served and promoted and that there is reasonable probability of the successful operation of the banking office. The transaction must also be approved by the FDIC, which considers a number of factors, including financial history, capital adequacy, earnings prospects, character of management, needs of the community and consistency with corporate powers.
Section 613 of the Dodd-Frank Act effectively eliminated the interstate branching restrictions set forth in the Riegle-Neal Interstate Banking and Branching Efficiency Act of 1994. Banks located in any state may now de novo branch in any other state, including Kentucky. Such unlimited branching power may increase competition within the markets in which the Company and the Bank operate.
Insider Credit Transactions. The restrictions on loans to directors, executive officers, principal shareholders and their related interests (collectively referred to as “insiders”) contained in the Federal Reserve Act and Regulation O apply to all insured depository institutions and their subsidiaries. These restrictions include limits on loans to one borrower and conditions that must be met before such a loan can be made. There is also an aggregate limitation on all loans to insiders and their related interests, which may not exceed the institution’s total unimpaired capital and surplus.
Consumer Protection Laws. The Bank is subject to federal consumer protection statues and regulations promulgated under those laws, including, but not limited to, the:
|
● |
Truth-In-Lending Act and Regulation Z, governing disclosures of credit terms to consumer borrowers; |
|
● |
Home Mortgage Disclosure Act and Regulation C, requiring financial institutions to provide certain information about home mortgage and refinanced loans; |
|
● |
Real Estate Settlement Procedures Act (“RESPA”), requiring lenders to provide borrowers with disclosures regarding the nature and cost of real estate settlements and prohibiting certain abusive practices; |
|
● |
Secure and Fair Enforcement for Mortgage Licensing Act (“S.A.F.E. Act”), requiring residential loan originators who are employees of financial institutions to meet registration requirements; |
|
● |
Fair Credit Reporting Act and Regulation V, governing the provision of consumer information to credit reporting agencies and the use of consumer information; |
|
● |
Equal Credit Opportunity Act and Regulation B, prohibiting discrimination on the basis of race, religion or other prohibited factors in the extension of credit; |
|
● |
Fair Debt Collection Act, governing the manner in which consumer debts may be collected by collection agencies; |
|
● |
Truth in Savings Act, which requires disclosure of deposit terms to consumers; |
|
● |
Regulation CC, which relates to the availability of deposit funds to consumers; |
|
● |
Right to Financial Privacy Act, which imposes a duty to maintain the confidentiality of consumer financial records and prescribes procedures for complying with administrative subpoenas of financial records; |
|
● |
Electronic Funds Transfer Act, governing automatic deposits to and withdrawals from deposit accounts and customers’ rights and liabilities arising from the use of automated teller machines and other electronic banking services; |
|
● |
Automated Overdraft Payment Regulations and Regulation E, requiring financial institutions to provide customer notices, monitor overdraft payment programs, and prohibiting financial institutions from charging consumer fees for paying overdrafts on automated teller machine and one time debit card transactions unless a consumer consents, or opts in to the service for those types of transactions. |
The Dodd-Frank Act created the Consumer Financial Protection Bureau, which is granted broad rulemaking, supervisory and enforcement powers under various federal consumer financial protection laws. The CFPB has examination and primary enforcement authority with respect to depository institutions with $10 billion or more in assets. Smaller institutions are subject to rules promulgated by the CFPB, but continue to be examined and supervised by federal banking regulators for consumer compliance purposes. The CFPB has authority to prevent unfair, deceptive or abusive acts or practices in connection with the offering of consumer financial products. The Dodd-Frank Act authorizes the CFPB to establish certain minimum standards for the origination of residential mortgages including a determination of the borrower’s ability to repay. In addition, the Dodd-Frank Act allows borrowers to raise certain defenses to foreclosure if they receive any loan other than a “qualified mortgage” as defined by the CFPB.
The Dodd-Frank Act also permits states to adopt consumer protection laws and standards that are more stringent than those adopted at the federal level and, in certain circumstances, permits state attorneys general to enforce compliance with both the state and federal laws and regulations. Federal preemption of state consumer protection law requirements, traditionally an attribute of the federal savings association charter, has also been modified by the Dodd-Frank Act and now requires a case-by-case determination of preemption by the Office of the Comptroller of the Currency (“OCC”) and eliminates preemption for subsidiaries of a bank. Depending on the implementation of this revised federal preemption standard, the operations of the Bank could become subject to additional compliance burdens in the states in which it operates.
Loans to One Borrower. Under current limits, loans and extensions of credit outstanding at one time to a single borrower and not fully secured generally may not exceed 20% of an institution’s unimpaired capital and unimpaired surplus. Loans and extensions of credit fully secured by collateral may represent an additional 10% of unimpaired capital and unimpaired surplus.
Volcker Rule. On December 10, 2013, the final Volcker Rule under the Dodd-Frank Act was approved and implemented by the Federal Reserve Board, the FDIC, the Securities and Exchange Commission (“SEC”), and the Commodity Futures Trading Commission. The Volcker Rule attempts to reduce risk and banking system instability by restricting U.S. banks from investing in or engaging in proprietary trading and speculation and imposing a strict framework to justify exemptions for underwriting, market-making and hedging activities. U.S. banks are restricted from investing in funds with collateral comprised of less than 100% loans that are not registered with the SEC and from engaging in hedging activities that do not hedge a specific identified risk. The Volcker Rule does not have a significant effect on the Bank’s operations.
Privacy. Federal law currently contains extensive customer privacy protection provisions. Under these provisions, a financial institution must provide to its customers, at the inception of the customer relationship and annually thereafter, the institution’s policies and procedures regarding the handling of customers’ nonpublic personal financial information. These provisions also provide that, except for certain limited exceptions, an institution may not provide such personal information to unaffiliated third parties unless the institution discloses to the customer that such information may be so provided and the customer is given the opportunity to opt out of such disclosure. Federal law makes it a criminal offense, except in limited circumstances, to obtain or attempt to obtain customer information of a financial nature by fraudulent or deceptive means.
Community Reinvestment Act. The Community Reinvestment Act (“CRA”) requires the FDIC to assess our record in meeting the credit needs of the communities we serve, including low- and moderate-income neighborhoods and persons. The FDIC’s assessment of our record is made available to the public. The assessment also is part of the Federal Reserve Board’s consideration of applications to acquire, merge or consolidate with another banking institution or its holding company, to establish a new banking office or to relocate an office.
Bank Secrecy Act. The Bank Secrecy Act of 1970 (“BSA”) was enacted to deter money laundering, establish regulatory reporting standards for currency transactions and improve detection and investigation of criminal, tax and other regulatory violations. BSA and subsequent laws and regulations require us to take steps to prevent the use of the Bank in the flow of illegal or illicit money, including, without limitation, ensuring effective management oversight, establishing sound policies and procedures, developing effective monitoring and reporting capabilities, ensuring adequate training and establishing a comprehensive internal audit of BSA compliance activities. In recent years, federal regulators have increased the attention paid to compliance with the provisions of BSA and related laws, with particular attention paid to “Know Your Customer” practices. Banks have been encouraged by regulators to enhance their identification procedures prior to accepting new customers in order to deter criminal elements from using the banking system to move and hide illegal and illicit activities.
USA Patriot Act. The USA Patriot Act of 2001 (the “Patriot Act”) contains anti-money laundering measures affecting insured depository institutions, broker-dealers and certain other financial institutions. The Patriot Act requires financial institutions to implement policies and procedures to combat money laundering and the financing of terrorism. This includes standards for verifying customer identification at account opening, as well as rules to promote cooperation among financial institutions, regulators and law enforcement entities in identifying parties that may be involved in terrorism or money laundering. It grants the Secretary of the Treasury broad authority to establish regulations and to impose requirements and restrictions on the operations of financial institutions. In addition, the Patriot Act requires the federal bank regulatory agencies to consider the effectiveness of a financial institution’s anti-money laundering activities when reviewing bank mergers and bank holding company acquisitions.
Effect on Economic Environment. The policies of regulatory authorities, including the monetary policy of the Federal Reserve Board, have a significant effect on the operating results of bank holding companies and bank subsidiaries. Among the means available to the Federal Reserve Board to affect the money supply are open market operations in U.S. government securities, changes in the discount rate on member bank borrowings and changes in reserve requirements against member bank deposits. These means are used in varying combinations to influence overall growth and distribution of bank loans, investments and deposits. Their use may affect interest rates charged on loans or paid for deposits.
Federal Reserve Board monetary policies have materially affected the operating results of commercial banks in the past and are expected to continue to do so in the future. The nature of future monetary policies and the effect of such policies on our business and earnings and those of our subsidiaries cannot be predicted.
Legislative and Regulatory Initiatives. From time to time various laws, regulations and governmental programs affecting financial institutions and the financial industry are introduced in Congress or otherwise promulgated by regulatory agencies. Such measures may change the environment in which the Company and its subsidiaries operate in substantial and unpredictable ways. The nature and extent of future legislative, regulatory or other changes affecting financial institutions are unpredictable at this time. Future legislation, policies and the effects thereof might have a significant influence on overall growth and distribution of loans, investments and deposits. They also may affect interest rates charged on loans or paid on time and savings deposits. New legislation and policies have had a significant effect on the operating results of commercial banks in the past and are expected to continue to do so in the future.
Available Information
The Company files periodic reports with the SEC including its annual report on Form 10-K, quarterly reports on Form 10-Q, current event reports on Form 8-K and proxy statements. The public may read and copy any materials filed with the SEC at the SEC’s Public Reference Room at 100 F Street, NE, Washington, DC 20549. The public may obtain information on the operation of the Public Reference Room by calling the SEC at 1-800-SEC-0330. The SEC maintains an internet site that contains reports, proxy and information statements and other information regarding issuers that file electronically with the SEC at http://www.sec.gov. Our SEC reports are accessible at no cost on our web site at http://www.limestonebank.com, under the Investors Relations section of the About Us tab, once they have been electronically filed with the SEC. A shareholder may also request a copy of our Annual Report on Form 10-K free of charge upon written request to: Chief Financial Officer, Porter Bancorp, Inc., 2500 Eastpoint Parkway, Louisville, Kentucky 40223.
An investment in the Company’s common stock involves a number of risks. Realization of any of the risks described below could have a material adverse effect on the Company’s business, financial condition, results of operations, cash flow and/or future prospects.
The Company is subject to a Written Agreement with the Federal Reserve that restricts the conduct of the Company’s operations and may have a material adverse effect on its business.
In a Written Agreement with the Federal Reserve Bank of St. Louis, the Company made formal commitments in the agreement to use its financial and management resources to serve as a source of strength for the Bank and to assist the Bank in addressing weaknesses identified by the FDIC and the KDFI, to pay no dividends without prior written approval, to pay no interest or principal on subordinated debentures or trust preferred securities without written approval, and to submit an acceptable plan to maintain sufficient capital.
Bank regulatory agencies can exercise discretion when an institution does not meet minimum regulatory capital levels and the other terms of a consent order. The agencies may initiate changes in management, issue mandatory directives, impose monetary penalties or refrain from formal sanctions, depending on individual circumstances. Any action taken by regulatory agencies could damage our reputation and have a material adverse effect on the Company’s business.
As a bank holding company, we depend on dividends and distributions paid to us by our banking subsidiary.
The Company is a legal entity separate and distinct from the Bank and our other subsidiaries. Our principal source of cash flow, from which we would fund any dividends paid to our shareholders, has historically been dividends the Company receives from the Bank. Regulations of the FDIC and the KDFI govern the ability of the Bank to pay dividends and other distributions to the Company, and regulations of the Federal Reserve govern our ability to pay dividends or make other distributions to shareholders. Since the Bank is unlikely to be in a position to pay dividends to the Company without prior regulatory approval until retained earnings are positive, cash inflows for the Company are limited to common stock or debt issuances. See the “Item 1. Business” “Item 5. Market for Registrant’s Common Equity, Related Stockholder Matters and Issuer Purchases of Equity Securities – Dividends.”
We are currently precluded from paying any dividends.
Our agreement with the holders of our trust preferred securities provides that we cannot pay dividends until we pay all deferred distributions in full and resume paying quarterly distributions. We have also agreed with the Federal Reserve to obtain its written consent prior to declaring or paying any future dividends. In addition, the dividend preferences of our Series E and Series F Preferred Shares entitle our preferred shareholders to receive an annual, noncumulative 2% dividend before we can pay a dividend on our non-voting common shares and voting common shares.
Interest on junior subordinated debt is in deferral.
At December 31, 2017, we had an aggregate obligation of $22.2 million relating to the principal and accrued unpaid interest on our four issues of junior subordinated debentures, which has resulted in a deferral of distributions on our trust preferred securities. Although we are permitted to defer payments on these securities for up to five years (and we commenced doing so in 2016), the deferred interest payments continue to accrue until paid in full. Our deferral period expires after the second quarter of 2021.
The Company’s senior debt is secured by the Bank’s common stock and contains financial covenants that must be maintained to avoid default.
The Company’s senior secured loan agreement is with a commercial bank. The loan matures on June 30, 2022. Interest is payable quarterly at a rate of three-month LIBOR plus 250 basis points through June 30, 2020, at which time quarterly principal payments of $250,000 plus interest will commence. The loan is secured by a first priority pledge of 100% of the issued and outstanding stock of the Bank. The Company may prepay any amount due under the promissory note at any time without premium or penalty.
The loan agreement contains customary representations, warranties, covenants and events of default, including the following financial covenants: (i) the Company must maintain minimum cash on hand of not less than $750,000 through June 30, 2018, and not less than $2,500,000 thereafter, (ii) the Company must maintain a total risk based capital ratio at least equal to 9% of risk-weighted assets to June 30, 2018, and 10% thereafter, (iii) the Bank must maintain a total risk based capital ratio at least equal to 10% of risk-weighted assets to June 30, 2018, and 11% thereafter, and (iv) non-performing assets of the Bank may not exceed 2.5% of the Bank’s total assets. Both the Company and Bank were in compliance with the covenants as of December 31, 2017.
We are defendants in various legal proceedings.
The Company and the Bank are involved in judicial proceedings and regulatory investigations concerning matters arising from our business activities. Although we believe we have a meritorious defense in all significant litigation pending against us, we cannot predict the ultimate outcome. Litigation is subject to inherent uncertainties and unfavorable rulings could occur. We record contingent liabilities resulting from claims against us when a loss is assessed to be probable and the amount of the loss is reasonably estimable. Assessing probability of loss and estimating probable losses requires analysis of multiple factors, including in some cases judgments about the potential actions of third party claimants and courts. Recorded contingent liabilities are based on the best information available and actual losses in any future period are inherently uncertain. Accruals are not made in cases where liability is not probable or the amount cannot be reasonably estimated. We provide disclosure of matters where we believe liability is reasonably possible and which may be material to our consolidated financial statements. If we do not prevail, the ultimate outcome of litigation matters could have a material adverse effect on our financial condition, results of operations, or cash flows. For more information about ongoing legal proceedings, see the Notes to Consolidated Financial Statements.
In the past, the Bank served as trustee for employee stock ownership plans (“ESOPs”) which engaged in transactions that are under review by the U. S. Department of Labor (“DOL”), subjecting us to certain legal risks.
From 2007 until the first quarter of 2013, the Bank served as trustee for certain ESOPs that purchased the stock of companies from prior owners in purchase transactions. Stock purchase transactions by ESOPs are subject to regular and routine reviews by the DOL for compliance with ERISA. Failure to fulfill fiduciary duties under ERISA with respect to any such plan would subject the Bank to certain financial risks such as claims for damages as well as fines and penalties assessable under ERISA. The Bank was a defendant in legal proceedings initiated by the DOL with respect to two stock purchase transactions by ESOPs for which the Bank served as trustee. Both matters were settled. A ruling in any future litigation that the Bank failed to fulfill its fiduciary duties under ERISA with respect to an ESOP, including stock purchases by the ESOP, could subject the Bank to claims for damages as well as fines and penalties assessable under ERISA.
Investigations into and heightened scrutiny of our operations could result in additional costs and damage our reputation.
In October 2014, the Department of Justice (“DOJ”) initiated an investigation concerning possible violations of federal laws, including, among other things, possible violations related to false bank entries, bank fraud and securities fraud. The investigation concerns allegations that Bank personnel engaged in practices intended to delay or avoid disclosure of the Bank’s asset quality at the time of and following the United States Treasury’s purchase of preferred shares from the Company in November 2008. The Bank has cooperated with all requests for information from the DOJ. At this time, the DOJ has not indicated whether it intends to pursue any action in the matter. Heightened scrutiny of the operations of the Company and the Bank by federal officials may subject us to governmental or regulatory inquiries, investigations, actions, penalties and fines, which could adversely affect our reputation and result in costs to us in excess of current reserves and management’s estimate of the aggregate range of possible loss for such matters.
Our business may be adversely affected by conditions in the financial markets and by economic conditions generally.
Weakness in business and economic conditions generally or specifically in our markets may have one or more of the following adverse effects on our business:
|
● |
A decrease in the demand for loans and other products and services we offer; |
|
● |
A decrease in the value of collateral securing our loans; and |
|
● |
An increase in the number of customers who become delinquent, file for protection under bankruptcy laws or default on their loans. |
Adverse conditions in the general business environment have had an adverse effect on our business in the past. Although the general business environment has improved, we cannot predict how long such improvement can be sustained. In addition, the improvement of certain economic indicators, such as real estate asset values, rents, and unemployment, may vary between geographic markets and may continue to lag behind improvement in the overall economy. These economic indicators typically affect the real estate and financial services industries, in which we have a significant number of customers, more significantly than other economic sectors. Furthermore, we have a substantial lending business that depends upon the ability of borrowers to make debt service payments on loans. Should economic conditions worsen, our business, financial condition or results of operations could be adversely affected.
A large percentage of our loans are collateralized by real estate, and prolonged weakness in the real estate market may result in losses and adversely affect our profitability.
Approximately 73.7% of our loan portfolio as of December 31, 2017, was comprised of commercial and residential loans collateralized by real estate. Adverse economic conditions could decrease demand for real estate and depress real estate values in our markets. Persistent weakness in the real estate market could significantly impair the value of our collateral and our ability to sell the collateral upon foreclosure. The real estate collateral in each case provides an alternate source of repayment in the event of default by the borrower and may deteriorate in value during the time the credit is extended. If real estate values decline, it will become more likely that we would be required to increase our allowance for loan losses. If during a period of depressed real estate values, we were required to liquidate the collateral securing a loan to satisfy the debt or to increase our allowance for loan losses, it could materially reduce our profitability and adversely affect our financial condition.
We offer real estate construction and development loans, which carry a higher degree of risk than other real estate loans. Weakness in the residential construction and commercial development real estate markets has in the past increased the non-performing assets in our loan portfolio and our provision for loan loss expense. These impacts have had, and could have in the future, a material adverse effect on capital, financial condition and results of operations.
Approximately 8.1% of our loan portfolio as of December 31, 2017 consisted of real estate construction and development loans, up from 5.7% at December 31, 2016 and 5.4% at December 31, 2015. These loans generally carry a higher degree of risk than long-term financing of existing properties because repayment depends on the ultimate completion of the project and permanent financing or sale of the property. If the Bank is forced to foreclose on a project prior to its completion, it may not be able to recover the entire unpaid portion of the loan or it may be required to fund additional money to complete the project, or hold the property for an indeterminate period of time. Any of these outcomes may result in losses and adversely affect profitability and financial condition.
Residential construction and commercial development real estate activity in our markets were affected by the challenging economic conditions that followed the financial crisis of 2008. Weakness in these sectors could lead to valuation adjustments to the loan portfolios and real estate owned. A weak real estate market could reduce demand for residential housing, which, in turn, could adversely affect real estate development and construction activities. Consequently, the longer challenging economic conditions persist, the more likely they are to adversely affect the ability of residential real estate development borrowers to repay loans and the value of property used as collateral for such loans.
Our decisions regarding credit risk may not be accurate, and our allowance for loan losses may not be sufficient to cover actual losses, which could adversely affect our business, financial condition and results of operations.
The Bank maintains an allowance for loan losses at a level we believe is adequate to absorb probable incurred losses in the loan portfolio based on historical loan loss experience, economic and environmental factors, specific problem loans, value of underlying collateral and other relevant factors. If our assessment of these factors is ultimately inaccurate, the allowance may not be sufficient to cover actual future loan losses, which would adversely affect operating results. Management’s estimates are subjective, and their accuracy depends on the outcome of future events. Changes in economic, operating, and other conditions that are generally beyond our control could cause actual loan losses to increase significantly. In addition, bank regulatory agencies, as an integral part of their supervisory functions, periodically review the adequacy of our allowance for loan losses. Regulatory agencies may require an increase in provision for loan losses or to recognize additional loan charge-offs when their judgment differed from ours. Any of these events could have a material negative impact on our operating results.
Our levels of classified loans and non-performing assets may increase in the foreseeable future if economic conditions cause borrowers to default. Further, the value of the collateral underlying a given loan, and the realizable value of such collateral in a foreclosure sale, may decline, making it less likely to realize a full recovery if a borrower defaults on a loan. Any additional increases in the level of our non-performing assets, loan charge-offs or provision for loan losses, or our inability to realize the estimated net value of underlying collateral in the event of a loan default, could negatively affect our business, financial condition, results of operations and the trading price of our securities.
If we experience greater credit losses than anticipated, our operating results would be adversely affected.
As a lender, the Bank is exposed to the risk that borrowers will be unable to repay their loans according to their terms and that any collateral securing the payment of their loans may not be sufficient to assure repayment. Credit losses are inherent in the business of making loans and could have a material adverse effect on our operating results. Our credit risk with respect to our real estate and construction loan portfolio will relate principally to the creditworthiness of borrowers and the value of the real estate serving as security for the repayment of loans. Our credit risk with respect to our commercial and consumer loan portfolio will relate principally to the general creditworthiness of businesses and individuals within our local markets.
We make various assumptions and judgments about the collectability of our loan portfolio and provide an allowance for estimated loss losses based on a number of factors. We believe that our allowance for loan losses is adequate. However, if our assumptions or judgments are wrong, our allowance for loan losses may not be sufficient to cover our actual loan losses. We may have to increase our allowance in the future at the request of one of our primary banking regulators, to adjust for changing conditions and assumptions, or as a result of any deterioration in the quality of our loan portfolio. The actual amount of future provisions for loan losses cannot be determined at this time and may vary from the amounts of past provisions.
We continue to hold and from time to time acquire OREO properties, which could increase operating expenses and result in future losses to the Company.
During recent years, the Bank has acquired and disposed of a significant amount of real estate as a result of foreclosure or by deed in lieu of foreclosure that is listed on our balance sheet as other real estate owned (“OREO”). An increase in our OREO portfolio increases the expenses incurred to manage and dispose of these properties, which sometimes includes funding construction required to facilitate sale.
Properties in our OREO portfolio are recorded at fair value, which represents the estimated sales price of the properties on the date acquired less estimated selling costs. Generally, in determining “fair value” an orderly disposition of the property is assumed, except where a different disposition strategy is expected. Significant judgment is required in estimating the fair value of OREO, and the period of time within which such estimates can be considered current may change during periods of market volatility. Any decreases in market prices of real estate in our market areas may lead to additional OREO write downs, with a corresponding expense in our statement of operations. We evaluate OREO property values periodically and write down the carrying value of the properties if and when the results of our analysis require it.
In response to market conditions and other economic factors, we may utilize alternative sale strategies other than orderly disposition as part of our OREO disposition strategy, such as auctions or bulk sales. In this event, as a result of the significant judgments required in estimating fair value and the variables involved in different methods of disposition, the net proceeds realized from such sales transactions could differ significantly from appraisals, comparable sales, and other estimates used to determine the fair value of our OREO properties. In addition, our disposition of OREO through alternative sales strategies could impact the fair value of comparable OREO properties remaining in our portfolio.
Our profitability depends significantly on local economic conditions.
Most of our business activities are conducted in central Kentucky and most of our credit exposure is in that region. We are at risk from adverse economic or business developments affecting this area, including declining regional and local business and employment activity, a downturn in real estate values and agricultural activities and natural disasters. To the extent the central Kentucky economy weakens, delinquency rates, foreclosures, bankruptcies and losses in our loan portfolio will likely increase. Moreover, the value of real estate or other collateral that secures our loans could be adversely affected by the economic downturn or a localized natural disaster. Events that adversely affect business activity and real estate values in central Kentucky have had and may continue to have a negative impact on our business, financial condition, results of operations and future prospects.
Our small to medium-sized business portfolio may have fewer resources to weather a downturn in the economy.
Our portfolio includes loans to small and medium-sized businesses and other commercial enterprises. Small and medium-sized businesses frequently have smaller market shares than their competitors, may be more vulnerable to economic downturns, often need additional capital to expand or compete and may experience variations in operating results, any of which may impair a borrower’s ability to repay a loan. In addition, the success of a small or medium-sized business often depends on the management talents and efforts of one or two persons or a small group of persons. The death, disability or resignation of one or more of these persons could have a material adverse impact on the business and its ability to repay our loan. A continued economic downturn may have a more pronounced negative impact on our target market, causing us to incur substantial credit losses that could materially harm our operating results.
Our profitability is vulnerable to fluctuations in interest rates.
Changes in interest rates could harm our financial condition or results of operations. Our results of operations depend substantially on net interest income, the difference between interest earned on interest-earning assets (such as investments and loans) and interest paid on interest-bearing liabilities (such as deposits and borrowings). Interest rates are highly sensitive to many factors, including governmental monetary policies and domestic or international economic or political conditions. Factors beyond our control, such as inflation, recession, unemployment and money supply may also affect interest rates. If, as a result of decreasing interest rates, our interest-earning assets mature or reprice more quickly than our interest-bearing liabilities in a given period, our net interest income may decrease. Likewise, our net interest income may decrease if interest-bearing liabilities mature or reprice more quickly than interest-earning assets in a given period as a result of increasing interest rates.
Fixed-rate loans increase our exposure to interest rate risk in a rising rate environment because interest-bearing liabilities may be subject to repricing before assets become subject to repricing. Fixed rate investment securities are subject to fair value declines as interest rates rise. Adjustable-rate loans decrease the risk associated with changes in interest rates but involve other risks, such as the inability of borrowers to make higher payments in an increasing interest rate environment. At the same time, for secured loans, the marketability of the underlying collateral may be adversely affected by higher interest rates. In a declining interest rate environment, there may be an increase in prepayments on loans as the borrowers refinance their loans at lower interest rates, which could reduce net interest income and harm our results of operations.
If we cannot obtain adequate funding, we may not be able to meet the cash flow requirements of our depositors and borrowers, or meet the operating cash needs of the Company.
Our liquidity policies and limits are established by the Board of Directors of the Bank, with operating limits managed and monitored by the Asset Liability Committee (“ALCO”), based upon analyses of the ratio of loans to deposits and the percentage of assets funded with non-core or wholesale funding. The ALCO regularly monitors the overall liquidity position of the Bank and the Company to ensure that various alternative strategies exist to meet unanticipated events that could affect liquidity. Liquidity is the ability to meet cash flow needs on a timely basis at a reasonable cost. If our liquidity policies and strategies do not work as well as intended, we may be unable to make loans and repay deposit liabilities as they become due or are demanded by customers. The ALCO follows established board approved policies and monitors guidelines to diversify our wholesale funding sources to avoid concentrations in any one-market source. Wholesale funding sources include Federal funds purchased, securities sold under repurchase agreements, and Federal Home Loan Bank (“FHLB”) advances that are collateralized with mortgage-related assets.
We maintain a portfolio of securities that can be used as a secondary source of liquidity. There are other available sources of liquidity, including additional collateralized borrowings such as FHLB advances, the issuance of debt securities, and the issuance of preferred or common shares in public or private transactions. If we are unable to access any of these funding sources when needed, we might not be able to meet the needs of our customers, which could adversely impact our financial condition, our results of operations, cash flows, and our level of regulatory-qualifying capital.
We may not be able to realize the value of our tax losses and deductions.
Due to historic losses, we have a net operating loss carry-forward of $25.6 million, credit carry-forwards of $900,000, and other net deferred tax assets of $4.8 million. In order to realize the benefit of these tax losses, credits and deductions, we will need to generate substantial taxable income in future periods. Our deferred tax assets are calculated using a federal corporate tax rate of 21%. Changes in tax laws and rates may affect our deferred tax assets in the future. If lower federal corporate tax rates are enacted, our net deferred tax assets would be reduced commensurate with the rate reduction. Additionally, should the Company need to raise additional capital by issuing new common shares or securities convertible into common shares, then depending on the number of common share equivalents issued, it could trigger a “change in control,” as defined by Section 382 of the Internal Revenue Code. Such an event could negatively impact or limit the ability to utilize our net operating loss carry-forwards, credit loss carry-forwards, and other net deferred tax assets.
We may sell capital stock in the future to raise additional capital or for additional liquidity at the holding company. Future sales or other dilution of our equity may adversely affect the market price of our common shares.
Our issuance of additional common shares or securities convertible into common shares would dilute the ownership interest of our existing common shareholders. The market price of our common shares could decline as a result of such an offering as well as other sales of a large block of shares of our common shares or similar securities in the market after such an offering, or the perception that such sales could occur. Our common shares have traded from time-to-time at a price below our book value per share. A sale of common shares at or below our book value would be dilutive to current shareholders. The sale of shares at a price below market value could negatively impact the market price of our common shares.
Higher FDIC deposit insurance premiums and assessments could significantly increase our non-interest expense.
Our deposits are insured by the FDIC up to legal limits and, accordingly, we are subject to FDIC deposit insurance premiums and assessments. FDIC assessments for deposit insurance are based on the average total consolidated assets of the insured institution during the assessment period, less the average tangible equity of the institution during the assessment period. Any increase in assessment rates may adversely affect our business, financial condition or results of operations.
We face strong competition from other financial institutions and financial service companies, which could adversely affect our results of operations and financial condition.
We compete with other financial institutions in attracting deposits and making loans. Our competition in attracting deposits comes principally from other commercial banks, credit unions, savings and loan associations, securities brokerage firms, insurance companies, money market funds, and other mutual funds. Our competition in making loans comes principally from other commercial banks, credit unions, savings and loan associations, mortgage banking firms, and consumer finance companies. In addition, competition for business in the Louisville and Lexington metropolitan areas has grown in recent years as changes in banking law have allowed banks to enter those markets by establishing new branches.
Competition in the banking industry may also limit our ability to attract and retain banking clients. We maintain smaller staffs of associates and have fewer financial and other resources than larger institutions with which we compete. Financial institutions that have far greater resources and greater efficiencies than we do may have several marketplace advantages resulting from their ability to:
|
● |
offer higher interest rates on deposits and lower interest rates on loans than we can; |
|
● |
offer a broader range of services than we do; |
|
● |
maintain more branch locations than we do; and |
|
● |
mount extensive promotional and advertising campaigns. |
In addition, banks and other financial institutions with larger capitalization and other financial intermediaries may not be subject to the same regulatory restrictions as we are and may have larger lending limits than we do. Some of our current commercial banking clients may seek alternative banking sources as they develop needs for credit facilities larger than we can accommodate. If we are unable to attract and retain customers, we may not be able to maintain growth and our results of operations and financial condition may otherwise be negatively impacted.
We depend on our senior management team, and the unexpected loss of one or more of our senior executives could impair our relationship with customers and adversely affect our business and financial results.
Our future success significantly depends on the continued services and performance of our key management personnel. Our future performance will depend on our ability to motivate and retain these and other key officers. The Dodd-Frank Act, and the policies of bank regulatory agencies have placed restrictions on executive compensation practices. Such restrictions and standards may further impact our ability to compete for talent with other businesses that are not subject to the same limitations as we are. The loss of the services of members of senior management or other key officers or our inability to attract additional qualified personnel as needed could materially harm our business.
Our reported financial results depend on management’s selection of accounting methods and certain assumptions and estimates.
Accounting policies and assumptions are fundamental to the reported financial condition and results of operations. Management must exercise judgment in selecting and applying many of these accounting policies and methods so they comply with generally accepted accounting principles and reflect management’s judgment of the most appropriate manner in which to report our financial condition and results. In some cases, management must select the accounting policy or method to apply from two or more alternatives, any of which may be reasonable under the circumstances, yet may result in reporting materially different results than would have been reported under a different alternative.
Certain accounting policies are critical to presenting our reported financial condition and results. They require management to make difficult, subjective or complex judgments about matters that are uncertain. Materially different amounts could be reported under different conditions or using different assumptions or estimates. These critical accounting policies include the valuation of securities, allowance for loan losses, valuation of OREO, valuation of stock based compensation, valuation of net deferred income tax asset, assessing and estimating contingencies, and revenue recognition. Because of the uncertainty of estimates involved in these matters, we may be required, among other things, to significantly increase the allowance for credit losses, sustain credit losses that are significantly higher than the reserve provided, recognize significant impairment on OREO, or permanently impair deferred tax assets.
While management continually monitors and improves our system of internal controls, data processing systems, and corporate wide processes and procedures, we may suffer losses from operational risk in the future.
Management maintains internal operational controls, and we have invested in technology to help us process large volumes of transactions. However, we may not be able to continue processing at the same or higher levels of transactions. If our systems of internal controls should fail to work as expected, if our systems were to be used in an unauthorized manner, or if employees were to subvert the system of internal controls, significant losses could occur.
We process large volumes of transactions on a daily basis and are exposed to numerous types of operational risk, which could cause us to incur substantial losses. Operational risk resulting from inadequate or failed internal processes, people, and systems includes the risk of fraud by employees or persons outside of our company, the execution of unauthorized transactions by employees, errors relating to transaction processing and systems, and breaches of the internal control system and compliance requirements. This risk of loss also includes potential legal actions that could arise as a result of the operational deficiency or as a result of noncompliance with applicable regulatory standards.
We establish and maintain systems of internal operational controls that provide management with timely and accurate information about our level of operational risk. While not foolproof, these systems have been designed to manage operational risk at appropriate, cost effective levels. We have also established procedures that are designed to ensure that policies relating to conduct, ethics and business practices are followed. Nevertheless, we experience loss from operational risk from time to time, including the effects of operational errors, and these losses may be substantial.
Our information systems may experience an interruption or security breach.
Failure in or breach of our operational or security systems or infrastructure, or those of our third party vendors and other service providers, including as a result of cyber attacks, could disrupt our businesses, result in the disclosure or misuse of confidential or proprietary information, damage our reputation, increase our costs and cause losses. As a financial institution, we depend on our ability to process, record and monitor a large number of customer transactions on a continuous basis. As customer, public and regulatory expectations regarding operational and information security have increased, our operational systems and infrastructure must continue to be safeguarded and monitored for potential failures, disruptions, and breakdowns. Our business, financial, accounting, data processing systems or other operating systems and facilities may stop operating properly or become disabled or damaged as a result of a number of factors including events that are wholly or partially beyond our control. For example, there could be sudden increases in customer transaction volume, electrical or telecommunications outages, natural disasters such as earthquakes, tornadoes, and hurricanes; disease pandemics, events arising from local or larger scale political or social matters, including terrorist acts, and, as described below, cyber attacks. Although we have business continuity plans and other safeguards in place, our business operations may be adversely affected by significant and widespread disruption to our physical infrastructure or operating systems that support our businesses and customers.
Information security risks for financial institutions have generally increased in recent years in part because of the proliferation of new technologies, the use of the Internet and telecommunications technologies to conduct financial transactions, and the increased sophistication and activities of organized crime, hackers, terrorists, activists, and other external parties. As noted above, our operations rely on the secure processing, transmission and storage of confidential information in our computer systems and networks. In addition, to access our products and services, our customers may use personal smartphones, tablet PC’s, and other mobile devices that are beyond our control systems. Although we believe we have appropriate information security procedures and controls, our technologies, systems, networks, and our customers’ devices may become the target of cyber attacks or information security breaches. These events could result in the unauthorized release, gathering, monitoring, misuse, loss or destruction of our customers’ confidential, proprietary and other information or that of our customers, or otherwise disrupt the business operations of ourselves, our customers or other third parties.
Third parties with which we do business or that facilitate our business activities, could also be sources of operational and information security risk to us, including from breakdowns or failures of their own systems or capacity constraints. Although to date we have not experienced any material losses relating to cyber attacks or other information security breaches, we can give no assurance that we will not suffer such losses in the future. Our risk and exposure to these matters remains heightened because of, among other things, the evolving nature of these threats and the prevalence of Internet and mobile banking. As cyber threats continue to evolve, we may be required to expend significant additional resources to continue to modify or enhance our protective measures or to investigate and remediate any information security vulnerabilities. Disruptions or failures in the physical infrastructure or operating systems that support our businesses and customers, or cyber attacks or security breaches of the networks, systems or devices that our customers use to access our products and services could result in customer attrition, regulatory fines, penalties or intervention, reputational damage, reimbursement or other compensation costs, and/or additional compliance costs, any of which could materially adversely affect our business, results of operations or financial condition.
We operate in a highly regulated environment and, as a result, are subject to extensive regulation and supervision that could adversely affect financial performance and ability to implement growth and operating strategies.
We are subject to examination, supervision and comprehensive regulation by federal and state regulatory agencies, as described under “Item 1 – Business-Supervision and Regulation.” Regulatory oversight of banks is primarily intended to protect depositors, the federal deposit insurance funds, and the banking system as a whole, and not our shareholders. Compliance with these regulations is costly and may make it more difficult to operate profitably.
Federal and state banking laws and regulations govern numerous matters including the payment of dividends, the acquisition of other banks, and the establishment of new banking offices. We must also meet specific regulatory capital requirements. Our failure to comply with these laws, regulations, and policies or to maintain required capital could affect our ability to pay dividends on common shares, our ability to grow through the development of new offices, make acquisitions, and remain independent. These limitations may prevent us from successfully implementing our growth and operating strategies.
In addition, the laws and regulations applicable to banks could change at any time, which could significantly impact our business and profitability. For example, new legislation or regulation could limit the manner in which we may conduct our business, including our ability to attract deposits and make loans. Events that may not have a direct impact on us, such as the bankruptcy or insolvency of a prominent U.S. corporation, can cause legislators and banking regulators and other agencies such as the Consumer Financial Protection Bureau, the SEC, the Public Company Accounting Oversight Board and various taxing authorities to respond by adopting and or proposing substantive revisions to laws, regulations, rules, standards, policies, and interpretations. The nature, extent, and timing of the adoption of significant new laws and regulations, or changes in or repeal of existing laws and regulations may have a material impact on our business and results of operations. Changes in regulation may cause us to devote substantial additional financial resources and management time to compliance, which may negatively affect our operating results.
Changes in banking laws could have a material adverse effect on us.
We are subject to changes in federal and state laws as well as changes in banking and credit regulations, and governmental economic and monetary policies. We cannot predict whether any of these changes could adversely and materially affect us. The current regulatory environment for financial institutions entails significant potential increases in compliance requirements and associated costs. Federal and state banking regulators also possess broad powers to take supervisory actions as they deem appropriate. These supervisory actions may result in higher capital requirements, higher insurance premiums and limitations on our activities that could have a material adverse effect on our business and profitability.
Recent legislation regarding the financial services industry may have a significant adverse effect on operations.
Enacted in July 2010, the Dodd-Frank Act has had a significant impact the U.S. financial system, including among other things:
|
● |
new requirements on banking, derivative and investment activities, including the repeal of the prohibition on the payment of interest on business demand accounts, and debit card interchange fee requirements; |
|
● |
the creation of the Consumer Financial Protection Bureau with supervisory authority, including the power to conduct examinations and take enforcement actions with respect to financial institutions with assets of $10 billion or more and implement regulations that will affect all financial institutions; |
|
● |
provisions affecting corporate governance and executive compensation of all companies subject to the reporting requirements of the Securities and Exchange Act of 1934, as amended; and |
|
● |
a provision requiring bank regulators to set minimum capital levels for bank holding companies that are as strong as those required for their insured depository subsidiaries, subject to a grandfather clause for holding companies with less than $15 billion in assets as of December 31, 2009. |
Some provisions in the Dodd-Frank Act remain subject to regulatory rule-making, implementation, and interpretation, the effects of which are not yet known. As a result, it is difficult to gauge the ultimate impact of certain provisions of the Dodd-Frank Act because the implementation of many concepts is left to regulatory agencies. For example, the CFPB is given the power to adopt new regulations to protect consumers and is given control over existing consumer protection regulations adopted by federal banking regulators. The CFPB has already adopted a number of regulations but it is not known at this time when additional rules will be finalized and implemented.
The provisions of the Dodd-Frank Act and any rules adopted to implement those provisions, as well as any additional legislative or regulatory changes may impact the profitability of our business activities and costs of operations, require that we change certain of our business practices, materially affect our business model or affect retention of key personnel, require us to raise additional regulatory capital, including additional Tier 1 capital, and could expose us to additional costs (including increased compliance costs). These and other changes may also require us to invest significant management attention and resources to make any necessary changes and may adversely affect our ability to conduct our business as previously conducted or our results of operations or financial condition.
|
Item 1B. |
Not applicable.
|
Item 2. |
The Bank operates 15 banking offices in Kentucky. The following table shows the location, square footage and ownership of each property. We believe that each of these locations is adequately insured. Support operations are located in our main office in Louisville and in Glasgow.
|
Markets |
|
Square Footage |
|
Owned/Leased |
||
|
Louisville/Jefferson, Bullitt and Henry Counties |
|
|
|
|
|
|
|
Main Office: 2500 Eastpoint Parkway, Louisville |
|
30,000 |
|
Owned |
|
|
|
Eminence Office: 646 Elm Street, Eminence |
|
1,500 |
|
Owned |
|
|
|
Hillview Office: 6890 North Preston Highway, Hillview |
|
3,500 |
|
Owned |
|
|
|
Pleasureville Office: 5440 Castle Highway, Pleasureville |
|
10,000 |
|
Owned |
|
|
|
Conestoga Office: 155 Conestoga Parkway, Shepherdsville |
|
3,900 |
|
Owned |
|
|
|
|
|
|
|
|
|
|
|
Lexington/Fayette County |
|
|
|
|
|
|
|
Lexington Office: 2424 Harrodsburg Road, Suite 100, Lexington |
|
8,500 |
|
Leased |
|
|
|
|
|
|
|
|
|
|
|
South Central Kentucky |
|
|
|
|
|
|
|
Brownsville Office: 113 East Main Cross Street, Brownsville |
|
8,500 |
|
Owned |
|
|
|
Greensburg Office: 202 North Main Street, Greensburg |
|
11,000 |
|
Owned |
|
|
|
Horse Cave Office: 201 East Main Street, Horse Cave |
|
5,000 |
|
Owned |
|
|
|
Morgantown Office: 112 West G.L. Smith Street, Morgantown |
|
7,500 |
|
Owned |
|
|
|
Munfordville Office: 949 South Dixie Highway, Munfordville |
|
9,000 |
|
Owned |
|
|
|
Beaver Dam Office: 1300 North Main Street, Beaver Dam |
|
3,200 |
|
Owned |
|
|
|
|
|
|
|
|
|
|
|
Owensboro/Daviess County |
|
|
|
|
|
|
|
Owensboro Office: 1819 Frederica Street, Owensboro |
|
3,000 |
|
Owned |
|
|
|
|
|
|
|
|
|
|
|
Southern Kentucky |
|
|
|
|
|
|
|
Campbell Lane Office: 751 Campbell Lane, Bowling Green |
|
7,500 |
|
Owned |
|
|
|
Glasgow Office: 1006 West Main Street, Glasgow |
|
12,000 |
|
Owned |
|
|
|
|
|
|
|
|
|
|
|
Other Properties |
|
|
|
|
|
|
|
Office Building: 701 Columbia Avenue, Glasgow |
|
19,000 |
|
Owned |
|
|
|
Item 3. |
We are defendants in various legal proceedings. Litigation is subject to inherent uncertainties and unfavorable outcomes could occur. See Note 16, “Off Balance Sheet Risks, Commitments, and Contingent Liabilities” in the Notes to our consolidated financial statements for detail regarding ongoing legal proceedings and other matters.
|
Item 4. |
Not applicable.
|
Item 5. |
Market for Registrant’s Common Equity, Related Stockholder Matters and Issuer Purchases of Equity Securities |
Market Information
Our common shares are traded on the Nasdaq Capital Market under the ticker symbol “PBIB”. The following table presents the high and low market closing prices per share for our common shares reported on the Nasdaq Capital Market for the periods indicated. The per share prices shown in the table have been adjusted for the 1-for-5 reverse stock split of our common shares that took effect on December 16, 2016.
|
2017 |
||||||||||||
|
Market Value |
||||||||||||
|
Quarter Ended |
High |
Low |
Dividend |
|||||||||
|
Fourth Quarter |
$ | 15.45 | $ | 11.42 | $ | 0.00 | ||||||
|
Third Quarter |
11.81 | 9.98 | 0.00 | |||||||||
|
Second Quarter |
10.49 | 8.73 | 0.00 | |||||||||
|
First Quarter |
12.75 | 9.14 | 0.00 | |||||||||
|
2016 |
||||||||||||
|
Market Value |
||||||||||||
|
Quarter Ended |
High |
Low |
Dividend |
|||||||||
|
Fourth Quarter |
$ | 12.90 | $ | 8.05 | $ | 0.00 | ||||||
|
Third Quarter |
8.55 | 7.70 | 0.00 | |||||||||
|
Second Quarter |
11.25 | 5.95 | 0.00 | |||||||||
|
First Quarter |
7.10 | 5.45 | 0.00 | |||||||||
As of January 31, 2018, we had approximately 1,664 shareholders, including 470 shareholders of record and approximately 1,194 beneficial owners whose shares are held in “street” name by securities broker-dealers or other nominees.
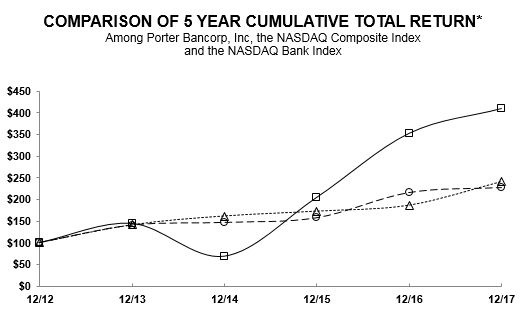
Dividends
As a bank holding company, our ability to declare and pay dividends depends on various federal regulatory considerations, including the guidelines of the Federal Reserve regarding capital adequacy and dividends.
Our principal source of revenue with which to pay dividends on our common shares are dividends the Bank may declare and pay out of funds legally available for payment of dividends. Currently, the Bank must obtain the prior written consent of its primary regulators prior to declaring or paying any dividends until retained earnings are positive. A Kentucky chartered bank may declare a dividend of an amount of the bank’s net profits as the board deems appropriate. The approval of the KDFI is required if the total of all dividends declared by a bank in any calendar year exceeds the total of its net profits for that year combined with its retained net profits for the preceding two years, less any required transfers to surplus or a fund for the retirement of preferred stock or debt. Under our Written Agreement, the prior approval of the Federal Reserve Bank of St. Louis is also required for the payment of any Bank dividends.
Effective with the third quarter of 2016, the Company resumed deferring interest payments on the junior subordinated notes underlying our trust preferred securities. Deferring interest payments on the junior subordinated notes resulted in the deferral of distributions on our trust preferred securities. If we defer interest payments on our trust preferred securities for 20 consecutive quarters, we must pay all deferred interest or we will be in default. Our deferral period expires after the second quarter of 2021.
We will not be able to pay cash dividends on our common shares until we have paid all deferred distributions on our trust preferred securities. Deferred distributions on trust preferred securities are cumulative, and distributions accrue and compound on each subsequent payment date. If we become subject to any liquidation, dissolution or winding up of affairs, holders of the trust preferred securities and then holders of our preferred shares will be entitled to receive the liquidation amounts to which they are entitled including the amount of any accrued and unpaid distributions and dividends, before any distribution can be made to the holders of common shares or preferred shares. Series E and Series F Preferred Shares have priority over our common shares and non-voting common shares with respect to any payment of dividends.
Purchase of Equity Securities by Issuer
During the fourth quarter of 2017, the Company did not repurchase any of its common shares, which is its only registered class of equity securities.
|
Item 6. |
The following table summarizes our selected historical consolidated financial data from 2013 to 2017. You should read this information in conjunction with Item 7. “Management’s Discussion and Analysis of Financial Condition and Results of Operations” and Item 8. “Financial Statements and Supplementary Data.”
Selected Consolidated Financial Data
|
As of and for the Years Ended December 31, |
||||||||||||||||||||
|
(Dollars in thousands except per share data) |
2017 |
2016 |
2015 |
2014 |
2013 |
|||||||||||||||
|
Income Statement Data: |
||||||||||||||||||||
|
Interest income |
$ | 37,522 | $ | 35,602 | $ | 36,574 | $ | 39,513 | $ | 43,228 | ||||||||||
|
Interest expense |
6,405 | 5,981 | 7,023 | 9,795 | 11,143 | |||||||||||||||
|
Net interest income |
31,117 | 29,621 | 29,551 | 29,718 | 32,085 | |||||||||||||||
|
Provision (negative provision) for loan losses |
(800 |
) |
(2,450 |
) |
(4,500 |
) |
7,100 | 700 | ||||||||||||
|
Non-interest income |
4,855 | 4,764 | 7,695 | 4,079 | 5,919 | |||||||||||||||
|
Non-interest expense |
30,218 | 39,567 | 44,959 | 39,435 | 38,890 | |||||||||||||||
|
Income (loss) before income taxes |
6,554 | (2,732 |
) |
(3,213 |
) |
(12,738 |
) |
(1,586 |
) |
|||||||||||
|
Income tax expense (benefit) |
(31,899 |
) |
21 | — | (1,583 |
) |
— | |||||||||||||
|
Net income (loss) |
38,453 | (2,753 |
) |
(3,213 |
) |
(11,155 |
) |
(1,586 |
) |
|||||||||||
|
Less: |
||||||||||||||||||||
|
Dividends and accretion on preferred stock |
— | — | — | 2,362 | 2,079 | |||||||||||||||
|
Effect of exchange of preferred stock for common stock |
— | — | — | (36,104 |
) |
— | ||||||||||||||
|
Earnings (loss) allocated to participating securities |
967 | (88 |
) |
(336 |
) |
3,159 | (267 |
) |
||||||||||||
|
Net income (loss) attributable to common |
$ | 37,486 | $ | (2,665 |
) |
$ | (2,877 |
) |
$ | 19,428 | $ | (3,398 |
) |
|||||||
|
Common Share Data: (1) |
||||||||||||||||||||
|
Basic earnings (loss) per common share |
$ | 6.15 | $ | (0.46 |
) |
$ | (0.62 |
) |
$ | 7.94 | $ | (1.44 |
) |
|||||||
|
Diluted earnings (loss) per common share |
6.15 | (0.46 |
) |
(0.62 |
) |
7.94 | (1.44 |
) |
||||||||||||
|
Cash dividends declared per common share |
— | — | — | — | — | |||||||||||||||
|
Book value per common share (2) |
11.17 | 4.81 | 5.43 | 8.37 | (0.92 |
) |
||||||||||||||
|
Tangible book value per common share (2) |
11.17 | 4.79 | 5.33 | 8.05 | (1.46 |
) |
||||||||||||||
|
Balance Sheet Data (at period end): |
||||||||||||||||||||
|
Total assets |
$ | 970,801 | $ | 945,177 | $ | 948,722 | $ | 1,017,989 | $ | 1,076,121 | ||||||||||
|
Debt obligations: |
||||||||||||||||||||
|
FHLB advances |
11,797 | 22,458 | 3,081 | 15,752 | 4,492 | |||||||||||||||
|
Junior subordinated debentures |
21,000 | 21,000 | 21,000 | 25,000 | 25,000 | |||||||||||||||
|
Subordinated capital note |
2,250 | 3,150 | 4,050 | 4,950 | 5,850 | |||||||||||||||
|
Senior debt |
10,000 | — | — | — | — | |||||||||||||||
|
Average Balance Data: |
||||||||||||||||||||
|
Average assets |
$ | 947,961 | $ | 929,140 | $ | 984,419 | $ | 1,049,232 | $ | 1,098,400 | ||||||||||
|
Average loans |
667,474 | 621,275 | 635,948 | 662,442 | 788,176 | |||||||||||||||
|
Average deposits |
864,278 | 852,717 | 907,785 | 961,671 | 1,004,052 | |||||||||||||||
|
Average FHLB advances |
9,184 | 2,967 | 3,473 | 4,473 | 4,990 | |||||||||||||||
|
Average junior subordinated debentures |
21,000 | 21,000 | 23,981 | 25,000 | 25,000 | |||||||||||||||
|
Average subordinated capital note |
2,805 | 3,708 | 4,608 | 5,508 | 6,404 | |||||||||||||||
|
Average senior debt |
5,068 | — | — | — | — | |||||||||||||||
|
Average stockholders’ equity |
37,851 | 39,423 | 33,083 | 33,881 | 42,631 | |||||||||||||||
|
(1) |
On December 16, 2016, the Company completed a 1-for-5 reverse stock split of its issued and outstanding common and non-voting common shares. As a result of the reverse stock split, all share and per share data has been adjusted in the accompanying tables. Preferred shares were not impacted by the 1-for-5 reverse stock split. |
|
(2) |
After shareholder approval on February 25, 2015, our two series of mandatorily convertible preferred shares converted into a total of 810,720 common shares and 1,291,600 non-voting common shares. |
Item 7. Management’s Discussion and Analysis of Financial Condition and Results of Operation
Management’s discussion and analysis of financial condition and results of operations analyzes the consolidated financial condition and results of operations of Porter Bancorp, Inc. (the “Company”) and its wholly owned subsidiary, Limestone Bank, Inc. (the “Bank”). The Bank completed a name change from PBI Bank to Limestone Bank on February 20, 2018. The Company is a Louisville, Kentucky-based bank holding company that operates banking offices of the Bank in twelve Kentucky counties. Our markets include metropolitan Louisville in Jefferson County and the surrounding counties of Henry and Bullitt. We serve south central Kentucky and southern Kentucky from banking offices in Butler, Green, Hart, Edmonson, Barren, Warren, Ohio, and Daviess Counties. We also have an office in Lexington, the second largest city in Kentucky. The Bank is a community bank with a wide range of commercial and personal banking products.
Historically, we have focused on commercial and commercial real estate lending, both in markets where we have banking offices and other growing markets in our region. Commercial, commercial real estate and real estate construction loans accounted for 58.4% of our total loan portfolio as of December 31, 2017, and 55.6% as of December 31, 2016. Commercial lending generally produces higher yields than residential lending, but involves greater risk and requires more rigorous underwriting standards and credit quality monitoring.
The following discussion should be read in conjunction with our consolidated financial statements and accompanying notes and other schedules presented elsewhere in the report.
Overview
For the year ended December 31, 2017, the Company reported net income of $38.5 million compared with net loss of $2.8 million for the year ended December 31, 2016 and a net loss of $3.2 million for the year ended December 31, 2015. After allocating earnings to participating securities, net income attributable to common shareholders was $37.5 million for the year ended December 31, 2017, compared with net loss attributable to common shareholders of $2.7 million for the year ended December 31, 2016, and a net loss attributable to common shareholders of $2.9 million for the year ended December 31, 2015. Basic and diluted income per common share were $6.15 for the year ended December 31, 2017, compared with net loss per common share of ($0.46) for 2016, and net loss per common share of ($0.62) for 2015.
The following significant items are of note for the year ended December 31, 2017:
|
● |
The Company has had a full valuation allowance against its net deferred tax asset since 2011. The ability to utilize the net deferred tax asset depends upon generating sufficient future levels of taxable income. The determination to restore a deferred tax asset and eliminate a valuation allowance depends upon the evaluation of both positive and negative evidence regarding the likelihood of achieving sufficient future taxable income levels. During the fourth quarter of 2017, management concluded it was more-likely-than-not the asset would be utilized to reduce future taxes payable related to the future taxable income of the Company, and as such, reversed the valuation allowance. As a result of the conclusion to reverse the valuation allowance, the Company recorded an income tax benefit of $54.0 million for the year ended December 31, 2017. On December 22, 2017, the Tax Cuts and Jobs Act of 2017 was signed into law. Among other significant changes to the tax code, the new law lowered the federal corporate tax rate from 35% to 21% beginning in 2018. As a result, the Company revalued its net deferred tax asset at the new 21% rate. Due to this revaluation, the Company recorded a $20.3 million charge to income tax expense for the year ended December 31, 2017. The combination of the reversal of the valuation allowance and the change in federal corporate tax rates, as well as income tax expense for the year, resulted in an income tax benefit of $31.9 million for the year ended December 31, 2017. |
|
● |
The Bank is no longer subject to a consent order with the Federal Deposit Insurance Corporation and Kentucky Department of Financial Institutions. We were notified that the Bank’s prior consent order was terminated, effective October 31, 2017. |
|
● |
Loan growth outpaced paydowns during the period. Average loans receivable increased approximately $46.2 million or 7.4% to $667.5 million for the year ended December 31, 2017, compared with $621.3 million for the year ended December 31, 2016. This resulted in an increase in interest revenue volume of approximately $2.2 million, which was offset by rate decreases of $895,000 for the year ended December 31, 2017, compared with the year ended December 31, 2016. |
|
● |
Net interest margin increased six basis points to 3.48% for the year ended 2017 compared with 3.42% in the year ended December 31, 2016. The increase in margin between periods was primarily due to an increase in the rate of interest earned on interest earning assets from 4.11% in 2016 to 4.18% in 2017. |
|
● |
Negative provision for loan losses expense was $800,000 in 2017, compared to a negative provision for loan losses expense of $2.5 million for 2016, because of declining historical loss rates, improvements in loan quality, and management’s assessment of risk in the loan portfolio. Net loan recoveries were $35,000 for 2017, compared to net loan charge-offs of $624,000 for 2016 and $2.8 million for 2015. In the following paragraphs, we discuss the improving trends in non-performing loans, past due loans, and loan risk categories during the period, factors that led to the negative provision expense. |
|
● |
Non-performing loans decreased $3.8 million to $5.5 million at December 31, 2017, compared with $9.2 million at December 31, 2016. The decrease in non-performing loans was due to $5.0 million in paydowns, $665,000 in charge-offs, $199,000 in loans returned to accrual status, and $270,000 in transfers to OREO, offset by $2.3 million in loans placed on non-accrual. |
|
● |
Loans past due 30-59 days decreased from $2.3 million at December 31, 2016 to $1.5 million at December 31, 2017, and loans past due 60-89 days decreased from $315,000 at December 31, 2016 to $171,000 at December 31, 2017. Loans past due 90 days or more totaled $1,000 at December 31, 2017, compared to no loans past due 90 days or more at December 31, 2016. Total loans past due and nonaccrual loans decreased to $7.1 million at December 31, 2017 from $11.8 million at December 31, 2016. |
|
● |
All loan risk categories (other than pass loans) have decreased since December 31, 2016. Pass loans represent 94.5% of the portfolio at December 31, 2017, compared to 91.7% at December 31, 2016 and 83.6% at December 31, 2015. During 2017, the pass category increased approximately $86.6 million, the watch category declined approximately $4.7 million, the special mention category declined approximately $333,000, and the substandard category declined approximately $8.7 million. The $8.7 million decrease in loans classified as substandard was driven by $6.8 million in principal payments received, $270,000 in migration to OREO, $4.6 million in loans upgraded from substandard, and $790,000 in charge-offs, offset by $3.7 million in loans moved to substandard during 2017. |
|
● |
Foreclosed properties were $4.4 million at December 31, 2017, compared with $6.8 million at December 31, 2016. During the year ended December 31, 2017, the Company acquired $270,000 and sold $793,000 of OREO. We incurred OREO losses totaling $2.0 million during the year ended December 31, 2017, reflecting fair value write-downs for updated appraisals, changes in marketing strategies, and reductions in listing prices for certain properties, offset by $74,000 in net gain on sales of OREO. |
|
● |
Non-performing assets decreased to $9.9 million or 1.02% of total assets at December 31, 2017, compared with $16.0 million or 1.70% of total assets at December 31, 2016. In addition, accruing troubled debt restructurings declined to $1.2 million at December 31, 2017 from $5.4 million at December 31, 2016. |
|
● |
Non-interest income increased by $91,000 in 2017 to $4.9 million compared with $4.8 million for the year ended December 31, 2016. This increase was primarily attributable to a $295,000 increase in service charges on deposit accounts, a $123,000 increase in bank card interchange fees, and a $72,000 increase in net gain on sale of securities partially offset by no OREO income during 2017, compared to $456,000 during 2016. |
|
● |
Non-interest expense for the year ended December 31, 2017 of $30.2 million represented a 23.6% decrease from $39.6 million for 2016. The decrease in non-interest expense was attributable primarily to a decrease in litigation and loan collection expense, which decreased $8.6 million. Litigation expense was negatively impacted in 2016 by a ruling from the Kentucky Court of Appeals against the Bank that approximated $8.0 million. Non-interest expense also benefited from a $590,000 decrease in professional fees, a $418,000 decrease in salaries and employee benefits, and a $248,000 decrease in FDIC insurance. |
|
● |
Deposits decreased $2.9 million or 0.3% to $847.0 million at December 31, 2017 compared with $849.9 million at December 31, 2016. Certificate of deposit balances decreased $20.4 million during 2017 to $424.2 million at December 31, 2017, from $444.6 million at December 31, 2016. Non-interest bearing demand deposits increased $13.0 million or 10.4% during 2017 to $137.4 million compared with $124.4 million at December 31, 2016. Money market accounts increased $8.9 million or 6.2% during 2017 to $151.4 million compared with $142.5 million at December 31, 2016. |
|
● |
On June 30, 2017, the Company entered into a $10.0 million senior secured loan agreement with a commercial bank. The loan matures on June 30, 2022. Interest is payable quarterly at a rate of three-month LIBOR plus 250 basis points through June 30, 2020, at which time quarterly principal payments of $250,000 plus interest will commence. The loan is secured by a first priority pledge of 100% of the issued and outstanding stock of the Bank. The Company may prepay any amount due under the promissory note at any time without premium or penalty. The Company contributed $9.0 million of the borrowing proceeds to the Bank as common equity Tier 1 capital. The remaining $1.0 million of the borrowing proceeds was retained by the lender in escrow to service quarterly interest payments. At December 31, 2017, the escrow account had a balance of $806,000. |
These items are discussed in further detail throughout this Item 7.
Application of Critical Accounting Policies
The Company’s accounting and reporting policies comply with GAAP and conform to general practices within the banking industry. We believe that the following significant accounting policies may involve a higher degree of management assumptions and judgments that could result in materially different amounts to be reported if conditions or underlying circumstances were to change.
Allowance for Loan Losses – The Bank maintains an allowance for loan losses believed to be sufficient to absorb probable incurred credit losses existing in the loan portfolio. The Board of Directors evaluates the adequacy of the allowance for loan losses on a quarterly basis. We evaluate the adequacy of the allowance using, among other things, historical loan loss experience, known and inherent risks in the portfolio, adverse situations that may affect the borrower’s ability to repay, estimated value of the underlying collateral and current economic conditions and trends. The allowance may be allocated for specific loans or loan categories, but the entire allowance is available for any loan. The allowance consists of specific and general components. The specific component relates to loans that are individually evaluated and measured for impairment. The general component is based on historical loss experience adjusted for qualitative environmental factors. We develop allowance estimates based on actual loss experience adjusted for current economic conditions and trends. Allowance estimates are a prudent measurement of the risk in the loan portfolio applied to individual loans based on loan type. If the mix and amount of future charge-off percentages differ significantly from the assumptions used by management in making its determination, we may be required to materially increase our allowance for loan losses and provision for loan losses, which could adversely affect our results.
Other Real Estate Owned – OREO is real estate acquired as a result of foreclosure or by deed in lieu of foreclosure. It is classified as real estate owned until such time as it is sold. OREO is recorded at its fair market value less estimated cost to sell. Any write-down of the property at the time of acquisition is charged to the allowance for loan losses. Costs incurred in order to perfect the lien prior to foreclosure may be capitalized if the fair value less the cost to sell exceeds the balance of the loan at the time of transfer to OREO. Examples of eligible costs to be capitalized are payments of delinquent property taxes to clear tax liens or payments to contractors and subcontractors to clear mechanics’ liens. Fair value of OREO is determined on an individual property basis. To determine the fair value of OREO for smaller dollar single family homes, we consult with staff from the Bank’s special assets group as well as external realtors and appraisers. If the internally evaluated market price is below our underlying investment in the property, appropriate write-downs are taken. For larger dollar residential and commercial real estate properties, we obtain a new appraisal of the subject property or have staff from our special assets group evaluate the latest in-file appraisal in connection with the transfer to OREO. We typically obtain updated appraisals within five quarters of the anniversary date of ownership unless a sale is imminent. Subsequent reductions in fair value are recorded as non-interest expense when a new appraisal indicates a decline in value or in cases where a listing price is lowered below the appraised amount.
Stock-based Compensation – Compensation cost is recognized for restricted stock awards issued to employees, based on the fair value of these awards at the date of grant. The market price of the Company’s common shares at the date of grant is used for restricted stock awards. Compensation cost is recognized over the required service period, generally defined as the vesting period. For awards with graded vesting, compensation cost is recognized on a straight-line basis over the requisite service period for the entire award.
Valuation of Deferred Tax Asset – We evaluate deferred tax assets for impairment on a quarterly basis. We established a 100% deferred tax valuation allowance in December 2011 based upon the analysis of our past performance and our expected future performance. The Company’s ability to utilize the net deferred tax asset depends upon generating suffient future levels of taxable income. The determination to restore a deferred tax asset and eliminate a valuation allowance depends upon the evaluation of both positive and negative evidence regarding the likelihood of achieving future taxable income levels. In 2017, management concluded it was more-likely-than-not the asset would be utilized to reduce future taxes payable related to the future taxable income of the Company, and as such, reversed the valuation allowance.
Contingencies – We are defendants in various legal proceedings. We record contingent liabilities resulting from claims against us when a loss is assessed to be probable and the amount of the loss is reasonably estimable. Assessing probability of loss and estimating probable losses requires analysis of multiple factors, including in some cases judgments about the potential actions of third party claimants and courts. Recorded contingent liabilities are based on the best information available and actual losses in any future period are inherently uncertain.
Results of Operations
The following table summarizes components of income and expense and the change in those components for 2017 compared with 2016:
|
For the Years Ended December 31, |
Change from Prior Period |
|||||||||||||||
|
2017 |
2016 |
Amount |
Percent |
|||||||||||||
|
(dollars in thousands) |
||||||||||||||||
|
Gross interest income |
$ | 37,522 | $ | 35,602 | $ | 1,920 | 5.4 |
% |
||||||||
|
Gross interest expense |
6,405 | 5,981 | 424 | 7.1 | ||||||||||||
|
Net interest income |
31,117 | 29,621 | 1,496 | 5.1 | ||||||||||||
|
Provision (negative provision) for loan losses |
(800 |
) |
(2,450 |
) |
1,650 | 67.3 | ||||||||||
|
Non-interest income |
4,567 | 4,548 | 19 | 0.4 | ||||||||||||
|
Gains on sale of securities, net |
288 | 216 | 72 | 33.3 | ||||||||||||
|
Non-interest expense |
30,218 | 39,567 | (9,349 |
) |
(23.6 |
) |
||||||||||
|
Net income (loss) before taxes |
6,554 | (2,732 |
) |
9,286 | 339.9 | |||||||||||
|
Income tax expense (benefit) |
(31,899 |
) |
21 | (31,920 |
) |
NM | ||||||||||
|
Net income (loss) |
38,453 | (2,753 |
) |
41,206 | NM | |||||||||||
|
Earnings (losses) attributable to participating securities |
967 | (88 |
) |
1,055 | NM | |||||||||||
|
Net income (loss) attributable to common shareholders |
37,486 | (2,665 |
) |
40,151 | NM | |||||||||||
NM: Not Meaningful
Net income of $38.5 million for the year ended December 31, 2017 increased by $41.2 million from a net loss of $2.8 million for 2016. During the period, improving trends in non-performing loans, past due loans, and loan risk categories continued. In addition, net income for 2017 was impacted by the reversal of the Company’s deferred tax asset valuation allowance and the change in federal corporate tax rates in connection with the enactment of the Tax Cuts and Jobs Act of 2017. The net result of these two items, as well as income tax expense for the year, was an income tax benefit of $31.9 million for 2017. A negative provision for loan losses expense of $800,000 was recorded during 2017, compared to $2.5 million negative provision for loan losses expense for 2016. Non-interest income increased $19,000 during 2017. There was an increase of $295,000 in service charges on deposit accounts, $123,000 in bank card interchange fees, and $62,000 in other non-interest income which was offset by no OREO income during 2017, compared to $456,000 during 2016. Non-interest expense decreased $9.3 million during 2017 due primarily to a decrease in litigation and loan collection expense of $8.6 million as 2016 was negatively impacted by a ruling from the Kentucky Court of Appeals against the Bank that approximated $8.0 million. After consideration of earnings attributable to participating securities, net income attributable to common shareholders was $37.5 million for the year ended December 31, 2017, as compared to net loss attributable to common shareholders of $2.7 million for 2016.
The following table summarizes components of income and expense and the change in those components for 2016 compared with 2015:
|
For the Years Ended December 31, |
Change from Prior Period |
|||||||||||||||
|
2016 |
2015 |
Amount |
Percent |
|||||||||||||
|
(dollars in thousands) |
||||||||||||||||
|
Gross interest income |
$ | 35,602 | $ | 36,574 | $ | (972 |
) |
(2.7 |
)% |
|||||||
|
Gross interest expense |
5,981 | 7,023 | (1,042 |
) |
(14.8 |
) |
||||||||||
|
Net interest income |
29,621 | 29,551 | 70 | 0.2 | ||||||||||||
|
Provision (negative provision) for loan losses |
(2,450 |
) |
(4,500 |
) |
(2,050 |
) |
(45.6 |
) |
||||||||
|
Non-interest income |
4,548 | 5,929 | (1,381 |
) |
(23.3 |
) |
||||||||||
|
Gains on sale of securities, net |
216 | 1,766 | (1,550 |
) |
(87.8 |
) |
||||||||||
|
Non-interest expense |
39,567 | 44,959 | (5,392 |
) |
(12.0 |
) |
||||||||||
|
Net loss before taxes |
(2,732 |
) |
(3,213 |
) |
481 | 15.0 | ||||||||||
|
Income tax expense |
21 | — | 21 | 100.0 | ||||||||||||
|
Net loss |
(2,753 |
) |
(3,213 |
) |
(460 |
) |
(14.3 |
) |
||||||||
|
Earnings (losses) attributable to participating securities |
(88 |
) |
(336 | ) | 248 | (73.8 |
) |
|||||||||
|
Net loss attributable to common shareholders |
(2,665 |
) |
(2,877 |
) |
(212 |
) |
(7.4 |
) |
||||||||
Net loss of $2.8 million for the year ended December 31, 2016 decreased by $460,000 from a net loss of $3.2 million for 2015. A negative provision for loan losses expense of $2.5 million was recorded for 2016 due to improvements in loan quality and management’s assessment of risk within the portfolio as compared to $4.5 million negative provision for loan losses expense for 2015. Non-interest income decreased $2.9 million during 2016 due primarily to a decrease in OREO rental income of $890,000 driven by the sale of income producing properties and a $1.6 million decrease in gains on the sale of securities compared to 2015. Non-interest expense decreased $5.4 million during 2016. OREO expense decreased by $10.8 million, but was offset by a $7.7 million increase in litigation and loan collection expense primarily resulting from the adverse Kentucky Court of Appeals ruling. After consideration of losses attributable to participating securities, net loss attributable to common shareholders was $2.7 million for the year ended December 31, 2016, as compared to net loss attributable to common shareholders of $2.9 million for 2015.
Net Interest Income – Net interest income was $31.1 million for the year ended December 31, 2017, an increase of $1.5 million, or 5.1%, compared with $29.6 million for the same period in 2016. Net interest spread and margin were 3.35% and 3.48%, respectively, for 2017, compared with 3.32% and 3.42%, respectively, for 2016. Average nonaccrual loans were $7.1 million and $11.4 million in 2017 and 2016, respectively.
Average interest-earning assets were $904.1 million for 2017, compared with $875.3 million for 2016, a 3.3% increase, primarily attributable to higher average loans and investment securities, partially offset by a decrease in interest bearing deposits with financial institutions. Average loans were $667.5 million for 2017, compared with $621.3 million for 2016, a 7.4% increase. Average investment securities were $193.1 million for 2017, compared with $183.7 million for 2016, a 5.1% increase. Average interest bearing deposits with financial institutions and fed funds sold were $36.2 million in 2017, compared with $62.9 million in 2016, a 42.4% decrease. Total interest income increased 5.4% to $37.5 million for 2017, compared with $35.6 million for 2016.
Average interest-bearing liabilities increased by 1.7% to $773.2 million for 2017, compared with $760.7 million for 2016. Our total interest expense increased by 7.1% to $6.4 million for 2017, compared with $6.0 million during 2016, due primarily to the completion of a $10.0 million senior debt transaction during 2017 as well as an increase in FHLB advances outstanding during 2017. Average volume of certificates of deposit decreased 2.9% to $452.4 million for 2017, compared with $466.0 million for 2016. The average interest rate paid on certificates of deposit increased to 0.93% for 2017, compared with 0.88% for 2016. Average volume of interest checking and money market deposit accounts increased 6.2% to $247.3 million for 2017, compared with $232.7 million for 2016. The average interest rate paid on interest checking and money market deposit accounts decreased to 0.38% for 2017, compared with 0.40% for 2016.
Net interest income was $29.6 million for the year ended December 31, 2016, an increase of $70,000, or 0.2%, compared with $29.6 million for the same period in 2015. Net interest spread and margin were 3.32% and 3.42%, respectively, for 2016, compared with 3.18% and 3.27%, respectively, for 2015. Average nonaccrual loans were $11.4 million and $29.0 million in 2016 and 2015, respectively.
Average interest-earning assets were $875.3 million for 2016, compared with $917.5 million for 2015, a 4.6% decrease, primarily attributable to lower average loans, investment securities and interest bearing deposits with financial institutions. Average loans were $621.3 million for 2016, compared with $635.9 million for 2015, a 2.3% decrease. Average investment securities were $183.7 million for 2016, compared with $194.1 million for 2015, a 5.3% decrease. Average interest bearing deposits with financial institutions were $62.3 million in 2016, compared with $78.9 million in 2015, a 21.0% decrease. Our total interest income decreased 2.7% to $35.6 million for 2016, compared with $36.6 million for 2015.
Average interest-bearing liabilities decreased by 8.0% to $760.7 million for 2016, compared with $826.9 million for 2015. Total interest expense decreased by 14.8% to $6.0 million for 2016, compared with $7.0 million during 2015, due primarily to lower interest rates paid on and lower volume of certificates of deposit. Average volume of certificates of deposit decreased 16.4% to $466.0 million for 2016, compared with $557.4 million for 2015. The average interest rate paid on certificates of deposit decreased to 0.88% for 2016, compared with 0.96% for 2015, as the result of continued re-pricing of certificates of deposit at maturity to lower interest rates. The average volume of interest checking and money market deposit accounts increased 15.7% to $232.7 million for 2016, compared with $201.2 million for 2015. The average interest rate paid on interest checking and money market deposit accounts increased to 0.40% for 2016, compared with 0.38% for 2015.
Average Balance Sheets
The following table sets forth the average daily balances, the interest earned or paid on such amounts, and the weighted average yield on interest-earning assets and weighted average cost of interest-bearing liabilities for the periods indicated. Dividing income or expense by the average daily balance of assets or liabilities, respectively, derives such yields and costs for the periods presented.
|
For the Years Ended December 31, |
||||||||||||||||||||||||
|
2017 |
2016 |
|||||||||||||||||||||||
|
Average Balance |
Interest Earned/Paid |
Average Yield/Cost |
Average Balance |
Interest Earned/Paid |
Average Yield/Cost |
|||||||||||||||||||
|
(dollars in thousands) |
||||||||||||||||||||||||
|
ASSETS |
||||||||||||||||||||||||
|
Interest-earning assets: |
||||||||||||||||||||||||
|
Loans receivables (1)(2) |
||||||||||||||||||||||||
|
Real estate |
$ | 509,133 | $ | 24,544 | 4.82 |
% |
$ | 493,068 | $ | 24,486 | 4.97 |
% |
||||||||||||
|
Commercial |
107,188 | 4,403 | 4.11 | 81,110 | 3,471 | 4.28 | ||||||||||||||||||
|
Consumer |
10,790 | 843 | 7.81 | 9,818 | 826 | 8.41 | ||||||||||||||||||
|
Agriculture |
39,839 | 2,047 | 5.14 | 36,811 | 1,733 | 4.71 | ||||||||||||||||||
|
Other |
524 | 29 | 5.53 | 468 | 21 | 4.49 | ||||||||||||||||||
|
U.S. Treasury and agencies |
31,440 | 694 | 2.21 | 34,049 | 757 | 2.22 | ||||||||||||||||||
|
Mortgage-backed securities |
94,451 | 2,240 | 2.37 | 101,249 | 2,240 | 2.21 | ||||||||||||||||||
|
Collateralized loan obligations |
20,242 | 541 | 2.67 | 802 | 28 | 3.49 | ||||||||||||||||||
|
State and political subdivision securities (non-taxable) (3) |
19,617 | 571 | 4.48 | 21,041 | 620 | 4.53 | ||||||||||||||||||
|
State and political subdivision securities (taxable) |
23,689 | 757 | 3.20 | 23,921 | 768 | 3.21 | ||||||||||||||||||
|
Corporate bonds |
3,651 | 167 | 4.57 | 2,656 | 93 | 3.50 | ||||||||||||||||||
|
FHLB stock |
7,323 | 366 | 5.00 | 7,323 | 293 | 4.00 | ||||||||||||||||||
|
Federal funds sold |
960 | 10 | 1.04 | 639 | 3 | 0.47 | ||||||||||||||||||
|
Interest-bearing deposits in other financial institutions |
35,222 | 310 | 0.88 | 62,307 | 263 | 0.42 | ||||||||||||||||||
|
Total interest-earning assets |
904,069 | 37,522 | 4.18 |
% |
875,262 | 35,602 | 4.11 |
% |
||||||||||||||||
|
Less: Allowance for loan losses |
(8,961 |
) |
(10,719 |
) |
||||||||||||||||||||
|
Non-interest-earning assets |
52,853 | 64,597 | ||||||||||||||||||||||
|
Total assets |
$ | 947,961 | $ | 929,140 | ||||||||||||||||||||
|
LIABILITIES AND STOCKHOLDERS’ EQUITY |
||||||||||||||||||||||||
|
Interest-bearing liabilities |
||||||||||||||||||||||||
|
Certificates of deposit and other time deposits |
$ | 452,443 | $ | 4,191 | 0.93 |
% |
$ | 466,007 | $ | 4,111 | 0.88 |
% |
||||||||||||
|
Interest checking and money market deposits |
247,261 | 940 | 0.38 | 232,717 | 921 | 0.40 | ||||||||||||||||||
|
Savings accounts |
35,486 | 59 | 0.17 | 34,257 | 61 | 0.18 | ||||||||||||||||||
|
FHLB advances |
9,184 | 120 | 1.31 | 2,967 | 70 | 2.36 | ||||||||||||||||||
|
Junior subordinated debentures |
23,805 | 901 | 3.78 | 24,708 | 818 | 3.31 | ||||||||||||||||||
|
Senior debt |
5,068 | 194 | 3.83 | — | — | — | ||||||||||||||||||
|
Total interest-bearing liabilities |
773,247 | 6,405 | 0.83 |
% |
760,656 | 5,981 | 0.79 |
% |
||||||||||||||||
|
Non-interest-bearing liabilities |
||||||||||||||||||||||||
|
Non-interest-bearing deposits |
129,088 | 119,736 | ||||||||||||||||||||||
|
Other liabilities |
7,775 | 9,325 | ||||||||||||||||||||||
|
Total liabilities |
910,110 | 889,717 | ||||||||||||||||||||||
|
Stockholders’ equity |
37,851 | 39,423 | ||||||||||||||||||||||
|
Total liabilities and stockholders’ equity |
$ | 947,961 | $ | 929,140 | ||||||||||||||||||||
|
Net interest income |
$ | 31,117 | $ | 29,621 | ||||||||||||||||||||
|
Net interest spread |
3.35 |
% |
3.32 |
% |
||||||||||||||||||||
|
Net interest margin |
3.48 |
% |
3.42 |
% |
||||||||||||||||||||
|
Ratio of average interest-earning assets to average interest-bearing liabilities |
116.92 |
% |
115.07 |
% |
||||||||||||||||||||
|
(1) |
Includes loan fees in both interest income and the calculation of yield on loans. |
|
(2) |
Calculations include non-accruing loans of $7.1 million and $11.4 million in average loan amounts outstanding. |
|
(3) |
Taxable equivalent yields are calculated assuming a 35% federal income tax rate. |
|
For the Years Ended December 31, |
||||||||||||||||||||||||
|
2016 |
2015 |
|||||||||||||||||||||||
|
Average Balance |
Interest Earned/Paid |
Average Yield/Cost |
Average Balance |
Interest Earned/Paid |
Average Yield/Cost |
|||||||||||||||||||
|
(dollars in thousands) |
||||||||||||||||||||||||
|
ASSETS |
||||||||||||||||||||||||
|
Interest-earning assets: |
||||||||||||||||||||||||
|
Loans receivables (1)(2) |
||||||||||||||||||||||||
|
Real estate |
$ | 493,068 | $ | 24,486 | 4.97 |
% |
$ | 516,605 | $ | 25,423 | 4.92 |
% |
||||||||||||
|
Commercial |
81,110 | 3,471 | 4.28 | 78,993 | 3,475 | 4.40 | ||||||||||||||||||
|
Consumer |
9,818 | 826 | 8.41 | 10,432 | 856 | 8.21 | ||||||||||||||||||
|
Agriculture |
36,811 | 1,733 | 4.71 | 29,395 | 1,470 | 5.00 | ||||||||||||||||||
|
Other |
468 | 21 | 4.49 | 523 | 27 | 5.16 | ||||||||||||||||||
|
U.S. Treasury and agencies |
34,049 | 757 | 2.22 | 31,269 | 684 | 2.19 | ||||||||||||||||||
|
Mortgage-backed securities |
101,249 | 2,240 | 2.21 | 107,277 | 2,420 | 2.26 | ||||||||||||||||||
|
Collateralized loan obligations |
802 | 28 | 3.49 | — | — | — | ||||||||||||||||||
|
State and political subdivision securities (non-taxable) (3) |
21,041 | 620 | 4.53 | 25,354 | 764 | 4.64 | ||||||||||||||||||
|
State and political subdivision securities (taxable) |
23,921 | 768 | 3.21 | 24,059 | 774 | 3.22 | ||||||||||||||||||
|
Corporate bonds |
2,656 | 93 | 3.50 | 6,116 | 155 | 2.53 | ||||||||||||||||||
|
FHLB stock |
7,323 | 293 | 4.00 | 7,323 | 293 | 4.00 | ||||||||||||||||||
|
Other debt securities |
— | — | — | 544 | 43 | 7.90 | ||||||||||||||||||
|
Federal funds sold |
639 | 3 | 0.47 | 752 | 1 | 0.13 | ||||||||||||||||||
|
Interest-bearing deposits in other financial institutions |
62,307 | 263 | 0.42 | 78,904 | 189 | 0.24 | ||||||||||||||||||
|
Total interest-earning assets |
875,262 | 35,602 | 4.11 |
% |
917,546 | 36,574 | 4.03 |
% |
||||||||||||||||
|
Less: Allowance for loan losses |
(10,719 |
) |
(17,154 |
) |
||||||||||||||||||||
|
Non-interest-earning assets |
64,597 | 84,027 | ||||||||||||||||||||||
|
Total assets |
$ | 929,140 | $ | 984,419 | ||||||||||||||||||||
|
LIABILITIES AND STOCKHOLDERS’ EQUITY |
||||||||||||||||||||||||
|
Interest-bearing liabilities |
||||||||||||||||||||||||
|
Certificates of deposit and other time deposits |
$ | 466,007 | $ | 4,111 | 0.88 |
% |
$ | 557,441 | $ | 5,329 | 0.96 |
% |
||||||||||||
|
Interest checking and money market deposits |
232,717 | 921 | 0.40 | 201,164 | 756 | 0.38 | ||||||||||||||||||
|
Savings accounts |
34,257 | 61 | 0.18 | 35,604 | 75 | 0.21 | ||||||||||||||||||
|
Federal funds purchased and repurchase agreements |
— | — | — | 587 | 1 | 0.17 | ||||||||||||||||||
|
FHLB advances |
2,967 | 70 | 2.36 | 3,473 | 95 | 2.74 | ||||||||||||||||||
|
Junior subordinated debentures |
24,708 | 818 | 3.31 | 28,589 | 767 | 2.68 | ||||||||||||||||||
|
Total interest-bearing liabilities |
760,656 | 5,981 | 0.79 |
% |
826,858 | 7,023 | 0.85 |
% |
||||||||||||||||
|
Non-interest-bearing liabilities |
||||||||||||||||||||||||
|
Non-interest-bearing deposits |
119,736 | 113,576 | ||||||||||||||||||||||
|
Other liabilities |
9,325 | 10,902 | ||||||||||||||||||||||
|
Total liabilities |
889,717 | 951,336 | ||||||||||||||||||||||
|
Stockholders’ equity |
39,423 | 33,083 | ||||||||||||||||||||||
|
Total liabilities and stockholders’ equity |
$ | 929,140 | $ | 984,419 | ||||||||||||||||||||
|
Net interest income |
$ | 29,621 | $ | 29,551 | ||||||||||||||||||||
|
Net interest spread |
3.32 |
% |
3.18 |
% |
||||||||||||||||||||
|
Net interest margin |
3.42 |
% |
3.27 |
% |
||||||||||||||||||||
|
Ratio of average interest-earning assets to average interest-bearing liabilities |
115.07 |
% |
110.97 |
% |
||||||||||||||||||||
|
(1) |
Includes loan fees in both interest income and the calculation of yield on loans. |
|
(2) |
Calculations include non-accruing loans of $11.4 million and $29.0 million in average loan amounts outstanding. |
|
(3) |
Taxable equivalent yields are calculated assuming a 35% federal income tax rate. |
Rate/Volume Analysis
The table below sets forth information regarding changes in interest income and interest expense for the periods indicated. For each category of interest-earning assets and interest-bearing liabilities, information is provided on changes attributable to (1) changes in rate (changes in rate multiplied by old volume); (2) changes in volume (changes in volume multiplied by old rate); and (3) changes in rate-volume (change in rate multiplied by change in volume). Changes in rate-volume are proportionately allocated between rate and volume variance.
|
Year Ended December 31, 2017 vs. 2016 |
Year Ended December 31, 2016 vs. 2015 |
|||||||||||||||||||||||
|
Increase (decrease) due to change in |
Increase (decrease) due to change in |
|||||||||||||||||||||||
|
Rate |
Volume |
Net Change |
Rate |
Volume |
Net Change |
|||||||||||||||||||
|
(in thousands) |
||||||||||||||||||||||||
|
Interest-earning assets: |
||||||||||||||||||||||||
|
Loan receivables |
$ | (895 |
) |
$ | 2,224 | $ | 1,329 | $ | 7 | $ | (721 |
) |
$ | (714 |
) |
|||||||||
|
U.S. Treasury and agencies |
(5 |
) |
(58 |
) |
(63 |
) |
11 | 62 | 73 | |||||||||||||||
|
Mortgage-backed securities |
155 | (155 |
) |
— | (46 |
) |
(134 |
) |
(180 |
) |
||||||||||||||
|
Collateralized loan obligations |
(9 |
) |
522 | 513 | — | 28 | 28 | |||||||||||||||||
|
State and political subdivision securities |
(9 |
) |
(51 |
) |
(60 |
) |
(13 |
) |
(137 |
) |
(150 |
) |
||||||||||||
|
Corporate bonds |
33 | 41 | 74 | 126 | (188 |
) |
(62 |
) |
||||||||||||||||
|
FHLB stock |
73 | — | 73 | — | — | — | ||||||||||||||||||
|
Other debt securities |
— | — | — | — | (43 |
) |
(43 |
) |
||||||||||||||||
|
Federal funds sold |
4 | 3 | 7 | 2 | — | 2 | ||||||||||||||||||
|
Interest-bearing deposits in other financial institutions |
196 | (149 |
) |
47 | 102 | (28 |
) |
74 | ||||||||||||||||
|
Total increase (decrease) in interest income |
(457 |
) |
2,377 | 1,920 | 189 | (1,161 |
) |
(972 |
) |
|||||||||||||||
|
Interest-bearing liabilities: |
||||||||||||||||||||||||
|
Certificates of deposit and other time deposits |
202 | (122 |
) |
80 | (390 |
) |
(828 |
) |
(1,218 |
) |
||||||||||||||
|
Interest checking and money market accounts |
(37 |
) |
56 | 19 | 42 | 123 | 165 | |||||||||||||||||
|
Savings accounts |
(4 |
) |
2 | (2 |
) |
(11 |
) |
(3 |
) |
(14 |
) |
|||||||||||||
|
Federal funds purchased and repurchase agreements |
— | — | — | — | (1 |
) |
(1 |
) |
||||||||||||||||
|
FHLB advances |
(42 |
) |
92 | 50 | (12 |
) |
(13 |
) |
(25 |
) |
||||||||||||||
|
Junior subordinated debentures |
114 | (31 |
) |
83 | 164 | (113 |
) |
51 | ||||||||||||||||
|
Senior debt |
— | 194 | 194 | — | — | — | ||||||||||||||||||
|
Total increase (decrease) in interest expense |
233 | 191 | 424 | (207 |
) |
(835 |
) |
(1,042 |
) |
|||||||||||||||
|
Increase (decrease) in net interest income |
$ | (690 | ) | $ | 2,186 | $ | 1,496 | $ | 396 | $ | (326 |
) |
$ | 70 | ||||||||||
Non-interest Income – The following table presents for the periods indicated the major categories of non-interest income:
|
For the Years Ended December 31, |
||||||||||||
|
2017 |
2016 |
2015 |
||||||||||
|
(in thousands) |
||||||||||||
|
Service charges on deposit accounts |
$ | 2,253 | $ | 1,958 | $ | 1,851 | ||||||
|
Bank card interchange fees |
972 | 849 | 839 | |||||||||
|
Income from bank owned life insurance |
412 | 417 | 295 | |||||||||
|
Net gain on sales and calls of securities |
288 | 216 | 1,766 | |||||||||
|
Other real estate owned rental income |
— | 456 | 1,346 | |||||||||
|
Gain on extinguishment of junior subordinated debt |
— | — | 883 | |||||||||
|
Other |
930 | 868 | 715 | |||||||||
|
Total non-interest income |
$ | 4,855 | $ | 4,764 | $ | 7,695 | ||||||
Non-interest income increased by $91,000 in 2017 to $4.9 million compared with $4.8 million for the year ended December 31, 2016. This increase was primarily attributable to a $295,000 increase in service charges on deposit accounts, a $123,000 increase in bank card interchange fees, and a $72,000 increase in net gain on sale of securities partially offset by no OREO income during 2017, compared to $456,000 during 2016.
Non-interest income decreased by $2.9 million in 2016 to $4.8 million compared with $7.7 million for the year ended December 31, 2015 driven primarily by a decline in gains on the sales of securities from $1.8 million in 2015 to $216,000 in 2016, as well as a decrease in OREO rental income of $890,000 between the two periods as a result of income producing properties being sold. Non-interest income for 2015 was also positively impacted by an $883,000 gain on extinguishment of junior subordinated debt.
Non-interest Expense – The following table presents the major categories of non-interest expense:
|
For the Years Ended December 31, |
||||||||||||
|
2017 |
2016 |
2015 |
||||||||||
|
(in thousands) |
||||||||||||
|
Salary and employee benefits |
$ | 15,090 | $ | 15,508 | $ | 15,857 | ||||||
|
Occupancy and equipment |
3,420 | 3,517 | 3,449 | |||||||||
|
FDIC insurance |
1,412 | 1,660 | 2,212 | |||||||||
|
Data processing expense |
1,256 | 1,185 | 1,128 | |||||||||
|
Marketing expense |
1,098 | 973 | 560 | |||||||||
|
State franchise and deposit tax |
956 | 965 | 1,120 | |||||||||
|
Professional fees |
978 | 1,568 | 2,885 | |||||||||
|
Communications |
722 | 706 | 663 | |||||||||
|
Insurance expense |
540 | 565 | 589 | |||||||||
|
Postage and delivery |
395 | 359 | 400 | |||||||||
|
Litigation and loan collection expense |
179 | 8,805 | 1,141 | |||||||||
|
Other real estate owned expense |
1,973 | 1,541 | 12,302 | |||||||||
|
Other |
2,199 | 2,215 | 2,653 | |||||||||
|
Total non-interest expense |
$ | 30,218 | $ | 39,567 | $ | 44,959 | ||||||
Non-interest expense for the year ended December 31, 2017 of $30.2 million represented a 23.6% decrease from $39.6 million for 2016. The decrease in non-interest expense was attributable primarily to a decrease in litigation and loan collection expense, which decreased $8.6 million. Litigation expense was negatively impacted in 2016 by a ruling from the Kentucky Court of Appeals against the Bank that approximated $8.0 million. Non-interest expense also benefited from a $590,000 decrease in professional fees, a $418,000 decrease in salaries and employee benefits, and a $248,000 decrease in FDIC insurance. As shown below, expenses related to OREO trended higher due to higher valuation adjustment writedowns during 2017 compared to 2016.
|
2017 |
2016 |
|||||||
|
(in thousands) |
||||||||
|
Net gain on sales |
$ | (74 |
) |
$ | (222 |
) |
||
|
Provision to allowance for declining market values |
1,963 | 1,180 | ||||||
|
Operating expense |
84 | 583 | ||||||
|
Total |
$ | 1,973 | $ | 1,541 | ||||
During the year ended December 31, 2017, fair value write-downs of $2.0 million were recorded compared with $1.2 million for the year ended December 31, 2016. The 2017 write-downs reflect declines in the fair value due to updated appraisals, changes in marketing strategies, and reductions in listing prices for certain properties. We were successful in selling OREO totaling $793,000 and $12.7 million during 2017 and 2016, respectively.
Non-interest Expense Comparison – 2016 to 2015
Non-interest expense for the year ended December 31, 2016 of $39.6 million represented a 12.0% decrease from $45.0 million for 2015. The decrease in non-interest expense was attributable primarily to decreases in OREO expenses and professional fees, offset by increases in litigation and loan collection expense as a result of the Kentucky Court of Appeals ruling against the Bank. As shown below, expenses related to OREO trended lower as the size of the portfolio significantly declined.
|
2016 |
2015 |
|||||||
|
(in thousands) |
||||||||
|
Net (gain) loss on sales |
$ | (222 |
) |
$ | 74 | |||
|
Provision to allowance for declining market values |
1,180 | 9,855 | ||||||
|
Operating expense |
583 | 2,373 | ||||||
|
Total |
$ | 1,541 | $ | 12,302 | ||||
During the year ended December 31, 2016, fair value write-downs of $1.2 million were recorded compared with $9.9 million for the year ended December 31, 2015. The write-downs reflect declines in the fair value and include reductions in listing prices for certain properties, updated appraisals, and sales of certain properties through auctions. We were successful in selling OREO totaling $12.7 million and $22.6 million during 2016 and 2015, respectively.
Income Tax Expense and Benefit – Effective tax rates differ from the federal statutory rate of 35% applied to income (loss) before income taxes due to the following:
|
2017 |
2016 |
2015 |
||||||||||
|
(in thousands) |
||||||||||||
|
Federal statutory rate times financial statement income (loss) |
$ | 2,294 | $ | (956 |
) |
$ | (1,125 |
) |
||||
|
Effect of: |
||||||||||||
|
Valuation allowance |
(54,049 |
) |
1,238 | 717 | ||||||||
|
Tax-exempt income |
(196 |
) |
(211 |
) |
(264 |
) |
||||||
|
Non-taxable life insurance income |
(144 |
) |
(146 |
) |
(103 |
) |
||||||
|
Restricted stock vesting |
(121 |
) |
— | — | ||||||||
|
Change in federal statutory rate |
20,274 | — | — | |||||||||
|
Other, net |
43 | 96 | 775 | |||||||||
|
Total |
$ | (31,899 |
) |
$ | 21 | $ | — | |||||
The Company has had a full valuation allowance against its net deferred tax asset since 2011. The Company’s ability to utilize the net deferred tax asset depends upon generating sufficient future levels of taxable income. The determination to restore a deferred tax asset and eliminate a valuation allowance depends upon the evaluation of both positive and negative evidence regarding the likelihood of achieving sufficient future taxable income levels. During the fourth quarter of 2017, management concluded it was more-likely-than-not the asset would be utilized to reduce future taxes payable related to the future taxable income of the Company, and as such, reversed the valuation allowance. As a result of the conclusion to reverse the valuation allowance, the Company recorded an income tax benefit of $54.0 million for the year ended December 31, 2017.
On December 22, 2017, the Tax Cuts and Jobs Act of 2017 was signed into law. Among other significant changes to the tax code, the new law lowered the federal corporate tax rate from 35% to 21% beginning in 2018. As a result, the Company revalued its net deferred tax asset at the new 21% rate. Due to this revaluation, the Company recorded a $20.3 million charge to income tax expense for the year ended December 31, 2017.
The combination of the reversal of the valuation allowance and the change in federal corporate tax rates, as well as income tax expense for the year, resulted in an income tax benefit of $31.9 million for the year ended December 31, 2017.
See Note 12, “Income Taxes”, for additional discussion of our income taxes.
Income tax expense of $21,000 was recorded for 2016, with no income tax expense or benefit recorded for 2015. Our deferred tax valuation allowance increased to $54.0 million at December 31, 2016. Our statutory federal tax rate was 35% in both 2016 and 2015. The effective tax rate for 2016 and 2015 is not meaningful due to the reduction of income tax benefit as the result of the deferred tax valuation allowance.
Analysis of Financial Condition
Total assets at December 31, 2017 were $970.8 million compared with $945.2 million at December 31, 2016, an increase of $25.6 million or 2.7%. This increase was primarily attributable to an increase in net loans of $73.6 million as well as the restoration of a net deferred tax asset of $31.3 million. These increases were partially offset by a decrease in investment securities of $41.9 million as well as a $30.9 million decrease in interest bearing deposits in banks.
Total assets at December 31, 2016 were $945.2 million compared with $948.7 million at December 31, 2015, a decrease of $3.5 million or 0.4%. This decrease was primarily attributable to a decrease in cash and cash equivalents of $27.0 million which funded the redemption of deposits of $28.1 million. There was also a decrease in OREO of $12.4 million offset by an increase in net loans of $23.6 million, an increase in available for sale securities of $7.8 million, and an increase in FHLB advances of $19.4 million.
Reversal of Deferred Tax Asset Valuation Allowance and Change in Federal Tax Rate – The Company had a full valuation allowance against its net deferred tax asset since 2011. The Company’s ability to utilize the net deferred tax asset depends upon generating sufficient future levels of taxable income. The determination to restore a deferred tax asset and eliminate a valuation allowance depends upon the evaluation of both positive and negative evidence regarding the likelihood of achieving sufficient future taxable income levels. During the fourth quarter of 2017, management concluded it was more-likely-than-not the asset would be utilized to reduce future taxes payable related to the future taxable income of the Company, and as such, reversed the valuation allowance.
As a result of the conclusion to reverse the valuation allowance and the reduction of the federal tax rate from 35% to 21%, the Company has a net deferred tax asset of $31.3 million at December 31, 2017.
Loans Receivable – Loans receivable increased $72.9 million, or 11.4%, during the year ended December 31, 2017, to $712.1 million. Our commercial, commercial real estate and real estate construction portfolios increased by an aggregate of $61.0 million, or 17.2%, during 2017 and comprised 58.4% of the total loan portfolio at December 31, 2017.
Loans receivable increased $20.6 million, or 3.3%, during the year ended December 31, 2016, to $639.2 million. Our commercial, commercial real estate and real estate construction portfolios increased by an aggregate of $18.8 million, or 5.6%, during 2016 and comprised 55.6% of the total loan portfolio at December 31, 2016.
Loan Portfolio Composition – The following table presents a summary of the loan portfolio at the dates indicated, net of deferred loan fees, by type. There are no foreign loans in our portfolio and other than the categories noted, there is no concentration of loans in any industry exceeding 10% of total loans.
|
As of December 31, |
||||||||||||||||
|
2017 |
2016 |
|||||||||||||||
|
Amount |
Percent |
Amount |
Percent |
|||||||||||||
|
(dollars in thousands) |
||||||||||||||||
|
Commercial |
$ | 113,771 | 15.98 |
% |
$ | 97,761 | 15.29 |
% |
||||||||
|
Commercial Real Estate: |
||||||||||||||||
|
Construction |
57,342 | 8.05 | 36,330 | 5.68 | ||||||||||||
|
Farmland |
88,320 | 12.40 | 71,507 | 11.19 | ||||||||||||
|
Nonfarm nonresidential |
156,724 | 22.01 | 149,546 | 23.39 | ||||||||||||
|
Residential Real Estate: |
||||||||||||||||
|
Multi-family |
56,588 | 7.94 | 48,197 | 7.54 | ||||||||||||
|
1-4 Family |
179,222 | 25.17 | 188,092 | 29.42 | ||||||||||||
|
Consumer |
18,439 | 2.59 | 9,818 | 1.54 | ||||||||||||
|
Agriculture |
41,154 | 5.78 | 37,508 | 5.87 | ||||||||||||
|
Other |
555 | 0.08 | 477 | 0.08 | ||||||||||||
|
Total loans |
$ | 712,115 | 100.00 |
% |
$ | 639,236 | 100.00 |
% |
||||||||
|
As of December 31, |
||||||||||||||||||||||||
|
2015 |
2014 |
2013 |
||||||||||||||||||||||
|
Amount |
Percent |
Amount |
Percent |
Amount |
Percent |
|||||||||||||||||||
|
(dollars in thousands) |
||||||||||||||||||||||||
|
Commercial |
$ | 86,176 | 13.93 |
% |
$ | 60,936 | 9.75 |
% |
$ | 52,878 | 7.45 |
% |
||||||||||||
|
Commercial Real Estate: |
||||||||||||||||||||||||
|
Construction |
33,154 | 5.36 | 33,173 | 5.31 | 43,326 | 6.11 | ||||||||||||||||||
|
Farmland |
76,412 | 12.35 | 77,419 | 12.39 | 71,189 | 10.04 | ||||||||||||||||||
|
Nonfarm nonresidential |
140,570 | 22.72 | 175,452 | 28.07 | 232,026 | 32.71 | ||||||||||||||||||
|
Residential Real Estate: |
||||||||||||||||||||||||
|
Multi-family |
44,131 | 7.13 | 41,891 | 6.70 | 46,858 | 6.61 | ||||||||||||||||||
|
1-4 Family |
201,478 | 32.57 | 197,278 | 31.56 | 228,505 | 32.21 | ||||||||||||||||||
|
Consumer |
10,010 | 1.62 | 11,347 | 1.82 | 14,365 | 2.03 | ||||||||||||||||||
|
Agriculture |
26,316 | 4.25 | 26,966 | 4.31 | 19,199 | 2.71 | ||||||||||||||||||
|
Other |
419 | 0.07 | 537 | 0.09 | 980 | 0.13 | ||||||||||||||||||
|
Total loans |
$ | 618,666 | 100.00 |
% |
$ | 624,999 | 100.00 |
% |
$ | 709,326 | 100.00 |
% |
||||||||||||
Lending activities are subject to a variety of lending limits imposed by state and federal law. The Bank’s secured legal lending limit to a single borrower or guarantor was approximately $31.4 million at December 31, 2017.
At December 31, 2017, we had 12 loan relationships each with aggregate extensions of credit in excess of $10.0 million, all of which were classified as pass by the Bank’s internal loan review process. In 2016, we had four loan relationships each with aggregate extensions of credit in excess of $10.0 million.
As of December 31, 2017, we had $46.2 million of loan participations purchased from, and $19.1 million of loan participations sold to, other banks. As of December 31, 2016, we had $33.4 million of loan participations purchased from, and $26.0 million of loan participations sold to, other banks.
Loan Maturity Schedule – The following table sets forth at December 31, 2017, the dollar amount of loans, net of deferred loan fees, maturing in the loan portfolio based on their contractual terms to maturity:
|
As of December 31, 2017 |
||||||||||||||||
|
Maturing Within One Year |
Maturing 1 through 5 Years |
Maturing Over 5 Years |
Total Loans |
|||||||||||||
|
(dollars in thousands) |
||||||||||||||||
|
Loans with fixed rates: |
||||||||||||||||
|
Commercial |
$ | 4,509 | $ | 25,481 | $ | 4,707 | $ | 34,697 | ||||||||
|
Commercial Real Estate: |
||||||||||||||||
|
Construction |
5,602 | 17,765 | 10,177 | 33,544 | ||||||||||||
|
Farmland |
5,273 | 16,985 | 21,075 | 43,333 | ||||||||||||
|
Nonfarm nonresidential |
14,801 | 77,138 | 22,287 | 114,226 | ||||||||||||
|
Residential Real Estate: |
||||||||||||||||
|
Multi-family |
5,038 | 28,337 | 15,449 | 48,824 | ||||||||||||
|
1-4 Family |
14,028 | 27,730 | 58,034 | 99,792 | ||||||||||||
|
Consumer |
1,172 | 5,951 | 1,275 | 8,398 | ||||||||||||
|
Agriculture |
3,143 | 5,582 | 779 | 9,504 | ||||||||||||
|
Other |
90 | 316 | 59 | 465 | ||||||||||||
|
Total fixed rate loans |
$ | 53,656 | $ | 205,285 | $ | 133,842 | $ | 392,783 | ||||||||
|
Loans with floating rates: |
||||||||||||||||
|
Commercial |
$ | 10,169 | $ | 45,673 | $ | 23,232 | $ | 79,074 | ||||||||
|
Commercial Real Estate: |
||||||||||||||||
|
Construction |
9,790 | 13,976 | 32 | 23,798 | ||||||||||||
|
Farmland |
1,127 | 5,665 | 38,195 | 44,987 | ||||||||||||
|
Nonfarm nonresidential |
1,598 | 7,170 | 33,730 | 42,498 | ||||||||||||
|
Residential Real Estate: |
||||||||||||||||
|
Multi-family |
208 | 4,956 | 2,600 | 7,764 | ||||||||||||
|
1-4 Family |
1,885 | 5,096 | 72,449 | 79,430 | ||||||||||||
|
Consumer |
10,013 | — | 28 | 10,041 | ||||||||||||
|
Agriculture |
22,087 | 9,349 | 214 | 31,650 | ||||||||||||
|
Other |
— | — | 90 | 90 | ||||||||||||
|
Total floating rate loans |
$ | 56,877 | $ | 91,885 | $ | 170,570 | $ | 319,332 | ||||||||
Loan Portfolio by Risk Category – The following table presents a summary of the loan portfolio at the dates indicated, by risk category.
| As of December 31, | |||||||||||||||||||||
|
2017 |
2016 |
2015 |
2014 |
2013 |
|||||||||||||||||
|
(in thousands) |
|||||||||||||||||||||
|
Pass |
$ | 673,033 | $ | 586,430 | $ | 517,484 | $ | 461,126 | $ | 369,529 | |||||||||||
|
Watch |
25,715 | 30,431 | 63,363 | 68,200 | 144,316 | ||||||||||||||||
|
Special Mention |
164 | 497 | 1,395 | 4,189 | 5,865 | ||||||||||||||||
|
Substandard |
13,203 | 21,878 | 36,424 | 91,484 | 189,616 | ||||||||||||||||
|
Doubtful |
— | — | — | — | — | ||||||||||||||||
|
Total |
$ | 712,115 | $ | 639,236 | $ | 618,666 | $ | 624,999 | $ | 709,326 | |||||||||||
Loans receivable increased $72.9 million, or 11.4%, during the year ended December 31, 2017. All loan risk categories have decreased since December 31, 2016, with the exception of pass graded loans. The pass category increased approximately $86.6 million, the watch category declined approximately $4.7 million, the special mention category declined approximately $333,000, and the substandard category declined approximately $8.7 million.
Loan Delinquency – The following table presents a summary of loan delinquencies at the dates indicated.
| As of December 31, | |||||||||||||||||||||
|
2017 |
2016 |
2015 |
2014 |
2013 |
|||||||||||||||||
|
(in thousands) |
|||||||||||||||||||||
|
Past Due Loans: |
|||||||||||||||||||||
|
30-59 Days |
$ | 1,478 | $ | 2,302 | $ | 3,133 | $ | 3,960 | $ | 10,696 | |||||||||||
|
60-89 Days |
171 | 315 | 241 | 980 | 775 | ||||||||||||||||
|
90 Days and Over |
1 | — | — | 151 | 232 | ||||||||||||||||
|
Total Loans Past Due 30-90+ Days |
1,650 | 2,617 | 3,374 | 5,091 | 11,703 | ||||||||||||||||
|
Nonaccrual Loans |
5,457 | 9,216 | 14,087 | 47,175 | 101,767 | ||||||||||||||||
|
Total Past Due and Nonaccrual Loans |
$ | 7,107 | $ | 11,833 | $ | 17,461 | $ | 52,266 | $ | 113,470 | |||||||||||
Loans past due 30-59 days decreased from $2.3 million at December 31, 2016 to $1.5 million at December 31, 2017, and loans past due 60-89 days decreased from $315,000 at December 31, 2016 to $171,000 at December 31, 2017. This represents a $968,000 decrease in loans past due 30-89 days. We considered this trend in delinquency levels during the evaluation of qualitative trends in the portfolio when establishing the general component of the allowance for loan losses.
Nonaccrual loans decreased $3.8 million from December 31, 2016 to December 31, 2017. The $3.8 million decrease in nonaccrual loans was primarily driven by $5.0 million in paydowns, $665,000 in charge-offs, $270,000 in transfers to OREO, and $199,000 in loans returned to accrual status, offset by $2.3 million in loans placed on non-accrual. The $5.5 million in nonaccrual loans at December 31, 2017, and $9.2 million at December 31, 2016, were generally secured by farmland, other commercial real estate, and other residential real estate loans. Management believes it has established adequate loan loss reserves for these credits.
Non-Performing Assets – Non-performing assets consist of certain restructured loans for which interest rate or other terms have been renegotiated, loans past due 90 days or more still on accrual, loans on which interest is no longer accrued, real estate acquired through foreclosure and repossessed assets. Loans, including impaired loans, are placed on nonaccrual status when they become past due 90 days or more as to principal or interest, unless they are adequately secured and in the process of collection. Loans are considered impaired if full principal or interest payments are not anticipated in accordance with the contractual loan terms. Impaired loans are carried at the present value of expected future cash flows discounted at the loan’s effective interest rate or at the fair value of the collateral less cost to sell if the loan is collateral dependent. Loans are reviewed on a regular basis and normal collection procedures are implemented when a borrower fails to make a required payment on a loan. If the delinquency on a mortgage loan exceeds 120 days and is not cured through normal collection procedures or an acceptable arrangement is not agreed to with the borrower, we institute measures to remedy the default, including commencing a foreclosure action. Consumer loans generally are charged off when a loan is deemed uncollectible and often before any available collateral has been disposed. Commercial business and real estate loan delinquencies are handled on an individual basis with the advice of legal counsel.
Interest income on loans is recognized on the accrual basis except for those loans placed on nonaccrual status. The accrual of interest on impaired loans is discontinued when management believes, after consideration of economic and business conditions and collection efforts, that the borrowers’ financial condition is such that collection of interest is doubtful, which typically occurs after the loan becomes 90 days delinquent. When interest accrual is discontinued, existing accrued interest is reversed and interest income is subsequently recognized only to the extent cash payments are received on well-secured loans.
Real estate acquired as a result of foreclosure or by deed in lieu of foreclosure is classified as real estate owned until such time as it is sold. New and used automobiles and other motor vehicles acquired as a result of foreclosure are classified as repossessed assets until they are sold. When such property is acquired it is recorded at its fair market value less cost to sell. Any write-down of the property at the time of acquisition is charged to the allowance for loan losses. Subsequent gains and losses are included in non-interest expense.
The following table sets forth information with respect to non-performing assets as of the dates indicated:
|
As of December 31, |
||||||||||||||||||||
|
2017 |
2016 |
2015 |
2014 |
2013 |
||||||||||||||||
|
(dollars in thousands) |
||||||||||||||||||||
|
Past due 90 days or more still on accrual |
$ | 1 | $ | — | $ | — | $ | 151 | $ | 232 | ||||||||||
|
Loans on nonaccrual status |
5,457 | 9,216 | 14,087 | 47,175 | 101,767 | |||||||||||||||
|
Total non-performing loans |
5,458 | 9,216 | 14,087 | 47,326 | 101,999 | |||||||||||||||
|
Real estate acquired through foreclosure |
4,409 | 6,821 | 19,214 | 46,197 | 30,892 | |||||||||||||||
|
Other repossessed assets |
— | — | — | — | — | |||||||||||||||
|
Total non-performing assets |
$ | 9,867 | $ | 16,037 | $ | 33,301 | $ | 93,523 | $ | 132,891 | ||||||||||
|
Non-performing loans to total loans |
0.77 |
% |
1.44 |
% |
2.28 |
% |
7.57 |
% |
14.38 |
% |
||||||||||
|
Non-performing assets to total assets |
1.02 |
% |
1.70 |
% |
3.51 |
% |
9.19 |
% |
12.35 |
% |
||||||||||
|
Allowance for non-performing loans |
$ | 108 | $ | 241 | $ | 295 | $ | 1,253 | $ | 2,285 | ||||||||||
|
Allowance for non-performing loans to non-performing loans |
1.98 |
% |
2.62 |
% |
2.09 |
% |
2.65 |
% |
2.24 |
% |
||||||||||
Troubled Debt Restructuring – A troubled debt restructuring (TDR) occurs when the Bank has agreed to a loan modification in the form of a concession to a borrower who is experiencing financial difficulty. The Bank’s TDRs typically involve a reduction in interest rate, a deferral of principal for a stated period of time, or an interest only period. All TDRs are considered impaired, and the Bank has allocated reserves for these loans to reflect the present value of the concessionary terms granted to the borrower. If the loan is considered collateral dependent, it is reported net of allocated reserves, at the fair value of the collateral less cost to sell.
The Bank does not have a formal loan modification program. If a borrower is unable to make contractual payments, we review the particular circumstances of that borrower’s situation and determine whether or not to negotiate a revised payment stream. The goal when restructuring a credit is to afford the borrower a reasonable period of time to remedy the issue causing cash flow constraints so that they may return to performing status over time.
Loan modifications have taken the form of a reduction in interest rate and/or curtailment of scheduled principal payments for a short-term period, usually three to six months, but in some cases until maturity of the loan. In some circumstances we may restructure real estate secured loans in a bifurcated fashion whereby there is a fully amortizing “A” loan at a market interest rate and an interest-only “B” loan at a reduced interest rate. The majority of restructured loans are collateral secured loans. If a borrower fails to perform under the modified terms, the loan(s) are placed on nonaccrual status and collection actions are intiated.
We consider any loan that is restructured for a borrower experiencing financial difficulties due to a borrower’s potential inability to pay in accordance with contractual terms of the loan to be a troubled debt restructuring. Specifically, we consider a concession involving a modification of the loan terms, such as (i) a reduction of the stated interest rate, (ii) a reduction or deferral of principal, or (iii) a reduction or deferral of accrued interest at a stated interest rate lower than the current market rate for new debt with similar risk all to be troubled debt restructurings. When a modification of terms is made for a competitive reason, we do not consider it to be a troubled debt restructuring. A primary example of a competitive modification would be an interest rate reduction for a performing customer’s loan to a market rate as the result of a market decline in rates.
Management periodically reviews renewals and modifications of previously identified TDRs for which there was no principal forgiveness, to consider if it is appropriate to remove the TDR classification. If the borrower is no longer experiencing financial difficulty and the renewal/modification did not contain a concessionary interest rate or other concessionary terms, management considers the potential removal of the TDR classification. If deemed appropriate based upon current underwriting, the TDR classification is removed as the borrower has complied with the terms of the loan at the date of renewal/modification and there was a reasonable expectation that the borrower would continue to comply with the terms of the loan after the date of the renewal/modification. Additionally, the TDR classification may be removed in circumstances in which the Company performs a non-concessionary re-modification of the loan at terms that were considered to be at market for loans with comparable risk. Management expects the borrower will continue to perform under the re-modified terms based on the borrower’s past history of performance.
If the borrower fails to perform, we place the loan on nonaccrual status and seek to liquidate the underlying collateral. The nonaccrual policy for restructured loans is identical to the nonaccrual policy for all loans. The policy calls for a loan to be reported as nonaccrual if it is maintained on a cash basis because of deterioration in the financial condition of the borrower, payment in full of principal and interest is not expected, or principal or interest is past due 90 days or more unless the assets are both well secured and in the process of collection. Changes in value for impairment, including the amount attributed to the passage of time, are recorded entirely within the provision for loan losses. Upon determination that a loan is collateral dependent, the loan is charged down to the fair value of collateral less estimated costs to sell.
At December 31, 2017, we had six restructured loans totaling $3.0 million with borrowers who experienced deterioration in financial condition compared with nine restructured loans totaling $8.7 million at December 31, 2016. In general, these loans were granted interest rate reductions to provide cash flow relief to borrowers experiencing cash flow difficulties. At December 31, 2017, two loans totaling approximately $1.8 million had been granted principal payment deferrals until maturity. There were no concessions made to forgive principal relative to these loans, although we have recorded partial charge-offs for certain restructured loans. In general, these loans are secured by first liens on 1-4 residential or commercial real estate properties, or farmland. Restructured loans also included $467,000 of commercial loans at December 31, 2017. At December 31, 2017, $1.2 million of TDRs were performing according to their modified terms.
There were no modifications granted during 2017 or 2016 that resulted in loans being identified as TDRs. During the twelve months ended December 31, 2017, TDRs were reduced as a result of $1.6 million in payments. In addition, the TDR classification was removed from two loans that met the requirements discussed above in 2017. These loans totaled $4.1 million at December 31, 2016, and are no longer evaluated individually for impairment.
The following table sets forth information with respect to TDRs, non-performing loans, real estate acquired through foreclosure, and other repossessed assets.
|
As of December 31, |
||||||||||||||||||||
|
2017 |
2016 |
2015 |
2014 |
2013 |
||||||||||||||||
|
(dollars in thousands) |
||||||||||||||||||||
|
Total non-performing loans |
$ | 5,458 | $ | 9,216 | $ | 14,087 | $ | 47,326 | $ | 101,999 | ||||||||||
|
TDRs on accrual |
1,217 | 5,350 | 17,440 | 21,985 | 44,346 | |||||||||||||||
|
Total non-performing loans and TDRs on accrual |
$ | 6,675 | $ | 14,566 | $ | 31,527 | $ | 69,311 | $ | 146,345 | ||||||||||
|
Real estate acquired through foreclosure |
4,409 | 6,821 | 19,214 | 46,197 | 30,892 | |||||||||||||||
|
Other repossessed assets |
— | — | — | — | — | |||||||||||||||
|
Total non-performing assets and TDRs on accrual |
$ | 11,084 | $ | 21,387 | $ | 50,741 | $ | 115,508 | $ | 177,237 | ||||||||||
|
Total non-performing loans and TDRs on accrual to total loans |
0.94 |
% |
2.28 |
% |
5.10 |
% |
11.09 |
% |
20.63 |
% |
||||||||||
|
Total non-performing assets and TDRs on accrual to total assets |
1.14 |
% |
2.26 |
% |
5.35 |
% |
11.35 |
% |
16.47 |
% |
||||||||||
See Footnote 3, “Loans”, to the financial statements for additional disclosure related to troubled debt restructuring.
Interest income that would have been earned on non-performing loans was $465,000, $738,000, and $1.7 million for the years ended December 31, 2017, 2016, and 2015, respectively. Interest income recognized on accruing non-performing loans was $135,000, $445,000, and $710,000 for the years ended December 31, 2017, 2016, and 2015, respectively.
Allowance for Loan Losses – The allowance for loan losses is based on management’s continuing review and evaluation of individual loans, loss experience, current economic conditions, risk characteristics of various categories of loans and such other factors that, in management’s judgment, require current recognition in estimating loan losses.
Management has established loan grading procedures that result in specific allowance allocations for any estimated inherent risk of loss. For loans not individually evaluated, a general allowance allocation is computed using factors developed over time based on actual loss experience. Prior to June 2017, the look-back period for historical losses was 12 quarters, weighted 40% for the most recent eight quarters and 20% for the previous four quarter period. Effective June 30, 2017, the Company extended the look-back period to 16 quarters on a prospective basis, weighted 40% for the most recent four quarters, then declining one tenth for each of the remaining annual periods. Management determined the four-year look-back period was appropriate as the four-year period more appropriately correlates to the period in which the current portfolio was underwritten and originated. The specific and general allocations plus consideration of qualitative factors represent management’s estimate of probable losses contained in the loan portfolio at the evaluation date. Although the allowance for loan losses is comprised of specific and general allocations, the entire allowance is available to absorb any credit losses.
The following table sets forth an analysis of loan loss experience as of and for the periods indicated:
|
As of December 31, |
||||||||||||||||||||
|
2017 |
2016 |
2015 |
2014 |
2013 |
||||||||||||||||
|
(dollars in thousands) |
||||||||||||||||||||
|
Balances at beginning of period |
$ | 8,967 | $ | 12,041 | $ | 19,364 | $ | 28,124 | $ | 56,680 | ||||||||||
|
Loans charged-off: |
||||||||||||||||||||
|
Real estate |
750 | 2,157 | 5,050 | 17,943 | 28,879 | |||||||||||||||
|
Commercial |
5 | 276 | 696 | 1,099 | 2,828 | |||||||||||||||
|
Consumer |
51 | 178 | 268 | 354 | 773 | |||||||||||||||
|
Agriculture |
95 | 18 | 118 | 30 | 128 | |||||||||||||||
|
Total charge-offs |
901 | 2,629 | 6,132 | 19,426 | 32,608 | |||||||||||||||
|
Recoveries: |
||||||||||||||||||||
|
Real estate |
714 | 1,189 | 2,338 | 2,726 | 1,622 | |||||||||||||||
|
Commercial |
59 | 334 | 723 | 614 | 1,212 | |||||||||||||||
|
Consumer |
130 | 368 | 240 | 213 | 266 | |||||||||||||||
|
Agriculture |
33 | 114 | 8 | 13 | 252 | |||||||||||||||
|
Total recoveries |
936 | 2,005 | 3,309 | 3,566 | 3,352 | |||||||||||||||
|
Net charge-offs (recoveries) |
(35 |
) |
624 | 2,823 | 15,860 | 29,256 | ||||||||||||||
|
Provision (negative provision) for loan losses |
(800 |
) |
(2,450 |
) |
(4,500 |
) |
7,100 | 700 | ||||||||||||
|
Balance at end of period |
$ | 8,202 | $ | 8,967 | $ | 12,041 | $ | 19,364 | $ | 28,124 | ||||||||||
|
Allowance for loan losses to period-end loans |
1.15 |
% |
1.40 |
% |
1.95 |
% |
3.10 |
% |
3.96 |
% |
||||||||||
|
Net charge-offs (recoveries) to average loans |
(0.01 |
%) |
0.10 |
% |
0.44 |
% |
2.39 |
% |
3.71 |
% |
||||||||||
|
Allowance for loan losses to non-performing loans |
150.27 |
% |
97.30 |
% |
85.48 |
% |
40.92 |
% |
27.57 |
% |
||||||||||
|
Allowance for loan losses for loans individually evaluated for impairment |
$ | 219 | $ | 399 | $ | 428 | $ | 752 | $ | 3,471 | ||||||||||
|
Loans individually evaluated for impairment |
7,173 | 15,131 | 31,776 | 71,993 | 149,883 | |||||||||||||||
|
Allowance for loan losses to loans individually evaluated for impairment |
3.05 | % | 2.64 | % | 1.35 | % | 1.04 | % | 2.32 | % | ||||||||||
|
Allowance for loan losses for loans collectively evaluated for impairment |
$ | 7,983 | $ | 8,568 | $ | 11,613 | $ | 18,612 | $ | 24,653 | ||||||||||
|
Loans collectively evaluated for impairment |
704,942 | 624,105 | 586,890 | 553,006 | 559,443 | |||||||||||||||
|
Allowance for loan losses to loans collectively evaluated for impairment |
1.13 | % | 1.37 | % | 1.98 | % | 3.37 | % | 4.41 | % | ||||||||||
The allowance for loan losses is a reserve established through charges to earnings in the form of a provision for loan losses. The allowance for loan losses is comprised of general reserves and specific reserves. The loan loss reserve, as a percentage of total loans at December 31, 2017, decreased to 1.15% from 1.40% at December 31, 2016. The change in loan loss reserve as a percentage of total loans between periods is attributable to growth in the portfolio driven by new loans underwritten with lower loss expectations, improving historical loss experience, improvement in risk grade classification metrics, improved charge-off levels, and improved past due trends. The allowance for loan losses to non-performing loans was 150.27% at December 31, 2017, compared with 97.30% at December 31, 2016. Net recoveries in 2017 totaled $35,000.
The following table sets forth the net charge-offs (recoveries) for the periods indicated:
|
Year Ended December 31, 2017 |
Year Ended December 31, 2016 |
Year Ended December 31, 2015 |
||||||||||
|
(in thousands) |
||||||||||||
|
Commercial |
$ | (54 |
) |
$ | (58 |
) |
$ | (27 |
) |
|||
|
Commercial Real Estate |
(361 |
) |
(339 |
) |
1,225 | |||||||
|
Residential Real Estate |
397 | 1,307 | 1,487 | |||||||||
|
Consumer |
(64 |
) |
(200 |
) |
37 | |||||||
|
Agriculture |
62 | (96 |
) |
110 | ||||||||
|
Other |
(15 |
) |
10 | (9 |
) |
|||||||
|
Total net charge-offs (recoveries) |
$ | (35 |
) |
$ | 624 | $ | 2,823 | |||||
A general reserve is maintained for each loan type in the loan portfolio. In determining the amount of the general reserve portion of the allowance for loan losses, management considers factors such as our historical loan loss experience, the growth, composition and diversification of our loan portfolio, current delinquency levels, loan quality grades, the results of recent regulatory examinations and general economic conditions. Based on these factors, we apply estimated percentages to the various categories of loans, not including any loan that has a specific allowance allocated to it, based on our historical experience, portfolio trends and economic and industry trends. This information is used by management to set the general reserve portion of the allowance for loan losses at a level it deems prudent.
Generally, all loans identified as impaired are reviewed on a quarterly basis in order to determine whether a specific allowance is required. A loan is considered impaired when, based on current information, it is probable that we will not receive all amounts due in accordance with the contractual terms of the loan agreement. Once a loan has been identified as impaired, management measures impairment in accordance with ASC 310-10, “Impairment of a Loan.” When management’s measured value of the impaired loan is less than the recorded investment in the loan, the amount of the impairment is recorded as a specific reserve or charged-off if the loan is deemed collateral dependent. These specific reserves are determined on an individual loan basis based on management’s current evaluation of our loss exposure for each credit given the payment status, financial condition of the borrower and value of any underlying collateral. Loans for which specific reserves have been provided are excluded from the general reserve calculations described below. Changes in specific reserves from period to period are the result of changes in the circumstances of individual loans such as charge-offs, pay-offs, changes in collateral values or other factors.
The allowance for loan losses represents management’s estimate of the amount necessary to provide for probable losses in the loan portfolio in the normal course of business. Due to the uncertainty of risks in the loan portfolio, management’s judgment of the amount of the allowance necessary to absorb loan losses is approximate. The allowance for loan losses is also subject to regulatory examinations and may be adjusted in response to a determination by the regulatory agencies as to its adequacy in comparison with peer institutions.
We make specific allowances for each impaired loan based on its type and risk classification as discussed above. At year-end 2017, the allowance for loan losses to total non-performing loans increased to 150.27% from 97.30% at year-end 2016. It is important to look more closely at this ratio as a significant portion of impaired loans are collateral dependent and have been charged down to the estimated fair value of the underlying collateral less cost to sell. Please see the next table for comparison and disclosure of recorded investment less allocated allowance relative to the unpaid principal balance. Impaired loans have been assessed for collectability which considered, among other things, the borrower’s ability to repay, the value of the underlying collateral, and other market conditions to ensure that the allowance for loan losses is adequate to absorb probable incurred losses.
The following table presents the unpaid principal balance, recorded investment and allocated allowance related to loans individually evaluated for impairment in the commercial real estate and residential real estate portfolios as of December 31, 2017 and 2016.
|
December 31, 2017 |
December 31, 2016 |
|||||||||||||||
|
Commercial Real Estate |
Residential Real Estate |
Commercial Real Estate |
Residential Real Estate |
|||||||||||||
|
(in thousands) |
||||||||||||||||
|
Unpaid principal balance |
$ | 4,734 | $ | 5,456 | $ | 10,985 | $ | 10,439 | ||||||||
|
Prior charge-offs |
(2,099 |
) |
(1,506 |
) |
(5,131 |
) |
(1,818 |
) |
||||||||
|
Recorded investment |
2,635 | 3,950 | 5,854 | 8,621 | ||||||||||||
|
Allocated allowance |
— | (206 |
) |
(35 |
) |
(350 |
) |
|||||||||
|
Recorded investment, less allocated allowance |
$ | 2,635 | $ | 3,744 | $ | 5,819 | $ | 8,271 | ||||||||
|
Recorded investment, less allocated allowance/ Unpaid principal balance |
55.66 |
% |
68.62 |
% |
52.97 |
% |
79.23 |
% |
||||||||
Based on prior charge-offs, the current recorded investments in loans individually evaluated for impairment in the commercial real estate and residential real estate segments of the portfolio are significantly below the unpaid principal balances of those loans. The recorded investment net of the allocated allowance was 55.66% and 68.62% of the unpaid principal balance in the commercial real estate and residential real estate segments, respectively, at December 31, 2017.
The following table illustrates recent trends in loans collectively evaluated for impairment and the related allowance for loan losses by portfolio segment:
|
December 31, 2017 |
December 31, 2016 |
|||||||||||||||||||||||
|
Loans |
Allowance |
% to Total |
Loans |
Allowance |
% to Total |
|||||||||||||||||||
|
(dollars in thousands) |
||||||||||||||||||||||||
|
Commercial |
$ | 113,184 | $ | 879 | 0.78 |
% |
$ | 97,166 | $ | 462 | 0.48 |
% |
||||||||||||
|
Commercial real estate |
299,751 | 4,032 | 1.35 | 251,529 | 4,859 | 1.93 | ||||||||||||||||||
|
Residential real estate |
231,860 | 2,694 | 1.16 | 227,668 | 3,076 | 1.35 | ||||||||||||||||||
|
Consumer |
18,438 | 64 | 0.35 | 9,817 | 8 | 0.08 | ||||||||||||||||||
|
Agriculture |
41,154 | 313 | 0.76 | 37,448 | 161 | 0.43 | ||||||||||||||||||
|
Other |
555 | 1 | 0.18 | 477 | 2 | 0.42 | ||||||||||||||||||
|
Total |
$ | 704,942 | $ | 7,983 | 1.13 |
% |
$ | 624,105 | $ | 8,568 | 1.37 |
% |
||||||||||||
The allowance for those loan losses related to loans collectively evaluated for impairment trended downward from 1.37% at December 31, 2016 to 1.13% at December 31, 2017 as a result of declining historical charge-off levels and improving trends in loan category risk ratings. The residential real estate segment constitutes approximately 32.9% of total loans collectively evaluated for impairment. The related allowance for the residential real estate segment trended downward from 1.35% at December 31, 2016 to 1.16% at December 31, 2017 as net charge-offs declined from approximately $1.3 million in 2016 to $397,000 in 2017. The commercial real estate segment constitutes approximately 42.5% of total loans collectively evaluated for impairment. The related allowance for the commercial real estate segment trended downward from 1.93% at December 31, 2016 to 1.35% at December 31, 2017. This is consistent with the decline in historical rates and improvement in loan quality within the commercial real estate segment. The overall decrease in the allowance also reflects improving historical loss experience, qualitative factors, improvement in risk grade classification metrics, improved charge-off levels, improved past due trends, and the negative provision.
A significant portion of the portfolio is comprised of loans secured by real estate. A decline in the value of the real estate serving as collateral for loans may impact our ability to collect those loans. In general, we obtain updated appraisals on property securing our loans when circumstances are warranted such as at the time of renewal or when market conditions have significantly changed. We use qualified licensed appraisers approved by our Board of Directors. These appraisers possess prerequisite certifications and knowledge of the local and regional marketplace.
Based on its assessment of the loan portfolio, management presents a quarterly review of the allowance for loan losses to the Bank’s Board of Directors, indicating any change in the allowance for loan losses since the last review and any recommendations as to adjustments in the allowance for loan losses.
This assessment is inherently subjective as it requires estimates that are susceptible to significant revision as more information becomes available or as events change. The allowance for loan losses has decreased as a percentage of loans outstanding to 1.15% at December 31, 2017 from 1.40% at December 31, 2016. This decline is the result of growth in the portfolio driven by new loans underwritten with lower loss expectations, improving historical loss experience, improvement in risk grade classification metrics, improved charge-off levels, and improved past due trends. The level of the allowance is based on estimates, and losses may ultimately vary from these estimates.
The Bank follows a loan grading program designed to evaluate the credit risk in the loan portfolio. Through this loan grading process, an internally classified watch list is maintained which helps management assess the overall quality of the loan portfolio and the adequacy of the allowance for loan losses. Loans categorized as watch list loans show warning elements where the present status exhibits one or more deficiencies that require attention in the short-term or where pertinent ratios of the loan account have weakened to a point where more frequent monitoring is warranted. These loans do not have all of the characteristics of a classified loan (substandard or doubtful) but show weakened elements as compared with those of a satisfactory credit. These loans are reviewed to assist in assessing the adequacy of the allowance for loan losses.
In establishing the appropriate risk rating for specific assets, management considers, among other factors, the borrower’s ability to repay, the borrower’s repayment history, the current delinquency status, the estimated value of the underlying collateral, and the capacity and willingness of a guarantor to satisfy the obligation. As a result of this process, loans are categorized as special mention, substandard or doubtful.
Loans classified as “special mention” do not have all of the characteristics of substandard or doubtful loans. They have one or more deficiencies that warrant special attention and which corrective action, such as accelerated collection practices, may remedy.
Loans classified as “substandard” are those loans with clear and defined weaknesses such as a highly leveraged position, unfavorable financial ratios, uncertain repayment sources or poor financial condition that may jeopardize the repayment of the debt as contractually agreed. They are characterized by the distinct possibility that we will sustain some losses if the deficiencies are not corrected.
Loans classified as “doubtful” are those loans which have characteristics similar to substandard loans but with an increased risk that collection or liquidation in full is highly questionable and improbable.
Specific reserves may be carried for accruing TDRs in compliance with restructured terms. Once a loan is deemed impaired or uncollectible as contractually agreed (other than performing TDRs), the loan is charged-off either partially or in-full against the allowance for loan losses, based upon the expected future cash flows discounted at the loan’s effective interest rate, or the fair value of collateral less estimated cost to sell with respect to collateral-based loans if collateral dependent.
As of December 31, 2017, $13.2 million of loans were classified as substandard, $164,000 classified as special mention and no loans classified as doubtful or loss. This compares with $21.9 million of loans classified as substandard, $497,000 classified as special mention and no loans classified as doubtful or loss as of December 31, 2016. The $8.7 million decrease in loans classified as substandard was primarily driven by $6.8 million in principal payments received, $270,000 in migration to OREO, $4.6 million in loans upgraded from substandard, and $790,000 in charge-offs, offset by $3.7 million in loans moved to substandard during 2017. Substandard loans are primarily concentrated in the residential real estate portfolio. As of December 31, 2017, $418,000 of the allowance for loan losses was allocated to substandard loans. This compares to allocations of $600,000 in the allowance for loan losses related to substandard loans at December 31, 2016.
The following table depicts management’s allocation of the allowance for loan losses by loan type. Allowance funding and allocation is based on management’s current evaluation of risk in each category, economic conditions, past loss experience, loan volume, past due history and other factors. Since these factors and management’s assumptions are subject to change, the allocation is not necessarily predictive of future portfolio performance. The allocation is made for analytical purposes and is not necessarily indicative of the categories in which future losses may occur. The total allowance is available to absorb losses from any segment of loans.
|
As of December 31, |
||||||||||||||||
|
2017 |
2016 |
|||||||||||||||
|
Amount of Allowance |
Percent of Loans to Total Loans |
Amount of Allowance |
Percent of Loans to Total Loans |
|||||||||||||
|
(dollars in thousands) |
||||||||||||||||
|
Commercial |
$ | 892 | 15.98 |
% |
$ | 475 | 15.29 |
% |
||||||||
|
Commercial Real Estate: |
||||||||||||||||
|
Construction |
301 | 8.05 | 470 | 5.68 | ||||||||||||
|
Farmland |
449 | 12.40 | 288 | 11.19 | ||||||||||||
|
Nonfarm nonresidential |
3,282 | 22.01 | 4,136 | 23.39 | ||||||||||||
|
Residential Real Estate: |
||||||||||||||||
|
Multi-family |
627 | 7.94 | 610 | 7.54 | ||||||||||||
|
1-4 Family |
2,273 | 25.17 | 2,816 | 29.42 | ||||||||||||
|
Consumer |
64 | 2.59 | 8 | 1.54 | ||||||||||||
|
Agriculture |
313 | 5.78 | 162 | 5.87 | ||||||||||||
|
Other |
1 | 0.08 | 2 | 0.08 | ||||||||||||
|
Total |
$ | 8,202 | 100.0 |
% |
$ | 8,967 | 100.0 |
% |
||||||||
|
As of December 31, |
||||||||||||||||||||||||
|
2015 |
2014 |
2013 |
||||||||||||||||||||||
|
Amount of Allowance |
Percent of Loans to Total Loans |
Amount of Allowance |
Percent of Loans to Total Loans |
Amount of Allowance |
Percent of Loans to Total Loans |
|||||||||||||||||||
|
(dollars in thousands) |
||||||||||||||||||||||||
|
Commercial |
$ | 818 | 13.93 |
% |
$ | 2,046 | 9.75 |
% |
$ | 3,221 | 7.45 |
% |
||||||||||||
|
Commercial Real Estate: |
||||||||||||||||||||||||
|
Construction |
424 | 5.36 | 739 | 5.31 | 2,149 | 6.11 | ||||||||||||||||||
|
Farmland |
364 | 12.35 | 1,094 | 12.39 | 1,623 | 10.04 | ||||||||||||||||||
|
Nonfarm nonresidential |
6,205 | 22.72 | 9,098 | 28.07 | 12,642 | 32.71 | ||||||||||||||||||
|
Residential Real Estate: |
||||||||||||||||||||||||
|
Multi-family |
422 | 7.13 | 886 | 6.70 | 1,449 | 6.61 | ||||||||||||||||||
|
1-4 Family |
3,562 | 32.57 | 4,901 | 31.56 | 6,313 | 32.21 | ||||||||||||||||||
|
Consumer |
122 | 1.62 | 274 | 1.82 | 416 | 2.03 | ||||||||||||||||||
|
Agriculture |
122 | 4.25 | 319 | 4.31 | 305 | 2.71 | ||||||||||||||||||
|
Other |
2 | 0.07 | 7 | 0.09 | 6 | 0.13 | ||||||||||||||||||
|
Total |
$ | 12,041 | 100.0 |
% |
$ | 19,364 | 100.0 |
% |
$ | 28,124 | 100.00 |
% |
||||||||||||
Provision for Loan Losses – A negative provision for loan losses of $800,000 was recorded for the year ended December 31, 2017, compared with a negative provision for loan losses of $2.5 million for 2016 and a negative provision for loan losses of $4.5 million for 2015. The negative provision in 2017 was driven by declining historical loss rates, improvements in loan quality, and management’s assessment of risk within the portfolio. The total allowance for loan losses was $8.2 million, or 1.15% of total loans, at December 31, 2017, compared with $9.0 million, or 1.40% of total loans, at December 31, 2016, and $12.0 million, or 1.95% of total loans, at December 31, 2015. The decreased allowance is consistent with the overall trends within the portfolio. Substandard loans decreased by $8.7 million or 39.7% during 2017, net recoveries were $35,000 for 2017 compared to net charge-offs of $624,000 in 2016 and $2.8 million in 2015, and nonaccrual loans decreased by $3.8 million or 40.8% during 2017. Charge-offs for 2017 were concentrated in the loans secured by the residential real estate category of the portfolio. These net charge-offs consisted of $397,000 of residential real estate loans. We consider the size and volume of our portfolio as well as the credit quality of our loan portfolio based upon risk category classification when determining the loan loss provision for each period and the allowance for loan losses at period end.
Foreclosed Properties – Foreclosed properties at December 31, 2017 were $4.4 million compared with $6.8 million at December 31, 2016. See Note 5, “Other Real Estate Owned”, to the financial statements. During 2017, we acquired $270,000 of OREO properties and sold properties totaling approximately $793,000. We value foreclosed properties at fair value less estimated cost to sell when acquired and expect to liquidate these properties to recover our investment in the due course of business.
OREO is recorded at fair market value less estimated cost to sell at time of acquisition. Any write-down of the property at the time of acquisition is charged to the allowance for loan losses. When foreclosed properties are acquired, management obtains a new appraisal or has staff from the Bank’s special assets group evaluate the latest in-file appraisal in connection with the transfer to OREO. We typically obtain updated appraisals within five quarters of the anniversary date of ownership unless a sale is imminent. Subsequent reductions in fair value are recorded as non-interest expense when a new appraisal indicates a decline in value or in cases where a listing price is lowered below the appraisal amount.
The following table presents the major categories of OREO at the year-ends indicated:
|
2017 |
2016 |
2015 |
||||||||||
|
(in thousands) |
||||||||||||
|
Commercial Real Estate: |
||||||||||||
|
Construction, land development, and other land |
$ | 4,335 | $ | 6,571 | $ | 12,344 | ||||||
|
Farmland |
74 | — | — | |||||||||
|
Nonfarm nonresidential |
— | — | 6,746 | |||||||||
|
Residential Real Estate: |
||||||||||||
|
1-4 Family |
— | 250 | 124 | |||||||||
| $ | 4,409 | $ | 6,821 | $ | 19,214 | |||||||
Net activity relating to other real estate owned during the years indicated is as follows:
|
2017 |
2016 |
2015 |
||||||||||
|
(in thousands) |
||||||||||||
|
OREO Activity |
||||||||||||
|
OREO as of January 1 |
$ | 6,821 | $ | 19,214 | $ | 46,197 | ||||||
|
Real estate acquired |
270 | 1,273 | 5,513 | |||||||||
|
Valuation adjustment write-downs |
(1,963 |
) |
(1,180 |
) |
(9,855 |
) |
||||||
|
Net gain (loss) on sale |
74 | 222 | (74 |
) |
||||||||
|
Proceeds from sale of properties |
(793 |
) |
(12,708 |
) |
(22,567 |
) |
||||||
|
OREO as of December 31 |
$ | 4,409 | $ | 6,821 | $ | 19,214 | ||||||
Net gain on sales, write-downs, and operating expenses for OREO totaled $2.0 million for the year ended December 31, 2017, compared with $1.5 million in 2016 and $12.3 million in 2015.
During the year ended December 31, 2017, fair value write-downs of $2.0 million were recorded compared with $1.2 million for 2016 and $9.9 million for 2015. The write-downs recorded in each year reflect fair value write-downs due to updated appraisals, changes in marketing strategies, and reductions in listing prices for certain properties. OREO sales totaled $793,000, $12.7 million, and $22.6 million during 2017, 2016, and 2015, respectively. We expect to resolve certain nonaccrual loans through the acquisition and sale of the underlying real estate collateral.
Investment Securities – The securities portfolio serves as a source of liquidity and earnings and contributes to the management of interest rate risk. Investments are made in various types of liquid assets, including short-term United States Treasury obligations and securities of various federal agencies, obligations of states and political subdivisions, corporate bonds, collateralized loan obligations, certificates of deposit at insured savings and loans and banks, bankers’ acceptances and federal funds. The investment policy also authorizes investment in mutual funds and stocks whose assets conform to the investments that we are authorized to make directly. The investment portfolio decreased by $41.9 million, or 21.5%, to $152.7 million at December 31, 2017, compared with $194.6 million at December 31, 2016 as the Bank sold selected securities to manage liquidity and interest rate risk.
The following table sets forth the carrying value of our securities portfolio at the dates indicated.
|
December 31, 2017 |
December 31, 2016 |
|||||||||||||||||||||||||||||||
|
Amortized Cost |
Gross Unrealized Gains |
Gross Unrealized Losses |
Fair Value |
Amortized Cost |
Gross Unrealized Gains |
Gross Unrealized Losses |
Fair Value |
|||||||||||||||||||||||||
|
(dollars in thousands) |
||||||||||||||||||||||||||||||||
|
Securities available for sale |
||||||||||||||||||||||||||||||||
|
U.S. Government and federal agencies |
$ | 22,105 | $ | 2 | $ | (483 |
) |
$ | 21,624 | $ | 34,757 | $ | 50 | $ | (708 |
) |
$ | 34,099 | ||||||||||||||
|
Agency mortgage-backed: residential |
65,935 | 117 | (1,087 |
) |
64,965 | 103,390 | 455 | (1,492 |
) |
102,353 | ||||||||||||||||||||||
|
Collateralized loan obligations |
25,343 | 182 | (20 |
) |
25,505 | 11,203 | — | — | 11,203 | |||||||||||||||||||||||
|
State and municipal |
33,303 | 508 | (101 |
) |
33,710 | 2,028 | 25 | (8 |
) |
2,045 | ||||||||||||||||||||||
|
Corporate bonds |
6,838 | 78 | — | 6,916 | 3,069 | 24 | (3 |
) |
3,090 | |||||||||||||||||||||||
|
Total available for sale |
$ | 153,524 | $ | 887 | $ | (1,691 |
) |
$ | 152,720 | $ | 154,447 | $ | 554 | $ | (2,211 |
) |
$ | 152,790 | ||||||||||||||
|
Amortized Cost |
Gross Unrecognized Gains |
Gross Unrecognized Losses |
Fair Value |
Amortized Cost |
Gross Unrecognized Gains |
Gross Unrecognized Losses |
Fair Value |
|||||||||||||||||||||||||
|
Securities held to maturity |
||||||||||||||||||||||||||||||||
|
State and municipal |
$ | — | $ | — | $ | — | $ | — | $ | 41,818 | $ | 1,272 | $ | (18 |
) |
$ | 43,072 | |||||||||||||||
|
Total held to maturity |
$ | — | $ | — | $ | — | $ | — | $ | 41,818 | $ | 1,272 | $ | (18 |
) |
$ | 43,072 | |||||||||||||||
In 2013, the Bank transferred a portion of its tax-free municipal and taxable municipal bond portfolios from available for sale (AFS) to held to maturity (HTM). At that time, the transfer occurred at fair value with the unrealized loss of $1.3 million remaining in other comprehensive income. That unrealized loss has subsequently been amortized on the level yield method out of other comprehensive income with an offsetting entry reducing interest income as a yield adjustment through earnings. No gain or loss was recorded at the time of transfer in 2013. Given the Bank’s current balance sheet composition, interest rate risk profile, the current tax environment, and the Bank’s strategic plan, management reassessed the classification of the held to maturity securities and, effective December 1, 2017, transferred $41.4 million of tax-free municipals and taxable municipals from HTM to AFS. As a result, the $702,000 in remaining unamortized loss from the 2013 transfer was reclassified through a book value adjustment of these securities. At December 31, 2017, these securities were carried at fair value with unrealized holding gains and losses reported in other comprehensive income, net of tax, with the remaining securities classified as AFS.
The following table sets forth the contractual maturities, fair values and weighted-average yields for our available for sale securities held at December 31, 2017:
|
Due Within One Year |
After One Year But Within Five Years |
After Five Years But Within Ten Years |
After Ten Years |
Total |
||||||||||||||||||||||||||||||||||||
|
Amount |
Yield |
Amount |
Yield |
Amount |
Yield |
Amount |
Yield |
Amount |
Yield |
|||||||||||||||||||||||||||||||
|
Available for sale |
||||||||||||||||||||||||||||||||||||||||
|
U.S. Government and federal agencies |
$ | — | — |
% |
$ | — | — |
% |
$ | 5,788 | 2.19 |
% |
$ | 15,836 | 2.18 |
% |
$ | 21,624 | 2.18 |
% |
||||||||||||||||||||
|
Agency mortgage-backed: residential |
— | — | 2,956 | 2.64 | 9,415 | 2.31 | 52,594 | 2.46 | 64,965 | 2.45 | ||||||||||||||||||||||||||||||
|
Collateralized loan obligations |
— | — | — | — | 10,631 | 0.28 | 14,874 | 2.59 | 25,505 | 1.63 | ||||||||||||||||||||||||||||||
|
State and municipal |
145 | 2.10 | 19,612 | 3.31 | 11,539 | 3.27 | 2,414 | 5.19 | 33,710 | 3.42 | ||||||||||||||||||||||||||||||
|
Corporate bonds |
— | — | — | — | 3,160 | 4.54 | 3,756 | 5.11 | 6,916 | 4.86 | ||||||||||||||||||||||||||||||
|
Total available for sale |
$ | 145 | 2.10 |
% |
$ | 22,568 | 3.22 |
% |
$ | 40,533 | 2.20 |
% |
$ | 89,474 | 2.61 |
% |
$ | 152,720 | 2.59 |
% |
||||||||||||||||||||
Average yields in the table above were calculated on a tax equivalent basis using a federal income tax rate of 35%. Mortgage-backed securities are securities that have been developed by pooling a number of real estate mortgages. These securities are issued by federal agencies such as Ginnie Mae, Fannie Mae and Freddie Mac, as well as non-agency company issuers. These securities are deemed to have high credit ratings, and minimum regular monthly cash flows of principal and interest. Cash flows from agency backed mortgage-backed securities are guaranteed by the issuing agencies.
Unlike U.S. Treasury and U.S. government agency securities, which have a lump sum payment at maturity, mortgage-backed securities provide cash flows from regular principal and interest payments and principal prepayments throughout the lives of the securities. Mortgage-backed securities that are purchased at a premium will generally return decreasing net yields as interest rates drop because home owners tend to refinance their mortgages. Thus, the premium paid must be amortized over a shorter period. Therefore, those securities purchased at a discount will obtain higher net yields in a decreasing interest rate environment. As interest rates rise, the opposite will generally be true. During a period of increasing interest rates, fixed rate mortgage-backed securities do not tend to experience heavy prepayments of principal and consequently, average life will not be shortened. If interest rates begin to fall, prepayments will generally increase. Non-agency issuer mortgage-backed securities do not carry a government guarantee. We limit our purchases of these securities to bank qualified issues with high credit ratings. We regularly monitor the performance and credit ratings of these securities and evaluate these securities, as we do all of our securities, for other-than-temporary impairment on a quarterly basis. At December 31, 2017, 81.0% of the agency mortgage-backed securities we held had contractual final maturities of more than ten years with a weighted average life of 23.9 years.
Deposits – We attract both short-term and long-term deposits from the general public by offering a wide range of deposit accounts and interest rates. In recent years, we have been required by market conditions to rely increasingly on short to mid-term certificate accounts and other deposit alternatives, which are more responsive to market interest rates.
We primarily rely on our banking office network to attract and retain deposits in our local markets and have in the past leveraged the online channel to attract out-of-market deposits. Market interest rates and rates on deposit products offered by competing financial institutions can significantly affect our ability to attract and retain deposits. During 2017, total deposits decreased $2.9 million compared with 2016. During 2016, total deposits decreased $28.1 million compared with 2015. The decrease in deposits for 2017 and 2016 was primarily in higher cost certificates of deposit balances.
To evaluate our funding needs in light of deposit trends resulting from continually changing conditions, we evaluate simulated performance reports that forecast changes in margins along with other pertinent economic data. We continue to offer attractively priced deposit products along our product line to allow us to retain deposit customers and reduce interest rate risk during various rising and falling interest rate cycles.
We offer savings accounts, interest checking accounts, money market accounts and fixed rate certificates with varying maturities. The flow of deposits is influenced significantly by general economic conditions, changes in interest rates and competition. Management adjusts interest rates, maturity terms, service fees and withdrawal penalties on the Bank’s deposit products periodically. The variety of deposit products allows the Bank to compete more effectively in obtaining funds and to respond with more flexibility to the flow of funds away from depository institutions into outside investment alternatives. However, the ability to attract and maintain deposits and the cost of these funds have been, and will continue to be, significantly affected by market conditions.
The following table sets forth the average daily balances and weighted average rates paid for our deposits for the periods indicated:
|
For the Years Ended December 31, |
||||||||||||||||||||||||
|
2017 |
2016 |
2015 |
||||||||||||||||||||||
|
Average Balance |
Average Rate |
Average Balance |
Average Rate |
Average Balance |
Average Rate |
|||||||||||||||||||
|
(dollars in thousands) |
||||||||||||||||||||||||
|
Demand |
$ | 129,088 | $ | 119,736 | $ | 113,576 | ||||||||||||||||||
|
Interest Checking |
101,980 | 0.13 |
% |
96,294 | 0.13 |
% |
88,814 | 0.13 |
% |
|||||||||||||||
|
Money Market |
145,281 | 0.55 | 136,423 | 0.58 | 112,350 | 0.57 | ||||||||||||||||||
|
Savings |
35,486 | 0.17 | 34,257 | 0.18 | 35,604 | 0.21 | ||||||||||||||||||
|
Certificates of Deposit |
452,443 | 0.93 | 466,007 | 0.88 | 557,441 | 0.96 | ||||||||||||||||||
|
Total Deposits |
$ | 864,278 | $ | 852,717 | $ | 907,785 | ||||||||||||||||||
|
Weighted Average Rate |
0.60 |
% |
0.60 |
% |
0.68 |
% |
||||||||||||||||||
The following table sets forth the average daily balances and weighted average rates paid for our certificates of deposit for the periods indicated:
|
For the Years Ended December 31, |
||||||||||||||||||||||||
|
2017 |
2016 |
2015 |
||||||||||||||||||||||
|
Average Balance |
Average Rate |
Average Balance |
Average Rate |
Average Balance |
Average Rate |
|||||||||||||||||||
|
(dollars in thousands) |
||||||||||||||||||||||||
|
Certificates of Deposit |
||||||||||||||||||||||||
|
Less than $250,000 |
$ | 419,816 | 1.01 |
% |
$ | 437,955 | 0.88 |
% |
$ | 524,279 | 0.95 |
% |
||||||||||||
|
$250,000 or more |
32,627 | 0.92 | 28,052 | 0.97 | 33,162 | 1.12 | ||||||||||||||||||
|
Total |
$ | 452,443 | 0.93 |
% |
$ | 466,007 | 0.88 |
% |
$ | 557,441 | 0.96 |
% |
||||||||||||
The following table shows at December 31, 2017 the amount of our time deposits of $250,000 or more by time remaining until maturity:
|
Maturity Period |
||||||
|
(in thousands) |
||||||
|
Three months or less |
$ | 5,276 | ||||
|
Three months through six months |
1,995 | |||||
|
Six months through twelve months |
3,497 | |||||
|
Over twelve months |
20,963 | |||||
|
Total |
$ | 31,731 | ||||
The Bank maintains competitive pricing on its deposit products, which we believe allows it to retain a substantial percentage of our customers when their time deposits mature.
Borrowing – Deposits are the primary source of funds for lending and investment activities and for general business purposes. We can also use advances (borrowings) from the FHLB of Cincinnati to supplement the pool of lendable funds, meet deposit withdrawal requirements and manage the terms of liabilities. Advances from the FHLB are secured by the Bank’s stock in the FHLB, and substantially all of its first mortgage residential loans. At December 31, 2017, the Bank had $11.8 million in advances outstanding from the FHLB and the capacity to increase borrowings by an additional $79.0 million. The FHLB of Cincinnati functions as a central reserve bank providing credit for savings banks and other member financial institutions. As a member, the Bank is required to own capital stock in the FHLB and is authorized to apply for advances on the security of such stock and certain of our home mortgages and other assets (principally, securities that are obligations of, or guaranteed by, the United States) provided that it meets certain standards related to creditworthiness.
The following table sets forth information about our FHLB advances as of and for the periods indicated:
|
December 31, |
||||||||||||
|
2017 |
2016 |
2015 |
||||||||||
|
(dollars in thousands) |
||||||||||||
|
Average balance outstanding |
$ | 9,184 | $ | 2,967 | $ | 3,473 | ||||||
|
Maximum amount outstanding at any month-end during the period |
26,830 | 22,458 | 8,705 | |||||||||
|
End of period balance |
11,797 | 22,458 | 3,081 | |||||||||
|
Weighted average interest rate: |
||||||||||||
|
At end of period |
1.48 |
% |
0.85 |
% |
2.65 |
% |
||||||
|
During the period |
1.31 |
% |
2.34 |
% |
2.73 |
% |
||||||
Subordinated Capital Note – At December 31, 2017, the Bank had a subordinated capital note outstanding in the principal amount of $2.3 million. The note is unsecured, bears interest at three-month LIBOR plus 300 basis points adjusting quarterly, and qualifies as Tier 2 capital until five years before the note matures on July 1, 2020. Beginning on July 1, 2015, one-fifth of the principal amount of the subordinated note was excluded from Tier 2 capital each year until fully excluded during the year before maturity. At December 31, 2017, a total of $1.7 million of the outstanding balance was included in Tier 2 capital. The note requires quarterly principal payments of $225,000 plus interest. At December 31, 2017, the interest rate on this note was 4.34%.
Junior Subordinated Debentures – At December 31, 2017, the Company had four issues of junior subordinated debentures outstanding totaling $21.0 million as shown in the table below.
|
Description |
Liquidation Amount Trust Preferred Securities |
Issuance Date |
Interest Rate (1) |
Junior Subordinated Debt and Investment in Trust |
Maturity Date |
|||||||
|
(dollars in thousands) |
||||||||||||
|
Porter Statutory Trust II |
$ | 5,000 |
2/13/2004 |
3-month LIBOR + 2.85% |
$ | 5,155 |
2/13/2034 |
|||||
|
Porter Statutory Trust III |
3,000 |
4/15/2004 |
3-month LIBOR + 2.79% |
3,093 |
4/15/2034 |
|||||||
|
Porter Statutory Trust IV |
10,000 |
12/14/2006 |
3-month LIBOR + 1.67% |
10,433 |
3/1/2037 |
|||||||
|
Ascencia Statutory Trust I |
3,000 |
2/13/2004 |
3-month LIBOR + 2.85% |
3,093 |
2/13/2034 |
|||||||
| $ | 21,000 | $ | 21,774 | |||||||||
|
(1) |
As of December 31, 2017, the 3-month LIBOR was 1.69%. |
The trust preferred securities are subject to mandatory redemption, in whole or in part, upon repayment of the subordinated debentures at maturity or their earlier redemption at the liquidation preference. The subordinated debentures are redeemable before the maturity date at our option at their principal amount plus accrued interest.
On April 15, 2016, the Company completed the private placement of 580,000 common shares and 220,000 non-voting common shares to accredited investors resulting in total proceeds of $5.0 million. The investors in the private placement directed a portion of the purchase price to pay all deferred interest payments on junior subordinated debentures, bringing interest payments current through the second quarter of 2016.
The Company has the option to defer interest payments on the subordinated debentures from time to time for a period not to exceed 20 consecutive quarters. Since the third quarter of 2016, we have been deferring interest payments on the junior subordinated debentures held by our trust subsidiaries, requiring the trust subsidiaries to defer distributions on the trust preferred securities held by investors. Deferred distributions on the $21.0 million of trust preferred securities outstanding totaled $1.2 million as of December 31, 2017. The deferral period expires after the second quarter of 2021, at which time we will be required to pay all accrued interest or be in default. A deferral period may begin at the Company’s discression so long as interest payments are current. We are prohibited from paying cash dividends on our preferred and common shares until such time as we have paid all deferred distributions on our trust preferred securities. So long as the Written Agreement remains in effect, we will be required to obtain the approval of the Federal Reserve Bank of St. Louis before making any interest payments on the subordinated debentures.
The Federal Reserve Board rules allow trust preferred securities to be included in Tier 1 capital, subject to quantitative and qualitative limits. Currently, no more than 25% of our Tier 1 capital can consist of trust preferred securities and qualifying perpetual preferred stock. To the extent the amount of our trust preferred securities exceeds the 25% limit, the excess would be includable in Tier 2 capital. As of December 31, 2017, the Company’s trust preferred securities totaled 22% of its Tier 1 capital and 40% of its Tier 2 capital.
Each of the trusts issuing the trust preferred securities holds junior subordinated debentures issued with an original maturity of 30 years. In the last five years before the junior subordinated debentures mature, the associated trust preferred securities are excluded from Tier 1 capital and included in Tier 2 capital. In addition, the trust preferred securities during this five-year period are amortized out of Tier 2 capital by one-fifth each year and excluded from Tier 2 capital completely during the year before maturity.
Senior Debt – On June 30, 2017, the Company entered into a $10.0 million senior secured loan agreement with a commercial bank. The loan matures on June 30, 2022. Interest is payable quarterly at a rate of three-month LIBOR plus 250 basis points through June 30, 2020, at which time quarterly principal payments of $250,000 plus interest will commence. The loan is secured by a first priority pledge of 100% of the issued and outstanding stock of the Bank. The Company may prepay any amount due under the promissory note at any time without premium or penalty.
The Company contributed $9.0 million of the borrowing proceeds to the Bank as common equity Tier 1 capital. The remaining $1.0 million of the borrowing proceeds were retained by the lender in escrow to service quarterly interest payments. At December 31, 2017, the escrow account had a balance of $806,000.
The loan agreement contains customary representations, warranties, covenants and events of default, including the following financial covenants: (i) the Company must maintain minimum cash on hand of not less than $750,000 through June 30, 2018, and not less than $2,500,000 thereafter, (ii) the Company must maintain a total risk based capital ratio at least equal to 9% of risk-weighted assets to June 30, 2018, and 10% thereafter, (iii) the Bank must maintain a total risk based capital ratio at least equal to 10% of risk-weighted assets to June 30, 2018, and 11% thereafter, and (iv) non-performing assets of the Bank may not exceed 2.5% of the Bank’s total assets. Both the Company and Bank were in compliance with the covenants as of December 31, 2017.
Liquidity
Liquidity risk arises from the possibility the Company may not be able to satisfy current or future financial commitments, or may become unduly reliant on alternative funding sources. The objective of liquidity risk management is to ensure that we meet the cash flow requirements of depositors and borrowers, as well as operating cash needs, taking into account all on- and off-balance sheet funding demands. Liquidity risk management also involves ensuring that we meet our cash flow needs at a reasonable cost. We maintain an investment and funds management policy, which identifies the primary sources of liquidity, establishes procedures for monitoring and measuring liquidity, and establishes minimum liquidity requirements in compliance with regulatory guidance. The Asset Liability Committee regularly monitors and reviews our liquidity position.
Funds are available to the Bank from a number of sources, including the sale of securities in the available for sale investment portfolio, principal pay-downs on loans and mortgage-backed securities, customer deposit inflows, and other wholesale funding.
The Bank also borrows from the FHLB to supplement funding requirements. At December 31, 2017, the unused borrowing capacity with the FHLB was $79.0 million. Advances are collateralized by first mortgage residential loans and borrowing capacity is based on the underlying book value of eligible pledged loans.
The Bank also has available on an unsecured basis federal funds borrowing lines from a correspondent bank totaling $5.0 million. Management believes the sources of liquidity are adequate to meet expected cash needs for the foreseeable future. However, the availability of these lines could be affected by our financial position.
Historically, we have also utilized brokered and wholesale deposits to supplement our funding strategy. At December 31, 2017, we had no brokered deposits.
The Company uses cash on hand to service senior debt and to provide for operating cash flow needs. The Company also may issue common equity preferred equity, and debt to support cash flow needs and liquidity requirements. At December 31, 2017, cash on hand totaled $2.0 million, of which, $806,000 is held in escrow by the Company’s senior debt holder to service interest payments.
Capital
Stockholders’ equity increased $39.9 million to $72.7 million at December 31, 2017, compared with $32.7 million at December 31, 2016. The increase was due primarily to current year net income $38.5 million.
The Company had a full valuation allowance against its net deferred tax asset since 2011. During the fourth quarter of 2017, management concluded it was more-likely-than-not the asset would be utilized to reduce future taxes payable related to the future taxable income of the Company, and as such, reversed the valuation allowance. On December 22, 2017, the Tax Cuts and Jobs Act of 2017 was signed into law. Among other significant changes to the tax code, the new law lowered the federal corporate tax rate from 35% to 21% beginning in 2018. As a result, the Company revalued its net deferred tax asset at the new 21% rate. The combination of the reversal of the valuation allowance and the change in federal corporate tax rates, as well as income tax expense for the year, resulted in an income tax benefit of $31.9 million for the year ended December 31, 2017.
On June 30, 2017, the Company entered into a $10.0 million senior secured loan agreement with a commercial bank. The loan matures on June 30, 2022. Interest is payable quarterly at a rate of three-month LIBOR plus 250 basis points through June 30, 2020, at which time quarterly principal payments of $250,000 plus interest will commence. The loan is secured by a first priority pledge of 100% of the issued and outstanding stock of the Bank. The Company may prepay any amount due under the promissory note at any time without premium or penalty. A total of $9.0 million of loan proceeds was injected to the Bank as common equity Tier 1 capital.
On December 16, 2016, the Company completed a 1-for-5 reverse stock split of its issued and outstanding common and non-voting common shares. The reverse stock split was intended to increase the trading price per share of the common shares, with the objective to make the common shares a more attractive and cost effective investment and enhance liquidity for shareholders. All share and per share data in this annual report has been adjusted to reflect the reverse stock split. Preferred shares were not affected by the 1-for-5 reverse stock split.
On April 15, 2016, the Company completed the private placement of 580,000 common shares and 220,000 non-voting common shares to accredited investors, raising total proceeds of $5.0 million. The investors in the private placement directed a portion of purchase price to pay all deferred interest payments on our junior subordinated debentures, bringing interest payments current through the second quarter of 2016. The remaining proceeds were retained for general corporate purposes and to support the Bank.
Each of the federal bank regulatory agencies has established risk-based capital requirements for banking organizations. The Basel III regulatory capital reforms became effective for the Company and Bank on January 1, 2015, and include new minimum risk-based capital and leverage ratios. These rules refine the definition of what constitutes “capital” for purposes of calculating those ratios, including the definitions of Tier 1 capital and Tier 2 capital. The final rules allowed banks and their holding companies with less than $250 billion in assets a one-time opportunity to opt-out of a requirement to include unrealized gains and losses in accumulated other comprehensive income in their capital calculation. The Company and the Bank opted out of this requirement. The rules also establish a “capital conservation buffer” of 2.5% above the regulatory minimum risk-based capital ratios. Once the capital conservation buffer is fully phased in, the minimum ratios are a common equity Tier 1 risk-based capital ratio of 7.0%, a Tier 1 risk-based capital ratio of 8.5%, and a total risk-based capital ratio of 10.5%. The phase-in of the capital conservation buffer requirement began in January 2016 at 0.625% of risk-weighted assets and increases each year until fully implemented in January 2019. An institution is subject to limitations on paying dividends, engaging in share repurchases and paying discretionary bonuses if capital levels fall below minimum levels plus the buffer amounts. These limitations establish a maximum percentage of eligible retained income that could be utilized for such actions.
The following table shows the ratios of Tier 1 capital, common equity Tier 1, and total capital to risk-adjusted assets and the leverage ratios (excluding the capital conservation buffer) for the Bank at December 31, 2017:
|
Regulatory Minimums |
Well-Capitalized Minimums |
Limestone Bank |
||||||||||
|
Tier 1 capital |
6.0 |
% |
8.0 |
% |
10.35 |
% |
||||||
|
Common equity Tier 1 capital |
4.5 | 6.5 | 10.35 | |||||||||
|
Total risk-based capital |
8.0 | 10.0 | 11.61 | |||||||||
|
Tier 1 leverage ratio |
4.0 | 5.0 | 8.70 | |||||||||
Failure to meet minimum capital requirements could result in additional discretionary actions by regulators that, if taken, could have a materially adverse effect on our financial condition.
Off Balance Sheet Arrangements
In the normal course of business, we enter into various transactions, which, in accordance with GAAP, are not included in our consolidated balance sheets. We enter into these transactions to meet the financing needs of our customers. These transactions include commitments to extend credit and standby letters of credit, which involve, to varying degrees, elements of credit risk and interest rate risk in excess of the amounts recognized in the consolidated balance sheets.
The commitments associated with outstanding standby letters of credit and commitments to extend credit as of December 31, 2017 are summarized below. Since commitments associated with letters of credit and commitments to extend credit may expire unused, the amounts shown do not necessarily reflect our actual future cash funding requirements:
|
One year or less |
More than 1 year but less than 3 years |
3 years or more but less than 5 years |
5 years or more |
Total |
||||||||||||||||
|
(dollars in thousands) |
||||||||||||||||||||
|
Commitments to extend credit |
$ | 37,862 | $ | 36,699 | $ | 19,542 | $ | 33,419 | $ | 127,522 | ||||||||||
|
Standby letters of credit |
2,588 | — | 1 | — | 2,589 | |||||||||||||||
|
Total |
$ | 40,450 | $ | 36,699 | $ | 19,543 | $ | 33,419 | $ | 130,111 | ||||||||||
Standby Letters of Credit – Standby letters of credit are written conditional commitments we issue to guarantee the performance of a borrower to a third party. If the borrower does not perform in accordance with the terms of the agreement with the third party, we may be required to fund the commitment. The maximum potential amount of future payments we could be required to make is represented by the contractual amount of the commitment. If the commitment is funded, we would be entitled to seek recovery from the borrower. Our policies generally require that standby letter of credit arrangements be underwritten in a manner consistent with a loan of similar characteristics.
Commitments to Extend Credit – We enter into contractual commitments to extend credit, normally with fixed expiration dates or termination clauses, at specified rates and for specific purposes. Substantially all of our commitments to extend credit are contingent upon borrowers maintaining specific credit standards at the time of loan funding. We minimize our exposure to loss under these commitments by subjecting them to credit approval and monitoring procedures.
Risk Participation Agreements – In connection with the purchase of loan participations, the Bank has entered into risk participation agreements, which had notional amounts totaling $19.8 million at December 31, 2017 and $14.6 million at December 31, 2016.
Contractual Obligations
The following table summarizes our contractual obligations and other commitments to make future payments as of December 31, 2017:
|
One year or less |
More than 1 year but less than 3 years |
3 years or more but less than 5 years |
5 years or more |
Total |
||||||||||||||||
|
(dollars in thousands) |
||||||||||||||||||||
|
Time deposits |
$ | 204,018 | $ | 205,986 | $ | 14,231 | $ | — | $ | 424,235 | ||||||||||
|
FHLB borrowing (1) |
10,200 | 665 | 836 | 96 | 11,797 | |||||||||||||||
|
Subordinated capital note |
900 | 1,350 | — | — | 2,250 | |||||||||||||||
|
Junior subordinated debentures |
— | — | — | 21,000 | 21,000 | |||||||||||||||
|
Senior debt |
— | 500 | 2,000 | 7,500 | 10,000 | |||||||||||||||
|
Total |
$ | 215,118 | $ | 208,501 | $ | 17,067 | $ | 28,596 | $ | 469,282 | ||||||||||
|
(1) |
Fixed rate borrowings with rates ranging from 0% to 5.24%, and maturities ranging from 2018 through 2033, averaging 1.48%. |
Impact of Inflation and Changing Prices
The financial statements and related data presented herein have been prepared in accordance with U.S. generally accepted accounting principles, which require the measurement of financial position and operating results in historical dollars without considering changes in the relative purchasing power of money over time due to inflation.
We have an asset and liability structure that is essentially monetary in nature. As a result, interest rates have a more significant impact on performance than the effects of general levels of inflation. Periods of high inflation are often accompanied by relatively higher interest rates, and periods of low inflation are accompanied by relatively lower interest rates. As market interest rates rise or fall in relation to the rates earned on loans and investments, the value of these assets decreases or increases respectively.
|
Item 7A. |
To minimize the volatility of net interest income and exposure to economic loss that may result from fluctuating interest rates, we manage our exposure to adverse changes in interest rates through asset and liability management activities within guidelines established by our Asset Liability Committee (“ALCO”). The ALCO, which is comprised of senior officers, has the responsibility for approving and ensuring compliance with asset/liability management policies. Interest rate risk is the exposure to adverse changes in the net interest income as a result of market fluctuations in interest rates. The ALCO, on an ongoing basis, monitors interest rate and liquidity risk in order to implement appropriate funding and balance sheet strategies. Management considers interest rate risk to be our most significant market risk.
The Company utilizes an earnings simulation model to analyze net interest income sensitivity. It then evaluates potential changes in market interest rates and their subsequent effects on net interest income. The model projects the effect of instantaneous movements in interest rates of both 100 and 200 basis points that are sustained for one year. Assumptions based on the historical behavior of our deposit rates and balances in relation to changes in interest rates are also incorporated into the model. These assumptions are inherently uncertain and, as a result, the model cannot precisely measure future net interest income or precisely predict the impact of fluctuations in market interest rates on net interest income. Actual results may differ from the model’s simulated results due to timing, magnitude and frequency of interest rate changes as well as changes in market conditions and the application and timing of various management strategies.
Given an instantaneous 100 basis point increase in interest rates, the base net interest income would increase by an estimated 0.9% at December 31, 2017 compared with an decrease of 2.5% at December 31, 2016. The following table indicates the estimated impact on net interest income under various interest rate scenarios for the year ended December 31, 2017, as calculated using the static shock model approach:
|
Change in Future Net Interest Income |
||||||||
|
Dollar Change |
Percentage Change |
|||||||
|
(dollars in thousands) |
||||||||
|
+ 200 basis points |
$ | 545 | 1.7 |
% |
||||
|
+ 100 basis points |
271 | 0.9 | ||||||
|
- 100 basis points |
(1,061 |
) |
(3.3 |
) |
||||
|
- 200 basis points |
(2,384 |
) |
(7.5 |
) |
||||
Implementation of strategies to mitigate the risk of changing interest rates in the future, could lessen our forecasted “base case” net interest income in the event of no interest rate changes. Interest sensitivity at any point in time will be affected by a number of factors. These factors include the mix of interest sensitive assets and liabilities as well as their relative pricing schedules. It is also influenced by market interest rates, deposit growth, loan growth, deposit decay rates and asset prepayment speed assumptions.
The following table sets forth the amounts of our interest-earning assets and interest-bearing liabilities outstanding at December 31, 2017, which we anticipate, based upon certain assumptions, to reprice or mature in each of the future time periods shown. The projected repricing of assets and liabilities anticipates prepayments and scheduled rate adjustments, as well as contractual maturities under an interest rate unchanged scenario within the selected time intervals. While we believe such assumptions are reasonable, we cannot provide assurance that assumed repricing rates will approximate actual future activity.
|
Volume Subject to Repricing Within |
||||||||||||||||||||||||||||
|
0 – 90 Days |
91 – 181 Days |
182 – 365 Days |
1 – 5 Years |
Over 5 Years |
Non- Interest Sensitive |
Total |
||||||||||||||||||||||
|
(dollars in thousands) |
||||||||||||||||||||||||||||
|
Assets: |
||||||||||||||||||||||||||||
|
Federal funds sold and short-term investments |
$ | 25,966 | $ | — | $ | — | $ | — | $ | — | $ | — | $ | 25,966 | ||||||||||||||
|
Investment securities |
46,712 | 2,726 | 7,649 | 58,131 | 37,056 | 516 | 152,790 | |||||||||||||||||||||
|
FHLB stock |
7,323 | — | — | — | — | — | 7,323 | |||||||||||||||||||||
|
Loans held for sale |
70 | — | — | — | — | — | 70 | |||||||||||||||||||||
|
Loans, net of allowance |
272,599 | 48,677 | 84,009 | 260,961 | 45,869 | (8,202 |
) |
703,913 | ||||||||||||||||||||
|
Fixed and other assets |
— | — | — | — | — | 80,739 | 80,739 | |||||||||||||||||||||
|
Total assets |
$ | 352,670 | $ | 51,403 | $ | 91,658 | $ | 319,092 | $ | 82,925 | $ | 73,053 | $ | 970,801 | ||||||||||||||
|
Liabilities and Stockholders’ Equity |
||||||||||||||||||||||||||||
|
Interest-bearing checking, savings, and money market accounts |
$ | 285,403 | $ | — | $ | — | $ | — | $ | — | $ | — | $ | 285,403 | ||||||||||||||
|
Certificates of deposit |
74,560 | 52,197 | 76,126 | 221,184 | 168 | — | 424,235 | |||||||||||||||||||||
|
Borrowed funds |
43,274 | 208 | 233 | 1,187 | 145 | — | 45,047 | |||||||||||||||||||||
|
Other liabilities |
— | — | — | — | — | 143,443 | 143,443 | |||||||||||||||||||||
|
Stockholders’ equity |
— | — | — | — | — | 72,673 | 72,673 | |||||||||||||||||||||
|
Total liabilities and stockholders’ equity |
$ | 403,237 | $ | 52,405 | $ | 76,359 | $ | 222,371 | $ | 313 | $ | 216,116 | $ | 970,801 | ||||||||||||||
|
Period gap |
$ | (50,567 |
) |
$ | (1,002 |
) |
$ | 15,299 | $ | 96,721 | $ | 82,612 | ||||||||||||||||
|
Cumulative gap |
$ | (50,567 |
) |
$ | (51,569 |
) |
$ | (36,270 |
) |
$ | 60,451 | $ | 143,063 | |||||||||||||||
|
Period gap to total assets |
(5.21 |
)% |
(0.10 |
)% |
1.58 |
% |
9.96 |
% |
8.51 |
% |
||||||||||||||||||
|
Cumulative gap to total assets |
(5.21 |
)% |
(5.31 |
)% |
(3.74 |
)% |
6.23 |
% |
14.74 |
% |
||||||||||||||||||
|
Cumulative interest-earning assets to cumulative interest-bearing liabilities |
87.46 |
% |
88.68 |
% |
93.18 |
% |
108.01 |
% |
118.96 |
% |
||||||||||||||||||
The one-year cumulative gap position as of December 31, 2017 was negative $36.3 million or 3.7% of total assets. This is a one-day position that is continually changing and is not necessarily indicative of the Company’s position at any other time. Any gap analysis has inherent shortcomings because certain assets and liabilities may not move proportionally as interest rates change.
|
Item 8. |
The following consolidated financial statements and reports are included in this section:
|
Report of Independent Registered Public Accounting Firm |
|
Consolidated Balance Sheets as of December 31, 2017 and 2016 |
|
Consolidated Statements of Operations for the Years Ended December 31, 2017, 2016, and 2015 |
|
Consolidated Statements of Comprehensive Income (Loss) for the Years Ended December 31, 2017, 2016, and 2015 |
|
Consolidated Statements of Change in Stockholders’ Equity for the Years Ended December 31, 2017, 2016, and 2015 |
|
Consolidated Statements of Cash Flows for the Years Ended December 31, 2017, 2016, and 2015 |
|
Notes to Consolidated Financial Statements |
|
|
Crowe Horwath LLP Independent Member Crowe Horwath International |

REPORT OF INDEPENDENT REGISTERED PUBLIC ACCOUNTING FIRM
Shareholders and the Board of Directors of Porter Bancorp, Inc.
Louisville, Kentucky
Opinion on the Financial Statements
We have audited the accompanying consolidated balance sheets of Porter Bancorp, Inc. (the "Company") as of December 31, 2017 and 2016, the related consolidated statements of operations, comprehensive income (loss), changes in stockholders’ equity, and cash flows for each of the three years in the period ended December 31, 2017, and the related notes (collectively referred to as the "financial statements"). In our opinion, the financial statements present fairly, in all material respects, the financial position of the Company as of December 31, 2017 and 2016, and the results of its operations and its cash flows for each of the three years in the period ended December 31, 2017, in conformity with accounting principles generally accepted in the United States of America.
Basis for Opinion
These financial statements are the responsibility of the Company's management. Our responsibility is to express an opinion on the Company's financial statements based on our audits. We are a public accounting firm registered with the Public Company Accounting Oversight Board (United States) ("PCAOB") and are required to be independent with respect to the Company in accordance with the U.S. federal securities laws and the applicable rules and regulations of the Securities and Exchange Commission and the PCAOB.
We conducted our audits in accordance with the standards of the PCAOB. Those standards require that we plan and perform the audit to obtain reasonable assurance about whether the financial statements are free of material misstatement, whether due to error or fraud. The Company is not required to have, nor were we engaged to perform, an audit of its internal control over financial reporting in accordance with the standards of the PCAOB. As part of our audits we are required to obtain an understanding of internal control over financial reporting but not for the purpose of expressing an opinion on the effectiveness of the Company's internal control over financial reporting. Accordingly, we express no such opinion in accordance with the standards of the PCAOB.
Our audits included performing procedures to assess the risks of material misstatement of the financial statements, whether due to error or fraud, and performing procedures that respond to those risks. Such procedures included examining, on a test basis, evidence regarding the amounts and disclosures in the financial statements. Our audits also included evaluating the accounting principles used and significant estimates made by management, as well as evaluating the overall presentation of the financial statements. We believe that our audits provide a reasonable basis for our opinion.
/s/ Crowe Horwath, LLP
We have served as the Company's auditor since 1998.
Louisville, Kentucky
February 28, 2018
PORTER BANCORP, INC.
CONSOLIDATED BALANCE SHEETS
December 31,
(Dollar amounts in thousands except share data)
|
2017 |
2016 |
|||||||
|
Assets |
||||||||
|
Cash and due from banks |
$ | 8,137 | $ | 9,449 | ||||
|
Interest bearing deposits in banks |
25,966 | 56,867 | ||||||
|
Cash and cash equivalents |
34,103 | 66,316 | ||||||
|
Securities available for sale |
152,720 | 152,790 | ||||||
|
Securities held to maturity (fair value of $0 and $43,072, respectively) |
— | 41,818 | ||||||
|
Loans held for sale |
70 | — | ||||||
|
Loans, net of allowance of $8,202 and $8,967, respectively |
703,913 | 630,269 | ||||||
|
Premises and equipment, net |
16,789 | 17,848 | ||||||
|
Other real estate owned |
4,409 | 6,821 | ||||||
|
Federal Home Loan Bank stock |
7,323 | 7,323 | ||||||
|
Bank owned life insurance |
15,229 | 14,838 | ||||||
|
Deferred taxes, net |
31,313 | — | ||||||
|
Accrued interest receivable and other assets |
4,932 | 7,154 | ||||||
|
Total assets |
$ | 970,801 | $ | 945,177 | ||||
|
Liabilities and Stockholders’ Equity |
||||||||
|
Deposits |
||||||||
|
Non-interest bearing |
$ | 137,386 | $ | 124,395 | ||||
|
Interest bearing |
709,638 | 725,530 | ||||||
|
Total deposits |
847,024 | 849,925 | ||||||
|
Federal Home Loan Bank advances |
11,797 | 22,458 | ||||||
|
Accrued interest payable and other liabilities |
6,057 | 15,911 | ||||||
|
Subordinated capital note |
2,250 | 3,150 | ||||||
|
Junior subordinated debentures |
21,000 | 21,000 | ||||||
|
Senior debt |
10,000 | — | ||||||
|
Total liabilities |
898,128 | 912,444 | ||||||
|
Commitments and contingent liabilities (Note 16) |
— | — | ||||||
|
Stockholders’ equity |
||||||||
|
Preferred stock, no par |
||||||||
|
Series E - 6,198 issued and outstanding; Liquidation preference of $6.2 million |
1,644 | 1,644 | ||||||
|
Series F - 4,304 issued and outstanding; Liquidation preference of $4.3 million |
1,127 | 1,127 | ||||||
|
Total preferred stockholders’ equity |
2,771 | 2,771 | ||||||
|
Common stock, no par, 39,000,000 shares authorized, 6,039,864 and 4,632,933 voting, and 220,000 and 1,591,600 non-voting shares issued and outstanding, respectively |
125,729 | 125,729 | ||||||
|
Additional paid-in capital |
24,497 | 24,097 | ||||||
|
Retained deficit |
(75,108 |
) |
(113,561 |
) |
||||
|
Accumulated other comprehensive loss |
(5,216 |
) |
(6,303 |
) |
||||
|
Total common stockholders’ equity |
69,902 | 29,962 | ||||||
|
Total stockholders' equity |
72,673 | 32,733 | ||||||
|
Total liabilities and stockholders’ equity |
$ | 970,801 | $ | 945,177 | ||||
See accompanying notes.
PORTER BANCORP, INC.
CONSOLIDATED STATEMENTS OF OPERATIONS
Years Ended December 31,
(Dollar amounts in thousands except per share data)
|
2017 |
2016 |
2015 |
||||||||||
|
Interest income |
||||||||||||
|
Loans, including fees |
$ | 31,866 | $ | 30,537 | $ | 31,251 | ||||||
|
Taxable securities |
4,399 | 3,886 | 4,076 | |||||||||
|
Tax exempt securities |
571 | 620 | 764 | |||||||||
|
Federal funds sold and other |
686 | 559 | 483 | |||||||||
| 37,522 | 35,602 | 36,574 | ||||||||||
|
Interest expense |
||||||||||||
|
Deposits |
5,190 | 5,093 | 6,160 | |||||||||
|
Federal Home Loan Bank advances |
120 | 70 | 95 | |||||||||
|
Senior debt |
194 | — | — | |||||||||
|
Junior subordinated debentures |
753 | 671 | 606 | |||||||||
|
Subordinated capital note |
148 | 147 | 161 | |||||||||
|
Federal funds purchased and other |
— | — | 1 | |||||||||
| 6,405 | 5,981 | 7,023 | ||||||||||
|
Net interest income |
31,117 | 29,621 | 29,551 | |||||||||
|
Negative provision for loan losses |
(800 | ) | (2,450 | ) | (4,500 | ) | ||||||
|
Net interest income after negative provision for loan losses |
31,917 | 32,071 | 34,051 | |||||||||
|
Non-interest income |
||||||||||||
|
Service charges on deposit accounts |
2,253 | 1,958 | 1,851 | |||||||||
|
Bank card interchange fees |
972 | 849 | 839 | |||||||||
|
Income from bank owned life insurance |
412 | 417 | 295 | |||||||||
|
Other real estate owned rental income |
— | 456 | 1,346 | |||||||||
|
Net gain on sales of securities |
288 | 216 | 1,766 | |||||||||
|
Gain on extinguishment of junior subordinated debt |
— | — | 883 | |||||||||
|
Other |
930 | 868 | 715 | |||||||||
| 4,855 | 4,764 | 7,695 | ||||||||||
|
Non-interest expense |
||||||||||||
|
Salaries and employee benefits |
15,090 | 15,508 | 15,857 | |||||||||
|
Occupancy and equipment |
3,420 | 3,517 | 3,449 | |||||||||
|
FDIC insurance |
1,412 | 1,660 | 2,212 | |||||||||
|
Data processing expense |
1,256 | 1,185 | 1,128 | |||||||||
|
Marketing expense |
1,098 | 973 | 560 | |||||||||
|
State franchise and deposit tax |
956 | 965 | 1,120 | |||||||||
|
Professional fees |
978 | 1,568 | 2,885 | |||||||||
|
Communications |
722 | 706 | 663 | |||||||||
|
Insurance expense |
540 | 565 | 589 | |||||||||
|
Postage and delivery |
395 | 359 | 400 | |||||||||
|
Litigation and loan collection expense |
179 | 8,805 | 1,141 | |||||||||
|
Other real estate owned expense |
1,973 | 1,541 | 12,302 | |||||||||
|
Other |
2,199 | 2,215 | 2,653 | |||||||||
| 30,218 | 39,567 | 44,959 | ||||||||||
|
Income (loss) before income taxes |
6,554 | (2,732 |
) |
(3,213 |
) |
|||||||
|
Income tax expense (benefit) |
(31,899 |
) |
21 | — | ||||||||
|
Net income (loss) |
38,453 | (2,753 |
) |
(3,213 |
) |
|||||||
|
Less: |
||||||||||||
|
Earnings (loss) allocated to participating securities |
967 | (88 |
) |
(336 |
) |
|||||||
|
Net income (loss) attributable to common shareholders |
$ | 37,486 | $ | (2,665 |
) |
$ | (2,877 |
) |
||||
|
Basic and diluted income (loss) per common share |
$ | 6.15 | $ | (0.46 |
) |
$ | (0.62 |
) |
||||
See accompanying notes.
PORTER BANCORP, INC.
CONSOLIDATED STATEMENTS OF COMPREHENSIVE INCOME (LOSS)
Years Ended December 31,
(in thousands)
|
2017 |
2016 |
2015 |
||||||||||
|
Net income (loss) |
$ | 38,453 | $ | (2,753 |
) |
$ | (3,213 |
) |
||||
|
Other comprehensive income (loss): |
||||||||||||
|
Unrealized gain (loss) on securities: |
||||||||||||
|
Unrealized gain (loss) arising during the period |
1,141 | (1,917 |
) |
(490 |
) |
|||||||
|
Transfer of investment securities from held to maturity to available for sale |
702 | — | — | |||||||||
|
Amortization during the period of net unrealized loss transferred to held to maturity |
119 | 129 | 129 | |||||||||
|
Reclassification of adjustment for gains included in net income |
(288 |
) |
(216 |
) |
(1,766 |
) |
||||||
|
Net unrealized gain/(loss) recognized in comprehensive income |
1,674 | (2,004 |
) |
(2,127 |
) |
|||||||
|
Tax effect |
(587 |
) |
— | — | ||||||||
|
Other comprehensive income (loss) |
1,087 | (2,004 |
) |
(2,127 |
) |
|||||||
|
Comprehensive income (loss) |
$ | 39,540 | $ | (4,757 |
) |
$ | (5,340 |
) |
||||
See accompanying notes.
PORTER BANCORP, INC.
CONSOLIDATED STATEMENTS OF CHANGES IN STOCKHOLDERS’ EQUITY
Years Ended December 31,
(Dollar amounts in thousands except share and per share data)
| Shares |
Amount |
||||||||||||||||||||||||||||||||||||||||||||||||||||||||
| Preferred | Preferred | Common | |||||||||||||||||||||||||||||||||||||||||||||||||||||||
|
Voting and Non-voting Common |
Series B |
Series D |
Series E |
Series F |
Common |
Series B |
Series D |
Series E |
Series F |
Additional Paid-In Capital |
Retained Earnings (Deficit) |
Accumulated Other Compre- hensive Income (Loss) |
Total |
||||||||||||||||||||||||||||||||||||||||||||
|
Balances, December 31, 2014 |
2,978,103 | 40,536 | 64,580 | 6,198 | 4,304 | $ | 113,238 | $ | 2,229 | $ | 3,552 | $ | 1,644 | $ | 1,127 | $ | 21,442 | $ | (107,595 |
) |
$ | (2,172 |
) |
$ | 33,465 | ||||||||||||||||||||||||||||||||
|
Issuance of unvested stock |
183,148 | — | — | — | — | — | — | — | — | — | — | — | — | — | |||||||||||||||||||||||||||||||||||||||||||
|
Terminated stock |
(107,696 |
) |
— | — | — | — | — | — | — | — | — | — | — | — | — | ||||||||||||||||||||||||||||||||||||||||||
|
Forfeited unvested stock |
(6,368 |
) |
— | — | — | — | — | — | — | — | — | — | — | — | — | ||||||||||||||||||||||||||||||||||||||||||
|
Stock-based compensation expense |
— | — | — | — | — | — | — | — | — | — | 445 | — | — | 445 | |||||||||||||||||||||||||||||||||||||||||||
|
Net loss |
— | — | — | — | — | — | — | — | — | — | — | (3,213 |
) |
— | (3,213 |
) |
|||||||||||||||||||||||||||||||||||||||||
|
Net change in accumulated other comprehensive income, net of taxes |
— | — | — | — | — | — | — | — | — | — | — | — | (2,127 |
) |
(2,127 |
) |
|||||||||||||||||||||||||||||||||||||||||
|
Debt to equity exchange |
240,000 | — | — | — | — | 1,680 | — | — | — | — | 1,767 | — | — | 3,447 | |||||||||||||||||||||||||||||||||||||||||||
|
Conversion of preferred stock to common and non-voting common stock |
2,102,320 | (40,536 |
) |
(64,580 |
) |
— | — | 5,781 | (2,229 |
) |
(3,552 |
) |
— | — | — | — | — | — | |||||||||||||||||||||||||||||||||||||||
|
Balances, December 31, 2015 |
5,389,507 | — | — | 6,198 | 4,304 | $ | 120,699 | $ | — | $ | — | $ | 1,644 | $ | 1,127 | $ | 23,654 | $ | (110,808 |
) |
$ | (4,299 |
) |
$ | 32,017 | ||||||||||||||||||||||||||||||||
|
Issuance of unvested stock |
35,465 | — | — | — | — | — | — | — | — | — | — | — | — | — | |||||||||||||||||||||||||||||||||||||||||||
|
Forfeited unvested stock |
(1,972 |
) |
— | — | — | — | — | — | — | — | — | — | — | — | — | ||||||||||||||||||||||||||||||||||||||||||
|
Reverse stock split rounding shares |
1,533 | — | — | — | — | — | — | — | — | — | — | — | — | — | |||||||||||||||||||||||||||||||||||||||||||
|
Stock-based compensation expense |
— | — | — | — | — | — | — | — | — | — | 443 | — | — | 443 | |||||||||||||||||||||||||||||||||||||||||||
|
Net loss |
— | — | — | — | — | — | — | — | — | — | — | (2,753 |
) |
— | (2,753 |
) |
|||||||||||||||||||||||||||||||||||||||||
|
Net change in accumulated other comprehensive income, net of taxes |
— | — | — | — | — | — | — | — | — | — | — | — | (2,004 |
) |
(2,004 |
) |
|||||||||||||||||||||||||||||||||||||||||
|
Issuance of stock |
800,000 | — | — | — | — | 5,030 | — | — | — | — | — | — | — | 5,030 | |||||||||||||||||||||||||||||||||||||||||||
|
Balances, December 31, 2016 |
6,224,533 | — | — | 6,198 | 4,304 | $ | 125,729 | $ | — | $ | — | $ | 1,644 | $ | 1,127 | $ | 24,097 | $ | (113,561 |
) |
$ | (6,303 |
) |
$ | 32,733 | ||||||||||||||||||||||||||||||||
|
Issuance of unvested stock |
37,865 | — | — | — | — | — | — | — | — | — | — | — | — | — | |||||||||||||||||||||||||||||||||||||||||||
|
Forfeited unvested stock |
(1,316 |
) |
— | — | — | — | — | — | — | — | — | — | — | — | — | ||||||||||||||||||||||||||||||||||||||||||
|
Reverse stock split rounding shares |
(1,218 |
) |
— | — | — | — | — | — | — | — | — | — | — | — | — | ||||||||||||||||||||||||||||||||||||||||||
|
Stock-based compensation expense |
— | — | — | — | — | — | — | — | — | — | 400 | — | — | 400 | |||||||||||||||||||||||||||||||||||||||||||
|
Net income |
— | — | — | — | — | — | — | — | — | — | — | 38,453 | — | 38,453 | |||||||||||||||||||||||||||||||||||||||||||
|
Net change in accumulated other comprehensive income, net of taxes |
— | — | — | — | — | — | — | — | — | — | — | — | 1,087 | 1,087 |
|
||||||||||||||||||||||||||||||||||||||||||
|
Balances, December 31, 2017 |
6,259,864 | — | — | 6,198 | 4,304 | $ | 125,729 | $ | — | $ | — | $ | 1,644 | $ | 1,127 | $ | 24,497 | $ | (75,108 |
) |
$ | (5,216 |
) |
$ | 72,673 | ||||||||||||||||||||||||||||||||
See accompanying notes.
PORTER BANCORP, INC.
CONSOLIDATED STATEMENTS OF CASH FLOWS
Years Ended December 31,
(in thousands)
|
2017 |
2016 |
2015 |
||||||||||
|
Cash flows from operating activities |
||||||||||||
|
Net income (loss) |
$ | 38,453 | $ | (2,753 |
) |
$ | (3,213 |
) |
||||
|
Adjustments to reconcile net income (loss) to net cash from operating activities |
||||||||||||
|
Depreciation and amortization |
1,239 | 1,725 | 1,711 | |||||||||
|
Negative provision for loan losses |
(800 |
) |
(2,450 |
) |
(4,500 |
) |
||||||
|
Net amortization on securities |
1,246 | 1,297 | 1,434 | |||||||||
|
Stock-based compensation expense |
400 | 443 | 445 | |||||||||
|
Deferred taxes, net |
(31,899 |
) |
— | — | ||||||||
|
Gain on extinguishment of junior subordinated debt |
— | — | (883 |
) |
||||||||
|
Net (gain) loss on sales of loans held for sale |
(46 |
) |
(86 |
) |
204 | |||||||
|
Loans originated for sale |
(2,859 |
) |
(5,145 |
) |
(6,652 |
) |
||||||
|
Proceeds from sales of loans held for sale |
2,835 | 5,417 | 6,548 | |||||||||
|
Net (gain) loss on sales of other real estate owned |
(74 |
) |
(222 |
) |
74 | |||||||
|
Net write-down of other real estate owned |
1,963 | 1,180 | 9,855 | |||||||||
|
Net realized (gain) loss on sales and calls of investment securities |
(288 |
) |
(216 |
) |
(1,766 |
) |
||||||
|
Net (gain) loss on sale of premises and equipment |
3 | (1 |
) |
— | ||||||||
|
Increase in cash surrender value of owned life insurance, net of premium expense |
(391 |
) |
(397 |
) |
(274 |
) |
||||||
|
Net change in accrued interest receivable and other assets |
2,079 | (814 |
) |
810 | ||||||||
|
Net change in accrued interest payable and other liabilities |
(9,854 |
) |
8,133 | 267 | ||||||||
|
Net cash from operating activities |
2,007 | 6,111 | 4,060 | |||||||||
|
Cash flows from investing activities |
||||||||||||
|
Purchases of available for sale securities |
(21,112 |
) |
(41,827 |
) |
(21,828 |
) |
||||||
|
Sales and calls of available for sale securities |
41,686 | 8,311 | 45,012 | |||||||||
|
Maturities and prepayments of available for sale securities |
21,838 | 22,876 | 21,084 | |||||||||
|
Proceeds from calls of held to maturity securities |
47 | — | — | |||||||||
|
Proceeds from maturities of held to maturity securities |
145 | |||||||||||
|
Proceeds from sales of loans not originated for sale |
— | — | 8,640 | |||||||||
|
Proceeds from sale of other real estate owned |
793 | 12,438 | 22,567 | |||||||||
|
Loan originations and payments, net |
(73,202 |
) |
(22,368 |
) |
(2,239 |
) |
||||||
|
Proceeds from sale of premises and equipment |
331 | 268 | — | |||||||||
|
Purchases of premises and equipment |
(284 |
) |
(464 |
) |
(385 |
) |
||||||
|
Purchase of bank owned life insurance |
— | (5,000 |
) |
— | ||||||||
|
Net cash from investing activities |
(29,758 |
) |
(25,766 |
) |
72,851 | |||||||
|
Cash flows from financing activities |
||||||||||||
|
Net change in deposits |
(2,901 |
) |
(28,072 |
) |
(48,844 |
) |
||||||
|
Net change in repurchase agreements |
— | — | (1,341 |
) |
||||||||
|
Repayment of Federal Home Loan Bank advances |
(55,661 |
) |
(623 |
) |
(17,671 |
) |
||||||
|
Advances from Federal Home Loan Bank |
45,000 | 20,000 | 5,000 | |||||||||
|
Repayment of subordinated capital note |
(900 |
) |
(900 |
) |
(900 |
) |
||||||
|
Proceeds from senior debt |
10,000 | — | — | |||||||||
|
Issuance of common stock |
— | 2,231 | — | |||||||||
|
Net cash from financing activities |
(4,462 |
) |
(7,364 |
) |
(63,756 |
) |
||||||
|
Net change in cash and cash equivalents |
(32,213 |
) |
(27,019 |
) |
13,155 | |||||||
|
Beginning cash and cash equivalents |
66,316 | 93,335 | 80,180 | |||||||||
|
Ending cash and cash equivalents |
$ | 34,103 | $ | 66,316 | $ | 93,335 | ||||||
|
Supplemental cash flow information: |
||||||||||||
|
Interest paid |
$ | 5,665 | $ | 5,253 | $ | 7,076 | ||||||
|
Income taxes paid (refunded) |
— | 21 | — | |||||||||
|
Supplemental non-cash disclosure: |
||||||||||||
|
Proceeds from common stock issuance directed by investors to pay junior subordinated debt interest |
$ | — | 2,799 | — | ||||||||
|
Transfer from loans to other real estate |
270 | $ | 1,273 | $ | 5,513 | |||||||
|
Financed sales of other real estate owned |
— | 270 | — | |||||||||
|
Effect of junior subordinated debt to equity exchange |
— | — | 4,330 | |||||||||
|
Transfer from held to maturity to available for sale securities |
41,380 | — | — | |||||||||
|
AOCI component of transfer from held to maturity to available for sale, net of tax |
456 | — | — | |||||||||
See accompanying notes.
PORTER BANCORP, INC. AND SUBSIDIARY
NOTES TO CONSOLIDATED FINANCIAL STATEMENTS
December 31, 2017, 2016 and 2015
NOTE 1 – SUMMARY OF SIGNIFICANT ACCOUNTING POLICIES
Nature of Operations and Principles of Consolidation – The consolidated financial statements include Porter Bancorp, Inc. (Company) and its subsidiary, PBI Bank (Bank). The Bank completed a name change to Limestone Bank on February 20, 2018. The Company owns a 100% interest in the Bank.
The Company provides financial services through its offices in Central and South Central Kentucky, Lexington and Louisville. Its primary deposit products are checking, savings, and term certificate accounts, and its primary lending products are residential mortgage, commercial, agricultural, and real estate loans. Substantially all loans are collateralized by specific items of collateral including business assets and real estate. Commercial loans are expected to be repaid from cash flow from operations of businesses. There are no significant concentrations of loans to any one industry or customer. However, borrowers’ ability to repay their loans is dependent on the real estate and general economic conditions in the area. Other financial instruments which potentially represent concentrations of credit risk include deposit accounts in other financial institutions, federal funds sold, municipal securities, collateralized loan obligations, corporate securities, and bank owned life insurance.
Use of Estimates – To prepare financial statements in conformity with U.S. generally accepted accounting principles, management makes estimates and assumptions based on available information. These estimates and assumptions affect the amounts reported in the financial statements and the disclosures provided, and future results could differ.
Cash and Cash Equivalents – For the purpose of presentation in the statements of cash flows, the Company considers all cash and amounts due from depository institutions as well as interest bearing deposits in banks that mature within one year and are carried at cost to be cash equivalents. The Bank is required to maintain average reserve balances with the Federal Reserve Bank of St. Louis.
Securities – Debt securities are classified as held to maturity and carried at amortized cost when management has the intent and ability to hold them to maturity. Debt securities are classified as available for sale when they might be sold before maturity. Securities available for sale are carried at fair value, with unrealized holding gains and losses reported in other comprehensive income.
Interest income includes amortization of purchase premium or discount. Premiums and discounts on securities are amortized on the level-yield method anticipating prepayments on mortgage backed securities. Gains and losses on sales are recorded on the trade date and determined using the specific identification method.
Management evaluates securities for other-than-temporary impairment (“OTTI”) on at least a quarterly basis, and more frequently when economic or market conditions warrant such an evaluation. For securities in an unrealized loss position, management considers the extent and duration of the unrealized loss, and the financial condition and near-term prospects of the issuer. Management also assesses whether it intends to sell, or it is more likely than not that it will be required to sell, a security in an unrealized loss position before recovery of its amortized cost basis. If either of the criteria regarding intent or requirement to sell is met, the entire difference between amortized cost and fair value is recognized as impairment through earnings. For debt securities that do not meet the aforementioned criteria, the amount of impairment is split into 1) OTTI related to credit loss, which is recognized in the income statement and 2) OTTI related to other factors, which is recognized in other comprehensive income. The credit loss is defined as the difference between the present value of the cash flows expected to be collected and the amortized cost basis.
Loans Held for Sale – Loans held for sale include residential mortgage loans originated for sale into the secondary market and are carried at the lower of aggregate cost or fair value, as determined by outstanding commitments from investors. Net unrealized losses, if any, are recorded as a valuation allowance and charged to earnings.
Mortgage loans held for sale are generally sold with servicing rights released. If sold with servicing retained, the carrying value of mortgage loans sold is reduced by the amount allocated to the servicing right. Gains and losses on sales of mortgage loans are based on the difference between the selling price and the carrying value of the related loan sold.
Mortgage banking derivatives used in the ordinary course of business consist of mandatory forward sales contracts and rate lock loan commitments. Forward contracts represent future commitments to deliver loans at a specified price and date and are used to manage interest rate risk on loan commitments and mortgage loans held for sale. Rate lock commitments represent commitments to fund loans at a specific rate. These derivatives involve underlying items, such as interest rates, and are designed to transfer risk. Substantially all of these instruments expire within 60 days from the date of issuance. Notional amounts are amounts on which calculations and payments are based, but which do not represent credit exposure, as credit exposure is limited to the amounts required to be received or paid. Commitments to deliver loans and rate lock loan commitments were insignificant at year end.
Loans – Loans that management has the intent and ability to hold for the foreseeable future or until maturity or payoff are reported at the principal balance outstanding, net of deferred loan fees and costs, and an allowance for loan losses. Interest income is accrued on the unpaid principal balance. Loan origination fees, net of certain direct origination costs, are deferred and recognized in interest income using the level-yield method without anticipating prepayments. The recorded investment in loans includes the outstanding principal balance and unamortized deferred origination costs and fees.
Interest income recognition on mortgage and commercial loans is discontinued at the time the loan is 90 days delinquent unless the loan is well collateralized and in process of collection. Consumer loans are typically charged off no later than 90 days past due. Past due status is based on the contractual terms of the loan. In all cases, loans are placed on nonaccrual or charged off at an earlier date if collection of principal or interest is not expected.
All interest accrued but not received for loans placed on nonaccrual is reversed against interest income. Interest received on such loans is accounted for on the cash-basis or cost-recovery method, until qualifying for return to accrual. Loans are returned to accrual status when all the principal and interest amounts contractually due are brought current and future payments are reasonably assured.
Allowance for Loan Losses – The allowance for loan losses is a valuation allowance for probable incurred credit losses. Loan losses are charged against the allowance when management believes the uncollectability of a loan balance is confirmed. Subsequent recoveries, if any, are credited to the allowance. Management estimates the allowance balance required using past loan loss experience, the nature and volume of the portfolio, information about specific borrower situations and estimated collateral values, economic conditions, and other factors. Allocations of the allowance may be made for specific loans, but the entire allowance is available for any loan that, in our judgment, should be charged off.
The allowance consists of specific and general components. The specific component relates to loans that are individually classified as impaired. A loan is deemed impaired when, based on current information and events, it is probable that the Company will be unable to collect all amounts due according to the contractual terms of the loan agreement. Loans for which the terms have been modified resulting in a concession, and for which the borrower is experiencing financial difficulties, are considered troubled debt restructurings and treated as impaired.
Factors considered in determining impairment include payment status, collateral value, and the probability of collecting scheduled principal and interest payments when due. Loans that experience insignificant payment delays and payment shortfalls generally are not classified as impaired. The significance of payment delays and payment shortfalls is determined on a case-by-case basis, taking into consideration all of the circumstances surrounding the loan and the borrower, including the length of the delay, the reasons for the delay, the borrower’s prior payment record, and the amount of the shortfall in relation to the principal and interest owed.
If a loan is impaired, a portion of the allowance is allocated so that the loan is reported, net, at the present value of estimated future cash flows using the loan’s existing rate or at the fair value of collateral if repayment is expected solely from the collateral. Large groups of smaller balance homogeneous loans, such as consumer and residential real estate loans, are collectively evaluated for impairment and are not separately identified for impairment disclosures. Troubled debt restructurings are separately identified for impairment disclosures and are measured at the present value of estimated future cash flows using the loan’s effective rate at inception. If a troubled debt restructuring is considered to be a collateral dependent loan, the loan is reported at the fair value of the collateral. For troubled debt restructurings that subsequently default, the amount of reserve is determined in accordance with the accounting policy for the allowance for loan losses.
The general component covers non-impaired loans and is based on historical loss experience adjusted for current factors. The historical loss experience is determined by portfolio segment and is based on actual loss history experienced over the most recent four years with weighting towards the most recent periods. This actual loss experience is supplemented with other economic factors based on the risks present for each portfolio segment. These economic factors include consideration of the following: changes in lending policies, procedures, and practices; effects of any change in risk selection and underwriting standards; national and local economic trends and conditions; industry conditions; trends in volume and terms of loans; experience, ability and depth of lending management and other relevant staff; levels of and trends in delinquencies and impaired loans; levels of and trends in charge-offs and recoveries; and effects of changes in credit concentrations.
A portfolio segment is defined as the level at which an entity develops and documents a systematic methodology to determine its allowance for loan losses. Management identified the following portfolio segments: commercial, commercial real estate, residential real estate, consumer, agricultural, and other.
|
● |
Commercial loans are made to businesses and depend on the strength of the industries, related borrowers, and cash flow from the businesses. Commercial loans are advances for equipment purchases, or to provide working capital, or to meet other financing needs of business enterprises. These loans may be secured by accounts receivable, inventory, equipment or other business assets. Financial information is obtained from the borrowers to evaluate their ability to repay the loans. |
|
● |
Commercial real estate loans are affected by the local commercial real estate market and the local economy. Commercial real estate loans include loans on commercial properties occupied by borrowers and/or tenants. Construction and development loans are a component of this segment. These loans are generally secured by land under development or homes and commercial buildings under construction. Appraisals are obtained to support the loan amount. Financial information is obtained from the borrowers and/or the individual project to evaluate cash flows sufficiency to service the debt. |
|
● |
Residential real estate loans are affected by the local residential real estate market, local economy, and, for variable rate mortgages, movement in indices tied to these loans. For owner occupied residential loans, the borrowers’ repayment ability is evaluated through a review of credit scores and debt to income ratios. For non-owner occupied residential loans, such as rental real estate, financial information is obtained from the borrowers and/or the individual project to evaluate cash flows sufficiency to service the debt. Appraisals are obtained to support the loan amount. |
|
● |
Consumer loans depend on local economies. Consumer loans are generally secured by consumer assets, but may be unsecured. Management evaluates the borrowers’ repayment ability through a review of credit scores and an evaluation of debt to income ratios. |
|
● |
Agriculture loans depend on the industries tied to these loans and are generally secured by livestock, crops, and/or equipment, but may be unsecured. Management evaluates the borrowers’ repayment ability through financial and business performance review. |
|
● |
Other loans include loans to municipalities, loans secured by stock, and overdrafts. For municipal loans, management evaluates the borrowers’ revenue streams as well as ability to repay form general funds. For loans secured by stock, management evaluates the market value of the stock securing the loan in relation to the loan amount. Overdrafts are funded based on pre-established criteria related to the deposit account relationship. |
Management analyzes key relevant risk characteristics for each portfolio segment having determined that loans in each segment possess similar general risk characteristics that are analyzed in connection with loan underwriting processes and procedures. In determining the allocated allowance, the weighted average loss rates over the most recent four years are used with weighting towards the most recent periods. Commercial real estate qualitative adjustment considerations include trends in the markets for underlying collateral values, risks related to tenant rents, and economic factors such as decreased sales demand, elevated inventory levels, and declining collateral values. Residential real estate loan considerations include macro economic factors such as unemployment rates, trends in vacancy rates, and home value trends. The commercial and agricultural portfolio qualitative adjustments are related to economic and portfolio performance trends. The agricultural, consumer and other portfolios are less significant in terms of size and risk is assessed based on the smaller dollar size of these loans and the more geographical areas where the collateral is located.
Transfers of Financial Assets – Transfers of financial assets are accounted for as sales, when control over the assets has been relinquished. Control over transferred assets is deemed to be surrendered when the assets have been isolated from the Company, the transferee obtains the right (free of conditions that constrain it from taking advantage of that right) to pledge or exchange the transferred assets, and the Company does not maintain effective control over the transferred assets through an agreement to repurchase them before their maturity.
Other Real Estate Owned (“OREO”) – Assets acquired through or instead of loan foreclosure are initially recorded at fair value less estimated costs to sell when acquired, establishing a new cost basis. These assets are subsequently accounted for at the lower of cost or fair value, less estimated costs to sell. If fair value declines subsequent to foreclosure, a write-down is recorded through expense. Costs after acquisition are expensed.
Premises and Equipment – Land is carried at cost. Premises and equipment are stated at cost less accumulated depreciation. Buildings and related components are depreciated using the straight-line method with useful lives generally ranging from 5 to 40 years. Furniture, fixtures and equipment are depreciated using the straight-line or accelerated method with useful lives generally ranging from 2 to 10 years.
Federal Home Loan Bank (FHLB) Stock – The Bank is a member of the FHLB system. Members are required to own a certain amount of stock based on the level of borrowings and other factors, and may invest in additional amounts. FHLB stock is carried at cost, classified as a restricted security, and periodically evaluated for impairment. Because this stock is viewed as long term investment, impairment is based on ultimate recovery of par value. Both cash and stock dividends are reported as income.
Intangible Assets – Intangible assets with definite useful lives are included with other assets and amortized over their estimated useful lives to their estimated residual values, if any. Other intangible assets consist of core deposit intangible assets arising from whole bank and branch acquisitions. They are initially measured at fair value and then are amortized on an accelerated or straight-line basis over their estimated useful lives, which range from 7 to 10 years.
Bank Owned Life Insurance – The Bank has purchased life insurance policies on certain key executives. Company owned life insurance is recorded at the amount that can be realized under the insurance contract at the balance sheet date, which is the cash surrender value adjusted for other charges or other amounts due that are probable at settlement.
Long-Term Assets – Premises and equipment, other intangible assets, and other long-term assets are reviewed for impairment when events indicate their carrying amount may not be recoverable from future undiscounted cash flows. If impaired, the assets are recorded at fair value through a charge to earnings.
Benefit Plans – Employee 401(k) and profit sharing plan expense is the amount of matching contributions. Deferred compensation and supplemental retirement plan expense allocates the benefits over years of service.
Stock-Based Compensation – Compensation cost is recognized for unvested stock awards issued to employees, based on the fair value of these awards at the date of grant. The market price of the Corporation’s common stock at the date of grant is used for restricted stock awards. Compensation cost is recognized over the required service period, generally defined as the vesting period. For awards with graded vesting, compensation cost is recognized on a straight-line basis over the requisite service period for the entire award.
Income Taxes – Income tax expense is the total of the current year income tax due or refundable and the change in deferred tax assets and liabilities. Deferred tax assets and liabilities are the expected future tax amounts for the temporary differences between carrying amounts and tax bases of assets and liabilities, computed using enacted tax rates. A valuation allowance, if needed, reduces deferred tax assets to the amount expected to be realized.
A tax position is recognized as a benefit only if it is "more likely than not" that the tax position would be sustained in a tax examination, with a tax examination being presumed to occur. The amount recognized is the largest amount of tax benefit that is greater than 50% likely of being realized on examination. For tax positions not meeting the "more likely than not" test, no tax benefit is recorded. The Company recognizes interest and/or penalties related to income tax matters in income tax expense.
Loan Commitments and Related Financial Instruments – Financial instruments include off-balance sheet credit instruments, such as commitments to make loans and commercial letters of credit, issued to meet customer-financing needs. The face amount for these items represents the exposure to loss, before considering customer collateral or ability to repay. Such financial instruments are recorded when they are funded.
Comprehensive Income (Loss) – Comprehensive loss consists of net income (loss) and other comprehensive income (loss). Other comprehensive income (loss) includes unrealized gains and losses on securities available for sale, which are also recognized as a separate component of equity.
Earnings (Loss) Per Common Share – Basic earnings (loss) per common share are net income (loss) attributable to common shareholders divided by the weighted average number of common shares outstanding during the period. Diluted earnings (loss) per common share include the dilutive effect, if any, of additional potential common shares issuable under stock options and warrants. Earnings (loss) and dividends per share are restated for all stock splits and dividends through the date of issue of the financial statements.
Earnings (Loss) Allocated to Participating Securities – The Company has issued and outstanding unvested common shares to employees and directors through the stock incentive plan. Earnings (loss) are allocated to these participating securities based on their percentage of total issued and outstanding shares.
Loss Contingencies – Loss contingencies, including claims and legal actions arising in the ordinary course of business, are recorded as liabilities when the likelihood of loss is probable and an amount or range of loss can be reasonably estimated.
Dividend Restrictions – Banking regulations require maintaining certain capital levels and may limit the dividends paid by the Bank to the Company or by the Company to shareholders.
Fair Value of Financial Instruments – Fair values of financial instruments are estimated using relevant market information and other assumptions. Fair value estimates involve uncertainties and matters of significant judgment regarding interest rates, credit risk, prepayments, and other factors, especially in the absence of broad markets for particular items. Changes in assumptions or in market conditions could significantly affect the estimates.
Derivative Instruments – Derivative Instruments are carried at fair value and reflect the estimated amounts that would have been received to terminate these contracts at the reporting date based upon pricing or valuation models applied to current market information.
As part of the asset/liability management program, the Company utilizes, from time to time, risk participation agreements to reduce its sensitivity to changing interest rates. These are derivative instruments, which are recorded as assets or liabilities in the consolidated balance sheets at fair value. Changes in the fair values of derivatives are reported in the consolidated statements of operations or other comprehensive income (“OCI”) depending on the use of the derivative and whether the instrument qualifies for hedge accounting. The key criterion for the hedge accounting is that the hedged relationship must be highly effective in achieving offsetting changes in those cash flows that are attributable to the hedged risk, both at inception of the hedge and on an ongoing basis.
Derivatives that qualify for the hedge accounting treatment are designated as either: a hedge of the fair value of the recognized asset or liability or of an unrecognized commitment (a fair value hedge) or a hedge of a forecasted transaction or the variability of cash flows to be received or paid related to a recognized asset or liability (a cash flow hedge). To date, the Company has not entered into a cash flow hedge. For cash flow hedges, changes in the fair values of the derivative instruments are reported in OCI to the extent the hedge is effective. The gains and losses on derivative instruments that are reported in OCI are reflected in the consolidated statements of income in the periods in which the results of operations are impacted by the variability of the cash flows of the hedged item. Generally, net interest income is increased or decreased by amounts receivable or payable with respect to the derivatives, which qualify for hedge accounting. At inception of the hedge, a Company must establish the method it uses for assessing the effectiveness of the hedging derivative and the measurement approach for determining the ineffective aspect of the hedge. The ineffective portion of the hedge, if any, is recognized currently in the consolidated statements of operations and time value expiration of the hedge when measuring ineffectiveness is excluded.
The risk participation agreements are not designated against specific assets or liabilities under ASC 815, Derivatives and Hedging, and, therefore, do not qualify for hedge accounting. The derivatives are recorded on the balance sheet at fair value and changes in fair value of both the borrower and the offsetting swap agreements are recorded (and essentially offset) in non-interest income. The fair value of the derivative instruments incorporates a consideration of credit risk in accordance with ASC 820, resulting in some volatility in earnings each period.
Adoption of New Accounting Standards – In August 2015, FASB issued ASU 2015-14, Revenue from Contracts with Customers (Topic 606). This ASU is an update to ASU 2014-09, and delays the effective date of ASU 2014-09. The ASU provides guidance on revenue recognition for entities that enter into contracts with customers to transfer goods or services or enter into contracts for the transfer of nonfinancial assets. The core principle of the guidance is that an entity should recognize revenue to depict the transfer of promised goods or services to customers in an amount that reflects the consideration to which the entity expects to be entitled in exchange for those goods or services. Additional disclosures are required to provide quantitative and qualitative information regarding the nature, amount, timing, and uncertainty of revenue and cash flows arising from contracts with customers. The new guidance is effective for annual reporting periods, and interim reporting periods within those annual periods, beginning after December 15, 2017. The Company’s revenue is comprised of net interest income on financial assets and liabilities, which is explicitly excluded from the scope of this guidance, and non-interest income. Based on the evaluation of the Company’s non-interest income revenue streams, adoption of this new guidance will not have a material impact on the consolidated financial statements. Changes to the related disclosures are still being finalized.
In January 2016, the FASB issued an update ASU No. 2016-01, Financial Instruments – Overall (Subtopic 825-10): Recognition and Measurement of Financial Assets and Financial Liabilities. The amendments in this update impact public business entities as follows: 1) Require equity investments (except those accounted for under the equity method of accounting or those that result in consolidation of the investee) to be measured at fair value with changes in fair value recognized in net income. 2) Simplify the impairment assessment of equity investments without readily determinable fair values by requiring a qualitative assessment to identify impairment. When a qualitative assessment indicates that impairment exists, an entity is required to measure the investment at fair value. 3) Eliminate the requirement to disclose the methods and significant assumptions used to estimate the fair value that is required to be disclosed for financial instruments measured at amortized cost on the balance sheet. 4) Require entities to use the exit price notion when measuring the fair value of financial instruments for disclosure purposes. 5) Require an entity to present separately in other comprehensive income the portion of the total change in fair value of a liability resulting from a change in the instrument-specific credit risk when the entity has elected to measure the liability at fair value in accordance with the fair value option for financial instruments. 6) Require separate presentation of financial assets and financial liabilities by measurement category and form of financial asset (that is, securities or loans and receivables) on the balance sheet or the accompanying notes to the financial statements. 7) Clarify that an entity should evaluate the need for a valuation allowance on a deferred tax asset related to available-for-sale securities in combination with the entity’s other deferred tax assets. The amendments in this update become effective for annual periods and interim periods within those annual periods beginning after December 15, 2017. The impact of adopting the new guidance did not have a material impact on the consolidated financial statements, but will require additional disclosures. The Company currently does not have any equity investments.
In February 2016, the FASB issued an update ASU No. 2016-02, Leases (Topic 842). Under the new guidance, lessees will be required to recognize the following for all leases, with the exception of short-term leases, at the commencement date: a lease liability, which is a lessee’s obligation to make lease payments arising from a lease, measured on a discounted basis; and a right-of-use asset, which is an asset that represents the lessee’s right to use, or control the use of, a specified asset for the lease term. Under the new guidance, lessor accounting in largely unchanged. The amendments in this update become effective for annual periods and interim periods within those annual periods beginning after December 15, 2018. The impact of adopting the new guidance on the consolidated financial statements will not have a material impact.
In June 2016, the FASB issued ASU No. 2016-13, –Financial Instruments – Credit Losses (Topic 326): Measurement of Credit Losses on Financial Instruments. The final standard will change estimates for credit losses related to financial assets measured at amortized cost such as loans, held-to-maturity debt securities, and certain other contracts. For estimating credit losses, the FASB is replacing the incurred loss model with an expected loss model, which is referred to as the current expected credit loss (CECL) model. Under the CECL model, certain financial assets that are carried at amortized cost, such as loans held for investment and held-to-maturity debt securities, are required to be presented at the net amount expected to be collected. The measurement of expected credit losses is to be based on information about past events, including historical experience, current conditions, and reasonable and supportable forecasts that affect the collectability of the reported amount. This measurement will take place at the time the financial asset is first added to the balance sheet and periodically thereafter. This differs significantly from the “incurred loss” model required under current GAAP, which delays recognition until it is probable a loss has been incurred. The change could materially affect how the allowance for loan losses is determined. The standard is effective for public companies for fiscal years beginning after December 15, 2019. Management is currently gathering loan level data, and assessing our data and system needs. The impact of CECL model implementation is being evaluated, but it is expected that a one-time cumulative-effect adjustment to the allowance for loan losses will be recognized in retained earnings on the consolidated balance sheet as of the beginning of the first reporting period in which the new standard is effective, as is consistent with regulatory expectations set forth in interagency guidance. The magnitude of any adjustment or the overall impact of the new standard on financial condition or results of operation cannot yet be determined.
In March 2017, the FASB issued ASU No. 2017-08, –Receivables – Nonrefundable Fees and Other Costs (Subtopic 310-20): Premium Amortization of Purchased Callable Debt Securities. The final standard will shorten the amortization period for premiums on callable debt securities by requiring that premiums be amortized to the first (or earliest) call date instead of as an adjustment to the yield over the contractual life. The standard is effective for public companies for fiscal years beginning after December 15, 2018. The Company is currently evaluating the impact of adopting the new guidance on the consolidated financial statements.
In February 2018, the FASB issued ASU No. 2018-02, –Income Statement – Reporting Comprehensive Income (Topic 220): Reclassification of Certain Tax Effects From Other Comprehensive Income. The final standard allows institutions to elect to reclassify the stranded tax effects from AOCI to retained earnings, limited to amounts in AOCI that are affected by the tax reform law. This includes remeasuring deferred tax assets and liabilities related to items presented in AOCI at the newly enacted tax rate and on other income tax effects of items remaining in AOCI. The standard is effective for public companies for fiscal years beginning after December 15, 2018, and interim periods during 2018. Early adoption is permitted. The Company will adopt the standard in the first quarter of 2018 and adoption will not have a material impact on the consolidated financial statements.
NOTE 2 – SECURITIES
Securities are classified into available for sale (AFS) and held to maturity (HTM) categories. AFS securities are those that may be sold if needed for liquidity, asset liability management, or other reasons. AFS securities are reported at fair value, with unrealized gains or losses included as a separate component of equity, net of tax. HTM securities are those that the Bank has the intent and ability to hold to maturity and are reported at amortized cost.
The amortized cost and fair value of securities and the related gross unrealized gains and losses recognized in accumulated other comprehensive income (loss) were as follows:
|
Amortized Cost |
Gross Unrealized Gains |
Gross Unrealized Losses |
Fair Value |
|||||||||||||
|
December 31, 2017 |
(in thousands) |
|||||||||||||||
|
Available for sale |
||||||||||||||||
|
U.S. Government and federal agency |
$ | 22,105 | $ | 2 | $ | (483 |
) |
$ | 21,624 | |||||||
|
Agency mortgage-backed: residential |
65,935 | 117 | (1,087 |
) |
64,965 | |||||||||||
|
Collateralized loan obligations |
25,343 | 182 | (20 |
) |
25,505 | |||||||||||
|
State and municipal |
33,303 | 508 | (101 |
) |
33,710 | |||||||||||
|
Corporate bonds |
6,838 | 78 | — | 6,916 | ||||||||||||
|
Total available for sale |
$ | 153,524 | $ | 887 | $ | (1,691 |
) |
$ | 152,720 | |||||||
|
Amortized Cost |
Gross Unrealized Gains |
Gross Unrealized Losses |
Fair Value |
||||||||||||||
|
December 31, 2016 |
(in thousands) |
||||||||||||||||
| Available for sale | |||||||||||||||||
|
U.S. Government and federal agency |
$ | 34,757 | $ | 50 | $ | (708 |
) |
$ | 34,099 | ||||||||
|
Agency mortgage-backed: residential |
103,390 | 455 | (1,492 |
) |
102,353 | ||||||||||||
|
Collateralized loan obligations |
11,203 | — | — | 11,203 | |||||||||||||
|
State and municipal |
2,028 | 25 | (8 |
) |
2,045 | ||||||||||||
|
Corporate bonds |
3,069 | 24 | (3 |
) |
3,090 | ||||||||||||
|
Total available for sale |
$ | 154,447 | $ | 554 | $ | (2,211 |
) |
$ | 152,790 | ||||||||
|
Amortized Cost |
Gross Unrecognized Gains |
Gross Unrecognized Losses |
Fair Value |
|||||||||||||
|
Held to maturity |
||||||||||||||||
|
State and municipal |
$ | 41,818 | $ | 1,272 | $ | (18 |
) |
$ | 43,072 | |||||||
|
Total held to maturity |
$ | 41,818 | $ | 1,272 | $ | (18 |
) |
$ | 43,072 | |||||||
In 2013, the Bank transferred a portion of its tax-free municipal and taxable municipal bond portfolios from AFS to HTM. At that time, the transfer occurred at fair value with the unrealized loss of $1.3 million remaining in other comprehensive income. That unrealized loss has subsequently been amortized on the level yield method out of other comprehensive income with an offsetting entry reducing interest income as a yield adjustment through earnings. No gain or loss was recorded at the time of transfer in 2013. Given the Bank’s current balance sheet composition, interest rate risk profile, the current tax environment, and the Bank’s strategic plan, management reassessed the classification of the held to maturity securities and, effective December 1, 2017, transferred $41.4 million of tax-free municipals and taxable municipals from HTM to AFS. As a result, the $702,000 in remaining unamortized loss from the 2013 transfer was reclassified through a book value adjustment of these securities. At December 31, 2017, these securities were carried at fair value with unrealized holding gains and losses reported in other comprehensive income, net of tax, with the remaining securities classified as AFS.
Sales and calls of securities were as follows:
|
2017 |
2016 |
2015 |
||||||||||
|
(in thousands) |
||||||||||||
|
Proceeds |
$ | 41,733 | $ | 8,311 | $ | 45,012 | ||||||
|
Gross gains |
449 | 245 | 1,902 | |||||||||
|
Gross losses |
161 | 29 | 136 | |||||||||
The tax provision related to net gains and losses realized on sales was $101,000, $76,000, and $618,000, respectively.
The amortized cost and fair value of our debt securities are shown by contractual maturity. Expected maturities may differ from actual maturities when borrowers have the right to call or prepay obligations with or without call or prepayment penalties. Mortgage-backed securities not due at a single maturity date are shown separately.
|
December 31, 2017 |
||||||||
|
Amortized Cost |
Fair Value |
|||||||
|
(in thousands) |
||||||||
|
Maturity |
||||||||
|
Available for sale |
||||||||
|
Within one year |
$ | 14,648 | $ | 14,682 | ||||
|
One to five years |
40,197 | 40,675 | ||||||
|
Five to ten years |
32,744 | 32,398 | ||||||
|
Agency mortgage-backed: residential |
65,935 | 64,965 | ||||||
|
Total |
$ | 153,524 | $ | 152,720 | ||||
Securities pledged at year-end 2017 and 2016 had carrying values of approximately $76.8 million and $61.2 million, respectively, and were pledged to secure public deposits.
At December 31, 2017 and 2016, the Bank held securities issued by the Commonwealth of Kentucky or Kentucky municipalities having a book value of $15.4 million and $16.4 million, respectively. At year-end 2017, there were no other holdings of securities of any one issuer, other than the U.S. Government and its agencies, in an amount greater than 10% of stockholders’ equity.
The Company evaluates securities for other-than-temporary impairment at least on a quarterly basis, and more frequently when economic or market concerns warrant such evaluation. Consideration is given to the length of time and the extent to which the fair value has been less than cost, the financial condition and near-term prospects of the issuer, underlying credit quality of the issuer, and the intent and ability of the Company to retain its investment in the issuer for a period of time sufficient to allow for any anticipated recovery in fair value. In analyzing an issuer’s financial condition, the Company may consider whether the securities are issued by the federal government or its agencies, whether downgrades by bond rating agencies have occurred, the sector or industry trends and cycles affecting the issuer, and the results of reviews of the issuer’s financial condition. As of December 31, 2017, management does not believe any securities in the portfolio with unrealized losses should be classified as other than temporarily impaired.
Securities with unrealized losses at December 31, 2017 and December 31, 2016, aggregated by investment category and length of time the individual securities have been in a continuous unrealized loss position, are as follows:
|
Less than 12 Months |
12 Months or More |
Total |
||||||||||||||||||||||
|
Description of Securities |
Fair Value |
Unrealized Loss |
Fair Value |
Unrealized Loss |
Fair Value |
Unrealized Loss |
||||||||||||||||||
|
(in thousands) |
||||||||||||||||||||||||
|
2017 |
||||||||||||||||||||||||
|
Available for sale |
||||||||||||||||||||||||
|
U.S. Government and federal agency |
$ | 5,788 | $ | (97 |
) |
$ | 14,121 | $ | (386 |
) |
$ | 19,909 | $ | (483 |
) |
|||||||||
|
Agency mortgage-backed: residential |
21,104 | (172 |
) |
27,158 | (915 |
) |
48,262 | (1,087 |
) |
|||||||||||||||
|
State and municipal |
7,492 | (101 |
) |
— | — | 7,492 | (101 |
) |
||||||||||||||||
|
Collateralized loan obligations |
6,038 | (20 |
) |
— | — | 6,038 | (20 |
) |
||||||||||||||||
|
Total temporarily impaired |
$ | 40,422 | $ | (390 |
) |
$ | 41,279 | $ | (1,301 |
) |
$ | 81,701 | $ | (1,691 |
) |
|||||||||
|
Less than 12 Months |
12 Months or More |
Total |
||||||||||||||||||||||
|
Description of Securities |
Fair Value |
Unrealized Loss |
Fair Value |
Unrealized Loss |
Fair Value |
Unrealized Loss |
||||||||||||||||||
|
(in thousands) |
||||||||||||||||||||||||
|
2016 |
||||||||||||||||||||||||
|
Available for sale |
||||||||||||||||||||||||
|
U.S. Government and federal agency |
$ | 27,738 | $ | (708 |
) |
$ | — | $ | — | $ | 27,738 | $ | (708 |
) |
||||||||||
|
Agency mortgage-backed: residential |
63,460 | (1,449 |
) |
2,745 | (43 |
) |
66,205 | (1,492 |
) |
|||||||||||||||
|
State and municipal |
465 | (8 |
) |
— | — | 465 | (8 |
) |
||||||||||||||||
|
Corporate bonds |
— | — | 1,566 | (3 |
) |
1,566 | (3 |
) |
||||||||||||||||
|
Total temporarily impaired |
$ | 91,663 | $ | (2,165 |
) |
$ | 4,311 | $ | (46 |
) |
$ | 95,974 | $ | (2,211 |
) |
|||||||||
|
Held to maturity |
||||||||||||||||||||||||
|
State and municipal |
1,540 | (18 |
) |
— | — | 1,540 | (18 |
) |
||||||||||||||||
|
Total |
$ | 1,540 | $ | (18 |
) |
$ | — | $ | — | $ | 1,540 | $ | (18 |
) |
||||||||||
NOTE 3 – LOANS
Loans net of unearned income, deferred loan origination costs, and net premiums on acquired loans by class were as follows:
|
2017 |
2016 |
|||||||
|
(in thousands) |
||||||||
|
Commercial |
$ | 113,771 | $ | 97,761 | ||||
|
Commercial Real Estate: |
||||||||
|
Construction |
57,342 | 36,330 | ||||||
|
Farmland |
88,320 | 71,507 | ||||||
|
Nonfarm nonresidential |
156,724 | 149,546 | ||||||
|
Residential Real Estate: |
||||||||
|
Multi-family |
56,588 | 48,197 | ||||||
|
1-4 Family |
179,222 | 188,092 | ||||||
|
Consumer |
18,439 | 9,818 | ||||||
|
Agriculture |
41,154 | 37,508 | ||||||
|
Other |
555 | 477 | ||||||
|
Subtotal |
712,115 | 639,236 | ||||||
|
Less: Allowance for loan losses |
(8,202 |
) |
(8,967 |
) |
||||
|
Loans, net |
$ | 703,913 | $ | 630,269 | ||||
The following table presents the activity in the allowance for loan losses by portfolio segment for the year ended December 31, 2017, 2016, and 2015:
|
Commercial |
Commercial Real Estate |
Residential Real Estate |
Consumer |
Agriculture |
Other |
Total |
||||||||||||||||||||||
|
December 31, 2017: |
(in thousands) |
|||||||||||||||||||||||||||
|
Beginning balance |
$ | 475 | $ | 4,894 | $ | 3,426 | $ | 8 | $ | 162 | $ | 2 | $ | 8,967 | ||||||||||||||
|
Provision (negative provision) |
363 | (1,223 |
) |
(129 |
) |
(8 |
) |
213 | (16 |
) |
(800 |
) |
||||||||||||||||
|
Loans charged off |
(5 |
) |
(58 |
) |
(692 |
) |
(51 |
) |
(95 |
) |
– | (901 |
) |
|||||||||||||||
|
Recoveries |
59 | 419 | 295 | 115 | 33 | 15 | 936 | |||||||||||||||||||||
|
Ending balance |
$ | 892 | $ | 4,032 | $ | 2,900 | $ | 64 | $ | 313 | $ | 1 | $ | 8,202 | ||||||||||||||
|
December 31, 2016: |
||||||||||||||||||||||||||||
|
Beginning balance |
$ | 818 | $ | 6,993 | $ | 3,984 | $ | 122 | $ | 122 | $ | 2 | $ | 12,041 | ||||||||||||||
|
Provision (negative provision) |
(401 |
) |
(2,438 |
) |
749 | (314 |
) |
(56 |
) |
10 | (2,450 |
) |
||||||||||||||||
|
Loans charged off |
(276 |
) |
(505 |
) |
(1,652 |
) |
(99 |
) |
(18 |
) |
(79 |
) |
(2,629 |
) |
||||||||||||||
|
Recoveries |
334 | 844 | 345 | 299 | 114 | 69 | 2,005 | |||||||||||||||||||||
|
Ending balance |
$ | 475 | $ | 4,894 | $ | 3,426 | $ | 8 | $ | 162 | $ | 2 | $ | 8,967 |
|
December 31, 2015: |
||||||||||||||||||||||||||||
|
Beginning balance |
$ | 2,046 | $ | 10,931 | $ | 5,787 | $ | 274 | $ | 319 | $ | 7 | $ | 19,364 | ||||||||||||||
|
Provision (negative provision) |
(1,255 |
) |
(2,713 |
) |
(316 |
) |
(115 |
) |
(87 |
) |
(14 |
) |
(4,500 |
) |
||||||||||||||
|
Loans charged off |
(696 |
) |
(2,879 |
) |
(2,171 |
) |
(221 |
) |
(118 |
) |
(47 |
) |
(6,132 |
) |
||||||||||||||
|
Recoveries |
723 | 1,654 | 684 | 184 | 8 | 56 | 3,309 | |||||||||||||||||||||
|
Ending balance |
$ | 818 | $ | 6,993 | $ | 3,984 | $ | 122 | $ | 122 | $ | 2 | $ | 12,041 |
The following table presents the balance in the allowance for loan losses and the recorded investment in loans by portfolio segment and based on the impairment method as of December 31, 2017:
| Commercial |
Commercial Real Estate |
Residential Real Estate |
Consumer |
Agriculture |
Other |
Total |
||||||||||||||||||||||
|
(in thousands) |
||||||||||||||||||||||||||||
|
Allowance for loan losses: |
||||||||||||||||||||||||||||
|
Ending allowance balance attributable to loans: |
||||||||||||||||||||||||||||
|
Individually evaluated for impairment |
$ | 13 | $ | – | $ | 206 | $ | – | $ | – | $ | – | $ | 219 | ||||||||||||||
|
Collectively evaluated for impairment |
879 | 4,032 | 2,694 | 64 | 313 | 1 | 7,983 | |||||||||||||||||||||
|
Total ending allowance balance |
$ | 892 | $ | 4,032 | $ | 2,900 | $ | 64 | $ | 313 | $ | 1 | $ | 8,202 | ||||||||||||||
|
Loans: |
||||||||||||||||||||||||||||
|
Loans individually evaluated for impairment |
$ | 587 | $ | 2,635 | $ | 3,950 | $ | 1 | $ | – | $ | – | $ | 7,173 | ||||||||||||||
|
Loans collectively evaluated for impairment |
113,184 | 299,751 | 231,860 | 18,438 | 41,154 | 555 | 704,942 | |||||||||||||||||||||
|
Total ending loans balance |
$ | 113,771 | $ | 302,386 | $ | 235,810 | $ | 18,439 | $ | 41,154 | $ | 555 | $ | 712,115 | ||||||||||||||
The following table presents the balance in the allowance for loan losses and the recorded investment in loans by portfolio segment and based on the impairment method as of December 31, 2016:
| Commercial |
Commercial Real Estate |
Residential Real Estate |
Consumer |
Agriculture |
Other |
Total |
||||||||||||||||||||||
|
(in thousands) |
||||||||||||||||||||||||||||
|
Allowance for loan losses: |
||||||||||||||||||||||||||||
|
Ending allowance balance attributable to loans: |
||||||||||||||||||||||||||||
|
Individually evaluated for impairment |
$ | 13 | $ | 35 | $ | 350 | $ | – | $ | 1 | $ | – | $ | 399 | ||||||||||||||
|
Collectively evaluated for impairment |
462 | 4,859 | 3,076 | 8 | 161 | 2 | 8,568 | |||||||||||||||||||||
|
Total ending allowance balance |
$ | 475 | $ | 4,894 | $ | 3,426 | $ | 8 | $ | 162 | $ | 2 | $ | 8,967 | ||||||||||||||
|
Loans: |
||||||||||||||||||||||||||||
|
Loans individually evaluated for impairment |
$ | 595 | $ | 5,854 | $ | 8,621 | $ | 1 | $ | 60 | $ | – | $ | 15,131 | ||||||||||||||
|
Loans collectively evaluated for impairment |
97,166 | 251,529 | 227,668 | 9,817 | 37,448 | 477 | 624,105 | |||||||||||||||||||||
|
Total ending loans balance |
$ | 97,761 | $ | 257,383 | $ | 236,289 | $ | 9,818 | $ | 37,508 | $ | 477 | $ | 639,236 | ||||||||||||||
Impaired Loans
Impaired loans include restructured loans and loans on nonaccrual or classified as doubtful, whereby collection of the total amount is improbable, or loss, whereby all or a portion of the loan has been written off or a specific allowance for loss had been provided.
The following table presents information related to loans individually evaluated for impairment by class of loan as of and for the year ended December 31, 2017:
|
Unpaid Principal Balance |
Recorded Investment |
Allowance For Loan Losses Allocated |
Average Recorded Investment |
Interest Income Recognized |
Cash Basis Income Recognized |
|||||||||||||||||||
|
(in thousands) |
||||||||||||||||||||||||
|
With No Related Allowance Recorded: |
||||||||||||||||||||||||
|
Commercial |
$ | 703 | $ | 487 | $ | — | $ | 495 | $ | 7 | $ | 7 | ||||||||||||
|
Commercial real estate: |
||||||||||||||||||||||||
|
Construction |
— | — | — | — | — | — | ||||||||||||||||||
|
Farmland |
3,687 | 2,059 | — | 2,651 | 210 | 210 | ||||||||||||||||||
|
Nonfarm nonresidential |
1,047 | 576 | — | 716 | 59 | 47 | ||||||||||||||||||
|
Residential real estate: |
||||||||||||||||||||||||
|
Multi-family |
— | — | — | 820 | — | — | ||||||||||||||||||
|
1-4 Family |
4,293 | 2,787 | — | 2,884 | 143 | 143 | ||||||||||||||||||
|
Consumer |
9 | 1 | — | 2 | 2 | 2 | ||||||||||||||||||
|
Agriculture |
— | — | — | 24 | 1 | 1 | ||||||||||||||||||
|
Other |
— | — | — | — | — | — | ||||||||||||||||||
|
Subtotal |
9,739 | 5,910 | — | 7,592 | 422 | 410 | ||||||||||||||||||
|
With An Allowance Recorded: |
||||||||||||||||||||||||
|
Commercial |
100 | 100 | 13 | 100 | 7 | — | ||||||||||||||||||
|
Commercial real estate: |
||||||||||||||||||||||||
|
Construction |
— | — | — | — | — | — | ||||||||||||||||||
|
Farmland |
— | — | — | 235 | — | — | ||||||||||||||||||
|
Nonfarm nonresidential |
— | — | — | 238 | 14 | — | ||||||||||||||||||
|
Residential real estate: |
||||||||||||||||||||||||
|
Multi-family |
— | — | — | — | — | — | ||||||||||||||||||
|
1-4 Family |
1,163 | 1,163 | 206 | 1,404 | 68 | — | ||||||||||||||||||
|
Consumer |
— | — | — | — | — | — | ||||||||||||||||||
|
Agriculture |
— | — | — | 24 | — | — | ||||||||||||||||||
|
Other |
— | — | — | — | — | — | ||||||||||||||||||
|
Subtotal |
1,263 | 1,263 | 219 | 2,001 | 89 | — | ||||||||||||||||||
|
Total |
$ | 11,002 | $ | 7,173 | $ | 219 | $ | 9,593 | $ | 511 | $ | 410 | ||||||||||||
The following table presents information related to loans individually evaluated for impairment by class of loan as of and for the year ended December 31, 2016:
|
Unpaid Principal Balance |
Recorded Investment |
Allowance For Loan Losses Allocated |
Average Recorded Investment |
Interest Income Recognized |
Cash Basis Income Recognized |
|||||||||||||||||||
|
(in thousands) |
||||||||||||||||||||||||
|
With No Related Allowance Recorded: |
||||||||||||||||||||||||
|
Commercial |
$ | 707 | $ | 495 | $ | — | $ | 758 | $ | 39 | $ | 39 | ||||||||||||
|
Commercial real estate: |
||||||||||||||||||||||||
|
Construction |
— | — | — | 156 | 9 | — | ||||||||||||||||||
|
Farmland |
5,566 | 3,742 | — | 4,188 | 94 | 95 | ||||||||||||||||||
|
Nonfarm nonresidential |
4,502 | 1,219 | — | 4,699 | 310 | 189 | ||||||||||||||||||
|
Residential real estate: |
||||||||||||||||||||||||
|
Multi-family |
4,100 | 4,100 | — | 2,608 | 287 | 1 | ||||||||||||||||||
|
1-4 Family |
4,663 | 2,910 | — | 5,509 | 162 | 94 | ||||||||||||||||||
|
Consumer |
41 | 1 | — | 7 | 8 | 8 | ||||||||||||||||||
|
Agriculture |
— | — | — | 73 | 28 | 28 | ||||||||||||||||||
|
Other |
— | — | — | — | — | — | ||||||||||||||||||
|
Subtotal |
19,579 | 12,467 | — | 17,998 | 937 | 454 | ||||||||||||||||||
|
With An Allowance Recorded: |
||||||||||||||||||||||||
|
Commercial |
100 | 100 | 13 | 20 | 6 | — | ||||||||||||||||||
|
Commercial real estate: |
||||||||||||||||||||||||
|
Construction |
— | — | — | — | — | — | ||||||||||||||||||
|
Farmland |
614 | 590 | 5 | 358 | — | — | ||||||||||||||||||
|
Nonfarm nonresidential |
303 | 303 | 30 | 398 | 23 | — | ||||||||||||||||||
|
Residential real estate: |
||||||||||||||||||||||||
|
Multi-family |
— | — | — | 2,506 | 101 | — | ||||||||||||||||||
|
1-4 Family |
1,676 | 1,611 | 350 | 1,659 | 111 | — | ||||||||||||||||||
|
Consumer |
— | — | — | — | — | — | ||||||||||||||||||
|
Agriculture |
78 | 60 | 1 | 39 | — | — | ||||||||||||||||||
|
Other |
— | — | — | — | — | — | ||||||||||||||||||
|
Subtotal |
2,771 | 2,664 | 399 | 4,980 | 241 | — | ||||||||||||||||||
|
Total |
$ | 22,350 | $ | 15,131 | $ | 399 | $ | 22,978 | $ | 1,178 | $ | 454 | ||||||||||||
The following table presents information related to loans individually evaluated for impairment by class of loan as of and for the year ended December 31, 2015:
|
Unpaid Principal Balance |
Recorded Investment |
Allowance For Loan Losses Allocated |
Average Recorded Investment |
Interest Income Recognized |
Cash Basis Income Recognized |
|||||||||||||||||||
|
(in thousands) |
||||||||||||||||||||||||
|
With No Related Allowance Recorded: |
||||||||||||||||||||||||
|
Commercial |
$ | 1,558 | $ | 1,112 | $ | — | $ | 1,526 | $ | 5 | $ | 5 | ||||||||||||
|
Commercial real estate: |
||||||||||||||||||||||||
|
Construction |
278 | 262 | — | 1,993 | 14 | 1 | ||||||||||||||||||
|
Farmland |
6,004 | 4,263 | — | 4,497 | 114 | 114 | ||||||||||||||||||
|
Nonfarm nonresidential |
11,256 | 7,829 | — | 16,073 | 263 | 9 | ||||||||||||||||||
|
Residential real estate: |
||||||||||||||||||||||||
|
Multi-family |
32 | 32 | — | 35 | — | — | ||||||||||||||||||
|
1-4 Family |
14,066 | 11,756 | — | 13,584 | 456 | 99 | ||||||||||||||||||
|
Consumer |
118 | 20 | — | 23 | — | — | ||||||||||||||||||
|
Agriculture |
260 | 152 | — | 206 | — | — | ||||||||||||||||||
|
Other |
— | — | — | 49 | 5 | 5 | ||||||||||||||||||
|
Subtotal |
33,572 | 25,426 | — | 37,986 | 857 | 233 | ||||||||||||||||||
|
With An Allowance Recorded: |
||||||||||||||||||||||||
|
Commercial |
— | — | — | 13 | — | — | ||||||||||||||||||
|
Commercial real estate: |
||||||||||||||||||||||||
|
Construction |
— | — | — | — | — | — | ||||||||||||||||||
|
Farmland |
— | — | — | 63 | — | — | ||||||||||||||||||
|
Nonfarm nonresidential |
574 | 465 | 43 | 4,591 | 25 | — | ||||||||||||||||||
|
Residential real estate: |
||||||||||||||||||||||||
|
Multi-family |
4,195 | 4,195 | 57 | 4,229 | 204 | — | ||||||||||||||||||
|
1-4 Family |
1,690 | 1,690 | 328 | 1,705 | 89 | — | ||||||||||||||||||
|
Consumer |
— | — | — | 8 | — | — | ||||||||||||||||||
|
Agriculture |
— | — | — | — | — | — | ||||||||||||||||||
|
Other |
— | — | — | — | — | — | ||||||||||||||||||
|
Subtotal |
6,459 | 6,350 | 428 | 10,609 | 318 | — | ||||||||||||||||||
|
Total |
$ | 40,031 | $ | 31,776 | $ | 428 | $ | 48,595 | $ | 1,175 | $ | 233 | ||||||||||||
Troubled Debt Restructuring
A troubled debt restructuring (TDR) occurs when the Bank has agreed to a loan modification in the form of a concession for a borrower who is experiencing financial difficulty. The Bank’s TDRs typically involve a reduction in interest rate, a deferral of principal for a stated period of time, or an interest only period. All TDRs are considered impaired and the Bank has allocated reserves for these loans to reflect the present value of the concessionary terms granted to the borrower.
The following table presents the types of TDR loan modifications by portfolio segment outstanding as of December 31, 2017 and 2016:
|
TDRs Performing to Modified Terms |
TDRs Not Performing to Modified Terms |
Total TDRs |
||||||||||
|
(in thousands) |
||||||||||||
|
December 31, 2017 |
||||||||||||
|
Commercial |
||||||||||||
|
Rate reduction |
$ | — | $ | 33 | $ | 33 | ||||||
|
Principal deferral |
— | 434 | 434 | |||||||||
|
Commercial Real Estate: |
||||||||||||
|
Farmland |
||||||||||||
|
Principal deferral |
— | 1,362 | 1,362 | |||||||||
|
Nonfarm nonresidential |
||||||||||||
|
Rate reduction |
483 | — | 483 | |||||||||
|
Residential Real Estate: |
||||||||||||
|
1-4 Family |
||||||||||||
|
Rate reduction |
734 | — | 734 | |||||||||
|
Total TDRs |
$ | 1,217 | $ | 1,829 | $ | 3,046 | ||||||
|
December 31, 2016 |
||||||||||||
|
Commercial |
||||||||||||
|
Rate reduction |
$ | — | $ | 33 | $ | 33 | ||||||
|
Principal deferral |
— | 434 | 434 | |||||||||
|
Commercial Real Estate: |
||||||||||||
|
Farmland |
||||||||||||
|
Principal deferral |
— | 2,300 | 2,300 | |||||||||
|
Nonfarm nonresidential |
||||||||||||
|
Rate reduction |
507 | — | 507 | |||||||||
|
Principal deferral |
— | 607 | 607 | |||||||||
|
Residential Real Estate: |
||||||||||||
|
Multi-family |
||||||||||||
|
Rate reduction |
4,100 | — | 4,100 | |||||||||
|
1-4 Family |
||||||||||||
|
Rate reduction |
743 | — | 743 | |||||||||
|
Total TDRs |
$ | 5,350 | $ | 3,374 | $ | 8,724 | ||||||
At December 31, 2017 and 2016, 40% and 61%, respectively, of the Company’s TDRs were performing according to their modified terms. The Company allocated $122,000 and $197,000 as of December 31, 2017 and 2016, respectively, in reserves to customers whose loan terms have been modified in TDRs. The Company has committed to lend no additional amounts to customers as of December 31, 2017 or 2016 with outstanding loans that are classified as TDRs.
Management periodically reviews renewals and modifications of previously identified TDRs, for which there was no principal forgiveness, to consider if it is appropriate to remove the TDR classification. If the borrower is no longer experiencing financial difficulty and the renewal/modification did not contain a concessionary interest rate or other concessionary terms, management considers the potential removal of the TDR classification. If deemed appropriate based upon current underwriting, the TDR classification is removed as the borrower has complied with the terms of the loan at the date of renewal/modification and there was a reasonable expectation that the borrower would continue to comply with the terms of the loan subsequent to the date of the renewal/modification. In this instance, the TDR was originally considered a restructuring in a prior year as a result of a modification with an interest rate that was not commensurate with the risk of the underlying loan. Additionally, TDR classification can be removed in circumstances in which the Company performs a non-concessionary re-modification of the loan at terms that were considered to be at market for loans with comparable risk. Management expects the borrower will continue to perform under the re-modified terms based on the borrower’s past history of performance. During 2017, the TDR classification was removed from two loans that met the requirements as discussed above. These loans totaled $4.1 million at December 31, 2016. These loans are no longer evaluated individually for impairment.
No TDR loan modifications occurred during the twelve months ended December 31, 2017 or 2016. During the year ended December, 31 2017 and 2016, no TDRs defaulted on their restructured loan within the twelve-month period following the loan modification. A default is considered to have occurred once the TDR is past due 90 days or more or it has been placed on nonaccrual.
Non-performing Loans
Non-performing loans include impaired loans and smaller balance homogeneous loans, such as residential mortgage and consumer loans, that are collectively evaluated for impairment. The following table presents the recorded investment in nonaccrual and loans past due 90 days and still on accrual by class of loan as of December 31, 2017 and 2016:
|
Nonaccrual |
Loans Past Due 90 Days And Over Still Accruing |
|||||||||||||||
|
2017 |
2016 |
2017 |
2016 |
|||||||||||||
|
(in thousands) |
||||||||||||||||
|
Commercial |
$ | 487 | $ | 495 | $ | — | $ | — | ||||||||
|
Commercial Real Estate: |
||||||||||||||||
|
Construction |
— | — | — | — | ||||||||||||
|
Farmland |
2,059 | 4,332 | — | — | ||||||||||||
|
Nonfarm nonresidential |
93 | 1,016 | — | — | ||||||||||||
|
Residential Real Estate: |
||||||||||||||||
|
Multi-family |
— | — | — | — | ||||||||||||
|
1-4 Family |
2,817 | 3,312 | — | — | ||||||||||||
|
Consumer |
1 | 1 | 1 | — | ||||||||||||
|
Agriculture |
— | 60 | — | — | ||||||||||||
|
Other |
— | — | — | — | ||||||||||||
|
Total |
$ | 5,457 | $ | 9,216 | $ | 1 | $ | — | ||||||||
The following table presents the aging of the recorded investment in past due loans by class as of December 31, 2017 and 2016:
|
30 – 59 Days Past Due |
60 – 89 Days Past Due |
90 Days And Over Past Due |
Nonaccrual |
Total Past Due And Nonaccrual |
||||||||||||||||
|
(in thousands) |
||||||||||||||||||||
|
December 31, 2017 |
||||||||||||||||||||
|
Commercial |
$ | — | $ | — | $ | — | $ | 487 | $ | 487 | ||||||||||
|
Commercial Real Estate: |
||||||||||||||||||||
|
Construction |
— | — | — | — | — | |||||||||||||||
|
Farmland |
593 | — | — | 2,059 | 2,652 | |||||||||||||||
|
Nonfarm nonresidential |
— | — | — | 93 | 93 | |||||||||||||||
|
Residential Real Estate: |
||||||||||||||||||||
|
Multi-family |
— | — | — | — | — | |||||||||||||||
|
1-4 Family |
850 | 126 | — | 2,817 | 3,793 | |||||||||||||||
|
Consumer |
30 | 45 | — | 1 | 76 | |||||||||||||||
|
Agriculture |
5 | — | 1 | — | 6 | |||||||||||||||
|
Other |
— | — | — | — | — | |||||||||||||||
|
Total |
$ | 1,478 | $ | 171 | $ | 1 | $ | 5,457 | $ | 7,107 | ||||||||||
|
30 – 59 Days Past Due |
60 – 89 Days Past Due |
90 Days And Over Past Due |
Nonaccrual |
Total Past Due And Nonaccrual |
||||||||||||||||
|
(in thousands) |
||||||||||||||||||||
|
December 31, 2016 |
||||||||||||||||||||
|
Commercial |
$ | — | $ | — | $ | — | $ | 495 | $ | 495 | ||||||||||
|
Commercial Real Estate: |
||||||||||||||||||||
|
Construction |
— | — | — | — | — | |||||||||||||||
|
Farmland |
626 | — | — | 4,332 | 4,958 | |||||||||||||||
|
Nonfarm nonresidential |
— | 59 | — | 1,016 | 1,075 | |||||||||||||||
|
Residential Real Estate: |
||||||||||||||||||||
|
Multi-family |
— | — | — | — | — | |||||||||||||||
|
1-4 Family |
1,454 | 256 | — | 3,312 | 5,022 | |||||||||||||||
|
Consumer |
19 | — | — | 1 | 20 | |||||||||||||||
|
Agriculture |
203 | — | — | 60 | 263 | |||||||||||||||
|
Other |
— | — | — | — | — | |||||||||||||||
|
Total |
$ | 2,302 | $ | 315 | $ | — | $ | 9,216 | $ | 11,833 | ||||||||||
Credit Quality Indicators
Management categorizes all loans into risk categories at origination based upon original underwriting. Thereafter, management categorizes loans into risk categories based on relevant information about the ability of borrowers to service their debt such as current financial information, historical payment experience, credit documentation, public information, and current economic trends. Additionally, loans are analyzed through internal and external loan review processes. Borrower relationships in excess of $500,000 are routinely analyzed through the credit administration processes which classify the loans as to credit risk. The following definitions are used for risk ratings:
Watch – Loans classified as watch are those loans which have or may experience a potentially adverse development which necessitates increased monitoring.
Special Mention – Loans classified as special mention do not have all of the characteristics of substandard or doubtful loans. They have one or more deficiencies which warrant special attention and which corrective action, such as accelerated collection practices, may remedy.
Substandard – Loans classified as substandard are those loans with clear and defined weaknesses such as a highly leveraged position, unfavorable financial ratios, uncertain repayment sources or poor financial condition which may jeopardize the repayment of the debt as contractually agreed. They are characterized by the possibility of some losses if the deficiencies are not corrected.
Doubtful – Loans classified as doubtful are those loans which have characteristics similar to substandard loans but with an increased risk that collection or liquidation in full is highly questionable and improbable.
Loans not meeting the criteria above that are analyzed individually as part of the above described process are considered to be “Pass” rated loans. As of December 31, 2017 and 2016, and based on the most recent analysis performed, the risk category of loans by class of loans is as follows:
|
Pass |
Watch |
Special Mention |
Substandard |
Doubtful |
Total |
|||||||||||||||||||
|
(in thousands) |
||||||||||||||||||||||||
|
December 31, 2017 |
||||||||||||||||||||||||
|
Commercial |
$ | 112,978 | $ | 84 | $ | — | $ | 709 | $ | — | $ | 113,771 | ||||||||||||
|
Commercial Real Estate: |
||||||||||||||||||||||||
|
Construction |
57,342 | — | — | — | — | 57,342 | ||||||||||||||||||
|
Farmland |
76,563 | 7,607 | — | 4,150 | — | 88,320 | ||||||||||||||||||
|
Nonfarm nonresidential |
152,004 | 2,906 | — | 1,814 | — | 156,724 | ||||||||||||||||||
|
Residential Real Estate: |
||||||||||||||||||||||||
|
Multi-family |
47,121 | 9,467 | — | — | — | 56,588 | ||||||||||||||||||
|
1-4 Family |
169,774 | 3,535 | 164 | 5,749 | — | 179,222 | ||||||||||||||||||
|
Consumer |
18,042 | 306 | — | 91 | — | 18,439 | ||||||||||||||||||
|
Agriculture |
38,654 | 1,810 | — | 690 | — | 41,154 | ||||||||||||||||||
|
Other |
555 | — | — | — | — | 555 | ||||||||||||||||||
|
Total |
$ | 673,033 | $ | 25,715 | $ | 164 | $ | 13,203 | $ | — | $ | 712,115 | ||||||||||||
|
Pass |
Watch |
Special Mention |
Substandard |
Doubtful |
Total |
|||||||||||||||||||
|
(in thousands) |
||||||||||||||||||||||||
|
December 31, 2016 |
||||||||||||||||||||||||
|
Commercial |
$ | 96,402 | $ | 294 | $ | — | $ | 1,065 | $ | — | $ | 97,761 | ||||||||||||
|
Commercial Real Estate: |
||||||||||||||||||||||||
|
Construction |
35,823 | 507 | — | — | — | 36,330 | ||||||||||||||||||
|
Farmland |
63,323 | 1,521 | — | 6,663 | — | 71,507 | ||||||||||||||||||
|
Nonfarm nonresidential |
142,222 | 5,217 | 445 | 1,662 | — | 149,546 | ||||||||||||||||||
|
Residential Real Estate: |
||||||||||||||||||||||||
|
Multi-family |
38,281 | 6,080 | — | 3,836 | — | 48,197 | ||||||||||||||||||
|
1-4 Family |
173,565 | 6,909 | 52 | 7,566 | — | 188,092 | ||||||||||||||||||
|
Consumer |
9,397 | 348 | — | 73 | — | 9,818 | ||||||||||||||||||
|
Agriculture |
26,940 | 9,555 | — | 1,013 | — | 37,508 | ||||||||||||||||||
|
Other |
477 | — | — | — | — | 477 | ||||||||||||||||||
|
Total |
$ | 586,430 | $ | 30,431 | $ | 497 | $ | 21,878 | $ | — | $ | 639,236 | ||||||||||||
NOTE 4 – PREMISES AND EQUIPMENT
Year-end premises and equipment were as follows:
|
2017 |
2016 |
|||||||
|
(in thousands) |
||||||||
|
Land and buildings |
$ | 23,124 | $ | 23,515 | ||||
|
Furniture and equipment |
10,151 | 10,050 | ||||||
| 33,275 | 33,565 | |||||||
|
Accumulated depreciation |
(16,486 |
) |
(15,717 |
) |
||||
| $ | 16,789 | $ | 17,848 | |||||
Depreciation expense was $955,000, $1.1 million and $1.0 million for 2017, 2016 and 2015, respectively.
NOTE 5 – OTHER REAL ESTATE OWNED
Other real estate owned (OREO) is real estate acquired as a result of foreclosure or by deed in lieu of foreclosure. It is classified as real estate owned until such time as it is sold. When property is acquired as a result of foreclosure or by deed in lieu of foreclosure, it is recorded at its fair market value less cost to sell. Any write-down of the property at the time of acquisition is charged to the allowance for loan losses.
Fair value of OREO is determined on an individual property basis. When foreclosed properties are acquired, management obtains a new appraisal of the subject property or has staff from the Bank’s special assets group evaluate the latest in-file appraisal in connection with the transfer to OREO. Updated appraisals are typically obtained within five quarters of the anniversary date of ownership unless a sale is imminent. Subsequent reductions in fair value are recorded as non-interest expense when a new appraisal indicates a decline in value or in cases where a listing price is lowered below the appraised amount.
The following table presents the major categories of OREO at the period-ends indicated:
|
2017 |
2016 |
|||||||
|
(in thousands) |
||||||||
|
Commercial Real Estate: |
||||||||
|
Construction, land development, and other land |
$ | 4,335 | $ | 6,571 | ||||
|
Farmland |
74 | — | ||||||
|
Residential Real Estate: |
||||||||
|
1-4 Family |
— | 250 | ||||||
| $ | 4,409 | $ | 6,821 | |||||
Residential loans secured by 1-4 family residential properties in the process of foreclosure totaled $616,000 and $932,000 at December 31, 2017 and December 31, 2016, respectively.
Activity relating to OREO owned during the years indicated is as follows:
|
2017 |
2016 |
2015 |
||||||||||
|
(in thousands) |
||||||||||||
|
OREO Activity |
||||||||||||
|
OREO as of January 1 |
$ | 6,821 | $ | 19,214 | $ | 46,197 | ||||||
|
Real estate acquired |
270 | 1,273 | 5,513 | |||||||||
|
Valuation adjustment write-downs |
(1,963 |
) |
(1,180 |
) |
(9,855 |
) |
||||||
|
Net gain (loss) on sale |
74 | 222 | (74 |
) |
||||||||
|
Proceeds from sale of properties |
(793 |
) |
(12,708 |
) |
(22,567 |
) |
||||||
|
OREO as of December 31 |
$ | 4,409 | $ | 6,821 | $ | 19,214 | ||||||
There was no OREO rental income for the year ended December 31, 2017, compared to $456,000, and $1.3 million for the years ended December 31, 2016, and 2015, respectively.
Expenses related to OREO owned include:
|
2017 |
2016 |
2015 |
||||||||||
|
(in thousands) |
||||||||||||
|
Net (gain) loss on sales |
$ | (74 |
) |
$ | (222 |
) |
$ | 74 | ||||
|
Valuation adjustment write-downs |
1,963 | 1,180 | 9,855 | |||||||||
|
Operating expense |
84 | 583 | 2,373 | |||||||||
|
Total |
$ | 1,973 | $ | 1,541 | $ | 12,302 | ||||||
NOTE 6 – DEPOSITS
The following table details deposits by category:
|
December 31, 2017 |
December 31, 2016 |
|||||||
|
(in thousands) |
||||||||
|
Non-interest bearing |
$ | 137,386 | $ | 124,395 | ||||
|
Interest checking |
99,383 | 103,876 | ||||||
|
Money market |
151,388 | 142,497 | ||||||
|
Savings |
34,632 | 34,518 | ||||||
|
Certificates of deposit |
424,235 | 444,639 | ||||||
|
Total |
$ | 847,024 | $ | 849,925 | ||||
Time deposits of $250,000 or more were approximately $31.7 million and $29.1 million at year-end 2017 and 2016, respectively.
Scheduled maturities of total time deposits for each of the next five years are as follows (in thousands):
|
Total |
||||
|
2018 |
$ | 204,018 | ||
|
2019 |
178,479 | |||
|
2020 |
27,507 | |||
|
2021 |
5,316 | |||
|
2022 |
8,915 | |||
| $ | 424,235 | |||
NOTE 7 – ADVANCES FROM FEDERAL HOME LOAN BANK
At year-end, advances from the Federal Home Loan Bank were as follows:
|
2017 |
2016 |
|||||||
|
(in thousands) |
||||||||
|
Advances with fixed rates from 0.00% to 5.24% and maturities ranging from 2018 through 2033, averaging 1.48% for 2017 and 0.85% for 2016 |
$ | 11,797 | $ | 22,458 | ||||
Each advance is payable per terms on agreement, with a prepayment penalty. No prepayment penalties were incurred during 2017 or 2016. The advances were collateralized by approximately $130.9 million and $124.2 million of first mortgage loans, under a blanket lien arrangement at year-end 2017 and 2016, respectively. At December 31, 2017, our additional borrowing capacity with the FHLB was $79.0 million.
Scheduled principal payments during the next five years and thereafter (in thousands):
|
Advances |
||||
|
2018 |
$ | 10,200 | ||
|
2019 |
180 | |||
|
2020 |
485 | |||
|
2021 |
728 | |||
|
2022 |
108 | |||
|
Thereafter |
96 | |||
| $ | 11,797 | |||
At year-end 2017, the Company had a $5.0 million federal funds line of credit available on an unsecured basis from a correspondent institution.
NOTE 8 – SUBORDINATED CAPITAL NOTE
The outstanding principal amount of the Bank’s subordinated capital note totaled $2.3 million at December 31, 2017. The note is unsecured, bears interest at the BBA three-month LIBOR floating rate plus 300 basis points, and qualifies as Tier 2 capital until five years before maturity on July 1, 2020. During the final five-year period to maturity, one-fifth of principal amount of the subordinated note is excluded from Tier 2 capital each year and until fully excluded from Tier 2 capital during the year before maturity. Principal payments of $225,000 plus interest are due quarterly. Scheduled principal payments of $900,000 per year are due each of the next two years with $450,000 due thereafter. The interest rate was 4.34% and 3.85% at December 31, 2017 and 2016, respectively.
NOTE 9 – JUNIOR SUBORDINATED DEBENTURES
The junior subordinated debentures are redeemable at par prior to maturity at the option of the Company as defined within the trust indenture. The Company has the option to defer interest payments on the junior subordinated debentures from time to time for a period not to exceed 20 consecutive quarters. A deferral period may begin at the Company’s discression so long as interest payments are current. The Company is prohibited from paying dividends on its preferred and common shares when interest payments are in deferral.
On April 15, 2016, the Company completed the private placement of 580,000 common shares and 220,000 non-voting common shares to accredited investors resulting in total proceeds of $5.0 million. The investors in the private placement directed a portion of purchase price to pay all deferred interest payments on junior subordinated debentures, bringing our interest payments current through the second quarter of 2016.
On June 29, 2016, the Company notified the trustees of its election to again defer interest payments effective with the third quarter 2016 payment. The deferral period ends after the second quarter of 2021. After 20 consecutive quarters, the Company must pay all deferred distributions to avoid default. Dividends accrued and unpaid on our junior subordinated debentures totaled $1.2 million at December 31, 2017.
A summary of the junior subordinated debentures is as follows:
| Description |
Issuance Date |
Interest Rate (1) |
Junior Subordinated Debt Owed To Trust |
Maturity Date (2) |
|||||
|
Porter Statutory Trust II |
2/13/2004 |
3-month LIBOR + 2.85% |
$ | 5,000,000 |
2/13/2034 |
||||
|
Porter Statutory Trust III |
4/15/2004 |
3-month LIBOR + 2.79% |
3,000,000 |
4/15/2034 |
|||||
|
Porter Statutory Trust IV |
12/14/2006 |
3-month LIBOR + 1.67% |
10,000,000 |
3/01/2037 |
|||||
|
Ascencia Statutory Trust I |
2/13/2004 |
3-month LIBOR + 2.85% |
3,000,000 |
2/13/2034 |
|||||
| $ | 21,000,000 | ||||||||
|
(1) |
As of December 31, 2017, the 3-month LIBOR was 1.69%. |
|
(2) |
The debentures are callable at our option at their principal amount plus accrued interest. |
On September 30, 2015, the Company completed a common equity for debt exchange with holders of $4.0 million of the capital securities (the “Trust Securities”) of Porter Statutory Trust IV, a trust subsidiary of the Company. Accrued and unpaid interest on the Trust Securities totaled of approximately $330,000. In exchange for the $4.3 million debt and interest liability, the Company issued 160,000 common shares and 80,000 non-voting common shares, for a total of 240,000 shares. In the transaction, a wholly owned subsidiary of the Company received a one-third portion of the Trust Securities directly from an unrelated third party in exchange for the issuance of 80,000 common shares resulting in an $883,000 gain on extinguishment of debt. The $883,000 gain was determined based upon the difference in the $560,000 fair value of the common shares issued and the $1.4 million book value of the debt securities and accrued interest thereon tendered to the Company by the unrelated third party on the date of closing. The fair value of the shares issued to the unrelated third party was computed by multiplying the 80,000 shares issued by $7.00 per share, which was the NASDAQ closing price of the Company’s common stock on September 30, 2015. The subsidiary also received two-thirds of the Trust Securities having a book value of $2.9 million from related parties in exchange for the issuance of 80,000 common shares and 80,000 non-voting common shares. In accordance with ASC 470-50-40-2 and SEC Guidance 405-20-40-1.J, the debt and interest liability exchanged with related parties was treated as a capital transaction.
NOTE 10 – SENIOR DEBT
On June 30, 2017, the Company entered into a $10.0 million senior secured loan agreement with a commercial bank. The loan matures on June 30, 2022. Interest is payable quarterly at a rate of three-month LIBOR plus 250 basis points through June 30, 2020, at which time quarterly principal payments of $250,000 plus interest will commence. The loan is secured by a first priority pledge of 100% of the issued and outstanding stock of the Bank. The Company may prepay any amount due under the promissory note at any time without premium or penalty.
The Company contributed $9.0 million of the borrowing proceeds to the Bank as common equity Tier 1 capital. The remaining $1.0 million of the borrowing proceeds were retained by the lender in escrow to service quarterly interest payments. At December 31, 2017, the escrow account had a balance of $806,000.
The loan agreement contains customary representations, warranties, covenants and events of default, including the following financial covenants: (i) the Company must maintain minimum cash on hand of not less than $750,000 through June 30, 2018, and not less than $2,500,000 thereafter, (ii) the Company must maintain a total risk based capital ratio at least equal to 9% of risk-weighted assets to June 30, 2018, and 10% thereafter, (iii) the Bank must maintain a total risk based capital ratio at least equal to 10% of risk-weighted assets to June 30, 2018, and 11% thereafter, and (iv) non-performing assets of the Bank may not exceed 2.5% of the Bank’s total assets. Both the Company and Bank were in compliance with the covenants as of December 31, 2017.
NOTE 11 – OTHER BENEFIT PLANS
401(k) Plan – The Company 401(k) Savings Plan allows employees to contribute up to the annual limits as determined by the Internal Revenue Service, which is matched equal to 50% of the first 4% of compensation contributed. The Company, at its discretion, may make an additional contribution. Total contributions made by the Company to the plan totaled approximately $200,000, $189,000 and $160,000 in 2017, 2016 and 2015, respectively.
Supplemental Executive Retirement Plan – The Company has a supplemental executive retirement plan covering certain executive officers. Under the plan, the Company pays each participant, or their beneficiary, a specific defined benefit amount over 10 years, beginning with the individual’s retirement or early termination of service for reasons other than cause. A liability is accrued for the obligation under these plans. The expense incurred for the plan was $121,000, $121,000 and $121,000 for the years ended December 31, 2017, 2016 and 2015, respectively. The related liability was $1.3 million at December 31, 2017 and 2016 and is included in other liabilities on the balance sheets.
The Company purchased life insurance on the participants of the plan. The cash surrender value of all insurance policies was $15.2 million and $14.8 million at December 31, 2017 and 2016, respectively. Income earned from the cash surrender value of life insurance totaled $412,000, $417,000 and $295,000 for the years ended December 31, 2017, 2016, and 2015, respectively. The income is recorded as other non-interest income.
NOTE 12 – INCOME TAXES
The Company has had a full valuation allowance against its net deferred tax asset since 2011. The Company’s ability to utilize the net deferred tax asset depends upon generating sufficient future levels of taxable income. The determination to restore a deferred tax asset and eliminate a valuation allowance depends upon the evaluation of both positive and negative evidence regarding the likelihood of achieving sufficient future taxable income levels. During the fourth quarter of 2017, management concluded it was more-likely-than-not the asset would be utilized to reduce future taxes payable related to the future taxable income of the Company, and as such, reversed the valuation allowance. The positive evidence that outweighed the negative evidence evaluated by management in arriving at the conclusion to remove the valuation allowance included, but was not limited to, the following:
|
● |
positive cumulative pre-tax earnings over the prior three-year period ended December 31, 2017 |
|
● |
growth in net interest income, stable non-interest income trends, and lower non-interest expense trends |
|
● |
improvement in asset quality which increases management’s ability to forecast future taxable income and achieve forecasted results |
|
● |
the Company’s net operating loss (“NOLs”) carryforwards do not begin to expire until 2032, and |
|
● |
the Bank’s Consent Order was terminated in the fourth quarter of 2017 |
As a result of the conclusion to reverse the valuation allowance, the Company recorded an income tax benefit of $54.0 million for the year ended December 31, 2017.
On December 22, 2017, the Tax Cuts and Jobs Act of 2017 was signed into law. Among other significant changes to the tax code, the new law lowered the federal corporate tax rate from 35% to 21% beginning in 2018. As a result, the Company revalued its net deferred tax asset at the new 21% rate. Due to this revaluation, the Company recorded a $20.3 million charge to income tax expense for the year ended December 31, 2017.
The combination of the reversal of the valuation allowance and the change in federal corporate tax rates, as well as income tax expense for the year, resulted in an income tax benefit of $31.9 million for the year ended December 31, 2017.
Income tax expense (benefit) was as follows:
|
2017 |
2016 |
2015 |
||||||||||
|
(in thousands) |
||||||||||||
|
Current |
$ | — | $ | 21 | $ | — | ||||||
|
Deferred |
2,523 | 2,771 | 5,258 | |||||||||
|
Net operating loss |
(647 |
) |
(4,009 |
) |
(5,975 |
) |
||||||
|
Change in federal statutory rate |
20,274 | — | — | |||||||||
|
Change in valuation allowance |
(54,049 |
) |
1,238 | 717 | ||||||||
| $ | (31,899 |
) |
$ | 21 | $ | — | ||||||
Effective tax rates differ from federal statutory rate of 35% applied to income (loss) before income taxes due to the following:
|
2017 |
2016 |
2015 |
||||||||||
|
(in thousands) |
||||||||||||
|
Federal statutory rate times financial statement income (loss) |
$ | 2,294 | $ | (956 |
) |
$ | (1,125 |
) |
||||
|
Effect of: |
||||||||||||
|
Valuation allowance |
(54,049 |
) |
1,238 | 717 | ||||||||
|
Tax-exempt income |
(196 |
) |
(211 |
) |
(264 |
) |
||||||
|
Non-taxable life insurance income |
(144 |
) |
(146 |
) |
(103 |
) |
||||||
|
Restricted stock vesting |
(121 |
) |
— | — | ||||||||
|
Change in federal statutory rate |
20,274 | — | — | |||||||||
|
Other, net |
43 | 96 | 775 | |||||||||
|
Total |
$ | (31,899 |
) |
$ | 21 | $ | — | |||||
Year-end deferred tax assets and liabilities were due to the following:
|
2017 |
2016 |
|||||||
|
(in thousands) |
||||||||
|
Deferred tax assets: |
||||||||
|
Net operating loss carry-forward |
$ | 25,645 | $ | 42,094 | ||||
|
Allowance for loan losses |
1,723 | 3,139 | ||||||
|
OREO write-down |
2,432 | 3,366 | ||||||
|
Alternative minimum tax credit carry-forward |
692 | 692 | ||||||
|
Net assets from acquisitions |
358 | 674 | ||||||
|
Net unrealized loss on securities |
169 | 867 | ||||||
|
New market tax credit carry-forward |
208 | 208 | ||||||
|
Nonaccrual loan interest |
271 | 481 | ||||||
|
Accrued expenses |
172 | 3,860 | ||||||
|
Deferred compensation |
277 | 465 | ||||||
|
Other |
241 | 360 | ||||||
| 32,188 | 56,206 | |||||||
|
Deferred tax liabilities: |
||||||||
|
FHLB stock dividends |
557 | 928 | ||||||
|
Fixed assets |
68 | 89 | ||||||
|
Deferred loan costs |
152 | 274 | ||||||
|
Other |
98 | 866 | ||||||
| 875 | 2,157 | |||||||
|
Net deferred tax assets before valuation allowance |
31,313 | 54,049 | ||||||
|
Valuation allowance |
— | (54,049 |
) |
|||||
|
Net deferred tax asset |
$ | 31,313 | $ | — | ||||
At December 31, 2017, the Company had net operating loss carryforwards ("NOLs") of $122.1 million, which will begin to expire in 2031.
The Company does not have any beginning and ending unrecognized tax benefits. The Company does not expect the total amount of unrecognized tax benefits to significantly increase or decrease in the next twelve months. There were no interest and penalties recorded in the income statement or accrued for 2017 or 2016 related to unrecognized tax benefits.
Under Section 382 of the Internal Revenue Code, as amended (“Section 382”), the Company’s net operating loss carryforwards and other deferred tax assets can generally be used to offset future taxable income and therefore reduce federal income tax obligations. However, the Company's ability to use its NOLs would be limited if there was an “ownership change” as defined by Section 382. This would occur if shareholders owning (or deemed to own under the tax rules) 5% or more of the Company's voting and non-voting common shares increase their aggregate ownership of the Company by more than 50 percentage points over a defined period of time.
In 2015, the Company took two measures to preserve the value of its NOLs. First, the Company adopted a tax benefits preservation plan designed to reduce the likelihood of an “ownership change” occurring as a result of purchases and sales of the Company's common shares. Upon adoption of this plan, the Company declared a dividend of one preferred stock purchase right for each common share outstanding as of the close of business on July 10, 2015. Any shareholder or group that acquires beneficial ownership of 5% or more of the Company (an “acquiring person”) could be subject to significant dilution in its holdings if the Company's Board of Directors does not approve such acquisition. Existing shareholders holding 5% or more of the Company will not be considered acquiring persons unless they acquire additional shares, subject to certain exceptions described in the plan. In addition, the Board of Directors has the discretion to exempt certain transactions and certain persons whose acquisition of securities is determined by the Board not to jeopardize the Company's deferred tax assets. The rights will expire upon the earlier of (i) June 29, 2018, (ii) the beginning of a taxable year with respect to which the Board of Directors determines that no tax benefits may be carried forward, (iii) the repeal or amendment of Section 382 or any successor statute, if the Board of Directors determines that the plan is no longer needed to preserve the tax benefits, and (iv) certain other events as described in the plan.
On September 23, 2015, the Company’s shareholders approved an amendment to its articles of incorporation to further help protect the long-term value of the Company’s NOLs. The amendment provides a means to block transfers of our common shares that could result in an ownership change under Section 382. The transfer restrictions will expire on the earlier of (i) September 23, 2018, (ii) the beginning of a taxable year with respect to which the Board of Directors determines that no tax benefit may be carried forward, (iii) the repeal of Section 382 or any successor statute if our Board determines that the transfer restrictions are no longer needed to preserve the tax benefits of our NOLs, or (iv) such date as the Board otherwise determines that the transfer restrictions are no longer necessary.
The Company and its subsidiaries are subject to U.S. federal income tax and the Company is subject to income tax in the Commonwealth of Kentucky. The Company is no longer subject to examination by taxing authorities for years before 2014.
NOTE 13 – RELATED PARTY TRANSACTIONS
Loans to principal officers, directors, significant shareholders, and their affiliates in 2017 were as follows (in thousands):
|
Beginning balance |
$ | — | ||
|
New loans |
9,400 | |||
|
Repayments |
— | |||
|
Ending balance |
$ | 9,400 |
Deposits from principal officers, directors, significant shareholders, and their affiliates at year-end 2017 and 2016 were $401,000 and $321,000, respectively.
Hogan Development Company assists the Bank in onboarding, managing, and selling the Bank’s OREO. Hogan Development Company is owned by W. Glenn Hogan, a director. The agreement with Hogan Development Company is periodically reviewed and evaluated by the Audit Committee. The Bank paid real estate management fees of $20,000 and $56,000 and real estate sales and leasing commissions of $6,000 and $478,000 to Hogan Development Company in 2017 and 2016, respectively.
On April 15, 2016, the Company completed the private placement of 580,000 common shares and 220,000 non-voting common shares to accredited investors resulting in total proceeds of $5.0 million. The investors in the private placement directed a portion of purchase price to pay all deferred interest payments on junior subordinated debentures, bringing our interest payments current through the second quarter of 2016. The investors included three directors of the Company, including President and CEO John T. Taylor, who purchased common shares on the same terms and conditions as the other investors.
NOTE 14 – PREFERRED STOCK
The Company has issued and outstanding 6,198 Series E preferred shares and 4,304 Series F preferred shares, both of which series are not convertible into common shares, have a liquidation preference of $1,000 per share, and are entitled to a 2% noncumulative annual dividend if and when declared. Series E and Series F preferred shares rank senior to, and have liquidation and dividend preferences over, the common shares and non-voting common shares.
NOTE 15 – CAPITAL REQUIREMENTS AND RESTRICTIONS ON RETAINED EARNINGS
Banks and bank holding companies are subject to regulatory capital requirements administered by federal banking agencies. Capital adequacy guidelines and, additionally for banks, prompt corrective action regulations involve quantitative measures of assets, liabilities, and certain off-balance-sheet items calculated under regulatory accounting practices. Capital amounts and classifications are also subject to qualitative judgments by regulators. Failure to meet capital requirements can result in regulatory action.
The final rules implementing Basel Committee on Banking Supervision’s capital guidelines for U.S. Banks (Basel III rules) became effective for the Company and Bank on January 1, 2015 with full compliance with all of the requirements being phased in over a multi-year schedule through January 1, 2019. The final rules allowed banks and their holding companies with less than $250 billion in assets a one-time opportunity to opt-out of a requirement to include unrealized gains and losses in accumulated other comprehensive income in their capital calculation. The Company and the Bank opted out of this requirement. The rules also establish a “capital conservation buffer” of 2.5% above the regulatory minimum risk-based capital ratios. Once the capital conservation buffer is fully phased in, the minimum ratios are a common equity Tier 1 risk-based capital ratio of 7.0%, a Tier 1 risk-based capital ratio of 8.5%, and a total risk-based capital ratio of 10.5%. The capital conservation buffer for 2017 is 1.25% and 0.625% for 2016. An institution is subject to limitations on paying dividends, engaging in share repurchases and paying discretionary bonuses if capital levels fall below minimum levels plus the buffer amounts. These limitations establish a maximum percentage of eligible retained income that could be utilized for such actions.
The Bank is no longer subject to a consent order with the Federal Deposit Insurance Corporation and Kentucky Department of Financial Institutions. The Bank’s prior consent order was terminated effective October 31, 2017.
On September 21, 2011, the Company entered into a Written Agreement with the Federal Reserve Bank of St. Louis. Pursuant to the Agreement, management made formal commitments to use the Company’s financial and management resources to serve as a source of strength for the Bank and to assist the Bank in addressing weaknesses identified by the FDIC and the KDFI (which has since been terminated), to pay no dividends without prior written approval, to pay no interest or principal on subordinated debentures or trust preferred securities without prior written approval, and to submit an acceptable plan to maintain sufficient capital.
The following tables show the ratios (excluding capital conservation buffer) and amounts of common equity Tier 1, Tier 1 capital, and total capital to risk-adjusted assets and the leverage ratios for Porter Bancorp, Inc. and the Bank at the dates indicated (dollars in thousands):
|
Actual |
Minimum Requirement for Capital Adequacy Purposes |
Minimum Requirement to be Well Capitalized Under Prompt Corrective Action Provisions |
||||||||||||||||||||||
|
Amount |
Ratio |
Amount |
Ratio |
Amount |
Ratio |
|||||||||||||||||||
|
As of December 31, 2017: |
||||||||||||||||||||||||
|
Total risk-based capital (to risk-weighted assets) |
||||||||||||||||||||||||
|
Consolidated |
$ | 83,072 | 10.55 |
% |
$ | 63,014 | 8.00 |
% |
N/A | N/A | ||||||||||||||
|
Bank |
91,305 | 11.61 | 62,938 | 8.00 | $ | 78,672 | 10.00 |
% |
||||||||||||||||
|
Total common equity Tier 1 risk- based capital (to risk-weighted assets) |
||||||||||||||||||||||||
|
Consolidated |
54,535 | 6.92 | 35,445 | 4.50 | N/A | N/A | ||||||||||||||||||
|
Bank |
81,393 | 10.35 | 35,403 | 4.50 | 51,137 | 6.50 | ||||||||||||||||||
|
Tier 1 capital (to risk-weighted assets) |
||||||||||||||||||||||||
|
Consolidated |
66,487 | 8.44 | 47,260 | 6.00 | N/A | N/A | ||||||||||||||||||
|
Bank |
81,393 | 10.35 | 47,203 | 6.00 | 62,938 | 8.00 | ||||||||||||||||||
|
Tier 1 capital (to average assets) |
||||||||||||||||||||||||
|
Consolidated |
66,487 | 7.11 | 37,392 | 4.00 | N/A | N/A | ||||||||||||||||||
|
Bank |
81,393 | 8.70 | 37,421 | 4.00 | 46,777 | 5.00 | ||||||||||||||||||
|
Actual |
Minimum Requirement for Capital Adequacy Purposes |
Minimum Requirement to be Well Capitalized Under Prompt Corrective Action Provisions |
||||||||||||||||||||||
|
Amount |
Ratio |
Amount |
Ratio |
Amount |
Ratio |
|||||||||||||||||||
|
As of December 31, 2016: |
||||||||||||||||||||||||
|
Total risk-based capital (to risk-weighted assets) |
||||||||||||||||||||||||
|
Consolidated |
$ | 71,109 | 10.21 |
% |
$ | 55,714 | 8.00 |
% |
N/A | N/A | ||||||||||||||
|
Bank |
68,773 | 9.88 | 55,663 | 8.00 | $ | 69,579 | 10.00 |
% |
||||||||||||||||
|
Total common equity Tier 1 risk- based capital (to risk-weighted assets) |
||||||||||||||||||||||||
|
Consolidated |
36,199 | 5.20 | 31,339 | 4.50 | N/A | N/A | ||||||||||||||||||
|
Bank |
57,642 | 8.28 | 31,311 | 4.50 | 45,226 | 6.50 | ||||||||||||||||||
|
Tier 1 capital (to risk-weighted assets) |
||||||||||||||||||||||||
|
Consolidated |
48,713 | 6.99 | 41,786 | 6.00 | N/A | N/A | ||||||||||||||||||
|
Bank |
57,642 | 8.28 | 41,747 | 6.00 | 55,663 | 8.00 | ||||||||||||||||||
|
Tier 1 capital (to average assets) |
||||||||||||||||||||||||
|
Consolidated |
48,713 | 5.27 | 36,975 | 4.00 | N/A | N/A | ||||||||||||||||||
|
Bank |
57,642 | 6.24 | 36,949 | 4.00 | 46,186 | 5.00 | ||||||||||||||||||
N/A: Not applicable. Regulatory framework does not define well capitalized for holding companies.
Kentucky banking laws limit the amount of dividends that may be paid to a holding company by its subsidiary banks without prior approval. These laws limit the amount of dividends that may be paid in any calendar year to current year’s net income, as defined in the laws, combined with the retained net income of the preceding two years, less any dividends declared during those periods. In addition, a bank must have positive retained earnings.
NOTE 16 – OFF BALANCE SHEET RISKS, COMMITMENTS, AND CONTINGENT LIABILITIES
The Company, in the normal course of business, is party to financial instruments with off balance sheet risk. The financial instruments include commitments to extend credit and standby letters of credit. The contract or notional amounts of these instruments reflect the potential future obligations of the Company pursuant to those financial instruments. Creditworthiness for all instruments is evaluated on a case-by-case basis in accordance with the Company’s credit policies. Collateral from the client may be required based on the Company’s credit evaluation of the client and may include business assets of commercial clients, as well as personal property and real estate of individual clients or guarantors.
An approved but unfunded loan commitment represents a potential credit risk and a liquidity risk, since the Company’s client(s) may demand immediate cash that would require funding. In addition, unfunded loan commitments represent interest rate risk as market interest rates may rise above the rate committed to the Company’s client. Since a portion of these loan commitments normally expire unused, the total amount of outstanding commitments at any point in time may not require future funding. Commitments to make loans are generally made for periods of one year or less.
Standby letters of credit are conditional commitments issued by the Company to guarantee the performance of a client to a third party. The terms and risk of loss involved in issuing standby letters of credit are similar to those involved in issuing loan commitments and extending credit. In addition to credit risk, the Company also has liquidity risk associated with standby letters of credit because funding for these obligations could be required immediately. The Company does not deem this risk to be material. No liability is currently established for standby letters of credit.
The following table presents the contractual amounts of financial instruments with off-balance sheet risk for each year
ended:
|
2017 |
2016 |
|||||||||||||||
|
Fixed Rate |
Variable Rate |
Fixed Rate |
Variable Rate |
|||||||||||||
|
(in thousands) |
||||||||||||||||
|
Commitments to make loans |
$ | 27,349 | $ | 31,412 | $ | 19,445 | $ | 18,347 | ||||||||
|
Unused lines of credit |
11,034 | 57,727 | 7,935 | 51,407 | ||||||||||||
|
Standby letters of credit |
2,216 | 373 | 582 | 360 | ||||||||||||
Commitments to make loans are generally made for periods of one year or less.
In connection with the purchase of loan participations, the Bank entered into risk participation agreements, which had notional amounts totaling $19.8 million at December 31, 2017 and $14.6 million at December 31, 2016.
The Company is subject to claims and lawsuits that arise primarily in the ordinary course of business. Litigation is subject to inherent uncertainties and unfavorable rulings could occur. The Company records contingent liabilities resulting from claims against it when a loss is assessed to be probable and the amount of the loss is reasonably estimable. Accruals are not made in cases where liability is not probable or the amount cannot be reasonably estimated. Assessing probability of loss and estimating probable losses requires analysis of multiple factors, including in some cases judgments about the potential actions of third party claimants and courts. Recorded contingent liabilities are based on the best information available and actual losses in any future period are inherently uncertain. Based upon current knowledge and after consultation with counsel, the Company believes pending legal proceedings or claims should not have a material impact on its financial position or results of operations. However, in light of the uncertainties involved in such proceedings, the outcome of a particular matter may be material to the financial position or results of operations for a particular reporting period in the future.
On October 17, 2014, the United States Department of Justice (the “DOJ”) notified the Bank that it was the subject of an investigation into possible violations of federal laws, including, among other things, possible violations related to false bank entries, bank fraud and securities fraud. The investigation concerns allegations that Bank personnel engaged in practices intended to delay or avoid disclosure of the Bank’s asset quality at the time of and following the United States Treasury’s purchase of preferred shares from the Company in November 2008. The Bank has cooperated with all requests for information from DOJ. At this time, the DOJ has not indicated whether it intends to pursue any action in this matter.
NOTE 17 – FAIR VALUES
Fair value is the exchange price that would be received for an asset or paid to transfer a liability (exit price) in the principal or most advantageous market for the asset or liability in an orderly transaction between market participants on the measurement date. Various valuation techniques are used to determine fair value, including market, income and cost approaches. There are three levels of inputs that may be used to measure fair values:
Level 1: Quoted prices (unadjusted) for identical assets or liabilities in active markets that an entity has the ability to access as of the measurement date, or observable inputs.
Level 2: Significant other observable inputs other than Level 1 prices, such as quoted prices for similar assets or liabilities, quoted prices in markets that are not active, and other inputs that are observable or can be corroborated by observable market data.
Level 3: Significant unobservable inputs that reflect an entity’s own assumptions about the assumptions that market participants would use in pricing an asset or liability.
In certain cases, the inputs used to measure fair value may fall into different levels of the fair value hierarchy. When that occurs, the fair value hierarchy is classified on the lowest level of input that is significant to the fair value measurement. The following methods and significant assumptions are used to estimate fair value.
Securities: The fair values of securities available for sale are determined by obtaining quoted prices on nationally recognized securities exchanges, if available. This valuation method is classified as Level 1 in the fair value hierarchy. For securities where quoted prices are not available, fair values are calculated on market prices of similar securities, or matrix pricing, which is a mathematical technique used widely in the industry to value debt securities without relying exclusively on quoted prices for the specific securities but rather by relying on the securities’ relationship to other benchmark quoted securities. Matrix pricing relies on the securities’ relationship to similarly traded securities, benchmark curves, and the benchmarking of like securities. Matrix pricing utilizes observable market inputs such as benchmark yields, reported trades, broker/dealer quotes, issuer spreads, two-sided markets, benchmark securities, bids, offers, reference data, and industry and economic events. In instances where broker quotes are used, these quotes are obtained from market makers or broker-dealers recognized to be market participants. This valuation method is classified as Level 2 in the fair value hierarchy. For securities where quoted prices or market prices of similar securities are not available, fair values are calculated using discounted cash flows or other market indicators. This valuation method is classified as Level 3 in the fair value hierarchy. Discounted cash flows are calculated using spread to swap and LIBOR curves that are updated to incorporate loss severities, volatility, credit spread and optionality. During times when trading is more liquid, broker quotes are used (if available) to validate the model. Rating agency and industry research reports as well as defaults and deferrals on individual securities are reviewed and incorporated into the calculations.
Impaired Loans: An impaired loan is evaluated at the time the loan is identified as impaired and is recorded at fair value less costs to sell. Fair value is measured based on the value of the collateral securing the loan and is classified as Level 3 in the fair value hierarchy. Fair value is determined using several methods. Generally, the fair value of real estate is determined based on appraisals by qualified licensed appraisers. These appraisals may utilize a single valuation approach or a combination of approaches including comparable sales and the income approach.
Adjustments are routinely made in the appraisal process by the appraisers to adjust for differences between the comparable sales and income data available. These routine adjustments are made to adjust the value of a specific property relative to comparable properties for variations in qualities such as location, size, and income production capacity relative to the subject property of the appraisal. Such adjustments are typically significant and result in a Level 3 classification of the inputs for determining fair value.
Management routinely apply an internal discount to the value of appraisals used in the fair value evaluation of our impaired loans. The deductions to the appraisal take into account changing business factors and market conditions, as well as potential value impairment in cases where our appraisal date predates a likely change in market conditions. These deductions range from 10% for routine real estate collateral to 25% for real estate that is determined (1) to have a thin trading market or (2) to be specialized collateral. This is in addition to estimated discounts for cost to sell of six to ten percent.
Management also apply discounts to the expected fair value of collateral for impaired loans where the likely resolution involves litigation or foreclosure. Resolution of this nature generally results in receiving lower values for real estate collateral in a more aggressive sales environment. Discounts ranging from 10% to 33% have been utilized in our impairment evaluations when applicable.
Impaired loans are evaluated quarterly for additional impairment. Management obtains updated appraisals on properties securing our loans when circumstances are warranted such as at the time of renewal or when market conditions have significantly changed. This determination is made on a property-by-property basis in light of circumstances in the broader economic climate and the assessment of deterioration of real estate values in the market in which the property is located. The first stage of management’s assessment involves management’s inspection of the property in question. Management also engages in conversations with local real estate professionals, investors, and market participants to determine the likely marketing time and value range for the property. The second stage involves an assessment of current trends in the regional market. After thorough consideration of these factors, management will either internally evaluate fair value or order a new appraisal.
Other Real Estate Owned (OREO): OREO is evaluated at the time of acquisition and recorded at fair value as determined by independent appraisal or internal evaluation less cost to sell. Quarterly evaluations of OREO for impairment are driven by property type. For smaller dollar single family homes, management consults with staff from the Bank’s special assets group as well as external realtors and appraisers. Based on these consultations, management determines asking prices for OREO properties being marketed for sale. If the internally evaluated fair value or asking price is below the recorded investment in the property, appropriate write-downs are taken.
For larger dollar commercial real estate properties, management obtains a new appraisal of the subject property or has staff in the special assets group evaluate the latest in-file appraisal in connection with the transfer to OREO. Management generally obtains updated appraisals within five quarters of the anniversary date of ownership unless a sale is imminent. When an asking price is lowered below the most recent appraised value, appropriate write-downs are taken.
Management routinely applies an internal discount to the value of appraisals used in the fair value evaluation of OREO. The deductions to the appraisal take into account changing business factors and market conditions, as well as potential value impairment in cases where our appraisal date predates a likely change in market conditions. These deductions range from 10% for routine real estate collateral to 25% for real estate that is determined (1) to have a thin trading market or (2) to be specialized collateral. This is in addition to estimated discounts for cost to sell of six to ten percent.
Financial assets measured at fair value on a recurring basis are summarized below:
|
Fair Value Measurements at December 31, 2017 Using |
||||||||||||||||
|
(in thousands) |
||||||||||||||||
|
Description |
Carrying Value |
Quoted Prices In Active Markets for Identical Assets (Level 1) |
Significant Other Observable Inputs (Level 2) |
Significant Unobservable Inputs (Level 3) |
||||||||||||
|
Available for sale securities |
||||||||||||||||
|
U.S. Government and federal agency |
$ | 21,624 | $ | — | $ | 21,624 | $ | — | ||||||||
|
Agency mortgage-backed: residential |
64,965 | — | 64,965 | — | ||||||||||||
|
Collateralized loan obligations |
25,505 | — | 25,505 | — | ||||||||||||
|
State and municipal |
33,710 | — | 33,710 | — | ||||||||||||
|
Corporate bonds |
6,916 | — | 6,916 | — | ||||||||||||
|
Total |
$ | 152,720 | $ | — | $ | 152,720 | $ | — | ||||||||
|
Fair Value Measurements at December 31, 2016 Using |
||||||||||||||||
|
(in thousands) |
||||||||||||||||
|
Description |
Carrying Value |
Quoted Prices In Active Markets for Identical Assets (Level 1) |
Significant Other Observable Inputs (Level 2) |
Significant Unobservable Inputs (Level 3) |
||||||||||||
|
Available for sale securities |
||||||||||||||||
|
U.S. Government and federal agency |
$ | 34,099 | $ | — | $ | 34,099 | $ | — | ||||||||
|
Agency mortgage-backed: residential |
102,353 | — | 102,353 | — | ||||||||||||
|
Collateralized loan obligations |
11,203 | — | 11,203 | — | ||||||||||||
|
State and municipal |
2,045 | — | 2,045 | — | ||||||||||||
|
Corporate bonds |
3,090 | — | 3,090 | — | ||||||||||||
|
Total |
$ | 152,790 | $ | — | $ | 152,790 | $ | — | ||||||||
There were no transfers between Level 1 and Level 2 during 2017 or 2016.
Financial assets measured at fair value on a non-recurring basis are summarized below:
|
Fair Value Measurements at December 31, 2017 Using |
||||||||||||||||
|
(in thousands) |
||||||||||||||||
|
Description |
Carrying Value |
Quoted Prices In Active Markets for Identical Assets (Level 1) |
Significant Other Observable Inputs (Level 2) |
Significant Unobservable Inputs (Level 3) |
||||||||||||
|
Impaired loans: |
||||||||||||||||
|
Commercial |
$ | 87 | $ | — | $ | — | $ | 87 | ||||||||
|
Commercial real estate: |
||||||||||||||||
|
Construction |
— | — | — | — | ||||||||||||
|
Farmland |
— | — | — | — | ||||||||||||
|
Nonfarm nonresidential |
— | — | — | — | ||||||||||||
|
Residential real estate: |
||||||||||||||||
|
Multi-family |
— | — | — | — | ||||||||||||
|
1-4 Family |
957 | — | — | 957 | ||||||||||||
|
Consumer |
— | — | — | — | ||||||||||||
|
Agriculture |
— | — | — | — | ||||||||||||
|
Other |
— | — | — | — | ||||||||||||
|
Other real estate owned, net: |
||||||||||||||||
|
Commercial real estate: |
||||||||||||||||
|
Construction |
4,335 | — | — | 4,335 | ||||||||||||
|
Farmland |
74 | — | — | 74 | ||||||||||||
|
Nonfarm nonresidential |
— | — | — | — | ||||||||||||
|
Residential real estate: |
||||||||||||||||
|
Multi-family |
— | — | — | — | ||||||||||||
|
1-4 Family |
— | — | — | — | ||||||||||||
|
Fair Value Measurements at December 31, 2016 Using |
||||||||||||||||
|
(in thousands) |
||||||||||||||||
|
Description |
Carrying Value |
Quoted Prices In Active Markets for Identical Assets (Level 1) |
Significant Other Observable Inputs (Level 2) |
Significant Unobservable Inputs (Level 3) |
||||||||||||
|
Impaired loans: |
||||||||||||||||
|
Commercial |
$ | 87 | $ | — | $ | — | $ | 87 | ||||||||
|
Commercial real estate: |
||||||||||||||||
|
Construction |
— | — | — | — | ||||||||||||
|
Farmland |
585 | — | — | 585 | ||||||||||||
|
Nonfarm nonresidential |
— | — | — | — | ||||||||||||
|
Residential real estate: |
||||||||||||||||
|
Multi-family |
— | — | — | — | ||||||||||||
|
1-4 Family |
1,261 | — | — | 1,261 | ||||||||||||
|
Consumer |
— | — | — | — | ||||||||||||
|
Agriculture |
59 | — | — | 59 | ||||||||||||
|
Other |
— | — | — | — | ||||||||||||
|
Other real estate owned, net: |
||||||||||||||||
|
Commercial real estate: |
||||||||||||||||
|
Construction |
6,571 | — | — | 6,571 | ||||||||||||
|
Farmland |
— | — | — | — | ||||||||||||
|
Nonfarm nonresidential |
— | — | — | — | ||||||||||||
|
Residential real estate: |
||||||||||||||||
|
Multi-family |
— | — | — | — | ||||||||||||
|
1-4 Family |
250 | — | — | 250 | ||||||||||||
Impaired loans, which are measured for impairment using the fair value of the collateral for collateral dependent loans, had a carrying amount of $1.3 million, with a valuation allowance of $219,000, at December 31, 2017, resulting in no additional provision for loan losses for the year ended December 31, 2017. At December 31, 2016, impaired loans had a carrying amount of $2.4 million, with a valuation allowance of $370,000, at December 31, 2016, resulting in no additional provision for loan losses for the year ended December 31, 2016.
OREO, which is measured at the lower of carrying or fair value less costs to sell, had a net carrying amount of $4.4 million as of December 31, 2017, compared with $6.8 million at December 31, 2016. Write-downs of $2.0 million and $1.2 million were recorded on OREO for the years ended December 31, 2017 and 2016, respectively.
The following table presents qualitative information about level 3 fair value measurements for financial instruments measured at fair value on a non-recurring basis at December 31, 2017:
|
Fair Value |
Valuation Technique(s) |
Unobservable Input(s) |
Range (Weighted Average) |
|||||||||
|
(in thousands) |
||||||||||||
|
Impaired loans – Residential real estate |
$ | 957 |
Sales comparison approach |
Adjustment for differences between the comparable sales |
0% | - | 26% | (9%) | ||||
|
Other real estate owned – Commercial real estate |
$ | 4,409 |
Sales comparison approach |
Adjustment for differences between the comparable sales |
0% | - | 35% | (18%) | ||||
|
Income approach |
Discount or capitalization rate |
25% | (25%) | |||||||||
The following table presents qualitative information about level 3 fair value measurements for financial instruments measured at fair value on a non-recurring basis at December 31, 2016:
|
Fair Value |
Valuation Technique(s) |
Unobservable Input(s) |
Range (Weighted Average) |
|||||||||
|
(in thousands) |
||||||||||||
|
Impaired loans – Residential real estate |
$ | 1,261 |
Sales comparison approach |
Adjustment for differences between the comparable sales |
0% | - | 22% | (9%) | ||||
|
Other real estate owned – Commercial real estate |
$ | 6,571 |
Sales comparison approach |
Adjustment for differences between the comparable sales |
0% | - | 20% | (9%) | ||||
| Income approach | Discount or capitalization rate | 18% | - | 20% | (19%) | |||||||
Carrying amount and estimated fair values of financial instruments were as follows at year-end 2017:
|
Fair Value Measurements at December 31, 2017 Using |
||||||||||||||||||||
|
Carrying Amount |
Level 1 |
Level 2 |
Level 3 |
Total |
||||||||||||||||
|
(in thousands) |
||||||||||||||||||||
|
Financial assets |
||||||||||||||||||||
|
Cash and cash equivalents |
$ | 34,103 | $ | 29,898 | $ | 4,205 | $ | — | $ | 34,103 | ||||||||||
|
Securities available for sale |
152,720 | — | 152,720 | — | 152,720 | |||||||||||||||
|
Federal Home Loan Bank stock |
7,323 | N/A | N/A | N/A | N/A | |||||||||||||||
|
Loans held for sale |
70 | — | 70 | — | 70 | |||||||||||||||
|
Loans, net |
703,913 | — | — | 703,263 | 703,263 | |||||||||||||||
|
Accrued interest receivable |
3,136 | — | 925 | 2,211 | 3,136 | |||||||||||||||
|
Financial liabilities |
||||||||||||||||||||
|
Deposits |
$ | 847,024 | $ | 137,386 | $ | 693,320 | $ | — | $ | 830,706 | ||||||||||
|
Federal Home Loan Bank advances |
11,797 | — | 11,799 | — | 11,799 | |||||||||||||||
|
Subordinated capital notes |
2,250 | — | — | 2,246 | 2,246 | |||||||||||||||
|
Junior subordinated debentures |
21,000 | — | — | 19,090 | 19,090 | |||||||||||||||
|
Senior debt |
10,000 | — | — | 10,000 | 10,000 | |||||||||||||||
|
Accrued interest payable |
1,475 | — | 357 | 1,118 | 1,475 | |||||||||||||||
Carrying amount and estimated fair values of financial instruments were as follows at year-end 2016:
|
Fair Value Measurements at December 31, 2016 Using |
||||||||||||||||||||
|
Carrying Amount |
Level 1 |
Level 2 |
Level 3 |
Total |
||||||||||||||||
|
(in thousands) |
||||||||||||||||||||
|
Financial assets |
||||||||||||||||||||
|
Cash and cash equivalents |
$ | 66,316 | $ | 31,091 | $ | 35,225 | $ | — | $ | 66,316 | ||||||||||
|
Securities available for sale |
152,790 | — | 152,790 | — | 152,790 | |||||||||||||||
|
Securities held to maturity |
41,818 | — | 43,072 | — | 43,072 | |||||||||||||||
|
Federal Home Loan Bank stock |
7,323 | N/A | N/A | N/A | N/A | |||||||||||||||
|
Loans, net |
630,269 | — | — | 632,528 | 632,528 | |||||||||||||||
|
Accrued interest receivable |
3,137 | — | 1,203 | 1,934 | 3,137 | |||||||||||||||
|
Financial liabilities |
||||||||||||||||||||
|
Deposits |
$ | 849,925 | $ | 124,395 | $ | 712,458 | $ | — | $ | 836,853 | ||||||||||
|
Federal Home Loan Bank advances |
22,458 | — | 22,475 | — | 22,475 | |||||||||||||||
|
Subordinated capital notes |
3,150 | — | — | 3,091 | 3,091 | |||||||||||||||
|
Junior subordinated debentures |
21,000 | — | — | 13,263 | 13,263 | |||||||||||||||
|
Accrued interest payable |
734 | — | 369 | 365 | 734 | |||||||||||||||
The methods and assumptions used to estimate fair value are described as follows:
(a) Cash and Cash Equivalents
The carrying amounts of cash and short-term instruments approximate fair values and are classified as either Level 1 or Level 2. Noninterest bearing deposits are Level 1 whereas interest bearing due from bank accounts and fed funds sold are Level 2.
(b) FHLB Stock
It is not practical to determine the fair value of FHLB stock due to restrictions placed on its transferability.
(c) Loans, Net
Fair values of loans, excluding loans held for sale, are estimated as follows: For variable rate loans that reprice frequently and with no significant change in credit risk, fair values are based on carrying values resulting in a Level 3 classification. Fair values for other loans are estimated using discounted cash flow analyses, using interest rates currently being offered for loans with similar terms to borrowers of similar credit quality resulting in a Level 3 classification. Impaired loans are valued at the lower of cost or fair value as described previously. The methods utilized to estimate the fair value of loans do not necessarily represent an exit price.
(d) Loans Held for Sale
The fair value of loans held for sale is estimated based upon binding contracts and quotes from third party investors resulting in a Level 2 classification.
(e) Deposits
The fair values disclosed for non-interest bearing deposits are, by definition, equal to the amount payable on demand at the reporting date resulting in a Level 1 classification. The carrying amounts of variable rate interest bearing deposits approximate their fair values at the reporting date resulting in a Level 2 classification. Fair values for fixed rate interest bearing deposits are estimated using a discounted cash flows calculation that applies interest rates currently being offered on certificates to a schedule of aggregated expected monthly maturities on time deposits resulting in a Level 2 classification.
(f) Other Borrowings
The fair values of FHLB advances are estimated using discounted cash flow analyses based on the current borrowing rates resulting in a Level 2 classification.
The fair values of subordinated capital notes, junior subordinated debentures, and senior debt are estimated using discounted cash flow analyses based on the current borrowing rates for similar types of borrowing arrangements resulting in a Level 3 classification.
(g) Accrued Interest Receivable/Payable
The carrying amounts of accrued interest approximate fair value resulting in a Level 2 or Level 3 classification based on the level of the asset or liability with which the accrual is associated.
NOTE 18 – STOCK PLANS AND STOCK BASED COMPENSATION
Shares available for issuance under the 2016 Omnibus Equity Compensation Plan (“2016 Plan”) total 25,000. Shares issued to employees under the plan vest annually on the anniversary date of the grant generally over three to four years.
The Company also maintains the Porter Bancorp, Inc. 2006 Non-Employee Directors Stock Ownership Incentive Plan (“2006 Director Plan”) pursuant to which 2,834 shares remain available for issuance as annual awards of restricted stock to the Company’s non-employee directors. Shares issued annually to non-employee directors have a fair market value of $25,000 and vest on December 31 in the year of grant.
The fair value of the 2017 unvested shares issued was $365,000, or $9.64 per weighted-average share. The Company recorded $400,000 and $443,000 of stock-based compensation during 2017 and 2016, respectively, to salaries and employee benefits. Management expects substantially all of the unvested shares outstanding at the end of the period to vest according to the vesting schedule. A deferred tax benefit of $140,000 was recognized in 2017 related to this expense, whereas no deferred tax benefit was recognized in 2016.
The following table summarizes unvested share activity as of and for the periods indicated for the Stock Incentive Plan:
|
Twelve Months Ended |
Twelve Months Ended |
|||||||||||||||
|
December 31, 2017 |
December 31, 2016 |
|||||||||||||||
|
Weighted |
Weighted |
|||||||||||||||
|
Average |
Average |
|||||||||||||||
|
Grant |
Grant |
|||||||||||||||
|
Shares |
Price |
Shares |
Price |
|||||||||||||
|
Outstanding, beginning |
179,513 | $ | 4.89 | 184,482 | $ | 4.81 | ||||||||||
|
Granted |
37,865 | 9.64 | 35,465 | 9.10 | ||||||||||||
|
Vested |
(73,728 |
) |
5.75 | (38,462 |
) |
8.32 | ||||||||||
|
Forfeited |
(1,316 |
) |
9.35 | (1,972 |
) |
6.16 | ||||||||||
|
Outstanding, ending |
142,334 | $ | 5.67 | 179,513 | $ | 4.89 | ||||||||||
Unrecognized stock based compensation expense related to unvested shares for 2018 and beyond is estimated as follows (in thousands):
|
2018 |
$ | 258 | ||
|
2019 |
99 | |||
|
2020 |
25 | |||
|
2021 & thereafter |
— |
NOTE 19 – EARNINGS (LOSS) PER SHARE
The factors used in the basic and diluted earnings per share computation follow:
|
2017 |
2016 |
2015 |
||||||||||
|
(in thousands, except share and per share data) |
||||||||||||
|
Net income (loss) |
$ | 38,453 | $ | (2,753 |
) |
$ | (3,213 |
) |
||||
|
Less: |
||||||||||||
|
Earnings (losses) allocated to unvested shares |
967 | (88 |
) |
(122 |
) |
|||||||
|
Earnings (losses) allocated to participating preferred shares |
— | — | (214 |
) |
||||||||
|
Net income (loss) attributable to common shareholders, basic and diluted |
$ | 37,486 | $ | (2,665 |
) |
$ | (2,877 |
) |
||||
|
Basic |
||||||||||||
|
Weighted average common shares including unvested common shares and participating preferred shares outstanding |
6,249,059 | 5,980,945 | 5,191,944 | |||||||||
|
Less: |
||||||||||||
|
Weighted average unvested common shares |
157,127 | 192,232 | 197,355 | |||||||||
|
Weighted average Series B Preferred Shares |
— | — | 133,269 | |||||||||
|
Weighted average Series D Preferred Shares |
— | — | 212,318 | |||||||||
|
Weighted average common shares outstanding |
6,091,932 | 5,788,713 | 4,649,002 | |||||||||
|
Basic income (loss) per common share |
$ | 6.15 | $ | (0.46 |
) |
$ | (0.62 |
) |
||||
|
Diluted |
||||||||||||
|
Add: Dilutive effects of assumed exercises of common stock warrants |
— | — | — | |||||||||
|
Weighted average common shares and potential common shares |
6,091,932 | 5,788,713 | 4,649,002 | |||||||||
|
Diluted income (loss) per common share |
$ | 6.15 | $ | (0.46 |
) |
$ | (0.62 |
) |
||||
The Company had no outstanding stock options at December 31, 2017, 2016 or 2015. A warrant for the purchase of 66,113 shares of the Company’s common stock at an exercise price of $79.41 was outstanding at December 31, 2017, 2016 and 2015, but was not included in the diluted EPS computation as inclusion would have been anti-dilutive. The warrant is exercisable at the holder’s option through November 21, 2018.
NOTE 20 – PARENT COMPANY ONLY CONDENSED FINANCIAL INFORMATION
Condensed financial information of Porter Bancorp Inc. is presented as follows:
CONDENSED BALANCE SHEETS
December 31,
|
2017 |
2016 |
|||||||
|
(in thousands) |
||||||||
|
ASSETS |
||||||||
|
Cash and cash equivalents (1) |
$ | 2,045 | $ | 2,048 | ||||
|
Investment in banking subsidiary |
99,651 | 51,528 | ||||||
|
Investment in and advances to other subsidiaries |
776 | 776 | ||||||
|
Deferred taxes, net |
2,497 | — | ||||||
|
Other assets |
711 | 645 | ||||||
|
Total assets |
$ | 105,680 | $ | 54,997 | ||||
|
LIABILITIES AND SHAREHOLDERS’ EQUITY |
||||||||
|
Debt |
$ | 31,775 | $ | 21,775 | ||||
|
Accrued expenses and other liabilities |
1,232 | 489 | ||||||
|
Shareholders’ equity |
72,673 | 32,733 | ||||||
|
Total liabilities and shareholders’ equity |
$ | 105,680 | $ | 54,997 | ||||
|
(1) |
$806,000 is held in escrow by the senior note lender to be used exclusively for interest payments on senior debt. |
CONDENSED STATEMENTS OF OPERATIONS
Years ended December 31,
|
2017 |
2016 |
2015 |
||||||||||
|
(in thousands) |
||||||||||||
|
Interest income |
$ | 4 | $ | 5 | $ | 46 | ||||||
|
Dividends from subsidiaries |
26 | 23 | 20 | |||||||||
|
Other income |
— | 17 | 102 | |||||||||
|
Interest expense |
(973 |
) |
(694 |
) |
(647 |
) |
||||||
|
Other expense |
(1,137 |
) |
(1,240 |
) |
(1,457 |
) |
||||||
|
Income (loss) before income tax and undistributed subsidiary income |
(2,080 |
) |
(1,889 |
) |
(1,936 |
) |
||||||
|
Income tax expense (benefit) |
(2,497 |
) |
21 | — | ||||||||
|
Equity in undistributed subsidiary income (loss) |
38,036 | (843 |
) |
(1,277 |
) |
|||||||
|
Net income (loss) |
$ | 38,453 | $ | (2,753 |
) |
$ | (3,213 |
) |
||||
CONDENSED STATEMENTS OF CASH FLOWS
Years ended December 31,
|
2017 |
2016 |
2015 |
||||||||||
|
(in thousands) |
||||||||||||
|
Cash flows from operating activities |
||||||||||||
|
Net income (loss) |
$ | 38,453 | $ | (2,753 |
) |
$ | (3,213 |
) |
||||
|
Adjustments: |
||||||||||||
|
Equity in undistributed subsidiary (income) loss |
(38,036 |
) |
843 | 1,277 | ||||||||
|
Deferred taxes, net |
(2,497 |
) |
— | — | ||||||||
|
Gain on sale of assets |
— | — | (70 |
) |
||||||||
|
Change in other assets |
743 | (95 |
) |
(40 |
) |
|||||||
|
Change in other liabilities |
(128 |
) |
358 | 634 | ||||||||
|
Other |
462 | 978 | 481 | |||||||||
|
Net cash (used in) operating activities |
(1,003 |
) |
(669 |
) |
(931 |
) |
||||||
|
Cash flows from investing activities |
||||||||||||
|
Investments in subsidiaries |
(9,000 |
) |
(500 |
) |
— | |||||||
|
Sales of securities |
— | — | 642 | |||||||||
|
Net cash (used in) from investing activities |
(9,000 |
) |
(500 |
) |
642 | |||||||
|
Cash flows from financing activities |
||||||||||||
|
Proceeds from issuance of common stock |
— | 2,231 | — | |||||||||
|
Proceeds from senior debt |
10,000 | — | — | |||||||||
|
Net cash (used in) financing activities |
10,000 | 2,231 | — | |||||||||
|
Net change in cash and cash equivalents |
(3 |
) |
1,062 | (289 |
) |
|||||||
|
Beginning cash and cash equivalents |
2,048 | 986 | 1,275 | |||||||||
|
Ending cash and cash equivalents |
$ | 2,045 | $ | 2,048 | $ | 986 | ||||||
NOTE 21 – QUARTERLY FINANCIAL DATA (UNAUDITED)
|
Earnings (Loss) Per Common Share |
||||||||||||||||||||||||||||
|
Interest Income |
Net Interest Income |
Provision For Loan Losses |
OREO Expense |
Net Income (Loss) |
Basic (1) |
Diluted (1) |
||||||||||||||||||||||
|
(in thousands, except per share data) |
||||||||||||||||||||||||||||
|
2017 |
||||||||||||||||||||||||||||
|
First quarter |
$ | 9,225 | $ | 7,741 | $ | — | $ | (16 |
) |
$ | 1,680 | $ | 0.27 | $ | 0.27 | |||||||||||||
|
Second quarter |
9,134 | 7,588 | — | (3 |
) |
1,709 | 0.27 | 0.27 | ||||||||||||||||||||
|
Third quarter |
9,446 | 7,787 | — | 111 | 1,794 | 0.29 | 0.29 | |||||||||||||||||||||
|
Fourth quarter |
9,717 | 8,001 | (800 |
) |
1,881 | 33,270 | (2) | 5.31 | 5.31 | |||||||||||||||||||
|
2016 |
||||||||||||||||||||||||||||
|
First quarter |
$ | 9,185 | $ | 7,651 | $ | (550 |
) |
$ | 668 | $ | 1,480 | $ | 0.27 | $ | 0.27 | |||||||||||||
|
Second quarter |
8,705 | 7,196 | (600 |
) |
294 | 1,012 | 0.17 | 0.17 | ||||||||||||||||||||
|
Third quarter |
8,931 | 7,458 | (750 |
) |
322 | 1,393 | 0.22 | 0.22 | ||||||||||||||||||||
|
Fourth quarter |
8,781 | 7,316 | (550 |
) |
257 | (6,638 |
) |
(3) | (1.07 |
) |
(1.07 |
) |
||||||||||||||||
|
(1) |
The sum of the quarterly net income (loss) per share (basic and diluted) differs from the annual net income (loss) per share (basic and diluted) because of the differences in the weighted average number of common shares outstanding and the common shares used in the quarterly and annual computations as well as differences in rounding. |
|
(2) |
Net income for the fourth quarter of 2017 was impacted by the reversal of the Company’s deferred tax asset valuation allowance and the change in federal corporate tax rates in connection with the enectment of the Tax Cuts and Jobs Act of 2017. The net result of these two items, as well as tax expense for the year, was an income tax benefit of $31.9 million. |
|
(3) |
The $6.6 million loss for the fourth quarter of 2016 was due to the $8.0 million in litigation expenses accrued as a result of the Kentucky Court of Appeals ruling against the Bank. |
Item 9. Changes in and Disagreements With Accountants on Accounting and Financial Disclosure
None
|
Item 9A. |
Disclosure Controls and Procedures
Management is responsible for establishing and maintaining effective disclosure controls and procedures, as defined under Rules 13a-15(e) and 15d-15(e) of the Securities Exchange Act of 1934. Our management, under the supervision and with the participation of our Chief Executive Officer and our Chief Financial Officer, evaluated the effectiveness of the design and operation of our disclosure controls and procedures as of December 31, 2017. Based on that evaluation, management believes that our disclosure controls and procedures were effective to collect, process, and disclose the information required to be disclosed in the reports filed with the SEC within the required time periods as of the end of the period covered by this report.
There was no change in the internal control over financial reporting during the most recent fiscal quarter that has materially affected, or is reasonably likely to materially affect, the Company’s internal control over financial reporting.
Management’s Report on Internal Control Over Financial Reporting
The management of Porter Bancorp, Inc. is responsible for establishing and maintaining adequate internal control over financial reporting. Internal control over financial reporting is defined in Rule 13a-15(f) promulgated under the Securities Exchange Act of 1934 as a process designed by, or under the supervision of; the principal executive and principal financial officers and effected by the board of directors, management and other personnel, to provide reasonable assurance regarding the reliability of financial reporting and the preparation of financial statements for external purposes in accordance with U.S. generally accepted accounting principles and includes those policies and procedures that:
Pertain to the maintenance of records that in reasonable detail accurately and fairly reflect the transactions and dispositions of our assets;
Provide reasonable assurance that transactions are recorded as necessary to permit preparation of financial statements in accordance with U.S. generally accepted accounting principles, and that our receipts and expenditures are being made only in accordance with authorizations of our management and directors; and
Provide reasonable assurance regarding prevention or timely detection of unauthorized acquisition, use or disposition of our assets that could have a material effect on the financial statements.
Because of its inherent limitations, internal control over financial reporting may not prevent or detect misstatements. Projections of any evaluation of effectiveness to future periods are subject to the risk that controls may become inadequate because of changes in conditions, or that the degree of compliance with the policies or procedures may deteriorate.
Management assessed the effectiveness of our internal control over financial reporting as of December 31, 2017. In making this assessment, management used the criteria set forth by the Committee of Sponsoring Organizations of the Treadway Commission ("COSO") in the 2013 Internal Control-Integrated Framework. Based on that assessment, management believes that, as of December 31, 2017, our internal control over financial reporting is effective based on those criteria.
This annual report does not include an attestation report of our registered public accounting firm regarding internal controls over financial reporting. Management’s report was not subject to attestation by our registered public accounting firm pursuant to rules of the Securities and Exchange Commission that permit us to provide only management’s report in this annual report.
/s/ John T. Taylor
John T. Taylor
President and Chief Executive Officer
/s/ Phillip W. Barnhouse
Phillip W. Barnhouse
Chief Financial Officer
None
Item 10. Directors, Executive Officers and Corporate Governance.
The Company has adopted a code of ethics applicable to the Chief Executive Officer and the senior financial officers, which is posted on the Bank’s website at http://www.limestonebank.com under the Investors Relations section of the About Us tab. If we amend or waive any of the provisions of the Code of Ethics applicable to our Chief Executive Officer or senior financial officers, we intend to disclose the amendment or waiver on our website. We will provide to any person without charge, upon request, a copy of this Code of Ethics. You can request a copy by contacting Porter Bancorp, Inc., Chief Financial Officer, 2500 Eastpoint Parkway, Louisville, Kentucky, 40223, (telephone) 502-499-4800.
Additional information required by this Item 10 is omitted because we are filing a definitive proxy statement pursuant to Regulation 14A on or before April 30, 2018, which includes the required information. The required information contained in our proxy statement is incorporated herein by reference.
Item 11. Executive Compensation.
The information required by this Item 11 is omitted because we are filing a definitive proxy statement pursuant to Regulation 14A on or before April 30, 2018, which includes the required information. The required information contained in our proxy statement is incorporated herein by reference.
Item 12. Security Ownership of Certain Beneficial Owners and Management and Related Stockholder Matters
The information required by this Item 12 is omitted because we are filing a definitive proxy statement pursuant to Regulation 14A on or before April 30, 2018, which includes the required information. The required information contained in our proxy statement is incorporated herein by reference.
Item 13. Certain Relationships and Related Transactions, and Director Independence.
The information required by this Item 13 is omitted because we are filing a definitive proxy statement pursuant to Regulation 14A on or before April 30, 2018, which includes the required information. The required information contained in our proxy statement is incorporated herein by reference.
Item 14. Principal Accounting Fees and Services.
The information required by this Item 14 is omitted because we are filing a definitive proxy statement pursuant to Regulation 14A on or before April 30, 2018, which includes the required information. The required information contained in our proxy statement is incorporated herein by reference.
| Exhibit No. (1) | Description | |||
|
32.2 |
||||
|
101 |
The following financial statements from the Company’s Annual Report on Form 10-K for the year ended December 31, 2017, formatted in XBRL: (i) Consolidated Balance Sheets, (ii) Consolidated Statements of Operations, (iii) Consolidated Statements of Comprehensive Income, (iv) Consolidated Statements of Changes in Stockholders’ Equity, (v) Consolidated Statements of Cash Flows, (vi) Notes to Consolidated Financial Statements. |
|||
|
+ |
Management contract or compensatory plan or arrangement. |
|
(1) |
The Company has other long-term debt agreements that meet the exclusion set forth in Section 601(b)(4)(iii)(A) of Regulation S-K. The Company hereby agrees to furnish a copy of such agreements to the Securities and Exchange Commission upon request. |
Pursuant to the requirements of Section 13 or 15(d) of the Securities Exchange Act of 1934, the registrant has duly caused this report to be signed on its behalf by the undersigned, thereunto duly authorized.
|
|
PORTER BANCORP, INC. |
|
|
February 28, 2018 |
By: |
/s/ John T. Taylor |
|
|
|
John T. Taylor |
|
|
|
Chief Executive Officer |
Pursuant to the requirements of the Securities Exchange Act of 1934, this report has been signed below by the following persons on behalf of the registrant and in the capacities indicated.
|
/s/ John T. Taylor |
Chief Executive Officer |
February 28, 2018 |
| John T. Taylor | ||
|
/s/ Phillip W. Barnhouse |
Chief Financial Officer |
February 28, 2018 |
| Phillip W. Barnhouse | ||
|
/s/ W. Glenn Hogan |
Director |
February 28, 2018 |
| W. Glenn Hogan | ||
|
/s/ Michael T. Levy |
Director |
February 28, 2018 |
| Michael T. Levy | ||
|
/s/ Bradford T. Ray |
Director |
February 28, 2018 |
| Bradford T. Ray | ||
|
/s/ W. Kirk Wycoff |
Director |
February 28, 2018 |
|
W. Kirk Wycoff |
||
|
/s/ James M. Parsons |
Director |
February 28, 2018 |
| James M. Parsons | ||
|
/s/ Dr. Edmond J. Seifried |
Director |
February 28, 2018 |
| Dr. Edmond J. Seifried |
102