Attached files
| file | filename |
|---|---|
| 8-K - 8-K - Zep Inc. | a11-10900_48k.htm |
| EX-99.1 - EX-99.1 - Zep Inc. | a11-10900_4ex99d1.htm |
Exhibit 99.2
|
|
Zep Inc. Third Quarter 2011 Earnings Conference Call July 7, 2011 John K. Morgan Chairman, President and Chief Executive Officer Mark R. Bachmann Executive Vice President and Chief Financial Officer |

|
|
Agenda Safe Harbor Third Quarter Highlights Detailed Financial Performance Zep Inc. Long-term Goals Questions and Answers 1 |

|
|
Safe Harbor This presentation and our commentary contain forward-looking statements within the meaning of the Private Securities Litigation Reform Act of 1995. Specifically, forward-looking statements include, but are not limited to, statements relating to our future economic performance, business prospects, revenue, income, and financial condition; and statements preceded by, followed by, or that include the words "expects," "believes," "intends," "will," "anticipates," and similar terms that relate to future events, performance, or our results. Examples of forward-looking statements in this presentation and our commentary include but are not limited to: statements regarding the economic environment and the impact this environment has had or could have on our current and/or future financial results; statements regarding benefits that we may realize from our acquisitions and our restructuring activities; statements regarding investments that may be made in the future to grow our business, either organically or otherwise, in accordance with our strategic plan, or that may be made for other purposes; and statements and related estimates concerning the benefits that the execution of our strategic initiatives are expected to have on future financial results. Our forward-looking statements are subject to certain risks and uncertainties that could cause actual results, expectations, or outcomes to differ materially from our historical experience as well as our present expectations or projections. These risks and uncertainties include, but are not limited to: economic conditions in general; customer and supplier relationships and prices; competition; ability to realize anticipated benefits from strategic planning initiatives and timing of benefits; market demand; and litigation and other contingent liabilities, such as environmental matters. A variety of other risks and uncertainties could cause our actual results to differ materially from the anticipated results or other expectations expressed in our forward-looking statements. A number of those risks are discussed in Part I, "Item 1A. Risk Factors" of our Annual Report on Form 10-K for the fiscal year ended August 31, 2010. We believe the forward-looking statements are reasonable; however, undue reliance should not be placed on any forward-looking statements, which are based on current expectations. Further, forward-looking statements speak only as of the date they are made, and we undertake no obligation to update publicly any of them in light of new information or future events. 2 |

|
|
Third Quarter Highlights 3 |

|
|
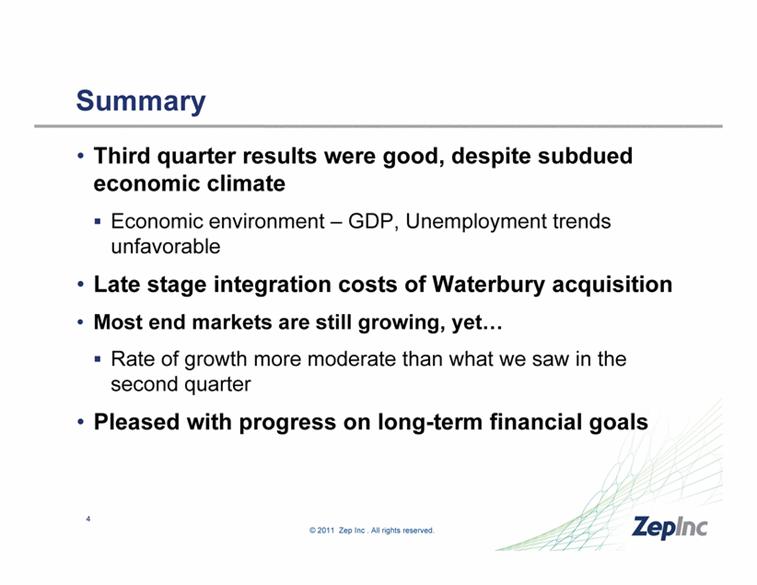
Summary Third quarter results were good, despite subdued economic climate Economic environment – GDP, Unemployment trends unfavorable Late stage integration costs of Waterbury acquisition Most end markets are still growing, yet... Rate of growth more moderate than what we saw in the second quarter Pleased with progress on long-term financial goals 4 |
|
|
Third Quarter 2011 Highlights Achieved Record Third Quarter Results: Net Sales increased 9.7% to a record $168 million Adjusted EBITDA of $16.5 million, up 14.4% Adjusted EBITDA margin up 40 basis points to 9.8% Adjusted Diluted EPS of $0.32, up 7.6% Free Cash Flow Generation Continues $12.6 million in Free Cash Flow, up 67.2% Strategic Growth Initiatives: We saw strength in Automotive, Food Processing, Industrial MRO Jan-San, Retail Diversification and Government taking longer to get traction 5 |

|
|
Zep Inc. - Evolving Business Model Shift towards more Distribution will Increase Sales and Drive Higher EBITDA Margins Market Data Source: information compiled by Zep Inc. based on research provided by Kline & Company and the Automotive Aftermarket Industry Association. 6 |

|
|
Zep Inc. - Long-Term Strategy 7 |

|
|
Strategic Initiatives: 3Q11 End-Market Drivers 8 Remain Confident that Strategic Growth Initiatives will Deliver Future Results + - + + + + - Automotive Aftermarket Food Processing Jan / San Industrial MRO Distribution Government Retail Diversification Deeper Penetration of Customer Accounts Saw strength due to higher sales volumes with Asian OEMs and promotional activity at retailers Improving sales due to focus on food segment and sales force training; increased number of certified food safety consultants Slowdown resulting from raw material shortages and integration disruption unique to the quarter as new business is accelerating Sales grew in line with the market Weakness resulting from slowdown in government spending Meaningful discussions underway to expand offering Recently expanded product line gaining traction across our business |

|
|
Adjusted EBITDA Margin Operating Expense Leverage to Drive EBITDA Margin Expansion +40 bp 9 |

|
|
Third Quarter Summary Long term strategic growth initiatives remain solid Now in a position to focus on profitable growth Evolution to Distributors continues on track Automotive business expanding nicely MRO is growing Jan-San had issues unique to the quarter, but has a strong foundation in place for future growth Waterbury and Retail integration near completion High-end of $2 million to $3 million estimate in synergies now expected in fiscal 2012 10 |

|
|
Detailed Financial Performance 11 |

|
|
Record Net Sales $ Millions Strategic Growth Initiatives in Place to Drive Volumes 12 *Figures may not foot due to rounding. |

|
|
Adjusted Gross Profit Margin Adj. Gross Profit Margin of 46.8%, 280 basis points below last year: Shift in sales mix to a larger portion of Retail and Distribution Like most companies, we face rising raw material costs 13 180bp Mix 100bp Cost Planned Sales Mix Shift, Raw Material Costs Impacted Gross Margin |

|
|
Gross Margin: Raw Material Cost Inflation Last 12 Months Last 3 Months Propylene +53% +35% Ethylene +28% +18% Acetone +52% +17% HDPE +14% +9% During periods of significant raw material inflation, have been able to maintain Gross Profit dollars, but will see Gross Profit Margin decline When raw material prices stabilize, we have been able to recoup some Gross Profit Margin Direct Sales and Service successful offsetting cost increases this quarter Distribution and Retail pricing slower to work through 14 Implementing Price Increases in Distribution and Retail to Offset Rising Raw Material Costs |

|
|
Costs Impacting 3Q11 Diluted EPS (a) We provide adjusted results that exclude restructuring charges, acquisition costs and other special items to reflect the impact of our initiatives to improve productivity. We provide adjusted information as an addition to, and not as a substitute for, financial measures presented in accordance with GAAP. We believe the adjusted presentation is a beneficial supplemental disclosure to investors in analyzing and assessing our past and future performance. (b) Rounding may affect summary presentation of adjusted diluted earnings per share totals. 15 Reported (GAAP) Diluted Earnings Per Share $ 0.28 $ 0.23 Incremental expense due to increased basis of acquired inventories — 0.01 Restructuring Charges — 0.06 Integration Costs 0.02 — Incremental Legal Costs Associated with California Matter 0.02 — Adjusted Diluted Earnings Per Share (a), (b) $ 0.32 $ 0.30 Three Months Ended May 31, 2011 2010 |

|
|
Adjusted EBITDA 16 $ Millions EBITDA Margin 40bp Above Prior Year Record Adjusted EBITDA Shift in Sales Mix and Cost Management Yielding Higher EBITDA Margins |

|
|
Record Third Quarter Adjusted Net Income 17 $ Millions Adjusted EPS up 7.6% to $0.32 |

|
|
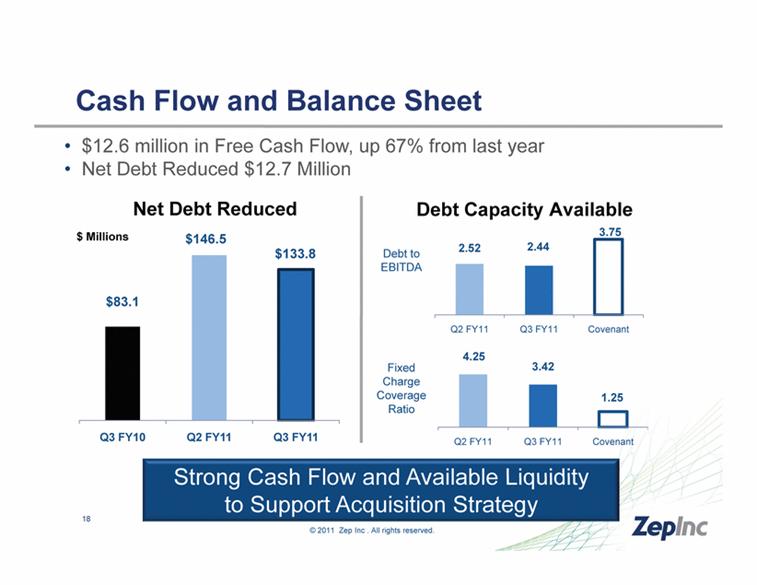
Cash Flow and Balance Sheet Net Debt Reduced Debt Capacity Available 18 Fixed Charge Coverage Ratio Debt to EBITDA Strong Cash Flow and Available Liquidity to Support Acquisition Strategy $12.6 million in Free Cash Flow, up 67% from last year Net Debt Reduced $12.7 Million $ Millions |
|
|
Zep Inc. Long-Term Goals 19 |

|
|
Long-Term Financial Objectives Revenue growth in excess of market growth Target of 50 bp annualized EBITDA margin improvement 11%-13% annualized EPS improvement Return on Invested Capital (ROIC) target of 15%+ 20 |

|
|
Questions and Answers 21 |