Attached files
Table of Contents
Index to Financial Statements
UNITED STATES
SECURITIES AND EXCHANGE COMMISSION
Washington, D.C. 20549
FORM 10-K
(Mark One)
| x | ANNUAL REPORT PURSUANT TO SECTION 13 OR 15(d) OF THE SECURITIES EXCHANGE ACT OF 1934 |
For the fiscal year ended August 31, 2010.
OR
| ¨ | TRANSITION REPORT PURSUANT TO SECTION 13 OR 15(d) OF THE SECURITIES EXCHANGE ACT OF 1934 |
For the transition period from to .
Commission file number 001-33633.
Zep Inc.
(Exact name of registrant as specified in its charter)
| Delaware | 26-0783366 | |
| (State or other jurisdiction of incorporation or organization) | (I.R.S. Employer Identification Number) | |
| 1310 Seaboard Industrial Boulevard, Atlanta, Georgia |
30318-2825 | |
| (Address of principal executive offices) | (Zip Code) | |
(404) 352-1680
(Registrant’s telephone number, including area code)
Securities registered pursuant to Section 12(b) of the Securities Exchange Act of 1934:
| Title of Each Class |
Name of Each Exchange on which Registered | |
| Common Stock ($0.01 Par Value) | New York Stock Exchange | |
| Preferred Stock Purchase Rights | New York Stock Exchange |
Securities registered pursuant to Section 12(g) of the Act: None
Indicate by checkmark if the registrant is a well-known seasoned issuer, as defined in Rule 405 of the Securities Act. Yes ¨ No x
Indicate by checkmark if the registrant is not required to file reports pursuant to Section 13 or Section 15(d) of the Act. Yes ¨ No x
Indicate by check mark whether the registrant (1) has filed all reports required to be filed by Section 13 or 15(d) of the Securities Exchange Act of 1934 during the preceding 12 months (or for such shorter period that the registrant was required to file such reports), and (2) has been subject to such filing requirements for the past 90 days. Yes x No ¨
Indicate by check mark whether the registrant has submitted electronically and posted on its corporate Web site, if any, every Interactive Data File required to be submitted and posted pursuant to Rule 405 of Regulation S-T (§232.405 of this chapter) during the preceding 12 months (or for such shorter period that the registrant was required to submit and post such files). Yes ¨ No ¨
Indicate by check mark if disclosure of delinquent filers pursuant to Item 405 of Regulation S-K (§229.405 of this chapter) is not contained herein, and will not be contained, to the best of registrant’s knowledge, in definitive proxy or information statements incorporated by reference in Part III of this Form 10-K or any amendment to this Form 10-K. x
Indicate by check mark whether the registrant is a large accelerated filer, an accelerated filer, a non-accelerated filer, or a smaller reporting company. See the definitions of “large accelerated filer,” “accelerated filer,” and “smaller reporting company” in Rule 12b-2 of the Exchange Act. (Check one):
Large Accelerated Filer ¨ Accelerated Filer x Non-accelerated Filer ¨ Smaller reporting company ¨
Indicate by check mark whether the registrant is a shell company (as defined in Rule 12b-2 of the Act). Yes ¨ No x
Based on the closing price of the registrant’s common stock of $22.09 as quoted on the New York Stock Exchange on February 26, 2010, the aggregate market value of the voting stock held by nonaffiliates of the registrant was $227,535,195.
The number of shares outstanding of the registrant’s common stock, $0.01 par value, was 21,753,556 as of November 5, 2010.
Documents Incorporated by Reference
| Location in Form 10K |
Incorporated Document | |
| Part III | Proxy Statement for January 6, 2011 Annual Meeting of Stockholders |
Table of Contents
Index to Financial Statements
Zep Inc.
| Page No. | ||||||
| Part I |
||||||
| Item 1. |
1 | |||||
| Item 1A. |
9 | |||||
| Item 1B. |
18 | |||||
| Item 2. |
18 | |||||
| Item 3. |
19 | |||||
| Item 4. |
19 | |||||
| Part II |
||||||
| Item 5. |
20 | |||||
| Item 6. |
22 | |||||
| Item 7. |
Management’s Discussion and Analysis of Financial Condition and Results of Operations |
23 | ||||
| Item 7A. |
39 | |||||
| Item 8. |
41 | |||||
| Item 9. |
Changes in and Disagreements with Accountants on Accounting and Financial Disclosure |
82 | ||||
| Item 9A. |
82 | |||||
| Item 9B. |
82 | |||||
| Part III |
||||||
| Item 10. |
83 | |||||
| Item 11. |
83 | |||||
| Item 12. |
Security Ownership of Certain Beneficial Owners and Management and Related Stockholder Matters |
83 | ||||
| Item 13. |
Certain Relationships and Related Transactions, and Director Independence |
84 | ||||
| Item 14. |
84 | |||||
| Part IV |
||||||
| Item 15. |
85 | |||||
| 94 | ||||||
| 95 | ||||||
Table of Contents
Index to Financial Statements
PART I
Our Business
Zep Inc. is a leading provider of cleaning and maintenance chemicals and related products and services. We market our products and services under well recognized brand names, some of which have been in existence since we were founded in 1937. For the fiscal year ended August 31, 2010, we generated net sales of $568.5 million and net income of $13.5 million. We sell our products to more than 200,000 customers, which are located primarily in the United States (80% of fiscal 2010 net sales), Canada (11% of fiscal 2010 net sales), and Europe (9% of fiscal 2010 net sales). We became an independent, publicly owned company in 2007 after having been spun-off by our former parent company. Our common stock is listed on the New York Stock Exchange under the ticker symbol “ZEP.”
We believe that the applicable market for our products and services in the United States is approximately $19 billion. The market consists of three different types of end-users. The largest category of end-users is professional maintenance and cleaning personnel who buy products from business-to-business supply distributors. We believe this type of end-user represents approximately 44% of the U.S. market. The next largest category, representing approximately 35% of the U.S. market, is the occasional purchaser of cleaning and maintenance chemicals who sources products at retail establishments. The third type of end-user purchases cleaning and maintenance chemicals directly from a salesperson who represents the manufacturer. This portion of the market represents the remaining approximately 21% of the U.S. market and consists of end users seeking specific specialty chemicals from a highly trained, technical sales organization.
Our goal is to sell our products and services in each type of channel. Accordingly, we market our products and services in the following ways:
| • | Our distributor sales organization markets our products to large national and regional business-to-business distributors that target the industrial maintenance, janitorial/sanitation, and automotive markets. The customers using our distributor sales organization’s branded and private label products include W.W. Grainger Inc.; HD Supply; Lagasse, Inc.; Fastenal Company; TripleS; Am San; Toyota Motor Sales USA, Inc.; Nissan North America, Inc.; Subaru of America, Inc. and Kia Motors America, Inc. |
| • | Our retail sales organization markets our products to contractors, small business owners and homeowners through retailers such as home-improvement stores, hardware stores, discount stores and auto parts stores. We believe that we are the largest supplier of industrial-strength cleaning chemicals to The Home Depot, which is our largest single customer. |
| • | Through our sales and service organization, we provide convenient, highly effective cleaning and maintenance solutions to customers that include commercial, industrial, institutional and governmental end-users, ranging in size from small sole proprietorships to the United States federal government. Our sales and service organization maintains a particular focus on meeting the needs of customers in the transportation, food processing, industrial manufacturing, and food service industries. We provide value-added services to the customers of our sales and service organization on application uses, safety aspects, product selection, specific formulations, inventory management, customer employee training and equipment, including dispensers. We believe that the services we offer often reduce the total cost of our customers’ cleaning and maintenance needs. Accordingly, we believe that the customers of our direct sales organization benefit from a more effective solution that is superior to many of our competitors’ offerings. We are a leading U.S. provider of cleaning and maintenance solutions in the direct-sales channel. |
1
Table of Contents
Index to Financial Statements
A summary of our product offerings, our representative brands, including selected licensed brands, and the customers we serve through each of our sales organizations is provided in the following table:
| END MARKET |
PRODUCTS OFFERED |
BRANDS |
CUSTOMERS | |||
| Commercial, Industrial and Institutional Sales Channel: | ||||||
| Transportation •Vehicle Wash •Vehicle Maintenance |
Interior and exterior vehicle cleaning products and equipment, solvents, degreasers, parts washers, lubricants, and hand care products | •Zep, Selig •ArmorAll •Niagara |
Automotive repair facilities, car washes, car dealers, airlines and fixed base operators, public transport organizations, car rental facilities, truck-fleet operators, railroads, and construction companies | |||
| Food •Processing •Service |
Cleaners and sanitizers, kitchen cleaners, deodorizers, hand care products, and dispensing equipment | •Zep, Enforcer •Private label |
Farms, meat processing facilities, bakeries, grocery stores, and full and quick-serve restaurants | |||
| Industrial •Manufacturing •Construction |
Cleaners, degreasers, solvents, parts washers, lubricants, and hand care products | •Zep, Selig •Enforcer |
Professional maintenance and engineering staff in manufacturing, pharmaceutical, construction and mining industries | |||
| Government |
Cleaners, degreasers, floor care, hand care products, deodorizers, and dispensing equipment | •Zep, Selig |
Federal, state and local government agencies, including cities, school districts, military, and police and fire departments | |||
| Institutional •Hospitality •Healthcare |
Floor care, laundry systems, bathroom care, glass care, deodorizers, hand care products, and other janitorial products | •Zep, Selig •Enforcer |
Hotels, hospitals, convention centers and other facilities that use janitorial housekeeping products | |||
| Retail Sales Channel: | ||||||
| Small business owners, contractors, and homeowners | Cleaners, degreasers, floor care, bathroom care, glass care, drain care, pressure wash products, and pest control products | •Zep Commercial •Enforcer •RedMax Pro •Rubbermaid |
Home improvement and hardware stores | |||
| Vehicle do-it-yourselfers | Cleaners, degreasers, upholstery care, glass care, headlight care, pressure wash products and hand soap. | •Zep Commercial •Original Bike Spirits •Private label |
Auto parts stores | |||
| Farm and Stable |
Pest control and air care products for cattle and horse stables | •Country Vet •Enforcer |
Specialty feed and supply retailers | |||
2
Table of Contents
Index to Financial Statements
| Distribution Sales Channel: | ||||||
| Professional maintenance and engineering staff | Cleaners, degreasers, floor care, hand care products, deodorizers, lubricants, specialty chemical and dispensing equipment | •Zep Professional •Zep Commercial •Enforcer •Microbemax •Misty •TimeMist •i-Chem •TimeWick •Private label |
Large national business- to-business supply stores | |||
| Professional janitorial and sanitation staff | Floor care, laundry systems, bathroom care, glass care, deodorizers, hand care products, and other janitorial products | •Misty •Zep Professional •Zep Commercial •Microbemax •TimeMist •TimeWick •Enforcer •Private label |
Large national business- to-business supply stores | |||
| Automobile dealers |
Cleaners, degreasers, upholstery care, glass care, headlight care, pressure wash products, vehicle wash and hand soap | •Zep Professional •i-Chem •Next Dimension •OEM private brands |
Automobile manufacturers | |||
Our Strategy
Our strategy is to become a leading provider of innovative, environmentally sustainable cleaning and maintenance solutions for commercial and industrial end users. We seek to achieve financial performance in the top quartile of our peer group of companies, certain of which are listed within the description of our competitors that follows this section, by growing our share with existing and new customers and expanding our margins. To achieve this financial performance, we intend to
| • | Profitably grow the sales and service business; |
| • | Serve “pro” customers through a broad retail base; |
| • | Grow sales with new and existing distributors; |
| • | Build upon existing European capabilities; and |
| • | Expand through selected acquisitions. |
During the past three years, we streamlined our historical product offering by approximately 50%, allowing our direct sales organization to focus on its most profitable products; we reduced our branch network from 42 locations to the 17 locations we believe are the best positioned to serve our customers; and we reduced non-sales headcount by approximately 10%. These changes allowed us to increase our cash flows and to reduce our debt by 53% before we began pursuing acquisitive growth opportunities. More importantly, we have reduced the breakeven point of our direct-sales business by almost one-third.
During this period, we also augmented our direct-sales organization by adding experienced sales reps under a recruitment model designed to yield a faster return-on-investment than our historic model, and supplied our direct-sales organization with price optimization tools. We also grew our Zep Commercial and private branded product lines with both existing and new retail customers. During fiscal 2010, we entered into new relationships with Advance Auto Parts, Inc. and AutoZone, Inc.
3
Table of Contents
Index to Financial Statements
We began to implement our acquisition strategy in fiscal 2010. In January 2010, we acquired Amrep, Inc., a leader in maintenance chemicals for the automotive aftermarket as well as the janitorial market sold through distributors. In September 2010, we acquired certain assets and liabilities from Waterbury Companies, Inc., including certain air-care brands. These two acquisitions gave us a strong presence in the industrial distribution market, and strengthened our position in the retail market. The acquisition of Amrep also allowed us to consolidate further our manufacturing operations. In October 2010, we acquired the assets of Niagara National, LLC, which complements the strength of our direct-sales organization in the vehicle-wash market, specifically in the truck and fleet washing equipment markets.
Our Competition
The market for cleaning and maintenance chemicals and related services is highly competitive. Overall, competition is fragmented in the commercial, industrial, and institutional end-markets, with numerous local and regional operators selling directly to customers, distributors, and a few national competitors. Many of these competitors offer products in some, but not all, of the markets we serve. Competition is based primarily on brand name recognition, price, product quality, and customer service. Competitors in the commercial, industrial, and institutional end-market include but are not limited to Ecolab Inc., Diversey, Inc., Arch Chemicals, Inc., RPM International, Inc., NCH Corporation, Rochester Midland Corporation, The Claire Manufacturing Company, and State Chemical Manufacturing Company. Many companies compete within the broader retail market for cleaning chemical products, including but not limited to Church & Dwight Co., Inc., Procter and Gamble, WD-40 Company, Reckitt Benckiser plc, S.C. Johnson & Sons, Inc., Sunshine Makers, Inc., and The Clorox Company. We also compete in the home improvement channel with pest control companies such as Bayer, A.G., Spectrum Brands, Inc., and The Scott’s Company. Competitors in the automotive original equipment aftermarkets include Excelda Manufacturing, CRC Industries, Inc., Ashland Inc., and Technical Chemical Company. Furthermore, barriers to entry and expansion in the industry are low, which may lead to additional competitive pressure in the future. In the industrial and institutional direct-sales market channel, we believe we are one of the top four market leaders, which together hold slightly less than approximately 30% of the total market share.
Seasonality and Cyclicality
Our business exhibits some seasonality, with net sales being affected by weather and the annual budget cycles of major customers. Historically, due to this seasonality and the number of available selling days, the second half of our fiscal year is much stronger in terms of sales, earnings, and cash flow than the first half.
In addition, our net sales are dependent on economic conditions in the retail, wholesale and industrial markets. We believe that demand for our products generally correlates with GDP growth. Furthermore, we believe that demand for our products correlates positively to seasonally adjusted manufacturing employment, overall employment levels and, to some degree, new motor vehicle sales. Therefore, economic downturns generally have an adverse effect on our net sales and operating income. The adverse effect of downturns may be mitigated to some extent in health-driven, sophisticated markets, such as North America and Europe, by customer expectations and health and safety regulations that require increased frequency of use of cleaning products. Health and safety regulations are also shrinking the pool of available chemicals. Together, these trends are driving demand and development of improved product formulations and application methods.
Our Products
We produce a wide range of cleaning and maintenance solutions for commercial, industrial, institutional, and consumer customers. Our product portfolio includes anti-bacterial and industrial hand care products, cleaners, degreasers, deodorizers, disinfectants, floor finishes, sanitizers, pest- and weed-
4
Table of Contents
Index to Financial Statements
control products, air-care products and delivery systems and a wide variety of automotive maintenance chemicals. We currently have more than 4,000 unique formulations that are used in manufacturing products for our customers. We own or have licenses to use various domestic and foreign patents and trademarks related to our formulations and products, processes, and businesses. These intellectual property rights, particularly our trademarks and formulations relating to our products, are important to our business.
We employ a staff of chemists and technical support personnel who develop new products and support both our sales representatives and customers. We also license new products and technologies from third parties and engage others to assist with product development. As a result, we continually refresh our product portfolio and service offerings through the introduction of new products and formulations, the incorporation of proven technologies into new applications and the introduction of new services to meet the demands of the industry and our customers. The development of environmentally preferable products based on renewable and environmentally preferred raw materials is a principal focus of our product development efforts. We are expanding our GreenLink™ product line and introducing products for the automotive market under the EnviroEdge™ name. We recently launched the Provisions™ food service cleaning product line, which is composed of biodegradable detergents and cleansers ideally suited for the growing food segment.
Manufacturing
We manufacture our products at eight facilities located in the United States, Canada, the Netherlands and Italy. The five United States facilities produce approximately 90% of our manufactured product. Certain finished goods purchased from contract manufacturers and finished goods suppliers supplement the products that we manufacture. Sales of finished products manufactured for us by third party suppliers currently account for approximately 20% of our net sales volume. Outsourced product is predominately manufactured in the United States.
The key raw materials we use in our chemical products, which account for most of our revenue, are surfactants, polymers and resins, fragrances, water, solvents and other petroleum-based materials, and packaging materials. Many of the raw materials we use are petroleum-based and, therefore, are subject to the availability and price of oil or its derivatives. We purchase most chemical raw materials on the open market. Although we do not currently engage in any commodity hedging transactions for raw materials, we have committed and expect to continue to commit to purchase certain materials for specified periods of time. Furthermore, we constantly monitor and investigate alternative suppliers and materials based on numerous attributes including quality, service, and price. Accordingly, the cost of products sold may be affected by changes in the market price of raw materials or the sourcing of finished goods. Due to the mix of purchases (raw materials, components parts and finished goods), timing of price increases and other economic and competitive forces within the supply chain, it is not possible to determine the financial impact of future changes in the market price of these raw materials.
Products sold to commercial, industrial and institutional end-markets are shipped from approximately 20 strategically located branch warehouses throughout North America and Europe, which are supplied directly from our production facilities, and by one large distribution center in Atlanta, Georgia. Products sold to home improvement retailers are distributed nationwide from another facility located in Georgia. We also utilize warehouses maintained by third-party logistics companies in our distribution network. Our products are primarily delivered through common and local carriers.
Environmental Regulation
Our operations are regulated under a number of federal, state, local and foreign environmental, health and safety laws and regulations that govern, among other things, the discharge of hazardous materials
5
Table of Contents
Index to Financial Statements
into the air, soil and water as well as the use, handling, storage and disposal of these materials. These laws and regulations include the Clean Air Act, the Clean Water Act, the Resource Conservation and Recovery Act, and the Comprehensive Environmental Response, Compensation and Liability Act (“CERCLA”), as well as analogous state, local and foreign laws. Compliance with these environmental laws is a major consideration for us because we use hazardous materials in some of our manufacturing processes. In addition, because we are a generator of hazardous waste, we, along with any other person who disposes of or arranges for the disposal of our waste, may be subject to financial exposure for costs associated with an investigation and any remediation of sites at which we have disposed or arranged for the disposal of hazardous waste if those sites become contaminated, even if we fully complied with applicable environmental laws at the time of disposal. Furthermore, process wastewater from our manufacturing operations is discharged to various types of wastewater management systems. We may incur significant costs relating to contamination that may have been, or is currently being, caused by this practice. We are also subject to numerous federal, state, local and foreign laws that regulate the manufacture, storage, distribution and labeling of many of our products, including some of our disinfecting, sanitizing and antimicrobial products. Some of these laws require us to have operating permits for our production facilities, warehouse facilities and operations. We may not have some of these permits or some of the permits that we do have may not be current. In the event of a violation of these laws, we may be liable for damages and the costs of remedial actions and may also be subject to revocation, non-renewal or modification of our operating and discharge permits, and revocation of product registrations. Any revocation, non-renewal or modification may require us to cease or limit the manufacture and sale of products at one or more of our facilities and may have a material adverse effect on our business, financial condition, results of operations and cash flows. In addition, legislation or regulations restricting emissions of greenhouse gases and our need to comply with such legislation or regulations could affect our business, financial condition, results of operation or cash flows. Environmental laws may also become more stringent over time, which could increase our compliance costs.
The environmental regulations we believe are most significant to us are summarized below:
Toxic Substances
We are subject to various federal, state, local and foreign laws and regulations governing the production, transport and import of industrial chemicals. Notably, the Toxic Substances Control Act gives the U.S. Environmental Protection Agency (“EPA”), the authority to track, test and/or ban chemicals that may pose an environmental or human-health hazard. We are required to comply with certification, testing, labeling and transportation requirements associated with regulated chemicals. To date, compliance with these laws and regulations has not had a material adverse effect on our business, financial condition, results of operations or cash flows.
Pesticide Regulation
Some of our facilities are subject to various federal, state, local and foreign laws and regulations governing the manufacture and/or use of pesticides. We manufacture and sell certain disinfecting and sanitizing products that kill micro-organisms, such as bacteria, viruses and fungi. These products are considered “pesticides” or “antimicrobial pesticides” and, in the United States, are governed primarily by the Federal Insecticide, Fungicide and Rodenticide Act, as amended by the Food Quality Protection Act of 1996 (“FIFRA”). To register these products, we must meet various efficacy, toxicity and labeling requirements and must pay initial and ongoing registration fees. In addition, some states or foreign jurisdictions may impose taxes on sales of pesticides. Although the cost of maintaining and delays associated with pesticide registration have increased in recent years, compliance with the various laws and regulations governing the manufacture and sale of pesticides has not had a material adverse effect on our business, financial condition, results of operations or cash flows.
6
Table of Contents
Index to Financial Statements
Ingredient Regulation
Numerous federal, state, local and foreign laws and regulations relate to the sale of products containing ingredients that may impact human health and the environment. Specifically, the State of California has enacted Proposition 65, which requires us to disclose specified listed ingredient chemicals on the labels of our products. To date, compliance with these laws and regulations has not had a material adverse effect on our business, financial condition, results of operations or cash flows.
Other Environmental Regulation
Many of our facilities are subject to various federal, state, local or foreign laws and regulations governing the discharge, transportation, use, handling, storage and disposal of hazardous substances. In the United States, these statutes include the Clean Air Act, the Clean Water Act and the Resource Conservation and Recovery Act as well as analogous state laws. We are also subject to the Superfund Amendments and Reauthorization Act of 1986, including the Emergency Planning and Community Right-to-Know Act, which impose reporting requirements when toxic substances are released into the environment. In Europe, we are subject to portions of the compliance obligations under the EU European Community Directive “Registration, Evaluation, Authorization, and Restriction of Chemicals” (EU Directive No. 2006/1907). The directive imposes several requirements related to the identification and management of risks related to chemical substances manufactured or marketed in Europe. Our compliance obligations are mostly associated with the use of chemicals versus manufacture. Each year we make various capital investments and expenditures necessary to comply with applicable laws and regulations. To date, these investments and expenditures have not had a material adverse effect on our business, financial condition, results of operations or cash flows.
Environmental Remediation and Proceedings
We may be jointly and severally liable under CERCLA or its state, local or foreign equivalents for the costs of environmental contamination on or from our properties and at off-site locations where we disposed of or arranged for the disposal or treatment of hazardous waste. Generally, CERCLA imposes joint and several liability on each potentially responsible party (“PRP”) that actually contributed hazardous waste to a site. Customarily, PRPs will work with the EPA to agree on and implement a plan for site investigation and remediation. Based on our experience with these environmental proceedings and, our estimate of the contribution to be made by other PRPs with the financial ability to pay their shares, we believe that our share of the costs at these sites will not have a material adverse effect on our business, financial condition, results of operations or cash flows.
In addition to the liabilities imposed by CERCLA or its state, local or foreign equivalents, we may be liable for costs of investigation and remediation of environmental contamination on or from our current or former properties or at off-site locations under numerous other federal, state, local and foreign laws. Our operations involve the handling, transportation and use of numerous hazardous substances. We are aware that there is or may be soil or groundwater contamination at some of our facilities resulting from past or current operations and practices. Based on available information, we believe that the costs to investigate and remediate known contamination at these sites will not have a material adverse effect on our results of operations.
Environmental Permits and Licensing
In the ordinary course of our business, we are continually subject to environmental inspections and monitoring by governmental enforcement authorities. In addition, our production facilities, warehouse facilities and operations require operating permits that are subject to renewal, modification and, in specified circumstances, revocation. While we believe that we are currently in material compliance with existing permit and licensing requirements, we may not be in compliance with all permit or licensing
7
Table of Contents
Index to Financial Statements
requirements at some of our facilities. Based on available information, we believe that costs associated with any failure to satisfy our permit and licensing obligations will not have a material adverse effect on our business, financial condition, results of operations or cash flows.
Product Registration and Compliance
In addition to our pesticides, which are required to be registered in the U.S. pursuant to FIFRA and in other countries pursuant to comparable foreign regulations, various federal, state, local and foreign laws and regulations regulate some of our products and require us to register our products and to comply with specified requirements. In the United States, we must register our sanitizing and disinfecting products with the EPA. When we register these products, we must also submit to the EPA information regarding the chemistry, toxicology and efficacy for the agency’s review. Data must be consistent with the desired claims stated on the product label. In addition, each state where these products are sold requires registration and payment of a fee.
We are also subject to various federal, state, local and foreign laws and regulations that regulate products manufactured and sold by us for controlling microbial growth on humans, animals and processed foods. In the United States, these requirements are generally administered by the U.S. Food and Drug Administration, (“FDA”). The FDA regulates the manufacture and sale of food, drugs and cosmetics, which includes antibacterial soaps, hand sanitizers and products used in food preparation establishments. The FDA requires companies to register antibacterial hand-care products and imposes specific criteria that the products must meet in order to be marketed for these regulated uses. Before we are able to advertise our product as an antibacterial soap, a hand sanitizer or a food-related product, we must generate, and maintain in our possession, information about the product that is consistent with the appropriate FDA monograph. FDA monographs dictate the necessary requirements for various product types such as antimicrobial hand soaps. In addition, the FDA regulates the labeling of these products. If the FDA determines that any of our products do not meet its standards for an antibacterial product, we will not be able to market the product as an antibacterial product. Similar product registration regulations and compliance programs exist in many other countries where we operate. To date, the cost of complying with product registration and compliance has not had a material adverse effect on our business, financial condition, results of operations or cash flows.
Employees
As of August 31, 2010, we had approximately 2,350 employees, including 1,750 in the United States, 240 in Canada, and 360 in Europe. Of our approximately 2,350 employees, we estimate that 200 were members of five unions in the United States and Europe. Certain of our employees are covered by collective bargaining agreements, which renew periodically. The collective bargaining agreement covering certain employees at our manufacturing facility on Seaboard Industrial Boulevard as well as our primary distribution center in Atlanta, Georgia is scheduled for renewal in fiscal year 2011.
International Operations
See Note 12: Geographic Distribution of Operations of Notes to Consolidated and Combined Financial Statements for information regarding the geographic distribution of net sales, operating profit, and long-lived assets.
Information Concerning Zep Inc.
We were incorporated in 2007 under the laws of Delaware. We make our Annual Reports on Form 10-K, Quarterly Reports on Form 10-Q, Current Reports on Form 8-K (and all amendments to these reports), together with all reports filed pursuant to Section 16 of the Securities Exchange Act of 1934 by our officers, directors, and beneficial owners of 10% or more of our common stock, available free of charge through the “SEC Filings” link on our website, located at www.zepinc.com, as soon as reasonably
8
Table of Contents
Index to Financial Statements
practicable after they are filed with or furnished to the SEC. Information included on our website is not incorporated by reference into this Annual Report on Form 10-K. Our reports are also available at the Securities and Exchange Commission’s Public Reference Room at 100 F Street, NE, Washington, DC 20549 or on their website at www.sec.gov.
We have adopted a written Code of Ethics and Business Conduct that applies to all of our directors, officers, and employees, including its principal executive officer and senior financial officers. The Code of Ethics and Business Conduct and our Corporate Governance Guidelines are available free of charge through the “Corporate Governance” link on our website at www.zepinc.com. The charters for our Audit Committee, Compensation Committee and Nominating and Corporate Governance Committee, and the rules and procedures relating thereto, are also available free of charge through the “Corporate Governance” link on our website. Each of the Code of Ethics and Business Conduct, the Corporate Governance Guidelines, and the committee charters is available in print to any of our stockholders by written request. Such requests should be directed to the Corporate Secretary, Zep Inc., 1310 Seaboard Industrial Boulevard, Atlanta, Georgia 30318.
The following are important factors that could affect our business and our financial condition and results of operations. Such factors could also cause our actual results for future periods to differ materially from our expectations, including those expressed in any forward-looking statements contained in this Annual Report on Form 10-K. See the section entitled “Forward-Looking Statements”.
We may also refer to this disclosure to identify factors that may cause results to differ from those expressed in other forward-looking statements made in oral presentations, including conference calls and/ or webcasts open to the public.
Except as may be required under applicable law, we undertake no responsibility to update our Forward-Looking Statements.
Risks Related to our Business
Global economic conditions could continue to affect adversely our business and financial results.
Unfavorable economic conditions, and in particular, downturns that affect the transportation, food processing, food service, manufacturing, government and housekeeping markets, may negatively impact our business and financial results. The recent global recession, many aspects of which, such as high unemployment, are continuing, negatively impacted all of these markets. During downturns in economic conditions, we experience decreased demand for our products as many customers either defer purchases or purchase lower-cost products. Credit quality frequently declines during recessions, which reduces our ability to collect accounts receivable on a timely basis, or at all, from certain customers. Furthermore, the ability of certain suppliers to fill our orders for raw materials or other goods and services declined because of the diminished availability of credit. A prolonged recession, particularly one that affects the end-user markets listed above, could have a material adverse impact on our business, results of operations and financial condition, and our ability to make distributions to our stockholders.
Our results can be adversely affected by fluctuations in the cost or availability of materials used in our manufacturing processes.
The key raw materials we use in our chemical products are surfactants, polymers and resins, fragrances, water, solvents and other petroleum-based materials and packaging materials. Many of the raw materials that we use are energy dependent and, therefore, are subject to the availability and price of energy related inputs such as oil and natural gas. Furthermore, there are a limited number of suppliers
9
Table of Contents
Index to Financial Statements
for some of our raw materials. Competitive conditions, governmental restrictions, natural disasters and other events could limit the quantities of our raw materials that we are able to purchase. As a result, the price and availability of the raw materials we use may fluctuate substantially.
For example, we are currently experiencing difficulty obtaining D-limonene, a key component of our citrus-based cleaning products, because of frost damage to last year’s citrus crop. We have had to increase the price of our citrus-based cleaning products to reflect the increased cost of this raw material. The price increases may lessen demand for our citrus-based cleaning products. As another example, we also expect that the cost of ethanol, which is used in some of our products and which is increasing in importance as a transportation fuel, will soon increase substantially because corn production was insufficient to meet expected demand for the product.
We may not be able to increase the prices of our products to recover the increased cost of the raw materials we use. Significant increases in the prices of our raw materials could have a negative effect on demand for our products and on our operating margins. Furthermore, our ability to meet the demand for our products could be negatively impacted by shortages of our raw materials.
We do not currently engage in commodity hedging transactions for significant quantities of our raw materials. We attempt to manage fluctuations in the price and availability of our raw materials by entering into long-term supply agreements. We are not always able to enter into a supply agreement for certain raw materials. When we are able to do so, we face the risk that the price of the raw material covered by the contract may decline during the term of the supply agreement.
We face significant competition and may face more significant competition in the future.
Our industry is highly competitive. Our competition includes numerous local and regional operators selling directly to customers, numerous distributors and several national competitors. Many of our competitors are privately-held companies that have cost structures that are lower than ours or that have lower financial-return requirements than we have. Competition is based primarily on brand name recognition, price, product quality, and customer service. Our competitors in the commercial, industrial, and institutional end-market include but are not limited to Ecolab Inc., Diversey, Inc., Arch Chemicals, Inc., RPM International, Inc., NCH Corporation, Rochester Midland Corporation, The Claire Manufacturing Company, and State Chemical Manufacturing Company. Many companies compete within the broader retail market for cleaning chemical products, including but not limited to Church & Dwight Co., Inc., Procter and Gamble, WD-40 Company, Reckitt Benckiser plc, S.C. Johnson & Sons, Inc., Sunshine Makers, Inc., and The Clorox Company. We also compete in the home improvement channel with pest control companies such as Bayer, A.G., Spectrum Brands, Inc., and The Scott’s Company. Competitors in the automotive original equipment aftermarkets include Excelda Manufacturing, CRC Industries, Inc., Ashland Inc., and Technical Chemical Company. Furthermore, barriers to entry and expansion in the industry are low, which may lead to additional competitive pressure in the future. We cannot assure you that we will be able to continue to compete successfully against current or future competitors or that change in the source or intensity of competitive pressure in the industry will not result in reduced market share that could negatively impact our results of operations, financial condition, or cash flows.
We may be unable to sustain our significant customer relationships.
Our relationships with our largest customers depend on our ability to deliver high quality products and services. The loss of or substantial decrease in the volume of purchases by one or more of our largest customers could harm our sales and profitability. We have developed plans for reducing our cost structure if we were to lose one or more of our largest customers; however, we could not implement the actions contemplated by these plans immediately and we would incur substantial costs in doing so. The Home Depot is our largest single customer. It represented approximately 10%, 11%, and 10% of our
10
Table of Contents
Index to Financial Statements
total net sales during the fiscal years ended August 31, 2010, 2009, and 2008, respectively. Although we have been supplying products to The Home Depot for many years, we do not have a written contract obligating The Home Depot to purchase our products.
If we are unable to implement our growth strategy, the price of our common stock may be adversely affected.
Our strategy is to achieve profitable growth by, among other things, acquiring other product lines and businesses. Our ability to implement our growth strategy depends upon a variety of factors that are not within our control, including:
| • | our ability to make profitable acquisitions; |
| • | our ability to integrate acquired companies and facilities into our existing operations; and |
| • | the availability of capital. |
We compete for acquisition opportunities with companies that have significantly greater financial resources than we have. Therefore, we may be unable to complete an acquisition that we believe could be important to our growth strategy because one of our competitors may be willing to pay more for a potential acquisition candidate or may be able to use its financial resources to acquire a potential acquisition candidate before we are able to obtain financing.
The implementation of our growth strategy may place additional demands on our administrative, operational and financial resources and may increase the demands on our financial systems and controls. Our ability to manage our growth successfully may require us to continue to improve and expand these resources, systems and controls. If our management is unable to manage growth effectively, our operating results could be adversely affected. If we are unable to manage our growth, our financial condition and results of operations may be adversely affected.
Our growth strategy requires that we make expenditures in connection with the acquisition of other product lines and companies. We will be required to seek additional sources of financing as we pursue our growth strategy, which may include issuing debt or equity securities. We cannot predict the amount of our expenditures in connection with our growth strategy because opportunities for implementing our growth strategy arise unexpectedly. Our need for additional financing may place us at a disadvantage in competing for acquisitions. When a future acquisition opportunity arises, we will be required to evaluate the sources of financing, which may be limited on short notice, and the terms of the financing available at the time. Certain sources of financing may have a dilutive effect on shareholders existing equity positions. If we cannot find financing on acceptable terms, we may be unable to make the acquisition.
We are subject to a broad range of environmental, health, and safety laws and regulations in the jurisdictions in which we operate, and we may be exposed to substantial environmental, health, and safety costs and liabilities.
As noted above, our operations are regulated under a number of federal, state, local and foreign environmental, health and safety laws and regulations that govern, among other things, the manufacture, storage, distribution, sale and use of our products. Regulation of our products and operations continues to increase with more stringent standards, including evolving climate change standards, causing increased costs of operations and potential for liability if a violation occurs. The costs of complying with these laws and regulations, including participation in assessments and remediation of contaminated sites and installation of pollution control facilities, have been, and in the future could
11
Table of Contents
Index to Financial Statements
be, significant. In addition, these laws and regulations may also result in substantial environmental liabilities associated with divested assets, third party locations, and past activities. We have established reserves for environmental remediation activities and liabilities where appropriate. The cost of addressing environmental matters (including the timing of any charges related thereto), however, cannot be predicted with certainty. These reserves may not ultimately be adequate, especially in light of potential changes in environmental conditions, changing interpretations of laws and regulations by regulators and courts, the discovery of previously unknown environmental conditions, the risk of governmental orders to carry out additional compliance on certain sites not initially included in remediation in progress, our potential liability to remediate sites for which provisions have not previously been established and the adoption of more stringent environmental laws. Such future developments could result in increased environmental costs and liabilities and could require significant capital and other ongoing expenditures, any of which could have a material adverse effect on our financial condition or results of operations. Furthermore, the failure to comply with our obligations under the environmental laws and regulations could subject us to administrative, civil, or criminal penalties, obligations to pay damages or other costs, and injunctions or other orders, including orders to cease operations. In addition, the presence of environmental contamination at our properties could adversely affect our ability to sell property, receive full value for a property, use a property as collateral for a loan, or obtain or maintain financing.
We are currently a party to federal and state administrative proceedings arising under federal and state laws enacted for the protection of the environment where a state or federal agency or a private party alleges that hazardous substances generated by us have been discharged into the environment and a state or federal agency is requiring a cleanup of soil and/or groundwater pursuant to federal or state superfund laws. In each of these proceedings in which we have been named as a party that allegedly generated hazardous substances that were transported to a waste site owned and operated by another party, either (1) we are one of many other identified generators who have reached an agreement on the allocation of costs for cleanup among the various generators and our potential liability is not material; (2) we have been identified as a potential generator and the sites have been remediated by the EPA or by a state for a cost that is not material; or (3) other generators have cleaned up the site and have not pursued a claim against us and our liability, if any, would not be material.
We own and operate property located on Seaboard Industrial Boulevard in Atlanta, Georgia where we have been named as a potentially responsible party. We and the current and former owners of adjoining properties have agreed to share the expected costs and responsibilities of implementing a Corrective Action Plan, approved in 2004, under the Georgia Hazardous Site Response Act (“HSRA”) to periodically monitor property along a nearby stream for a period of five years, which ended in December 2009. Monitoring actions will continue until the Georgia Environmental Protection Division (the “EPD”) notifies the Company that such activities are no longer necessary. Further, we have executed a Consent Order with the EPD covering this remediation. On November 23, 2009, the EPD approved the Corrective Action Plan submitted by the Company to address the subsurface contamination north of Seaboard Industrial Boulevard. The Company continues to actively remediate subsurface contamination at this site in compliance with the approved Corrective Action Plan.
In May 2007, we accrued an undiscounted pre-tax liability of $5.0 million representing our best estimate of costs associated with subsurface remediation, primarily to remove contaminants from soil underlying one of our manufacturing facilities, and other related environmental issues. While over approximately the next twenty years Zep could expend an amount ranging up to $10.0 million on these efforts, management’s best estimate of remediation costs continues to be $5.0 million. To date, we have expended approximately $2.0 million of the $5.0 million reserve established in May 2007. Further sampling, engineering studies, and/or changes in regulatory requirements could cause us to revise the current estimate. We arrived at the current estimates on the basis of studies prepared by independent third party environmental consulting firms. The actual cost of remediation will vary depending upon the
12
Table of Contents
Index to Financial Statements
results of additional testing and geological studies, the success of initial remediation efforts in the first five years addressing the most significant areas of contamination, the rate at which site conditions may change, and the requirements of the EPD.
Amrep is currently a party to federal and state administrative proceedings arising under federal and state laws enacted for the protection of the environment where a state or federal agency or a private party alleges that hazardous substances generated by Amrep have been discharged into the environment and a state or federal agency is requiring a cleanup of soil and/or groundwater pursuant to federal or state superfund laws. In each of these proceedings in which Amrep has been named as a party that allegedly generated hazardous substances that were transported to a waste site owned and operated by another party, either (1) Amrep is one of many other identified generators who have reached an agreement on the allocation of costs for cleanup among the various generators and Amrep’s potential liability is not material, or (2) Amrep has been identified as a potential generator but has been indemnified by its waste broker and transporter.
Amrep’s primary manufacturing location in Marietta, Georgia is the only active site involving property which Amrep owns with respect to which Amrep has been named as a potentially responsible party. With regard to this location, Amrep is responsible for the expected costs of implementing an Amended Corrective Action Plan that was submitted in March 2009 under HSRA, the approval of which is still pending. The EPD is reviewing the Amended Corrective Action Plan and will determine whether additional actions are necessary and, if so, for what period of time.
As of August 31, 2010, the liabilities presented within Zep’s Consolidated Balance Sheets reflect an undiscounted, pre-tax liability of approximately $11.7 million, which represents Zep’s best estimate of costs associated with the aforementioned Amended Corrective Action Plan, primarily to remediate contaminants in soil and ground water underlying the Marietta manufacturing facility and affected adjacent properties, and other related environmental issues. While over approximately the next twenty years Zep could expend an amount ranging up to $18.0 million on these efforts, management’s best estimate of remaining remediation costs continues to be $11.7 million. Further sampling, engineering studies, and/or changes in regulatory requirements could cause revision to the current estimate. The initially recorded $12.0 million estimate was derived on the basis of studies prepared by independent third party environmental consulting firms. To date, we have expended approximately $0.3 million of the initial $12.0 million reserve established in December 2009. The actual cost of remediation will vary depending upon the results of additional testing and geological studies, the success of initial remediation designed to address the most significant areas of contamination, the rate at which site conditions may change, and the requirements of the EPD.
Additionally, Amrep previously conducted manufacturing operations at a property in Georgia that has since been sold. Pursuant to the terms of the sale, Amrep has retained environmental exposure that might arise from its previous use of this property. Management is preparing a plan to address the sub-surface contamination and, at this time, does not anticipate costs associated with future remediation efforts will be material. As of August 31, 2010, accruals associated with this effort totaled approximately $0.2 million. However, the actual cost of remediation could vary depending upon the results of additional testing and geological studies and the rate at which site conditions may change. Finally, management is preparing a plan to address the sub-surface contamination at a Texas manufacturing location owned by Amrep, and, at this time, does not anticipate the costs associated with future remediation efforts will be material. These estimates could change, however, based upon the response of the Texas Commission on Environmental Quality to that plan.
We use a variety of hazardous materials and chemicals in our manufacturing processes and in connection with maintenance work on our manufacturing facilities. Because of the nature of these substances or related residues, we may be liable for certain costs, including, among others, costs for
13
Table of Contents
Index to Financial Statements
health-related claims or removal or re-treatment of such substances. In addition, although we have developed environmental, health, and safety programs for our employees, including measures to protect our employees from exposure to hazardous substances, and conduct regular assessments at our facilities, we may be involved in claims and litigation filed on behalf of persons alleging injury as a result of occupational exposure to substances or other hazards at our current or former facilities. Due to the unpredictable nature of personal injury litigation, it is not possible to predict the ultimate outcome of any such claims or lawsuits that may arise. If any such claims and lawsuits, individually or in the aggregate, were resolved against us, our results of operations and cash flows could be adversely affected.
We may not properly execute, or realize anticipated benefits from, our ongoing strategic or other initiatives.
Our success is partly dependent upon properly executing, and realizing the anticipated benefits from, our ongoing strategic growth initiatives (a discussion of which is provided within Item 7. Management’s Discussion and Analysis of Financial Condition and Results of Operations), our information technology initiatives, and other initiatives. These initiatives are primarily designed to increase our revenue and market share and to make us more efficient in the sales, manufacture, and distribution of our products. These initiatives are complex; a failure to implement them properly may, in addition to not providing the anticipated benefits, result in an interruption to our sales, manufacturing, logistics, customer service, or accounting functions. Furthermore, we have invested a significant amount of capital into a number of these initiatives and will invest a significant amount of capital into others, which might have been more efficiently used if the anticipated benefits are not fully realized. Any of these results could have a material adverse effect on our business and results of operations, including the requirement to reduce the book value of certain assets that must be evaluated for impairment.
Our business could suffer in the event of a work stoppage or increased organized labor activity.
As of August 31, 2010, approximately 200 of our 2,350 employees were members of five unions in the United States and Europe. While we consider our relations with employees to be generally good, we cannot assure you that we will not experience work stoppages, strikes, or slowdowns in the future. In addition, we outsource to third parties the manufacturing of certain of our products that currently account for approximately 20% of our net sales volumes, and we cannot assure you that these third parties will not experience work stoppages, strikes or slowdowns in the future. A prolonged work stoppage, strike, or slowdown at any of our facilities or those of our third party suppliers could have a material adverse effect on our results of operations. Further, we cannot assure you that, upon expiration of any of our existing collective bargaining agreements, new agreements will be reached without union action or that any new agreement will be on terms satisfactory to us. Moreover, we cannot assure you that our non-union facilities will not become subject to labor union organizing efforts. If any current non-union facilities were to unionize, we would incur increased risk of work stoppages and possibly higher labor costs.
If we are unable to keep and protect our intellectual property rights, our ability to compete may be negatively impacted.
The market for our products depends to a significant extent upon the goodwill associated with our brand names. We own, or have licenses to use, all of the material trademark and trade name rights we use in connection with the packaging, marketing, and distribution of our major products both in the United States and in other countries where our products are principally sold. In addition, we possess trade secret product formulations and other product information, some of which are patented, which are competitively sensitive. Intellectual property protection is important to our business. Although most of our trademarks are registered in the United States and in the foreign countries in which we operate,
14
Table of Contents
Index to Financial Statements
we may not be successful in asserting trademark or trade name protection. In addition, the laws of some foreign countries may not protect our intellectual property rights to the same extent as the laws of the United States. The costs required to protect our intellectual property rights may be substantial.
We cannot be certain that we will be able to assert our intellectual property rights successfully in the future or that they will not be invalidated, circumvented, or challenged. Other parties may infringe on our intellectual property rights and may thereby dilute the value of our brand names in the marketplace. Any infringement of our intellectual property rights would also likely result in a diversion of our time and resources to protect these rights through litigation or otherwise. Others may claim that our business or products infringe on their intellectual property rights.
Recent California legislation, called the “Green Chemistry Initiative”, regulates products that contain chemicals deemed to exhibit a “hazard trait” such as carcinogenicity, toxicity or mutagenicity. As a result of this legislation, we may be required to disclose certain of our proprietary product formulations, the identity of the chemicals used in certain of our products and chemical and market data with respect to certain of our products to the California Department of Toxic Substance Control (the “DTSC”). We intend to request protective treatment for any proprietary confidential business information that we are required to disclose to DTSC. However, DTSC has the discretion to deny a claim of trade secret status. If it does so, we may lose trade-secret protection for the formulation. Loss of trade-secret protection for a product formulation could enable our competitors to duplicate the product. Our failure to protect our trademarks and trade names, or any adverse judgment with respect to infringement of others’ intellectual property rights, may have a material adverse effect on our business, financial condition, results of operations, and cash flows.
If our products are improperly manufactured, packaged, or labeled or become adulterated, we may need to recall those items and may experience product liability claims if consumers are injured.
If we improperly manufactured, packaged, or labeled our products or if they become adulterated, we may be required to recall the affected products. Our quality control procedures relating to the raw materials, including packaging, that we receive from third-party suppliers or our quality control procedures relating to our products after our products are formulated and packaged may not be sufficient. We have previously initiated product recalls, and widespread product recalls could result in significant losses due to the costs of a recall, the destruction of product inventory, and lost sales due to the unavailability of product for a period of time. We may also be liable if the use of any of our products causes injury, and could suffer losses from a significant product liability judgment against us. A significant product recall or product liability case could also result in adverse publicity, damage to our reputation, and a loss of consumer confidence in our products, which could have a material adverse effect on our business and financial results.
We have recorded a significant amount of goodwill and other identifiable intangible assets. We may be required to record non-cash charges for impairment of our goodwill and other identifiable intangible assets, if we do not achieve the anticipated benefits from the transactions that gave rise to the goodwill and other intangible assets.
We have recorded a significant amount of goodwill and other identifiable intangible assets, including customer relationships, trademarks and developed technologies. Goodwill and other net identifiable intangible assets were approximately $84.0 million as of August 31, 2010, or approximately 24.5% of our total assets. Goodwill, which represents the excess of cost over the fair value of the net assets of the businesses acquired, was approximately $53.8 million as of August 31, 2010, or 15.7% of our total assets.
Goodwill and net identifiable intangible assets are recorded at fair value on the date of acquisition and, in accordance with ASC 350, Intangibles—Goodwill and Other, will be reviewed at least annually for impairment. Impairment may result from, among other things, deterioration in our performance,
15
Table of Contents
Index to Financial Statements
adverse market conditions, adverse changes in applicable laws or regulations, including changes that restrict the activities of or affect the products and services sold by our business, and a variety of other factors. Some of the products and services we sell to our customers are dependent upon laws and regulations, and changes to such laws or regulations could impact the demand for our products and services. The amount of any quantified impairment must be expensed immediately as a non-cash charge to results of operations. Although we have never recorded impairment charges related to our intangible assets, it is possible, depending on future circumstances, that we may never realize the full value of our intangible assets. Any future determination of impairment of a significant portion of goodwill or other identifiable intangible assets would have an adverse effect on our results of operations.
Reliance on a third-party contract manufacturer may result in disruption to part of our business.
In connection with our recent acquisition of products from Waterbury Companies, Inc., we contracted with Waterbury for the manufacture of the acquired products for an extended transition period. We do not have direct control over the management or business of Waterbury, except indirectly through the terms of a transition services agreement. Should Waterbury not be able to fulfill its obligations to us under the transition services agreement, our business may be disrupted, which could have an adverse effect on our business, financial condition and results of operations.
Failure of the spin-off to qualify as a tax-free transaction could result in substantial liability.
Acuity Brands, Inc., our former parent corporation, received a private letter ruling from the Internal Revenue Service to the effect that, among other things, the spin-off (including certain related transactions) pursuant to which we became an independent, public company, qualifies as tax-free to Acuity Brands, us, and Acuity Brands stockholders for United States federal income tax purposes under Section 355 and related provisions of the Internal Revenue Code. Although a private letter ruling generally is binding on the Internal Revenue Service, if the factual assumptions or representations made in the private letter ruling request are untrue or incomplete in any material respect, then Acuity Brands will not be able to rely on the ruling. Moreover, the Internal Revenue Service will not rule on whether a distribution of shares satisfies certain requirements necessary to obtain tax-free treatment under Section 355 of the Internal Revenue Code. Rather, the private letter ruling is based upon representations by Acuity Brands that those requirements have been satisfied, and any inaccuracy in those representations could invalidate the ruling.
We received an opinion from King & Spalding LLP, then counsel to Acuity Brands and us, to the effect that, with respect to the requirements referred to above on which the Internal Revenue Service will not rule, those requirements will be satisfied. The opinion is based on, among other things, certain assumptions and representations as to factual matters made by Acuity Brands and us which, if untrue or incomplete in any material respect, could jeopardize the conclusions reached by counsel in its opinion. The opinion is not binding on the Internal Revenue Service or the courts, and the Internal Revenue Service or the courts may not agree with the opinion.
If the spin-off failed to qualify for tax-free treatment, a substantial corporate tax would be payable by Acuity Brands, measured by the difference between (1) the aggregate fair market value of the shares of our common stock on the date of the spin-off and (2) Acuity Brands’ adjusted tax basis in the shares of our common stock on the date of the spin-off. The corporate level tax would be payable by Acuity Brands. However, we have agreed under certain circumstances to indemnify Acuity Brands for this tax liability. This indemnification obligation, if triggered, could have a material adverse effect on our results of operations and financial position. In addition, under the applicable Treasury regulations, each member of Acuity Brands’ consolidated group at the time of the spin-off (including us) is severally liable for such tax liability.
16
Table of Contents
Index to Financial Statements
Even if the spin-off otherwise qualifies as tax-free, Acuity Brands nevertheless could incur a substantial corporate tax liability under Section 355(e) of the Internal Revenue Code, if 50 percent or more of our stock or the stock of Acuity Brands were to be acquired as part of a “plan (or a series of related transactions)” that includes the distribution. For this purpose, any acquisitions of the stock of Acuity Brands or of our stock that occur within two years before or after the spin-off are presumed to be part of such a plan, although Acuity Brands may be able to rebut that presumption. If such an acquisition of the stock of Acuity Brands or of our stock triggers the application of Section 355(e), Acuity Brands would recognize taxable gain as described above, but the spin-off would generally remain tax-free to the Acuity Brands stockholders. If acquisitions of our stock trigger the application of Section 355(e), we would be obligated to indemnify Acuity Brands for the resulting corporate-level tax liability. This indemnification obligation would have a material adverse effect on our results of operations and financial position.
Risks Related to our Common Stock
The market price for our common stock may be volatile, and you may not be able to sell our stock at a favorable price.
Our common stock is traded on the New York Stock Exchange. The market price of our common stock has in the recent past been, and may in the future be, highly volatile and subject to wide fluctuations. This volatility may occur for many reasons, including for reasons unrelated to our performance, such as reports by industry analysts, investor perceptions, or negative announcements by our customers, competitors, or suppliers regarding their own performance, as well as general economic and industry conditions. Additional factors that could cause the market price of our common stock to rise and fall include, but are not limited to, the following:
| • | variations in our quarterly results; |
| • | announcements of technological innovations by us or by our competitors; |
| • | introductions of new products or services or new pricing policies by us or by our competitors; |
| • | acquisitions or strategic alliances by us or by our competitors; |
| • | recruitment or departure of key personnel or key groups of personnel; |
| • | the gain or loss of significant orders; |
| • | the gain or loss of significant customers; |
| • | the disruption of supply and/or price of key raw materials; |
| • | significant changes in regulatory requirements; |
| • | increased litigation resulting from product or employee claims; |
| • | adverse developments concerning environmental matters; |
| • | changes in the estimates of our operating performance or changes in recommendations by any securities analysts that elect to follow our stock; |
| • | market conditions in our industry, the industries of our customers, and the economy as a whole; and |
| • | the dilution of our earnings per share caused by our acquisition of another company or product line or because of our issuance of additional shares of our common stock or shares of a series of preferred stock or debt securities that are convertible into shares of our common stock. |
17
Table of Contents
Index to Financial Statements
Certain provisions of our certificate of incorporation, bylaws and rights plan may discourage takeovers.
Our certificate of incorporation and bylaws contain certain anti-takeover provisions that may make more difficult or expensive or that may discourage a tender offer, change in control or takeover attempt that is opposed by our Board of Directors. In particular, our certificate of incorporation and bylaws:
| • | classify our Board of Directors into three groups, so that stockholders elect only one-third of the Board each year; |
| • | permit stockholders to remove directors only for cause and only by the affirmative vote of at least 80% of our voting shares; |
| • | permit a special stockholders’ meeting to be called only by a majority of the Board of Directors; |
| • | do not permit stockholders to take action except at an annual or special meeting of stockholders; |
| • | require stockholders to give us advance notice to nominate candidates for election to our Board of Directors or to make stockholder proposals at a stockholders’ meeting; |
| • | permit our Board of Directors to issue, without stockholder approval, preferred stock with such terms as the Board may determine; |
| • | require the vote of the holders of at least 80% of our voting shares for stockholder amendments to our bylaws; and |
| • | require, for the approval of a business combination with stockholders owning 5% or more of our voting shares, the vote of at least 50% of our voting shares not owned by such stockholder, unless certain “fair price” requirements are met or the business combination is approved by our continuing directors. |
The preferred stock purchase rights attached to our shares of common stock, in effect, prevent a person or group from acquiring more than 15% of the total number of shares of our common stock outstanding at any time without obtaining prior approval from our Board of Directors, to be granted at the Board’s sole discretion. In addition, Delaware law generally restricts mergers and other business combinations between us and any holder of 15% or more of our common stock, unless the transaction or the 15% acquisition is approved in advance by our Board of Directors.
These provisions of our certificate of incorporation and bylaws, Delaware law, and the preferred stock purchase rights could discourage potential acquisition proposals and could delay or prevent a change in control of our company, even though a majority of our stockholders may consider such proposals, if effected, desirable. Such provisions could also make it more difficult for third parties to remove and replace the members of our Board of Directors. Moreover, these provisions could diminish the opportunities for stockholders to participate in certain tender offers, including tender offers at prices above the then-current market value of our common stock, and may also inhibit increases in the trading price of our common stock that could result from takeover attempts or speculation.
Item 1B. Unresolved Staff Comments
None.
Our corporate office and our primary manufacturing facilities are owned by us and located in the metropolitan Atlanta, Georgia, area. We also have manufacturing facilities located at two additional sites
18
Table of Contents
Index to Financial Statements
in Georgia and in Texas, Canada, Italy and the Netherlands. We own six of our eight manufacturing facilities. The facilities in Italy and Canada are leased. Additionally, we own branch and storage facilities in Massachusetts, Illinois and Washington. We lease sales offices and storage facilities throughout North America and Europe. Our facilities, which are adequate for our current needs, are in good operating condition.
Legal Proceedings
We are subject to various legal claims arising in the normal course of business. We are self-insured up to specified limits for certain types of claims, including product liability, and are fully self-insured for certain other types of claims, including environmental, product recall, and patent infringement. Based on information currently available, it is the opinion of management that the ultimate resolution of pending and threatened legal proceedings will not have a material adverse effect on our results of operations, financial position, or cash flows. However, in the event of unexpected future developments, it is possible that the ultimate resolution of such matters, if unfavorable, could have a material adverse effect on our results of operations, financial position, or cash flows in future periods. We establish reserves for legal claims when the costs associated with the claims become probable and can be reasonably estimated. The actual costs of resolving legal claims may be substantially higher or lower than the amounts reserved for such claims. However, we cannot make a meaningful estimate of actual costs to be incurred that could possibly be higher or lower than the amounts reserved.
Item 4. [Removed and Reserved]
19
Table of Contents
Index to Financial Statements
PART II
Item 5. Market for Registrant’s Common Equity, Related Stockholder Matters, and Issuer Purchases of Equity Securities
Our common stock is traded on the New York Stock Exchange under the symbol “ZEP”. There were 3,661 stockholders of record as of November 5, 2010. This figure does not include an estimate of the indeterminate number of beneficial holders whose shares may be held of record by brokerage firms and clearing agencies. The following table sets forth the New York Stock Exchange high and low sale prices and the dividend payments for our common stock for the periods indicated.
| Price per Share | Dividends Per Share |
|||||||||||
| High | Low | |||||||||||
| 2010 |
||||||||||||
| First Quarter |
$ | 19.05 | $ | 14.76 | $ | 0.04 | ||||||
| Second Quarter |
$ | 24.10 | $ | 16.12 | $ | 0.04 | ||||||
| Third Quarter |
$ | 24.37 | $ | 15.83 | $ | 0.04 | ||||||
| Fourth Quarter |
$ | 20.59 | $ | 16.36 | $ | 0.04 | ||||||
| 2009 |
||||||||||||
| First Quarter |
$ | 21.80 | $ | 13.58 | $ | 0.04 | ||||||
| Second Quarter |
$ | 21.00 | $ | 7.62 | $ | 0.04 | ||||||
| Third Quarter |
$ | 14.40 | $ | 6.63 | $ | 0.04 | ||||||
| Fourth Quarter |
$ | 17.99 | $ | 11.13 | $ | 0.04 | ||||||
We began making dividend payments, at an annual rate of $0.16 per share, in the second quarter of fiscal 2008. Our Board of Directors evaluates our dividend policy periodically, taking into consideration the composition of our stockholder base; our financial condition, earnings and funding requirements; our growth prospects; applicable law; and any other factors our Board of Directors deems, in its discretion, relevant. Our Board of Directors believes that it is in the best interests of our stockholders to continue paying dividends and has no present intention to change the annual dividend rate. On October 6, 2010, our Board of Directors declared a quarterly dividend of $0.04 per share.
Our ability to fund a regular quarterly dividend is impacted by our financial results and the availability of surplus funds. All dividends are paid out of current year earnings. Delaware law prohibits the payment of dividends or otherwise distributing funds to our stockholders absent a legally available surplus. There can be no assurance that we will continue to pay quarterly dividends at this level or at all in the future.
20
Table of Contents
Index to Financial Statements
Stockholder Return Performance Graph
The following Performance Graph and related information shall not be deemed “soliciting material” or to be “filed” with the Securities and Exchange Commission, nor shall such information be incorporated by reference into any future filing under the Securities Act of 1933 or Securities Exchange Act of 1934, each as amended, except to the extent that we specifically incorporate such information by reference into such filing.
The following graph compares the change in cumulative total stockholders’ return on our common stock with (a) the S&P Smallcap 600 Index and (b) the Russell 2000 Index, each for the period from November 1, 2007 (the date our stock first traded other than on a when-issued basis) through August 31, 2010. The graph assumes an initial investment of $100 at the closing price on November 1, 2007 and assumes all dividends were reinvested. We have presented the Russell 2000 Index, in lieu of an industry index or peer group, because we believe there is no published index or peer group that adequately compares to our business. Except for the initial measurement date (November 1, 2007), the figures for the chart and graph set forth below have been calculated based on the closing prices on the last trading day on the New York Stock Exchange for each period indicated.
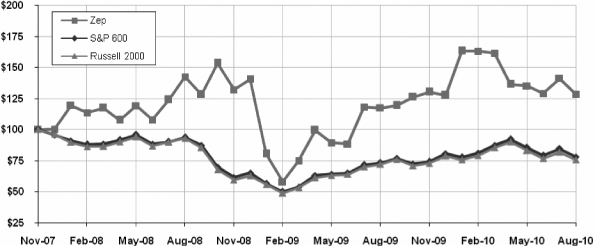
| Nov 2007 |
Feb 2008 |
May 2008 |
Aug 2008 |
Nov 2008 |
Feb 2009 |
May 2009 |
Aug 2009 |
Nov 2009 |
Feb 2010 |
May 2010 |
Aug 2010 |
|||||||||||||||||||||||||||||||||||||
| Zep Inc. |
100.00 | 113.63 | 119.16 | 142.50 | 131.99 | 57.86 | 89.28 | 117.52 | 130.33 | 163.13 | 135.29 | 128.38 | ||||||||||||||||||||||||||||||||||||
| S&P 600 |
100.00 | 88.01 | 95.66 | 93.73 | 61.41 | 49.84 | 64.10 | 73.13 | 74.20 | 80.99 | 85.50 | 77.98 | ||||||||||||||||||||||||||||||||||||
| Russell 2000 |
100.00 | 86.29 | 94.10 | 93.00 | 59.50 | 48.92 | 63.08 | 71.94 | 72.91 | 79.05 | 83.20 | 75.71 | ||||||||||||||||||||||||||||||||||||
21
Table of Contents
Index to Financial Statements
Item 6. Selected Financial Data
The following table sets forth our selected financial data, which have been derived from our Consolidated and Combined Financial Statements for each of the five years in the period ended August 31, 2010. We were a wholly owned subsidiary of Acuity Brands, Inc. during all periods presented prior to November 1, 2007 in the below listed tabular disclosure. The information set forth below should be read in conjunction with Management’s Discussion and Analysis of Financial Condition and Results of Operations and the Consolidated and Combined Financial Statements and the notes related to those financial statements included elsewhere in this report. Operating expenses included within our historical income statements that were incurred prior to November 1, 2007 reflect direct expenses of our business together with allocations of certain Acuity Brands corporate expenses that have been charged to us based on usage or other methodologies appropriate for allocating such expenses. In our opinion, these assumptions and allocations have been made on a reasonable and appropriate basis under the circumstances. Our combined financial information (for periods preceding our spin-off from Acuity Brands, Inc.) may not be indicative of our future performance and does not necessarily reflect what our financial condition and results of operations would have been had we operated as a separate, stand-alone entity during all the periods presented, as many changes have occurred and will continue to occur in our operations and capitalization as a result of our spin-off from Acuity Brands.
| Years Ended August 31, | ||||||||||||||||||||
| 2010 | 2009 | 2008 | 2007 | 2006 | ||||||||||||||||
| (In thousands, except per share amounts) | ||||||||||||||||||||
| Summary of Operations Data: |
||||||||||||||||||||
| Net sales |
$ | 568,512 | $ | 501,032 | $ | 574,724 | $ | 565,886 | $ | 552,084 | ||||||||||
| Operating profit |
23,852 | 18,089 | 29,063 | 29,649 | 40,049 | |||||||||||||||
| Net income |
13,504 | 9,260 | 16,322 | 14,083 | 21,275 | |||||||||||||||
| Basic earnings per share |
$ | 0.62 | $ | 0.43 | $ | 0.76 | $ | 0.68 | $ | 1.02 | ||||||||||
| Diluted earnings per share |
$ | 0.61 | $ | 0.42 | $ | 0.75 | $ | 0.68 | $ | 1.02 | ||||||||||
| Cash dividends declared per common share |
$ | 0.16 | $ | 0.16 | $ | 0.12 | $ | — | $ | — | ||||||||||
| Basic weighted average number of shares outstanding(1) |
21,271 | 21,057 | 20,862 | 20,811 | 20,811 | |||||||||||||||
| Diluted weighted average number of shares outstanding(1) |
21,738 | 21,290 | 21,252 | 20,811 | 20,811 | |||||||||||||||
| Balance Sheet Data (at period end): |
||||||||||||||||||||
| Cash and cash equivalents |
$ | 25,257 | $ | 16,651 | $ | 14,528 | $ | 9,142 | $ | 8,128 | ||||||||||
| Total assets |
342,848 | 249,618 | 274,071 | 249,473 | 248,373 | |||||||||||||||
| Total debt |
92,150 | 40,650 | 59,150 | 75,000 | 75,000 | |||||||||||||||
| Stockholders’ equity |
122,173 | 109,265 | 99,717 | 74,834 | 81,048 | |||||||||||||||
| Other Data: |
||||||||||||||||||||
| Cash provided by operations |
$ | 34,023 | $ | 30,438 | $ | 26,435 | $ | 30,931 | $ | 28,479 | ||||||||||
| Operating working capital(2) |
$ | 92,629 | $ | 83,616 | $ | 103,763 | $ | 101,357 | $ | 101,013 | ||||||||||
| (1) | On October 31, 2007, the separation from Acuity Brands was completed in a tax-free distribution to its stockholders of one share of our common stock for every two shares of Acuity Brands’ common stock held as of the record date. Prior to this date, all of our outstanding shares were owned by Acuity Brands. Accordingly, for periods prior to October 31, 2007, basic and diluted earnings per share have been computed using the number of shares of our common stock outstanding on October 31, 2007, the date on which our common stock was distributed by Acuity Brands to its stockholders. |
On September 1, 2009, we retrospectively adopted an accounting pronouncement which provides that unvested share-based payment awards that contain nonforfeitable rights to dividends or dividend equivalents are participating securities and should be included in the computation of earnings per share. The application of this guidance to each of the basic and diluted earnings per share computations for the two years ended August 31, 2010 effectively reduced those computations by $0.01. Due to the number of unvested shares issued during fiscal year 2008 in connection with our previously disclosed one-time founders’ award, the application of this guidance to each of the basic and diluted earnings per share computations for the year ended August 31, 2008 effectively reduced those computations by $0.02. We did not pay dividends prior to our October 31, 2007 spin-off, nor did we have control over the equity award programs previously administered by our former parent company, whose compensation philosophy may have differed from that reflected in our currently administered equity award programs. Therefore, it is not practicable to retrospectively apply this guidance before we became a stand-alone, public entity. However, we believe that retrospective application of this guidance would not have had an impact on basic and diluted earnings per share as we did not pay dividends during those periods.
| (2) | Operating working capital is defined as the sum of accounts receivable and inventory less accounts payable. |
22
Table of Contents
Index to Financial Statements
Item 7. Management’s Discussion and Analysis of Financial Condition and Results of Operations
The following discussion should be read in conjunction with Item 1A. Risk Factors, Item 6. Selected Financial Data, Item 8. Financial Statements and Supplementary Data, including the notes thereto, and the other financial information included elsewhere in this Annual Report on Form 10-K. Please see “Cautionary Statement Regarding Forward-Looking Information” for a discussion of the uncertainties, risks and assumptions associated with these statements.
Overview
Company
We are a leading provider of cleaning and maintenance chemicals and related products and services for commercial, industrial, institutional and consumer applications, which we market under well recognized brand names, some of which have been in existence since we were founded in 1937. Our product portfolio, which is currently produced using more than 4,000 unique formulations, includes anti-bacterial and industrial hand care products, cleaners, degreasers, deodorizers, disinfectants, floor finishes, sanitizers, pest- and weed-control products, air-care products and delivery systems and a wide variety of automotive maintenance chemicals. We sell our products through a sales and service organization, to consumers primarily through home improvement stores, and to national and regional business-to-business distributors that target the industrial maintenance, janitorial/sanitation, and automotive markets. We are a leading U.S. provider of cleaning and maintenance solutions in the direct-sales channel. Furthermore, as the result of recent acquisitions, we have established a strong presence in the industrial distribution market.
Acquisition of Amrep, Inc.
On January 4, 2010, we acquired Amrep, Inc. a specialty chemical formulator and packager focused in the automotive, fleet maintenance, industrial/MRO supply, institutional supply, and motorcycle markets. Amrep was acquired for approximately $63.5 million. Amrep’s products are marketed under the recognized and established brand names such as Misty®, Next Dimension™, Petro®, and i-Chem®. We believe the acquisition of Amrep to be an important strategic step in our efforts to utilize distribution to expand our presence in a number of end markets while minimizing channel conflict through the manufacture of both private branded products and national brands. Integration efforts associated with the Amrep acquisition are well underway, and we remain optimistic about the synergies afforded by the transaction. Borrowings made under our credit facilities were utilized to finance the $63.5 million purchase price of Amrep, Inc. The acquisition of Amrep, Inc. did not result in new reporting segments. See Note 3 of Notes to Consolidated and Combined Financial Statements for more information regarding this acquisition. Subsequent to August 31, 2010, we executed two acquisitions, which are discussed in Note 13 of Notes to Consolidated and Combined Financial Statements. None of our acquisition activities have impacted our compliance with our debt covenants, nor have these activities affected management’s belief that we will be able to meet the liquidity needs of our business over the next 12 months.
Our separation from Acuity Brands, Inc.
We were spun-off from Acuity Brands effective October 31, 2007 through a distribution of 100% of our common stock to Acuity Brands’ stockholders. The stock dividend of one share of our common stock for every two shares of Acuity Brands’ common stock was distributed (the “Distribution”) on a pro rata basis to holders of record of Acuity Brands’ common stock at the close of business on October 17, 2007, which was the record date for the Distribution. Following the Distribution, Acuity Brands no longer held any of our shares as we became an independent public company after the spin-off. In conjunction with
23
Table of Contents
Index to Financial Statements
the separation of businesses, we and Acuity Brands entered into various agreements that address the allocation of assets and liabilities between us and that define our relationship after the separation. Our common stock is listed on the New York Stock Exchange under the ticker symbol “ZEP.”
Basis of Presentation
We prepare our Consolidated and Combined Financial Statements, which present our financial position, results of operations, and cash flows, in accordance with U.S. generally accepted accounting principles. The financial statements and other financial information in this Form 10-K related to periods on or after the Distribution date of October 31, 2007 are presented on a consolidated basis and include our accounts and those of our majority-owned subsidiaries.
The financial statements and related financial information pertaining to periods preceding the Distribution date of October 31, 2007 are presented on a combined basis and reflect the results of those entities that were ultimately transferred to us as part of the spin-off. These periods include either all or a portion of fiscal years 2006 through 2008 as presented in Item 6. Selected Financial Data and Item 8. Financial Statements and Supplementary Data. Prior to the spin-off, certain functions, including treasury, tax, executive and employee benefits, financial reporting, risk management, legal, corporate secretary and investor relations, were historically managed by our former parent corporation. The assets, liabilities and expenses related to the support of these centralized corporate functions were allocated to us on a specific identification basis to the extent possible. Otherwise, allocations related to these services were primarily based upon an estimate of the proportion of corporate amounts applicable to us given our contribution to our consolidated parent company’s revenues and employee base. Allocation ratios derived from these contribution factors are similar in amount and remained consistent throughout the historical periods presented. Examples of expenses that were allocated in accordance with these proportional estimates include charges related to accounting and legal services undertaken to ensure the consolidated parent company’s compliance with various regulatory requirements as well as the salaries of certain corporate officers and employees.
In the opinion of management, the assumptions and allocations were made on a reasonable and appropriate basis under the circumstances. Management believes that amounts allocated to Zep reflect a reasonable representation of the types of costs that would have been incurred if we had performed these functions as a stand-alone company. However, as estimation is inherent within the allocation process, these combined financial statements do not include all of the actual amounts that would have been incurred had we been a stand-alone entity during the periods presented. The combined financial statements reflect an allocation of debt and related interest expense, as further described in Note 5 to the Notes to Consolidated and Combined Financial Statements.
Strategy
Our strategy is to become a leading provider of innovative, environmentally sustainable cleaning and maintenance solutions for commercial and industrial end users. We seek to achieve financial performance in the top quartile of our peer group of companies by growing our share with existing and new customers and expanding our margins. To achieve this financial performance, we intend to
| • | Profitably grow the sales and service business; |
| • | Serve “pro” customers through a broad retail base; |
| • | Grow sales with new and existing distributors; |
| • | Build upon existing European capabilities; and |
| • | Expand through selected acquisitions. |
24
Table of Contents
Index to Financial Statements
During the past three years, we streamlined our historical product offering by approximately 50%; we reduced our branch network from 42 locations to 17 locations; we reduced non-sales headcount by approximately 10%; and we reduced the breakeven point of our sales and service sales organization by almost one-third. These changes allowed us to increase our cash flows and to reduce our debt by 53% before we began pursuing acquisitive growth opportunities. We began to implement our acquisition strategy in fiscal 2010 with the January 2010 acquisition of Amrep, Inc., a leader in maintenance chemicals for the automotive aftermarket as well as the janitorial market sold through distributors. In September 2010, we acquired certain assets and liabilities from Waterbury Companies, Inc., including certain air-care brands. These two acquisitions gave us a strong presence in the industrial distribution market and strengthened our position in the retail market. The acquisition of Amrep also allowed us to consolidate further our manufacturing operations. In October 2010, we acquired the assets of Niagara National, LLC, which complements the strength of our direct-sales organization in the vehicle-wash market, specifically in the truck and fleet washing equipment markets.
Liquidity and Capital Resources
The following table sets forth certain indicators of our consolidated financial condition and liquidity as of the end of the fiscal years shown (in thousands):
| 2010 | 2009 | 2008 | ||||||||||
| Cash and cash equivalents |
$ | 25,257 | $ | 16,651 | $ | 14,528 | ||||||
| Operating working capital |
92,629 | 83,616 | 103,763 | |||||||||
| Total debt and capital lease obligations |
92,150 | 40,650 | 59,150 | |||||||||
| Stockholders’ equity |
122,173 | 109,265 | 99,717 | |||||||||
| Total debt to stockholders’ equity |
75 | % | 37 | % | 59 | % | ||||||
We have three principal sources of near-term liquidity: (1) existing cash and cash equivalents; (2) cash generated by operations; and (3) available borrowing capacity under our five-year senior, secured credit facility (the “2010 Credit Facility”), which provides for a maximum borrowing capacity of $320 million. We also have $7.2 million of industrial revenue bonds that are due in 2018. Our industrial revenue bonds were issued by the City of DeSoto Industrial Development Authority, Inc. in May 1991 in connection with the construction of Zep’s facility in DeSoto, Texas. We have issued outstanding letters of credit totaling $11.5 million primarily for the purpose of providing credit support for our industrial revenue bonds, securing collateral requirements under our casualty insurance programs as well as supporting certain environmental obligations. These letters of credit were issued under the 2010 Credit Facility as of August 31, 2010, thereby reducing the total availability under the facility by such amount. As of August 31, 2010, we had $25.3 million in cash and cash equivalents and approximately $220 million available under the 2010 Credit Facility. The increase of Operating working capital, Total debt and capital lease obligations, and Total debt to equity during fiscal year 2010 reflects acquisition activity discussed throughout this section. We believe that our liquidity and capital resources are sufficient to meet our working capital, capital expenditure and other anticipated cash requirements, excluding acquisitions, over the next twelve months. In addition, during January 2010, the Securities and Exchange Commission declared our shelf registration statement effective. The shelf registration statement registers the issuance of up to an aggregate of $200 million of equity, debt, and certain other types of securities through one or more future offerings. The net proceeds from the sale of any securities to be registered thereunder may be used for general corporate purposes, which may include funding capital expenditures, pursuing growth initiatives, whether through acquisitions, joint ventures or otherwise, repaying or refinancing indebtedness or other obligations, and financing working capital.
Cash Flow
We use available cash and cash flow provided by operating activities primarily to fund operations, capital expenditures and dividend payments to stockholders. Net cash flow provided by operating
25
Table of Contents
Index to Financial Statements
activities for the years ended August 31, 2010 and 2009 was $34.0 million and $30.4 million, respectively. Cash flow provided by operating activities during the year ended August 31, 2010, which improved 11.8% from the prior year, was driven in part by the $13.5 million of net income generated during fiscal year 2010. Additionally, operating working capital (calculated by adding accounts receivable, plus inventories, and subtracting accounts payable) provided $5.5 million of cash during the twelve months ended August 31, 2010. As of August 31, 2010, operating working capital included in our Consolidated Balance Sheets attributable to the acquisition of Amrep, Inc. totaled $16.1 million. The $4.7 million source of cash reflected in the Accrued compensation and other current liabilities line item of our cash flow statement reflects compensation-related costs including administrative salaries and bonuses as well as the net increase of restructuring-related severance accruals. Current year restructuring actions are discussed further in Note 9 of Notes to Consolidated and Combined Financial Statements.
The majority of the share-based compensation expense generated through the administration of our share-based award programs does not affect our overall cash position. Accordingly, Net Cash Provided by Operating Activities includes approximately $4.4 million of share-based expense, which is reflected as Other non-cash charges within our Consolidated and Combined Statements of Cash Flows.
We paid cash dividends on our common stock of $3.5 million, or $0.16 per share, during the twelve months ended August 31, 2010. On October 6, 2010, our Board of Directors declared a quarterly dividend of $0.04 per share payable on November 1, 2010 to stockholders of record as of October 19, 2010. Our ability to generate positive cash flows from operating activities directly affects our ability to make dividend payments. Also, restrictions under the instruments governing our indebtedness could impair our ability to make such payments. Payments on our indebtedness and the quarterly dividends are expected to account for the majority of our financing activities as they pertain to normal operations.
Net cash flow provided by operating activities for the years ended August 31, 2009 and 2008 was $30.4 million and $26.4 million, respectively. Cash flow provided by operating activities during the year ended August 31, 2009, which improved 15.1% from the prior year, was driven in part by the $9.3 million of net income generated during fiscal year 2009. Additionally, operating working capital decreased $20.1 million to $83.6 million at August 31, 2009 from $103.8 million in the prior year. Operating working capital levels declined due to lower sales that resulted from deteriorating macro-economic conditions as well as more efficient management of the components of operating working capital. The $7.9 million use of cash reflected in the Accrued compensation and other current liabilities line item of our cash flow statement was primarily due to the decrease in compensation-related costs including administrative salaries and bonuses as well as the payment of restructuring-related accruals established during fiscal year 2008. Also impacting fiscal year 2009 operating cash flow was the decrease in costs related to certain of our insurance programs
Management believes that investing in assets and programs that will over time increase the overall return on our invested capital is a key factor in driving stockholder value. We invested $9.8 million and $7.5 million in fiscal year 2010 and 2009, respectively, primarily to effect facility consolidations, reduce our cost structure, enhance information technology, invest in equipment at customer facilities, and improve our manufacturing capabilities. We continue to invest in these items primarily to improve productivity and product quality, increase manufacturing efficiencies, and enhance customer service capabilities. We expect to invest approximately $10.0 million to $12.0 million in fiscal year 2011 for machinery, equipment, and information technology expected to maintain and enhance our operations, and future financial performance.
26
Table of Contents
Index to Financial Statements
Contractual Obligations
The following table summarizes our contractual obligations at August 31, 2010:
| Payments Due by Period | ||||||||||||||||||||
| Total | Less than One Year |
1 to 3 Years |
4 to 5 Years |
After 5 Years |
||||||||||||||||
| Long-Term Debt(1) |
$ | 92,150 | $ | 17,500 | $ | 18,750 | $ | 48,750 | $ | 7,150 | ||||||||||
| Interest Obligations(2) |
21,043 | 4,231 | 8,972 | 7,636 | 204 | |||||||||||||||
| Operating Leases(3) |
30,651 | 7,708 | 11,635 | 7,925 | 3,383 | |||||||||||||||
| Purchase Obligations(4) |
18,419 | 18,419 | — | — | — | |||||||||||||||
| Other Long-term Liabilities(5) |
6,903 | 2,144 | 949 | 1,289 | 2,521 | |||||||||||||||
| Total(6) |
$ | 169,166 | $ | 50,002 | $ | 40,306 | $ | 65,600 | $ | 13,258 | ||||||||||
| (1) | These amounts (which represent outstanding debt at August 31, 2010) are included in our Consolidated Balance Sheets. The current versus long-term presentation of our outstanding debt within these statements reflects our intent and ability to refinance certain amounts of outstanding debt that are otherwise contractually due within one year. Further detail regarding our debt instruments is provided in the preceding Liquidity and Capital Resources section as well as in Note 5 of Notes to Consolidated and Combined Financial Statements. |
| (2) | These amounts represent expected future interest payments on debt that are contractually due within one year but that we anticipate will remain outstanding for longer periods given current market conditions as well as our ability and intent to refinance certain borrowings made under our credit agreement. Also included in these expected future interest payments are estimates of interest expense related to our $7.2 million industrial revenue bonds that neither mature nor are expected to be repaid before 2018. |
| (3) | Our operating lease obligations are described in Note 8 of Notes to Consolidated and Combined Financial Statements. |
| (4) | Purchase obligations include commitments to purchase goods or services that specify all significant terms. This amount is primarily composed of purchase orders that were open as of August 31, 2010. |
| (5) | These amounts are included in our Consolidated Balance Sheets and largely represent liabilities on which we are obligated to make future payments pursuant to certain deferred compensation programs addressed within Note 7 of Notes to Consolidated and Combined Financial Statements. Estimates of the value and timing of these amounts are based on various assumptions, including interest rates and other variables. |
| (6) | At August 31, 2010, our liability recorded for uncertain tax positions, including associated interest and penalties, was approximately $1.2 million. Since the ultimate amount and timing of other potential audit related cash settlements cannot be predicted with reasonable certainty, liabilities for uncertain tax positions are excluded from the contractual obligations table above. See further discussion in Note 10 of Notes to Consolidated and Combined Financial Statements. |
Results of Operations
Fiscal Year 2010 Compared with Fiscal Year 2009
The following table sets forth information comparing the components of net income for the year ended August 31, 2010 with the year ended August 31, 2009. Both dollar and percentage changes included within the tables below were calculated from our Consolidated and Combined Statements of Income:
| (Dollars in millions) | Years Ended August 31, |
Percent Change |
||||||||||
| 2010 | 2009 | |||||||||||
| Net Sales |
$ | 568.5 | $ | 501.0 | 13.5 | % | ||||||
| Gross Profit |
283.2 | 264.5 | 7.1 | % | ||||||||
| Percent of net sales |
49.8 | % | 52.8 | % | ||||||||
| Operating Profit |
23.9 | 18.1 | 31.9 | % | ||||||||
| Percent of net sales |
4.2 | % | 3.6 | % | ||||||||
| Income before Provision for Taxes |
21.7 | 15.2 | 43.0 | % | ||||||||
| Percent of net sales |
3.8 | % | 3.0 | % | ||||||||
| Net Income |
$ | 13.5 | $ | 9.3 | 45.8 | % | ||||||
27
Table of Contents
Index to Financial Statements
Net Sales
Net sales were $568.5 million for the year ended August 31, 2010, compared with $501.0 million generated in the prior fiscal year, representing an increase of $67.5 million or 13.5%. Revenues generated from the Amrep acquisition, which was completed in January 2010, comprised $76.7 million of our sales in fiscal year 2010. Amrep sales grew $6.7 million in fiscal year 2010 from the same prior year eight month period. In total, volume in fiscal year 2010 grew $55.4 million. Excluding acquisition-related revenues, in fiscal year 2010 we experienced volume related sales declines of $21.3 million. While we achieved year-over-year volume growth in sales to customers accessed through the retail channel, we experienced softness in demand within the majority of our institutional and industrial end markets. Management believes these markets, which include transportation, food processing and service, industrial manufacturing and government, are strongly correlated to seasonally-adjusted manufacturing employment, overall employment levels and, to some degree, new motor vehicle sales. Furthermore, our sales and service sales organization focuses on small businesses, which continue to suffer the effects of the economic downturn. Favorable foreign currency translation on international sales and the realization of higher selling prices made necessary by rising raw material costs impacted total net sales by $7.6 million and $4.5 million, for the years ended August 31, 2010 and 2009, respectively. During the first quarter of fiscal year 2010, we renegotiated the terms of our contract with our licensee in France. We believe the terms of the new contract are favorable to us. Separately, we executed a release agreement with our licensee in France that addressed historical business transactions. We received a one-time, $1.1 million payment pursuant to this release agreement, all of which was recognized in net sales during the first quarter of fiscal year 2010.
Gross Profit
| (Dollars in millions) | Years Ended August 31, |
Increase (Decrease) |
Percent Change |
|||||||||||||
| 2010 | 2009 | |||||||||||||||
| Net Sales |
$ | 568.5 | $ | 501.0 | $ | 67.5 | 13.5 | % | ||||||||
| Cost of Products Sold |
285.3 | 236.5 | 48.8 | 20.6 | % | |||||||||||
| Percent of net sales |
50.2 | % | 47.2 | % | ||||||||||||
| Gross Profit |
$ | 283.2 | $ | 264.5 | $ | 18.7 | 7.1 | % | ||||||||
| Percent of net sales |
49.8 | % | 52.8 | % | ||||||||||||
Gross profit increased $18.7 million, or 7.1% to $283.2 million in fiscal year 2010 compared with $264.5 million in the prior fiscal year. Gross profit margin of 49.8% in fiscal year 2010 decreased approximately 300 basis points from that of the prior fiscal year. The Amrep acquisition significantly altered our margin structure due to the increased percentage of product sold into the lower gross profit margin distribution and retail channels. The basis of Amrep’s acquired finished goods inventory was increased by $0.9 million in accordance with purchase accounting rules. This one-time markup of acquired inventory impacted our Cost of Products Sold during our second and third fiscal year 2010 quarters. During the fourth quarter of fiscal year 2010, we consolidated certain manufacturing functions among our Atlanta, Georgia and Dallas, Texas area facilities. Approximately $0.4 million of inventory value was either written down or written off in accordance with these fiscal year 2010 restructuring efforts.
Raw material pricing experienced upward pressure during the second half of our fiscal year 2010. The cost of certain commodities, such as D-Limonene, an ingredient that is integral to citrus-based cleaners, continues to increase due to supply shortages. We have announced price increases and we continue to evaluate new raw material suppliers to mitigate the impact of rising raw material costs. Also, fluctuation of foreign currencies relative to the U.S. dollar increased gross margin in fiscal year 2010 by approximately $4.0 million.
28
Table of Contents
Index to Financial Statements
Operating Profit
| (Dollars in millions) | Years Ended August 31, |
Increase (Decrease) |
Percent Change |
|||||||||||||
| 2010 | 2009 | |||||||||||||||
| Gross Profit |
$ | 283.2 | $ | 264.5 | $ | 18.7 | 7.1 | % | ||||||||
| Percent of net sales |
49.8 | % | 52.8 | % | ||||||||||||
| Selling, Distribution, and Administrative Expenses |
$ | 247.8 | $ | 243.0 | $ | 4.8 | 2.0 | % | ||||||||
| Restructuring Charges |
8.2 | 3.4 | 4.8 | 140 | % | |||||||||||
| Acquisition Costs |
3.4 | — | 3.4 | 100 | % | |||||||||||
| Operating Profit |
$ | 23.9 | $ | 18.1 | $ | 5.8 | 31.9 | % | ||||||||
| Percent of net sales |
4.2 | % | 3.6 | % | ||||||||||||
In fiscal year 2010, our selling, distribution, and administrative (“SD&A”) expenses as a percentage of net sales improved 500 basis points from the prior year. This favorable result is due to the inclusion of Amrep and its impact on our overall cost structure as well as the success of previously enacted restructuring initiatives undertaken to reduce the breakeven point of the business. We have been able to use our reduced cost structure to further invest in sales and marketing resources, as well as to reinstitute benefit programs and to fund employee incentive programs designed to reward performance.
We recorded restructuring charges totaling $8.2 million during fiscal year 2010 and are substantially complete with the three-year restructuring plan that was commenced shortly after we became a stand-alone public company in November 2007. In fiscal year 2010, we consolidated several branch locations within our distribution network. As noted above, during the three months ended August 31, 2010, we continued to integrate manufacturing capabilities. We put Amrep’s Lancaster, Texas property on the market, as manufacturing activities at that location have been transferred to other facilities. We recorded an impairment charge in connection with these consolidation activities that totaled $1.6 million in the fourth quarter of fiscal year 2010 to state fixed assets at fair value, which is included in the aforementioned $8.2 million fiscal year 2010 restructuring charge total. Non-sales headcount was reduced in connection with these activities along with other opportunities to improve productivity. We recorded restructuring charges of $3.4 million during the prior fiscal year. Further detail regarding our restructuring initiatives is provided within Notes 9 and 11 of Notes to Consolidated and Combined Financial Statements.
After streamlining our core operations and lowering our breakeven point, we began executing our acquisition growth initiatives during fiscal year 2010. Since January 2010, we have completed three acquisitions. The first was Amrep, which was immediately accretive to earnings, expanded our access to the retail and distributor channels, and provided significant private label capabilities. In September 2010, we acquired or assumed certain brands, assets, and liabilities of Waterbury Companies, Inc., which are expected to enhance Amrep’s leading position as a provider of air care delivery systems and products for facilities maintenance. Our third acquisition was completed in October 2010, and while much smaller than the first two, was of the assets of Niagara National, LLC, which complements our strength in vehicle wash, specifically in the truck and fleet washing equipment markets. Acquisition costs incurred in support of these transactions totaled $3.4 million during fiscal year 2010.
Operating profit increased $5.8 million, or 31.9%, in the year ended August 31, 2010 to $23.9 million from $18.1 million reported in fiscal year 2009. Operating margins generated during fiscal year 2010 were 4.2% compared with 3.6% in the prior year.
29
Table of Contents
Index to Financial Statements
Income before Provision for Taxes
| (Dollars in millions) | Years Ended August 31, |
Increase (Decrease) |
Percent Change |
|||||||||||||
| 2010 | 2009 | |||||||||||||||
| Operating Profit |
$ | 23.9 | $ | 18.1 | $ | 5.8 | 31.9 | % | ||||||||
| Percent of net sales |
4.2 | % | 3.6 | % | ||||||||||||
| Other Expense (Income) |
||||||||||||||||
| Interest expense, net |
$ | 2.0 | $ | 1.7 | $ | 0.3 | 18.4 | % | ||||||||
| Accelerated debt issuance cost on debt extinguishment |
0.4 | — | 0.4 | 100 | % | |||||||||||
| Miscellaneous expense (income), net |
(0.2 | ) | 1.3 | (1.5 | ) | (119 | )% | |||||||||
| Total Other Expense (Income) |
2.1 | 2.9 | (0.8 | ) | (26.3 | )% | ||||||||||
| Income before Provision for Taxes |
$ | 21.7 | $ | 15.2 | $ | 6.5 | 43.0 | % | ||||||||
| Percent of net sales |
3.8 | % | 3.0 | % | ||||||||||||
Total other expense remained consistent with that of the prior year and is composed primarily of interest expense associated with our outstanding debt obligations. On July 15, 2010, we entered into a $320 million five-year senior, secured credit facility. Our previous $100 million revolving credit facility and $40 million receivables security agreement were extinguished on that date, at which time $0.4 million of previously deferred financing costs were written off. Zep recorded a $1.2 million loss on transactions denominated in foreign currencies during fiscal year 2009, which is reflected above in Miscellaneous expense (income), net.
Provision for Taxes and Net Income
| (Dollars in millions) | Years Ended August 31, |
Increase (Decrease) |
Percent Change |
|||||||||||||
| 2010 | 2009 | |||||||||||||||
| Income before Provision for Taxes |
$ | 21.7 | $ | 15.2 | $ | 6.5 | 43.0 | % | ||||||||
| Percent of net sales |
3.8 | % | 3.0 | % | ||||||||||||
| Provision for Income Taxes |
$ | 8.2 | $ | 5.9 | $ | 2.3 | 38.5 | % | ||||||||
| Effective tax rate |
37.8 | % | 39.0 | % | ||||||||||||
| Net Income |
$ | 13.5 | $ | 9.3 | $ | 4.2 | 45.8 | % | ||||||||
Net income for the year ended August 31, 2010 increased $4.2 million, or 45.8%, to $13.5 million from $9.3 million reported in the prior fiscal year. The effective tax rate for fiscal years 2010 and 2009 was 37.8% and 39.0%, respectively. The year-over-year decrease in our effective tax rate is due to the mix of income across domestic and foreign jurisdictions, and the favorable outcome of a routine IRS audit of our fiscal year 2008. These factors more than offset the negative effect of permanent differences arising from the above mentioned acquisition costs. Our effective tax rate is anticipated to range between 37.5% and 38.5% in fiscal year 2011.
Diluted earnings per share generated in fiscal year 2010 totaled $0.61, representing an increase of $0.19 per diluted share from the $0.42 per diluted share earned in the prior year. Earnings in fiscal year 2010 were negatively impacted by $0.37 per diluted share due as a result of restructuring charges and costs related to our acquisitions. Earnings in fiscal year 2009 were negatively impacted by $0.10 per diluted share due to restructuring charges.
30
Table of Contents
Index to Financial Statements
Fiscal Year 2009 Compared with Fiscal Year 2008
The following table sets forth information comparing the components of net income for the year ended August 31, 2009 with the year ended August 31, 2008. Both dollar and percentage changes included within the tables below were calculated from our Consolidated and Combined Statements of Income:
| (Dollars in millions) | Years Ended August 31, |
Percent Change |
||||||||||
| 2009 | 2008 | |||||||||||
| Net Sales |
$ | 501.0 | $ | 574.7 | (12.8 | )% | ||||||
| Gross Profit |
264.5 | 323.2 | (18.2 | )% | ||||||||
| Percent of net sales |
52.8 | % | 56.2 | % | ||||||||
| Operating Profit |
18.1 | 29.1 | (37.8 | )% | ||||||||
| Percent of net sales |
3.6 | % | 5.1 | % | ||||||||
| Income before Provision for Taxes |
15.2 | 26.0 | (41.6 | )% | ||||||||
| Percent of net sales |
3.0 | % | 4.5 | % | ||||||||
| Net Income |
$ | 9.3 | $ | 16.3 | (43.3 | )% | ||||||
Net Sales
Net sales were $501.0 million for the year ended August 31, 2009 compared with $574.7 million generated in the prior fiscal year, representing a decrease of $73.7 million or 12.8%. Weakening demand in each of our markets resulted in volume-related sales declines of $76.1 million. Domestic unit volume was adversely impacted as we operated our North American core business with reduced direct sales force capacity. In addition to normal attrition, the reduction in selling capacity was attributable to modifications in sales force hiring practices and stricter enforcement of sales performance standards designed to increase productivity and set the stage for growth consistent with our strategic plans. Also, we experienced a decline in demand from the retail marketplace as well as from transportation and food related customers. Unfavorable foreign currency translation on international sales negatively impacted total net sales by an additional $16.0 million. These declines were partially offset by the realization of higher selling prices totaling approximately $18.4 million, primarily within our domestic markets.
Gross Profit
| (Dollars in millions) | Years Ended August 31, |
Increase (Decrease) |
Percent Change |
|||||||||||||
| 2009 | 2008 | |||||||||||||||
| Net Sales |
$ | 501.0 | $ | 574.7 | $ | (73.7 | ) | (12.8 | )% | |||||||
| Cost of Products Sold |
236.5 | 251.5 | (15.0 | ) | (6.0 | )% | ||||||||||
| Percent of net sales |
47.2 | % | 43.8 | % | ||||||||||||
| Gross Profit |
$ | 264.5 | $ | 323.2 | $ | (58.7 | ) | (18.2 | )% | |||||||
| Percent of net sales |
52.8 | % | 56.2 | % | ||||||||||||
Gross profit decreased $58.7 million, or 18.2%, to $264.5 million in fiscal year 2009 compared with $323.2 million in the prior fiscal year, which included a $1.2 million charge recorded during May 2008 to establish a reserve for inventory that was discontinued during that period. Declining sales volume coupled with higher raw material costs continued to place downward pressure on gross profit during fiscal year 2009. Gross profit margin of 52.8% in fiscal year 2009 decreased approximately 3.4% from that of the prior fiscal year. On a comparative year-to-date basis, raw material costs increased approximately $18.3 million. Our ability to capture higher selling prices offset these higher raw material costs. The impact of channel and product sales mix was responsible for approximately 80 basis points of the year’s decline in gross profit margin. Also, we significantly lowered finished goods inventories throughout
31
Table of Contents
Index to Financial Statements
fiscal year 2009. Lower inventory levels resulted in reduced manufacturing absorption, which adversely impacted gross profit margins by approximately 40 basis points. Additionally, fluctuation of foreign currencies relative to the U.S. dollar adversely impacted gross profit in fiscal year 2009 by approximately $8.9 million.
Operating Profit
| (Dollars in millions) | Years Ended August 31, |
Increase (Decrease) |
Percent Change |
|||||||||||||
| 2009 | 2008 | |||||||||||||||
| Gross Profit |
$ | 264.5 | $ | 323.2 | $ | (58.7 | ) | (18.2 | )% | |||||||
| Percent of net sales |
52.8 | % | 56.2 | % | ||||||||||||
| Selling, Distribution, and Administrative Expenses |
$ | 243.0 | $ | 285.6 | $ | (42.6 | ) | (14.9 | )% | |||||||
| Restructuring Charges |
3.4 | 8.5 | (5.1 | ) | (59.9 | )% | ||||||||||
| Operating Profit |
$ | 18.1 | $ | 29.1 | $ | (11.0 | ) | (37.8 | )% | |||||||
| Percent of net sales |
3.6 | % | 5.1 | % | ||||||||||||
Operating profit decreased $11.0 million, or 37.8%, in the year ended August 31, 2009 to $18.1 million from $29.1 million reported in fiscal year 2008. Operating margins generated during fiscal year 2009 were 3.6% compared with 5.1% in the prior year.
We reduced selling, distribution, and administrative expenses (“SD&A”) by an aggregate of $42.6 million during fiscal year 2009. The decline in net sales resulted in reduced variable selling costs of approximately $28.8 million. Such costs include commissions paid to sales representatives as well as customer freight. We incurred approximately $10.7 million less in expenses attributable to compensation-related costs including administrative salaries and bonuses. Our operating results benefited by approximately $3.8 million from the disciplined control of certain sales support costs. Also, we implemented an enterprise-wide cost containment initiative during the year resulting in savings separate from those mentioned above of approximately $5.8 million. This initiative focused upon reducing a variety of administrative expenses including, but not limited to, those pertaining to facility costs, telecommunications, travel, and consulting. Partially offsetting these cost reductions were $3.6 million in charges necessary to reflect the collection risk in the current economic environment associated with certain accounts receivable and $1.6 million in increased legal-related costs due primarily to the enforcement of our non-compete arrangements.
Operating profit during the year ended August 31, 2009 was adversely affected by charges recorded for restructuring and other special items totaling $3.4 million. During fiscal year 2009, we recorded a restructuring charge of $2.0 million pertaining to employee severance costs. Also, we continued with our facility consolidation initiatives and recorded restructuring charges in the second and fourth quarters of fiscal year 2009 totaling $1.4 million related to facility lease termination and consolidation costs. Operating profit during the year ended August 31, 2008 was adversely affected by charges recorded for restructuring and other special items totaling $10.0 million, of which approximately $1.5 million is included in cost of goods sold. Those charges were composed of severance related costs of $5.2 million, facility lease contract termination costs of approximately $3.3 million, and inventory discontinuance costs of $1.5 million.
32
Table of Contents
Index to Financial Statements
Income before Provision for Taxes
| (Dollars in millions) | Years Ended August 31, |
Increase (Decrease) |
Percent Change |
|||||||||||||
| 2009 | 2008 | |||||||||||||||
| Operating Profit |
$ | 18.1 | $ | 29.1 | $ | (11.0 | ) | (37.8 | )% | |||||||
| Percent of net sales |
3.6 | % | 5.1 | % | ||||||||||||
| Other Expense (Income) |
||||||||||||||||
| Interest expense, net |
$ | 1.7 | $ | 2.8 | $ | (1.2 | ) | (41.9 | )% | |||||||
| Miscellaneous expense (income), net |
$ | 1.3 | $ | 0.3 | $ | 1.0 | 454 | % | ||||||||
| Total Other Expense (Income) |
2.9 | 3.1 | (0.2 | ) | (5.4 | )% | ||||||||||
| Income before Provision for Taxes |
$ | 15.2 | $ | 26.0 | $ | (10.8 | ) | (41.6 | )% | |||||||
| Percent of net sales |
3.0 | % | 4.5 | % | ||||||||||||
Other expense remained consistent with that of the prior year and is composed primarily of losses on transactions denominated in foreign currencies and interest expense associated with our outstanding debt obligations. The loss on foreign currency transactions was offset by a reduction in interest expense attributable to lower comparable interest rates and net borrowings.
Provision for Taxes and Net Income
| (Dollars in millions) | Years Ended August 31, |
Increase (Decrease) |
Percent Change |
|||||||||||||
| 2009 | 2008 | |||||||||||||||
| Income before Provision for Taxes |
$ | 15.2 | $ | 26.0 | $ | (10.8 | ) | (41.6 | )% | |||||||
| Percent of net sales |
3.0 | % | 4.5 | % | ||||||||||||
| Provision for Income Taxes |
5.9 | 9.7 | (3.7 | ) | (38.7 | )% | ||||||||||
| Effective tax rate |
39.0 | % | 37.2 | % | ||||||||||||
| Net Income |
$ | 9.3 | $ | 16.3 | $ | (7.1 | ) | (43.3 | )% | |||||||
Net income for the year ended August 31, 2009 decreased $7.1 million, or 43.3%, to $9.3 million from $16.3 million reported in the prior fiscal year. The decrease in net income resulted primarily from the above noted decrease in operating profit. The effective tax rate for fiscal years 2009 and 2008 was 39.0% and 37.2%, respectively. The year-over-year increase in our effective tax rate is due primarily to the impact of permanent items and lower utilization of tax credits in various jurisdictions in fiscal year 2009.
Diluted earnings per share generated in fiscal year 2009 totaled $0.43, representing a decline of $0.34 per diluted share from the $0.77 per diluted share earned in the prior year. Earnings in fiscal year 2009 were negatively impacted by $0.10 per diluted share due as a result of restructuring charges. Earnings in fiscal year 2008 were negatively impacted by $0.30 per diluted share due to restructuring charges.
Outlook
During fiscal 2011, we intend to take one or more of the following actions in pursuit of our strategic goals:
| • | We intend to profitably grow the revenue of our sales and service organization by expanding the number of sales representatives focused on our key strategic verticals where the customers value the training and experience of our dedicated sales force. We will continue to invest in tools and training to further enhance the effectiveness of the sales organization; we will also develop new products and new marketing initiatives for targeted strategic end-markets; |
33
Table of Contents
Index to Financial Statements
| • | We seek to diversify our business with retailers by utilizing a variety of owned and private label brands focused on the “pro” buyer; |
| • | We will expand our business in the distribution channel by offering industrial and specialty distributors a variety of owned and private label brands focusing on the category management strategies of the distributors. We will leverage the recently acquired assets and brands to further penetrate this channel; |
| • | We will improve and then expand our international operations leveraging the strengths of the Italian organization by more fully integrating our western European operations and look at acquisition opportunities to expand in other areas of Europe; and |
| • | We intend to grow through profitable, strategic acquisitions to expand our access to market and utilize the strength of our formulations and industry knowledge to accelerate our growth. |
We are committed to transforming the business into a dynamic, market-driven enterprise that delivers superior products and customer service. Importantly, we believe we have made substantial improvements to our cost structure. In the near term, we will continue to invest in the business, organically as well as acquisitively, while leveraging our improved cost structure.
We believe that the success of our strategy in creating shareholder value will be measured by the following long-term financial objectives:
| • | Revenue growth in excess of market growth rates; |
| • | Annualized EBITDA margin improvement of 50 basis points; |
| • | Annualized earnings per share increases of 11 – 13%; and |
| • | Returns on invested capital of greater than 15%. |
These financial objectives are long term in nature and are expressed in terms of annualized improvement. We have previously stated that in the early phases of our transformation, we would likely experience inconsistency in meeting these objectives, and that we expect our financial results to fluctuate over time as we implement our strategy. Our progress towards these objectives was delayed by the deep and prolonged economic recession that began in December 2007 and worsened throughout the majority of our 2008 and 2009 fiscal years. However, as discussed in the previous sections, we made significant improvements to the business during the past three years, and we remain committed to achieving our previously stated long-term financial objectives.
We face potential execution risk with respect to accomplishing our strategic initiatives. We believe we are operating in a new economic reality following the recent, broad economic downturn, and the full impact on our customers is not yet known. While economists have declared an end to the recession, its effects are widely predicted to be felt for many months to come. Management believes markets reached through its sales rep organization, which include transportation, food, industrial manufacturing, and government, are strongly correlated to seasonally-adjusted manufacturing employment, overall employment levels and, to some degree, new motor vehicle sales. Sales into this channel are expected to remain soft for the foreseeable future, and we intend to continue managing the business in a way that is not predicated upon a near-term recovery. However, as volume growth returns, we expect to realize significant financial leverage due to our efforts to improve productivity and streamline the business.
Volatility in the commodities markets could have a negative impact on margins and volumes. Further, while we believe we have substantially completed the restructuring of our legacy operations, we may incur some costs during fiscal 2011 as we finalize our three-year plan to simplify our core. All this notwithstanding, we remain encouraged and believe the improvements to our cost structure should
34
Table of Contents
Index to Financial Statements
enable improvement in future EBITDA margins. We will continue to aggressively pursue each of the components of our strategic plan, and are committed to delivering long-term value to our shareholders as measured by our aforementioned, long-term financial objectives.
Recently Adopted Accounting Standards
In June 2009, the Financial Accounting Standards Board (“FASB”) issued guidance that established a single source of authoritative U.S. GAAP recognized by the FASB to be applied by nongovernmental entities. SEC rules and interpretive releases are also sources of authoritative GAAP for SEC registrants. This guidance modifies the GAAP hierarchy to include only two levels of GAAP: authoritative and nonauthoritative, and is effective for financial statements issued for fiscal years ending after September 15, 2009 and interim periods within those fiscal years, and therefore became effective for us September 1, 2009. The adoption of this pronouncement did not impact our results of operations or financial condition.
In June 2008, the FASB issued authoritative guidance which provides that unvested share-based payment awards that contain nonforfeitable rights to dividends or dividend equivalents (whether paid or unpaid) are participating securities and shall be included in the computation of earnings per share pursuant to the two-class method. This guidance was effective for the Company on September 1, 2009 and requires all prior-period earnings per share data to be adjusted retrospectively. Certain of the Company’s equity awards are participating securities as defined by this guidance, and the Company has calculated earnings per share presented herein in accordance with the two-class method outlined within the new guidance. The adoption of this guidance is discussed further in Note 6 of Notes to Consolidated and Combined Financial Statements.
In March 2008, the FASB issued authoritative guidance requiring additional disclosures about the objectives, accounting treatment, and disclosure of derivative instruments and hedging activities. This guidance is effective for financial statements issued for fiscal years beginning after November 15, 2008 and interim periods within those fiscal years, and therefore became effective for us on September 1, 2009. The adoption of this guidance did not have a material impact on our results of operations or financial condition or related disclosures.
In December 2007, the FASB issued guidance pertaining to business combinations and requiring that all assets, liabilities, contingent consideration, contingencies and in-process research and development costs of an acquired business be recorded at fair value at the acquisition date; that acquisition costs generally be expensed as incurred; that restructuring costs generally be expensed in periods subsequent to the acquisition date; and that changes in accounting for deferred tax asset valuation allowances and acquired income tax uncertainties after the measurement period impact income tax expense. This guidance is effective for business combinations transacted subsequent to a company’s first annual reporting period beginning after December 15, 2008, and therefore became effective for us on September 1, 2009. The acquisition of Amrep, Inc. was accounted for in accordance with purchase accounting rules, and requisite disclosure pursuant to those rules have been made in both the Consolidated and Combined Financial Statements and the accompanying notes thereto.
In September 2006, the FASB issued guidance that establishes a single authoritative definition of fair value, establishes a framework for measuring fair value, and expands disclosure requirements pertaining to fair value measurements. This guidance is effective for financial statements issued for fiscal years beginning after November 15, 2007 and interim periods within those fiscal years. Accordingly, we adopted this pronouncement effective September 1, 2008. The adoption did not impact our results of operations or financial condition. We have not applied the provisions of this guidance to non-financial assets, such as our property and equipment, goodwill and certain other assets, which are
35
Table of Contents
Index to Financial Statements
measured at fair value for impairment assessment. We will apply the provisions of this guidance to these assets and liabilities as required beginning September 1, 2010, and do not expect our results of operations or financial condition will be materially affected as a result of this adoption.
Critical Accounting Estimates
Management’s Discussion and Analysis of Financial Condition and Results of Operations addresses the financial condition and results of operations as reflected in our Consolidated and Combined Financial Statements, which have been prepared in accordance with U.S. generally accepted accounting principles. As discussed in Note 2 of Notes to Consolidated and Combined Financial Statements, the preparation of financial statements in conformity with U.S. generally accepted accounting principles requires management to make estimates and assumptions that affect the reported amounts of assets and liabilities and disclosure of contingent assets and liabilities at the date of the financial statements and reported amounts of revenue and expense during the reporting period. On an ongoing basis, management evaluates its estimates and judgments, including those related to inventory valuation; depreciation, amortization, and the recoverability of long-lived assets, including intangible assets; share-based compensation expense; medical, product warranty, and other reserves; litigation; and environmental matters. Management bases its estimates and judgments on its substantial historical experience and other relevant factors, the results of which form the basis for making judgments about the carrying values of assets and liabilities that are not readily apparent from other sources. Actual results could differ from those estimates. See Note 2 of Notes to Consolidated and Combined Financial Statements for a summary of our accounting policies. We believe the following represent our critical accounting estimates:
Accounts Receivable
The Company records accounts receivable at net realizable value. This value includes an allowance for estimated uncollectible accounts to reflect losses anticipated on accounts receivable balances. The allowance is based on historical write-offs, an analysis of past due accounts based on the contractual terms of the receivables, and the economic status of customers, if known. Management believes that the allowance is sufficient to cover uncollectible amounts; however, there can be no assurance that unanticipated future business conditions of customers will not have a negative impact on our results of operations.
Inventories
Inventories include materials, direct labor, and related manufacturing overhead, and are stated at the lower of cost (on a first-in, first-out or average cost basis) or market. Management reviews inventory quantities on hand and records a provision for excess or obsolete inventory primarily based on estimated future demand as a function of historical buying patterns and current market conditions. A significant change in customer demand or market conditions could render certain inventory obsolete and thus could have a material adverse impact on our operating results in the period the change occurs.
Long-Lived and Intangible Assets and Goodwill
We review goodwill and intangible assets with indefinite useful lives for impairment on an annual basis or on an interim basis if an event occurs that might reduce the fair value of the long-lived asset below its carrying value. All other long-lived and intangible assets are reviewed for impairment whenever events or circumstances indicate that the carrying amount of the asset may not be recoverable. An impairment loss would be recognized based on the difference between the carrying value of the asset and its estimated fair value, which would be determined based on either an evaluation of market capitalization
36
Table of Contents
Index to Financial Statements
or other appropriate fair value methods. The evaluation of goodwill and intangibles with indefinite useful lives for impairment requires management to use significant judgments and estimates including, but not limited to, projected future net sales, operating results, and cash flows of our business. Although management currently believes that the estimates used in the evaluation of goodwill and intangibles with indefinite lives are reasonable, differences between actual and expected net sales, operating results, and cash flows could cause these assets to be deemed impaired. If this were to occur, we would be required to charge to operations the write-down in value of such assets, which could have a material adverse effect on our results of operations and financial position, but not our cash flow from operations.
Self-Insurance
It is our policy to self-insure, up to certain limits, certain risks including workers’ compensation, comprehensive general liability, and auto liability. Our self-insured retention for each claim involving workers’ compensation, comprehensive general liability (including toxic tort and other product liability claims), and auto liability is limited to $0.5 million per occurrence of such claims. Based on our historical claims experience, our comprehensive general liability self-insurance retention limits have been increased to $1.5 million per occurrence for claims incurred after August 31, 2008. A provision for claims under this self-insured program, based on our estimate of the aggregate liability for claims incurred, is revised and recorded annually. The estimate is derived from both internal and external sources including but not limited to our independent actuary. We are also self-insured up to certain limits for certain other insurable risks, primarily physical loss to property ($0.5 million per occurrence) and business interruptions resulting from such loss lasting three days or more in duration. Insurance coverage is maintained for catastrophic property and casualty exposures as well as those risks required to be insured by law or contract. Based on our historical claims experience, the retention limits stipulated by policies addressing physical loss to properties located in North America have been increased to $1.0 million per occurrence for claims incurred after August 31, 2008. We are fully self-insured for certain other types of liabilities, including environmental, product recall, patent infringement and errors and omissions. The actuarial estimates are subject to uncertainty from various sources, including, among others, changes in claim reporting patterns, claim settlement patterns, judicial decisions, legislation, and economic conditions. Although we believe that the actuarial estimates are reasonable, significant differences related to the items noted above could materially affect our self-insurance obligations, future expense, and cash flow.
We are also self-insured for the majority of our medical benefit plans. We estimate our aggregate liability for claims incurred by applying a lag factor to our historical claims and administrative cost experience. The appropriateness of the lag factor is evaluated at least annually and, if necessary, revised upon review. Although management believes that the current estimates are reasonable, significant differences related to claim reporting patterns, plan designs, legislation, and general economic conditions could materially affect our medical benefit plan liabilities, future expense, and cash flow.
Share-Based Compensation Expense
We have adopted guidance requiring compensation cost relating to share-based payment transactions be recognized in the financial statements based on the estimated fair value of the equity or liability instrument issued. We incurred $5.0 million, $3.8 million, and $4.4 million of share-based expense for the years ended August 31, 2010, 2009, and 2008, respectively. This guidance also requires forfeitures of share-based awards to be estimated at time of grant and revised in subsequent periods if actual forfeitures differ from initial estimates. Expense related to share-based payments has been reduced for estimated forfeitures, and equity awards having graded vesting provisions are accounted for on a straight-line basis.
37
Table of Contents
Index to Financial Statements
Share-based compensation regulation does not specify a preference for a type of valuation model to be used when measuring the fair value of share-based payments. We have historically used the Black-Scholes model in deriving the fair value estimates of stock option awards whose vesting are conditioned solely upon an award holders’ service to us, which includes all stock option awards outstanding as of August 31, 2010. The Black-Scholes model’s valuation inputs include an entity’s dividend yield, measure of expected volatility, estimated risk-free rate and an option’s expected life based on historical exercise behavior of award holders. Our dividend yield is calculated based on annual dividends paid and the trailing historical average closing stock price at the time of an award’s grant. For awards issued prior to the spin-off, expected volatility was based on historical volatility of Acuity Brands’ stock over the preceding number of years equal to the expected life of the options. Expected volatility for awards issued under Zep’s long-term incentive programs has been based on the volatilities of well-established guideline companies as well as our own historical volatility. We have begun phasing out the use of guideline companies as a determinant for volatility as our own trading history is established and becomes a more appropriate measure for expected volatility. We base our risk-free rate on the United States Treasury yield for a term equal to the expected life of the options at the time of grant. We have used historical exercise behavior data to determine the expected life of options. All inputs into the Black-Scholes model are estimates made at the time of grant. Actual realized value of each option grant could materially differ from these estimates, though without impact to future reported net income. On September 1, 2009, the annual equity award grant for fiscal year 2010 was issued. This grant not only included restricted stock and stock option awards conditioned solely upon service, but also awards containing both service and market-based conditions (“performance awards”). Vesting of these performance awards is predicated in part upon on the attainment of certain stock appreciation targets. Our performance award’s fair value is determined using a Monte-Carlo simulation model that is able to accommodate stock price appreciation and other provisions of our performance awards.
As of August 31, 2010, there was $3.7 million of total unrecognized compensation cost related to unvested restricted stock. That cost is expected to be recognized over a weighted-average period of approximately two years. As of August 31, 2010, there was $2.8 million of total unrecognized compensation cost related to unvested options. That cost is also expected to be recognized over a weighted-average period of approximately two years. The majority of the share-based compensation expense generated through the administration of our share-based award programs does not affect Zep’s overall cash position. Therefore, certain of these expenses have been reflected as other non-cash charges within our Consolidated and Combined Statements of Cash Flows. Forfeitures were estimated based on historical experience. If factors change causing different assumptions to be made in future periods, compensation expense recorded pursuant to accounting rules governing the treatment of share-based compensation may differ significantly from that recorded in the current period. See Notes 2 and 7 of Notes to Consolidated and Combined Financial Statements for more information regarding the assumptions used in estimating the fair value of stock options as well as for the financial implications associated with the accounting rules governing the treatment of share-based compensation.
Environmental Matters
We recognize expense for known environmental claims when payments associated with the claims become probable and the costs can be reasonably estimated. The actual cost of resolving environmental issues may be higher or lower than that reserved primarily due to difficulty in estimating such costs and potential changes in the status of government regulations. We are self-insured for most environmental matters. For more information concerning environmental matters affecting us and our approach towards such, please refer to Note 8 of Notes to Consolidated and Combined Financial Statements.
Cautionary Statement Regarding Forward-Looking Information
This filing contains, and other written or oral statements made by or on behalf of us may include, forward-looking statements, within the meaning of the Private Securities Litigation Reform Act of 1995.
38
Table of Contents
Index to Financial Statements
In addition, we, or the executive officers on our behalf, may from time to time make forward-looking statements in reports and other documents we file with the SEC or in connection with oral statements made to the press, potential investors or others. Specifically, forward-looking statements may include, but are not limited to:
| • | statements relating to our future economic performance, business prospects, revenue, income, and financial condition; |
| • | statements relating to the tax-free nature of the distribution of Zep common stock to stockholders of Acuity Brands in the spin-off; and |
| • | statements preceded by, followed by, or that include the words “expects,” “believes,” “intends,” “anticipates,” and similar terms that relate to future events, performance, or results of the Company. |
Forward-looking statements are subject to certain risks and uncertainties that could cause actual results, expectations, or outcomes to differ materially from our historical experience and the historical experience of Acuity Brands as well as management’s present expectations or projections. These risks and uncertainties include, but are not limited to:
| • | underlying assumptions or expectations related to the spin-off transaction proving to be inaccurate or unrealized; |
| • | customer and supplier relationships and prices; |
| • | competition; |
| • | ability to realize anticipated benefits from strategic or planning initiatives and the timing of related benefits, including initiatives and benefits pertaining to acquisitions; |
| • | market demand; |
| • | litigation and other contingent liabilities, such as environmental matters; and |
| • | economic, political, governmental, technological, and natural disaster related factors affecting the Company’s operations, tax rate, markets, products, services, and prices, among others. |
In evaluating these forward-looking statements, you also should consider various factors, including the risk factors described in Item 1A. Risk Factors of this Annual Report on Form 10-K and the other factors described in our filings with the SEC. You are cautioned not to place undue reliance on any forward-looking statements, which speak only as of the date of this Annual Report and Form 10-K. Except as required by law, we undertake no obligation to publicly update or release any revisions to these forward-looking statements to reflect any events or circumstances after the date of this Annual Report and Form 10-K or to reflect the occurrence of unanticipated events.
Item 7A. Quantitative and Qualitative Disclosures about Market Risk
General. We are exposed to market risks that may impact our financial statements due primarily to changing interest rates and foreign exchange rates. The following discussion provides additional information regarding our market risks.
Interest Rates. Interest rate fluctuations expose our variable-rate debt to changes in interest expense and cash flows. Debt outstanding as of August 31, 2010 was attributable to facilities with variable interest rates. We have previously entered into interest rate swap arrangements with the intention to manage the variability of interest related cash flows associated with our variable-rate debt. While we may enter into similar instruments in the future, no such arrangements existed as of either August 31, 2010 or the date of this filing.
39
Table of Contents
Index to Financial Statements
Based on our borrowings, the potential change in annual interest expense resulting from a hypothetical 10% fluctuation in market interest rates would be approximately $0.6 million. See Notes 2 and 5 of the Notes to Consolidated and Combined Financial Statements for additional information regarding our hedge instruments and long-term debt.
Foreign Exchange Rates. The majority of our net sales, expense, and capital purchases are transacted in United States dollars. However, exposure with respect to foreign exchange rate fluctuation exists due to our operations in Canada and Europe. A hypothetical fluctuation in the Canadian dollar and Euro of 10% would impact operating profit by approximately $0.3 million and $0.4 million, respectively. The impact of these hypothetical currency fluctuations has been calculated in isolation from any response we would undertake to address such exchange rate changes in our foreign markets.
Fluctuations in Commodity Prices. The key raw materials used in our products are surfactants, polymers and resins, fragrances, water, solvents, and other petroleum-based materials and packaging materials. We do not engage in commodity hedging transactions for raw materials, though we have committed and will continue to commit to purchase certain materials for specified periods of time. Many of the raw materials that we use are petroleum-based and, therefore, subject to the availability and price of oil or its derivatives. Significant increases in the prices of our products due to increases in the cost of raw materials or packaging materials could have a negative effect on demand for products and on profitability. It is difficult to estimate the impact that pricing volatility in the commodities markets from which we source raw materials will have on our future earnings. We estimate the rising costs of raw materials negatively impacted our gross profit by approximately $18.3 million and $9.0 million in fiscal years 2009 and 2008, respectively. Raw material pricing experienced upward pressure during the second half of Zep’s fiscal year 2010. The cost of certain commodities, such as D-Limonene, an ingredient that is integral to citrus-based cleaners, continues to increase due to supply shortages. We have announced price increases and continue to evaluate new raw material suppliers to mitigate the impact of rising raw material costs. While we have generally been able to pass along these increases in cost in the form of higher selling prices for our products over time, failure to effectively manage future increases in the costs of these materials could adversely affect our operating margins and cash flow. Furthermore, there are a limited number of suppliers for some of our raw materials, packaging materials, and finished goods. Our profitability, volume, and cash flow could be negatively impacted by limitations inherent within the supply chain of certain of these materials, including competitive conditions, governmental issues, legal issues, natural disasters, and other events that could impact both the availability and price of the materials.
40
Table of Contents
Index to Financial Statements
Item 8. Financial Statements and Supplementary Data
Index to Consolidated and Combined Financial Statements
41
Table of Contents
Index to Financial Statements
MANAGEMENT’S REPORT ON INTERNAL CONTROL OVER FINANCIAL REPORTING
Zep Inc.
The management of Zep Inc. is responsible for establishing and maintaining adequate internal control over financial reporting for the Company. Internal control over financial reporting is defined in Rule 13a-15(f) and 15d-15(f) promulgated under the Securities Exchange Act of 1934. Because of its inherent limitations, internal control over financial reporting may not prevent or detect misstatements. Projections of any evaluation of effectiveness to future periods are subject to the risk that controls may become inadequate because of changes in conditions, or that the degree of compliance with the policies or procedures may deteriorate.
On January 4, 2010 we completed our acquisition of Amrep, Inc. As permitted by the Securities and Exchange Commission, management has elected to exclude Amrep from management’s assessment of the effectiveness of our internal control over financial reporting as of August 31, 2010. Total assets, total revenues, and net income of Amrep, Inc. represented 32%, 13%, and 19%, respectively, of our total assets, total revenues, and net income as reported in our consolidated financial statements as of and for the year ended August 31, 2010.
The Company’s management assessed the effectiveness of the Company’s internal control over financial reporting as of August 31, 2010. In making this assessment, the Company’s management used the criteria set forth by the Committee of Sponsoring Organizations of the Treadway Commission (“COSO”) in Internal Control-Integrated Framework. Based on this assessment, management believes that, as of August 31, 2010, the Company’s internal control over financial reporting is effective.
The Company’s independent registered public accounting firm has issued an audit report on this assessment of the Company’s internal control over financial reporting. This report, dated November 8, 2010, appears on page 44 of this Form 10-K.
| /s/ JOHN K. MORGAN |
/s/ MARK R. BACHMANN | |
| John K. Morgan | Mark R. Bachmann | |
| Chairman, President and Chief Executive Officer |
Executive Vice President and Chief Financial Officer |
42
Table of Contents
Index to Financial Statements
Report of Independent Registered Public Accounting Firm
The Board of Directors and Shareholders of Zep Inc.
We have audited the accompanying consolidated balance sheets of Zep Inc. and subsidiaries as of August 31, 2010 and 2009, and the related consolidated and combined statements of income, stockholders’ equity and comprehensive income, and cash flows for each of the three years in the period ended August 31, 2010. Our audits also included the financial statement schedule listed in the Index at Item 15(a). These financial statements and schedule are the responsibility of the Company’s management. Our responsibility is to express an opinion on these financial statements and schedule based on our audits.
We conducted our audits in accordance with the standards of the Public Company Accounting Oversight Board (United States). Those standards require that we plan and perform the audit to obtain reasonable assurance about whether the financial statements are free of material misstatement. An audit includes examining, on a test basis, evidence supporting the amounts and disclosures in the financial statements. An audit also includes assessing the accounting principles used and significant estimates made by management, as well as evaluating the overall financial statement presentation. We believe that our audits provide a reasonable basis for our opinion.
In our opinion, the financial statements referred to above present fairly, in all material respects, the consolidated financial position of Zep Inc. and subsidiaries at August 31, 2010 and 2009, and the consolidated and combined results of their operations and their cash flows for each of the three years in the period ended August 31, 2010, in conformity with U.S. generally accepted accounting principles. Also, in our opinion, the related financial statement schedule, when considered in relation to the basic financial statements taken as a whole, presents fairly in all material respects the information set forth therein.
We also have audited, in accordance with the standards of the Public Company Accounting Oversight Board (United States), Zep Inc.’s internal control over financial reporting as of August 31, 2010, based on criteria established in Internal Control-Integrated Framework issued by the Committee of Sponsoring Organizations of the Treadway Commission and our report dated November 8, 2010 expressed an unqualified opinion thereon.
/s/ Ernst & Young LLP
Atlanta, Georgia
November 8, 2010
43
Table of Contents
Index to Financial Statements
Report of Independent Registered Public Accounting Firm
The Board of Directors and Shareholders of Zep Inc.
We have audited Zep Inc.’s internal control over financial reporting as of August 31, 2010, based on criteria established in Internal Control—Integrated Framework issued by the Committee of Sponsoring Organizations of the Treadway Commission (the COSO criteria). Zep Inc.’s management is responsible for maintaining effective internal control over financial reporting, and for its assessment of the effectiveness of internal control over financial reporting included in the accompanying Management’s Report on Internal Control Over Financial Reporting. Our responsibility is to express an opinion on the company’s internal control over financial reporting based on our audit.
We conducted our audit in accordance with the standards of the Public Company Accounting Oversight Board (United States). Those standards require that we plan and perform the audit to obtain reasonable assurance about whether effective internal control over financial reporting was maintained in all material respects. Our audit included obtaining an understanding of internal control over financial reporting, assessing the risk that a material weakness exists, testing and evaluating the design and operating effectiveness of internal control based on the assessed risk, and performing such other procedures as we considered necessary in the circumstances. We believe that our audit provides a reasonable basis for our opinion.
A company’s internal control over financial reporting is a process designed to provide reasonable assurance regarding the reliability of financial reporting and the preparation of financial statements for external purposes in accordance with generally accepted accounting principles. A company’s internal control over financial reporting includes those policies and procedures that (1) pertain to the maintenance of records that, in reasonable detail, accurately and fairly reflect the transactions and dispositions of the assets of the company; (2) provide reasonable assurance that transactions are recorded as necessary to permit preparation of financial statements in accordance with generally accepted accounting principles, and that receipts and expenditures of the company are being made only in accordance with authorizations of management and directors of the company; and (3) provide reasonable assurance regarding prevention or timely detection of unauthorized acquisition, use, or disposition of the company’s assets that could have a material effect on the financial statements.
Because of its inherent limitations, internal control over financial reporting may not prevent or detect misstatements. Also, projections of any evaluation of effectiveness to future periods are subject to the risk that controls may become inadequate because of changes in conditions, or that the degree of compliance with the policies or procedures may deteriorate.
As indicated in the accompanying Management’s Report on Internal Control Over Financial Reporting, management’s assessment of and conclusion on the effectiveness of internal control over financial reporting did not include the internal controls of Amrep, Inc., which is included in the 2010 consolidated financial statements of Zep Inc. and constituted 32% of total assets as of August 31, 2010 and 13% and 19% of total revenues and net income, respectively, for the year then ended. Our audit of internal control over financial reporting of Zep Inc. also did not include an evaluation of the internal control over financial reporting of Amrep, Inc.
In our opinion, Zep Inc. maintained, in all material respects, effective internal control over financial reporting as of August 31, 2010, based on the COSO criteria.
We also have audited, in accordance with the standards of the Public Company Accounting Oversight Board (United States), the consolidated balance sheets of Zep Inc. as of August 31, 2010 and 2009, and the related consolidated and combined statements of income, stockholders’ equity and comprehensive income, and cash flows for each of the three years in the period ended August 31, 2010 of Zep Inc. and our report dated November 8, 2010 expressed an unqualified opinion thereon.
/s/ Ernst & Young LLP
Atlanta, Georgia
November 8, 2010
44
Table of Contents
Index to Financial Statements
CONSOLIDATED BALANCE SHEETS
(In thousands, except per-share data)
| August 31, | ||||||||
| 2010 | 2009 | |||||||
| Current Assets: |
||||||||
| Cash and cash equivalents |
$ | 25,257 | $ | 16,651 | ||||
| Accounts receivable, less reserve for doubtful accounts of $4,995 and $4,955 at August 31, 2010 and 2009, respectively |
90,827 | 85,060 | ||||||
| Inventories |
53,192 | 39,618 | ||||||
| Prepayments and other current assets |
9,779 | 6,772 | ||||||
| Deferred income taxes |
8,188 | 7,859 | ||||||
| Total Current Assets |
187,243 | 155,960 | ||||||
| Property, Plant, and Equipment, at cost: |
||||||||
| Land |
4,504 | 3,289 | ||||||
| Buildings and leasehold improvements |
58,224 | 56,191 | ||||||
| Machinery and equipment |
94,172 | 84,940 | ||||||
| Total Property, Plant, and Equipment |
156,900 | 144,420 | ||||||
| Less accumulated depreciation and amortization |
90,026 | 89,945 | ||||||
| Property, Plant, and Equipment, net |
66,874 | 54,475 | ||||||
| Other Assets: |
||||||||
| Goodwill |
53,764 | 31,871 | ||||||
| Identifiable intangible assets |
30,271 | 69 | ||||||
| Deferred income taxes |
861 | 5,989 | ||||||
| Other long-term assets |
3,835 | 1,254 | ||||||
| Total Other Assets |
88,731 | 39,183 | ||||||
| Total Assets |
$ | 342,848 | $ | 249,618 | ||||
| LIABILITIES AND STOCKHOLDERS’ EQUITY |
||||||||
| Current Liabilities: |
||||||||
| Current maturities of long-term debt |
$ | 15,000 | $ | 12,000 | ||||
| Accounts payable |
51,390 | 41,062 | ||||||
| Accrued compensation |
21,322 | 15,398 | ||||||
| Other accrued liabilities |
29,124 | 25,064 | ||||||
| Total Current Liabilities |
116,836 | 93,524 | ||||||
| Long-term debt, less current maturities |
77,150 | 28,650 | ||||||
| Deferred income taxes |
2,140 | 371 | ||||||
| Self-insurance reserves, less current portion |
5,420 | 7,262 | ||||||
| Other long-term liabilities |
19,129 | 10,546 | ||||||
| Commitments and Contingencies (see Note 8) |
||||||||
| Stockholders’ Equity: |
||||||||
| Preferred stock, $0.01 par value; 50,000,000 shares authorized; none issued and outstanding |
— | — | ||||||
| Common stock, $0.01 par value; 500,000,000 shares authorized; 21,335,922 and 21,159,127 shares issued and outstanding at August 31, 2010 and August 31, 2009, respectively |
213 | 212 | ||||||
| Paid-in capital |
85,316 | 80,034 | ||||||
| Retained earnings |
25,052 | 15,061 | ||||||
| Accumulated other comprehensive income |
11,592 | 13,958 | ||||||
| Total Stockholders’ Equity |
122,173 | 109,265 | ||||||
| Total Liabilities and Stockholders’ Equity |
$ | 342,848 | $ | 249,618 | ||||
The accompanying Notes to Consolidated and Combined Financial Statements are an integral part of these statements.
45
Table of Contents
Index to Financial Statements
CONSOLIDATED AND COMBINED STATEMENTS OF INCOME
(In thousands, except per-share data)
| Years Ended August 31, | ||||||||||||
| 2010 | 2009 | 2008 | ||||||||||
| Net Sales |
$ | 568,512 | $ | 501,032 | $ | 574,724 | ||||||
| Cost of Products Sold |
285,335 | 236,513 | 251,542 | |||||||||
| Gross Profit |
283,177 | 264,519 | 323,182 | |||||||||
| Selling, Distribution, and Administrative Expenses |
247,759 | 242,083 | 285,592 | |||||||||
| Restructuring Charges |
8,213 | 3,422 | 8,527 | |||||||||
| Acquisition Costs |
3,353 | — | — | |||||||||
| Loss on Disposal of Fixed Assets |
— | 925 | — | |||||||||
| Operating Profit |
23,852 | 18,089 | 29,063 | |||||||||
| Other Expense (Income): |
||||||||||||
| Interest expense, net |
1,957 | 1,653 | 2,846 | |||||||||
| Accelerated debt issuance cost on debt extinguishment |
428 | — | — | |||||||||
| Miscellaneous expense (income), net |
(244 | ) | 1,252 | 226 | ||||||||
| Total Other Expense |
2,141 | 2,905 | 3,072 | |||||||||
| Income before Provision for Income Taxes |
21,711 | 15,184 | 25,991 | |||||||||
| Provision for Income Taxes |
8,207 | 5,924 | 9,669 | |||||||||
| Net Income |
$ | 13,504 | $ | 9,260 | $ | 16,322 | ||||||
| Earnings Per Share: |
||||||||||||
| Basic Earnings per Share |
$ | 0.62 | $ | 0.43 | $ | 0.76 | ||||||
| Basic Weighted Average Number of Shares Outstanding |
21,271 | 21,057 | 20,862 | |||||||||
| Diluted Earnings per Share |
$ | 0.61 | $ | 0.42 | $ | 0.75 | ||||||
| Diluted Weighted Average Number of Shares Outstanding |
21,738 | 21,290 | 21,252 | |||||||||
| Dividends Declared per Share |
$ | 0.16 | $ | 0.16 | $ | 0.12 | ||||||
The accompanying Notes to Consolidated and Combined Financial Statements are an integral part of these statements.
46
Table of Contents
Index to Financial Statements
CONSOLIDATED AND COMBINED STATEMENTS OF CASH FLOWS
(In thousands)
| Years Ended August 31, | ||||||||||||
| 2010 | 2009 | 2008 | ||||||||||
| Cash Provided by (Used for) Operating Activities: |
||||||||||||
| Net income |
$ | 13,504 | $ | 9,260 | $ | 16,322 | ||||||
| Adjustments to reconcile net income to net cash provided by (used for) operating activities: |
||||||||||||
| Depreciation and amortization |
10,268 | 6,960 | 6,882 | |||||||||
| Loss on disposal of fixed assets |
1,583 | 925 | — | |||||||||
| Excess tax benefits from share-based payments |
(366 | ) | (758 | ) | (777 | ) | ||||||
| Other non-cash charges |
4,379 | 3,152 | 3,161 | |||||||||
| Changes in assets and liabilities: |
||||||||||||
| Accounts receivable |
1,304 | 13,295 | (5,103 | ) | ||||||||
| Inventories |
2,532 | 10,854 | (4,653 | ) | ||||||||
| Deferred income taxes |
(1,360 | ) | 114 | (996 | ) | |||||||
| Prepayments and other current assets |
(2,553 | ) | 443 | (1,937 | ) | |||||||
| Accounts payable |
1,616 | (4,851 | ) | 8,669 | ||||||||
| Accrued compensation and other current liabilities |
4,691 | (7,904 | ) | 6,315 | ||||||||
| Self insurance reserves and other long-term liabilities |
(2,971 | ) | (2,118 | ) | (574 | ) | ||||||
| Other assets |
1,396 | 1,066 | (874 | ) | ||||||||
| Net Cash Provided by Operating Activities |
34,023 | 30,438 | 26,435 | |||||||||
| Cash Provided by (Used for) Investing Activities: |
||||||||||||
| Purchases of property, plant, and equipment |
(9,776 | ) | (7,517 | ) | (9,176 | ) | ||||||
| Acquisitions |
(63,736 | ) | — | — | ||||||||
| Other investing activities |
— | — | 124 | |||||||||
| Net Cash Used for Investing Activities |
(73,512 | ) | (7,517 | ) | (9,052 | ) | ||||||
| Cash Provided by (Used for) Financing Activities: |
||||||||||||
| Proceeds from revolving credit facilities |
148,000 | 66,800 | 96,700 | |||||||||
| Repayment of borrowings from revolving credit facilities |
(96,500 | ) | (85,300 | ) | (49,724 | ) | ||||||
| Proceeds from Receivables Facility |
15,000 | — | — | |||||||||
| Repayment of Receivables Facility |
(15,000 | ) | — | — | ||||||||
| Payment to Acuity Brands, Inc. upon separation |
— | — | (62,500 | ) | ||||||||
| Stock issuances |
521 | 709 | 381 | |||||||||
| Excess tax benefits from share-based payments |
366 | 758 | 777 | |||||||||
| Dividend payments |
(3,513 | ) | (3,463 | ) | (2,596 | ) | ||||||
| Repayments of other long-term debt |
— | — | (326 | ) | ||||||||
| Net activity with Acuity Brands, Inc. prior to separation |
— | — | 4,876 | |||||||||
| Net Cash Provided by (Used for) Financing Activities |
48,874 | (20,496 | ) | (12,412 | ) | |||||||
| Effect of Exchange Rate Changes on Cash |
(779 | ) | (302 | ) | 415 | |||||||
| Net Change in Cash and Cash Equivalents |
8,606 | 2,123 | 5,386 | |||||||||
| Cash and Cash Equivalents at Beginning of Period |
16,651 | 14,528 | 9,142 | |||||||||
| Cash and Cash Equivalents at End of Period |
$ | 25,257 | $ | 16,651 | $ | 14,528 | ||||||
| Supplemental Cash Flow Information: |
||||||||||||
| Income taxes paid during the year |
$ | 8,578 | $ | 6,243 | $ | 6,843 | ||||||
| Interest paid during the year |
$ | 2,299 | $ | 1,730 | $ | 2,394 | ||||||
The accompanying Notes to Consolidated and Combined Financial Statements are an integral part of these statements.
47
Table of Contents
Index to Financial Statements
CONSOLIDATED AND COMBINED STATEMENTS OF STOCKHOLDERS’ EQUITY AND
COMPREHENSIVE INCOME
| (in thousands) | Parent’s Equity |
Common Stock |
Additional Paid-In Capital |
Retained Earnings |
Accumulated Other Comprehensive Income |
Total Equity |
Comprehensive Income |
|||||||||||||||||||||||||
| Balance as of August 31, 2007 |
$ | 61,518 | — | $ | — | $ | — | $ | — | $ | 13,316 | $ | 74,834 | |||||||||||||||||||
| Net income earned prior to spin-off |
4,462 | — | — | — | — | — | 4,462 | $ | 4,462 | |||||||||||||||||||||||
| Net income earned subsequent to spin-off |
— | — | — | — | 11,860 | — | 11,860 | 11,860 | ||||||||||||||||||||||||
| Change in unrealized loss on cash flow hedge, (net of tax of $50) |
— | — | — | — | — | (76 | ) | (76 | ) | (76 | ) | |||||||||||||||||||||
| Foreign currency translation adjustment (net of tax of $0) |
— | — | — | — | — | 1,978 | 1,978 | 1,978 | ||||||||||||||||||||||||
| Comprehensive income |
— | — | — | — | — | — | — | $ | 18,224 | |||||||||||||||||||||||
| Net transaction with Acuity Brands, Inc |
4,876 | — | — | — | — | — | 4,876 | |||||||||||||||||||||||||
| Consummation of spin-off transaction on October 31, 2007, including distribution of Zep Inc. common stock by Acuity Brands, Inc |
(70,856 | ) | 20,811 | 208 | 70,648 | — | — | — | ||||||||||||||||||||||||
| Amortization, issuance, and forfeitures of restricted stock grants and stock options |
— | 129 | 2 | 2,792 | — | — | 2,794 | |||||||||||||||||||||||||
| Deferred compensation plan |
— | 2 | — | 427 | — | — | 427 | |||||||||||||||||||||||||
| Employee stock purchase plan issuances |
— | 14 | — | 317 | — | — | 317 | |||||||||||||||||||||||||
| Stock option exercises |
— | 2 | — | 64 | — | — | 64 | |||||||||||||||||||||||||
| Dividend payments |
— | — | — | — | (2,596 | ) | — | (2,596 | ) | |||||||||||||||||||||||
| Tax effect on stock options and restricted stock |
— | — | — | 777 | — | — | 777 | |||||||||||||||||||||||||
| Balance at August 31, 2008 |
$ | — | 20,958 | $ | 210 | $ | 75,025 | $ | 9,264 | $ | 15,218 | $ | 99,717 | |||||||||||||||||||
| Net income |
— | — | — | — | 9,260 | — | 9,260 | $ | 9,260 | |||||||||||||||||||||||
| Change in unrealized loss on cash flow hedge, (net of tax of $143) |
— | — | — | — | — | (250 | ) | (250 | ) | (250 | ) | |||||||||||||||||||||
| Foreign currency translation adjustment (net of tax of $0) |
— | — | — | — | — | (1,010 | ) | (1,010 | ) | (1,010 | ) | |||||||||||||||||||||
| Comprehensive income |
— | — | — | — | — | — | — | $ | 8,000 | |||||||||||||||||||||||
| Net transaction with Acuity Brands, Inc |
— | — | — | 792 | — | — | 792 | |||||||||||||||||||||||||
| Amortization, issuance, and forfeitures of restricted stock grants and stock options |
— | 130 | 2 | 2,656 | — | — | 2,658 | |||||||||||||||||||||||||
| Deferred compensation plan |
— | 4 | — | 94 | — | — | 94 | |||||||||||||||||||||||||
| Employee stock purchase plan issuances |
— | 23 | — | 272 | — | — | 272 | |||||||||||||||||||||||||
| Stock option exercises |
— | 44 | — | 437 | — | — | 437 | |||||||||||||||||||||||||
| Dividend payments |
— | — | — | — | (3,463 | ) | — | (3,463 | ) | |||||||||||||||||||||||
| Tax effect on stock options and restricted stock |
— | — | — | 758 | — | — | 758 | |||||||||||||||||||||||||
| Balance at August 31, 2009 |
$ | — | 21,159 | $ | 212 | $ | 80,034 | $ | 15,061 | $ | 13,958 | $ | 109,265 | |||||||||||||||||||
| Net income |
— | — | — | — | 13,504 | — | 13,504 | $ | 13,504 | |||||||||||||||||||||||
| Reclassification of unrealized loss on cash flow hedge, (net of tax of $190) |
— | — | — | — | — | 326 | 326 | 326 | ||||||||||||||||||||||||
| Foreign currency translation adjustment (net of tax of $0) |
— | — | — | — | — | (2,692 | ) | (2,692 | ) | (2,692 | ) | |||||||||||||||||||||
| Comprehensive income |
— | — | — | — | — | — | — | $ | 11,138 | |||||||||||||||||||||||
| Amortization, issuance, and forfeitures of restricted stock grants and stock options |
— | 177 | 1 | 3,822 | — | — | 3,823 | |||||||||||||||||||||||||
| Deferred compensation plan |
— | — | — | 573 | — | — | 573 | |||||||||||||||||||||||||
| Employee stock purchase plan issuances |
— | — | — | 160 | — | — | 160 | |||||||||||||||||||||||||
| Stock option exercises |
— | — | — | 361 | — | — | 361 | |||||||||||||||||||||||||
| Dividend payments |
— | — | — | — | (3,513 | ) | — | (3,513 | ) | |||||||||||||||||||||||
| Tax effect on stock options and restricted stock |
— | — | — | 366 | — | — | 366 | |||||||||||||||||||||||||
| Balance at August 31, 2010 |
$ | — | 21,336 | $ | 213 | $ | 85,316 | $ | 25,052 | $ | 11,592 | $ | 122,173 | |||||||||||||||||||
The accompanying Notes to Consolidated and Combined Financial Statements are an integral part of these statements.
48
Table of Contents
Index to Financial Statements
NOTES TO CONSOLIDATED AND COMBINED FINANCIAL STATEMENTS
(Dollar amounts in thousands, except share and per-share data and as indicated)
Note 1: Description of Business, Distribution and Basis of Presentation
Description of the Business and Distribution
Zep Inc. (“Zep” or the “Company”) is a leading provider of cleaning and maintenance chemicals and related products and services for commercial, industrial, institutional and consumer applications, which we market under well recognized brand names, some of which have been in existence since we were founded in 1937. The Company’s product portfolio, which is produced using more than 4,000 unique formulations, includes anti-bacterial and industrial hand care products, cleaners, degreasers, deodorizers, disinfectants, floor finishes, sanitizers, pest- and weed-control products, air-care products and delivery systems and a wide variety of automotive maintenance chemicals. Zep sells its products through a direct-sales organization, to consumers primarily through home improvement stores and to large national and regional business-to-business distributors that target the industrial maintenance, janitorial/sanitation, and automotive markets. Management believes that Zep is the leading U.S. provider of cleaning and maintenance solutions in the direct-sales channel. As the result of recent acquisitions, the Company has established a strong presence in the industrial distribution market.
The spin-off of Zep by Acuity Brands, Inc. (“Acuity Brands”) became effective during Zep’s fiscal year 2008 on October 31, 2007 (the “Distribution Date”) through a distribution of 100% of the common stock of Zep to Acuity Brands’ stockholders (the “Distribution”). The stock dividend of one share of Zep common stock for every two shares of Acuity Brands common stock was distributed on a pro rata basis to holders of record of Acuity Brands common stock at the close of business on October 17, 2007, which was the record date for the Distribution. No fractional shares of Zep common stock were distributed. Instead of fractional shares, Zep stockholders received cash. Following the Distribution, Acuity Brands does not own any shares of Zep as the spin-off rendered Zep an independent public company. In conjunction with the separation of their businesses, Zep and Acuity Brands entered into various agreements that address the allocation of assets and liabilities between them and that define their relationship after the separation, including the Agreement of Plan of Distribution, which we refer to as the distribution agreement, the tax disaffiliation agreement, the employee benefits agreement, and the transition services agreement. The Internal Revenue Service has issued a private letter ruling supporting the spin-off’s tax-free status, and Zep continues to conduct its operations in a manner that is compliant with the conditions set forth by that ruling. Zep and Acuity Brands have also received an opinion from their external counsel supporting the spin-off’s tax-free status.
Prior to the spin-off, Acuity Brands engaged in an internal restructuring, including a holding company reorganization. As part of the internal restructuring, the business that had previously been conducted by Acuity Specialty Products Group, Inc. was merged into the parent company and was subsequently transferred to Acuity Specialty Products, Inc. (“ASP”). ASP is now a wholly-owned subsidiary of Zep Inc.
Basis of Presentation
The Company’s Consolidated and Combined Financial Statements have been prepared in accordance with U.S. generally accepted accounting principles and present its financial position, results of operations, and cash flows. The financial statements and other financial information in this Form 10-K related to periods ending on or after the Distribution Date are presented on a consolidated basis and include the accounts of Zep and its majority-owned subsidiaries.
The financial statements and related financial information pertaining to periods preceding the Distribution Date have been presented on a combined basis and reflect the results of those entities that were ultimately transferred to us as part of the spin-off. Prior to the spin-off, certain functions, including
49
Table of Contents
Index to Financial Statements
Zep Inc.
NOTES TO CONSOLIDATED AND COMBINED FINANCIAL STATEMENTS—(Continued)
(Dollar amounts in thousands, except share and per-share data and as indicated)
treasury, tax, executive and employee benefits, financial reporting, risk management, legal, corporate secretary and investor relations, were historically managed by the corporate division of Acuity Brands on behalf of its subsidiaries. The assets, liabilities and expenses related to the support of these centralized corporate functions have been allocated to us on a specific identification basis to the extent possible. Otherwise, allocations related to these services were primarily based upon an estimate of the proportion of corporate amounts applicable to us given our contribution to our consolidated parent company’s revenues and employee base. Allocation ratios derived from these contribution factors are similar in amount and remained consistent throughout the historical periods presented. Examples of expenses that were allocated in accordance with these proportional estimates include charges related to accounting and legal services undertaken to ensure the consolidated parent company’s compliance with various regulatory requirements as well as the salaries of certain corporate officers and employees. In the opinion of management, the assumptions and allocations have been made on a reasonable and appropriate basis under the circumstances. Management believes that amounts allocated to Zep reflect a reasonable representation of the types of costs that would have been incurred if we had performed these functions as a stand-alone company. However, as estimation is inherent within the aforementioned allocation process, these combined financial statements do not include all of the actual amounts that would have been incurred had we been a stand-alone entity during the periods presented. The combined financial statements reflect an allocation of debt and related interest expense, as further described in Note 5 to the Notes to Consolidated and Combined Financial Statements.
During the first quarter of fiscal year 2010, Zep renegotiated the terms of its contract with its licensee in France. Separately, the Company executed a release agreement with this party that addressed historical business transactions. Zep received a one-time, $1.1 million payment pursuant to this release agreement, all of which was recognized within Net Sales on our Consolidated and Combined Statements of Income during the year ended August 31, 2010.
Note 2: Summary of Significant Accounting Policies
Principles of Consolidation and Combination
The Consolidated and Combined Financial Statements include the accounts of Zep after elimination of significant intercompany transactions and accounts.
Revenue Recognition
Zep records revenue when the following criteria are met: persuasive evidence of an arrangement exists, delivery has occurred, the selling price to the customer is fixed and determinable, and collectibility is reasonably assured. Delivery is not considered to have occurred until the customer assumes the risks and rewards of ownership. Customers take delivery at the time of shipment for terms designated free on board shipping point. For sales designated free on board destination, customers take delivery when the product is delivered to the customer’s delivery site. Provisions for rebates, sales incentives, product returns, and discounts to customers are recorded as an offset to revenue in the same period the related revenue is recorded. The Company also maintains one-time or on-going marketing and trade-promotion programs with certain customers that require the Company to estimate and accrue the expected costs of such programs. These arrangements include cooperative marketing programs, merchandising of the Company’s products and introductory marketing funds for new products and other trade-promotion activities conducted by the customer. Costs associated with these programs are recorded as a reduction of revenues.
50
Table of Contents
Index to Financial Statements
Zep Inc.
NOTES TO CONSOLIDATED AND COMBINED FINANCIAL STATEMENTS—(Continued)
(Dollar amounts in thousands, except share and per-share data and as indicated)
The Company provides for limited product return rights to certain distributors and customers primarily for slow moving or damaged items subject to certain defined criteria. The Company monitors product returns and records, at the time revenue is recognized, a provision for the estimated amount of future returns based primarily on historical experience and specific notification of pending returns. Although historical product returns generally have been within expectations, there can be no assurance that future product returns will not exceed historical amounts. A significant increase in product returns could have a material impact on the Company’s operating results in future periods.
Use of Estimates
The preparation of financial statements and related disclosures in conformity with U.S. generally accepted accounting principles requires management to make estimates and assumptions, which in fiscal year 2008 and prior include estimates of Acuity Brands’ costs allocated to Zep, that affect the reported amounts of assets and liabilities, the disclosure of contingent assets and liabilities at the date of the financial statements, and the reported amounts of revenue and expense during the reporting period. Actual results could differ from those estimates.
Cash and Cash Equivalents
Zep considers time deposits and marketable securities purchased with an original maturity of three months or less to be cash equivalents, which are included in the accompanying balance sheets at fair value.
Accounts Receivable
The Company records accounts receivable at net realizable value. This value includes an allowance for estimated uncollectible accounts to reflect losses anticipated on accounts receivable balances. The allowance is based on historical write-offs, an analysis of past due accounts based on the contractual terms of the receivables, and the economic status of customers, if known. Management believes that the allowance is sufficient to cover uncollectible amounts; however, there can be no assurance that unanticipated future business conditions of customers will not have a negative impact on the Company’s results of operations. Accounts receivable are written off against the allowance for estimated uncollectible accounts should the Company conclude their collection is improbable. Expense recorded in connection with our allowance for estimated uncollectable accounts totaled $2.9 million, $5.6 million, and $2.5 million for the years ended August 31, 2010, 2009, and 2008, respectively.
Concentrations of Credit Risk
Concentrations of credit risk with respect to receivables, which are typically unsecured, are generally limited due to the wide variety of customers and markets using Zep’s products, as well as their dispersion across many different geographic areas. Receivables due from The Home Depot, the Company’s largest single customer, were approximately $10.0 million, $12.7 million and $13.1 million as of the years ended August 31, 2010, 2009, and 2008, respectively. Additionally, net sales to The Home Depot accounted for approximately 10%, 11% and 10% of our total net sales during the fiscal years ended August 31, 2010, 2009, and 2008, respectively. No other single customer accounted for more than 10% of combined receivables at August 31, 2010.
51
Table of Contents
Index to Financial Statements
Zep Inc.
NOTES TO CONSOLIDATED AND COMBINED FINANCIAL STATEMENTS—(Continued)
(Dollar amounts in thousands, except share and per-share data and as indicated)
Fair Value of Financial Instruments
The Company’s financial instruments consist primarily of cash and cash equivalents, trade receivables, trade payables, and debt and related derivative instruments. The book values of cash and cash equivalents, trade receivables, and trade payables are considered to be representative of their respective fair values due to their short-term nature.
As discussed further in Note 5 of Notes to Consolidated and Combined Financial Statements, debt levels pertaining to periods prior to the Distribution and reflected within Zep’s historical Consolidated Balance Sheets reflect assumptions regarding prospective debt issuances based upon Zep’s anticipated financial condition on or about the time of the spin-off. Therefore, it is not practicable to make estimates regarding the fair value of the Company’s outstanding indebtedness prior to the Distribution. The majority of our indebtedness related to periods subsequent to the Distribution was transacted through borrowings made under our revolving credit facilities. The Company estimates that the carrying value of all of its outstanding debt obligations approximates fair value based on the variable nature of interest rates associated with the indebtedness.
We entered into four interest rate swap arrangements during the fourth quarter of fiscal year 2008 effectively swapping the variable interest rate associated with $20 million of borrowings made under the revolving credit facility that was in effect at that time for fixed rates ranging from 3.2% to 3.5%. These interest rate swaps, all of which matured in June 2010, were derivative instruments and were accounted for as cash flow hedges. The objective of these hedges was to manage the variability of interest related cash flows associated with variable-rate debt subject to these hedge instruments. There was no ineffectiveness related to the change in fair value of our cash flow hedges. The instruments generated an immaterial amount of unrealized losses that have been recorded net of tax within Accumulated Other Comprehensive Income on our Consolidated and Combined Statements of Stockholders’ Equity and Comprehensive Income. The estimated fair values of our derivative instruments were calculated based on market rates. These instruments were valued using pricing models based upon market observable inputs such as yield curves, and such inputs are classified as Level 2 inputs under accounting guidance governing fair value disclosures. Cash flow hedge instruments may be affected by counterparty creditworthiness and market conditions. However, we minimized such risk exposures for by limiting counterparties to large banks and financial institutions that meet established credit guidelines. Given all hedge instruments outstanding during the majority of our fiscal year 2010 matured prior to the August 31, 2010 balance sheet date, there was no risk of loss to the Company as a result of counterparty default as of that date. While we may enter into similar instruments in the future, no such arrangements existed as of either August 31, 2010 or the date of this filing.
Inventories
Inventories, which include materials, direct labor, and related manufacturing overhead, are stated at the lower of cost (on a first-in, first-out or average cost basis) or market, and consist of the following:
| 2010 | 2009 | |||||||
| Raw materials and supplies |
$ | 14,559 | $ | 12,814 | ||||
| Work in progress |
867 | 448 | ||||||
| Finished goods |
40,339 | 28,968 | ||||||
| 55,765 | 42,230 | |||||||
| Less: Reserves |
(2,573 | ) | (2,612 | ) | ||||
| $ | 53,192 | $ | 39,618 | |||||
52
Table of Contents
Index to Financial Statements
Zep Inc.
NOTES TO CONSOLIDATED AND COMBINED FINANCIAL STATEMENTS—(Continued)
(Dollar amounts in thousands, except share and per-share data and as indicated)
Goodwill and Identifiable Intangible Assets
As of August 31, 2010, Zep’s Consolidated Balance Sheets reflect a total of $53.8 million in goodwill. Goodwill is an asset representing the future economic benefits arising from other assets acquired in a business combination that are not individually identified and separately recognized. Approximately $21.0 million is attributable to the fiscal 1997 acquisition of Enforcer Products, Inc. On January 4, 2010, Zep acquired Amrep, Inc. (“Amrep”) for a cash purchase price of approximately $63.5 million. Under the purchase method of accounting, Zep has made an allocation of the closing purchase price to Amrep’s net tangible and intangible assets based on their estimated fair values as of the January 4, 2010. The excess of the purchase price over the net tangible and identifiable intangible assets has been recorded as Goodwill within the Consolidated Balance Sheets. Goodwill is not deductible for income tax purposes. The acquisition of Amrep is discussed further in Note 3 of Notes to Consolidated and Combined Financial Statements.
Zep tests goodwill for impairment on an annual basis in the fiscal fourth quarter or sooner if events or changes in circumstances indicate that the carrying amount of goodwill may exceed its fair value. The goodwill impairment test has two steps. The first step identifies potential impairments by comparing the fair value of the reporting unit, Zep, with its carrying value, including goodwill. If the carrying value of a reporting unit exceeds the fair value, the second step of the test requires a calculation of possible impairment loss by comparing the implied fair value of goodwill with the carrying value. If the implied fair value of the goodwill is less than the carrying value, an impairment charge is recorded. If the calculated fair value of a reporting unit exceeds the carrying value, goodwill is not impaired and the second step is not necessary.
Zep’s market capitalization, market multiple and recent transaction values of peer companies, and projected discounted cash flows are considered each year when determining the Company’s fair value. Zep’s fair value exceeded its carrying value, including goodwill, in the fiscal year 2010 impairment analysis, and the second step of the impairment test was not required. Further, Zep has not historically had to perform the second step of this annual impairment test, and the Company has not previously been required to record an impairment charge to properly state the value of its goodwill.
Changes in the carrying amount of Goodwill during fiscal years 2009 and 2008 are summarized as follows:
| Balance as of August 31, 2008 |
$ | 32,034 | ||
| Currency translation adjustments |
(163 | ) | ||
| Balance as of August 31, 2009 |
$ | 31,871 | ||
| Acquisitions |
22,112 | |||
| Currency translation adjustments |
(219 | ) | ||
| Balance as of August 31, 2010 |
$ | 53,764 | ||
Zep’s identifiable intangible assets primarily include the customer relationships, patents and formulations acquired through the purchase of Amrep during Zep’s fiscal year 2010. Of the total $63.5 million purchase price exchanged for Amrep, a preliminary estimate of approximately $31.4 million was
53
Table of Contents
Index to Financial Statements
Zep Inc.
NOTES TO CONSOLIDATED AND COMBINED FINANCIAL STATEMENTS—(Continued)
(Dollar amounts in thousands, except share and per-share data and as indicated)
allocated to identifiable intangible assets. Amortization of intangible assets with finite lives is recognized over their estimated useful lives using an amortization method that reflects the pattern in which the economic benefits of the intangible assets are consumed or otherwise realized. The straight-line method is used for customer relationships. As a result of the negligible attrition rate in Zep’s customer base, the difference between the straight-line method and attrition methods is not considered significant. The estimated useful lives for the Company’s intangible assets range from 17 to 18 years. The Company determined acquired trademarks have an indefinite useful life.
Summarized information for the Company’s acquired intangible assets is as follows:
| August 31, 2010 | August 31, 2009 | |||||||||||||||
| Gross Carrying Amount |
Accumulated Amortization |
Gross Carrying Amount |
Accumulated Amortization |
|||||||||||||
| Definite-lived intangible assets: |
||||||||||||||||
| Customer relationships |
$ | 23,841 | $ | (1,114 | ) | $ | — | $ | 0 | |||||||
| Patents and formulations |
5,264 | (24 | ) | 84 | (21 | ) | ||||||||||
| Total |
$ | 29,105 | $ | (1,138 | ) | $ | 84 | $ | (21 | ) | ||||||
| Indefinite-lived intangible assets: |
||||||||||||||||
| Trademarks |
$ | 2,304 | — | $ | 6 | — | ||||||||||
| Total as of August 31, 2010 |
$ | 31,409 | $ | (1,138 | ) | $ | 90 | $ | (21 | ) | ||||||
The amortization expense associated with acquired definite-lived intangible assets established as of August 31, 2010 is expected to approximate $1.7 million during each of the next five years.
Other Long-Term Liabilities
Other long-term liabilities consist of the following:
| 2010 | 2009 | |||||||
| Deferred compensation and postretirement benefits(1) |
$ | 3,057 | $ | 2,902 | ||||
| Liabilities related to uncertain income tax positions(2) |
1,476 | 1,465 | ||||||
| Environmental remediation liabilities(3) |
12,067 | 2,700 | ||||||
| Restructuring related reserves(4) |
1,018 | 1,746 | ||||||
| Miscellaneous(5) |
1,511 | 1,733 | ||||||
| $ | 19,129 | $ | 10,546 | |||||
| (1) | Postretirement benefits—The Company adopted a non-qualified deferred compensation plan effective October 31, 2007 for the benefit of eligible employees. The deferred compensation plan administered by the Company provides for elective deferrals of an eligible employee’s compensation, which are matched with contributions from the Company as stipulated by the plan. In addition, the plan provides for an automatic contribution by the Company ranging from 3% to 5% of an eligible employee’s compensation. The majority of the activity associated with these programs is recorded through corresponding short-term liability accounts. See Note 7 of Notes to Consolidated and Combined Financial Statements for more information regarding this plan. |
| (2) | Liabilities related to uncertain income tax positions—The Company guidance pertaining to uncertain income tax positions effective September 1, 2007, and accordingly recognized a liability totaling $1.6 million. The amount is almost entirely offset by a corresponding receivable recorded within Other long-term assets pursuant to the terms of the tax disaffiliation agreement entered into between us and our former parent company. See Note 10 of Notes to Consolidated and Combined Financial Statements for more information regarding this pronouncement’s adoption. |
54
Table of Contents
Index to Financial Statements
Zep Inc.
NOTES TO CONSOLIDATED AND COMBINED FINANCIAL STATEMENTS—(Continued)
(Dollar amounts in thousands, except share and per-share data and as indicated)
| (3) | Environmental remediation liabilities—In May 2007, the Company recorded a $5.0 million pretax charge representing its best estimate of costs associated with a Company-initiated remediation plan addressing subsurface contamination identified at a manufacturing facility located in Atlanta, Georgia. Zep also maintains an $11.9 million liability representing its best estimate of costs associated with Amrep Inc.’s environmental remediation efforts. Amrep was acquired by Zep on January 4, 2010. The portion of this reserve related to amounts the Company expects to expend after fiscal year 2011 is classified within Other long-term liabilities. See Note 8 of Notes to Consolidated and Combined Financial Statements for more information regarding the Company’s environmental remediation efforts. |
| (4) | Restructuring related reserves—The Company established accruals for facility lease termination costs associated with its restructuring activities during fiscal years 2010 and 2009. The portion of these accruals associated with payments expected to occur subsequent to fiscal 2010 have been appropriately classified as long-term. See Note 9 of Notes to Consolidated and Combined Financial Statements for more information regarding the Company’s restructuring activities. |
| (5) | Miscellaneous—These amounts represent a number of liabilities that will be settled beyond fiscal 2011, the most substantial of which pertains to deferred rents associated with facility lease agreements containing escalating rent clauses. |
Shipping and Handling Fees and Costs
Zep includes shipping and handling fees billed to customers in Net Sales. Shipping and handling costs associated with inbound freight and freight between manufacturing facilities and distribution centers are generally recorded in Cost of Products Sold. Certain customer-related shipping and handling costs are included in Selling, Distribution, and Administrative Expenses, and those costs totaled $36.0 million, $31.5 million, and $38.6 million for the fiscal years ended August 31, 2010, 2009, and 2008 respectively.
Share-Based Compensation
The Company has adopted guidance governing the accounting for share-based compensation. This guidance requires that compensation cost relating to share-based payment transactions be recognized in financial statements and that this cost be measured based on the estimated fair value of the equity or liability instrument issued. These accounting rules also require that forfeitures be estimated over the vesting period of the instrument.
Share-based expense includes expense related to restricted stock and options issued, as well as share units deferred into the Company’s Director Deferred Compensation Plan and the Company’s Supplemental Deferred Savings Plan. Zep incurred $5.0 million, $3.8 million, and $4.4 million of share-based expense, which includes an estimate of forfeitures, for the fiscal years ended August 31, 2010, 2009, and 2008, respectively. Zep did not capitalize any expense related to share-based payments and has recorded share-based expense within Selling, Distribution, and Administrative Expenses. Equity awards having graded vesting provisions are accounted for on a straight-line basis. The majority of the share-based compensation expense generated through the administration of the Company’s award programs does not affect Zep’s overall cash position. Therefore, certain of these expenses have been reflected as other non-cash charges within the Company’s Consolidated and Combined Statements of Cash Flows. Share-based compensation accounting rules require that the benefit of tax deductions in excess of recognized compensation cost be reported as a financing cash flow, rather than as an operating cash flow as required under prior guidance. Excess tax benefits of $0.4 million were included in the financing activities of the Company’s Consolidated and Combined Statements of Cash Flows for the year ended August 31, 2010. See Note 7 of Notes to Consolidated and Combined Financial Statements for more information regarding the Company’s share-based incentive programs.
Depreciation
Property, Plant, and Equipment is stated at cost. For financial reporting purposes, depreciation is determined principally on a straight-line basis using estimated useful lives of plant and equipment
55
Table of Contents
Index to Financial Statements
Zep Inc.
NOTES TO CONSOLIDATED AND COMBINED FINANCIAL STATEMENTS—(Continued)
(Dollar amounts in thousands, except share and per-share data and as indicated)
(20 to 40 years for buildings and 5 to 12 years for machinery and equipment) while accelerated depreciation methods are used for income tax purposes. Depreciation expense totaled $9.1 million, $6.9 million, and $6.9 million for the years ended August 31, 2010, 2009, and 2008, respectively. Leasehold improvements are amortized over the life of the lease or the useful life of the improvement, whichever is shorter.
As of August 31, 2010, Prepayments and other current assets in the Company’s Consolidated Balance Sheets included $3.2 million of fixed assets classified as held-for-sale. In the fourth quarter of fiscal year 2010, the Company put up for sale Amrep’s Lancaster, Texas property as manufacturing activities at that location have been transferred to other Zep facilities. Further detail regarding this action is included within Note 9 of Notes to Consolidated and Combined Financial Statements.
Research and Development
Research and development costs, which are included in Selling, Distribution, and Administrative Expenses in the Company’s Consolidated and Combined Statements of Income, are expensed as incurred. Research and development expenses ranged between $1.5 million and $2.5 million during the three years ended August 31, 2010.
Advertising
Advertising costs are expensed as incurred and are included within Selling, Distribution, and Administrative Expenses in the Company’s Consolidated and Combined Statements of Income. These costs totaled $2.4 million, $2.4 million, and $1.9 million during the fiscal years ended August 31, 2010, 2009, and 2008, respectively.
Foreign Currency Translation
The functional currency for the foreign operations of Zep is the local currency. The translation of foreign currencies into United States dollars is performed for balance sheet accounts using exchange rates in effect at the balance sheet dates and for revenue and expense accounts using a weighted average exchange rate each month during the year. The gains or losses resulting from the translation are included in Comprehensive Income in the Consolidated and Combined Statements of Stockholders’ Equity and Comprehensive Income and are excluded from net income. Expense recognized in connection with transactions denominated in foreign currencies and included within Income before Provision for Income Taxes within Zep’s Consolidated and Combined Statements of Income totaled $0.2 million, $1.2 million, and $0.3 million for the years ended August 31, 2010, 2009, and 2008, respectively.
Interest Expense, Net
Interest expense, net, is composed primarily of interest expense on the Company’s variable-rate debt instruments, partially offset by interest income on cash and cash equivalents.
The following table summarizes the components of interest expense, net:
| Years Ended August 31, | ||||||||||||
| 2010 | 2009 | 2008 | ||||||||||
| Interest expense |
$ | 2,005 | $ | 1,791 | $ | 3,081 | ||||||
| Interest income |
(48 | ) | (138 | ) | (235 | ) | ||||||
| Interest expense, net |
$ | 1,957 | $ | 1,653 | $ | 2,846 | ||||||
56
Table of Contents
Index to Financial Statements
Zep Inc.
NOTES TO CONSOLIDATED AND COMBINED FINANCIAL STATEMENTS—(Continued)
(Dollar amounts in thousands, except share and per-share data and as indicated)
On July 15, 2010, the Company entered into a $320 million five-year senior, secured credit facility (the “2010 Credit Facility”) with a syndicate of lenders. The 2010 Credit Agreement replaced the Company’s prior revolving credit agreement, which it entered into on October 19, 2007, and its prior receivables financing agreement, which it entered into on October 14, 2009. In fiscal year 2010 the Company’s Consolidated and Combined Statements of Income reflect $0.4 million of previously capitalized debt issuance cost that were accelerated in connection with the replacement of the Company’s former debt facilities within Accelerated debt issuance cost on debt extinguishment. See Note 5 of Notes to Consolidated and Combined Financial Statements for more information regarding our debt.
Miscellaneous Expense (Income), Net
Miscellaneous expense (income), net, is composed primarily of gains or losses on foreign currency transactions.
Recently Adopted Accounting Standards
In June 2009, the Financial Accounting Standards Board (“FASB”) issued guidance that established a single source of authoritative U.S. GAAP recognized by the FASB to be applied by nongovernmental entities. SEC rules and interpretive releases are also sources of authoritative GAAP for SEC registrants. This guidance modifies the GAAP hierarchy to include only two levels of GAAP: authoritative and nonauthoritative, and is effective for financial statements issued for fiscal years ending after September 15, 2009 and interim periods within those fiscal years, and therefore became effective for us September 1, 2009. The adoption of this pronouncement did not impact our results of operations or financial condition.
In June 2008, the FASB issued authoritative guidance which provides that unvested share-based payment awards that contain nonforfeitable rights to dividends or dividend equivalents (whether paid or unpaid) are participating securities and shall be included in the computation of earnings per share pursuant to the two-class method. This guidance was effective for the Company on September 1, 2009 and requires all prior-period earnings per share data to be adjusted retrospectively. Certain of the Company’s equity awards are participating securities as defined by this guidance, and the Company has calculated earnings per share presented herein in accordance with the two-class method outlined within the new guidance. The adoption of this guidance is discussed further in Note 6 of Notes to Consolidated and Combined Financial Statements.
In March 2008, the FASB issued authoritative guidance requiring additional disclosures about the objectives, accounting treatment, and disclosure of derivative instruments and hedging activities. This guidance is effective for financial statements issued for fiscal years beginning after November 15, 2008 and interim periods within those fiscal years, and therefore became effective for us on September 1, 2009. The adoption of this guidance did not have a material impact on our results of operations or financial condition or related disclosures.
In December 2007, the FASB issued guidance pertaining to business combinations and requiring that all assets, liabilities, contingent consideration, contingencies and in-process research and development costs of an acquired business be recorded at fair value at the acquisition date; that acquisition costs generally be expensed as incurred; that restructuring costs generally be expensed in periods subsequent to the acquisition date; and that changes in accounting for deferred tax asset valuation
57
Table of Contents
Index to Financial Statements
Zep Inc.
NOTES TO CONSOLIDATED AND COMBINED FINANCIAL STATEMENTS—(Continued)
(Dollar amounts in thousands, except share and per-share data and as indicated)
allowances and acquired income tax uncertainties after the measurement period impact income tax expense. This guidance is effective for business combinations transacted subsequent to a company’s first annual reporting period beginning after December 15, 2008, and therefore became effective for us on September 1, 2009. The acquisition of Amrep was accounted for in accordance with purchase accounting rules, and requisite disclosure pursuant to those rules have been made in both the Consolidated and Combined Financial Statements and the accompanying notes thereto.
In September 2006, the FASB issued guidance that establishes a single authoritative definition of fair value, establishes a framework for measuring fair value, and expands disclosure requirements pertaining to fair value measurements. This guidance is effective for financial statements issued for fiscal years beginning after November 15, 2007 and interim periods within those fiscal years. Accordingly, we adopted this pronouncement effective September 1, 2008. The adoption did not impact our results of operations or financial condition. We have not applied the provisions of this guidance to non-financial assets, such as our property and equipment, goodwill and certain other assets, which are measured at fair value for impairment assessment. We will apply the provisions of this guidance to these assets and liabilities as required beginning September 1, 2010, and do not expect our results of operations or financial condition will be materially affected as a result of this adoption.
Note 3: Acquisitions
On January 4, 2010 (the “Closing Date”), Zep acquired Amrep, a specialty chemical formulator and packager focused in the automotive, fleet maintenance, industrial/MRO supply, institutional supply, and motorcycle markets. Amrep was acquired for an initial cash purchase price (the “Closing Purchase Price”) of approximately $64.4 million. In May 2010, Zep received a return of purchase price totaling $0.9 million pursuant to an agreement involving the final determination of Amrep’s Closing Date working capital. The return of cash effectively reduced the purchase price of Amrep to $63.5 million, and was offset against Goodwill within the Company’s Consolidated Balance Sheets. In August 2010, the Company established a liability of $0.2 million for a life insurance-related obligation of Amrep’s that was generated prior to the Closing Date but that did not become known until after the acquisition. The liability effectively increased Goodwill by that same amount. Zep believes the acquisition of Amrep to be an important strategic step in the Company’s efforts to utilize distribution to expand its presence in a number of end markets while minimizing channel conflict through the manufacture of both private branded products and national brands. Borrowings of $49.4 million and $15.0 million were drawn from the Company’s revolving credit facility and receivables facility (each are discussed further in Note 5 of Notes to Consolidated and Combined Financial Statements), respectively, in order to finance the initial Closing Purchase Price.
The operating results of Amrep have been included in the Company’s consolidated financial statements commencing as of the Closing Date. Management continues to gather additional information about the fair value of Amrep’s acquired assets and liabilities. Accordingly, the allocation of the purchase price presented herein, including amounts recorded as goodwill and intangible assets is preliminary. As discussed in Note 13 of Notes to Consolidated and Combined Financial Statements, on September 15, 2010, Zep filed income tax returns for Amrep’s 2009 tax year. The filing of these tax returns concurrently generated a tax payable whose amount was determinable based upon the amended terms of the purchase agreement, and that is due from Zep to Amrep’s former owners. The amount of the payable, which is approximately $0.5 million, was not known until September 2010. The final allocation
58
Table of Contents
Index to Financial Statements
Zep Inc.
NOTES TO CONSOLIDATED AND COMBINED FINANCIAL STATEMENTS—(Continued)
(Dollar amounts in thousands, except share and per-share data and as indicated)
of the Closing Purchase Price will include this first quarter fiscal year 2011 event, and may include other adjustment as this process is finalized. A summary of the preliminary purchase price allocation as of August 31, 2010 inclusive of the aforementioned final $0.9 million working capital settlement, and $0.2 million adjustment to Goodwill due to the aforementioned life insurance obligation is as follows:
| Cash and cash equivalents |
$ | 21 | ||
| Inventory |
16,552 | |||
| Other current assets |
10,049 | |||
| Property, plant and equipment |
16,528 | |||
| Net deferred tax liabilities |
(7,928 | ) | ||
| Accrued environmental remediation costs |
(12,200 | ) | ||
| Other liabilities assumed |
(13,032 | ) | ||
| Total net tangible assets: |
$ | 9,990 | ||
| Identifiable intangible assets |
||||
| Customer relationships |
23,841 | |||
| Patents and formulations |
5,264 | |||
| Trademarks |
2,304 | |||
| Goodwill |
22,112 | |||
| Total preliminary estimated purchase price allocation |
$ | 63,511 | ||
Of the total purchase price, a preliminary estimate of approximately $31.4 million has been allocated to identifiable intangible assets. The value allocated to customer relationships will be amortized on a straight-line basis over a period of 18 years. The value allocated to patents and technology will be amortized on a straight-line basis over a period of 17 years. The Company determined acquired trademarks have an indefinite useful life.
Net sales reflected in the Consolidated and Combined Statements of Income for the three and twelve months ended August 31, 2010 include $29.7 million and $76.7 million, respectively, of sales generated by Amrep subsequent to the acquisition. Income before Provision for Income Taxes reflected in the Consolidated and Combined Statements of Income for the three and twelve months ended August 31, 2010 includes $1.8 million and $4.2 million, respectively, of earnings generated by Amrep subsequent to the acquisition. All costs associated with advisory, legal and other due diligence-related services consumed in connection with acquisition-related activity have been expensed as incurred in accordance with purchase accounting rules. These costs are disclosed as Acquisition Costs within our Consolidated and Combined Statements of Income.
59
Table of Contents
Index to Financial Statements
Zep Inc.
NOTES TO CONSOLIDATED AND COMBINED FINANCIAL STATEMENTS—(Continued)
(Dollar amounts in thousands, except share and per-share data and as indicated)
The following unaudited pro forma combined results of operations give effect to the acquisition of Amrep as if it had occurred at the beginning of the periods presented. The unaudited pro forma combined results of operations are provided for informational purposes only and do not purport to represent Zep’s actual consolidated results of operations or consolidated financial position had the acquisition occurred on the dates assumed, nor are these financial statements necessarily indicative of Zep’s future consolidated results of operations or consolidated financial position. Zep expects to incur costs and realize benefits associated with integrating the operations of Zep and Amrep. The unaudited pro forma combined results of operations do not reflect the costs of any integration activities, nonrecurring charges directly attributable to purchase accounting, or any benefits that may result from operating efficiencies or revenue synergies.
| Pro Forma Results of Operations |
Three Months Ended August 31, |
Years Ended August 31, |
||||||||||||||
| 2010 | 2009 | 2010 | 2009 | |||||||||||||
| Net Sales |
$ | 161,370 | $ | 161,876 | $ | 603,448 | $ | 606,438 | ||||||||
| Net Income |
$ | 2,112 | $ | 7,328 | $ | 15,633 | $ | 3,523 | ||||||||
| Basic Earnings per Share |
$ | 0.10 | $ | 0.17 | $ | 0.73 | $ | 0.35 | ||||||||
| Diluted Earnings per Share |
$ | 0.09 | $ | 0.17 | $ | 0.72 | $ | 0.34 | ||||||||
The unaudited pro forma results for the year ended August 31, 2009 include pre-tax charges totaling $10.6 million recorded by Amrep in connection with environmental remediation efforts. A discussion of environmental remediation-related liabilities assumed in the transaction is provided within Note 8 of the Notes to Consolidated Financial Statements.
Note 4: Employee Benefit Plans
Zep maintains a qualified defined contribution plan to which both employees and the Company make contributions. The cost to Zep for this plan during the years ended August 31, 2010, 2009, and 2008 was $1.8 million, $1.2 million and $2.7 million, respectively. Employer matching amounts are allocated in accordance with plan participants’ elective deferral investments. We instituted a temporary suspension of our match of employee contributions into our defined contribution plans during the second quarter of fiscal year 2009. We restored one-half of the employer match component of our defined contribution plans during the fourth quarter of fiscal year 2009; full reinstatement of the employer matching contribution benefit occurred beginning in January 2010. Plan participants may invest a percentage of their contributions into a Zep common stock fund. At August 31, 2010, assets of the Company’s defined contribution plan included shares of Zep common stock with a market value of approximately $2.7 million, which represented approximately 2.1% of the total fair market value of the assets in Zep’s defined contribution plan on that date.
Zep also maintains a non-qualified deferred compensation plan for the benefit of eligible employees. The deferred compensation plan administered by the Company provides for elective deferrals of an eligible employee’s compensation, which are matched with contributions from the Company as stipulated by the plan. In addition, the plan provides for an automatic supplemental contribution by the Company ranging from 3% to 5% of an eligible employee’s compensation, unless otherwise determined by the Board of Directors. The employer matching and supplemental contribution components of this plan were also suspended during the second quarter of fiscal year 2009, and these components were reinstated during October 2009. See Note 7 of Notes to Consolidated and Combined Financial Statements for more information regarding this plan.
60
Table of Contents
Index to Financial Statements
Zep Inc.
NOTES TO CONSOLIDATED AND COMBINED FINANCIAL STATEMENTS—(Continued)
(Dollar amounts in thousands, except share and per-share data and as indicated)
Note 5: Debt Obligations
The Company’s indebtedness and credit arrangements consisted of the following at the end of our two most recent fiscal years:
| August 31, 2010 | August 31, 2009 | |||||||
| Short-term borrowings: |
||||||||
| Revolving credit facility |
$ | 7,500 | $ | 12,000 | ||||
| Term loan borrowings |
7,500 | — | ||||||
| 15,000 | 12,000 | |||||||
| Long-term borrowings: |
||||||||
| Term loan |
$ | 75,000 | $ | — | ||||
| Industrial revenue bonds |
7,150 | 7,150 | ||||||
| Revolving credit facility |
10,000 | 33,500 | ||||||
| 92,150 | 40,650 | |||||||
| Less: Current maturities of long-term debt |
15,000 | 12,000 | ||||||
| $ | 77,150 | $ | 28,650 | |||||
Future maturities of our outstanding debt obligations are as follows for fiscal years ending August 31:
| Amount | ||||
| 2011 |
$ | 17,500 | ||
| 2012 |
7,500 | |||
| 2013 |
11,250 | |||
| 2014 |
11,250 | |||
| 2015 |
37,500 | |||
| Thereafter |
7,150 | |||
| $ | 92,150 | |||
Further detail regarding each of the above mentioned debt instruments, including amounts outstanding under each as of August 31, 2010, is provided below. On July 15, 2010, the Company entered into a $320 million five-year senior, secured credit facility (the “2010 Credit Facility”) with a syndicate of lenders. The 2010 Credit Facility is comprised of a revolving loan facility that provides for advances in the initial aggregate principal amount of up to $245 million and a term loan in the initial aggregate principal amount of $75 million. The Company may, at its option and subject to customary conditions, request an increase in the aggregate principal amount available under the 2010 Credit Facility by an additional $30 million. Borrowings under the 2010 Credit Facility are secured by a lien on substantially all of the Company’s and the Company’s domestic subsidiaries’ owned real and personal property. The 2010 Credit Facility will mature on July 15, 2015, at which time all amounts outstanding thereunder will be due and payable. The Company is required to make quarterly payments with respect to the principal amount of the term loan, beginning on November 30, 2010.
The 2010 Credit Agreement replaced the Company’s prior revolving credit agreement, which it entered into on October 19, 2007, and its prior receivables financing agreement, which it entered into on October 14, 2009. In connection with the termination of the prior financing arrangements, the Company
61
Table of Contents
Index to Financial Statements
Zep Inc.
NOTES TO CONSOLIDATED AND COMBINED FINANCIAL STATEMENTS—(Continued)
(Dollar amounts in thousands, except share and per-share data and as indicated)
borrowed approximately $97 million under the 2010 Credit Facility to repay all outstanding indebtedness under the prior agreements. The Company incurred a non-cash charge of $0.4 million associated with the write-off of the unamortized deferred financing costs upon the termination of the prior financing arrangements.
Amounts outstanding under the 2010 Credit Facility bear interest at an “Alternate Base Rate” or a “Eurocurrency Rate”. Alternate Base Rate loans bear interest at a rate per annum equal to the sum of (i) the greater of (A) JPMorgan Chase Bank’s prime rate, (B) the weighted average of the rates on overnight federal funds transactions with members of the Federal Reserve System plus 0.5% or (C) the Adjusted LIBO Rate (as defined below) for a one month interest period plus 1% (the “Alternate Base Rate”), and (ii) an applicable margin that ranges from 1.25% to 2.50% based on our leverage ratio. Eurocurrency Rate advances outstanding bear interest at a rate based upon the London interbank offered rate for the interest period multiplied by a statutory reserve rate, plus an applicable margin that ranges from 2.25% to 3.50% based upon the Company’s leverage ratio (plus any mandatory costs) (the “Adjusted LIBO Rate”).
Zep is required to pay certain fees in connection with the 2010 Credit Facility. For example, the Company must pay an annual commitment fee. This fee is payable quarterly in arrears and is determined by our leverage ratio as defined in the 2010 Credit Facility. This facility fee ranges from 0.4% to 0.5% of the unused portion of the $320 million commitment of the lenders under the 2010 Credit Facility. Additionally, the Company is also required to pay certain fees to the Administrative Agent for administrative services. Facility and commitment fees paid by Zep during fiscal 2010 under the 2010 Credit Facility and its predecessor facilities totaled $0.4 million.
The 2010 Credit Facility contains customary covenants and default provisions, including, but not limited to, financial covenants, limitations on liens and the incurrence of debt, covenants to preserve corporate existence and comply with laws and covenants regarding the use of loans made pursuant to the 2010 Credit Facility. The financial covenants include a maximum leverage ratio, which is the ratio of total indebtedness to EBITDA (earnings before interest, taxes, depreciation and amortization expense), of 3.75 to 1.0, and a minimum fixed charge coverage ratio, which is the ratio of EBITDA (minus certain items) to fixed charges, of 1.25 to 1.0.
As of August 31, 2010, $2.5 million of the total $10.0 million in borrowings made under the 2010 Credit Facility have been reflected within Long-term debt, less current maturities on our Consolidated Balance Sheets given our current intent and ability to settle $2.5 million of those borrowings in periods subsequent to August 31, 2011. Under the terms of the 2010 Credit Facility, the Company may refinance all amounts borrowed under its 2010 Credit Facility until 2015. Therefore, the short- and long-term classification of debt on our Consolidated Balance Sheets may fluctuate not only in response to repayment of those amounts, but also concurrent with changes in the Company’s projected cash flow for the 12-month period subsequent to the balance sheet date. The base interest rate associated with borrowings made under the 2010 Credit Facility and its predecessor facility approximated 0.2% during the fiscal year 2010. As of August 31, 2010 we had additional borrowing capacity under the 2010 Credit Facility of $223.5 million, which represents the full amount of the 2010 Credit Facility less the aforementioned borrowings, amounts drawn under the term loan portion of that facility and outstanding letters of credit totaling $11.5 million that have been issued under the 2010 Credit Facility.
62
Table of Contents
Index to Financial Statements
Zep Inc.
NOTES TO CONSOLIDATED AND COMBINED FINANCIAL STATEMENTS—(Continued)
(Dollar amounts in thousands, except share and per-share data and as indicated)
Industrial Revenue Bonds
The industrial revenue bonds due 2018 were issued by the City of DeSoto Industrial Development Authority, Inc. in May 1991 in connection with the construction of Zep’s facility in DeSoto, Texas. Pursuant to a loan agreement between the Company and the DeSoto Industrial Development Authority, the Company is required to pay the principal and interest on the bonds. The bonds currently bear interest at a weekly rate. The interest rate during the twelve months ended August 31, 2010 and August 31, 2009 averaged 0.4% and 1.3%, respectively. The outstanding principal amount of the bonds is payable upon their maturity in 2018. The payment of principal and interest on the bonds is secured by an irrevocable letter of credit issued by Wachovia Bank, National Association.
Letters of Credit
The Company has issued outstanding letters of credit totaling $11.5 million primarily for the purpose of providing credit support for its industrial revenue bonds, securing collateral requirements under its casualty insurance programs as well as supporting certain environmental obligations. These letters of credit were issued under the 2010 Credit Facility as of August 31, 2010, thereby reducing the total availability under the facility by such amount.
Note 6: Common Stock and Related Matters
Acuity Brands’ Equity Investment
Upon completion of the Distribution on October 31, 2007, Zep became an independent company owned by the Acuity Brands’ shareholders of record as of October 17, 2007. Prior to October 31, 2007, Zep and the subsidiaries comprising the specialty products chemical business were wholly-owned by Acuity Brands. Therefore, prior to October 31, 2007, stockholders’ equity was comprised of Acuity Brands’ investment in these subsidiaries. Beginning on the Distribution Date, stockholders’ equity reflects the outstanding stock, paid-in capital, and other stockholders’ equity items of Zep and its wholly owned subsidiaries.
Common and Preferred Stock
Zep has 500 million shares of common stock, par value $0.01 per share, and 50 million shares of preferred stock (“Preferred Stock”), authorized as of August 31, 2010. No shares of preferred stock were issued as of that date.
Stockholder Protection Rights Agreement
Zep’s Board of Directors adopted a Stockholder Protection Rights Agreement (the “Rights Agreement”) effective October 30, 2007. The Rights Agreement contains provisions that are intended to protect our stockholders in the event of an unsolicited offer to acquire the Company, including offers that do not treat all stockholders equally and other coercive, unfair, or inadequate takeover bids and practices that could impair the ability of the Company’s Board of Directors to fully represent stockholders’ interests. Pursuant to the Rights Agreement, our Board of Directors declared a dividend of one “Right” for each outstanding share of the Company’s common stock as of October 30, 2007. The Rights will be represented by, and trade together with, the Company’s common stock until and unless certain events occur, including the acquisition of in excess of 15% of the Company’s common stock by a person or
63
Table of Contents
Index to Financial Statements
Zep Inc.
NOTES TO CONSOLIDATED AND COMBINED FINANCIAL STATEMENTS—(Continued)
(Dollar amounts in thousands, except share and per-share data and as indicated)
group of affiliated or associated persons (with certain exceptions, “Acquiring Persons”); provided, however, that the Company’s Board of Directors, at its sole discretion, may grant its prior consent to a person or group of affiliated or associated persons to acquire more than 15% of the Company’s outstanding common stock, subject to any conditions the Board may impose, without such acquisition triggering the Rights Agreement. Unless previously redeemed by the Company’s Board of Directors, upon the occurrence of one of the specified triggering events, each Right that is not held by an Acquiring Person will entitle its holder to purchase one share of common stock or, under certain circumstances, additional shares of common stock at a discounted price. The Rights will cause substantial dilution to a person or group that attempts to acquire the Company on terms not approved by the Company’s Board of Directors. Thus, the Rights are intended to encourage persons who may seek to acquire control of the Company to initiate such an acquisition through negotiation with the Board of Directors.
Earnings per Share
On September 1, 2009, the Company retrospectively adopted an accounting pronouncement which provides that unvested share-based payment awards that contain nonforfeitable rights to dividends or dividend equivalents (whether paid or unpaid) are participating securities and should be included in the computation of earnings per share. The application of this guidance to each of the basic and diluted earnings per share computations for the two years ended August 31, 2010 effectively reduced those computations by $0.01. The application of this guidance to each of the basic and diluted earnings per share computations for the year ended August 31, 2008 effectively reduced those computations by $0.02.
Basic earnings per share is computed by dividing net income adjusted for presumed dividend payments on unvested shares by the weighted average number of common shares outstanding during the period. Unvested shares of restricted stock are excluded from basic shares outstanding. Diluted earnings per share is computed similarly, but reflects the potential dilution that would occur if dilutive options were exercised and restricted stock awards were vested.
On October 31, 2007, the separation from Acuity Brands was completed in a tax-free distribution to its stockholders of one share of our common stock for every two shares of Acuity Brands’ common stock held as of the record date. Prior to this date, all outstanding shares of Zep were owned by Acuity Brands. Accordingly, for periods prior to October 31, 2007, basic and diluted earnings per share have been computed using the number of shares of Zep common stock outstanding on October 31, 2007, the date on which the Zep common stock was distributed by Acuity Brands to its stockholders.
64
Table of Contents
Index to Financial Statements
Zep Inc.
NOTES TO CONSOLIDATED AND COMBINED FINANCIAL STATEMENTS—(Continued)
(Dollar amounts in thousands, except share and per-share data and as indicated)
The following table reflects basic and diluted earnings per common share for the three years ended August 31, 2010:
| Years Ended August 31, | ||||||||||||
| 2010 | 2009 | 2008 | ||||||||||
| Basic earnings per share: |
||||||||||||
| Net income |
$ | 13,504 | $ | 9,260 | $ | 16,322 | ||||||
| Less: Allocation of earnings and dividends to participating securities |
(282 | ) | (216 | ) | (476 | ) | ||||||
| Net income available to common shareholders—basic |
$ | 13,222 | $ | 9,044 | $ | 15,846 | ||||||
| Basic weighted average shares outstanding |
21,271 | 21,057 | 20,862 | |||||||||
| Basic earnings per share |
$ | 0.62 | $ | 0.43 | $ | 0.76 | ||||||
| Diluted earnings per share: |
||||||||||||
| Net income available to common shareholders—basic |
$ | 13,222 | $ | 9,044 | $ | 15,846 | ||||||
| Add: Undistributed earnings reallocated to unvested shareholders |
3 | 1 | 3 | |||||||||
| Net income available to common shareholders—diluted |
$ | 13,225 | $ | 9,045 | $ | 15,849 | ||||||
| Basic weighted average shares outstanding |
21,271 | 21,057 | 20,862 | |||||||||
| Common stock equivalents (stock options and restricted stock) |
467 | 233 | 390 | |||||||||
| Diluted weighted average shares outstanding |
21,738 | 21,290 | 21,252 | |||||||||
| Diluted earnings per share |
$ | 0.61 | $ | 0.42 | $ | 0.75 | ||||||
For the year ended August 31, 2008, we excluded from our earnings per share calculation less than 0.1 million common stock equivalents because their effect was anti-dilutive. For the years ended August 31, 2010 and 2009, we excluded from our earnings per share calculation 0.4 million and 0.7 million common stock equivalents, respectively, because their effect was anti-dilutive.
Note 7: Share-Based Incentive Programs
2010 Omnibus Incentive Plan.
On January 7, 2010, the Company’s shareholders approved the Zep Inc. 2010 Omnibus Incentive Plan (the “2010 Incentive Plan”), under which 4,300,000 shares of Common Stock are reserved for issuance. The number of shares available for issuance under the 2010 Incentive Plan is reduced on a share-for-share basis by the number of shares reserved for issuance with respect to stock options, stock appreciation rights, restricted stock awards, performance share awards and stock unit awards that were issued under the 2007 LTIP (as defined below). The 2010 Incentive Plan provides specific limitations on the size of grants that any one participant in the 2010 Incentive Plan may receive. Pursuant to the 2010 Incentive Plan, the Compensation Committee (the “Committee”) of the Company’s Board of Directors is authorized to issue awards consisting of stock options, stock appreciation rights, restricted stock and/or restricted unit awards, performance stock and/or unit awards and cash-based awards to eligible employees, non-employee directors and outside consultants.
Stock options granted under the 2010 Incentive Plan may be either non-qualified stock options or incentive stock options. The exercise price of stock options may not be less than the fair market value of
65
Table of Contents
Index to Financial Statements
Zep Inc.
NOTES TO CONSOLIDATED AND COMBINED FINANCIAL STATEMENTS—(Continued)
(Dollar amounts in thousands, except share and per-share data and as indicated)
the common stock on the date of grant. Generally, all options granted under the 2010 Incentive Plan have terms of ten years. Options granted by the Committee in fiscal 2010 generally vest over four years. Vested options held by terminated employees allow for exercise periods of three months following termination. Restricted stock and/or units granted under the 2010 Incentive Plan generally vest proportionately over four years. The fair value of restricted stock awards is measured based on their date of grant fair market value, and the related compensation expense is recognized over a requisite service period equal to the awards’ vesting period. Performance-based restricted stock and/or units granted under the 2010 Incentive Plan become vested upon the attainment of a stock appreciation target and a specific vesting date. The fair value of Zep’s performance awards is determined using Monte-Carlo simulation valuation model that is able to accommodate stock price appreciation and other provisions of our performance awards. At August 31, 2010, 1.8 million options to purchase shares of Zep common stock, 0.5 million restricted stock awards and units, and 0.1 million performance-based restricted stock awards and units were outstanding under the 2010 Incentive Plan, including those that were previously issued and outstanding under the 2007 LTIP.
The 2010 Incentive Plan replaced the Zep Inc. Long-Term Incentive Plan (the “2007 LTIP”), which was established on October 31, 2007, in connection with the spin-off and which is described in more detail below. The 2007 LTIP was terminated as of the date the stockholders approved the 2010 Incentive Plan, except that such termination did not affect any grants or awards outstanding under the 2007 LTIP or prior plans. Shares previously reserved for issuance under the 2007 LTIP that remained available for grants under the 2007 LTIP and any shares subject to awards under the 2007 LTIP that subsequently are forfeited, cancelled or expire unexercised are available for issuance under the 2010 Incentive Plan.
A total of 1.4 million shares were available for grant under the 2010 Incentive Plan at August 31, 2010. Forfeited shares and shares that are exchanged to pay taxes due upon exercise of stock options or the release of awards are returned to the pool of shares available for grant.
2007 Long-Term Incentive Plan
The 2007 LTIP was replaced by the 2010 Incentive Plan described above. The 2007 LTIP permitted the Company to grant incentive stock options, nonqualified stock options, stock appreciation rights, restricted stock, restricted stock units, performance units and performance shares to key personnel and directors. Generally, stock options awarded pursuant to the 2007 LTIP were issued with exercise prices equal to the fair market value of the Company’s common stock on the date of the grant, vested proportionately over a four-year period, and were exercisable for ten years from the grant date. Restricted shares of Zep’s common stock awarded under the 2007 LTIP generally vested proportionally over a four-year period. The fair value of restricted stock awards was measured based on their date of grant fair market value, and the related compensation expense was recognized over a requisite service period equal to the award’s vesting period.
Restricted Stock Awards
The majority of restricted stock awards issued to employees under the 2010 Incentive Plan, including those issued under the 2007 LTIP and upon conversion of pre-spin equity awards, vest over a four-year period. Restricted stock awards issued to our non-employee directors vest over a three-year period. The fair value of restricted stock at the date of grant is equal to the closing stock price on that date.
66
Table of Contents
Index to Financial Statements
Zep Inc.
NOTES TO CONSOLIDATED AND COMBINED FINANCIAL STATEMENTS—(Continued)
(Dollar amounts in thousands, except share and per-share data and as indicated)
Restricted stock transactions during the years ended August 31, 2008, 2009 and 2010 can be summarized as follows:
| Number of Shares (in thousands) |
Weighted Average Grant Date Fair Value |
|||||||
| Outstanding at August 31, 2007 |
121 | $ | 34.13 | |||||
| Granted |
465 | $ | 12.71 | |||||
| Vested |
(61 | ) | $ | 9.92 | ||||
| Forfeited |
(15 | ) | $ | 13.32 | ||||
| Outstanding at August 31, 2008 |
510 | $ | 12.85 | |||||
| Granted |
112 | $ | 17.25 | |||||
| Vested |
(146 | ) | $ | 12.84 | ||||
| Forfeited |
(46 | ) | $ | 13.07 | ||||
| Outstanding at August 31, 2009 |
430 | $ | 14.42 | |||||
| Granted |
113 | $ | 17.39 | |||||
| Vested |
(163 | ) | $ | 14.14 | ||||
| Forfeited |
(20 | ) | $ | 16.63 | ||||
| Outstanding at August 31, 2010 |
360 | $ | 15.38 | |||||
As of August 31, 2010, there was $3.7 million of total unrecognized compensation cost related to unvested restricted stock of Zep employees. That cost is expected to be recognized over a weighted-average period of two years. The total fair value of shares vested during the years ended August 31, 2010, 2009, and 2008, was approximately $3.2 million, $2.4 million and $2.4 million, respectively.
Performance Stock Awards
The performance-based stock awards (the “Performance Stock”) issued to employees under the 2010 Incentive Plan generally vest upon the achievement of stock price targets (each a “Stock Appreciation Target”) and target dates (each a “Target Date”), in each case as specified at the time of the award. The Stock Appreciation Targets may be met at any time during a period, generally four years, beginning on the grant date and ending on the last Target Date. If, upon the final Target Date, some or all of the Stock Appreciation Targets have not been achieved, the then unvested shares of Performance Stock will become fully vested as of the final Target Date if our stock price over the period following the grant date equals or exceeds the return an index or peer group specified at the time of the award over the same period. Any shares of Performance Stock not otherwise vested on the last Target Date will be forfeited. Upon the achievement of each Stock Appreciation Target, the recipient of the award will be entitled to receive dividends or similar distributions on, and be entitled to vote, the shares of common stock underlying the corresponding Performance Stock.
Generally, achievement of a particular Stock Appreciation Target occurs when the average closing price of our common stock on the New York Stock Exchange for 20 consecutive trading days, on a rolling basis, is equal to or exceeds the particular Stock Appreciation Target. If a Stock Appreciation Target is achieved prior to the corresponding Target Date, then that Stock Appreciation Target will be considered
67
Table of Contents
Index to Financial Statements
Zep Inc.
NOTES TO CONSOLIDATED AND COMBINED FINANCIAL STATEMENTS—(Continued)
(Dollar amounts in thousands, except share and per-share data and as indicated)
to have been met, regardless of changes in the price of a share of our common stock that occurs later. The fair value of a Performance Stock award at the date of grant is derived using a Monte-Carlo simulation model. The Company first granted Performance Stock awards on September 1, 2009 with respect to fiscal 2010. Performance Stock transactions during the year ended August 31, 2010 can be summarized as follows:
| Number of Shares (in thousands) |
Weighted Average Grant Date Fair Value |
|||||||
| Outstanding at August 31, 2009 |
— | $ | — | |||||
| Granted |
96 | 13.09 | ||||||
| Vested |
— | — | ||||||
| Forfeited |
(2 | ) | 13.82 | |||||
| Outstanding at August 31, 2010 |
94 | $ | 13.47 | |||||
As of August 31, 2010, there was $0.5 million of total unrecognized compensation cost related to unvested Performance Stock awards. That cost is expected to be recognized over a weighted-average period of three years.
The following weighted average assumptions were used to estimate the fair value Performance Stock awards (“PSA’s”) issued by the Company in fiscal years ended August 31:
| 2010 | ||||
| Dividend yield |
1.1 | % | ||
| Expected volatility |
43.68 | % | ||
| Risk-free interest rate |
1.98 | % | ||
| Weighted-average fair value of PSA’s granted in Tranche 1 |
$ | 13.61 | ||
| Weighted-average fair value of PSA’s granted in Tranche 2 |
$ | 13.17 | ||
| Weighted-average fair value of PSA’s granted in Tranche 3 |
$ | 12.82 | ||
| Weighted-average fair value of PSA’s granted in Tranche 4 |
$ | 12.43 | ||
Stock Options
The fair value of each option is estimated on the date of grant using the Black-Scholes model. The dividend yield was calculated based on annual dividends paid and the trailing historical average closing stock price at the time of grant. For awards issued prior to the spin-off, expected volatility was based on historical volatility of the Acuity Brands’ stock over the preceding number of years equal to the expected life of the options. Expected volatility for awards issued under Zep’s long-term incentive programs has been based on the volatilities of well-established guideline companies as well as our own historical volatility. We have begun phasing out the use of guideline companies as a determinant for volatility as the Company’s own trading history is established and becomes a more appropriate measure for expected volatility. The Company bases our risk-free rate on the United States Treasury yield for a term equal to the expected life of the options at the time of grant. The Company has used historical exercise behavior data to determine the expected life of options. All inputs into the Black-Scholes model are estimates made at the time of grant. Actual realized value of each option grant could materially differ from these estimates, though without impact to future reported net income.
68
Table of Contents
Index to Financial Statements
Zep Inc.
NOTES TO CONSOLIDATED AND COMBINED FINANCIAL STATEMENTS—(Continued)
(Dollar amounts in thousands, except share and per-share data and as indicated)
The following weighted average assumptions were used to estimate the fair value of stock options awarded by the Company in fiscal years ended August 31:
| 2010 | 2009 | 2008 | ||||||||||
| Dividend yield |
1.1 | % | 1.0 | % | 1.2 | % | ||||||
| Expected volatility |
40.9 | % | 33.2 | % | 31.0 | % | ||||||
| Risk-free interest rate |
2.3 | % | 3.1 | % | 3.8 | % | ||||||
| Expected life of options |
5 years | 5 years | 5 years | |||||||||
| Weighted-average fair value of options granted |
$ | 5.35 | $ | 5.43 | $ | 3.77 | ||||||
Stock option transactions during the years ended August 31, 2008, 2009, and 2010 can be summarized as follows:
| Outstanding (share data in thousands) |
Exercisable (share data in thousands) |
|||||||||||||||
| Number of Shares |
Weighted Average Exercise Price |
Number of Shares |
Weighted Average Exercise Price |
|||||||||||||
| Outstanding at August 31, 2007 |
69 | $ | 23.36 | 69 | $ | 23.36 | ||||||||||
| Acuity Brands, Inc. options converted at the spin-off |
314 | $ | 9.11 | |||||||||||||
| Granted |
1,058 | $ | 12.54 | |||||||||||||
| Exercised |
(23 | ) | $ | 9.33 | ||||||||||||
| Forfeited |
(7 | ) | $ | 12.52 | ||||||||||||
| Outstanding at August 31, 2008 |
1,411 | $ | 11.66 | 234 | $ | 8.71 | ||||||||||
| Granted |
410 | $ | 17.52 | |||||||||||||
| Exercised |
(44 | ) | $ | 10.07 | ||||||||||||
| Forfeited |
(268 | ) | $ | 13.41 | ||||||||||||
| Outstanding at August 31, 2009 |
1,509 | $ | 12.99 | 539 | $ | 10.44 | ||||||||||
| Granted |
330 | $ | 15.18 | |||||||||||||
| Exercised |
(50 | ) | $ | 9.32 | ||||||||||||
| Forfeited |
(31 | ) | $ | 14.45 | ||||||||||||
| Outstanding at August 31, 2010 |
1,758 | $ | 13.48 | 782 | $ | 11.87 | ||||||||||
| Range of option exercise prices through August 31, 2010: |
||||||||||||||||
| $ 4.00 – $10.00 (average life – 4.6 years) |
295 | $ | 9.39 | 295 | $ | 9.39 | ||||||||||
| $10.00 – $15.00 (average life – 7.4 years) |
784 | $ | 12.48 | 397 | $ | 12.45 | ||||||||||
| $15.00 – $20.00 (average life – 8.5 years) |
672 | $ | 16.33 | 90 | $ | 17.48 | ||||||||||
| $20.00 – $22.00 (average life – 9.4 years) |
7 | $ | 21.93 | — | $ | — | ||||||||||
The total intrinsic value of options exercised during the years ended August 31, 2010, 2009, and 2008 was $0.5 million, $0.2 million and $0.2 million, respectively. The total intrinsic value of options outstanding, expected to vest, and exercisable as of August 31, 2010 was $6.9 million, $6.7 million, and $4.3 million, respectively. As of August 31, 2010, there was $2.8 million of total unrecognized compensation cost related to unvested options, which is expected to be recognized over a weighted-average period of approximately two years. The weighted-average remaining contractual terms of options outstanding and currently exercisable as of August 31, 2010 were approximately seven years and six years, respectively.
69
Table of Contents
Index to Financial Statements
Zep Inc.
NOTES TO CONSOLIDATED AND COMBINED FINANCIAL STATEMENTS—(Continued)
(Dollar amounts in thousands, except share and per-share data and as indicated)
Share Units
In fiscal year 2008, the Company adopted the Zep Inc. Nonemployee Director Deferred Compensation Plan. The Company requires its Directors to defer at least 50% of their annual retainer into this program, and our Directors may defer additional amounts at their election. Under this plan, share deferrals are valued at fair market value at the date of deferral. Of the 300,000 shares reserved for issuance under this plan, approximately 2,460 have been issued. As of August 31, 2010, approximately 42,000 share units were accounted for in this plan.
The Company also maintains a non-qualified deferred compensation program that was adopted in fiscal year 2008—the Zep Inc. Supplemental Deferred Savings Plan. This program provides for elective deferrals of an eligible employee’s compensation. These deferrals may be matched with contributions from the Company as stipulated by the plan. In addition, when participants defer a minimum of 1% of base salary, the plan provides for a supplemental contribution by the Company ranging from 0% to 5% of an eligible employee’s compensation, unless otherwise determined by the Board of Directors. The employer-matching and supplemental-contribution components of this plan were suspended during the second quarter of fiscal year 2009 and reinstated during October 2009. Share unit deferrals resulting from the match and supplemental contributions provided by the Company are valued at their fair market value at the date of deferral and are ultimately distributed to plan participants in stock. Associates may also elect to defer salary and/or bonus into the share units. Of the 400,000 shares of the Company’s common stock reserved under the plan, approximately 3,900 have been issued. As of August 31, 2010 approximately 35,000 fully vested share units were accounted for in this plan.
Employee Stock Purchase Plan
In fiscal year 2008, the Company adopted the Zep Inc. Employee Stock Purchase Plan for the benefit of eligible employees. Under the plan, employees are able to purchase the Company’s common stock at a 5% discount on a monthly basis. Discounts received under this plan are not compensatory. Of the 200,000 shares of the Company’s common stock reserved for purchase under the plan, approximately 150,000 shares remained available as of August 31, 2010. Eligible employees may participate at their discretion.
Note 8: Commitments and Contingencies
Self-Insurance
It is the policy of Zep to self-insure, up to certain limits, risks including workers’ compensation, comprehensive general liability, and auto liability. As of August 31, 2008, Zep’s self-insured retention for each claim involving workers’ compensation, comprehensive general liability (including toxic tort and other product liability claims), and auto liability was limited to $0.5 million per occurrence of such claims. However, due to the Company’s historical claims experience our comprehensive general liability self-insurance retention limits have been increased to $1.5 million for claims per occurrence incurred after August 31, 2008. Based on Zep’s estimate of the aggregate liability for claims incurred, a provision for claims under this self-insured program is revised and recorded annually. This estimate is derived from both internal and external sources including but not limited to Zep’s independent actuary. Zep is also self-insured up to certain limits for certain other insurable risks, primarily physical loss to property ($0.5 million per occurrence) and business interruptions resulting from such loss and lasting three days or more in duration. Based on the Company’s historical claims experience, the retention limits stipulated
70
Table of Contents
Index to Financial Statements
Zep Inc.
NOTES TO CONSOLIDATED AND COMBINED FINANCIAL STATEMENTS—(Continued)
(Dollar amounts in thousands, except share and per-share data and as indicated)
by policies addressing physical loss to properties located in North America have been increased to $1.0 million per occurrence for claims incurred after August 31, 2008. Insurance coverage is maintained for catastrophic property and casualty exposures as well as those risks required to be insured by law or contract. Zep is fully self-insured for certain other types of liabilities, including environmental, product recall, patent infringement and errors and omissions.
Zep is also self-insured for the majority of its medical benefits plans. The Company estimates its aggregate liability for claims incurred by applying a lag factor to the Company’s historical claims and administrative cost experience. The appropriateness of the Company’s lag factor is evaluated and revised annually, as necessary.
Leases
Zep leases certain of its buildings and equipment under non-cancelable operating lease agreements. Certain of these operating lease agreements contain rent escalation clauses. The Company expenses rent on a straight-line basis over the life of our leases, which commences on the date we have the right to control leased property. Minimum lease payments under noncancelable leases for years subsequent to August 31, 2010, are as follows: 2011—$7.7 million; 2012—$6.3 million; 2013—$5.4 million; 2014—$4.6 million; 2015—$3.3 million; after 2015—$3.4 million.
Rent expense totaled $7.9 million in 2010, $8.1 million in 2009, and $12.2 million in 2008. The Company has undertaken restructuring activities that have resulted in the recording of facility lease contract termination cost. These activities and their related costs are discussed further in Note 8 of Notes to Consolidated and Combined Financial Statements.
Collective Bargaining Agreements
Certain of Zep’s employees are covered by collective bargaining agreements, which renew periodically. The collective bargaining agreement covering certain employees at the Company’s manufacturing facility on Seaboard Industrial Boulevard and our primary distribution center in Atlanta, Georgia is scheduled to renew during fiscal year 2011.
Litigation
Zep is subject to various legal claims arising in the normal course of business. Zep is self-insured up to specified limits for certain types of claims, including product liability, and is fully self-insured for certain other types of claims, including environmental, product recall, and patent infringement. Based on information currently available, it is the opinion of management that the ultimate resolution of pending and threatened legal proceedings will not have a material adverse effect on the results of operations, financial position, or cash flows of Zep. However, in the event of unexpected future developments, it is possible that the ultimate resolution of such matters, if unfavorable, could have a material adverse effect on results of operations, financial position, or cash flows of the Company in future periods.
Zep establishes reserves for legal claims when the costs associated with the claims become probable and can be reasonably estimated. The actual costs of resolving legal claims may be substantially higher or lower than the amounts reserved for such claims. However, the Company cannot make a meaningful estimate of actual costs to be incurred that could possibly be higher or lower than the amounts reserved. Also, from time to time we may incur expense associated with efforts to enforce our non-compete agreements.
71
Table of Contents
Index to Financial Statements
Zep Inc.
NOTES TO CONSOLIDATED AND COMBINED FINANCIAL STATEMENTS—(Continued)
(Dollar amounts in thousands, except share and per-share data and as indicated)
Environmental Matters Pertaining to Zep’s Historical Operations
The Company’s operations are subject to federal, state, local, and foreign laws and regulations relating to the generation, storage, handling, transportation, and disposal of hazardous substances and solid and hazardous waste, and the remediation of contaminated sites. Permits and environmental controls are required for certain of our operations to limit air and water pollution, and these permits are subject to modification, renewal, and revocation by issuing authorities. We will incur capital and operating costs relating to environmental compliance on an ongoing basis. Environmental laws and regulations have generally become stricter in recent years, and the cost of responding to future changes may be substantial. While management believes that the Company is currently in substantial compliance with all material environmental laws and regulations, and has taken reasonable steps to ensure such compliance, there can be no assurance that the Company will not incur significant costs to remediate violations of such laws and regulations, particularly in connection with acquisitions of existing operating facilities, or to comply with changes in, or stricter or different interpretations of, existing laws and regulations. Such costs could have a material adverse effect on the Company’s results of operations.
In June 2007, we reached a final resolution of the investigation by the United States Department of Justice (the “DOJ”) of certain environmental issues at our primary manufacturing facility located in Atlanta, Georgia. In connection with this resolution, we were subject to a three-year probation period that incorporated a compliance agreement with the United States Environmental Protection Agency (the “EPA”). Under the compliance agreement, we were required to maintain an enhanced compliance program. During June 2010, the Company was released from the EPA compliance agreement and is no longer operating on probationary terms.
Zep is currently a party to federal and state administrative proceedings arising under federal and state laws enacted for the protection of the environment where a state or federal agency or a private party alleges that hazardous substances generated by the Company have been discharged into the environment and a state or federal agency is requiring a cleanup of soil and/or groundwater pursuant to federal or state superfund laws. In each of these proceedings in which Zep has been named as a party that allegedly generated hazardous substances that were transported to a waste site owned and operated by another party either: (1) Zep is one of many other identified generators who have reached an agreement regarding the allocation of costs for cleanup among the various generators and Zep’s potential liability is not material; (2) Zep has been identified as a potential generator and the sites have been remediated by the EPA or by a state for a cost that is not material; or (3) other generators have cleaned up the site and have not pursued a claim against Zep and Zep’s liability, if any, would not be material.
Zep owns and operates property located on Seaboard Industrial Boulevard in Atlanta, Georgia where the Company has been named as a potentially responsible party. Zep and the current and former owners of adjoining properties have agreed to share the expected costs and responsibilities of implementing a Corrective Action Plan, approved in 2004, under the Georgia Hazardous Site Response Act (“HSRA”) to periodically monitor property along a nearby stream for a period of five years, which ended in December 2009. Monitoring actions will continue until the Georgia Environmental Protection Division (the “EPD”) notifies the Company that such activities are no longer necessary. Further, the Company has executed a Consent Order with the EPD covering this remediation. On November 23, 2009, the EPD approved the Corrective Action Plan submitted by the Company to address the subsurface contamination north of Seaboard Industrial Boulevard. The Company continues to actively remediate the subsurface contamination in compliance with the approved Corrective Action Plan.
72
Table of Contents
Index to Financial Statements
Zep Inc.
NOTES TO CONSOLIDATED AND COMBINED FINANCIAL STATEMENTS—(Continued)
(Dollar amounts in thousands, except share and per-share data and as indicated)
In May 2007, the Company accrued an undiscounted pre-tax liability of $5.0 million representing our best estimate of costs associated with subsurface remediation, primarily to remove contaminants from soil underlying one of our manufacturing facilities, and other related environmental issues. While over approximately the next twenty years Zep could expend an amount ranging up to $10.0 million on these efforts, management’s best estimate of remediation costs continues to be $5.0 million. To date, we have expended approximately $2.0 million of the $5.0 million reserve established in May 2007. Further sampling, engineering studies, and/or changes in regulatory requirements could cause us to revise the current estimate. We arrived at the current estimates on the basis of studies prepared by independent third party environmental consulting firms. The actual cost of remediation will vary depending upon the results of additional testing and geological studies, the success of initial remediation efforts in the first five years addressing the most significant areas of contamination, the rate at which site conditions may change, and the requirements of the EPD.
Environmental Liabilities Assumed in the Acquisition of Amrep
Amrep is currently a party to federal and state administrative proceedings arising under federal and state laws enacted for the protection of the environment where a state or federal agency or a private party alleges that hazardous substances generated by Amrep have been discharged into the environment and a state or federal agency is requiring a cleanup of soil and/or groundwater pursuant to federal or state superfund laws. In each of these proceedings in which Amrep has been named as a party that allegedly generated hazardous substances that were transported to a waste site owned and operated by another party, either (1) Amrep is one of many other identified generators who have reached an agreement on the allocation of costs for cleanup among the various generators and Amrep’s potential liability is not material, or (2) Amrep has been identified as a potential generator but has been indemnified by its waste broker and transporter.
Amrep’s primary manufacturing location in Marietta, Georgia is the only active site involving property which Amrep owns with respect to which Amrep has been named as a potentially responsible party. With regard to this location, Amrep is responsible for the expected costs of implementing an Amended Corrective Action Plan that was submitted in March 2009 under HSRA, the approval of which is still pending. The EPD is reviewing the Amended Corrective Action Plan and will determine whether additional actions are necessary and, if so, for what period of time.
As of August 31, 2010, the liabilities presented within Zep’s Consolidated Balance Sheets reflect an undiscounted, pre-tax liability of approximately $11.7 million, which represents Zep’s best estimate of costs associated with the aforementioned Amended Corrective Action Plan, primarily to remediate contaminants in soil and ground water underlying the Marietta manufacturing facility and affected adjacent properties, and other related environmental issues. While over approximately the next twenty years Zep could expend an amount ranging up to $18.0 million on these efforts, management’s best estimate of remaining remediation costs continues to be $11.7 million. Further sampling, engineering studies, and/or changes in regulatory requirements could cause revision to the current estimate. The initially recorded $12.0 million estimate was derived on the basis of studies prepared by independent third party environmental consulting firms. To date, the Company has expended approximately $0.3 million of what was an initial $12.0 million reserve established in December 2009. The actual cost of remediation will vary depending upon the results of additional testing and geological studies, the success of initial remediation designed to address the most significant areas of contamination, the rate at which site conditions may change, and the requirements of the EPD.
73
Table of Contents
Index to Financial Statements
Zep Inc.
NOTES TO CONSOLIDATED AND COMBINED FINANCIAL STATEMENTS—(Continued)
(Dollar amounts in thousands, except share and per-share data and as indicated)
Additionally, Amrep previously conducted manufacturing operations at an unrelated property in Georgia that has since been sold. Pursuant to the terms of the sale, Amrep, and therefore Zep, has retained environmental exposure that might arise from its previous use of this property. Management is preparing a plan to address the sub-surface contamination and, at this time, does not anticipate costs associated with future remediation efforts will be material. As of August 31, 2010, accruals associated with this effort totaled approximately $0.2 million. However, the actual cost of remediation could vary depending upon the results of additional testing and geological studies and the rate at which site conditions may change. Finally, management is preparing a plan to address the sub-surface contamination at a Texas manufacturing location owned by Amrep, and, at this time, does not anticipate the costs associated with future remediation efforts will be material. These estimates could change, however, based upon the response of the Texas Commission on Environmental Quality to that plan.
Guarantees and Indemnities
As further discussed in our Note 1 of Notes to Consolidated and Combined Financial Statements, in conjunction with the separation of their businesses, Zep and Acuity Brands entered into various agreements that address the allocation of assets and liabilities between them and that define their relationship after the separation, including the distribution agreement, the tax disaffiliation agreement, the employee benefits agreement, and the transition services agreement.
Included in these agreements are certain general indemnifications granted by Zep to Acuity Brands, and by Acuity Brands to Zep, as well as specific limited tax liability indemnifications in the event that the Distribution is deemed to be taxable, or if any of the internal reorganization steps taken to effect the Distribution are not deemed to have been made on a tax-free basis. The Internal Revenue Service has issued a private letter ruling supporting the tax-free status of the spin-off, and Zep continues to conduct its operations in a manner that is compliant with the conditions set forth by that ruling. Further, Zep and Acuity Brands have received an opinion from external counsel supporting the tax-free status of the spin-off. We believe the probability that the Distribution will be deemed taxable is remote, and the estimated fair value to be de minimis. Therefore, we have not recorded any related amounts in our Consolidated Financial Statements.
Note 9: Restructuring Charges
During the first quarter of fiscal year 2008, Zep’s management announced its intention to pursue a strategic plan focused upon achieving the Company’s long-term financial objectives. As part of this program, we recorded pretax charges of $10.0 million reflecting the cost of restructuring and other special items during fiscal year 2008. These charges are composed of severance related costs totaling approximately $5.3 million, product line simplification costs of $1.5 million (approximately $1.2 million of which is related to inventory disposal and is required to be reported within Cost of Products Sold), and facility lease contract termination costs of approximately $3.3 million. We will continue to make payments on the affected facility lease until it expires in 2015.
During the first quarter of fiscal year 2009, the Company recorded an additional $1.9 million restructuring charge composed of severance costs. The Company’s employee severance actions are collectively expected to affect approximately 330 employees, and the majority of related payments are expected to be settled during the next 12 months. In the second quarter of fiscal year 2009, the
74
Table of Contents
Index to Financial Statements
Zep Inc.
NOTES TO CONSOLIDATED AND COMBINED FINANCIAL STATEMENTS—(Continued)
(Dollar amounts in thousands, except share and per-share data and as indicated)
Company recorded a charge of $1.1 million as it exited two additional facilities, and, in accordance with guidance governing the accounting for costs associated with exit or disposal activities, adjusted sub-lease rental income assumptions associated with the above mentioned fiscal year 2008 facility closure. In the fourth quarter of fiscal year 2009, Zep recorded a pretax restructuring charge of $0.4 million for costs associated with severances and facility consolidation.
During fiscal year 2010, Restructuring Charges recorded within Zep’s Consolidated and Combined Statements of Income reflect 1) the consolidation of the Company’s logistics branch network, which has been substantially completed, 2) the further streamlining of the Company’s organizational structure, which resulted in the reduction of non-sales headcount, and 3) the continued integration of Zep and Amrep’s manufacturing capabilities. Zep recorded facility consolidation-related pretax restructuring charges of approximately $2.1 million in fiscal year 2010. The Company recorded $4.2 million in severance-related pretax restructuring costs during fiscal year 2010.
In the fourth quarter of fiscal year 2010, Zep’s aerosol production facility was closed and volumes were transferred to Amrep’s Marietta, Georgia manufacturing location. The Company also put up for sale Amrep’s Lancaster, Texas property as manufacturing activities at that location have been transferred to other Zep facilities. Finally, the Company outsourced its specialty blending production. We recorded an impairment charge totaling $1.6 million in the fourth quarter of fiscal year 2010 to state fixed assets at fair value (determined based upon market value) as they could not be used in their full capacity, if at all, subsequent to these restructuring actions. Other miscellaneous restructuring charges totaled $0.4 million during the fourth quarter of fiscal year 2010.
Also, approximately $0.4 million of inventory value was either written down or written off in the fourth quarter of fiscal year 2010 as the Company restructured its logistics network and manufacturing operations. This inventory charge was recorded within Cost of Products Sold within the fiscal year 2010 Consolidated and Combined Statements of Income.
The fiscal 2010 changes to our restructuring reserve (included within Accrued compensation and Other accrued liabilities on the Consolidated Balance Sheets) are summarized as follows:
| Severance Costs |
Facility Exit Costs |
|||||||
| Balance as of August 31, 2008 |
$ | 4,082 | $ | 3,130 | ||||
| Restructuring charges recorded during fiscal 2009 |
2,017 | 1,405 | ||||||
| Payments made from restructuring reserves |
(4,038 | ) | (1,323 | ) | ||||
| Balance as of August 31, 2009 |
$ | 2,061 | $ | 3,212 | ||||
| Restructuring charges recorded during fiscal 2010 |
4,224 | 2,009 | ||||||
| Payments made from restructuring reserves |
(2,074 | ) | (1,788 | ) | ||||
| Balance as of August 31, 2010 |
$ | 4,211 | $ | 3,433 | ||||
Note 10: Income Taxes
Zep accounts for income taxes using the asset and liability approach as prescribed by ASC 740, Income Taxes. This approach requires recognition of deferred tax liabilities and assets for the expected future tax consequences of events that have been included in the financial statements or tax returns.
75
Table of Contents
Index to Financial Statements
Zep Inc.
NOTES TO CONSOLIDATED AND COMBINED FINANCIAL STATEMENTS—(Continued)
(Dollar amounts in thousands, except share and per-share data and as indicated)
Using the enacted tax rates in effect for the year in which the differences are expected to reverse, deferred tax liabilities and assets are determined based on the differences between the financial reporting and the tax basis of an asset or liability.
The provision for income taxes consists of the following components:
| Years Ended August 31, | ||||||||||||
| 2010 | 2009 | 2008 | ||||||||||
| Provision for current federal taxes |
$ | 6,942 | $ | 3,804 | $ | 7,678 | ||||||
| Provision for current state taxes |
949 | 643 | 936 | |||||||||
| Provision for current foreign taxes |
1,707 | 1,296 | 3,489 | |||||||||
| Provision for deferred taxes |
(1,391 | ) | 181 | (2,434 | ) | |||||||
| Total provision for income taxes |
$ | 8,207 | $ | 5,924 | $ | 9,669 | ||||||
A reconciliation from the federal statutory rate to the total provision for income taxes is as follows:
| Years Ended August 31, | ||||||||||||
| 2010 | 2009 | 2008 | ||||||||||
| Federal income tax computed at statutory rate |
$ | 7,599 | $ | 5,314 | $ | 9,097 | ||||||
| State income tax, net of federal income tax benefit |
90 | 388 | 504 | |||||||||
| Permanent differences |
251 | |||||||||||
| Foreign permanent differences and rate differential |
29 | 259 | 208 | |||||||||
| Change in valuation allowance |
125 | 67 | (76 | ) | ||||||||
| Other, net |
113 | (104 | ) | (64 | ) | |||||||
| Total provision for income taxes |
$ | 8,207 | $ | 5,924 | $ | 9,669 | ||||||
The Company recorded deferred tax liabilities in conjunction with the acquisition disclosed separately within the notes herein which are included in the net deferred income tax asset at August 31, 2010. Components of the net deferred income tax asset at August 31, 2010 and 2009 include:
| 2010 | 2009 | |||||||
| Deferred Income Tax Liabilities: |
||||||||
| Depreciation |
$ | (6,782 | ) | $ | (3,637 | ) | ||
| Goodwill and intangibles |
(10,737 | ) | (762 | ) | ||||
| Other liabilities |
(1,629 | ) | (552 | ) | ||||
| Total deferred income tax liabilities |
$ | (19,148 | ) | $ | (4,951 | ) | ||
| Deferred Income Tax Assets: |
||||||||
| Self-insurance |
3,251 | 4,075 | ||||||
| Deferred compensation |
4,441 | 3,864 | ||||||
| Foreign tax losses |
929 | 950 | ||||||
| Environmental Reserve |
5,411 | 1,369 | ||||||
| Other accruals not yet deductible |
10,712 | 8,274 | ||||||
| Other assets and tax losses |
2,641 | 1,233 | ||||||
| Total deferred income tax assets |
27,385 | 19,765 | ||||||
| Valuation allowance |
(1,464 | ) | (1,337 | ) | ||||
| Net deferred income tax asset |
$ | 6,773 | $ | 13,477 | ||||
76
Table of Contents
Index to Financial Statements
Zep Inc.
NOTES TO CONSOLIDATED AND COMBINED FINANCIAL STATEMENTS—(Continued)
(Dollar amounts in thousands, except share and per-share data and as indicated)
Subsequent to the spin-off, we intend to indefinitely reinvest in our foreign subsidiaries all undistributed earnings of and original investments in such subsidiaries. If these earnings were distributed to the United States in the form of dividends or otherwise, or if the shares of the relevant foreign subsidiaries were sold or otherwise transferred, the Company would be subject to additional United States income taxes (subject to an adjustment for foreign tax credits) and foreign withholding taxes. Determination of the amount of unrecognized deferred income tax liability related to these earnings or investments is not practicable because such liability, if any, is dependent on events and circumstances existing if and when remittance occurs.
Deferred tax assets were partially offset by valuation allowances of $1.5 million at August 31, 2010 and $1.3 million at August 31, 2009. The Company’s deferred tax asset valuation allowances are primarily the result of uncertainties regarding the future realization of recorded tax benefits of state tax credits and foreign capital loss carryforwards. In 2010, the Company recognized a net increase in its valuation allowance of $0.1 million reflecting a decrease in the expected realizable value of state tax credits. In 2009, the Company recognized a net increase in its valuation allowance of less than $0.1 million reflecting a decrease in the expected realizable value of state tax credits.
At August 31, 2010 domestic net operating loss carryforwards, which expire in tax year 2029, were approximately $2.6 million, and certain other domestic state net operating loss carryforwards, which expire from tax year 2012 to 2026, were $9.0 million. At August 31, 2010, foreign net operating and capital loss carryforwards, the majority of which have no expiration, were approximately $1.6 million. Additionally, the Company has state tax credit carryforwards of approximately $1.7 million, which will expire between 2013 and 2020.
In June 2006, the FASB issued ASC 740-10 (formerly FIN 48), which clarifies the accounting for uncertainty in income taxes by prescribing a recognition threshold and measurement attribute for the financial statement implications of tax positions taken or expected to be taken in a company’s tax return.
The interpretation also provides guidance on derecognition, classification, interest and penalties, accounting in interim periods, and disclosure of such positions. We adopted this pronouncement effective September 1, 2007. Federal and state income tax liabilities relating to periods prior to the spin-off remain the responsibility of Acuity Brands pursuant to the tax disaffiliation agreement, and, therefore, the adoption of this pronouncement had a de minimis impact on our results from operations and financial position during the twelve months ended August 31, 2008. As of the adoption date, we had gross tax-effected unrecognized tax benefits (including interest and penalties) of $1.1 million, none of which, if recognized, would affect our effective tax rate due to the offsetting receivable from Acuity Brands provided for in the tax disaffiliation agreement. In our results from operations during the twelve months ended August 31, 2010 and August 31, 2009, we recognized less than $0.2 million additional income tax expense in each respective period related to changes in gross tax-effected unrecognized tax benefits, including interest and penalties.
We recognize potential accrued interest and penalties related to unrecognized tax benefits in income tax expense. As of August 31, 2010, we had gross tax-effected unrecognized tax benefits of $1.5 million (including interest and penalties of $0.2 million), of which $0.4 million, if recognized, would affect our effective tax rate due to the offsetting receivable from Acuity Brands provided for in the tax disaffiliation agreement. Interest and penalties recognized had a de minimis impact on our fiscal year 2009 operating results due to the offsetting receivable from Acuity Brands. There are no significant increases or decreases to the amount of unrecognized tax benefits anticipated within the next twelve months.
77
Table of Contents
Index to Financial Statements
Zep Inc.
NOTES TO CONSOLIDATED AND COMBINED FINANCIAL STATEMENTS—(Continued)
(Dollar amounts in thousands, except share and per-share data and as indicated)
A reconciliation of the beginning and ending amount of unrecognized tax benefits is as follows (in thousands):
| Balance at August 31, 2008 |
$ | 1,350 | ||
| Additions based on tax positions related to the current year |
182 | |||
| Reductions based on tax positions related to the current year |
— | |||
| Additions for tax positions of prior years |
160 | |||
| Reductions for tax positions of prior years |
(283 | ) | ||
| Reductions for settlements with taxing authorities |
(36 | ) | ||
| Reductions for closings of statutes of prior years |
(122 | ) | ||
| Balance at August 31, 2009 |
$ | 1,251 | ||
| Additions based on tax positions related to the current year |
331 | |||
| Reductions based on tax positions related to the current year |
(3 | ) | ||
| Additions for tax positions of prior years |
18 | |||
| Reductions for tax positions of prior years |
(141 | ) | ||
| Reductions for settlements with taxing authorities |
(105 | ) | ||
| Reductions for closings of statutes of prior years |
(102 | ) | ||
| Balance at August 31, 2010 |
$ | 1,249 | ||
We conduct business globally, and as a result, one or more of our subsidiaries files income tax returns in the U.S. federal jurisdiction and various state and foreign jurisdictions. In the normal course of business we are subject to examination by taxing authorities throughout the world, including various jurisdictions in Europe, Canada and the United States. With few exceptions, we are no longer subject to U.S. federal, state and local income tax examinations for tax years before 2006, or non-U.S. income tax examinations for tax years before 2005.
Note 11: Quarterly Financial Data (Unaudited)
| Net Sales |
Gross Profit |
Income Before Taxes |
Net Income |
Basic Earnings Per Share(1) |
Diluted Earnings Per Share(1) |
|||||||||||||||||||
| 2010(2) |
||||||||||||||||||||||||
| 1st Quarter |
$ | 126,751 | $ | 69,892 | $ | 8,707 | $ | 5,420 | $ | 0.25 | $ | 0.25 | ||||||||||||
| 2nd Quarter |
127,350 | 59,976 | 980 | 738 | 0.03 | 0.03 | ||||||||||||||||||
| 3rd Quarter |
153,041 | 75,552 | 8,628 | 5,234 | 0.24 | 0.23 | ||||||||||||||||||
| 4th Quarter |
161,370 | 77,757 | 3,396 | 2,112 | 0.10 | 0.09 | ||||||||||||||||||
| 2009(3) |
||||||||||||||||||||||||
| 1st Quarter |
$ | 129,161 | $ | 67,801 | $ | (2,453 | ) | $ | (1,545 | ) | $ | (0.07 | ) | $ | (0.07 | ) | ||||||||
| 2nd Quarter |
114,608 | 58,732 | (1,511 | ) | (942 | ) | (0.04 | ) | (0.04 | ) | ||||||||||||||
| 3rd Quarter |
122,961 | 66,302 | 8,674 | 5,407 | 0.25 | 0.25 | ||||||||||||||||||
| 4th Quarter |
134,302 | 71,684 | 10,474 | 6,340 | 0.30 | 0.29 | ||||||||||||||||||
| (1) | Basic and diluted earnings per share are calculated independently for each of the quarters presented in accordance with ASC No. 260, Earnings per Share. Therefore, the sum of quarterly basic and diluted earnings per share may not total annual basic and diluted earnings per share. On September 1, 2009, we retrospectively adopted an accounting pronouncement which provides that unvested share-based payment awards that contain nonforfeitable rights to dividends or dividend equivalents are participating securities and should be included in the computation of earnings per share. See Note 6 of Notes to Consolidated and Combined Financial Statements for further detail. |
78
Table of Contents
Index to Financial Statements
Zep Inc.
NOTES TO CONSOLIDATED AND COMBINED FINANCIAL STATEMENTS—(Continued)
(Dollar amounts in thousands, except share and per-share data and as indicated)
| (2) | As discussed in Note 3 of Notes to Consolidated and Combined Financial Statements, Amrep’s purchase price has been allocated to Amrep’s net tangible and intangible assets based on their estimated fair values as of the January 4, 2010 closing date of the acquisition. The estimated fair value of acquired finished goods inventories exceeded the historical net book value for such goods by $0.9 million. As a result of this step-up in asset basis, the Company recognized an increase of cost of goods sold totaling $0.5 million in the last two months of the second quarter of fiscal year 2010. The remainder of this inventory sold through during Zep’s third fiscal quarter; subsequently, the mark up of acquired finished goods inventory will not impact Zep’s operating results. |
| Acquisition costs reflect advisory, legal and other due diligence-related services incurred in connection with acquisition-related activity. Acquisition costs associated with Amrep and recognized in Zep’s fiscal second quarter totaled $1.6 million. Acquisition costs associated with the recently purchased Waterbury Companies and Niagara National totaled $2.2 million during the fourth quarter of fiscal year 2010, which included a one-time $0.4 million acceleration of previously capitalized financing costs that were recorded as interest expense when the Company replaced its credit arrangements with a single, expanded facility. This recapitalization was necessary to finance the Company’s acquisitive growth initiatives. All such costs are expensed as incurred pursuant to purchase accounting. |
| During the fourth quarter of fiscal year 2010, Zep and Amrep consolidated manufacturing operations among its Atlanta, Georgia and Dallas, Texas-area facilities. The value of certain inventory, primarily raw materials, was written-down or written-off in accordance with these consolidation efforts. Also, during fiscal year 2010, our SG&A expenses were impacted we recorded $8.2 million in restructuring charges primarily related to the cost of severances and selling branch and manufacturing facility consolidations. |
| The impact of these charges and costs are included within the fiscal year 2010 quarterly data presented within the above listed table. |
| (3) | During the first quarter of fiscal year 2009, Zep’s management initiated actions necessary to reduce non-sales headcount by 5%. Accordingly, we recorded a net pretax charge of $1.9 million during the three months ended November 30, 2008. This charge was entirely composed of severance related costs. In the second quarter of fiscal year 2009, the Company recorded a charge of $1.1 million as it exited two facilities, and, in accordance with ASC No. 146, Exit or Disposal Cost Obligations, adjusted sub-lease rental income assumptions associated with a leased facility exited during the third quarter of fiscal year 2008. In the fourth quarter of fiscal year 2009, Zep recorded a pretax restructuring charge of $0.4 million for costs associated with severances and facility consolidation. The impact of these charges is included within first, second and fourth quarter fiscal year 2009 income before taxes and net income presented within the above listed table. |
Note 12: Geographic Distribution of Operations
The Company is managed as a single business unit that provides a wide range of cleaning and maintenance chemical solutions to our customers. Strategies and policies regarding Zep’s revenue growth, product sourcing, brand management, pricing, sales management, and marketing of product formulations are facilitated by personnel within the Company’s corporate office, which is located in Atlanta, Georgia. Additional functions including but not limited to tax, legal, treasury, environmental compliance, research and development, and risk management are managed through Zep’s central, shared-service organization, also located within Zep’s Atlanta-based headquarters. The Company reports revenues in one line item as a group of similar products, given its products have similar profit contributions, are marketed to a similar customer base, and share similar methods of production and distribution.
79
Table of Contents
Index to Financial Statements
Zep Inc.
NOTES TO CONSOLIDATED AND COMBINED FINANCIAL STATEMENTS—(Continued)
(Dollar amounts in thousands, except share and per-share data and as indicated)
The geographic distribution of Zep’s net sales, operating profit, and long-lived assets is summarized in the following table for the years ended August 31:
| 2010 | 2009 | 2008 | ||||||||||
| Net sales(1) |
||||||||||||
| Domestic(2) |
$ | 455,520 | $ | 394,280 | $ | 445,071 | ||||||
| International |
112,992 | 106,752 | 129,653 | |||||||||
| $ | 568,512 | $ | 501,032 | $ | 574,724 | |||||||
| Operating profit(3) |
||||||||||||
| Domestic(2) |
$ | 19,547 | $ | 15,485 | $ | 21,414 | ||||||
| International |
4,305 | 2,604 | 7,649 | |||||||||
| $ | 23,852 | $ | 18,089 | $ | 29,063 | |||||||
| Long-lived assets(4) |
||||||||||||
| Domestic(2) |
$ | 63,919 | $ | 55,848 | $ | 57,833 | ||||||
| International |
7,651 | 5,870 | 5,789 | |||||||||
| $ | 71,570 | $ | 61,718 | $ | 63,622 | |||||||
| (1) | Net sales are attributed to each country based on the selling location. Sales generated in Canada approximated 11%, 12%, and 13% of total net sales for the years ended August 31, 2010, 2009, and 2008, respectively. None of the remaining countries categorized in the above table as “International” were responsible for more than 10% of the Company’s total consolidated net sales. |
| (2) | Domestic amounts include net sales, operating profit, and long-lived assets for U.S. based operations. |
| (3) | Certain costs related to corporate functions performed within our Atlanta, Georgia based headquarters and supporting offices have not been allocated among our international operating results. Fiscal year 2008 international operating results were impacted by transfer pricing actions undertaken by the Company in accordance with regulations promulgated within the jurisdictions where we conduct business. Interest costs incurred in connection with our debt instruments, all of which are maintained by our domestic operations, are primarily responsible for differences between Operating Profit and Income before Provision for Income Taxes as reported within our Consolidated and Combined Statements of Income. |
| (4) | Long-lived assets include net property, plant, and equipment, long-term deferred income tax assets, and other long-term assets. |
Note 13: Subsequent Events
Zep has evaluated subsequent events through November 8, 2010, the date on which the Company’s Annual Report on Form 10-K for the fiscal year ended August 31, 2010 was filed with the Securities and Exchange Commission (“SEC”). On October 6, 2010, our Board of Directors declared a quarterly dividend of $0.04 per share. On October 1, 2010, Zep completed the acquisition of the brands and assets of Atlanta-based Niagara National, LLC, a manufacturer of truck wash systems and products, for a cash purchase price that was not material to Zep’s operating results. Zep will add the Niagara brand of custom truck wash, pressure washers, water recovery systems and maintenance chemicals to its transportation product portfolio that includes the Zep, EnviroEdge, and Armor All Professional® brands.
On September 9, 2010 certain terms of the stock purchase agreement between Zep and the former owners of Amrep were amended in contemplation of Zep’s filing of Amrep’s 2009 tax returns. On September 15, 2010, Zep filed income tax returns for Amrep’s 2009 tax year. The filing of these tax returns concurrently generated a tax payable from Zep to Amrep’s former owners, whose amount became determinable based upon the amended terms of the purchase agreement. The amount
80
Table of Contents
Index to Financial Statements
Zep Inc.
NOTES TO CONSOLIDATED AND COMBINED FINANCIAL STATEMENTS—(Continued)
(Dollar amounts in thousands, except share and per-share data and as indicated)
of the payable is approximately $0.5 million. This liability will be recorded in the first quarter of Zep’s fiscal year 2011 as an adjustment to goodwill given the obligation represents a return of tax payments made by Amrep’s former owners prior to the January 4, 2010 Closing Date.
On September 2, 2010 (the “Closing Date”), Amrep and certain other of Zep’s subsidiaries acquired certain brands and assets and the assumed certain liabilities of the North American operations of Waterbury Companies, Inc. (“Waterbury”), a provider of air-care delivery systems and products for facility maintenance. Waterbury was acquired for a cash purchase price of $66 million, subject to post-closing working capital adjustments. Of the $66 million purchase price, $62 million was funded through borrowings the Company’s 2010 Credit Facility (discussed further in Note 5 of the Notes to Consolidated and Combined Financial Statements), and the remaining $4.0 million was funded through available cash. The acquisition of Waterbury did not impact our compliance with debt covenants, nor does it affect management’s belief that we will be able to meet the liquidity needs of our business over the next 12 months.
Under the purchase method of accounting, Zep has made a preliminary allocation of the closing purchase price to Waterbury’s net tangible and intangible assets based on their estimated fair values as of the October 1, 2010. The excess of the purchase price over the net tangible and identifiable intangible assets will be recorded as goodwill within Zep’s consolidated balance sheets. Management continues to gather additional information about the fair value of Waterbury’s acquired assets and liabilities. Accordingly, the allocation of the purchase price presented herein, including amounts recorded as goodwill and intangible assets is preliminary. The allocation may not reflect any final purchase price adjustments made, and could change as the purchase price allocation is finalized. A summary of the preliminary purchase price allocation is as follows:
| Cash and cash equivalents |
$ | — | ||
| Inventory |
6,998 | |||
| Other current assets |
5,500 | |||
| Property, plant and equipment |
1,186 | |||
| Accounts payable |
(3,622 | ) | ||
| Other liabilities assumed |
(941 | ) | ||
| Total net tangible assets: |
$ | 9,121 | ||
| Identifiable intangible assets |
||||
| Customer relationships |
27,050 | |||
| Patents and formulations |
3,700 | |||
| Trademarks |
3,700 | |||
| Goodwill |
22,429 | |||
| Total preliminary estimated purchase price allocation |
$ | 66,000 | ||
Of the total purchase price, a preliminary estimate of approximately $34.5 million has been allocated to identifiable intangible assets.
81
Table of Contents
Index to Financial Statements
Item 9. Changes in and Disagreements with Accountants on Accounting and Financial Disclosure
None.
Item 9A. Controls and Procedures
Disclosure controls and procedures are controls and other procedures that are designed to reasonably ensure that information required to be disclosed in the reports filed or submitted by the Company under the Securities Exchange Act is recorded, processed, summarized, and reported within the time periods specified in the Securities and Exchange Commission’s rules and forms. Disclosure controls and procedures include, without limitation, controls and procedures designed to reasonably ensure that information required to be disclosed by the Company in the reports filed under the Securities Exchange Act is accumulated and communicated to management, including the principal executive officer and principal financial officer, as appropriate to allow timely decisions regarding required disclosure.
As required by SEC rules, the Company has evaluated the effectiveness of the design and operation of its disclosure controls and procedures as of August 31, 2010. This evaluation was carried out under the supervision and with the participation of management, including the principal executive officer and principal financial officer. Based on this evaluation, these officers have concluded that the design and operation of the Company’s disclosure controls and procedures are effective at a reasonable assurance level. However, because all disclosure procedures must rely to a significant degree on actions or decisions made by employees throughout the organization, such as reporting of material events, the Company and its reporting officers believe that they cannot provide absolute assurance that all control issues and instances of fraud or errors and omissions, if any, within the Company will be detected. Limitations within any control system, including the Company’s control system, include faulty judgments in decision-making or simple errors or mistakes. In addition, controls can be circumvented by an individual, by collusion between two or more people, or by management override of the control. Because of these limitations, misstatements due to error or fraud may occur and may not be detected.
Management’s annual report on the Company’s internal control over financial reporting and the independent registered public accounting firm’s attestation report are included in the Company’s 2010 Financial Statements in Item 8 of this Annual Report on Form 10-K, under the headings, “Management’s Report on Internal Control over Financial Reporting” and “Report of Independent Registered Public Accounting Firm”, respectively, and are incorporated herein by reference.
Except as set forth below we made no change in our internal control over financial reporting that has materially affected, or is reasonably likely to materially affect, our internal control over financial reporting during fiscal year 2010:
On January 4, 2010, we completed our acquisition of Amrep, Inc. We are currently integrating policies, processes, people, technology and operations for the combined company. As permitted by the SEC, management has elected to exclude Amrep from management’s assessment of the effectiveness of our internal control over financial reporting for the year ended August 31, 2010. Management will continue to evaluate our internal control over financial reporting as we execute integration activities.
CEO and CFO Certifications
The Company’s Chief Executive Officer as well as the Executive Vice President and Chief Financial Officer have filed with the Securities and Exchange Commission the certifications required by Section 302 of the Sarbanes-Oxley Act of 2002 as Exhibits 31.1 and 31.2 to the Company’s Annual Report on Form 10-K for the fiscal year ended August 31, 2010. In addition, on February 22, 2010, the Company’s CEO certified to the New York Stock Exchange that he was not aware of any violation by us of the NYSE corporate governance listing standards.
None.
82
Table of Contents
Index to Financial Statements
PART III
Item 10. Directors, Executive Officers and Corporate Governance
The information required by this item, with respect to directors and corporate governance, is included under the captions Director Nominees for the 2011 Annual Meeting and Directors with Terms Expiring at the 2012 and 2013 Annual Meetings of the Company’s proxy statement for the annual meeting of stockholders to be held January 6, 2011, to be filed with the Commission pursuant to Regulation 14A, and is incorporated herein by reference.
The information required by this item, with respect to executive officers, is included under the caption Management of the Company’s proxy statement for the annual meeting of stockholders to be held January 6, 2011, to be filed with the Commission pursuant to Regulation 14A, and is incorporated herein by reference.
The information required by this item, with respect to the Audit Committee of our Board of Directors is included under the caption Information Concerning the Board and its Committees—Audit Committee of the Company’s proxy statement for the annual meeting of stockholders to be held January 6, 2011, to be filed with the Commission pursuant to Regulation 14A, and is incorporated herein by reference.
The information required by this item, with respect to beneficial ownership reporting, is included under the caption Section 16(a) Beneficial Ownership Reporting Compliance of the Company’s proxy statement for the annual meeting of stockholders to be held January 6, 2011, to be filed with the Commission pursuant to Regulation 14A, and is incorporated herein by reference.
The information required by this item, with respect to our Code of Ethics and Business Conduct can be found in Item 1. of this Annual Report on Form 10-K under the caption Information Concerning Zep Inc.
Item 11. Executive Compensation
The information required by this item is included under the captions Report of the Compensation Committee, Compensation of Directors, Information Concerning the Board and Its Committees, Compensation Committee Interlocks and Insider Participation, Fiscal 2010 Summary Compensation Table, Fiscal 2010 Grants of Plan-Based Awards, Outstanding Equity Awards at Fiscal 2010 Year-End, Option Exercises and Stock Vested in Fiscal 2010, Fiscal 2010 Nonqualified Deferred Compensation, Employment, Severance, and Change in Control Agreements, Equity Award Agreements and Deferred Compensation Plans of the Company’s proxy statement for the annual meeting of stockholders to be held January 6, 2011, to be filed with the Commission pursuant to Regulation 14A, and is incorporated herein by reference.
Item 12. Security Ownership of Certain Beneficial Owners and Management and Related Stockholder Matters
The information required by this item is included under the captions Beneficial Ownership of the Company’s Securities of the Company’s proxy statement for the annual meeting of stockholders to be held January 6, 2011, to be filed with the Commission pursuant to Regulation 14A, and is incorporated herein by reference.
83
Table of Contents
Index to Financial Statements
Disclosure with Respect to Equity Compensation Plans
The following table provides information as of August 31, 2010 about equity awards under our Omnibus Incentive Plan, share units from deferrals into the Non-Employee Director Deferred Compensation Plan and share units from Company contributions into the Supplemental Deferred Compensation Plan.
| Plan Category |
Number of Securities to be Issued Upon Exercise of Outstanding Options, Warrants and Rights |
Weighted- Average Exercise Price of Outstanding Options, Warrants and Rights |
Number of Securities Remaining Available for Future Issuance Under Equity Compensation Plans (Excluding those Currently Outstanding) |
|||||||||
| Equity compensation plans approved by the security holders(1) |
1,826,403 | (2) | $ | 13.48 | 1,433,373 | |||||||
| Equity compensation plans not approved by the security holders |
N/A | N/A | N/A | |||||||||
| Total |
1,826,403 | 1,433,373 | ||||||||||
| (1) | The Non-Employee Director Deferred Compensation Plan and the Supplemental Deferred Savings Plan were approved in October 2007 by our sole stockholder, Acuity Brands, Inc., prior to our spin-off. The 2010 Omnibus Incentive Plan was approved by our stockholders in January 2010. The table does not include 150,265 shares available for purchase under our Employee Stock Purchase Plan, which was approved by our sole stockholder prior to the spin-off. |
| (2) | Includes 1,758,410 stock options under the 2010 Omnibus Incentive Plan, 26,024 share units in the Non-Employee Director Deferred Compensation Plan and 41,969 share units in the Supplemental Deferred Savings Plan. Share units in the deferred compensation plans may be distributed to participants upon termination of service or retirement. |
Item 13. Certain Relationships and Related Transactions, and Director Independence
The information required by this item is included under the captions Certain Relationships and Related Party Transactions, Information Concerning the Board of Directors and its Committees, and Proposals Requiring Your Vote Item-1—Election of Directors of the Company’s proxy statement for the annual meeting of stockholders to be held January 6, 2011, to be filed with the Commission pursuant to Regulation 14A, and is incorporated herein by reference.
Item 14. Principal Accountant Fees and Services
The information required by this item is included under the caption Fees Billed by Independent Registered Public Accounting Firm of the Company’s proxy statement for the annual meeting of stockholders to be held January 6, 2011, to be filed with the Commission pursuant to Regulation 14A, and is incorporated herein by reference.
84
Table of Contents
Index to Financial Statements
PART IV
Item 15. Exhibits and Financial Statement Schedules
(a) The following documents are filed as part of this report:
| (1) | Management’s Report on Internal Control Over Financial Reporting |
Report of Independent Registered Public Accounting Firm (Ernst & Young LLP)
Report of Independent Registered Public Accounting Firm on Internal Control Over Financial Reporting
Consolidated Balance Sheets as of August 31, 2010 and 2009
Consolidated and Combined Statements of Income for the years ended August 31, 2010, 2009, and 2008
Consolidated and Combined Statements of Cash Flows for the years ended August 31, 2010, 2009, and 2008
Consolidated and Combined Statements of Stockholders’ Equity and Comprehensive Income for the years ended August 31 2010, 2009, and 2008
Notes to Consolidated and Combined Financial Statements
| (2) | Financial Statement Schedules: |
Schedule II Valuation and Qualifying Accounts
Any of Schedules I through V not listed above have been omitted because they are not applicable or the required information is included in the consolidated and combined financial statements or notes thereto.
| (3) | Exhibits filed with this report (begins on next page): |
Copies of exhibits will be furnished to stockholders upon request at a nominal fee.
Requests should be sent to Zep Inc., Investor Relations Department, 1310 Seaboard Industrial Boulevard Atlanta, Georgia 30318-2825.
85
Table of Contents
Index to Financial Statements
INDEX TO EXHIBITS
| EXHIBIT 2 |
Agreement and Plan of Distribution by and between Acuity Brands, Inc. and Zep Inc., dated as of October 31, 2007. | Reference is made to Exhibit 2.1 of registrant’s Form 8-K as filed with the Commission on November 5, 2007, which is incorporated herein by reference. | ||||
| EXHIBIT 3 |
(a) |
Restated Certificate of Incorporation of Zep Inc. | Reference is made to Exhibit 3.1 of registrant’s Form 8-K as filed with the Commission on October 26, 2007, which is incorporated herein by reference. | |||
| (b) |
Amended and Restated By-Laws of Zep Inc. (effective January 7, 2010) | Reference is made to Exhibit 3.1 of registrant’s Form 8-K as filed with the Commission on October 6, 2008, which is incorporated herein by reference. | ||||
| EXHIBIT 4 |
(a) |
Form of Certificate representing Zep Inc. Common Stock. | Reference is made to Exhibit 4.1 of registrant’s Form 8-K as filed with the Commission on November 5, 2007, which is incorporated herein by reference. | |||
| (b) |
Stockholder Protection Rights Agreement, dated as of October 30, 2007, between Zep Inc. and Mellon Investor Services LLC, as rights agent. | Reference is made to Exhibit 4.2 of registrant’s Form 8-K as filed with the Commission on November 5, 2007, which is incorporated herein by reference. | ||||
| (c) |
First Amendment to Stockholder Protection Rights Agreement, between Zep Inc. and Mellon Investor Services LLC, as rights agent, dated as of January 22, 2009 | Reference is made to Exhibit 10(a) of registrant’s Form 10-Q as filed with the Commission on April 9, 2009, which is incorporated herein by reference. | ||||
| EXHIBIT 10(i)A |
(1) |
Tax Disaffiliation Agreement, dated as of October 31, 2007, by and between Acuity Brands, Inc. and Zep Inc. | Reference is made to Exhibit 10.1 of registrant’s Form 8-K as filed with the Commission on November 5, 2007, which is incorporated herein by reference. | |||
| (2) |
Transition Services Agreement, dated as of October 31, 2007, by and between Acuity Brands, Inc. and Zep Inc. | Reference is made to Exhibit 10.2 of registrant’s Form 8-K as filed with the Commission on November 5, 2007, which is incorporated herein by reference. | ||||
| (3) |
Agreement and Plan of Distribution, dated as of October 31, 2007, by and between Acuity Brands, Inc. and Zep Inc. | Reference is made to Exhibit 2.1 of registrant’s Form 8-K as filed with the Commission on November 5, 2007, which is incorporated herein by reference. | ||||
86
Table of Contents
Index to Financial Statements
| (4) |
Loan and Security Agreement, by and between Acuity Enterprise, Inc., Acuity Specialty Products, Inc. and Regions Bank, as administrative agent, dated October 14, 2009. | Reference is made to Exhibit 10(i)A(7) of the registrant’s Form 10-K as filed with the Commission on October 29, 2009, which is incorporated herein by reference. | ||||
| (5) |
Performance Undertaking, by and between Zep Inc. and Acuity Enterprise, Inc., dated October 14, 2009. | Reference is made to Exhibit 10(i)A(8) of the registrant’s Form 10-K as filed with the Commission on October 29, 2009, which is incorporated herein by reference. | ||||
| (6) |
Agreement and Plan of Merger, dated January 4, 2010, by and among Zep Inc., Project Missouri, Inc., Dawn Chemical Company MCM Capital Partners L.P., as stockholders representative, and certain stockholders of Dawn Chemical Company. | Reference is made to Exhibit 2.1 of the registrant’s Form 8-K as filed with the Commission on January 5, 2010, which is incorporated herein by reference. | ||||
| (7) |
Credit Agreement, dated as of July 15, 2010, among Zep Inc., Acuity Specialty Products, Inc., the other subsidiary borrowers party thereto, J.P. Morgan Chase Bank, N.A., as administrative agent, Wells Fargo Bank, National Association, as syndication agent, Regions Bank, as documentation agent, and the other lenders party thereto. | Reference is made to Exhibit 10.1 of the registrant’s Form 8-K as filed with the Commission on July 19, 2010, which is incorporated herein by reference. | ||||
| (8) |
Asset Purchase Agreement, dated as of July 23, 2010, among Waterbury Companies, Inc., Air Guard Control (Canada) Limited, Air Guard Control Corporation and Amrep, Inc., Amrep IP Holdings, LLC, Acuity Holdings, Inc., and solely with respect to Section 5.9, Watco International Holdings Corp., Wind Point Partners V, L.P. and Wind Point Executive Advisor Partners, L.P. and solely with respect to Section 10.4, Zep Inc. | Reference is made to Exhibit 10.1 of the registrant’s Form 8-K as filed with the Commission on July 27, 2010, which is incorporated herein by reference. | ||||
| (9) |
Form of Transition Services Agreement, dated as of September 2, 2010, by and between Amrep, Inc., Acuity Holdings, Inc., Waterbury Companies, Inc. and Air Guard Control (Canada) Limited. | Reference is made to Exhibit 10.1 of the registrant’s Form 8-K as filed with the Commission on September 3, 2010, which is incorporated herein by reference. | ||||
87
Table of Contents
Index to Financial Statements
| EXHIBIT 10(iii)A |
Management Contracts and Compensatory Arrangements: | |||||
| (1) |
Employee Benefits Agreement, dated as of October 31, 2007. | Reference is made to Exhibit 10.3 of registrant’s Form 8-K as filed with the Commission on November 5, 2007, which is incorporated herein by reference. | ||||
| (2) |
Zep Inc. Long-Term Incentive Plan. | Reference is made to Exhibit 10.4 of registrant’s Form 8-K as filed with the Commission on November 5, 2007, which is incorporated herein by reference. | ||||
| (3) |
Zep Inc. Non-Employee Director Deferred Compensation Plan. | Reference is made to Exhibit 10.5 of registrant’s Form 8-K as filed with the Commission on November 5, 2007, which is incorporated herein by reference. | ||||
| (4) |
Zep Inc. Supplemental Deferred Savings Plan. | Reference is made to Exhibit 10(iii)A(4) of registrant’s Form 10-K filed with the Commission on October 29, 2009, which is herein incorporated by reference. | ||||
| (5) |
Amendment No. 1 to the Zep Inc. Supplemental Deferred Savings Plan, dated October 7, 2009. | Reference is made to Exhibit 10(iii)A(5) of registrant’s Form 10-K filed with the Commission on October 29, 2009, which is herein incorporated by reference. | ||||
| (6) |
Zep Inc. Employee Stock Purchase Plan | Reference is made to Exhibit 10.1 of registrant’s Form 8-K as filed with the Commission on August 31, 2009, which is incorporated herein by reference. | ||||
| (7) |
Amendment of Zep Inc. Employee Stock Purchase Plan. | Reference is made to Exhibit 10.2 of registrant’s Form 8-K as filed with the Commission on August 31, 2009, which is incorporated herein by reference. | ||||
| (8) |
Form of Indemnification Agreement. | Reference is made to Exhibit 10.16 of registrant’s Form 8-K as filed with the Commission on November 5, 2007, which is incorporated herein by reference. | ||||
| (9) |
Form of Change-in-Control Agreement. | Reference is made to Exhibit 10.17 of registrant’s Form 8-K as filed with the Commission on November 5, 2007, which is incorporated herein by reference. | ||||
| (10) |
Form of Change-in-Control Agreement for Certain Executive Officers. | Reference is made to Exhibit 10.19 of the registrant’s Form 8-K as filed with the Commission on November 5, 2007, which is incorporated herein by reference. | ||||
88
Table of Contents
Index to Financial Statements
| (11) |
Form of Severance Agreement. | Reference is made to Exhibit 10.18 of registrant’s Form 8-K as filed with the Commission on November 5, 2007, which is incorporated herein by reference. | ||||
| (12) |
Zep Inc. Management Compensation and Incentive Plan. | Reference is made to Exhibit 10.7 of registrant’s Form 8-K as filed with the Commission on November 5, 2007, which is incorporated herein by reference. | ||||
| (13) |
Zep Inc. Management Compensation and Incentive Plan, amended and restated as of September 1, 2008. | Reference is made to Exhibit A of the registrant’s Definitive Proxy Statement filed with the Commission on November 21, 2008, which is incorporated herein by reference. | ||||
| (14) |
John Morgan Employment Letter. | Reference is made to Exhibit 10.12 of registrant’s Form 10 as filed with the Commission on October 10, 2007, which is incorporated herein by reference. | ||||
| (15) |
Amendment to Employment Letter Agreement, dated as of October 13, 2009, by and between Acuity Specialty Products, Inc., Zep Inc. and John K. Morgan. | Reference is made to Exhibit 10.1 of registrant’s Form 8-K as filed with the Commission on October 13, 2009, which is incorporated herein by reference. | ||||
| (16) |
Amendment No. 2 to Change in Control Agreement and Notice of Termination, dated as of October 13, 2009, by and between Acuity Specialty Products, Inc., Zep Inc. and John K. Morgan. | Reference is made to Exhibit 10.2 of registrant’s Form 8-K as filed with the Commission on October 13, 2009, which is incorporated herein by reference. | ||||
| (17) |
Amendment to Amended and Restated Severance Agreement and Notice of Termination, dated as of October 13, 2009, by and between Acuity Specialty Products, Inc., Zep Inc. and John K. Morgan. | Reference is made to Exhibit 10.3 of registrant’s Form 8-K as filed with the Commission on October 13, 2009, which is incorporated herein by reference. | ||||
| (19) |
Separation Agreement between Zep Inc. and William A. Holl dated January 15, 2009. | Reference is made to Exhibit 10(b) of registrant’s Form 10-Q as filed with the Commission on April 9, 2009, which is incorporated herein by reference. | ||||
| (20) |
Form of Stock Appreciation Rights Agreement for Executive Officers. | Reference is made to Exhibit 10.8 of the registrant’s Form 8-K as filed with the Commission on November 5, 2007, which is incorporated herein by reference. | ||||
89
Table of Contents
Index to Financial Statements
| (21) |
Form of Stock Appreciation Rights Agreement for Key Employees. | Reference is made to Exhibit 10.20 of the registrant’s Form 8-K as filed with the Commission on November 5, 2007, which is incorporated herein by reference. | ||||
| (22) |
Form of Nonqualified Stock Option Agreement for Executive Officers. | Reference is made to Exhibit 10.9 of the registrant’s Form 8-K as filed with the Commission on November 5, 2007, which is incorporated herein by reference. | ||||
| (23) |
Form of Nonqualified Stock Option Agreement for Key Employees. | Reference is made to Exhibit 10.10 of the registrant’s Form 8-K as filed with the Commission on November 5, 2007, which is incorporated herein by reference. | ||||
| (24) |
Form of Incentive Stock Option Agreement for Executive Employees. | Reference is made to Exhibit 10.12of the registrant’s Form 8-K as filed with the Commission on November 5, 2007, which is incorporated herein by reference. | ||||
| (25) |
Form of Incentive Stock Option Agreement for Key Officers. | Reference is made to Exhibit 10.11 of the registrant’s Form 8-K as filed with the Commission on November 5, 2007, which is incorporated herein by reference. | ||||
| (26) |
Form of Long-Term Incentive Plan Restricted Stock Award Agreement (without Restrictive Covenants). | Reference is made to Exhibit 10.13 of the registrant’s Form 8-K as filed with the Commission on November 5, 2007, which is incorporated herein by reference. | ||||
| (27) |
Form of Stock Appreciation Rights Agreement for Nonemployee Directors. | Reference is made to Exhibit 10.22 of the registrant’s Form 8-K as filed with the Commission on November 5, 2007, which is incorporated herein by reference. | ||||
| (30) |
Form of Long-Term Incentive Plan Restricted Stock Award Agreement for Nonemployee Directors. | Reference is made to Exhibit 10.23 of the registrant’s Form 8-K as filed with the Commission on November 5, 2007, which is incorporated herein by reference. | ||||
| (31) |
Form of Incentive Stock Option Agreement for Executive Employees. | Reference is made to Exhibit 10.1 of registrant’s Form 8-K as filed with the Commission on September 8, 2009, which is incorporated herein by reference. | ||||
90
Table of Contents
Index to Financial Statements
| (32) |
Form of Non-Qualified Stock Option Agreement for Executive Employees. | Reference is made to Exhibit 10.2 of registrant’s Form 8-K as filed with the Commission on September 8, 2009, which is incorporated herein by reference. | ||||
| (33) |
Form of 2010 Performance Stock Award Agreement. | Reference is made to Exhibit 10.3 of registrant’s Form 8-K as filed with the Commission on September 8, 2009, which is incorporated herein by reference. | ||||
| (34) |
Form of Restricted Stock Award Agreement with restrictive covenants. | Reference is made to Exhibit 10.4 of registrant’s Form 8-K as filed with the Commission on September 8, 2009, which is incorporated herein by reference. | ||||
| (35) |
Form of Change-in-Control Agreement. | Reference is made to Exhibit 10(c) of registrant’s Form 10-Q/A as filed with the Commission on December 22, 2009, which is incorporated herein by reference. | ||||
| (36) |
Form of Change-in-Control Agreement for Certain Executive Officers. | Reference is made to Exhibit 10(d) of registrant’s Form 10-Q/A as filed with the Commission on December 22, 2009, which is incorporated herein by reference. | ||||
| (37) |
Form of Severance Agreement. | Reference is made to Exhibit 10(e) of registrant’s Form 10-Q/A as filed with the Commission on December 22, 2009, which is incorporated herein by reference. | ||||
| (38) |
Amendment to Change-in-Control Agreement and Severance Agreement dated as of December 28, 2009, by and between Acuity Specialty Products, Inc., Zep Inc. and John R. Morgan. | Reference is made to Exhibit 10 of registrant’s Form 8-K as filed with the Commission on December 31, 2009, which is incorporated herein by reference. | ||||
| (39) |
Form of Incentive Stock Options Agreement for Executive Employees for grants made on and after September 1, 2009. | Reference is made to Exhibit 10.1 of the registrant’s Form 8-K as filed with the Commission on September 8, 2009, which is incorporated herein by reference. | ||||
| (40) |
Form of Non-Qualified Stock Option Agreement for Executive Employees for grants made on and after September 1, 2009. | Reference is made to Exhibit 10.2 of the registrant’s Form 8-K as filed with the Commission on September 8, 2009, which is incorporated herein by reference. | ||||
91
Table of Contents
Index to Financial Statements
| (41) |
Form of 2010 Performance Stock Award Agreement for grants made on and after September 1, 2009. | Reference is made to Exhibit 10.3 of the registrant’s Form 8-K as filed with the Commission on September 8, 2009, which is incorporated herein by reference. | ||||
| (42) |
Form of Restricted Stock Award Agreement for grants made on and after September 1, 2009. | Reference is made to Exhibit 10.4 of the registrant’s Form 8-K as filed with the Commission on September 8, 2009, which is incorporated herein by reference. | ||||
| (43) |
Zep Inc. 2010 Omnibus Incentive Plan. | Reference is made to Exhibit A of the registrant’s 2010 Proxy Statement, as filed with the Commission on November 19, 2009, which is incorporated herein by reference. | ||||
| (44) |
Zep Inc. 2010 Omnibus Incentive Plan Form of Restricted Stock Award Agreement for Non-Employee Directors. | Reference is made to Exhibit 10(d) of the registrant’s Form 10-Q for the fiscal quarter ended February 28, 2010, as filed with the Commission on April 7, 2010, which is incorporated herein by reference. | ||||
| (45) |
Amendment No. 2 to the Zep, Inc. Supplemental Deferred Savings Plan, dated January 8, 2010. | Reference is made to Exhibit 10(e) of the registrant’s Form 10-Q for the fiscal quarter ended February 28, 2010, as filed with the Commission on April 7, 2010, which is incorporated herein by reference. | ||||
| (46) |
Separation and Termination Agreement, dated as of July 16, 2010, by and between Zep Inc and C. Francis Whitaker III. | Reference is made to Exhibit 10.1 of registrant’s Form 8-K as filed with the Commission on July 21, 2009, which is incorporated herein by reference. | ||||
| (47) |
Amendment to Change-in-Control Agreement and Severance Agreement, dated as of August 20, 2010, by and between Zep Inc. and John K. Morgan. | Reference is made to Exhibit 10.1 of registrant’s Form 8-K as filed with the Commission on August 23, 2009, which is incorporated herein by reference. | ||||
| (48) |
Zep Inc. Amended and Restated Supplemental Deferred Savings Plan, effective as of October 5, 2010. | Filed with the Commission as part of this Form 10-K. | ||||
| (49) |
Amendment, effective as of October 5, 2010, to the Zep Inc. 2010 Omnibus Incentive Plan. | Filed with the Commission as part of this Form 10-K. | ||||
| (50) |
Form of Amendment to Change-in-Control Agreement and Severance Agreement, effective as of October 5, 2010. | Filed with the Commission as part of this Form 10-K. | ||||
92
Table of Contents
Index to Financial Statements
| (51) |
Form of Incentive Stock Options Agreement for Executive Employees for grants under the 2010 Omnibus Incentive Plan. | Filed with the Commission as part of this Form 10-K. | ||||
| (52) |
Form of Non-Qualified Stock Options Agreement for Executive Employees for grants under the 2010 Omnibus Incentive Plan. | Filed with the Commission as part of this Form 10-K. | ||||
| (53) |
Form of Performance Stock Award Agreement for grants under the 2010 Omnibus Incentive Plan. | Filed with the Commission as part of this Form 10-K. | ||||
| (54) |
Form of Restricted Stock Award Agreement for grants under the 2010 Omnibus Incentive Plan. | Filed with the Commission as part of this Form 10-K. | ||||
| (55) |
Form of Restricted Stock Award Agreement for Retiring Nonemployee Director. | Filed with the Commission as part of this Form 10-K. | ||||
| EXHIBIT 12 |
Statement Regarding Computation of Ratios of Earnings to Fixed Charges. | Filed with the Commission as part of this Form 10-K. | ||||
| EXHIBIT 21 |
List of Subsidiaries. | Filed with the Commission as part of this Form 10-K. | ||||
| EXHIBIT 23 |
Consent of Independent Registered Public Accounting Firm. | Filed with the Commission as part of this Form 10-K. | ||||
| EXHIBIT 24 |
Powers of Attorney. | Filed with the Commission as part of this Form 10-K. | ||||
| EXHIBIT 31 |
(a) |
Rule 13a-14(a)/15d-14(a) Certification, signed by John K. Morgan | Filed with the Commission as part of this Form 10-K. | |||
| (b) |
Rule 13a-14(a)/15d-14(a) Certification, signed by Mark R. Bachmann | Filed with the Commission as part of this Form 10-K. | ||||
| EXHIBIT 32 |
(a) |
Section 1350 Certification, signed by John K. Morgan | Filed with the Commission as part of this Form 10-K. | |||
| (b) |
Section 1350 Certification, signed by Mark R. Bachmann | Filed with the Commission as part of this Form 10-K. | ||||
93
Table of Contents
Index to Financial Statements
Pursuant to the requirements of Section 13 or 15(d) of the Securities Exchange Act of 1934, the registrant has duly caused this report to be signed on its behalf by the undersigned, thereunto duly authorized.
| Zep Inc. | ||||
| Date: November 8, 2010 | By: | /s/ JOHN K. MORGAN | ||
| John K. Morgan Chairman, President, and Chief Executive Officer | ||||
Pursuant to the requirements of the Securities Exchange Act of 1934, this report has been signed below by the following persons on behalf of the registrant and in the capacities and on the dates indicated.
| Signature |
Title |
Date | ||||
| /s/ JOHN K. MORGAN John K. Morgan |
Chairman, President, and Chief Executive Officer (Principal Executive Officer) |
November 8, 2010 | ||||
| /s/ MARK R. BACHMANN Mark R. Bachmann |
Executive Vice President and Chief Financial Officer (Principal Financial and Accounting Officer) |
November 8, 2010 | ||||
| * Earnest W. Deavenport, Jr. |
Director |
November 8, 2010 | ||||
| * Timothy T. Tevens |
Director |
November 8, 2010 | ||||
| * O.B. Grayson Hall, Jr. |
Director |
November 8, 2010 | ||||
| * Joseph Squicciarino |
Director |
November 8, 2010 | ||||
| * Ronald D. Brown |
Director |
November 8, 2010 | ||||
| * Sidney J. Nurkin |
Director |
November 8, 2010 | ||||
| * J. Veronica Biggins |
Director |
November 8, 2010 | ||||
| *BY: | /s/ Mark R. Bachmann Mark R. Bachmann |
Executive Vice President and Chief Financial Officer (Principal Financial and Accounting Officer) |
November 8, 2010 | |||
94
Table of Contents
Index to Financial Statements
Zep Inc.
VALUATION AND QUALIFYING ACCOUNTS
FOR THE YEARS ENDED AUGUST 31, 2010, 2009, AND 2008
(in thousands)
| Balance at Beginning of Year |
Additions and Reductions Charged to |
Deductions | Balance at End of Year |
|||||||||||||||||
| Costs and Expenses |
Other Accounts |
|||||||||||||||||||
| Year Ended August 31, 2010: |
||||||||||||||||||||
| Reserve for doubtful accounts |
$ | 4,955 | 2,940 | — | 2,900 | $ | 4,995 | |||||||||||||
| Reserve for estimated returns and allowances |
$ | 500 | 13,868 | — | 13,944 | $ | 424 | |||||||||||||
| Year Ended August 31, 2009: |
||||||||||||||||||||
| Reserve for doubtful accounts |
$ | 3,329 | 5,608 | — | 3,982 | $ | 4,955 | |||||||||||||
| Reserve for estimated returns and allowances |
$ | 420 | 13,516 | — | 13,436 | $ | 500 | |||||||||||||
| Year Ended August 31, 2008: |
||||||||||||||||||||
| Reserve for doubtful accounts |
$ | 3,503 | 2,532 | — | 2,706 | $ | 3,329 | |||||||||||||
| Reserve for estimated returns and allowances |
$ | 670 | 13,433 | — | 13,683 | $ | 420 | |||||||||||||
95