Attached files
Table of Contents
UNITED STATES
SECURITIES AND EXCHANGE COMMISSION
Washington, D.C. 20549
FORM 10-K
(Mark One)
| x | ANNUAL REPORT PURSUANT TO SECTION 13 OR 15(d) OF THE SECURITIES EXCHANGE ACT OF 1934 |
For the fiscal year ended August 31, 2009.
OR
| ¨ | TRANSITION REPORT PURSUANT TO SECTION 13 OR 15(d) OF THE SECURITIES EXCHANGE ACT OF 1934 |
For the transition period from to .
Commission file number 001-33633.
Zep Inc.
(Exact name of registrant as specified in its charter)
| Delaware | 26-0783366 | |
| (State or other jurisdiction of incorporation or organization) | (I.R.S. Employer Identification Number) | |
| 1310 Seaboard Industrial Boulevard, Atlanta, Georgia |
30318-2825 | |
| (Address of principal executive offices) | (Zip Code) | |
(404) 352-1680
(Registrant’s telephone number, including area code)
Securities registered pursuant to Section 12(b) of the Securities Exchange Act of 1934:
| Title of Each Class |
Name of Each Exchange on which Registered | |
| Common Stock ($0.01 Par Value) | New York Stock Exchange | |
| Preferred Stock Purchase Rights | New York Stock Exchange |
Securities registered pursuant to Section 12(g) of the Act: None
Indicate by checkmark if the registrant is a well-known seasoned issuer, as defined in Rule 405 of the Securities Act. Yes ¨ No x
Indicate by checkmark if the registrant is not required to file reports pursuant to Section 13 or Section 15(d) of the Act. Yes ¨ No x
Indicate by check mark whether the registrant (1) has filed all reports required to be filed by Section 13 or 15(d) of the Securities Exchange Act of 1934 during the preceding 12 months (or for such shorter period that the registrant was required to file such reports), and (2) has been subject to such filing requirements for the past 90 days. Yes x No ¨
Indicate by check mark whether the registrant has submitted electronically and posted on its corporate Web site, if any, every Interactive Data File required to be submitted and posted pursuant to Rule 405 of Regulation S-T (§232.405 of this chapter) during the preceding 12 months (or for such shorter period that the registrant was required to submit and post such files). Yes ¨ No ¨
Indicate by check mark if disclosure of delinquent filers pursuant to Item 405 of Regulation S-K (§229.405 of this chapter) is not contained herein, and will not be contained, to the best of registrant’s knowledge, in definitive proxy or information statements incorporated by reference in Part III of this Form 10-K or any amendment to this Form 10-K. x
Indicate by check mark whether the registrant is a large accelerated filer, an accelerated filer, a non-accelerated filer, or a smaller reporting company. See the definitions of “large accelerated filer,” “accelerated filer,” and “smaller reporting company” in Rule 12b-2 of the Exchange Act. (Check one):
Large Accelerated Filer ¨ Accelerated Filer x Non-accelerated Filer ¨ Smaller reporting company ¨
Indicate by check mark whether the registrant is a shell company (as defined in Rule 12b-2 of the Act). Yes ¨ No x
Based on the closing price of the registrant’s common stock of $7.91 as quoted on the New York Stock Exchange on February 28, 2009, the aggregate market value of the voting stock held by nonaffiliates of the registrant was $99,127,503.
The number of shares outstanding of the registrant’s common stock, $0.01 par value, was 21,593,077 shares as of October 23, 2009.
Documents Incorporated by Reference
| Location in Form 10K |
Incorporated Document | |
| Part III | Proxy Statement for January 7, 2010 Annual Meeting of Stockholders |
Table of Contents
Zep Inc.
| Page No. | ||||
| Part I |
||||
| Item 1. |
1 | |||
| Item 1a. |
7 | |||
| Item 1b. |
19 | |||
| Item 2. |
19 | |||
| Item 3. |
19 | |||
| Item 4. |
21 | |||
| Part II |
||||
| Item 5. |
22 | |||
| Item 6. |
24 | |||
| Item 7. |
Management’s Discussion and Analysis of Financial Condition and Results of Operations |
25 | ||
| Item 7a. |
41 | |||
| Item 8. |
43 | |||
| Item 9. |
Changes in and Disagreements with Accountants on Accounting and Financial Disclosure |
80 | ||
| Item 9a. |
80 | |||
| Item 9b. |
80 | |||
| Part III |
||||
| Item 10. |
81 | |||
| Item 11. |
81 | |||
| Item 12. |
Security Ownership of Certain Beneficial Owners and Management and Related Stockholder Matters |
81 | ||
| Item 13. |
Certain Relationships and Related Transactions, and Director Independence |
81 | ||
| Item 14. |
81 | |||
| Part IV |
||||
| Item 15. |
82 | |||
| 89 | ||||
| 90 | ||||
Table of Contents
PART I
Zep Inc. (“Zep” or the “Company”) is a producer, marketer, and service provider of a wide range of cleaning and maintenance solutions for commercial, industrial, institutional, and consumer end-markets. Our product portfolio includes anti-bacterial and industrial hand care products, cleaners, degreasers, deodorizers, disinfectants, floor finishes, sanitizers, and pest and weed control products. We continually refresh our product portfolio and service offerings through the introduction of new products and formulations as well as new services to meet the demands of the industry and our customers. We market these products and services under well recognized and established brand names, such as Zep®, Zep Commercial®, Zep Professional, Enforcer®, and Selig™, some of which have been in existence for more than 70 years. We reach our customers through an experienced, international organization of sales representatives supported by highly skilled marketing, research and development and technical services teams, who collectively provide creative solutions for our customers’ diverse cleaning and maintenance needs by utilizing their extensive product expertise and providing customized value added services that we believe distinguish us among our competitors. We believe our highly trained and experienced representatives further differentiate us from our competition by providing knowledge and consultation that reduce our customers’ total cost of ownership.
Through our direct sales organization, we provide convenient, highly effective cleaning and maintenance solutions to approximately 240,000 customers in a broad array of commercial, industrial, and institutional end-markets, including transportation, food processing and service, manufacturing, government, and housekeeping. These customers include government entities and businesses ranging from small sole proprietorships to large corporations. In fiscal year 2009 we introduced our Zep Professional brand to customers within these end-markets who prefer to acquire product through the distribution channel. Additionally, our products are sold to contractors, small business owners, and homeowners who want to purchase professional strength cleaning products through large and small home improvement retailers. The home improvement channel is supported by sales and management personnel who focus on customers such as The Home Depot, Inc., Wal-Mart Stores, Inc., Ace Hardware Corporation, True Value Company, Lowe’s Companies, Inc., and Menard, Inc.
We sell our products to customers primarily in the United States (78% of 2009 net sales), Canada (12% of 2009 net sales), and Western Europe (10% of 2009 net sales). For the fiscal year ended August 31, 2009, we generated net sales of $501.0 million and net income of $9.3 million.
Our separation from Acuity Brands, Inc.
We were spun-off from Acuity Brands, Inc. (“Acuity Brands”) effective October 31, 2007 through a distribution of 100% of the common stock of Zep to Acuity Brands’ stockholders (the “Distribution”). Following the Distribution, Acuity Brands does not own any of our shares as the spin-off rendered us an independent public company. Our common stock is listed on the New York Stock Exchange under the ticker symbol “ZEP.” Further discussion of the Distribution is provided within the Overview section of Item 7. Management’s Discussion and Analysis of Financial Condition and Results of Operation.
1
Table of Contents
Brands
We market our products and services under well recognized and established brand names, such as Zep, Zep Commercial, Zep Professional, Enforcer, and Selig, some of which have been in existence for more than 70 years. A summary of our strong portfolio of brands, which provide customers with highly valued products and services across a broad array of commercial, industrial, institutional, and consumer end-markets is provided below:
| • | Zep is our flagship brand and represents our largest portfolio of cleaning and maintenance solutions for commercial, industrial, and institutional customers needing highly effective product solutions and professional technical support. |
| • | Zep Commercial provides professional cleaning and plumbing chemical products targeted to contractors and small business owners and is currently sold through The Home Depot, HD Supply and other retailers. |
| • | Zep Professional was introduced in fiscal year 2009 and represents our portfolio of cleaning and maintenance solutions that are offered to customers in the commercial, industrial, and institutional end-markets who prefer to acquire product through the distribution channel. |
| • | Enforcer provides retail plumbing and pest and weed control products sold through home improvement retailers. |
| • | Selig offers a limited assortment of cleaning solutions targeted to commercial, industrial and institutional customers. The Selig product line was merged into the Zep industrial and institutional product offering during fiscal year 2008, and redundant products were eliminated. |
We have licenses for two other brands, the ArmorAll® Professional brand and a line of cleaners under the Rubbermaid® Commercial brand. We licensed the ArmorAll Professional name from The Clorox Company in 2002 to produce and sell a premium line of cleaning products for the transportation end-market. In 2003, we licensed and developed a line of cleaners under the Rubbermaid Commercial brand name that we currently sell primarily to Wal-Mart and Menards.
Industry
According to market research that we utilize, the United States commercial, industrial, and institutional cleaning chemicals market is an estimated $10.5 billion market. We believe we are one of the top four market leaders, which together hold slightly less than 30% of the total market share. We estimate that our greater than 3% market share trails only that of Ecolab Inc. and JohnsonDiversey Holdings, Inc. The market is highly fragmented and is served by hundreds of regional and niche participants who sell either directly to end-users or through distributors. Approximately two-thirds of the market is currently served through distributors while one-third of the market is currently served through direct sales. We are a market leader in the direct sales channel and the significant majority of our historical revenues have come from this channel. In general, the commercial, industrial, and institutional end-market enjoys growth consistent with GDP due to favorable end-market demographics, increasing government regulations, health and safety concerns, and consumer demand for cleanliness. In October 2008, we announced our entrance into the industrial distribution channel through the forging of strategic alliances with several world-class distributors. We anticipate that significant revenue growth can be achieved as we execute on our long-term strategy of entering and penetrating the $7.2 billion industrial distribution channel. These efforts, we anticipate, could produce 10-15% of our revenues.
Additionally, based on internal and industry research, we estimate the total size of the retail cleaning chemicals market is approximately $5.8 billion. This market is served through channels including grocery, mass merchandisers, home improvement, drug, and other specialty retailers. We primarily sell through the home improvement channel, which only serves a portion of the overall retail cleaning chemicals market.
2
Table of Contents
While consumption of cleaning and maintenance products is somewhat discretionary, in health-driven, sophisticated markets such as North America and Western Europe, health and safety regulations and customer expectations can somewhat buffer demand downturns. Increased legislation regulating food, health, and safety requires increased frequency of use, thus fueling increases in demand. Health and safety regulations are also shrinking the pool of available chemicals. Together, these trends are driving demand and development of improved product formulations and application methods.
We believe end-users in our markets are beginning to demand more effective and efficient products. Additionally, many corporate buyers are increasing centralized corporate buying activities and consolidating their respective purchases and suppliers. These demand factors should offer opportunities for broad product line suppliers like us, with national presence and support, formulation expertise, and distribution capabilities.
Our Products, Services, and Customers
Products. We produce a wide range of cleaning and maintenance solutions for commercial, industrial, institutional, and consumer customers. We have more than 2,300 unique formulations that are used in manufacturing products for our customers.
Services. We have a well-trained and experienced sales team, supported by our highly skilled research and development and technical services teams that provide creative customized solutions for our customers’ diverse cleaning and maintenance needs. We provide value-added services to customers on application uses, safety aspects, product selection, specific formulations, inventory management, customer employee training, and equipment and dispensers. Accordingly, our customers benefit from a more effective solution that includes a total cost of ownership for their cleaning and maintenance needs that we believe is superior to many of our competitors’ offerings.
Customers. We sell cleaning and maintenance solutions directly to approximately 240,000 customers. Our commercial, industrial, and institutional customers include government entities and businesses ranging from small sole proprietorships to large corporations as well as distributors. In addition, our cleaning and maintenance solutions are sold to contractors, small business owners, and homeowners who want to purchase professional strength cleaning products through home improvement retailers such as The Home Depot, Wal-Mart, Ace Hardware, True Value, Lowe’s and Menards. Net sales from The Home Depot, our largest customer, accounted for approximately 11%, 10%, and 11% of our total net sales during the three fiscal years ended August 31, 2009, respectively. Our next largest customer accounted for less than 1.5% of our net sales during the three fiscal years ended August 31, 2009.
3
Table of Contents
Our cleaning and maintenance solutions are developed for customers in targeted end-markets, including the transportation, food processing and service, manufacturing, government, housekeeping, and contractors and small business owners markets. A summary of our product offerings, our representative brands, and the customers served in each of these end-markets is provided in the table below.
| END-MARKETS |
KEY PRODUCTS OFFERED |
BRANDS |
CUSTOMERS | |||
| Transportation |
Interior and exterior vehicle cleaning products, solvents, degreasers, parts washers, lubricants, and hand care products | • Zep • Selig • Zep Commercial • Zep Professional • ArmorAll Professional |
Automotive repair facilities, car washes, car dealers, aircraft, public transport, car rental facilities, trucks, trains, and construction vehicles | |||
| Food Processing and Service |
Cleaners and sanitizers, kitchen cleaners, deodorizers, hand care products, and dispensing equipment | • Zep • Selig • Zep Professional |
Farms, meat processing facilities, bakeries, grocery stores, and full and quick-serve restaurants | |||
| Manufacturing |
Cleaners, degreasers, solvents, parts washers, lubricants, and hand care products | • Zep • Selig • Zep Professional |
Professional maintenance and engineering staff in manufacturing, pharmaceutical, and mining industries | |||
| Government |
Cleaners, degreasers, floor care, hand care products, deodorizers, and dispensing equipment | • Zep • Selig • Zep Professional |
Federal, state and local government agencies, including cities, school districts, military, and police and fire departments | |||
| Housekeeping |
Floor care, laundry systems, bathroom care, glass care, deodorizers, hand care products, and other janitorial products | • Zep • Selig • Zep Professional |
Hospitality, healthcare, entertainment, and other industries that use janitorial housekeeping products | |||
| Contractors and Small Business Owners |
Cleaners, degreasers, floor care, bathroom care, glass care, drain care, pressure wash products, and pest control products | • Zep Commercial • Enforcer • Rubbermaid Commercial |
Small business owners, contractors, and homeowners | |||
Sales and Service Organization
We reach our customers primarily through an experienced, international organization of sales representatives. Our compensation model is primarily commission-based. Net sales are largely dependent on the hiring, training, and retention of our commissioned sales representatives. Our sales and service organization covers the United States, Canada, Italy, Belgium, Luxemburg, the Netherlands and certain other smaller markets.
Manufacturing
We manufacture products at six facilities located in the United States, Canada, the Netherlands, and Italy. The three United States facilities produce approximately 90% of our manufactured product; the Canadian facility produces approximately 6%; and the two European facilities produce approximately 4%. Certain finished goods purchased from contract manufacturers and finished goods suppliers supplement the manufactured product line. Sales of outsourced product, which is product manufactured for us by third party suppliers, currently account for approximately 20% of our net sales
4
Table of Contents
volume. Outsourced product is predominately manufactured in the United States. Management does not believe the loss of any one supplier of outsourced product would have a material adverse impact on our results of operations.
Distribution
Products sold to commercial, industrial, and institutional end-markets are shipped from more than 30 strategically located branch warehouses throughout North America and Europe, which are supplied directly from our production facilities, and by one large distribution center in Atlanta, Georgia. Products sold to home improvement retailers are distributed nationwide from another facility located in Georgia. Our products are primarily delivered through common and local carriers.
Research and Development
We employ approximately 20 chemists and technical support personnel who develop product systems that provide comprehensive solutions for broad-based customer applications and who work in our technical services area supporting both our sales representatives and customers. Efforts to enhance existing formulations by utilizing new raw materials or combinations of raw materials have resulted in both new and improved products. Special emphasis has been placed on the development of environmentally preferable products based on renewable and environmentally preferred raw materials, such as the continued expansion of our GreenLink™ product line, introduction of products for the automotive market under the EnviroEdge™ name, and the launch of the Provisions™ food service cleaning product line, which is composed of biodegradable detergents and cleansers ideally suited for the growing food segment. Technical expertise is employed to incorporate proven technologies into new applications. Our research and development expense for the three years ended August 31, 2009, has ranged between approximately $1.5 million and $2.5 million.
Competition
The cleaning and maintenance solutions industry is highly competitive. Overall, competition is fragmented in the commercial, industrial, and institutional end-markets, with numerous local and regional operators selling directly to customers, distributors, and a few national competitors. Many of these competitors offer products in some, but not all, of the markets we serve. Competition is based primarily on brand name recognition, price, product quality, and customer service. Competitors in the commercial, industrial, and institutional end-market include but are not limited to Ecolab Inc., JohnsonDiversey Holdings, Inc., Arch Chemicals, Inc., RPM International, Inc., NCH Corporation, Rochester Midland Corporation, and State Chemical Manufacturing Company. Many companies compete within the broader retail market for cleaning chemical products including but not limited to Church & Dwight Co., Inc., Procter and Gamble, WD-40 Company, Reckitt Benckiser plc, S.C. Johnson & Sons, Inc., Sunshine Makers, Inc., and The Clorox Company. We also compete in the home improvement channel with pest control companies such as Bayer, A.G., Spectrum Brands, Inc., and The Scott’s Company. Furthermore, barriers to entry and expansion in the industry are low, which may lead to additional competitive pressure in the future.
Patents, Licenses, and Trademarks
We own or have licenses to use various domestic and foreign patents and trademarks related to our formulations and products, processes, and businesses. These intellectual property rights, particularly our trademarks and formulations relating to our products, are important factors for our businesses. While patents and patent applications in the aggregate are important to our competitive position, no single patent or patent application is material to us.
5
Table of Contents
To protect these proprietary rights, we rely on copyright, patent, trade secret, and trademark laws. Despite these protections, unauthorized parties may attempt to infringe on our intellectual property. Our management is not aware of any such material unauthorized use or of any pending claims where we do not have the right to use any intellectual property material to our business.
Raw Materials
The key raw materials we use in our products are surfactants, polymers and resins, fragrances, water, solvents and other petroleum-based materials, and packaging materials. We purchase most raw materials on the open market and rely on third parties for the sourcing of some finished goods. Accordingly, the cost of products sold may be affected by changes in the market price of the above-mentioned raw materials or the sourcing of finished goods. Due to the mix of purchases (raw materials, components parts, and finished goods), timing of price increases, and other economic and competitive forces within the supply chain, it is not possible to determine the financial impact of future changes in the market price of these raw materials.
We do not engage in significant commodity hedging transactions for raw materials, though we have committed and will continue to commit to purchase certain materials for specified periods of time. Many of the raw materials we use are petroleum-based and, therefore, subject to the availability and price of oil or its derivatives. Significant increases in the prices of our products due to increases in the cost of raw materials could have a negative effect on demand for products and on profitability. While we have generally been able to pass along these increases in cost in the form of higher selling prices for our products over time, some customer conservation may have a negative impact on our sales volume. There can be no assurance that future disruptions in either supply or price of these materials will not negatively affect future results.
We constantly monitor and investigate alternative suppliers and materials based on numerous attributes including quality, service, and price. Our ongoing efforts to improve the cost effectiveness of our products and services may result in a reduction in the number of our suppliers. A reduction in the number of suppliers could cause increased risk associated with reliance on a limited number of suppliers for certain raw materials and finished goods.
Seasonality and Cyclicality
Our business exhibits some seasonality, with net sales being affected by weather and the annual budget cycles of major customers. Historically, due to this seasonality and the number of available selling days, the second half of our fiscal year is much stronger in terms of sales, earnings, and cash flow than the first half. In addition, our net sales are dependent on the retail, wholesale, and industrial markets and demand for these markets is generally associated with GDP, unemployment levels, industrial production, and housing construction in the United States. Economic downturns and the potential decline in key markets and demand for cleaning and maintenance products may have a material adverse effect on our net sales and operating income.
Environmental Regulation
Our operations are subject to federal, state, local, and foreign laws and regulations relating to the generation, storage, handling, transportation, and disposal of hazardous substances and solid and hazardous wastes, and to the remediation of contaminated sites. Permits and environmental controls are required for certain of our operations to limit air and water pollution, and these permits are subject to modification, renewal, and revocation by issuing authorities. We will incur capital and operating costs relating to environmental compliance on an ongoing basis. Environmental laws and regulations have generally become stricter in recent years, and the cost of responding to future changes may be
6
Table of Contents
substantial. While we believe that we are currently in substantial compliance with all material environmental laws and regulations, there can be no assurance that we will not incur significant costs to remediate violations of such laws and regulations, particularly in connection with acquisitions of existing operating facilities, or to comply with changes in, or stricter or different interpretations of, existing laws and regulations. Such costs could have a material adverse effect on our results of operations.
Employees
As of August 31, 2009, we had approximately 2,200 employees, including 1,580 in the United States, 270 in Canada, and 350 in Europe. Of our approximately 2,200 employees, we estimate that 240 were members of eight unions in the United States and Europe. Approximately 11% of Zep’s total work force is covered by collective bargaining agreements. Collective bargaining agreements representing a de minimis amount (less than 1%) of the Company’s work force will expire within one year.
International Operations
See Note 11: Geographic Distribution of Operations of the Notes to Consolidated and Combined Financial Statements for information regarding the geographic distribution of net sales, operating profit, and long-lived assets.
Information Concerning Zep Inc.
We were incorporated in 2007 under the laws of Delaware. We make our Annual Reports on Form 10-K, Quarterly Reports on Form 10-Q, Current Reports on Form 8-K (and all amendments to these reports), together with all reports filed pursuant to Section 16 of the Securities Exchange Act of 1934 by our officers, directors, and beneficial owners of 10% or more of our common stock, available free of charge through the “SEC Filings” link on our website, located at www.zepinc.com, as soon as reasonably practicable after they are filed with or furnished to the SEC. Information included on our website is not incorporated by reference into this Annual Report on Form 10-K. Our reports are also available at the Securities and Exchange Commission’s Public Reference Room at 100 F Street, NE, Washington, DC 20549 or on their website at www.sec.gov.
Additionally, we have adopted a written Code of Ethics and Business Conduct that applies to all of our directors, officers, and employees, including its principal executive officer and senior financial officers. The Code of Ethics and Business Conduct and our Corporate Governance Guidelines are available free of charge through the “Corporate Governance” link on our website at www.zepinc.com. Additionally, the charters for our Audit Committee, Compensation Committee, and Nominating and Corporate Governance Committee, and the rules and procedures relating thereto, are available free of charge through the “Corporate Governance” link on our website. Each of the Code of Ethics and Business Conduct, the Corporate Governance Guidelines, and the committee charters is available in print to any of our stockholders by written request. Such requests should be directed to the Corporate Secretary, Zep Inc., 1310 Seaboard Industrial Boulevard, Atlanta, Georgia 30318.
Risks Related to our Business
Our results can be adversely affected by fluctuations in the cost or availability of materials used in our manufacturing processes.
The key raw materials we use in our products, which are surfactants, polymers and resins, fragrances, water, and solvents and other petroleum-based materials, and packaging materials, are subject to price fluctuations. Further, we do not engage in significant commodity hedging transactions for raw materials,
7
Table of Contents
though we have committed and will continue to commit to purchase certain materials for specified periods of time. Significant increases in the prices of our products due to increases in the cost of raw materials or packaging materials could have a negative effect on demand for products and on profitability. Many of the raw materials that we use are energy dependent, and, therefore are subject to the availability and price of energy related inputs such as oil and natural gas. Failure to effectively manage future increases in the costs of these materials could adversely affect our ability to achieve operating margins acceptable to stockholders. Furthermore, there are a limited number of suppliers for some of our raw materials, packaging materials, and finished goods. Our profitability and volume could be negatively impacted by limitations inherent within the supply chain of certain of these materials, including competitive conditions, governmental issues, legal issues, natural disasters, and other events that could impact both the availability and price of the materials.
We face significant competition and may face more significant competition in the future.
The cleaning and maintenance solutions industry is highly competitive. Overall, our competition is fragmented in the commercial, industrial, and institutional end-market, with numerous local and regional operators selling directly to customers, distributors, and a few national competitors. Many of these competitors offer products in some of the markets we serve. Competition is based primarily on brand name recognition, price, product quality, and customer service. Competitors in the commercial, industrial, and institutional end-market include but are not limited to Ecolab Inc., JohnsonDiversey Holdings, Inc., Arch Chemicals, Inc., RPM International, Inc., NCH Corporation, Rochester Midland Corporation, and State Chemical Manufacturing Company. Many companies compete within the broader retail market for cleaning chemical products including but not limited to Church & Dwight Co., Inc., Procter and Gamble, WD-40 Company, Reckitt Benckiser plc, S.C. Johnson & Sons, Inc., Sunshine Makers, Inc., and The Clorox Company. We also compete in the home improvement channel with pest control companies such as Bayer, A.G., Spectrum Brands, Inc., and The Scott’s Company. Furthermore, barriers to entry and expansion in the industry are low, which may lead to additional competitive pressure in the future. We cannot assure you that we will be able to continue to compete successfully against current or future competitors or that change in the source or intensity of competitive pressure in the industry will not result in reduced market share that could negatively impact our results of operations, financial condition, or cash flows.
We are subject to a broad range of environmental, health, and safety laws and regulations in the jurisdictions in which we operate, and we may be exposed to substantial environmental, health, and safety costs and liabilities.
We are subject to a broad range of environmental, health, and safety laws and regulations in the jurisdictions in which we operate. These laws and regulations impose increasingly stringent environmental, health, and safety protection standards and permitting requirements regarding, among other things, air emissions, wastewater storage, treatment, and discharges, the use and handling of hazardous or toxic materials, waste disposal practices, and the remediation of environmental contamination and working conditions for our employees. Some environmental laws, such as Superfund, the Clean Water Act, and comparable laws in U.S. states and other jurisdictions world-wide, impose joint and several liability for the cost of environmental remediation, natural resource damages, third party claims, and other expenses, without regard to the fault or the legality of the original conduct, on those persons who contributed to the release of a hazardous substance into the environment. These laws may impact the manufacture and distribution of our products and place restrictions on the products we can sell in certain geographical locations.
The costs of complying with these laws and regulations, including participation in assessments and remediation of contaminated sites and installation of pollution control facilities, have been, and in the future could be, significant. In addition, these laws and regulations may also result in substantial environmental liabilities associated with divested assets, third party locations, and past activities. We
8
Table of Contents
have established reserves for environmental remediation activities and liabilities where appropriate. However, the cost of addressing environmental matters (including the timing of any charges related thereto) cannot be predicted with certainty, and these reserves may not ultimately be adequate, especially in light of potential changes in environmental conditions, changing interpretations of laws and regulations by regulators and courts, the discovery of previously unknown environmental conditions, the risk of governmental orders to carry out additional compliance on certain sites not initially included in remediation in progress, our potential liability to remediate sites for which provisions have not previously been established and the adoption of more stringent environmental laws. Such future developments could result in increased environmental costs and liabilities and could require significant capital and other ongoing expenditures, any of which could have a material adverse effect on our financial condition or results of operations. Furthermore, the failure to comply with our obligations under the environmental laws and regulations could subject us to administrative, civil, or criminal penalties, obligations to pay damages or other costs, and injunctions or other orders, including orders to cease operations. In addition, the presence of environmental contamination at our properties could adversely affect our ability to sell property, receive full value for a property, or use a property as collateral for a loan.
In June 2007, we reached a final resolution of the investigation by the United States Department of Justice (the “DOJ”) of certain environmental issues at our primary manufacturing facility located in Atlanta, Georgia. In connection with this resolution, we are subject to a three-year probation period that incorporates a compliance agreement with the United States Environmental Protection Agency (the “EPA”). Under the compliance agreement, we are required to maintain an enhanced compliance program. This matter is not expected to lead to a material loss of business, any disruption of production, or materially higher operating costs. However, in the event of our material breach of the compliance agreement, those consequences could occur.
We are currently a party to federal and state administrative proceedings arising under federal and state laws enacted for the protection of the environment where a state or federal agency or a private party alleges that hazardous substances generated by Zep have been discharged into the environment and a state or federal agency is requiring a cleanup of soil and/or groundwater pursuant to federal or state superfund laws. In each of these proceedings in which Zep has been named as a party that allegedly generated hazardous substances that were transported to a waste site owned and operated by another party, either (1) Zep is one of many other identified generators who have reached an agreement on the allocation of costs for cleanup among the various generators and Zep’s potential liability is not material; (2) Zep has been identified as a potential generator and the sites have been remediated by the EPA or by a state for a cost that is not material; or (3) other generators have cleaned up the site and have not pursued a claim against Zep and Zep’s liability, if any, would not be material.
Our property on Seaboard Industrial Boulevard is the only active site involving property which we own and where we have been named as a potentially responsible party. We and the current and former owners of adjoining properties have agreed to share the expected costs and responsibilities of implementing an approved corrective action plan, submitted in 2004, under the Georgia Hazardous Response Act (“HSRA”) to periodically monitor property along a nearby stream for a period of five years ending in December 2009. The Georgia Environmental Protection Division (the “EPD”) is reviewing the monitoring program and will determine if additional monitoring is necessary and for what period of time. Subsequently, in connection with the DOJ investigation described earlier, we and the EPA each analyzed samples taken from certain sumps at the Seaboard facility. The sample results from some of the sump tests indicated the presence of certain hazardous substances. As a result, we notified the EPD and conducted additional soil and groundwater studies pursuant to HSRA. We are continuing to negotiate with the EPD on the scope of the Corrective Action Plan we submitted to address the subsurface contamination north of Seaboard Industrial Boulevard, and have executed a Consent Order with the EPD covering this remediation.
9
Table of Contents
In January 2008, the EPA issued a Notice of Violation and document request regarding the use and management of certain trench drains at the Seaboard production facility as well as assorted minor waste labeling issues. The Company executed a Consent Order with the EPA in March 2009 that resolved this matter. Resolution involved the remittance of a penalty and modification of certain manufacturing practices, neither of which had a material impact on the Company’s results of operations or financial condition.
In May 2007, we accrued an undiscounted pre-tax liability of $5.0 million representing our best estimate of costs associated with voluntary subsurface remediation, primarily to remove contaminants from soil underlying one of our manufacturing facilities, and other related environmental issues. While over approximately the next three years, we could expend an amount ranging up to $7.5 million on these efforts, our best estimate of voluntary remediation costs continues to be $5.0 million. To date, we have expended approximately $1.5 million of the $5.0 million reserve established in May 2007. Further sampling, engineering studies, changes in regulatory requirements and/or final resolution of the proposed consent order could cause us to revise the current estimate. We believe that additional expenditures after three years of remediation may be necessary and that those expenditures, based on currently available information, could range up to an additional $10.0 million during the subsequent twenty-five year period. It may be appropriate to capitalize certain of the expenditures that may be incurred in this twenty-five year period. We arrived at the current estimates on the basis of studies prepared by independent third party environmental consulting firms. The actual cost of remediation will vary depending upon the results of additional testing and geological studies, the success of initial remediation efforts in the first five years addressing the most significant areas of contamination, the rate at which site conditions may change, and the requirements of the EPD.
We may develop unexpected legal contingencies or lose insurance coverage.
We are subject to various claims, including legal claims arising in the normal course of business. As of August 31, 2008, we were insured up to specified limits for certain types of claims with a self-insurance retention of $0.5 million per occurrence, including toxic tort and other product liability claims, and are fully self-insured for certain other types of claims, including environmental, product recall, commercial disputes, patent infringement and errors and omissions. Based on our historical claims experience, our comprehensive general liability self-insurance retention limits have been increased to $1.5 million per occurrence for claims incurred after August 31, 2008. We establish reserves for legal claims when the costs associated with the claims become probable and can be reasonably estimated. The actual costs of resolving legal claims may be substantially higher or lower than the amounts reserved for such claims. In the event of unexpected future developments, it is possible that the ultimate resolutions of such matters, if unfavorable, could have a material adverse effect on our results of operations, financial position or cash flows. In addition, we cannot assure you that we will be able to maintain current levels of insurance coverage for all matters that are currently insured for costs that we consider reasonable. Our insurance coverage is negotiated on an annual basis, and our insurance policies in the future may have coverage exclusions that would cause our costs for claims to rise.
We use hazardous materials and chemicals in our manufacturing processes which could result in claims against us.
We use a variety of hazardous materials and chemicals in our manufacturing processes and in connection with maintenance work on our manufacturing facilities. Because of the nature of these substances or related residues, we may be liable for certain costs, including, among others, costs for health-related claims or removal or re-treatment of such substances. In addition, although we have developed environmental, health, and safety programs for our employees, including measures to reduce employee exposure to hazardous substances, and conduct regular assessments at our facilities, we may be involved in claims and litigation filed on behalf of persons alleging injury as a result of
10
Table of Contents
occupational exposure to substances or other hazards at our current or former facilities. Due to the unpredictable nature of personal injury litigation, it is not possible to predict the ultimate outcome of any such claims or lawsuits that may arise. If any such claims and lawsuits, individually or in the aggregate, were resolved against us, our results of operations and cash flows could be adversely affected.
If our products are improperly manufactured, packaged, or labeled or become adulterated, we may need to recall those items and may experience product liability claims if consumers are injured.
We may need to recall some of our products if they are improperly manufactured, packaged, or labeled or if they become adulterated. Our quality control procedures relating to the raw materials, including packaging, that we receive from third-party suppliers as well as our quality control procedures relating to our products after our products are formulated and packaged may not be sufficient. We have previously initiated product recalls, and widespread product recalls could result in significant losses due to the costs of a recall, the destruction of product inventory, and lost sales due to the unavailability of product for a period of time. We may also be liable if the use of any of our products causes injury, and could suffer losses from a significant product liability judgment against us. A significant product recall or product liability case could also result in adverse publicity, damage to our reputation, and a loss of consumer confidence in our products, which could have a material adverse effect on our business and financial results.
We rely on a variety of third party service providers for transportation of our products between our facilities and from our facilities to our customers.
We rely upon third party carriers for safe and timely delivery of our shipments. As a result, we are subject to carrier disruptions and increased costs due to factors that are beyond our control, including labor difficulties, inclement weather, terrorist activity, and increased fuel costs. Furthermore, mishandling of our products by the third party carriers could subject us to product liability claims or other costs and liabilities.
Disruptions at our most significant facilities could affect our profitability and harm our relationship with significant customers.
Over the past three years, nearly half of our manufactured products were produced at our Atlanta, Georgia (Seaboard) facility. In addition, our Emerson, Georgia facility packages the majority of our products sold to retail end-markets. We also maintain a national distribution center in Atlanta, Georgia. A material disruption of the operations of any of these facilities due to a natural disaster, work stoppages, power outages, or any other cause could have an adverse effect on our ability to maintain desired levels of profitability and volume and could affect our relationship with our most significant customers.
We may be unable to sustain significant customer relationships.
Relationships forged with customers, including The Home Depot, which represented approximately 11%, 10%, and 11% of our total net sales during the three fiscal years ended August 31, 2009, respectively, are directly impacted by our ability to deliver high quality products and service. We do not have a written contract obligating The Home Depot to purchase our products. The loss of or substantial decrease in the volume of purchases by The Home Depot would harm our sales and profitability.
11
Table of Contents
We may not be able to attract and retain sufficiently qualified sales representatives and other personnel.
Our success is dependent upon the continued service of our highly skilled workforce and our ability to attract and retain new personnel. The challenge to attract top talent is a formidable one given the competition for such talent within our markets. In particular, we have historically experienced substantial turnover in sales representatives who have less than two years experience. This turnover in our sales force on a monthly basis increases our hiring and training expenses and can interrupt continuity with some of our customers. In addition, we are continuing to expand our sales efforts into alternative sales channels, including wholesale distribution through our Zep Professional product line. Widespread sales of our products through wholesale distribution could reduce the sales of our products by sales representatives in certain regions, which could lead to the loss of sales representatives and customers, as well as disputes over the terms of sales and commission agreements. We also have instituted stricter performance standards for our sales representatives. Failure to meet these standards could result in loss of employment for the sales representative, loss of customers and potential for lawsuits. Significant employee turnover and failure to maintain a qualified workforce, including qualified sales representatives, could have a material adverse effect on our results of operations.
If we are unable to protect our information and telecommunication systems against disruptions or failures, our operations could be disrupted.
We are increasingly dependent on internal and third party information technology networks and systems, including the Internet, to process, transmit and store electronic information. In particular, we depend on our information technology infrastructure for fulfilling and invoicing customer orders, applying cash receipts, determining reorder points and placing purchase orders on our suppliers, making cash disbursements, blending chemicals, and conducting digital marketing activities, data processing, and electronic communications among our locations and between company personnel and our customers and suppliers. We also depend on our telecommunication systems for communications between company personnel and our customers and suppliers. We have experienced system disruptions in the past that have adversely affected our ability to effectively manage our operations and service our customers. Future system disruptions, security breaches, or shutdowns could significantly disrupt our operations or may result in financial damage or loss because of lost or misappropriated information.
We may not properly execute, or realize anticipated cost savings or benefits from, our ongoing strategic transformation initiatives, information technology, or other initiatives.
Our success is partly dependent upon properly executing, and realizing cost savings or other benefits from, our ongoing strategic transformation initiatives (a discussion of which is provided within Item 7. Management’s Discussion and Analysis of Financial Condition and Results of Operations), information technology, and other initiatives. These initiatives are primarily designed to make us more efficient in the sales, manufacture, and distribution of our products. These initiatives are often complex, and a failure to implement them properly may, in addition to not meeting projected cost savings or benefits, result in an interruption to our sales, manufacturing, logistics, customer service, or accounting functions. Furthermore, we have invested a significant amount of capital into a number of these initiatives, which might have been more efficiently used if the full cost savings or benefits are not realized. Any of these results could have a material adverse effect on our business and results of operations including the requirement to reduce the book value of some assets.
12
Table of Contents
We may pursue future growth through strategic acquisitions or joint ventures from which we may not receive the benefits that we anticipate.
As part of our business growth strategy, we may pursue acquisitions. Our ability to implement this component of our growth strategy will be limited by our ability to identify appropriate acquisition candidates and our financial resources, including available cash and borrowing capacity. We may not be able to realize any of the anticipated benefits from acquisitions due to the risk inherent in such activity, including:
| • | unrecorded liabilities of acquired companies that we fail to discover during our due diligence investigations or that are not subject to indemnification or reimbursement by the seller; |
| • | difficulty in assimilating the operations and personnel of the acquired company within our existing operations or in maintaining uniform standards; |
| • | loss of key employees of the acquired company; |
| • | the failure to achieve anticipated synergies; and |
| • | strains on management and other personnel time and resources to evaluate, negotiate and integrate acquisitions. |
Our failure to properly manage these risks could result in our expenses increasing disproportionately to our incremental revenues, causing our operating margins and profitability to be adversely affected.
We would expect to pay for any future acquisitions using cash, capital stock, notes and/or assumption of indebtedness. To the extent that our existing sources of cash are not sufficient in any instance, we would expect to need additional debt or equity financing, which involves its own risks.
We have not established a minimum dividend payment level and we cannot give assurance of our ability to pay dividends in the future or the amount of any dividends.
We intend to make quarterly distributions to our stockholders. Even though we have paid a regular quarterly dividend since our second full quarter of stand-alone operations and do not expect change with respect to dividend payment activity, we have not established a minimum dividend payment level and our ability to make distributions may be adversely affected by the risk factors described in this Annual Report on Form 10-K and any risk factors in our subsequent Securities and Exchange Commission filings. All distributions will be made at the discretion of our board of directors and their payment and amount will depend on our earnings, our financial condition and other factors as our board of directors may deem relevant from time to time. We cannot assure you of our ability to make distributions in the future or that the distributions will be made in amounts similar to our historic distributions.
Future offerings of debt securities, which would rank senior to our common stock upon liquidation, and future offerings of equity securities, which would dilute our existing shareholders and may be senior to our common stock for the purposes of dividend and liquidating distributions, may adversely affect the market price of our common stock.
On October 14, 2009, we filed a shelf registration statement on Form S-3 with the Securities and Exchange Commission that, upon being declared effective, will allow Zep to raise up to an aggregate of $200 million. In the future, we may attempt to increase our capital resources by making offerings of debt or additional offerings of equity securities, including senior or subordinated notes and series of preferred stock or common stock. Upon liquidation, holders of our debt securities and preferred stock, if any, and lenders with respect to other borrowings will receive a distribution of our available assets prior to the holders of our common stock. Additional equity offerings may dilute the holdings of our existing
13
Table of Contents
stockholders or reduce the market price of our common stock, or both. Preferred stock, if issued, could have a preference on liquidating distributions or a preference on dividend payments or both that could limit our ability to make a dividend distribution to the holders of our common stock. Because our decision to issue securities in any future offering will depend on market conditions and other factors beyond our control, we cannot predict or estimate the amount, timing or nature of our future offerings. Thus, holders of our common stock bear the risk of our future offerings reducing the market price of our common stock and diluting their share holdings in us.
We are subject to risks related to our operations outside the United States.
We have operations outside the United States. Net sales outside the United States represented approximately 22% of our total net sales for the fiscal year ended August 31, 2009. Furthermore, as of August 31, 2009, approximately 10% of our products were manufactured outside the United States. In addition to the risks that are common to both our U.S. and non-U.S. operations, we face risks related to our foreign operations such as:
| • | foreign currency fluctuations; |
| • | unstable political, economic, financial, and market conditions; |
| • | trade and currency restrictions; |
| • | increases in tariffs and taxes; |
| • | high levels of inflation; |
| • | restrictions on repatriating foreign profits back to the United States; |
| • | greater difficulty collecting accounts receivable and longer payment cycles; |
| • | higher social and legal costs; and |
| • | adverse interpretations of foreign laws and regulations. |
Some of these risks have affected our business in the past and may have a material adverse effect on our business, financial condition, results of operations, and cash flows in the future.
Global economic conditions could continue to adversely affect the Company’s business and financial results.
Unfavorable economic conditions, including the impact of recessions in the United States and throughout the world, may continue to negatively affect the Company’s business and financial results. We are particularly sensitive to economic downturns that affect the transportation, food processing and services, manufacturing, government and housekeeping markets, all of which have been affected by the recent global recession. These economic conditions could negatively impact (i) demand for our products by end-users of such products, including a shifting purchasing patterns to lower-cost options, (ii) our ability to collect accounts receivable on a timely basis from certain customers and (iii) the ability of certain suppliers to fill our orders for raw materials or other goods and services. A prolonged recession, particularly one that affects the end-user markets listed set forth above, could have a material adverse impact on our business, results of operations and financial condition, and our ability to make distributions to our stockholders.
If we are unable to keep and protect our intellectual property rights, our ability to compete may be negatively impacted.
The market for our products depends to a significant extent upon the goodwill associated with our brand names. We own, or have licenses to use, all of the material trademark and trade name rights used
14
Table of Contents
by us in connection with the packaging, marketing, and distribution of our major products both in the United States and in other countries where our products are principally sold. In addition, we possess trade secret product formulations and other product information, some of which are patented, which are competitively sensitive. Intellectual property protection is important to our business. Although most of our trademarks are registered in the United States and in the foreign countries in which we operate, we may not be successful in asserting trademark or trade name protection. In addition, the laws of some foreign countries may not protect our intellectual property rights to the same extent as the laws of the United States. The costs required to protect our intellectual property rights may be substantial.
We cannot be certain that we will be able to assert our intellectual property rights successfully in the future or that they will not be invalidated, circumvented, or challenged. Other parties may infringe on our intellectual property rights and may thereby dilute the value of our brand names in the marketplace. Any infringement of our intellectual property rights would also likely result in a diversion of our time and resources to protect these rights through litigation or otherwise. Finally, others may claim that our business or products infringe on their intellectual property rights. Any failure by us to protect our trademarks and trade names, or any adverse judgment with respect to infringement of others’ intellectual property rights, may have a material adverse effect on our business, financial condition, results of operations, and cash flows.
Our business could suffer in the event of a work stoppage or increased organized labor activity.
As of August 31, 2009, approximately 240 of our 2,200 employees were members of eight unions in the United States and Europe. While we consider our relations with employees to be generally good, we cannot assure you that we will not experience work stoppages, strikes, or slowdowns in the future. In addition, we outsource to third parties the manufacturing of certain of our products that currently account for approximately 20% of our net sales volumes, and we cannot assure you that these third parties will not experience work stoppages, strikes or slowdowns in the future. A prolonged work stoppage, strike, or slowdown at any of our facilities or those of our third party suppliers could have a material adverse effect on our results of operations. Further, we cannot assure you that, upon expiration of any of our existing collective bargaining agreements, new agreements will be reached without union action or that any new agreement will be on terms satisfactory to us. Moreover, we cannot assure you that our non-union facilities will not become subject to labor union organizing efforts. If any current non-union facilities were to unionize, we would incur increased risk of work stoppages and possibly higher labor costs.
We have incurred indebtedness in the normal course of business, which subjects us to various restrictions that could limit our operating flexibility.
In connection with the spin-off, we entered into a $100.0 million revolving credit facility that will mature in 2012 (“Revolving Credit Facility”). On October 14, 2009, we entered into a three-year, $40 million Loan and Security Agreement secured by our trade accounts receivable that replaced a similar asset-backed securitization facility we allowed to expire in the normal course during October 2008. In addition, we are responsible for $7.2 million in industrial revenue bonds due in 2018. These financing arrangements contain customary restrictions, covenants, and events of default. The terms of these financing arrangements impose and any future indebtedness may impose various restrictions and covenants on us that could limit our ability to respond to market conditions, provide for capital investment needs or take advantage of business opportunities. We were in compliance with all debt-related financial covenants as of August 31, 2009. Each of these financing arrangements is discussed further within Note 4 of Notes to Consolidated and Combined Financial Statements.
15
Table of Contents
Access to capital markets necessary to support current operations and future growth plans may not be available.
As of August 31, 2009, we had additional borrowing capacity under our Revolving Credit Facility of $63.6 million. We entered into four interest rate swap arrangements during the fourth quarter of fiscal year 2008 effectively swapping the variable interest rate associated with $20 million of borrowings made under our Revolving Credit Facility for fixed rates ranging from 3.2% to 3.5%. We reduced our debt, net of cash, position approximately 46% during fiscal year 2009 to $24.0 million, and based on our current cash on hand, current financing arrangements, and current projections of cash flow from operations, management believes that we will be able to meet the liquidity needs of our current business over the next twelve months.
On October 14, 2009, we entered into the above mentioned three-year, $40 million Loan and Security Agreement. While we have recently demonstrated an ability to secure additional capital, in the future, market conditions could substantially increase the cost associated with accessing capital markets and ultimately constrain our ability to borrow money, which could impact future profitability. Moreover, depending upon market conditions, we may be unable to access the equity capital markets on favorable terms or at all. While we have relationships with six banks through our outstanding debt arrangements, the failure of any one or more of those banks or other financial institutions may impact the Company’s ability to borrow money to finance its operating activities.
Local, state, and federal governments are placing increasingly stringent regulations on the security of chemical plant locations, the transportation of hazardous chemicals, and the environmental impact of chemical production.
Growing public and political attention has been placed on protecting critical infrastructure, including the chemical industry, from security threats. Terrorist attacks and natural disasters have increased concern regarding the security of chemical production and distribution. In addition, local, state, and federal governments have enacted, and may in the future enact, increasingly stringent regulations that impact the security of chemical plant locations, the transportation of hazardous chemicals, and the environmental impact of chemical production, which could result in higher operating costs and interruptions in normal business operations.
The market price for our common stock may be volatile, and you may not be able to sell our stock at a favorable price.
Our common stock is traded on the New York Stock Exchange. The market price of our common stock has in the recent past been, and may in the future be, highly volatile and subject to wide fluctuations. This volatility may occur for many reasons, including for reasons unrelated to our performance, such as reports by industry analysts, investor perceptions, or negative announcements by our customers, competitors, or suppliers regarding their own performance, as well as general economic and industry conditions. Additional factors that could cause the market price of our common stock to rise and fall include, but are not limited to, the following:
| • | variations in our quarterly results; |
| • | announcements of technological innovations by us or by our competitors; |
| • | introductions of new products or services or new pricing policies by us or by our competitors; |
| • | acquisitions or strategic alliances by us or by our competitors; |
| • | recruitment or departure of key personnel or key groups of personnel; |
| • | the gain or loss of significant orders; |
16
Table of Contents
| • | the gain or loss of significant customers; |
| • | the disruption of supply and/or price of key raw materials; |
| • | significant changes in regulatory requirements; |
| • | increased litigation resulting from product or employee claims; |
| • | adverse developments concerning environmental matters; |
| • | changes in the estimates of our operating performance or changes in recommendations by any securities analysts that elect to follow our stock; and |
| • | market conditions in our industry, the industries of our customers, and the economy as a whole. |
Risks Related to our Spin-off from Acuity Brands
We have a limited operating history as an independent public company and may be unable to operate as profitably as a stand-alone company as we operated as a segment of Acuity Brands.
We have only operated as an independent public company since October 31, 2007. Prior to the Distribution, the businesses that comprised each of Acuity Brands and Zep were under one ultimate parent, and each of those businesses was able to rely, to some degree, on the earnings, assets, and cash flows of the others for capital requirements. After the spin-off, we are able to rely only on our specialty chemicals business for such requirements. While the specialty chemicals business was a profitable segment of Acuity Brands, we cannot assure you that, as an independent company, profits will continue at the same level.
Historical financial information may be of limited relevance.
The historical financial information preceding the Distribution and included in this Annual Report on Form 10-K does not reflect our results of operations, financial position, and cash flows in the future and only estimates our results of operations, financial position, and cash flows had we operated as a separate stand-alone public entity during the periods presented. The financial information included herein does not reflect any changes that may have occurred or may occur in our funding and operations as a result of the spin-off.
Failure of the spin-off to qualify as a tax-free transaction could result in substantial liability.
Acuity Brands has received a private letter ruling from the Internal Revenue Service to the effect that, among other things, the spin-off (including certain related transactions) qualifies as tax-free to Acuity Brands, us, and Acuity Brands stockholders for United States federal income tax purposes under Section 355 and related provisions of the Internal Revenue Code. Although a private letter ruling generally is binding on the Internal Revenue Service, if the factual assumptions or representations made in the private letter ruling request are untrue or incomplete in any material respect, then Acuity Brands will not be able to rely on the ruling. Moreover, the Internal Revenue Service will not rule on whether a distribution of shares satisfies certain requirements necessary to obtain tax-free treatment under Section 355 of the Internal Revenue Code. Rather, the private letter ruling is based upon representations by Acuity Brands that those requirements have been satisfied, and any inaccuracy in those representations could invalidate the ruling.
Acuity Brands and Zep Inc. have received an opinion from King & Spalding LLP, then counsel to Acuity Brands and us, to the effect that, with respect to the requirements referred to above on which the Internal Revenue Service will not rule, those requirements will be satisfied. The opinion is based on, among other things, certain assumptions and representations as to factual matters made by Acuity
17
Table of Contents
Brands and us which, if untrue or incomplete in any material respect, could jeopardize the conclusions reached by counsel in its opinion. The opinion is not binding on the Internal Revenue Service or the courts, and the Internal Revenue Service or the courts may not agree with the opinion.
If the spin-off fails to qualify for tax-free treatment, a substantial corporate tax would be payable by Acuity Brands, measured by the difference between (1) the aggregate fair market value of the shares of our common stock on the date of the spin-off and (2) Acuity Brands’ adjusted tax basis in the shares of our common stock on the date of the spin-off. The corporate level tax would be payable by Acuity Brands. However, we have agreed under certain circumstances to indemnify Acuity Brands for this tax liability. This indemnification obligation, if triggered, could have a material adverse effect on our results of operations and financial position. In addition, under the applicable Treasury regulations, each member of Acuity Brands’ consolidated group at the time of the spin-off (including us) is severally liable for such tax liability.
Even if the spin-off otherwise qualifies as tax-free, Acuity Brands nevertheless could incur a substantial corporate tax liability under Section 355(e) of the Internal Revenue Code, if 50 percent or more of our stock or the stock of Acuity Brands were to be acquired as part of a “plan (or a series of related transactions)” that includes the distribution. For this purpose, any acquisitions of the stock of Acuity Brands or of our stock that occur within two years before or after the spin-off are presumed to be part of such a plan, although Acuity Brands may be able to rebut that presumption. If such an acquisition of the stock of Acuity Brands or of our stock triggers the application of Section 355(e), Acuity Brands would recognize taxable gain as described above, but the spin-off would generally remain tax-free to the Acuity Brands stockholders. If acquisitions of our stock trigger the application of Section 355(e), we would be obligated to indemnify Acuity Brands for the resulting corporate-level tax liability. This indemnification obligation would have a material adverse effect on our results of operations and financial position.
Certain provisions of our certificate of incorporation, bylaws and rights plan and the tax disaffiliation agreement may discourage takeovers.
Our certificate of incorporation and bylaws contain certain anti-takeover provisions that may make more difficult or expensive or that may discourage a tender offer, change in control or takeover attempt that is opposed by our Board of Directors. In particular, our certificate of incorporation and bylaws:
| • | classify our Board of Directors into three groups, so that stockholders elect only one-third of the Board each year; |
| • | permit stockholders to remove directors only for cause and only by the affirmative vote of at least 80% of our voting shares; |
| • | permit a special stockholders’ meeting to be called only by a majority of the Board of Directors; |
| • | do not permit stockholders to take action except at an annual or special meeting of stockholders; |
| • | require stockholders to give us advance notice to nominate candidates for election to our Board of Directors or to make stockholder proposals at a stockholders’ meeting; |
| • | permit our Board of Directors to issue, without stockholder approval, preferred stock with such terms as the Board may determine; |
| • | require the vote of the holders of at least 80% of our voting shares for stockholder amendments to our bylaws; and |
| • | require, for the approval of a business combination with stockholders owning 5% or more of our voting shares, the vote of at least 50% of our voting shares not owned by such stockholder, |
18
Table of Contents
| unless certain “fair price” requirements are met or the business combination is approved by our continuing directors. |
The preferred stock purchase rights attached to our shares of common stock, in effect, prevent a person or group from acquiring more than 15% of the total number of our common stock outstanding at any time without obtaining prior approval from the Company’s Board of Directors, to be granted at the Board’s sole discretion. In addition, Delaware law generally restricts mergers and other business combinations between us and any holder of 15% or more of our common stock, unless the transaction or the 15% acquisition is approved in advance by our Board of Directors.
These provisions of our certificate of incorporation and bylaws, Delaware law, and the preferred stock purchase rights could discourage potential acquisition proposals and could delay or prevent a change in control of our company, even though a majority of our stockholders may consider such proposals, if effected, desirable. Such provisions could also make it more difficult for third parties to remove and replace the members of our Board of Directors. Moreover, these provisions could diminish the opportunities for stockholders to participate in certain tender offers, including tender offers at prices above the then-current market value of our common stock, and may also inhibit increases in the trading price of our common stock that could result from takeover attempts or speculation.
If the spin-off is considered part of a “plan (or series of related transactions)” pursuant to which 50% or more of our stock is acquired, the spin-off will be taxable to Acuity Brands (but not to its stockholders) under Section 355(e) of the Internal Revenue Code. For this purpose, any acquisitions of our stock that occur within two years after the spin-off (subject to certain exceptions including an exception for public trading) will be presumed to be part of such a plan, although Acuity Brands may be able to rebut that presumption. Under the tax disaffiliation agreement, we have agreed to indemnify Acuity Brands for any tax liability to Acuity Brands under Section 355(e) of the Code that results from acquisitions of our stock. This provision of the tax disaffiliation agreement may have the effect of discouraging or preventing an acquisition of our company or a disposition of our business.
Item 1b. Unresolved Staff Comments
None.
Our corporate office and primary manufacturing facilities are owned by us and located in Atlanta, Georgia. Nearly half of the finished goods produced by us are manufactured at this Atlanta site. Manufacturing facilities are also located at one additional site in Georgia, and in Texas, Canada, Italy, and Holland. Each of our six manufacturing facilities is owned by the Company except for the Italy and Canada locations, which are leased. Additionally, we own branch and storage facilities in Massachusetts, Illinois and Washington. We lease sales offices and storage facilities throughout North America and Europe. Our facilities, which are adequate for our current needs, are in good operating condition and are suitable for their current uses.
Legal Proceedings
We are subject to various legal claims arising in the normal course of business. We are self-insured up to specified limits for certain types of claims, including product liability, and are fully self-insured for certain other types of claims, including environmental, product recall, and patent infringement as part of the distribution agreement with Acuity Brands. Based on information currently available, it is the opinion of management that the ultimate resolution of pending and threatened legal proceedings will not have a
19
Table of Contents
material adverse effect on our results of operations, financial position, or cash flows. However, in the event of unexpected future developments, it is possible that the ultimate resolution of such matters, if unfavorable, could have a material adverse effect on our results of operations, financial position, or cash flows in future periods. We establish reserves for legal claims when the costs associated with the claims become probable and can be reasonably estimated. The actual costs of resolving legal claims may be substantially higher or lower than the amounts reserved for such claims. However, we cannot make a meaningful estimate of actual costs to be incurred that could possibly be higher or lower than the amounts reserved.
Environmental Regulation
Our operations are subject to federal, state, local, and foreign laws and regulations relating to the generation, storage, handling, transportation, and disposal of hazardous substances and solid and hazardous wastes, and to the remediation of contaminated sites. Permits and environmental controls are required for certain of our operations to limit air and water pollution, and these permits are subject to modification, renewal, and revocation by issuing authorities. We will incur capital and operating costs relating to environmental compliance on an ongoing basis. Environmental laws and regulations have generally become stricter in recent years, and the cost of responding to future changes may be substantial. While we believe that we are currently in substantial compliance with all material environmental laws and regulations, there can be no assurance that we will not incur significant costs to remediate violations of such laws and regulations, particularly in connection with acquisitions of existing operating facilities, or to comply with changes in, or stricter or different interpretations of, existing laws and regulations. Such costs could have a material adverse effect on our results of operations.
In June 2007, we reached a final resolution of the investigation by the United States Department of Justice (the “DOJ”) of certain environmental issues at our primary manufacturing facility located in Atlanta, Georgia. In connection with this resolution, we are subject to a three-year probation period that incorporates a compliance agreement with the United States Environmental Protection Agency (the “EPA”). Under the compliance agreement, we are required to maintain an enhanced compliance program. This matter is not expected to lead to a material loss of business, any disruption of production, or materially higher operating costs. However, in the event of our material breach of the compliance agreement, those consequences could occur.
We are currently a party to federal and state administrative proceedings arising under federal and state laws enacted for the protection of the environment where a state or federal agency or a private party alleges that hazardous substances generated by Zep have been discharged into the environment and a state or federal agency is requiring a cleanup of soil and/or groundwater pursuant to federal or state superfund laws. In each of these proceedings in which Zep has been named as a party that allegedly generated hazardous substances that were transported to a waste site owned and operated by another party, either (1) Zep is one of many other identified generators who have reached an agreement on the allocation of costs for cleanup among the various generators and Zep’s potential liability is not material; (2) Zep has been identified as a potential generator and the sites have been remediated by the EPA or by a state for a cost that is not material; or (3) other generators have cleaned up the site and have not pursued a claim against Zep and Zep’s liability, if any, would not be material.
Our property on Seaboard Industrial Boulevard is the only active site involving property which we own and where we have been named as a potentially responsible party. We and the current and former owners of adjoining properties have agreed to share the expected costs and responsibilities of implementing an approved corrective action plan, submitted in 2004, under the Georgia Hazardous Response Act (“HSRA”) to periodically monitor property along a nearby stream for a period of five years ending in December 2009. The Georgia Environmental Protection Division (the “EPD”) is reviewing the monitoring program and will determine if additional monitoring is necessary and for what period of
20
Table of Contents
time. Subsequently, in connection with the DOJ investigation described earlier, we and the EPA each analyzed samples taken from certain sumps at the Seaboard facility. The sample results from some of the sump tests indicated the presence of certain hazardous substances. As a result, we notified the EPD and conducted additional soil and groundwater studies pursuant to HSRA. We are continuing to negotiate with the EPD on the scope of the Corrective Action Plan we submitted to address the subsurface contamination north of Seaboard Industrial Boulevard, and have executed a Consent Order with the EPD covering this remediation.
In January 2008, the EPA issued a Notice of Violation and document request regarding the use and management of certain trench drains at the Seaboard production facility as well as assorted minor waste labeling issues. The Company executed a Consent Order with the EPA in March 2009 that resolved this matter. Resolution involved the remittance of a penalty and modification of certain manufacturing practices, neither of which had a material impact on the Company’s results of operations or financial condition.
In May 2007, we accrued an undiscounted pre-tax liability of $5.0 million representing our best estimate of costs associated with voluntary subsurface remediation, primarily to remove contaminants from soil underlying one of our manufacturing facilities, and other related environmental issues. While over approximately the next three years we could expend an amount ranging up to $7.5 million on these efforts, our best estimate of voluntary remediation costs continues to be $5.0 million. To date, we have expended approximately $1.5 million of the $5.0 million reserve established in May 2007. Further sampling, engineering studies, changes in regulatory requirements and/or final resolution of the proposed consent order could cause us to revise the current estimate. We believe that additional expenditures after three years of remediation may be necessary and that those expenditures, based on currently available information, could range up to an additional $10.0 million during the subsequent twenty-five year period. It may be appropriate to capitalize certain of the expenditures that may be incurred in this twenty-five year period. We arrived at the current estimates on the basis of studies prepared by independent third party environmental consulting firms. The actual cost of remediation will vary depending upon the results of additional testing and geological studies, the success of initial remediation efforts in the first five years addressing the most significant areas of contamination, the rate at which site conditions may change, and the requirements of the EPD.
Item 4. Submission of Matters to a Vote of Security Holders
No matters were submitted for a vote of the security holders during the three months ended August 31, 2009.
21
Table of Contents
PART II
Item 5. Market for Registrant’s Common Equity, Related Stockholder Matters, and Issuer Purchases of Equity Securities
Our common stock began trading “regular way” on the New York Stock Exchange under the symbol “ZEP” on November 1, 2007. There were 3,933 stockholders of record as of October 23, 2009. This figure does not include an estimate of the indeterminate number of beneficial holders whose shares may be held of record by brokerage firms and clearing agencies. The following table sets forth the New York Stock Exchange high and low sale prices and the dividend payments for our common stock for the periods indicated.
| Price per Share | Dividends Per Share | ||||||||
| High | Low | ||||||||
| 2009 |
|||||||||
| First Quarter |
$ | 21.80 | $ | 13.58 | $ | 0.04 | |||
| Second Quarter |
$ | 21.00 | $ | 7.62 | $ | 0.04 | |||
| Third Quarter |
$ | 14.40 | $ | 6.63 | $ | 0.04 | |||
| Fourth Quarter |
$ | 17.99 | $ | 11.13 | $ | 0.04 | |||
| 2008 |
|||||||||
| First Quarter (since inception) |
$ | 15.85 | $ | 12.18 | $ | — | |||
| Second Quarter |
$ | 17.41 | $ | 12.85 | $ | 0.04 | |||
| Third Quarter |
$ | 17.35 | $ | 13.98 | $ | 0.04 | |||
| Fourth Quarter |
$ | 20.05 | $ | 13.98 | $ | 0.04 | |||
Dividends are paid out of current year earnings, and we began making dividend payments in fiscal year 2008 after our first full quarter of stand-alone operations. We expect to pay a regular quarterly dividend at an annual rate of $0.16 per share. Our ability to fund a regular quarterly dividend is impacted by our financial results and the availability of surplus funds. Delaware law prohibits the payment of dividends or otherwise distributing funds to our stockholders absent a legally available surplus. All decisions regarding the declaration and payment of dividends are at the discretion of our Board of Directors and are evaluated periodically in consideration of our financial condition, earnings, growth prospects, funding requirements, applicable law, and any other factors our Board of Directors deems relevant. We do not currently have plans to change our annual dividend rate, and on October 7, 2009, our Board of Directors declared a quarterly dividend of $0.04 per share.
22
Table of Contents
Shareowner Return Performance Graph
The following Performance Graph and related information shall not be deemed “soliciting material” or to be “filed” with the Securities and Exchange Commission, nor shall such information be incorporated by reference into any future filing under the Securities Act of 1933 or Securities Exchange Act of 1934, each as amended, except to the extent that the Company specifically incorporates such information by reference into such filing.
The following graph compares the change in cumulative total stockholders’ return on our common stock with (a) the S&P Smallcap 600 Index and (b) the Russell 2000 Index, each for the period from November 1, 2007 (the date our stock first traded other than on a when-issued basis) through August 31, 2009. The graph assumes an initial investment of $100 at the closing price on November 1, 2007 and assumes all dividends were reinvested. We have presented the Russell 2000 Index, in lieu of an industry index or peer group, because we believe there is no published index or peer group that adequately compares to our business. Except for the initial measurement date (November 1, 2007), the figures for the chart and graph set forth below have been calculated based on the closing prices on the last trading day on the New York Stock Exchange for each period indicated.
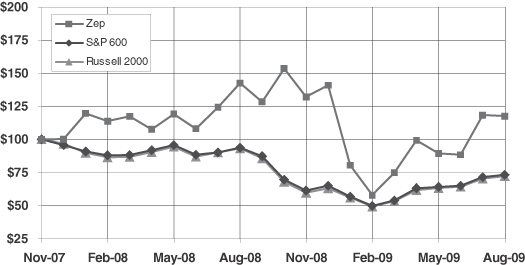
| Nov 2007 |
Feb 2008 |
May 2008 |
Aug 2008 |
Nov 2008 |
Feb 2009 |
May 2009 |
Aug 2009 | |||||||||
| Zep Inc. |
100.00 | 113.63 | 119.16 | 142.50 | 131.99 | 57.86 | 89.28 | 117.52 | ||||||||
| S&P 600 |
100.00 | 88.01 | 95.66 | 93.73 | 61.41 | 49.84 | 64.10 | 73.13 | ||||||||
| Russell 2000 |
100.00 | 86.29 | 94.10 | 93.00 | 59.50 | 48.92 | 63.08 | 71.94 |
23
Table of Contents
Item 6. Selected Financial Data
The following table sets forth our selected financial data, which have been derived from our Consolidated and Combined Financial Statements for each of the five years in the period ended August 31, 2009. We were a wholly owned subsidiary of Acuity Brands during all periods presented prior to November 1, 2007 in the below listed tabular disclosure. The information set forth below should be read in conjunction with Management’s Discussion and Analysis of Financial Condition and Results of Operations and the Consolidated and Combined Financial Statements and the notes related to those financial statements included elsewhere in this report. Operating expenses included within our historical income statements that were incurred prior to November 1, 2007 reflect direct expenses of our business together with allocations of certain Acuity Brands corporate expenses that have been charged to us based on usage or other methodologies appropriate for allocating such expenses. In our opinion, these assumptions and allocations have been made on a reasonable and appropriate basis under the circumstances. Our combined financial information (for periods preceding the Distribution) may not be indicative of our future performance and does not necessarily reflect what our financial condition and results of operations would have been had we operated as a separate, stand-alone entity during all the periods presented, as many changes have occurred and will continue to occur in our operations and capitalization as a result of our spin-off from Acuity Brands.
| Years Ended August 31, | |||||||||||||||
| 2009 | 2008 | 2007 | 2006 | 2005 | |||||||||||
| (In thousands, except per share amounts) | |||||||||||||||
| Summary of Operations Data: |
|||||||||||||||
| Net sales |
$ | 501,032 | $ | 574,724 | $ | 565,886 | $ | 552,084 | $ | 534,952 | |||||
| Operating profit |
18,089 | 29,063 | 29,649 | 40,049 | 37,234 | ||||||||||
| Net income |
9,260 | 16,322 | 14,083 | 21,275 | 23,060 | ||||||||||
| Basic earnings per share |
$ | 0.44 | $ | 0.78 | $ | 0.68 | $ | 1.02 | $ | 1.11 | |||||
| Diluted earnings per share |
$ | 0.43 | $ | 0.77 | $ | 0.68 | $ | 1.02 | $ | 1.11 | |||||
| Cash dividends declared per common share |
$ | 0.16 | $ | 0.12 | $ | — | $ | — | $ | — | |||||
| Basic weighted average number of shares outstanding(1) |
21,057 | 20,862 | 20,811 | 20,811 | 20,811 | ||||||||||
| Diluted weighted average number of shares outstanding(1) |
21,290 | 21,252 | 20,811 | 20,811 | 20,811 | ||||||||||
| Balance Sheet Data (at period end): |
|||||||||||||||
| Cash and cash equivalents |
$ | 16,651 | $ | 14,528 | $ | 9,142 | $ | 8,128 | $ | 11,794 | |||||
| Total assets |
249,618 | 274,071 | 249,473 | 248,373 | 249,516 | ||||||||||
| Total debt |
40,650 | 59,150 | 75,000 | 75,000 | 75,000 | ||||||||||
| Stockholders’ equity |
109,265 | 99,717 | 74,834 | 81,048 | 80,398 | ||||||||||
| Other Data: |
|||||||||||||||
| Cash provided by operations |
$ | 30,438 | $ | 26,435 | $ | 30,931 | $ | 28,479 | $ | 34,614 | |||||
| Operating working capital(2) |
$ | 83,616 | $ | 103,763 | $ | 101,357 | $ | 101,013 | $ | 100,527 | |||||
| (1) | On October 31, 2007, the separation from Acuity Brands was completed in a tax-free distribution to its stockholders of one share of our common stock for every two shares of Acuity Brands’ common stock held as of the record date. Prior to this date, all outstanding shares of Zep were owned by Acuity Brands. Accordingly, for periods prior to October 31, 2007, basic and diluted earnings per share have been computed using the number of shares of Zep common stock outstanding on October 31, 2007, the date on which the Zep common stock was distributed by Acuity Brands to its stockholders. |
| (2) | Operating working capital is defined as the sum of accounts receivable and inventory less accounts payable. |
24
Table of Contents
Item 7. Management’s Discussion and Analysis of Financial Condition and Results of Operation
The following discussion should be read in conjunction with Item 1a. Risk Factors, Item 6. Selected Financial Data, Item 8. Consolidated and Combined Financial Statements and Supplementary Data, including the notes thereto, and the other financial information included elsewhere in this Annual Report on Form 10-K. Please see “Cautionary Statement Regarding Forward-Looking Information” for a discussion of the uncertainties, risks and assumptions associated with these statements.
Overview
Company
We are a leading producer, marketer, and service provider of a wide range of cleaning and maintenance solutions for commercial, industrial, institutional, and consumer end-markets. Our product portfolio includes anti-bacterial and industrial hand care products, cleaners, degreasers, deodorizers, disinfectants, floor finishes, sanitizers, and pest and weed control products. We continually refresh our product portfolio and service offerings through the introduction of new products and formulations as well as new services to meet the demands of the industry and our customers. We market these products and services under well recognized and established brand names, such as Zep, Zep Commercial, Zep Professional, Enforcer, and Selig, some of which have been in existence for more than 70 years. We reach our customers through an experienced, international organization of sales representatives supported by highly skilled research and development and technical services teams, who collectively provide creative solutions for our customers’ diverse cleaning and maintenance needs by utilizing their extensive product expertise and providing customized value added services that we believe distinguish us among our competitors.
Our separation from Acuity Brands, Inc.
We were spun-off from Acuity Brands effective October 31, 2007 through a distribution of 100% of the common stock of Zep to Acuity Brands’ stockholders. The stock dividend of one share of Zep common stock for every two shares of Acuity Brands common stock was distributed on a pro rata basis to holders of record of Acuity Brands common stock at the close of business on October 17, 2007, which was the record date for the Distribution. No fractional shares of Zep common stock were distributed. Instead of fractional shares, Zep stockholders received cash. Following the Distribution, Acuity Brands no longer holds any of our shares as we became an independent public company after the spin-off. In conjunction with the separation of businesses, we and Acuity Brands entered into various agreements that address the allocation of assets and liabilities between us and that define our relationship after the separation, including the Agreement of Plan of Distribution, which we refer to as the distribution agreement, the tax disaffiliation agreement, the employee benefits agreement, and the transition services agreement. The Internal Revenue Service has issued a private letter ruling supporting the spin-off’s tax-free status, and we continue to conduct our operations in a manner that is compliant with the conditions set forth by that ruling. We and Acuity Brands have also received an opinion from external counsel supporting the spin-off’s tax-free status. Our common stock is listed on the New York Stock Exchange under the ticker symbol “ZEP.”
Prior to the spin-off, Acuity Brands engaged in an internal restructuring, including a holding company reorganization. As part of the internal restructuring, the business that had previously been conducted by Acuity Specialty Products Group, Inc. was merged into the parent company and was subsequently transferred to Acuity Specialty Products, Inc. (“ASP”). ASP is now a wholly-owned subsidiary of Zep Inc.
25
Table of Contents
Basis of Presentation
Our Consolidated and Combined Financial Statements have been prepared by us in accordance with U.S. generally accepted accounting principles and present our financial position, results of operations, and cash flows. The financial statements and other financial information in this Form 10-K related to periods ending on or after the Distribution date of October 31, 2007 are presented on a consolidated basis and include our accounts and those of our majority-owned subsidiaries.
The financial statements and related financial information pertaining to periods preceding the Distribution date of October 31, 2007 have been presented on a combined basis and reflect the results of those entities that were ultimately transferred to us as part of the spin-off. Prior to the spin-off, certain functions, including treasury, tax, executive and employee benefits, financial reporting, risk management, legal, corporate secretary and investor relations, were historically managed by the corporate division of Acuity Brands on behalf of its subsidiaries. The assets, liabilities and expenses related to the support of these centralized corporate functions have been allocated to us on a specific identification basis to the extent possible. Otherwise, allocations related to these services were primarily based upon an estimate of the proportion of corporate amounts applicable to us given our contribution to our consolidated parent company’s revenues and employee base. Allocation ratios derived from these contribution factors are similar in amount and remained consistent throughout the historical periods presented. Examples of expenses that were allocated in accordance with these proportional estimates include charges related to accounting and legal services undertaken to ensure the consolidated parent company’s compliance with various regulatory requirements as well as the salaries of certain corporate officers and employees.
In the opinion of management, the assumptions and allocations have been made on a reasonable and appropriate basis under the circumstances. Management believes that amounts allocated to Zep reflect a reasonable representation of the types of costs that would have been incurred if we had performed these functions as a stand-alone company. However, as estimation is inherent within the allocation process, these combined financial statements do not include all of the actual amounts that would have been incurred had we been a stand-alone entity during the periods presented. The combined financial statements reflect an allocation of debt and related interest expense, as further described in Note 4 to the Notes to Consolidated and Combined Financial Statements.
Strategy
Zep is committed to leveraging its many capabilities and strengths to create long-term value for its shareholders. We intend to accomplish this goal through the execution of a profitable growth strategy composed of the following five key components:
| • | Simplifying and improving our core business; |
| • | Expanding our presence with retailers; |
| • | Entering the industrial distribution market; |
| • | Investing in international growth; and |
| • | Growing through profitable acquisitions. |
Since becoming an independent, public company, we have made significant progress and investment in executing our transformational strategy. We have decentralized certain aspects of the business creating, we believe, an entrepreneurial culture across Zep and placing more decision-making authority closer to our customers. The success of our strategy in creating shareholder value will be measured by the following long-term financial objectives:
| • | Organic revenue growth in excess of market growth rates on an annualized basis; |
26
Table of Contents
| • | Annualized EBIT margin improvement of 50 basis points per year; |
| • | Annualized earnings per share increases of 11 – 13% per year; and |
| • | Returns on invested capital of greater than 15%. |
While these long-term financial objectives are expressed in terms of annualized improvement, we previously stated that in the early phases of our implementation, we would likely experience inconsistent quarterly results. The progress towards achieving these objectives was further impacted by the deep and prolonged economic recession that began in December 2007 and worsened throughout the majority of our 2008 and 2009 fiscal years. However, as discussed in the sections that follow, we made significant improvements to the business during fiscal year 2009, and we remain committed to achieving our previously stated long-term financial objectives.
Liquidity and Capital Resources
Our principal sources of liquidity are operating cash flows generated primarily from operating activities and various sources of borrowings. Our ability to generate sufficient cash flow from operations and to access certain capital markets, including financial institutions, is necessary for us to fund our operations, to pay dividends, to meet obligations as they become due, and to maintain compliance with covenants contained within our financing agreements. Our ongoing liquidity will depend on a number of factors, including available cash resources, cash flow from operations, compliance with covenants contained in certain of our financing agreements, and the ability to access capital markets. As of August 31, 2009, we had additional borrowing capacity under our Revolving Credit Facility of $63.6 million. We entered into four interest rate swap arrangements during the fourth quarter of fiscal year 2008 effectively swapping the variable interest rate associated with $20 million of borrowings made under our Revolving Credit Facility for fixed rates ranging from 3.2% to 3.5%. On October 14, 2009, we entered into a three-year Loan and Security Agreement that allows for borrowings up to $40 million secured by our trade accounts receivable. While we maintained a similar, one-year securitization arrangement during a portion of fiscal years 2008 and 2009, we did not utilize that instrument during its term. We reduced our debt, net of cash, position approximately 46% during fiscal year 2009 to $24.0 million. We were in compliance with all debt-related financial covenants as of August 31, 2009. Based on our current cash on hand, current financing arrangements, and current projections of cash flow from operations, management believes that we will be able to meet the liquidity needs of our current business over the next 12 months. Further detail regarding our debt instruments is provided in the Capitalization section that follows as well as in Note 4 of Notes to Consolidated and Combined Financial Statements.
Cash Flow
We use available cash and cash flow provided by operating activities primarily to fund operations, capital expenditures and dividend payments to shareholders. Prior to the Distribution, after these obligations were met, any excess domestic, as well as periodic repatriation of certain foreign cash balances, were remitted to Acuity Brands.
Net cash flow provided by operating activities for the years ended August 31, 2009 and 2008 was $30.4 million and $26.4 million, respectively. Cash flow provided by operating activities during the year ended August 31, 2009, which improved 15.1% from the prior year, was driven in part by the $9.3 million of net income generated during fiscal year 2009. Additionally, operating working capital (calculated by adding accounts receivable, plus inventories, and subtracting accounts payable) decreased $20.1 million to $83.6 million at August 31, 2009 from $103.8 million in the prior year. Operating working capital levels have declined due to lower sales that resulted from deteriorating macro-economic conditions as well as more efficient management of the components of operating working capital. The $7.9 million use of cash reflected in the Accrued compensation and other current liabilities line item of our cash flow
27
Table of Contents
statement was primarily due to the decrease in compensation-related costs including administrative salaries and bonuses as well as the payment of restructuring-related accruals established during fiscal year 2008. Also impacting fiscal year 2009 operating cash flow was the decrease in costs related to certain of our insurance programs.
The majority of the share-based compensation expense generated through the administration of our share-based award programs does not affect our overall cash position. Accordingly, Net Cash Provided by Operating Activities has been adjusted for approximately $3.2 million of share-based expense, which is reflected as Other non-cash charges within our Consolidated and Combined Statements of Cash Flows.
We paid cash dividends on our common stock of $3.5 million or $0.16 per share during the twelve months ended August 31, 2009. On October 7, 2009, our Board of Directors declared a quarterly dividend of $0.04 per share. Our ability to generate positive cash flows from operating activities directly affects our ability to make dividend payments. Also, restrictions under the instruments governing our indebtedness could impair our ability to make such payments. Effective as of the date of the spin-off, payments on our indebtedness and the quarterly dividend are expected to account for the majority of our financing activities as they pertain to normal operations.
Net cash flow provided by operating activities for the years ended August 31, 2008 and 2007 was $26.4 million and $30.9 million, respectively. Cash flow provided by operating activities during the year ended August 31, 2008 was driven by the $16.3 million of net income generated during the fiscal year. Our operating working capital needs consumed more cash in fiscal year 2008 than in the prior year. In fiscal year 2008 operating working capital (calculated by adding accounts receivable, plus inventories, and subtracting accounts payable) increased by approximately $2.4 million to $103.8 million at August 31, 2008 from $101.4 million at August 31, 2007. The timing of fourth quarter 2008 sales as well as higher annual sales contributed to the increase in accounts receivable. An increase in inventory levels was necessary to prepare for the launch of our Zep Professional brand and promotional activity undertaken by certain of our customers focused in the home improvement retail channel. Operating working capital was also negatively affected by both inflation and currency appreciation on foreign denominated assets. The impact of higher accounts receivable, inventory, and the effect of foreign currency translation was partially offset by improvement in accounts payable resulting from the timing of payments to suppliers.
We recorded restructuring charges in fiscal year 2008 totaling $8.5 million. These charges were composed of severance related costs as well as facility exit costs. Restructuring related amounts yet to be paid as of August 31, 2008 were largely responsible for the $6.3 million source of operating cash reflected in the Accrued compensation and other current liabilities line item of our cash flow statement. However, charges associated with these initiatives resulted in an increase of our deferred tax assets, and on a net basis, our restructuring actions had a minimal impact on our total operating cash flows. Current year restructuring actions are discussed further in Note 8 of Notes to Consolidated and Combined Financial Statements.
Management believes that investing in assets and programs that will over time increase the overall return on our invested capital is a key factor in driving stockholder value. We invested $7.5 million and $9.2 million in fiscal year 2009 and 2008, respectively, primarily to effect facility consolidations, reduce our cost structure, enhance information technology, and improve our manufacturing capabilities. We continue to invest in these items primarily to improve productivity and product quality, increase manufacturing efficiencies, and enhance customer service capabilities. We expect to invest approximately $11.0 million to $13.0 million in fiscal year 2010 for machinery, equipment, and information technology expected to enhance our operations and financial performance in the future.
28
Table of Contents
Contractual Obligations
The following table summarizes our contractual obligations at August 31, 2009:
| Payments Due by Period | |||||||||||||||
| Total | Less than One Year |
1 to 3 Years |
4 to 5 Years |
After 5 Years | |||||||||||
| Long-Term Debt(1) |
$ | 40,650 | $ | 33,500 | $ | — | $ | — | $ | 7,150 | |||||
| Interest Obligations(2) |
6,623 | 1,268 | 1,382 | 2,120 | 1,853 | ||||||||||
| Operating Leases(3) |
32,492 | 7,918 | 11,737 | 7,261 | 5,576 | ||||||||||
| Purchase Obligations(4) |
12,072 | 12,072 | — | — | — | ||||||||||
| Other Long-term Liabilities(5) |
6,086 | 452 | 2,039 | 1,293 | 2,302 | ||||||||||
| Total |
$ | 97,923 | $ | 55,210 | $ | 15,158 | $ | 10,674 | $ | 16,881 | |||||
| (1) | These amounts (which represent outstanding debt at August 31, 2009) are included in the Company’s Consolidated Balance Sheets. The current versus long-term classification of our outstanding debt within these statements reflects our intent and ability to refinance certain amounts that are contractually due in less than one year. Related amounts have been presented as Long-term debt, less current maturities within those statements in accordance with Statement of Financial Accounting Standard No. 6: Classification of Short-Term Obligations Expected to be Refinanced. Further detail regarding our debt instruments is provided in the Capitalization section below as well as in Note 4 of Notes to Consolidated and Combined Financial Statements. |
| (2) | These amounts represent expected future interest payments on debt, including payments under interest rate swap arrangements, that are contractually due within one year but that we anticipate will remain outstanding for longer periods given current market conditions as well as our ability and intent to refinance certain borrowings made under our Revolving Credit Facility. In fiscal year 2008, we entered into four interest rate swap arrangements effectively swapping the variable interest rate associated with $20 million of borrowings made under our Revolving Credit Facility for fixed rates ranging from 3.2% to 3.5%, and estimates of related future interest payments included in this line item have been made in accordance with those fixed rates. Our interest rate swap arrangements will not require an additional cash outlay unless these contracts are terminated prior to maturity. Also included in these expected future interest payments are estimates of interest expense related to our $7.2 million industrial revenue bonds that neither mature nor are expected to be repaid before 2018. |
| (3) | Our operating lease obligations are described in Note 7 of Notes to Consolidated and Combined Financial Statements. |
| (4) | Purchase obligations include commitments to purchase goods or services that specify all significant terms. This amount is primarily composed of purchase orders that were open as of August 31, 2009. |
| (5) | These amounts are included in our Consolidated Balance Sheets and largely represent liabilities on which we are obligated to make future payments pursuant to certain long-term incentive programs addressed within Note 6 of Notes to Consolidated and Combined Financial Statements. Estimates of the value and timing of these amounts are based on various assumptions, including interest rates and other variables. |
Capitalization
Borrowings Preceding the Spin-Off
The debt levels and associated interest costs reflected within the historical combined financial statements prior to the Distribution date of October 31, 2007 (the “Distribution Date”) reflect assumptions regarding prospective debt issuances based upon our anticipated financial condition on or about the time of the spin-off. Debt in the amount of $75.0 million was assumed to have been outstanding during all periods preceding the Distribution Date. Accordingly, Zep has reflected the interest expense associated with these borrowings within its historical results of operations as though $75.0 million in total borrowings had been outstanding during all periods preceding the Distribution Date.
Borrowings Following the Spin-Off
On October 19, 2007, we executed a receivables facility and a Revolving Credit Facility in anticipation of the spin-off, and the significant terms of each of those facilities are discussed below. We drew $62.5 million from that Revolving Credit Facility on October 31, 2007, and these proceeds were immediately distributed to Acuity Brands. Additionally, we assumed a $7.2 million industrial revenue
29
Table of Contents
bond due in 2018 and approximately $0.3 million of other debt following the spin-off. On October 14, 2009, we entered into a three-year Loan and Security Agreement that allows for borrowings up to $40 million secured by our trade accounts receivable. This new receivables facility replaces the receivables facility established in anticipation of the spin-off. Further detail regarding each of these debt instruments and supporting letters of credit, including amounts outstanding under each as of August 31, 2009, is provided within Note 4 of Notes to Consolidated and Combined Financial Statements.
Results of Operations
Fiscal Year 2009 Compared with Fiscal Year 2008
The following table sets forth information comparing the components of net income for the year ended August 31, 2009 with the year ended August 31, 2008. Both dollar and percentage changes included within the tables below were calculated from the Company’s Consolidated and Combined Statements of Income:
| (Dollars in millions) | Years Ended August 31, |
Percent Change |
|||||||||
| 2009 | 2008 | ||||||||||
| Net Sales |
$ | 501.0 | $ | 574.7 | (12.8 | )% | |||||
| Gross Profit |
264.5 | 323.2 | (18.2 | )% | |||||||
| Percent of net sales |
52.8 | % | 56.2 | % | |||||||
| Operating Profit |
18.1 | 29.1 | (37.8 | )% | |||||||
| Percent of net sales |
3.6 | % | 5.1 | % | |||||||
| Income before Provision for Taxes |
15.2 | 26.0 | (41.6 | )% | |||||||
| Percent of net sales |
3.0 | % | 4.5 | % | |||||||
| Net Income |
$ | 9.3 | $ | 16.3 | (43.3 | )% | |||||
Net Sales
Net sales were $501.0 million for the year ended August 31, 2009 compared with $574.7 million generated in the prior fiscal year, representing a decrease of $73.7 million or 12.8%. Weakening demand in each of the Company’s markets resulted in volume-related sales declines of $76.1 million. Domestic unit volume was adversely impacted as we operated our North American core business with reduced direct sales force capacity. In addition to normal attrition, the reduction in selling capacity was attributable to modifications in sales force hiring practices and stricter enforcement of sales performance standards designed to increase productivity and set the stage for growth consistent with our strategic plans. Also, we experienced a decline in demand from the retail marketplace as well as from transportation and food related customers. Unfavorable foreign currency translation on international sales negatively impacted total net sales by an additional $16.0 million. These declines were partially offset by the realization of higher selling prices totaling approximately $18.4 million, primarily within the Company’s domestic markets.
Gross Profit
| (Dollars in millions) | Years Ended August 31, |
Increase (Decrease) |
Percent Change |
||||||||||||
| 2009 | 2008 | ||||||||||||||
| Net Sales |
$ | 501.0 | $ | 574.7 | $ | (73.7 | ) | (12.8 | )% | ||||||
| Cost of Products Sold |
236.5 | 251.5 | (15.0 | ) | (6.0 | )% | |||||||||
| Percent of net sales |
47.2 | % | 43.8 | % | |||||||||||
| Gross Profit |
$ | 264.5 | $ | 323.2 | $ | (58.7 | ) | (18.2 | )% | ||||||
| Percent of net sales |
52.8 | % | 56.2 | % | |||||||||||
30
Table of Contents
Gross profit decreased $58.7 million, or 18.2% to $264.5 million in fiscal year 2009 compared with $323.2 million in the prior fiscal year, which included a $1.2 million charge recorded during May 2008 to establish a reserve for inventory that was discontinued during that period. Declining sales volume coupled with higher raw material costs continued to place downward pressure on gross profit during fiscal year 2009. Gross profit margin of 52.8% in fiscal year 2009 decreased approximately 3.4% from that of the prior fiscal year. On a comparative year-to-date basis, raw material costs increased approximately $18.3 million. Our ability to capture higher selling prices offset these higher raw material costs. The impact of channel and product sales mix was responsible for approximately 80 basis points of the year’s decline in gross profit margin. Also, we significantly lowered finished goods inventories throughout fiscal year 2009. Lower inventory levels resulted in reduced manufacturing absorption, which adversely impacted gross profit margins by approximately 40 basis points. Additionally, fluctuation of foreign currencies relative to the U.S. dollar adversely impacted gross profit in fiscal year 2009 by approximately $8.9 million.
Operating Profit
| (Dollars in millions) | Years Ended August 31, |
Increase (Decrease) |
Percent Change |
||||||||||||
| 2009 | 2008 | ||||||||||||||
| Gross Profit |
$ | 264.5 | $ | 323.2 | $ | (58.7 | ) | (18.2 | )% | ||||||
| Percent of net sales |
52.8 | % | 56.2 | % | |||||||||||
| Selling, Distribution, and Administrative Expenses |
243.0 | 285.6 | (42.6 | ) | (14.9 | )% | |||||||||
| Restructuring Charge |
3.4 | 8.5 | (5.1 | ) | (59.9 | )% | |||||||||
| Operating Profit |
$ | 18.1 | $ | 29.1 | (11.0 | ) | (37.8 | )% | |||||||
| Percent of net sales |
3.6 | % | 5.1 | % | |||||||||||
Operating profit decreased $11.0 million, or 37.8%, in the year ended August 31, 2009 to $18.1 million from $29.1 million reported in fiscal year 2008. Operating margins generated during fiscal year 2009 were 3.6% compared with 5.1% in the prior year.
The Company reduced selling, distribution, and administrative expenses (“SD&A”) by an aggregate of $42.6 million during fiscal year 2009. The decline in net sales resulted in reduced variable selling costs of approximately $28.8 million. Such costs include commissions paid to sales representatives as well as customer freight. We incurred approximately $10.7 million less in expenses attributable to compensation-related costs including administrative salaries and bonuses. Our operating results benefited by approximately $3.8 million from the disciplined control of certain sales support costs. Also, we implemented an enterprise-wide cost containment initiative during the year resulting in savings separate from those mentioned above of approximately $5.8 million. This initiative focused upon reducing a variety of administrative expenses including, but not limited to, those pertaining to facility costs, telecommunications, travel, and consulting. Partially offsetting these cost reductions were $3.6 million in charges necessary to reflect the collection risk in the current economic environment associated with certain accounts receivable and $1.6 million in increased legal-related costs due primarily to the enforcement of our non-compete arrangements.
Operating profit during the year ended August 31, 2009 was adversely affected by charges recorded for restructuring and other special items totaling $3.4 million. During fiscal year 2009, the Company recorded a restructuring charge of $2.0 million pertaining to employee severance costs. Also, the Company is continuing with its facility consolidation initiatives and recorded restructuring charges in the second and fourth quarters of fiscal year 2009 totaling $1.4 million related to facility lease termination and consolidation costs. Operating profit during the year ended August 31, 2008 was adversely affected by charges recorded for restructuring and other special items totaling $10.0 million. Those charges were composed of severance related costs of $5.2 million, facility lease contract termination costs of approximately $3.3 million, and inventory discontinuance costs of $1.5 million.
31
Table of Contents
Income before Provision for Taxes
| (Dollars in millions) | Years Ended August 31, |
Increase (Decrease) |
Percent Change |
||||||||||||
| 2009 | 2008 | ||||||||||||||
| Operating Profit |
$ | 18.1 | $ | 29.1 | $ | (11.0 | ) | (37.8 | )% | ||||||
| Percent of net sales |
3.6 | % | 5.1 | % | |||||||||||
| Other Expense (Income) |
|||||||||||||||
| Interest Expense, net |
1.7 | 2.8 | (1.2 | ) | (41.9 | )% | |||||||||
| Loss on foreign currency translation |
1.2 | 0.3 | 1.0 | 368 | % | ||||||||||
| Miscellaneous Expense (Income) |
— | (— | ) | 0.1 | 202 | % | |||||||||
| Total Other Expense (Income) |
2.9 | 3.1 | (0.2 | ) | (5.4 | )% | |||||||||
| Income before Provision for Taxes |
$ | 15.2 | $ | 26.0 | $ | (10.8 | ) | (41.6 | )% | ||||||
| Percent of net sales |
3.0 | % | 4.5 | % | |||||||||||
Other expense remained consistent with that of the prior year and is composed primarily of losses on transactions denominated in foreign currencies and interest expense associated with our outstanding debt obligations. The loss on foreign currency transactions was offset by a reduction in interest expense attributable to lower comparable interest rates and net borrowings.
Provision for Taxes and Net Income
| (Dollars in millions) | Years Ended August 31, |
Increase (Decrease) |
Percent Change |
||||||||||||
| 2009 | 2008 | ||||||||||||||
| Income before Provision for Taxes |
$ | 15.2 | $ | 26.0 | $ | (10.8 | ) | (41.6 | )% | ||||||
| Percent of net sales |
3.0 | % | 4.5 | % | |||||||||||
| Provision for Income Taxes |
5.9 | 9.7 | (3.7 | ) | (38.7 | )% | |||||||||
| Effective tax rate |
39.0 | % | 37.2 | % | |||||||||||
| Net Income |
$ | 9.3 | $ | 16.3 | $ | (7.1 | ) | (43.3 | )% | ||||||
Net income for the year ended August 31, 2009 decreased $7.1 million, or 43.3%, to $9.3 million from $16.3 million reported in the prior fiscal year. The decrease in net income resulted primarily from the above noted decrease in operating profit. The effective tax rate for fiscal years 2009 and 2008 was 39.0% and 37.2%, respectively. The year-over-year increase in our effective tax rate is due primarily to the impact of permanent items and lower utilization of tax credits in various jurisdictions in fiscal year 2009. Our effective tax rate is anticipated to range between 38% and 39% in fiscal year 2010.
Diluted earnings per share generated in fiscal year 2009 totaled $0.43 representing a decline of $0.34 per diluted share from the $0.77 per diluted share earned in the prior year. Earnings in fiscal year 2009 were negatively impacted by $0.10 per diluted share due as a result of year-to-date restructuring charges. Earnings in fiscal year 2008 were negatively impacted by $0.30 per diluted share due to restructuring charges.
32
Table of Contents
Fiscal Year 2008 Compared with Fiscal Year 2007
The following table sets forth information comparing the key components of net income for the year ended August 31, 2008 with the year ended August 31, 2007. Both dollar and percentage changes included within the tables below were calculated from the Company’s Consolidated and Combined Statements of Income:
| (Dollars in millions) | Years Ended August 31, |
Percent Change |
|||||||||
| 2008 | 2007 | ||||||||||
| Net Sales |
$ | 574.7 | $ | 565.9 | 1.6 | % | |||||
| Gross Profit |
323.2 | 325.9 | (0.8 | )% | |||||||
| Percent of net sales |
56.2 | % | 57.6 | % | |||||||
| Operating Profit |
29.1 | 29.6 | (2.0 | )% | |||||||
| Percent of net sales |
5.1 | % | 5.2 | % | |||||||
| Income before Provision for Taxes |
26.0 | 24.8 | 4.6 | % | |||||||
| Percent of net sales |
4.5 | % | 4.4 | % | |||||||
| Net Income |
$ | 16.3 | $ | 14.1 | 15.9 | % | |||||
Net Sales
Net sales were $574.7 million in fiscal year 2008 compared with $565.9 million in fiscal year 2007, representing an increase of $8.8 million or 1.6%. This increase was due to the effect of foreign currency translation on international sales and higher selling prices captured in all of Zep’s markets. In fiscal year 2008 the effect of fluctuating foreign currency rates on international sales and the Company’s pricing strategies improved net sales by approximately $13.6 million and $12.2 million, respectively. These benefits were partially offset by lower overall unit volume of approximately $17.0 million as greater shipments to our European customer base were more than offset by volume declines in our domestic markets. Domestic unit volume was adversely impacted as we operated our North American core business with reduced direct sales force capacity. In addition to normal attrition, the reduction in selling capacity was attributable to modifications in sales force hiring practices and stricter enforcement of sales performance standards designed to increase productivity and set the stage for growth consistent with our strategic plans. Also, we experienced a decline in demand from the retail marketplace as well as from transportation related customers. Finally, the second half of fiscal year 2008 contained two fewer selling days than the second half of fiscal year 2007.
Gross Profit
| (Dollars in millions) | Years Ended August 31, |
Increase (Decrease) |
Percent Change |
||||||||||||
| 2008 | 2007 | ||||||||||||||
| Net Sales |
$ | 574.7 | $ | 565.9 | $ | 8.8 | 1.6 | % | |||||||
| Cost of Products Sold |
251.5 | 240.0 | 11.5 | 4.8 | % | ||||||||||
| Percent of net sales |
43.8 | % | 42.4 | % | |||||||||||
| Gross Profit |
$ | 323.2 | $ | 325.9 | $ | (2.7 | ) | (0.8 | )% | ||||||
| Percent of net sales |
56.2 | % | 57.6 | % | |||||||||||
Gross profit decreased $2.7 million, or 0.8%, to $323.2 million in fiscal year 2008 from $325.9 million in fiscal year 2007. Gross profit margin of 56.2% in fiscal year 2008 declined 135 basis points from the year-ago period. Gross profit was favorably impacted by the abovementioned foreign currency fluctuation and higher selling prices that resulted in increased net sales. However, this improvement was more than offset by unfavorable trends affecting the cost of our raw materials, particularly those materials that are heavily influenced by energy inputs. Additionally, both manufacturing and freight
33
Table of Contents
related costs during fiscal year 2008 were higher compared with the prior year. Our raw material, manufacturing, and freight related costs increased $9.0 million, $2.4 million, and $2.2 million, respectively during fiscal year 2008. Also, cost of products sold in the third quarter of fiscal year 2008 included a $1.2 million charge related to the establishment of a reserve for discontinued inventory made necessary by the Company’s product line simplification efforts. The above mentioned increase in manufacturing costs was due in part to investments made to increase future productivity.
Operating Profit
| (Dollars in millions) | Years Ended August 31, |
Increase (Decrease) |
Percent Change |
||||||||||||
| 2008 | 2007 | ||||||||||||||
| Gross Profit |
$ | 323.2 | $ | 325.9 | $ | (2.7 | ) | (0.8 | )% | ||||||
| Percent of net sales |
56.2 | % | 57.6 | % | |||||||||||
| Selling, Distribution, and Administrative Expenses |
285.6 | 296.0 | (10.4 | ) | (3.5 | )% | |||||||||
| Restructuring Charge |
8.5 | — | 8.5 | 100 | % | ||||||||||
| Operating Profit |
$ | 29.1 | $ | 29.6 | (0.6 | ) | (2.0 | )% | |||||||
| Percent of net sales |
5.1 | % | 5.2 | % | |||||||||||
Operating profit decreased $0.6 million, or 2.0%, in fiscal year 2008 to $29.1 million from $29.6 million reported in fiscal year 2007. Operating profit margin generated during fiscal year 2008 was consistent with that generated in the prior year.
We reduced SD&A by an aggregate of $10.4 million during fiscal year 2008. Expenses associated with our insurance programs declined when compared with the same year-ago period by $5.5 million. We incurred approximately $3.6 million less in expenses during fiscal year 2008 due to the disciplined control of certain sales related costs, and certain compensation related costs declined approximately $2.6 million.
The non-recurrence of costs associated with legal matters resolved during the prior year also contributed to the reduction of SD&A. During the second quarter of fiscal year 2007 the Company recorded a $1.8 million charge in connection with the settlement of an investigation into certain past environmental practices. During the third quarter of fiscal year 2007 we recorded a $5.0 million charge to establish an environmental reserve for voluntary remediation of sub-surface contaminants at the Company’s primary manufacturing facility. Legal fees during fiscal year 2007 related to these actions totaled $1.6 million.
Partially offsetting these savings was the $7.6 million negative impact from foreign currency translation on total SD&A expenses. Also, the Company incurred incremental costs compared with the prior fiscal year of approximately $1.1 million due to investments, which included consulting fees, made to support our strategic initiatives.
Operating results during fiscal year 2007 reflect an allocation of certain administrative costs associated with functions that were historically managed by our parent on our behalf prior to the spin-off. These functions include treasury, tax, executive and employee benefits, financial reporting, risk management, legal, corporate secretary and investor relations. Also included in these administrative costs were expenses associated with our equity award programs designed to incentivize and reward positive performance of our employees. During fiscal year 2008, as anticipated, the actual costs of these administrative functions outpaced the prior year’s allocated costs by approximately $2.7 million. In the first half of fiscal year 2008, management announced its intention to pursue a strategic plan focused upon achieving the Company’s long-term financial objectives. As part of this program, we recorded net pretax restructuring charges of $8.5 million composed of severance related costs totaling $5.2 million and facility lease contract termination costs of approximately $3.3 million.
34
Table of Contents
Income before Provision for Taxes
| (Dollars in millions) | Years Ended August 31, |
Increase (Decrease) |
Percent Change |
||||||||||||
| 2008 | 2007 | ||||||||||||||
| Operating Profit |
$ | 29.1 | $ | 29.6 | $ | (0.6 | ) | (2.0 | )% | ||||||
| Percent of net sales |
5.1 | % | 5.2 | % | |||||||||||
| Other Expense (Income) |
|||||||||||||||
| Interest Expense, net |
2.8 | 5.0 | (2.1 | ) | (42.9 | )% | |||||||||
| Miscellaneous Expense (Income) |
0.2 | (0.2 | ) | (0.4 | ) | (228 | )% | ||||||||
| Total Other Expense (Income) |
3.1 | 4.8 | (1.7 | ) | (36.2 | )% | |||||||||
| Income before Provision for Taxes |
$ | 26.0 | $ | 24.8 | $ | 1.2 | 4.6 | % | |||||||
| Percent of net sales |
4.5 | % | 4.4 | % | |||||||||||
Other expense consisted primarily of interest expense incurred as a result of our outstanding debt obligations, most of which represent variable-rate debt instruments. Interest expense, net, was $2.8 million and $5.0 million in fiscal years 2008 and 2007, respectively. The reduction in interest costs was attributable to both less outstanding debt and lower weighted average interest rates in fiscal year 2008, and contributed to the increase in income before provision for taxes.
Provision for Taxes and Net Income
| (Dollars in millions) | Years Ended August 31, |
Increase (Decrease) |
Percent Change |
||||||||||||
| 2008 | 2007 | ||||||||||||||
| Income before Provision for Taxes |
$ | 26.0 | $ | 24.8 | $ | 1.2 | 4.6 | % | |||||||
| Percent of net sales |
4.5 | % | 4.4 | % | |||||||||||
| Provision for Income Taxes |
9.7 | 10.8 | (1.1 | ) | (10.1 | )% | |||||||||
| Effective tax rate |
37.2 | % | 43.3 | % | |||||||||||
| Net Income |
$ | 16.3 | $ | 14.1 | $ | 2.2 | 15.9 | % | |||||||
Net income for fiscal year 2008 increased $2.2 million, or 15.9%, to $16.3 million from $14.1 million reported in fiscal year 2007. The increase in net income resulted primarily from the above mentioned increase in income before provision for taxes as well as a decrease in our annual effective tax rate.
The effective tax rate for fiscal year 2008 was 37.2%, compared with 43.3% in fiscal year 2007. The fiscal year 2007 tax rate was adversely affected by approximately 5.0% due to the non-deductible fine that was paid in connection with the wastewater investigation discussed further in Note 7 of the Notes to Consolidated and Combined Financial Statements.
Outlook
In the face of substantial economic headwinds, Zep made significant progress towards improving its cost structure and balance sheet during fiscal year 2009. During a time when liquidity was of great concern for many companies, Zep’s strong cash flow generation allowed the Company to reduce its debt by 31%. Substantial, permanent improvements were made to the Company’s cost structure as operating expenses as a percentage of sales were reduced to the lowest point since stand-alone operations began. The Company’s sourcing initiatives along with declines in the commodity markets yielded significant cost benefits. We believe we have lowered Zep’s breakeven point for the foreseeable future, and, in doing so, have created a platform upon which to profitably grow the business.
Looking ahead to fiscal year 2010, we will augment our existing Zep Sales and Service organization through adding experienced sales associates under a recruitment model designed to yield a faster
35
Table of Contents
return on investment than those used in previous years. We will continue to work collaboratively with our retail customers to build successful merchandising programs at the store level and expand our Zep Commercial product line with other complimentary retailers, including those that service the automotive aftermarket. To date, we have made good progress with efforts to introduce the Zep Professional brand to the $7 billion industrial distribution market. While we are early in our relationship with six world-class distributors and more than 70 regional and local distributors, we intend to leverage these partnerships to grow the Zep Professional product line. During fiscal year 2010 we are also interested in expanding our international business. Specifically, we are focused on driving our core Italian operations, integrating our entire European business, and expanding operations in Europe. Finally, we will leverage our improved capital structure by pursuing appropriate strategic acquisition opportunities that, we believe, will not only broaden our access to market, but will also accelerate profitable sales growth in the industrial distribution, retail and international marketplace.
We face potential execution risk with respect to accomplishing our strategic initiatives. We believe we are operating in a new economic reality, and the full impact on our customers is not yet known as economists are predicting that the effects this recession could be felt for months to come. We intend to continue to manage the business in a way that is not predicated upon a near-term recovery. As volume growth returns, we expect to realize significant financial leverage due to our efforts to improve productivity and streamline the business.
Volatility could return to the commodities markets, which would most likely have a negative impact on margins and volumes. Further, as the Company is continuing to implement its restructuring initiatives, we anticipate that we will incur additional expenses as we reduce the complexity currently associated with our product and customer portfolio, realign our manufacturing and distribution operations to better serve our customers, exit certain leased properties, and take further actions necessary to streamline and decentralize the business.
All this notwithstanding, we remain encouraged regarding the year ahead. We believe the improvements to our cost structure should enable profitable operations in all four quarters of fiscal year 2010. We will continue to aggressively pursue each of the components of our Strategic Plan, and are committed to delivering long-term value to our shareholders as measured by our aforementioned, long-term financial objectives.
Recently Adopted Accounting Standards
In May 2009, the Financial Accounting Standards Board (“FASB”) issued Statement of Financial Accounting Standard (“SFAS”) No. 165, Subsequent Events (“SFAS No. 165”). SFAS No. 165 establishes general standards of accounting for and disclosure of events that occur after the balance sheet date but prior to the issuance of the financial statements. The statement requires disclosure of the date through which subsequent events were evaluated and the basis for that date. SFAS No. 165 sets forth the following: (1) the period after the balance sheet date during which management of a reporting entity should evaluate events or transactions that may occur for potential recognition or disclosure in the financial statements; (2) the circumstances under which an entity should recognize events or transactions occurring after the balance sheet date in its financial statements; and (3) the disclosures that an entity should make about events or transactions that occurred after the balance sheet date. SFAS No. 165 is effective for financial statements issued for fiscal years ending after June 15, 2009 and interim periods within those fiscal years. Accordingly, we have adopted this pronouncement, which did not have a material impact on our results of operations or financial condition. Disclosures required by SFAS No. 165 have been made in Note 12 of Notes to Consolidated and Combined Financial Statements.
In September 2006, the FASB issued SFAS No. 157, Fair Value Measurements (“SFAS No. 157”). SFAS No. 157 establishes a single authoritative definition of fair value, establishes a framework for measuring fair value,
36
Table of Contents
and expands disclosure requirements pertaining to fair value measurements. SFAS No. 157 is effective for financial statements issued for fiscal years beginning after November 15, 2007 and interim periods within those fiscal years, and is therefore effective for us beginning in fiscal year 2009. Accordingly, we adopted this pronouncement effective September 1, 2008. The adoption did not impact our results of operations or financial condition. Disclosures required by SFAS No. 157 are included within Note 2 of Notes to Consolidated and Combined Financial Statements. We have not applied the provisions of SFAS No. 157 to non-financial assets, such as our property and equipment, goodwill and certain other assets, which are measured at fair value for impairment assessment. We will apply the provisions of SFAS No. 157 to these assets and liabilities beginning September 1, 2010, in accordance with FASB Staff Position No. 157-2, “Effective Date of FASB Statement No. 157,” which is not expected to have a material impact on our results of operations or financial condition.
In June 2006, the FASB issued Interpretation No. 48, Accounting for Uncertainty in Income Taxes—an interpretation of FASB Statement No. 109 (“FIN 48”). FIN 48 clarifies the accounting for uncertainty in income taxes by prescribing a recognition threshold and measurement attribute for the financial statement implications of tax positions taken or expected to be taken in a company’s tax return. The interpretation also provides guidance on derecognition, classification, interest and penalties, accounting in interim periods, and disclosure of such positions. We adopted FIN 48 effective September 1, 2007, and detail regarding the impact of this pronouncement’s adoption is located at Note 9 of Notes to Consolidated and Combined Financial Statements.
Accounting Standards Yet to be Adopted
In June 2009, the FASB issued SFAS No. 168, The FASB Accounting Standards Codification (Codification) and the Hierarchy of GAAP (“SFAS No. 168”). SFAS No. 168 replaces SFAS No. 162, The Hierarchy of GAAP and establishes the Codification as the single source of authoritative U.S. GAAP recognized by the FASB to be applied by nongovernmental entities. SEC rules and interpretive releases are also sources of authoritative GAAP for SEC registrants. SFAS No. 168 modifies the GAAP hierarchy to include only two levels of GAAP: authoritative and nonauthoritative. SFAS No. 168 is effective for financial statements issued for fiscal years ending after September 15, 2009 and interim periods within those fiscal years, and will therefore become effective for us beginning in fiscal year 2010. Due to the nature of this pronouncement, we do not anticipate that the adoption of SFAS No. 168 will have a material impact on our results of operations or financial condition.
In March 2008, the FASB issued Statement SFAS No. 161, Disclosures about Derivative Instruments and Hedging Activities, an amendment of FASB Statement No. 133 (“SFAS No. 161”), which requires additional disclosures about the objectives of the derivative instruments and hedging activities, the method of accounting for such instruments under SFAS No. 133, Accounting for Derivative Instruments and Hedging Activities, as amended by SFAS No. 137, SFAS No. 138, and SFAS No. 149 (“SFAS No. 133”) and its related interpretations, and a tabular disclosure of the effects of such instruments and related hedged items on our financial position, financial performance, and cash flows. SFAS No. 161 is effective for financial statements issued for fiscal years beginning after November 15, 2008 and interim periods within those fiscal years, and is therefore effective for us beginning in fiscal year 2010. We are currently assessing the potential impact that the adoption of SFAS No. 161 may have on our consolidated financial statements.
In December 2007, the FASB issued SFAS No. 141 (revised 2007), Business Combinations (“SFAS No. 141(R)”). SFAS No. 141(R) replaces SFAS No. 141 and requires that all assets, liabilities, contingent consideration, contingencies and in-process research and development costs of an acquired business be recorded at fair value at the acquisition date; that acquisition costs generally be expensed as incurred; that restructuring costs generally be expensed in periods subsequent to the acquisition date; and that changes in accounting for deferred tax asset valuation allowances and acquired income tax uncertainties after the measurement period impact income tax expense. SFAS No. 141(R) is effective
37
Table of Contents
for business combinations transacted subsequent to a company’s first annual reporting period beginning after December 15, 2008, and is therefore effective for us beginning in fiscal year 2010. The impact that SFAS No. 141(R) might have on our results of operations and financial position will depend upon the nature, terms and size of any acquisitions that we may consummate after the effective date.
Critical Accounting Estimates
Management’s Discussion and Analysis of Financial Condition and Results of Operations addresses the financial condition and results of operations as reflected in our Consolidated and Combined Financial Statements, which have been prepared in accordance with U.S. generally accepted accounting principles. As discussed in Note 2 of Notes to Consolidated and Combined Financial Statements, the preparation of financial statements in conformity with U.S. generally accepted accounting principles requires management to make estimates and assumptions that affect the reported amounts of assets and liabilities and disclosure of contingent assets and liabilities at the date of the financial statements and reported amounts of revenue and expense during the reporting period. On an ongoing basis, management evaluates its estimates and judgments, including those related to inventory valuation; depreciation, amortization, and the recoverability of long-lived assets, including intangible assets; share-based compensation expense; medical, product warranty, and other reserves; litigation; and environmental matters. Management bases its estimates and judgments on its substantial historical experience and other relevant factors, the results of which form the basis for making judgments about the carrying values of assets and liabilities that are not readily apparent from other sources. Actual results could differ from those estimates. Management discusses the development of accounting estimates with Zep’s Audit Committee. See Note 2 of Notes to Consolidated and Combined Financial Statements for a summary of our accounting policies. We believe the following represent our critical accounting estimates:
Accounts Receivable
The Company records accounts receivable at net realizable value. This value includes an allowance for estimated uncollectible accounts to reflect losses anticipated on accounts receivable balances. The allowance is based on historical write-offs, an analysis of past due accounts based on the contractual terms of the receivables, and the economic status of customers, if known. Management believes that the allowance is sufficient to cover uncollectible amounts; however, there can be no assurance that unanticipated future business conditions of customers will not have a negative impact on the Company’s results of operations.
Inventories
Inventories include materials, direct labor, and related manufacturing overhead, and are stated at the lower of cost (on a first-in, first-out or average cost basis) or market. Management reviews inventory quantities on hand and records a provision for excess or obsolete inventory primarily based on estimated future demand as a function of historical buying patterns and current market conditions. A significant change in customer demand or market conditions could render certain inventory obsolete and thus could have a material adverse impact on our operating results in the period the change occurs.
Long-Lived and Intangible Assets and Goodwill
We review goodwill and intangible assets with indefinite useful lives for impairment on an annual basis or on an interim basis if an event occurs that might reduce the fair value of the long-lived asset below its carrying value. All other long-lived and intangible assets are reviewed for impairment whenever events or circumstances indicate that the carrying amount of the asset may not be recoverable. An impairment
38
Table of Contents
loss would be recognized based on the difference between the carrying value of the asset and its estimated fair value, which would be determined based on either an evaluation of market capitalization or other appropriate fair value methods. The evaluation of goodwill and intangibles with indefinite useful lives for impairment requires management to use significant judgments and estimates including, but not limited to, projected future net sales, operating results, and cash flows of our business. Although management currently believes that the estimates used in the evaluation of goodwill and intangibles with indefinite lives are reasonable, differences between actual and expected net sales, operating results, and cash flows could cause these assets to be deemed impaired. If this were to occur, we would be required to charge to operations the write-down in value of such assets, which could have a material adverse effect on our results of operations and financial position, but not our cash flow from operations.
Self-Insurance
It is our policy to self-insure, up to certain limits, certain risks including workers’ compensation, comprehensive general liability, and auto liability. Our self-insured retention for each claim involving workers’ compensation, comprehensive general liability (including toxic tort and other product liability claims), and auto liability is limited to $0.5 million per occurrence of such claims. Based on our historical claims experience, our comprehensive general liability self-insurance retention limits have been increased to $1.5 million per occurrence for claims incurred after August 31, 2008. A provision for claims under this self-insured program, based on our estimate of the aggregate liability for claims incurred, is revised and recorded annually. The estimate is derived from both internal and external sources including but not limited to our independent actuary. We are also self-insured up to certain limits for certain other insurable risks, primarily physical loss to property ($0.5 million per occurrence) and business interruptions resulting from such loss lasting three days or more in duration. Insurance coverage is maintained for catastrophic property and casualty exposures as well as those risks required to be insured by law or contract. Based on our historical claims experience, the retention limits stipulated by policies addressing physical loss to properties located in North America have been increased to $1.0 million per occurrence for claims incurred after August 31, 2008. We are fully self-insured for certain other types of liabilities, including environmental, product recall, patent infringement and errors and omissions. The actuarial estimates are subject to uncertainty from various sources, including, among others, changes in claim reporting patterns, claim settlement patterns, judicial decisions, legislation, and economic conditions. Although we believe that the actuarial estimates are reasonable, significant differences related to the items noted above could materially affect our self-insurance obligations, future expense, and cash flow.
We are also self-insured for the majority of our medical benefit plans. We estimate our aggregate liability for claims incurred by applying a lag factor to our historical claims and administrative cost experience. The appropriateness of the lag factor is evaluated at least annually and, if necessary, revised upon review. Although management believes that the current estimates are reasonable, significant differences related to claim reporting patterns, plan designs, legislation, and general economic conditions could materially affect our medical benefit plan liabilities, future expense, and cash flow.
Share-Based Compensation Expense
On September 1, 2005, we adopted SFAS No. 123(R), Share-Based Payment (“SFAS No. 123(R)”), which requires that compensation cost relating to share-based payment transactions be recognized in the financial statements based on the estimated fair value of the equity or liability instrument issued. We incurred $3.8 million, $4.4 million, and $3.2 million of share-based expense for the years ended August 31, 2009, 2008, and 2007, respectively. SFAS No. 123(R) requires forfeitures of share-based awards to be estimated at time of grant and revised in subsequent periods if actual forfeitures differ from initial estimates. Expense related to share-based payments has been reduced for estimated forfeitures, and equity awards having graded vesting provisions are accounted for on a straight-line basis.
39
Table of Contents
SFAS No. 123(R) does not specify a preference for a type of valuation model to be used when measuring the fair value of share-based payments. We have historically and will continue to utilize the Black-Scholes model in deriving the fair value estimates of stock option awards whose vesting are conditioned solely upon an award holders’ service to the Company, which includes all stock option awards outstanding as of August 31, 2009. The Black-Scholes model’s valuation inputs include an entity’s dividend yield, measure of expected volatility, estimated risk-free rate and an option’s expected life based on historical exercise behavior of award holders. Our dividend yield is calculated based on annual dividends paid and the trailing 12-month average closing stock price at the time of an award’s grant. For awards issued prior to the spin-off, expected volatility was based on historical volatility of Acuity Brands’ stock over the preceding number of years equal to the expected life of the options. Expected volatility for awards issued under the Zep LTIP was based on the volatilities of well-established guideline companies in accordance with SFAS 123(R). The use of guideline companies as a determinant for volatility will most likely be phased out beginning in fiscal year 2010 as the Company’s own trading history becomes an appropriate measure for expected volatility. We base our risk-free rate on the United States Treasury yield for a term equal to the expected life of the options at the time of grant. The Company has used historical exercise behavior data of similar employee groups to determine the expected life of options. All inputs into the Black-Scholes model are estimates made at the time of grant. Actual realized value of each option grant could materially differ from these estimates, though without impact to future reported net income. On September 1, 2009, the annual equity award grant for fiscal year 2010 was issued. This grant not only included restricted stock and stock option awards conditioned solely upon service, but also awards containing both service and market-based conditions (“performance awards”). Vesting of these performance awards is predicated in part upon on the attainment of certain stock appreciation targets. Our performance award’s fair value will be determined by a more complex valuation model that can accommodate stock price appreciation and other provisions of the performance awards.
As of August 31, 2009, there was $3.9 million of total unrecognized compensation cost related to unvested restricted stock. That cost is expected to be recognized over a weighted-average period of approximately two years. As of August 31, 2009, there was $3.1 million of total unrecognized compensation cost related to unvested options. That cost is expected to be recognized over a weighted-average period of approximately three years. The majority of the share-based compensation expense generated through the administration of our share-based award programs does not affect Zep’s overall cash position. Therefore, certain of these expenses have been reflected as other non-cash charges within our Consolidated and Combined Statements of Cash Flows. Forfeitures were estimated based on historical experience. If factors change causing different assumptions to be made in future periods, compensation expense recorded pursuant to SFAS No. 123(R) may differ significantly from that recorded in the current period. See Notes 2 and 6 of Notes to Consolidated and Combined Financial Statements for more information regarding the assumptions used in estimating the fair value of stock options as well as for the financial implications associated with the adoption of SFAS No. 123(R).
Environmental Matters
We recognize expense for known environmental claims when payments associated with the claims become probable and the costs can be reasonably estimated. The actual cost of resolving environmental issues may be higher or lower than that reserved primarily due to difficulty in estimating such costs and potential changes in the status of government regulations. We are self-insured for most environmental matters. For more information concerning environmental matters affecting the Company and our approach towards such, please refer to Item 3. Legal Proceedings and Note 7 of Notes to Consolidated and Combined Financial Statements.
40
Table of Contents
Cautionary Statement Regarding Forward-Looking Information
This filing contains, and other written or oral statements made by or on behalf of us may include, forward-looking statements, within the meaning of the Private Securities Litigation Reform Act of 1995. In addition, we, or the executive officers on our behalf, may from time to time make forward-looking statements in reports and other documents we file with the SEC or in connection with oral statements made to the press, potential investors or others. Specifically, forward-looking statements may include, but are not limited to:
| • | statements relating to our future economic performance, business prospects, revenue, income, and financial condition; |
| • | statements relating to the tax-free nature of the distribution of Zep common stock to stockholders of Acuity Brands in the spin-off; and |
| • | statements preceded by, followed by, or that include the words “expects,” “believes,” “intends,” “anticipates,” and similar terms that relate to future events, performance, or results of the Company. |
Forward-looking statements are subject to certain risks and uncertainties that could cause actual results, expectations, or outcomes to differ materially from our historical experience and the historical experience of Acuity Brands as well as management’s present expectations or projections. These risks and uncertainties include, but are not limited to:
| • | underlying assumptions or expectations related to the spin-off transaction proving to be inaccurate or unrealized; |
| • | customer and supplier relationships and prices; |
| • | competition; |
| • | ability to realize anticipated benefits from initiatives and timing of benefits; |
| • | market demand; |
| • | litigation and other contingent liabilities, such as environmental matters; and |
| • | economic, political, governmental, technological, and natural disaster related factors affecting the Company’s operations, tax rate, markets, products, services, and prices, among others. |
In evaluating these forward-looking statements, you also should consider various factors, including the risk factors described in Item 1a. Risk Factors of this Annual Report on Form 10-K and the other factors described in our filings with the SEC. You are cautioned not to place undue reliance on any forward-looking statements, which speak only as of the date of this Annual Report and Form 10-K. Except as required by law, we undertake no obligation to publicly update or release any revisions to these forward-looking statements to reflect any events or circumstances after the date of this Annual Report and Form 10-K or to reflect the occurrence of unanticipated events.
Item 7a. Quantitative and Qualitative Disclosures about Market Risk
General. We are exposed to market risks that may impact our financial statements due primarily to changing interest rates and foreign exchange rates. The following discussion provides additional information regarding our market risks.
Interest Rates. Interest rate fluctuations expose our variable-rate debt to changes in interest expense and cash flows. The substantial majority of long-term debt outstanding at August 31, 2009 was attributable to facilities with variable interest rates. We have entered into interest rate swap arrangements with the intention to manage the variability of interest related cash flows associated with our variable-rate debt.
41
Table of Contents
Based on our borrowings, the potential change in annual interest expense resulting from a hypothetical 10% fluctuation in market interest rates would be approximately $0.1 million. See Notes 2 and 4 of the Notes to Consolidated and Combined Financial Statements for additional information regarding our hedge instruments and long-term debt.
Foreign Exchange Rates. The majority of our net sales, expense, and capital purchases are transacted in United States dollars. However, exposure with respect to foreign exchange rate fluctuation exists due to our operations in Canada and Europe. A hypothetical fluctuation in the Canadian dollar and Euro of 10% would impact operating profit by approximately $0.1 million and $0.3 million, respectively. The impact of these hypothetical currency fluctuations has been calculated in isolation from any response we would undertake to address such exchange rate changes in our foreign markets.
Fluctuations in Commodity Prices. The key raw materials used in our products are surfactants, polymers and resins, fragrances, water, solvents, and other petroleum-based materials and packaging materials. We do not engage in commodity hedging transactions for raw materials, though we have committed and will continue to commit to purchase certain materials for specified periods of time. Many of the raw materials that we use are petroleum-based and, therefore, subject to the availability and price of oil or its derivatives. Significant increases in the prices of our products due to increases in the cost of raw materials or packaging materials could have a negative effect on demand for products and on profitability. It is difficult to estimate the impact that pricing volatility in the commodities markets from which we source raw materials will have on our future earnings. However, we estimate the rising costs of raw materials negatively impacted our gross profit by approximately $18.3 million, $9.0 million and $4.0 million in fiscal years 2009, 2008 and 2007, respectively. While we have generally been able to pass along these increases in cost in the form of higher selling prices for our products over time, failure to effectively manage future increases in the costs of these materials could adversely affect our operating margins and cash flow. Furthermore, there are a limited number of suppliers for some of our raw materials, packaging materials, and finished goods. Our profitability, volume, and cash flow could be negatively impacted by limitations inherent within the supply chain of certain of these materials, including competitive conditions, governmental issues, legal issues, natural disasters, and other events that could impact both the availability and price of the materials.
42
Table of Contents
Item 8. Financial Statements and Supplementary Data
Index to Consolidated and Combined Financial Statements
43
Table of Contents
MANAGEMENT’S REPORT ON INTERNAL CONTROL OVER FINANCIAL REPORTING
Zep Inc.
The management of Zep Inc. is responsible for establishing and maintaining adequate internal control over financial reporting for the Company. Internal control over financial reporting is defined in Rule 13a-15(f) and 15d-15(f) promulgated under the Securities Exchange Act of 1934. Because of its inherent limitations, internal control over financial reporting may not prevent or detect misstatements. Projections of any evaluation of effectiveness to future periods are subject to the risk that controls may become inadequate because of changes in conditions, or that the degree of compliance with the policies or procedures may deteriorate.
The Company’s management assessed the effectiveness of the Company’s internal control over financial reporting as of August 31, 2009. In making this assessment, the Company’s management used the criteria set forth by the Committee of Sponsoring Organizations of the Treadway Commission (“COSO”) in Internal Control-Integrated Framework. Based on this assessment, management believes that, as of August 31, 2009, the Company’s internal control over financial reporting is effective.
The Company’s independent registered public accounting firm has issued an audit report on this assessment of the Company’s internal control over financial reporting. This report, dated October 29, 2009, appears on page 46 of this Form 10-K.
| /s/ JOHN K. MORGAN |
/s/ MARK R. BACHMANN | |
| John K. Morgan | Mark R. Bachmann | |
| Chairman, President and Chief Executive Officer |
Executive Vice President and Chief Financial Officer |
44
Table of Contents
Report of Independent Registered Public Accounting Firm
The Board of Directors and Shareholders of Zep Inc.
We have audited the accompanying consolidated balance sheets of Zep Inc. and subsidiaries as of August 31, 2009 and 2008, and the related consolidated and combined statements of income, stockholders’ equity and comprehensive income, and cash flows for each of the three years in the period ended August 31, 2009. Our audits also included the financial statement schedule listed in the Index at Item 15(a). These financial statements and schedule are the responsibility of the Company’s management. Our responsibility is to express an opinion on these financial statements and schedule based on our audits.
We conducted our audits in accordance with the standards of the Public Company Accounting Oversight Board (United States). Those standards require that we plan and perform the audit to obtain reasonable assurance about whether the financial statements are free of material misstatement. An audit includes examining, on a test basis, evidence supporting the amounts and disclosures in the financial statements. An audit also includes assessing the accounting principles used and significant estimates made by management, as well as evaluating the overall financial statement presentation. We believe that our audits provide a reasonable basis for our opinion.
In our opinion, the financial statements referred to above present fairly, in all material respects, the consolidated financial position of Zep Inc. and subsidiaries at August 31, 2009 and 2008, and the consolidated and combined results of their operations and their cash flows for each of the three years in the period ended August 31, 2009, in conformity with U.S. generally accepted accounting principles. Also, in our opinion, the related financial statement schedule, when considered in relation to the basic financial statements taken as a whole, presents fairly in all material respects the information set forth therein.
As discussed in Note 2 to the consolidated and combined financial statements, the Company adopted the provisions of the Financial Accounting Standards Board’s (FASB) Interpretation No. 48, “Accounting for Uncertainty in Income Taxes—an interpretation of FASB Statement No. 109” in 2007.
We also have audited, in accordance with the standards of the Public Company Accounting Oversight Board (United States), Zep Inc.’s internal control over financial reporting as of August 31, 2009, based on criteria established in Internal Control-Integrated Framework issued by the Committee of Sponsoring Organizations of the Treadway Commission and our report dated October 29, 2009 expressed an unqualified opinion thereon.
/s/ Ernst & Young LLP
Atlanta, Georgia
October 29, 2009
45
Table of Contents
Report of Independent Registered Public Accounting Firm
The Board of Directors and Shareholders of Zep Inc.
We have audited Zep Inc.’s internal control over financial reporting as of August 31, 2009, based on criteria established in Internal Control—Integrated Framework issued by the Committee of Sponsoring Organizations of the Treadway Commission (the COSO criteria). Zep Inc.’s management is responsible for maintaining effective internal control over financial reporting, and for its assessment of the effectiveness of internal control over financial reporting included in the accompanying Management’s Report on Internal Control Over Financial Reporting. Our responsibility is to express an opinion on the company’s internal control over financial reporting based on our audit.
We conducted our audit in accordance with the standards of the Public Company Accounting Oversight Board (United States). Those standards require that we plan and perform the audit to obtain reasonable assurance about whether effective internal control over financial reporting was maintained in all material respects. Our audit included obtaining an understanding of internal control over financial reporting, assessing the risk that a material weakness exists, testing and evaluating the design and operating effectiveness of internal control based on the assessed risk, and performing such other procedures as we considered necessary in the circumstances. We believe that our audit provides a reasonable basis for our opinion.
A company’s internal control over financial reporting is a process designed to provide reasonable assurance regarding the reliability of financial reporting and the preparation of financial statements for external purposes in accordance with generally accepted accounting principles. A company’s internal control over financial reporting includes those policies and procedures that (1) pertain to the maintenance of records that, in reasonable detail, accurately and fairly reflect the transactions and dispositions of the assets of the company; (2) provide reasonable assurance that transactions are recorded as necessary to permit preparation of financial statements in accordance with generally accepted accounting principles, and that receipts and expenditures of the company are being made only in accordance with authorizations of management and directors of the company; and (3) provide reasonable assurance regarding prevention or timely detection of unauthorized acquisition, use, or disposition of the company’s assets that could have a material effect on the financial statements.
Because of its inherent limitations, internal control over financial reporting may not prevent or detect misstatements. Also, projections of any evaluation of effectiveness to future periods are subject to the risk that controls may become inadequate because of changes in conditions, or that the degree of compliance with the policies or procedures may deteriorate.
In our opinion, Zep Inc. maintained, in all material respects, effective internal control over financial reporting as of August 31, 2009, based on the COSO criteria.
We also have audited, in accordance with the standards of the Public Company Accounting Oversight Board (United States), the consolidated balance sheets of Zep Inc. as of August 31, 2009 and 2008, and the related consolidated and combined statements of income, stockholders’ equity and comprehensive income, and cash flows for each of the three years in the period ended August 31, 2009 of Zep Inc. and our report dated October 29, 2009 expressed an unqualified opinion thereon.
/s/ Ernst & Young LLP
Atlanta, Georgia
October 29, 2009
46
Table of Contents
CONSOLIDATED BALANCE SHEETS
(In thousands)
| August 31, | ||||||
| 2009 | 2008 | |||||
| ASSETS |
||||||
| Current Assets: |
||||||
| Cash and cash equivalents |
$ | 16,651 | $ | 14,528 | ||
| Accounts receivable, less reserve for doubtful accounts of $4,955 and $3,329 at August 31, 2009 and 2008, respectively |
85,060 | 99,101 | ||||
| Inventories |
39,618 | 50,782 | ||||
| Prepayments and other current assets |
6,772 | 7,300 | ||||
| Deferred income taxes |
7,859 | 6,614 | ||||
| Total Current Assets |
155,960 | 178,325 | ||||
| Property, Plant, and Equipment, at cost: |
||||||
| Land |
3,289 | 3,295 | ||||
| Buildings and leasehold improvements |
56,191 | 53,952 | ||||
| Machinery and equipment |
84,940 | 82,692 | ||||
| Total Property, Plant, and Equipment |
144,420 | 139,939 | ||||
| Less accumulated depreciation and amortization |
89,945 | 85,327 | ||||
| Property, Plant, and Equipment, net |
54,475 | 54,612 | ||||
| Other Assets: |
||||||
| Goodwill and intangible assets |
31,940 | 32,124 | ||||
| Deferred income taxes |
5,989 | 7,387 | ||||
| Other long-term assets |
1,254 | 1,623 | ||||
| Total Other Assets |
39,183 | 41,134 | ||||
| Total Assets |
$ | 249,618 | $ | 274,071 | ||
| LIABILITIES AND STOCKHOLDERS’ EQUITY |
||||||
| Current Liabilities: |
||||||
| Current maturities of long-term debt |
$ | 12,000 | $ | 12,000 | ||
| Accounts payable |
41,062 | 46,120 | ||||
| Accrued compensation |
15,398 | 21,376 | ||||
| Other accrued liabilities |
25,064 | 27,223 | ||||
| Total Current Liabilities |
93,524 | 106,719 | ||||
| Long-term debt, less current maturities |
28,650 | 47,150 | ||||
| Deferred income taxes |
371 | 410 | ||||
| Self-insurance reserves, less current portion |
7,262 | 7,748 | ||||
| Other long-term liabilities |
10,546 | 12,327 | ||||
| Commitments and Contingencies (See Note 7) |
||||||
| Stockholders’ Equity: |
||||||
| Preferred stock, $0.01 par value; 50,000,000 shares authorized; none issued and outstanding |
— | — | ||||
| Common stock, $0.01 par value; 500,000,000 shares authorized; 21,159,127 and 20,957,916 shares issued and outstanding at August 31, 2009 and August 31, 2008, respectively |
212 | 210 | ||||
| Paid-in capital |
80,034 | 75,025 | ||||
| Retained earnings |
15,061 | 9,264 | ||||
| Accumulated other comprehensive income items |
13,958 | 15,218 | ||||
| Total Stockholders’ Equity |
109,265 | 99,717 | ||||
| Total Liabilities and Stockholders’ Equity |
$ | 249,618 | $ | 274,071 | ||
The accompanying Notes to Consolidated and Combined Financial Statements are an integral part of these statements.
47
Table of Contents
CONSOLIDATED AND COMBINED STATEMENTS OF INCOME
(In thousands)
| Years Ended August 31, | ||||||||||
| 2009 | 2008 | 2007 | ||||||||
| Net Sales |
$ | 501,032 | $ | 574,724 | $ | 565,886 | ||||
| Cost of Products Sold |
236,513 | 251,542 | 240,028 | |||||||
| Gross Profit |
264,519 | 323,182 | 325,858 | |||||||
| Selling, Distribution, and Administrative Expenses |
242,083 | 285,592 | 296,016 | |||||||
| Restructuring Charges |
3,422 | 8,527 | — | |||||||
| Loss on Disposal of Fixed Assets |
925 | — | 193 | |||||||
| Operating Profit |
18,089 | 29,063 | 29,649 | |||||||
| Other Expense (Income): |
||||||||||
| Interest expense, net |
1,653 | 2,846 | 4,988 | |||||||
| Miscellaneous expense (income), net |
1,252 | 226 | (176 | ) | ||||||
| Total Other Expense |
2,905 | 3,072 | 4,812 | |||||||
| Income before Provision for Income Taxes |
15,184 | 25,991 | 24,837 | |||||||
| Provision for Income Taxes |
5,924 | 9,669 | 10,754 | |||||||
| Net Income |
$ | 9,260 | $ | 16,322 | $ | 14,083 | ||||
| Earnings Per Share: |
||||||||||
| Basic Earnings per Share |
$ | 0.44 | $ | 0.78 | $ | 0.68 | ||||
| Basic Weighted Average Number of Shares Outstanding |
21,057 | 20,862 | 20,811 | |||||||
| Diluted Earnings per Share |
$ | 0.43 | $ | 0.77 | $ | 0.68 | ||||
| Diluted Weighted Average Number of Shares Outstanding |
21,290 | 21,252 | 20,811 | |||||||
| Dividends Declared per Share |
$ | 0.16 | $ | 0.12 | $ | — | ||||
The accompanying Notes to Consolidated and Combined Financial Statements are an integral part of these statements.
48
Table of Contents
CONSOLIDATED AND COMBINED STATEMENTS OF CASH FLOWS
(In thousands)
| Years Ended August 31, | ||||||||||||
| 2009 | 2008 | 2007 | ||||||||||
| Cash Provided by (Used for) Operating Activities: |
||||||||||||
| Net income |
$ | 9,260 | $ | 16,322 | $ | 14,083 | ||||||
| Adjustments to reconcile net income to net cash provided by (used for) operating activities: |
||||||||||||
| Depreciation and amortization |
6,960 | 6,882 | 7,101 | |||||||||
| Loss on disposal of fixed assets |
925 | — | 193 | |||||||||
| Excess tax benefits from share-based payments |
(758 | ) | (777 | ) | — | |||||||
| Other non-cash charges |
3,152 | 3,161 | 2,342 | |||||||||
| Changes in assets and liabilities: |
||||||||||||
| Accounts receivable |
13,295 | (5,103 | ) | (1,889 | ) | |||||||
| Inventories |
10,854 | (4,653 | ) | 1,572 | ||||||||
| Deferred income taxes |
114 | (996 | ) | 651 | ||||||||
| Prepayments and other current assets |
443 | (1,937 | ) | (467 | ) | |||||||
| Accounts payable |
(4,851 | ) | 8,669 | 1,502 | ||||||||
| Accrued compensation and other current liabilities |
(7,904 | ) | 6,315 | 1,601 | ||||||||
| Self insurance reserves and other long-term liabilities |
(2,118 | ) | (574 | ) | 3,518 | |||||||
| Other assets |
1,066 | (874 | ) | 724 | ||||||||
| Net Cash Provided by Operating Activities |
30,438 | 26,435 | 30,931 | |||||||||
| Cash Provided by (Used for) Investing Activities: |
||||||||||||
| Purchases of property, plant, and equipment |
(7,517 | ) | (9,176 | ) | (5,809 | ) | ||||||
| Other investing activities |
— | 124 | 291 | |||||||||
| Net Cash Used for Investing Activities |
(7,517 | ) | (9,052 | ) | (5,518 | ) | ||||||
| Cash Provided by (Used for) Financing Activities: |
||||||||||||
| Proceeds from revolving credit facility |
66,800 | 96,700 | — | |||||||||
| Repayment of borrowings from revolving credit facility |
(85,300 | ) | (49,724 | ) | — | |||||||
| Payment to Acuity Brands, Inc. upon separation |
— | (62,500 | ) | — | ||||||||
| Proceeds from issuances of other long-term debt |
— | — | 647 | |||||||||
| Stock issuances |
709 | 381 | — | |||||||||
| Excess tax benefits from share-based payments |
758 | 777 | — | |||||||||
| Dividend payments |
(3,463 | ) | (2,596 | ) | — | |||||||
| Repayments of other long-term debt |
— | (326 | ) | (647 | ) | |||||||
| Net activity with Acuity Brands, Inc. prior to separation |
— | 4,876 | (24,831 | ) | ||||||||
| Net Cash Used For Financing Activities |
(20,496 | ) | (12,412 | ) | (24,831 | ) | ||||||
| Effect of Exchange Rate Changes on Cash |
(302 | ) | 415 | 432 | ||||||||
| Net Change in Cash and Cash Equivalents |
2,123 | 5,386 | 1,014 | |||||||||
| Cash and Cash Equivalents at Beginning of Period |
14,528 | 9,142 | 8,128 | |||||||||
| Cash and Cash Equivalents at End of Period |
$ | 16,651 | $ | 14,528 | $ | 9,142 | ||||||
| Supplemental Cash Flow Information: |
||||||||||||
| Income taxes paid during the year |
$ | 6,243 | $ | 6,843 | $ | 9,413 | ||||||
| Interest paid during the period |
$ | 1,730 | $ | 2,394 | $ | 5,211 | ||||||
The accompanying Notes to Consolidated and Combined Financial Statements are an integral part of these statements.
49
Table of Contents
CONSOLIDATED AND COMBINED STATEMENTS OF STOCKHOLDERS’ EQUITY AND COMPREHENSIVE INCOME
| (in thousands) | Parent’s Equity |
Common Stock |
Additional Paid-In Capital |
Retained Earnings |
Accumulated Other Comprehensive Income |
Total Equity |
Comprehensive Income |
|||||||||||||||||||||
| Balance as of August 31, 2006 |
$ | 72,077 | — | $ | — | $ | — | $ | — | $ | 8,971 | $ | 81,048 | |||||||||||||||
| Net income |
14,083 | — | — | — | — | — | 14,083 | $ | 14,083 | |||||||||||||||||||
| Foreign currency translation adjustment (net of tax of $0) |
— | — | — | — | — | 4,345 | 4,345 | 4,345 | ||||||||||||||||||||
| Other non-cash charges |
2,342 | — | — | — | — | — | 2,342 | |||||||||||||||||||||
| Comprehensive income |
— | — | — | — | — | — | — | $ | 18,428 | |||||||||||||||||||
| Net transaction with Acuity |
(26,984 | ) | — | — | — | — | — | (26,984 | ) | |||||||||||||||||||
| Balance as of August 31, 2007 |
$ | 61,518 | — | $ | — | $ | — | $ | — | $ | 13,316 | $ | 74,834 | |||||||||||||||
| Net income earned prior to spin-off |
4,462 | — | — | — | — | — | 4,462 | $ | 4,462 | |||||||||||||||||||
| Net income earned subsequent to spin-off |
— | — | — | — | 11,860 | — | 11,860 | 11,860 | ||||||||||||||||||||
| Change in unrealized loss on cash flow hedge, (net of tax of $50) |
— | — | — | — | — | (76 | ) | (76 | ) | (76 | ) | |||||||||||||||||
| Foreign currency translation adjustment (net of tax of $0) |
— | — | — | — | — | 1,978 | 1,978 | 1,978 | ||||||||||||||||||||
| Comprehensive income |
— | — | — | — | — | — | — | $ | 18,224 | |||||||||||||||||||
| Net transaction with Acuity |
4,876 | — | — | — | — | — | 4,876 | |||||||||||||||||||||
| Consummation of spin-off transaction on October 31, 2007, including distribution of Zep Inc. common stock by Acuity Brands, Inc |
(70,856 | ) | 20,811 | 208 | 70,648 | — | — | — | ||||||||||||||||||||
| Amortization, issuance, and forfeitures of restricted stock grants and stock options |
— | 129 | 2 | 2,792 | — | — | 2,794 | |||||||||||||||||||||
| Deferred compensation plan |
— | 2 | — | 427 | — | — | 427 | |||||||||||||||||||||
| Employee stock purchase plan issuances |
— | 14 | — | 317 | — | — | 317 | |||||||||||||||||||||
| Stock option exercises |
— | 2 | — | 64 | — | — | 64 | |||||||||||||||||||||
| Dividend payments |
— | — | — | — | (2,596 | ) | — | (2,596 | ) | |||||||||||||||||||
| Tax effect on stock options and restricted stock |
— | — | — | 777 | — | — | 777 | |||||||||||||||||||||
| Balance at August 31, 2008 |
$ | — | 20,958 | $ | 210 | $ | 75,025 | $ | 9,264 | $ | 15,218 | $ | 99,717 | |||||||||||||||
| Net income |
— | — | — | — | 9,260 | — | 9,260 | $ | 9,260 | |||||||||||||||||||
| Change in unrealized loss on cash flow hedge, (net of tax of $143) |
— | — | — | — | — | (250 | ) | (250 | ) | (250 | ) | |||||||||||||||||
| Foreign currency translation adjustment (net of tax of $0) |
— | — | — | — | — | (1,010 | ) | (1,010 | ) | (1,010 | ) | |||||||||||||||||
| Comprehensive income |
— | — | — | — | — | — | — | $ | 8,000 | |||||||||||||||||||
| Net transaction with Acuity |
— | — | — | 792 | — | — | 792 | |||||||||||||||||||||
| Amortization, issuance, and forfeitures of restricted stock grants and stock options |
— | 130 | 2 | 2,656 | — | — | 2,658 | |||||||||||||||||||||
| Deferred compensation plan |
— | 4 | — | 94 | — | — | 94 | |||||||||||||||||||||
| Employee stock purchase plan issuances |
— | 23 | — | 272 | — | — | 272 | |||||||||||||||||||||
| Stock option exercises |
— | 44 | — | 437 | — | — | 437 | |||||||||||||||||||||
| Dividend payments |
— | — | — | — | (3,463 | ) | — | (3,463 | ) | |||||||||||||||||||
| Tax effect on stock options and restricted stock |
— | — | — | 758 | — | — | 758 | |||||||||||||||||||||
| Balance at August 31, 2009 |
$ | — | 21,159 | $ | 212 | $ | 80,034 | $ | 15,061 | $ | 13,958 | $ | 109,265 | |||||||||||||||
The accompanying Notes to Consolidated and Combined Financial Statements are an integral part of these statements.
50
Table of Contents
NOTES TO CONSOLIDATED AND COMBINED FINANCIAL STATEMENTS
(Dollar amounts in thousands, except share and per-share data and as indicated)
Note 1: Description of Business, Distribution and Basis of Presentation
Description of the Business and Distribution
Zep Inc. (“Zep” or the “Company”) is a producer, marketer, and service provider of a wide range of cleaning and maintenance solutions for commercial, industrial, institutional, and consumer end-markets. The stock of Zep is listed on the New York Stock Exchange under the ticker symbol “ZEP”. Zep’s product portfolio includes anti-bacterial and industrial hand care products, cleaners, degreasers, deodorizers, disinfectants, floor care, sanitizers, and pest and weed control products. As of August 31, 2009, Zep served approximately 240,000 customers through a network of distribution centers and warehouses utilizing a base of more than 2,300 unique formulations.
The spin-off of Zep by Acuity Brands, Inc. (“Acuity Brands”) became effective on October 31, 2007 (the “Distribution Date”) through a distribution of 100% of the common stock of Zep to Acuity Brands’ stockholders (the “Distribution”). The stock dividend of one share of Zep common stock for every two shares of Acuity Brands common stock was distributed on a pro rata basis to holders of record of Acuity Brands common stock at the close of business on October 17, 2007, which was the record date for the Distribution. No fractional shares of Zep common stock were distributed. Instead of fractional shares, Zep stockholders received cash. Following the Distribution, Acuity Brands does not own any shares of Zep as the spin-off rendered Zep an independent public company. In conjunction with the separation of their businesses, Zep and Acuity Brands entered into various agreements that address the allocation of assets and liabilities between them and that define their relationship after the separation, including the Agreement of Plan of Distribution, which we refer to as the distribution agreement, the tax disaffiliation agreement, the employee benefits agreement, and the transition services agreement. The Internal Revenue Service has issued a private letter ruling supporting the spin-off’s tax-free status, and Zep continues to conduct its operations in a manner that is compliant with the conditions set forth by that ruling. Zep and Acuity Brands have also received an opinion from their external counsel supporting the spin-off’s tax-free status.
Prior to the spin-off, Acuity Brands engaged in an internal restructuring, including a holding company reorganization. As part of the internal restructuring, the business that had previously been conducted by Acuity Specialty Products Group, Inc. was merged into the parent company and was subsequently transferred to Acuity Specialty Products, Inc. (“ASP”). ASP is now a wholly-owned subsidiary of Zep Inc.
Basis of Presentation
Our Consolidated and Combined Financial Statements have been prepared by us in accordance with U.S. generally accepted accounting principles and present our financial position, results of operations, and cash flows. The financial statements and other financial information in this Form 10-K related to periods ending on or after the Distribution Date are presented on a consolidated basis and include the accounts of Zep and its majority-owned subsidiaries.
The financial statements and related financial information pertaining to periods preceding the Distribution Date have been presented on a combined basis and reflect the results of those entities that were ultimately transferred to us as part of the spin-off. Prior to the spin-off, certain functions, including treasury, tax, executive and employee benefits, financial reporting, risk management, legal, corporate secretary and investor relations, were historically managed by the corporate division of Acuity Brands on behalf of its subsidiaries. The assets, liabilities and expenses related to the support of these centralized
51
Table of Contents
Zep Inc.
NOTES TO CONSOLIDATED AND COMBINED FINANCIAL STATEMENTS—(Continued)
(Dollar amounts in thousands, except share and per-share data and as indicated)
corporate functions have been allocated to us on a specific identification basis to the extent possible. Otherwise, allocations related to these services were primarily based upon an estimate of the proportion of corporate amounts applicable to us given our contribution to our consolidated parent company’s revenues and employee base. Allocation ratios derived from these contribution factors are similar in amount and remained consistent throughout the historical periods presented. Examples of expenses that were allocated in accordance with these proportional estimates include charges related to accounting and legal services undertaken to ensure the consolidated parent company’s compliance with various regulatory requirements as well as the salaries of certain corporate officers and employees. In the opinion of management, the assumptions and allocations have been made on a reasonable and appropriate basis under the circumstances. Management believes that amounts allocated to Zep reflect a reasonable representation of the types of costs that would have been incurred if we had performed these functions as a stand-alone company. However, as estimation is inherent within the aforementioned allocation process, these combined financial statements do not include all of the actual amounts that would have been incurred had we been a stand-alone entity during the periods presented. The combined financial statements reflect an allocation of debt and related interest expense, as further described in Note 4 to the Notes to Consolidated and Combined Financial Statements.
Note 2: Summary of Significant Accounting Policies
Principles of Consolidation and Combination
The Consolidated and Combined Financial Statements include the accounts of Zep after elimination of significant intercompany transactions and accounts.
Revenue Recognition
Zep records revenue when the following criteria are met: persuasive evidence of an arrangement exists, delivery has occurred, the selling price to the customer is fixed and determinable, and collectibility is reasonably assured. Delivery is not considered to have occurred until the customer assumes the risks and rewards of ownership. Customers take delivery at the time of shipment for terms designated free on board shipping point. For sales designated free on board destination, customers take delivery when the product is delivered to the customer’s delivery site. Provisions for rebates, sales incentives, product returns, and discounts to customers are recorded as an offset to revenue in the same period the related revenue is recorded. The Company also maintains one-time or on-going marketing and trade-promotion programs with certain customers that require the Company to estimate and accrue the expected costs of such programs. These arrangements include cooperative marketing programs, merchandising of the Company’s products and introductory marketing funds for new products and other trade-promotion activities conducted by the customer. Costs associated with these programs are recorded as a reduction of revenues.
The Company provides for limited product return rights to certain distributors and customers primarily for slow moving or damaged items subject to certain defined criteria. The Company monitors product returns and records, at the time revenue is recognized, a provision for the estimated amount of future returns based primarily on historical experience and specific notification of pending returns. Although historical product returns generally have been within expectations, there can be no assurance that future product returns will not exceed historical amounts. A significant increase in product returns could have a material impact on the Company’s operating results in future periods.
52
Table of Contents
Zep Inc.
NOTES TO CONSOLIDATED AND COMBINED FINANCIAL STATEMENTS—(Continued)
(Dollar amounts in thousands, except share and per-share data and as indicated)
Use of Estimates
The preparation of financial statements and related disclosures in conformity with U.S. generally accepted accounting principles requires management to make estimates and assumptions, which include estimates of Acuity Brands’ costs allocated to Zep, that affect the reported amounts of assets and liabilities, the disclosure of contingent assets and liabilities at the date of the financial statements, and the reported amounts of revenue and expense during the reporting period. Actual results could differ from those estimates.
Cash and Cash Equivalents
Cash in excess of daily requirements is invested in marketable securities and is included in the accompanying balance sheets at fair value. Zep considers time deposits and marketable securities purchased with an original maturity of three months or less to be cash equivalents.
Accounts Receivable
The Company records accounts receivable at net realizable value. This value includes an allowance for estimated uncollectible accounts to reflect losses anticipated on accounts receivable balances. The allowance is based on historical write-offs, an analysis of past due accounts based on the contractual terms of the receivables, and the economic status of customers, if known. Management believes that the allowance is sufficient to cover uncollectible amounts; however, there can be no assurance that unanticipated future business conditions of customers will not have a negative impact on the Company’s results of operations.
Concentrations of Credit Risk
Concentrations of credit risk with respect to receivables, which are typically unsecured, are generally limited due to the wide variety of customers and markets using Zep’s products, as well as their dispersion across many different geographic areas. Receivables due from The Home Depot were approximately $12.7 million, $13.1 million, and $14.3 million as of the three years ended August 31, 2009, respectively. Additionally, net sales to The Home Depot by Zep accounted for approximately 11%, 10% and 11% of our total net sales during the three fiscal years ended August 31, 2009, respectively. No other single customer accounted for more than 10% of combined receivables at August 31, 2009.
Fair Value of Financial Instruments
Our financial instruments consist primarily of cash and cash equivalents, trade receivables, trade payables, and debt and related derivative instruments. The book values of cash and cash equivalents, trade receivables, and trade payables are considered to be representative of their respective fair values due to their short-term nature.
As discussed further in Note 4 of Notes to Consolidated and Combined Financial Statements, debt levels pertaining to periods prior to the Distribution and reflected within our historical Consolidated Balance Sheets reflect assumptions regarding prospective debt issuances based upon Zep’s anticipated financial condition on or about the time of the spin-off. Therefore, it is not practicable to make estimates regarding the fair value of our outstanding indebtedness prior to the Distribution. The majority of our indebtedness related to periods subsequent to the Distribution was transacted through borrowings
53
Table of Contents
Zep Inc.
NOTES TO CONSOLIDATED AND COMBINED FINANCIAL STATEMENTS—(Continued)
(Dollar amounts in thousands, except share and per-share data and as indicated)
made under our Revolving Credit Facility. We estimate that the carrying value of all of our outstanding debt obligations approximates fair value based on the variable nature of interest rates associated with our indebtedness.
We entered into four interest rate swap arrangements during the fourth quarter of fiscal year 2008 effectively swapping the variable interest rate associated with $20 million of borrowings made under our Revolving Credit Facility for fixed rates ranging from 3.2% to 3.5%. These interest rate swaps, which mature in June 2010, constitute derivative instruments and are accounted for as cash flow hedges. The objective of these hedges is to manage the variability of interest related cash flows associated with variable-rate debt subject to these hedge instruments. There was no ineffectiveness related to the change in fair value of our cash flow hedges during either fiscal year 2009 or fiscal year 2008. The instruments generated unrealized losses totaling $0.3 million and $0.1 million in fiscal years 2009 and 2008. These unrealized losses have been recorded net of tax within Accumulated Other Comprehensive Income on our Consolidated and Combined Statements of Stockholders’ Equity and Comprehensive Income. The estimated fair values of our derivative instruments are calculated based on market rates. Our cash flow hedges carried an aggregate fair market value liability of approximately $0.6 million as of August 31, 2009, all of which is expected to affect earnings by June 2010. These instruments are valued using pricing models based upon market observable inputs such as yield curves, and such inputs are classified as Level 2 inputs under SFAS No. 157, Fair Value Measurements (“SFAS No. 157”). These values reflect estimated termination costs and may be affected by counterparty creditworthiness and market conditions. However, we minimize such risk exposures for these instruments by limiting the counterparties to large banks and financial institutions that meet established credit guidelines. We do not expect to incur any losses as a result of counterparty default. The debt instrument related to these hedges is discussed further in Note 4 of Notes to Consolidated and Combined Financial Statements.
Inventories
Inventories include materials, direct labor, and related manufacturing overhead, are stated at the lower of cost (on a first-in, first-out or average cost basis) or market, and consist of the following:
| 2009 | 2008 | |||||||
| Raw materials and supplies |
$ | 12,814 | $ | 16,351 | ||||
| Work in progress |
448 | 401 | ||||||
| Finished goods |
28,968 | 36,328 | ||||||
| 42,230 | 53,080 | |||||||
| Less: Reserves |
(2,612 | ) | (2,298 | ) | ||||
| $ | 39,618 | $ | 50,782 | |||||
During the first quarter of fiscal year 2008, Zep’s management announced its intention to pursue a strategic plan focused upon achieving the Company’s long-term financial objectives. As part of this plan, in the third quarter of fiscal year 2008 we recorded a $1.5 million charge related to discontinued inventory resulting from our product line simplification initiatives ($1.2 million for inventory write-downs was recorded within Cost of Products Sold and affected our inventory reserves, the remaining $0.3 million related to estimated waste disposal costs and was recorded within Selling, Distribution, and Administrative Expenses). Further discussion of this charge can be found at Note 8 of Notes to Consolidated and Combined Financial Statements.
54
Table of Contents
Zep Inc.
NOTES TO CONSOLIDATED AND COMBINED FINANCIAL STATEMENTS—(Continued)
(Dollar amounts in thousands, except share and per-share data and as indicated)
Goodwill and Other Intangibles
Of the $32.0 million in goodwill reflected as of August 31, 2009 on the Consolidated Balance Sheets, approximately $21.0 million is attributable to the fiscal 1997 acquisition of Enforcer Products, Inc. (“Enforcer”). The Enforcer brand provides retail plumbing and pest and weed control products sold through home improvement retailers. The remainder of the goodwill resulted from several smaller acquisitions. Zep tests goodwill for impairment on an annual basis in the fiscal fourth quarter or sooner if events or changes in circumstances indicate that the carrying amount of goodwill may exceed its fair value. The goodwill impairment test has two steps. The first step identifies potential impairments by comparing the fair value of the reporting unit, Zep, with its carrying value, including goodwill. The fair value of Zep is determined based on valuation techniques and considerations concerning our market capitalization. If the calculated fair value of a reporting unit exceeds the carrying value, goodwill is not impaired and the second step is not necessary. If the carrying value of a reporting unit exceeds the fair value, the second step calculates the possible impairment loss by comparing the implied fair value of goodwill with the carrying value. If the implied fair value of the goodwill is less than the carrying value, an impairment charge is recorded. This analysis did not result in an impairment charge during fiscal years 2009, 2008, or 2007.
Zep’s intangible assets subject to amortization primarily include the trademarks, patents, and formulations acquired through the purchase of Enforcer. The Company amortizes trademarks associated with specific products with finite lives over their estimated useful lives of 30 years. Other amortized intangible assets consist primarily of patented technology that is amortized over its estimated useful life of 12 years. The Company recorded amortization expense of less than $0.1 million related to intangible assets with finite lives during fiscal years 2009, 2008, and 2007. In each of the next five years amortization expense is projected to remain consistent with that reported during fiscal years 2009, 2008, and 2007. No adjustments were made during fiscal year 2009 to intangible assets related to trademarks, patents, and formulations other than normal accumulated amortization.
Other Long-Term Liabilities
Other long-term liabilities consist of the following:
| 2009 | 2008 | |||||
| Deferred compensation and postretirement benefits(1) |
$ | 2,902 | $ | 3,182 | ||
| Liabilities related to the adoption of FIN 48(2) |
1,465 | 1,614 | ||||
| Environmental remediation liabilities(3) |
2,700 | 3,244 | ||||
| Restructuring related reserves(4) |
1,746 | 2,330 | ||||
| Miscellaneous(5) |
1,733 | 1,957 | ||||
| $ | 10,546 | $ | 12,327 | |||
| (1) | Postretirement benefits—We adopted a non-qualified deferred compensation plan effective October 31, 2007 for the benefit of our eligible employees. The deferred compensation plan administered by the Company provides for elective deferrals of an eligible employee’s compensation, which are matched with contributions from the Company as stipulated by the plan. In addition, the plan provides for an automatic contribution by the Company ranging from 3% to 5% of an eligible employee’s compensation. See Note 6 of Notes to Consolidated and Combined Financial Statements for more information regarding this plan. |
| (2) | Liabilities related to the adoption of Financial Accounting Standards Board (“FASB”) Interpretation No. 48, Accounting for Uncertainty in Income Taxes—an interpretation of FASB Statement No. 109 (“FIN 48”)—We adopted FIN 48 effective |
55
Table of Contents
Zep Inc.
NOTES TO CONSOLIDATED AND COMBINED FINANCIAL STATEMENTS—(Continued)
(Dollar amounts in thousands, except share and per-share data and as indicated)
| September 1, 2007, and accordingly recognized a liability totaling $1.6 million. The amount is almost entirely offset by a corresponding receivable recorded within Other long-term assets pursuant to the terms of the tax disaffiliation agreement entered into between us and our former parent company. See Note 9 of Notes to Consolidated and Combined Financial Statements for more information regarding this pronouncement’s adoption. |
| (3) | Environmental remediation liabilities—In May 2007, we recorded a $5.0 million pretax charge representing our best estimate of costs associated with a Company-initiated remediation plan addressing subsurface contamination identified at our primary manufacturing facility located in Atlanta, Georgia. The portion of this reserve related to amounts we expect to expend after fiscal year 2010 is classified within Other long-term liabilities. See Note 7 of Notes to Consolidated and Combined Financial Statements for more information regarding our environmental remediation efforts. |
| (4) | Restructuring related reserves—We established accruals for facility lease termination costs associated with our restructuring activities during fiscal years 2009 and 2008. The portion of these accruals associated with payments expected to occur subsequent to fiscal 2010 have been appropriately classified as long-term. See Note 8 of Notes to Consolidated and Combined Financial Statements for more information regarding our restructuring activities. |
| (5) | Miscellaneous—These amounts represent a number of liabilities that will be settled beyond fiscal 2010, the most substantial of which pertains to deferred rents associated with facility lease agreements containing escalating rent clauses. |
Shipping and Handling Fees and Costs
Zep includes shipping and handling fees billed to customers in Net Sales. Shipping and handling costs associated with inbound freight and freight between manufacturing facilities and distribution centers are generally recorded in Cost of Products Sold. Certain customer related shipping and handling costs are included in Selling, Distribution, and Administrative Expenses, and those costs totaled $31.5 million, $38.6 million, and $37.0 million for fiscal years 2009, 2008, and 2007, respectively.
Share-Based Compensation
Effective September 1, 2005, the Company adopted Statement of Financial Accounting Standards No. 123(R), Share-Based Payment (“SFAS No. 123(R)”). SFAS No. 123(R) requires that compensation cost relating to share-based payment transactions be recognized in financial statements and that this cost be measured based on the estimated fair value of the equity or liability instrument issued. SFAS No. 123(R) also requires that forfeitures be estimated over the vesting period of the instrument.
Share-based expense includes expense related to restricted stock and options issued, as well as share units deferred into our Director Deferred Compensation Plan and our Supplemental Deferred Savings Plan. Zep incurred $3.8 million, $4.4 million, and $3.2 million of share-based expense, which includes an estimate of forfeitures, for the years ended August 31, 2009, 2008, and 2007, respectively. Zep did not capitalize any expense related to share-based payments and has recorded share-based expense within Selling, Distribution, and Administrative Expenses. Equity awards having graded vesting provisions are accounted for on a straight-line basis. The majority of the share-based compensation expense generated through the administration of the Company’s award programs does not affect Zep’s overall cash position. Therefore, certain of these expenses have been reflected as other non-cash charges within our Consolidated and Combined Statements of Cash Flows. SFAS No. 123(R) requires that the benefit of tax deductions in excess of recognized compensation cost be reported as a financing cash flow, rather than as an operating cash flow as required under prior guidance. Excess tax benefits of $0.8 million were included in the financing activities of the Company’s Consolidated and Combined Statements of Cash Flows for the year ended August 31, 2009.
56
Table of Contents
Zep Inc.
NOTES TO CONSOLIDATED AND COMBINED FINANCIAL STATEMENTS—(Continued)
(Dollar amounts in thousands, except share and per-share data and as indicated)
Depreciation
For financial reporting purposes, depreciation is determined principally on a straight-line basis using estimated useful lives of plant and equipment (20 to 40 years for buildings and 5 to 12 years for machinery and equipment) while accelerated depreciation methods are used for income tax purposes. Leasehold improvements are amortized over the life of the lease or the useful life of the improvement, whichever is shorter.
Research and Development
Research and development costs, which are included in Selling, Distribution, and Administrative Expenses in our Consolidated and Combined Statements of Income, are expensed as incurred. Research and development expenses ranged between $1.5 million and $2.5 million during the three years ended August 31, 2009.
Advertising
Advertising costs are expensed as incurred and are included within Selling, Distribution, and Administrative Expenses in our Consolidated and Combined Statements of Income. These costs totaled $2.4 million, $1.9 million, and $1.4 million during fiscal years 2009, 2008, and 2007, respectively.
Foreign Currency Translation
The functional currency for the foreign operations of Zep is the local currency. The translation of foreign currencies into United States dollars is performed for balance sheet accounts using exchange rates in effect at the balance sheet dates and for revenue and expense accounts using a weighted average exchange rate each month during the year. The gains or losses resulting from the translation are included in Comprehensive Income in the Consolidated and Combined Statements of Stockholders’ Equity and Comprehensive Income and are excluded from net income.
Interest Expense, Net
Interest expense, net, is composed primarily of interest expense on our variable-rate debt instruments, partially offset by interest income on cash and cash equivalents.
The following table summarizes the components of interest expense, net:
| Years Ended August 31, | ||||||||||||
| 2009 | 2008 | 2007 | ||||||||||
| Interest expense |
$ | 1,791 | $ | 3,081 | $ | 5,218 | ||||||
| Interest income |
(138 | ) | (235 | ) | (230 | ) | ||||||
| Interest expense, net |
$ | 1,653 | $ | 2,846 | $ | 4,988 | ||||||
Miscellaneous Expense (Income), Net
Miscellaneous expense (income), net, is composed primarily of gains or losses on foreign currency transactions.
57
Table of Contents
Zep Inc.
NOTES TO CONSOLIDATED AND COMBINED FINANCIAL STATEMENTS—(Continued)
(Dollar amounts in thousands, except share and per-share data and as indicated)
Recently Adopted Accounting Standards
In May 2009, the Financial Accounting Standards Board (“FASB”) issued Statement of Financial Accounting Standard (“SFAS”) No. 165, Subsequent Events (“SFAS No. 165”). SFAS No. 165 establishes general standards of accounting for and disclosure of events that occur after the balance sheet date but prior to the issuance of the financial statements. The statement requires disclosure of the date through which subsequent events were evaluated and the basis for that date. SFAS No. 165 sets forth the following: (1) the period after the balance sheet date during which management of a reporting entity should evaluate events or transactions that may occur for potential recognition or disclosure in the financial statements; (2) the circumstances under which an entity should recognize events or transactions occurring after the balance sheet date in its financial statements; and (3) the disclosures that an entity should make about events or transactions that occurred after the balance sheet date. SFAS No. 165 is effective for financial statements issued for fiscal years ending after June 15, 2009 and interim periods within those fiscal years. Accordingly, we have adopted this pronouncement, which did not have a material impact on our results of operations or financial condition. Disclosures required by SFAS No. 165 have been made in Note 12 of Notes to Consolidated and Combined Financial Statements.
In September 2006, the FASB issued SFAS No. 157, which establishes a single authoritative definition of fair value, establishes a framework for measuring fair value, and expands disclosure requirements pertaining to fair value measurements. SFAS No. 157 is effective for financial statements issued for fiscal years beginning after November 15, 2007 and interim periods within those fiscal years, and is therefore effective for us beginning in fiscal year 2009. Accordingly, we adopted this pronouncement effective September 1, 2008. The adoption did not impact our results of operations or financial condition. Disclosures required by SFAS No. 157 are included within Note 2 of Notes to Consolidated and Combined Financial Statements. We have not applied the provisions of SFAS No. 157 to non-financial assets, such as our property and equipment, goodwill and certain other assets, which are measured at fair value for impairment assessment. We will apply the provisions of SFAS No. 157 to these assets and liabilities beginning September 1, 2010, in accordance with FASB Staff Position No. 157-2, “Effective Date of FASB Statement No. 157,” which is not expected to have a material impact on our results of operations or financial condition.
In June 2006, the FASB issued Interpretation No. 48, Accounting for Uncertainty in Income Taxes—an interpretation of FASB Statement No. 109 (“FIN 48”). FIN 48 clarifies the accounting for uncertainty in income taxes by prescribing a recognition threshold and measurement attribute for the financial statement implications of tax positions taken or expected to be taken in a company’s tax return. The interpretation also provides guidance on derecognition, classification, interest and penalties, accounting in interim periods, and disclosure of such positions. We adopted FIN 48 effective September 1, 2007, and detail regarding the impact of this pronouncement’s adoption is located at Note 9 of Notes to Consolidated and Combined Financial Statements.
Accounting Standards Yet to be Adopted
In June 2009, the FASB issued SFAS No. 168, The FASB Accounting Standards Codification (Codification) and the Hierarchy of GAAP (“SFAS No. 168”). SFAS No. 168 replaces SFAS No. 162, The Hierarchy of GAAP and establishes the Codification as the single source of authoritative U.S. GAAP recognized by the FASB to be applied by nongovernmental entities. SEC rules and interpretive releases are also sources of authoritative GAAP for SEC registrants. SFAS No. 168 modifies the GAAP hierarchy to include only two levels of GAAP: authoritative and nonauthoritative. SFAS No. 168 is effective for financial statements
58
Table of Contents
Zep Inc.
NOTES TO CONSOLIDATED AND COMBINED FINANCIAL STATEMENTS—(Continued)
(Dollar amounts in thousands, except share and per-share data and as indicated)
issued for fiscal years ending after September 15, 2009 and interim periods within those fiscal years, and will therefore become effective for us beginning in fiscal year 2010. Due to the nature of this pronouncement, we do not anticipate that the adoption of SFAS No. 168 will have a material impact on our results of operations or financial condition.
In March 2008, the FASB issued Statement SFAS No. 161, Disclosures about Derivative Instruments and Hedging Activities, an amendment of FASB Statement No. 133 (“SFAS No. 161”), which requires additional disclosures about the objectives of the derivative instruments and hedging activities, the method of accounting for such instruments under SFAS No. 133, Accounting for Derivative Instruments and Hedging Activities, as amended by SFAS No. 137, SFAS No. 138, and SFAS No. 149 (“SFAS No. 133”) and its related interpretations, and a tabular disclosure of the effects of such instruments and related hedged items on our financial position, financial performance, and cash flows. SFAS No. 161 is effective for financial statements issued for fiscal years beginning after November 15, 2008 and interim periods within those fiscal years, and is therefore effective for us beginning in fiscal year 2010. We are currently assessing the potential impact that the adoption of SFAS No. 161 may have on our consolidated financial statements.
In December 2007, the FASB issued SFAS No. 141 (revised 2007), Business Combinations (“SFAS No. 141(R)”). SFAS No. 141(R) replaces SFAS No. 141 and requires that all assets, liabilities, contingent consideration, contingencies and in-process research and development costs of an acquired business be recorded at fair value at the acquisition date; that acquisition costs generally be expensed as incurred; that restructuring costs generally be expensed in periods subsequent to the acquisition date; and that changes in accounting for deferred tax asset valuation allowances and acquired income tax uncertainties after the measurement period impact income tax expense. SFAS No. 141(R) is effective for business combinations transacted subsequent to a company’s first annual reporting period beginning after December 15, 2008, and is therefore effective for us beginning in fiscal year 2010. The impact that SFAS No. 141(R) might have on our results of operations and financial position will depend upon the nature, terms and size of any acquisitions that we may consummate after the effective date.
Note 3: Employee Benefit Plans
Zep maintains a qualified defined contribution plan to which both employees and the Company make contributions. The cost to Zep for this plan during the years ended August 31, 2009, 2008, and 2007 was $1.2 million, $2.7 million, and $2.8 million, respectively. Employer matching amounts are allocated in accordance with plan participants’ elective deferral investments. We instituted a temporary suspension of our match of employee contributions into our defined contribution plans during the second quarter of fiscal year 2009. We restored one-half of the employer match component of our defined contribution plans during the fourth quarter of fiscal year 2009; full reinstatement of the employer matching contribution benefit will occur beginning in January 2010. Plan participants may invest a percentage of their contributions into a Zep common stock fund. At August 31, 2009, assets of the Company’s defined contribution plan included shares of Zep common stock with a market value of approximately $2.9 million, which represented approximately 2.3% of the total fair market value of the assets in Zep’s defined contribution plan on that date.
Zep also maintains a non-qualified deferred compensation plan for the benefit of our eligible employees. The deferred compensation plan administered by the Company provides for elective deferrals of an eligible employee’s compensation, which are matched with contributions from the Company as stipulated by the plan. In addition, the plan provides for an automatic supplemental contribution by the Company ranging from 3% to 5% of an eligible employee’s compensation, unless
59
Table of Contents
Zep Inc.
NOTES TO CONSOLIDATED AND COMBINED FINANCIAL STATEMENTS—(Continued)
(Dollar amounts in thousands, except share and per-share data and as indicated)
otherwise determined by the Board of Directors. The employer matching and supplemental contribution components of this plan were also suspended during the second quarter of fiscal year 2009, and these components were reinstated during October 2009. See Note 6 of Notes to Consolidated and Combined Financial Statements for more information regarding this plan.
Note 4: Debt Obligations
Borrowings Preceding the Spin-Off
The debt levels and associated interest costs reflected within the historical combined financial statements prior to the Distribution Date reflect assumptions regarding prospective debt issuances based upon our anticipated financial condition on or about the time of the spin-off. Debt in the amount of $75.0 million was assumed to have been outstanding during all periods preceding the Distribution Date. Accordingly, Zep has reflected the interest expense associated with these borrowings within its historical results of operations as though $75.0 million in total borrowings had been outstanding during all periods preceding the Distribution Date.
Borrowings Following the Spin-Off
On October 19, 2007, we executed a receivables facility and a Revolving Credit Facility in anticipation of the spin-off, and the significant terms of each of those facilities are discussed below. We drew $62.5 million from that Revolving Credit Facility on October 31, 2007, and these proceeds were immediately distributed to Acuity Brands. Additionally, we assumed a $7.2 million industrial revenue bond due in 2018 and approximately $0.3 million of other debt following the spin-off. On October 14, 2009, we entered into a three-year Loan and Security Agreement that allows for borrowings up to $40 million secured by our trade accounts receivable.
Borrowings made under our debt obligations must be settled upon the maturity of those obligations rather than be repaid in accordance with a principal repayment schedule. Future maturities of our outstanding debt obligations are as follows for fiscal years ending August 31:
| Amount | |||
| 2010 |
$ | 33,500 | |
| 2011 |
— | ||
| 2012 |
— | ||
| 2013 |
— | ||
| 2014 |
— | ||
| Thereafter |
7,150 | ||
| $ | 40,650 | ||
Further detail regarding each of the above mentioned debt instruments, including amounts outstanding under each as of August 31, 2009, is provided below.
Revolving Credit Facility
On October 19, 2007, we entered into a new $100 million five-year unsecured Revolving Credit Facility with a syndicate of commercial banks consisting of Bank of America, JPMorgan Chase Bank (“Administrative Agent”), KeyBank, Regions Bank, Wachovia Bank, and Wells Fargo Bank. As of August 31, 2009, borrowings under the Revolving Credit Facility totaled $33.5 million. Of that total
60
Table of Contents
Zep Inc.
NOTES TO CONSOLIDATED AND COMBINED FINANCIAL STATEMENTS—(Continued)
(Dollar amounts in thousands, except share and per-share data and as indicated)
outstanding amount, $12.0 million has been classified as Current maturities of long-term debt on our Consolidated Balance Sheets reflecting our current intention to settle that amount during the twelve months following August 31, 2009. The Company has the ability to refinance all amounts borrowed under its Revolving Credit Facility until 2012. Therefore, amounts classified as Current maturities of long-term debt may fluctuate not only as a result of repayment of those amounts, but also concurrent with changes in the Company’s projected cash flow for the 12-month period subsequent to the balance sheet date. The remaining $21.5 million has been reported on our Consolidated Balance Sheets within Long-term debt, less current maturities. The base interest rate associated with borrowings made under the Revolving Credit Facility approximated 1.2% during the twelve months ended August 31, 2009. As of August 31, 2009, we had additional borrowing capacity under the Revolving Credit Facility of $63.6 million, which represents the full amount of the Revolving Credit Facility less the aforementioned borrowings as well as the outstanding letters of credit of $2.9 million that were issued under the Revolving Credit Facility and are discussed below.
The Revolving Credit Facility contains customary covenants regarding the preservation and maintenance of our corporate existence, material compliance with laws, payment of taxes, and maintenance of insurance and of our properties. Further, the Revolving Credit Facility contains financial covenants including a leverage ratio (“Maximum Leverage Ratio”) of total indebtedness to EBITDA, as such terms are defined in the Revolving Credit Facility agreement, and a minimum interest coverage ratio also defined in that agreement (“Minimum Interest Coverage Ratio”). These ratios are computed at the end of each fiscal quarter for the most recent 12-month period. The Revolving Credit Facility allows for a Maximum Leverage Ratio of 3.25x and a Minimum Interest Coverage Ratio of 2.50x. The Revolving Credit Facility includes customary events of default, including, but not limited to, the failure to pay any interest, principal or fees when due, the failure to perform any covenant or agreement, inaccurate or false representations or warranties, a material adverse change, insolvency or bankruptcy, change of control, the occurrence of certain ERISA events and judgment defaults. We were in compliance with all debt-related covenants at August 31, 2009.
We are required to pay certain fees in connection with the Revolving Credit Facility. For example, we must pay an annual facility fee. This fee is payable quarterly in arrears and is determined by our leverage ratio as defined in the Revolving Credit Facility. This facility fee ranges from 0.125% to 0.250% of the aggregate $100 million commitment of the lenders under the Revolving Credit Facility. Additionally, we are also required to pay certain fees to the Administrative Agent for administrative services. Facility and commitment fees paid by Zep during fiscal 2009 totaled $0.2 million.
Generally, amounts outstanding under the Revolving Credit Facility bear interest at a “base rate” or a “Eurocurrency Rate”. Base rate advances are denominated in U.S. Dollars, and amounts outstanding bear interest at a fluctuating rate equal to JPMorgan’s base rate. Eurocurrency rate advances can be denominated in a variety of currencies, including U.S. Dollars, and amounts outstanding bear interest at a periodic fixed rate equal to LIBOR for the applicable currency plus an applicable margin. The applicable margins are based on our leverage ratio, as defined in the Revolving Credit Facility, with such margins ranging from 0.50% to 1.00%. Zep’s applicable margin ranged between 0.60% and 1.00% during fiscal year 2009. Interest on both base rate and Eurocurrency rate advances are payable upon the earlier of maturity of the outstanding loan or quarterly if the loan is for a period greater than three months. The Revolving Credit Facility will mature and all amounts outstanding thereunder will be due and payable on October 19, 2012.
61
Table of Contents
Zep Inc.
NOTES TO CONSOLIDATED AND COMBINED FINANCIAL STATEMENTS—(Continued)
(Dollar amounts in thousands, except share and per-share data and as indicated)
Receivables Facility
On October 14, 2009, we entered into a three-year Loan and Security Agreement (the “Receivables Facility”) with Regions Bank that allows for borrowings up to $40 million secured by our trade accounts receivable. As of October 29, 2009, net trade accounts receivable pledged as security for borrowings under the Receivables Facility totaled $37.6 million. Interest under the Receivables Facility is payable monthly at the LIBOR Index Rate plus an applicable margin ranging from 2.00% to 2.25%. Commitment fees on the Receivables Facility will total 0.35% per annum on unused balances. The Receivables Facility includes customary covenants that restrict our ability to, among other things, sell, assign or create liens or other encumbrances upon or with respect to assets secured by the agreement; enter into consolidations, mergers and transfers of assets; or make certain investments. The Receivables Facility also contains customary events of default for credit facilities of this type (with customary grace periods, as applicable), including, among other things, nonpayment of principal or interest when due. In addition, under the Receivables Facility, an event of default will be deemed to include: (1) a default ratio that exceeds 7.00% on a rolling three month basis, (2) a dilution ratio that exceeds 4.00% on a rolling three month basis, and (3) a delinquency ratio that exceeds 8.50% at the end of four consecutive months. As of the date of this filing we had yet to borrow under the Receivables Facility, which also contains a cross-default provision whereby we would be in default should an occurrence of a default or an event of a default result under any other financing arrangement where we are a debtor or an obligor to debt. In connection with the execution of the Loan and Security Agreement, we paid a $100,000 one-time closing fee to Regions Bank on October 14, 2009. O.B. Grayson Hall, Jr., a member of our Board of Directors, is Vice Chairman and head of the General Banking Group of Regions and Regions Financial Corporation. This Receivables Facility replaces a similar, one-year securitization instrument that we did not utilize during its term and that expired in the normal course in October 2008.
Industrial Revenue Bonds
The industrial revenue bonds due 2018 were issued by the City of DeSoto Industrial Development Authority, Inc. in May 1991 in connection with the construction of Zep’s facility in DeSoto, Texas. In 2001, in connection with the spin-off of Acuity Brands from National Services Industries, Inc. (“NSI”), the loan agreement was assigned to Acuity Brands and Acuity Specialty Products Group Inc., which assumed all of the obligations of NSI with respect to the industrial revenue bonds. In connection with our spin-off from Acuity Brands, Acuity Brands was released from its obligations with respect to the industrial revenue bonds, and we remained as an obligor under the loan agreement. Pursuant to the loan agreement, we are required to make principal and interest payments on the bonds. We will fulfill these requirements by making interest payments on a quarterly basis, and by settling the associated principal obligation in 2018 upon maturity. The payment of principal and interest on the bonds is secured by an irrevocable letter of credit issued by Wachovia Bank, National Association. The bonds currently bear interest at a weekly rate. The interest rate during the twelve months ended August 31, 2009 and August 31, 2008 averaged 1.3% and 2.6%, respectively. Pursuant to certain cross-default provisions relating to our industrial revenue bonds, a breach of financial covenants set forth in our Revolving Credit Facility Agreement constituting an event of default under the Revolving Credit Facility Agreement would also constitute an event of default under our industrial revenue bonds.
Letters of Credit
We have issued outstanding letters of credit totaling $10.4 million primarily for the purpose of securing collateral requirements under our casualty insurance programs and for providing credit support for our
62
Table of Contents
Zep Inc.
NOTES TO CONSOLIDATED AND COMBINED FINANCIAL STATEMENTS—(Continued)
(Dollar amounts in thousands, except share and per-share data and as indicated)
industrial revenue bonds. At August 31, 2009, a total of $2.9 million of the letters of credit were issued under the Revolving Credit Facility, thereby reducing the total availability under the facility by such amount.
Note 5: Common Stock and Related Matters
Acuity Brands’ Equity Investment
Upon completion of the Distribution on October 31, 2007, Zep became an independent company owned by the Acuity Brands’ shareholders of record as of October 17, 2007. Prior to October 31, 2007, Zep and the subsidiaries comprising the specialty products chemical business were wholly-owned by Acuity Brands. Therefore, prior to October 31, 2007, stockholders’ equity was comprised of Acuity Brands’ investment in these subsidiaries. Beginning on the Distribution Date, stockholders’ equity reflects the outstanding stock, paid-in capital, and other stockholders’ equity items of Zep and its wholly owned subsidiaries.
Common and Preferred Stock
Zep has 500 million shares of common stock, par value $0.01 per share, and 50 million shares of preferred stock (“Preferred Stock”), authorized as of August 31, 2009. No shares of preferred stock were issued as of that date.
Stockholder Protection Rights Agreement
Zep’s Board of Directors adopted a Stockholder Protection Rights Agreement (the “Rights Agreement”) effective October 30, 2007. The Rights Agreement contains provisions that are intended to protect our stockholders in the event of an unsolicited offer to acquire the Company, including offers that do not treat all stockholders equally and other coercive, unfair, or inadequate takeover bids and practices that could impair the ability of the Company’s Board of Directors to fully represent stockholders’ interests. Pursuant to the Rights Agreement, our Board of Directors declared a dividend of one “Right” for each outstanding share of the Company’s common stock as of October 30, 2007. The Rights will be represented by, and trade together with, the Company’s common stock until and unless certain events occur, including the acquisition of in excess of 15% of the Company’s common stock by a person or group of affiliated or associated persons (with certain exceptions, “Acquiring Persons”); provided, however, that the Company’s Board of Directors, at its sole discretion, may grant its prior consent to a person or group of affiliated or associated persons to acquire more than 15% of the Company’s outstanding common stock, subject to any conditions the Board may impose, without such acquisition triggering the Rights Agreement. Unless previously redeemed by the Company’s Board of Directors, upon the occurrence of one of the specified triggering events, each Right that is not held by an Acquiring Person will entitle its holder to purchase one share of common stock or, under certain circumstances, additional shares of common stock at a discounted price. The Rights will cause substantial dilution to a person or group that attempts to acquire the Company on terms not approved by the Company’s Board of Directors. Thus, the Rights are intended to encourage persons who may seek to acquire control of the Company to initiate such an acquisition through negotiation with the Board of Directors.
63
Table of Contents
Zep Inc.
NOTES TO CONSOLIDATED AND COMBINED FINANCIAL STATEMENTS—(Continued)
(Dollar amounts in thousands, except share and per-share data and as indicated)
Earnings per Share
Basic earnings per share is computed by dividing net income available to common stockholders by the weighted average number of common shares outstanding during the period. Unvested shares of restricted stock are excluded from basic shares outstanding. Diluted earnings per share is computed similarly but reflects the potential dilution that would occur if dilutive options were exercised and restricted stock awards were vested.
On October 31, 2007, the separation from Acuity Brands was completed in a tax-free distribution to its stockholders of one share of our common stock for every two shares of Acuity Brands’ common stock held as of the record date. Prior to this date, all outstanding shares of Zep were owned by Acuity Brands. Accordingly, for periods prior to October 31, 2007, basic and diluted earnings per share have been computed using the number of shares of Zep common stock outstanding on October 31, 2007, the date on which the Zep common stock was distributed by Acuity Brands to its stockholders.
The following table reflects basic and diluted earnings per common share for the three years ended August 31, 2009:
| Years Ended August 31, | |||||||||
| 2009 | 2008 | 2007 | |||||||
| Basic earnings per share: |
|||||||||
| Net income |
$ | 9,260 | $ | 16,322 | $ | 14,083 | |||
| Basic weighted average shares outstanding |
21,057 | 20,862 | 20,811 | ||||||
| Basic earnings per share |
$ | 0.44 | $ | 0.78 | $ | 0.68 | |||
| Diluted earnings per share: |
|||||||||
| Net income |
$ | 9,260 | $ | 16,322 | $ | 14,083 | |||
| Basic weighted average shares outstanding |
21,057 | 20,862 | 20,811 | ||||||
| Common stock equivalents (stock options and restricted stock) |
233 | 390 | — | ||||||
| Diluted weighted average shares outstanding |
21,290 | 21,252 | 20,811 | ||||||
| Diluted earnings per share |
$ | 0.43 | $ | 0.77 | $ | 0.68 | |||
For the years ended August 31, 2009 and August 31, 2008, we excluded from our earnings per share calculation 0.4 million and less than 0.1 million common stock equivalents, respectively because their effect was anti-dilutive.
Note 6: Share-Based Payments
Pre-spin equity award issuances
Prior to the October 31, 2007 spin-off, Zep participated in Acuity Brands’ long-term incentive programs that provided qualified and non-qualified stock options to officers and employees of Acuity Brands at exercise prices not less than the fair market value on the date of grant. Effective November 30, 2001, Acuity Brands adopted the Acuity Brands, Inc. Long-Term Incentive Plan (the “Plan”) for the benefit of officers and other key management personnel (“Participants”). An aggregate of 8.1 million shares was originally authorized for issuance under that plan. In October 2003, the Board of Directors approved the Acuity Brands, Inc. Amended and Restated Long-Term Incentive Plan (the “Amended Plan”), including an increase of 5.0 million in the number of shares available for grant. However, the Board of Directors
64
Table of Contents
Zep Inc.
NOTES TO CONSOLIDATED AND COMBINED FINANCIAL STATEMENTS—(Continued)
(Dollar amounts in thousands, except share and per-share data and as indicated)
subsequently committed that not more than 3.0 million of the 5.0 million share increase would be available for grant without further shareholder approval. In December 2003, the stockholders approved the Amended Plan. The Amended Plan provides for issuance of share-based awards, including stock options, stock appreciation rights, and performance-based and time-based restricted stock and restricted stock unit awards. The majority of the share-based compensation expense generated through the administration of these award programs does not affect Zep’s overall cash position. Therefore, certain of these expenses have been reflected as other non-cash charges within our Consolidated and Combined Statements of Cash Flows. Generally, stock options awarded pursuant to those programs vest proportionately over a three-year period and are exercisable for ten years from the grant date. Certain of the long-term incentive programs also provide for awards of restricted shares of Acuity Brands’ common stock, which generally vest proportionally over a four-year period. Zep incurred $3.2 million of compensation expense related to Acuity Brands’ share-based long-term incentive programs in fiscal year 2007. Zep incurred $0.6 million of compensation expense related to Acuity Brands’ share-based long-term incentive programs during the first two months of fiscal year 2008 and before the occurrence of the spin-off related equity conversion.
Adoption of Zep Inc. Long-Term Incentive Plan and Conversion of Equity Awards Pursuant to Spin-off
In connection with the spin-off, we established the Zep Inc. Long-Term Incentive Plan (“Zep LTIP”) on October 31, 2007. The purposes of the Zep LTIP are to provide additional incentives to our officers, key executives and directors whose substantial contributions are essential to our continued success. To accomplish these purposes, the Zep LTIP provides that the Company may grant incentive stock options, nonqualified stock options, stock appreciation rights, restricted stock, restricted stock units, performance units and performance shares to key personnel and directors. A total of 4.3 million shares of Zep’s common stock have been reserved for issuance under the Zep LTIP. Generally, stock options awarded pursuant to the Zep LTIP will be issued with exercise prices equal to the fair market value of our common stock on the date of the grant, will vest proportionately over a four-year period, and will be exercisable for ten years from the grant date. Compensation expense related to these option grants will be recognized over the requisite service period. Restricted shares of Zep’s common stock awarded under the Zep LTIP will generally vest proportionally over a four-year period. The fair value of restricted stock awards will be measured based on their date of grant fair market value, and the related compensation expense will be recognized over a requisite service period equal to the award’s vesting period.
At the time of the spin-off, each of Acuity Brands and Zep’s current and former employees holding unvested shares of restricted stock of Acuity Brands received a dividend of one share of Zep restricted stock for each two shares of Acuity Brands unvested restricted stock held. The shares of Zep stock so received as a dividend are subject to the same restrictions and terms as the Acuity Brands restricted stock. The shares of Zep common stock will be fully paid and non-assessable and the holders thereof will not be entitled to preemptive rights. Restricted shares outstanding under the Zep LTIP totaled 0.4 million shares as a result of the October 31, 2007 dividend distribution.
At the time of the spin-off, Acuity Brands stock options held by Zep’s current employees (but not former employees) were generally converted to, and replaced by, Zep stock options in accordance with a conversion ratio such that the intrinsic value of the underlying awards remained unaffected by the spin-off. Also, Acuity Brands stock options held by current and former Acuity Brands employees and former Zep employees were adjusted with regard to the exercise price of and number of Acuity Brands shares
65
Table of Contents
Zep Inc.
NOTES TO CONSOLIDATED AND COMBINED FINANCIAL STATEMENTS—(Continued)
(Dollar amounts in thousands, except share and per-share data and as indicated)
underlying the Acuity Brands stock options to maintain the intrinsic value of the options, pursuant to the applicable Acuity Brands long-term incentive plan. Options subjected to this conversion totaled 0.3 million. The exercise prices associated with converted options ranged from $4.62 to $10.71.
Effective immediately after the spin-off approximately 25,000 shares represented by restricted stock units were converted in the same manner as the above mentioned stock option awards.
Shares available for grant under the Zep LTIP plan totaled approximately 1,915,000 at August 31, 2009. Forfeited shares and shares that are exchanged to offset taxes are returned to the pool of shares available for grant.
Restricted Stock Awards
Under the Zep LTIP on September 29, 2008 our Board of Directors approved an award of restricted stock and stock options to Zep’s officers and other key employees with an aggregate value of $3.9 million. These awards represent an annual award that is typically granted in the fall of each calendar year in recognition of prior fiscal year performance. Additionally, on September 29, 2008 we issued each of our non-employee directors approximately 3,420 restricted stock awards. The restricted stock awards issued vest over a four year period.
Under the Zep LTIP and in connection with the spin-off, on November 5, 2007 our Board of Directors approved a restricted stock award and stock option grant to Zep’s officers and other key employees with an aggregate value of $8.4 million. Our Board of Directors determined that the majority of these awards would be issued on November 14, 2007 and would be composed of 1) an annual award that is typically granted in the fall of each calendar year in recognition of prior fiscal year performance, and 2) a one-time founders’ award intended to motivate recipients to contribute to the future growth and profitability of Zep. Additionally, on November 14, 2007 we issued each of our non-employee directors approximately 12,000 restricted stock awards. The majority of restricted stock awards issued to employees vest over a four year period, and those issued to members of our non-employee directors vest over a three year period commensurate with their term of service.
Under the Amended Plan, Acuity Brands awarded restricted stock to officers and other key employees of Zep in September 2006, December 2005, January 2005, and December 2003. Shares issued under the Amended Plan vest over a four-year period from the respective grant dates. In December 2002, the Company reserved shares of performance-based restricted stock for issuance to officers and other key employees of Zep under the Plan. Those shares vest at the later of (a) determination by the compensation committee of the Board of Directors that at least two of the three performance measures have been achieved or (b) November 30 of the specified target year following achievement of related performance targets. In connection with an October 2000 NSI award and the distribution of Acuity Brands from its former parent, NSI, in November 2001, Acuity Brands distributed restricted shares, matching NSI shares that were vesting, and reserved performance based restricted shares, representing conversion of the remaining October 2000 award which had not reached a vesting start date. These shares vest ratably in four equal annual installments beginning one year from the vesting start date based on achievement of progressive increases in the value of Acuity Brands stock, and certain Zep officers and key employees were included in this award. Additionally, Acuity Brands awarded restricted stock to certain employees of Zep on an individual basis during each of the previous three fiscal years. The fair value of restricted stock at the date of grant is equal to the closing stock price on that date.
66
Table of Contents
Zep Inc.
NOTES TO CONSOLIDATED AND COMBINED FINANCIAL STATEMENTS—(Continued)
(Dollar amounts in thousands, except share and per-share data and as indicated)
Restricted stock transactions during the years ended August 31, 2007, 2008 and 2009 can be summarized as follows:
| Number of Shares (in thousands) |
Weighted Average Grant Date Fair Value | |||||
| Outstanding at August 31, 2006 |
155 | $ | 28.00 | |||
| Granted |
44 | $ | 45.96 | |||
| Vested |
(40 | ) | $ | 24.72 | ||
| Forfeited |
(38 | ) | $ | 32.53 | ||
| Outstanding at August 31, 2007 |
121 | $ | 34.13 | |||
| Granted |
465 | $ | 12.71 | |||
| Vested |
(61 | ) | $ | 9.92 | ||
| Forfeited |
(15 | ) | $ | 13.32 | ||
| Outstanding at August 31, 2008 |
510 | $ | 12.85 | |||
| Granted |
112 | $ | 17.25 | |||
| Vested |
(146 | ) | $ | 12.84 | ||
| Forfeited |
(125 | ) | $ | 13.07 | ||
| Outstanding at August 31, 2009 |
351 | $ | 14.21 | |||
As of August 31, 2009, there was $3.9 million of total unrecognized compensation cost related to unvested restricted stock of Zep employees. That cost is expected to be recognized over a weighted-average period of two years. The total fair value of shares vested during the years ended August 31, 2009, 2008, and 2007, was approximately $2.4 million, $2.4 million, and $2.6 million, respectively.
Stock Options
Options issued under the Zep LTIP are granted with an exercise price equal to the fair market value of the Company’s stock on the date of grant and expire 10 years from the date of grant. These options generally vest and become exercisable over a four-year period. On September 29, 2008, we issued approximately 410,000 stock options to certain of our officers and key employees. On November 14, 2007, we issued approximately 1,052,000 stock options in connection with the aforementioned annual and founders’ awards. Approximately 6,000 additional options were granted during fiscal year 2008 in connection with the hiring of certain key officers.
The fair value of each option was estimated on the date of grant using the Black-Scholes model. The dividend yield was calculated based on annual dividends paid and the trailing 12 month average closing stock price at the time of grant. For awards issued prior to the spin-off, expected volatility was based on historical volatility of the Acuity Brands’ stock over the preceding number of years equal to the expected life of the options. Expected volatility for awards issued under the Zep LTIP was based on the volatilities of well-established guideline companies in accordance with SFAS 123(R). The use of guideline companies as a determinant of volatility will most likely be phased out beginning in fiscal year 2010 as the Company’s own trading history becomes an appropriate measure for expected volatility. The risk-free interest rate was based on the United States Treasury yield for a term equal to the expected life of
67
Table of Contents
Zep Inc.
NOTES TO CONSOLIDATED AND COMBINED FINANCIAL STATEMENTS—(Continued)
(Dollar amounts in thousands, except share and per-share data and as indicated)
the options at the time of grant. The Company has used historical exercise behavior data of similar employee groups to determine the expected life of options. All inputs into the Black-Scholes model are estimates made at the time of grant. Actual realized value of each option grant could materially differ from these estimates, though without impact to future reported net income.
The following weighted average assumptions were used to estimate the fair value of stock options awarded by the Company in fiscal years ended August 31:
| 2009 | 2008 | 2007 | ||||||||||
| Dividend yield |
1.0 | % | 1.2 | % | 1.6 | % | ||||||
| Expected volatility |
33.2 | % | 31.0 | % | 35.0 | % | ||||||
| Risk-free interest rate |
3.1 | % | 3.8 | % | 4.6 | % | ||||||
| Expected life of options |
5 years | 5 years | 5 years | |||||||||
| Weighted-average fair value of options granted |
$ | 5.43 | $ | 3.77 | $ | 15.01 | ||||||
Stock option transactions during the years ended August 31, 2007, 2008, and 2009 can be summarized as follows:
| Outstanding (share data in thousands) |
Exercisable (share data in thousands) | ||||||||||
| Number of Shares |
Weighted Average Exercise Price |
Number of Shares |
Weighted Average Exercise Price | ||||||||
| Outstanding at August 31, 2006 |
159 | $ | 24.57 | 131 | $ | 24.74 | |||||
| Granted |
— | $ | — | ||||||||
| Exercised |
(90 | ) | $ | 25.51 | |||||||
| Cancelled |
— | $ | — | ||||||||
| Outstanding at August 31, 2007 |
69 | $ | 23.36 | 69 | $ | 23.36 | |||||
| Acuity Brands, Inc. options converted at the spin-off |
314 | $ | 9.11 | ||||||||
| Granted |
1,058 | $ | 12.54 | ||||||||
| Exercised |
(23 | ) | $ | 9.33 | |||||||
| Cancelled |
(7 | ) | $ | 12.52 | |||||||
| Outstanding at August 31, 2008 |
1,411 | $ | 11.66 | 234 | $ | 8.71 | |||||
| Granted |
410 | $ | 17.52 | ||||||||
| Exercised |
(44 | ) | $ | 10.07 | |||||||
| Cancelled |
(268 | ) | $ | 13.41 | |||||||
| Outstanding at August 31, 2009 |
1,509 | $ | 12.99 | 539 | $ | 10.44 | |||||
| Range of option exercise prices through August 31, 2009: |
|||||||||||
| $ 5.00 – $10.00 (average life – 5.2 years) |
320 | $ | 9.08 | 320 | $ | 9.08 | |||||
| $10.00 – $15.00 (average life – 8.1 years) |
822 | $ | 12.48 | 217 | $ | 12.39 | |||||
| $15.00 – $20.00 (average life – 9.1 years) |
367 | $ | 17.50 | 2 | $ | 16.18 | |||||
The total intrinsic value of options exercised during the years ended August 31, 2009, 2008, and 2007 was $0.2 million, $0.2 million, and $2.3 million, respectively. The total intrinsic value of options
68
Table of Contents
Zep Inc.
NOTES TO CONSOLIDATED AND COMBINED FINANCIAL STATEMENTS—(Continued)
(Dollar amounts in thousands, except share and per-share data and as indicated)
outstanding, expected to vest, and exercisable as of August 31, 2009 was $5.2 million, $5.0 million, and $3.0 million, respectively. As of August 31, 2009, there was $3.1 million of total unrecognized compensation cost related to unvested options, which is expected to be recognized over a weighted-average period of approximately two-and-one-half years. The weighted-average remaining contractual terms of options outstanding and currently exercisable as of August 31, 2009 were approximately eight years and six years, respectively.
Share Units
In fiscal year 2008, the Company adopted the Zep Inc. Nonemployee Director Deferred Compensation Plan. The Company requires its Directors to defer at least 50% of their annual retainer into this program, and our Directors may defer additional amounts at their election. Under this plan, share deferrals are valued at fair market value at the date of deferral. Of the 300,000 shares reserved for issuance under this plan, approximately 2,460 have been issued. As of August 31, 2009, approximately 23,800 share units were accounted for in this plan.
The Company also maintains a non-qualified deferred compensation program that was adopted in fiscal year 2008—the Zep Inc. Supplemental Deferred Savings Plan. This program provides for elective deferrals of an eligible employee’s compensation. These deferrals are matched with contributions from the Company as stipulated by the plan. In addition, the plan provides for an automatic supplemental contribution by the Company ranging from 3% to 5% of an eligible employee’s compensation, unless otherwise determined by the Board of Directors. The employer matching and supplemental contribution components of this plan were suspended during the second quarter of fiscal year 2009, and these components were reinstated during October 2009. Share unit deferrals resulting from the match and supplemental contributions provided by the Company are valued at their fair market value at the date of deferral and are ultimately distributed to plan participants in stock. Of the 400,000 shares of the Company’s common stock reserved under the plan, approximately 3,200 have been issued. As of August 31, 2009 approximately 26,425 fully vested share units were accounted for in this plan.
Employee Stock Purchase Plan
In fiscal year 2008, the Company adopted the Zep Inc. Employee Stock Purchase Plan for the benefit of eligible employees. Under the plan, employees are able to purchase the Company’s common stock at a 5% discount on a monthly basis. Discounts received under this plan are not considered compensatory under SFAS No. 123(R). There were 200,000 shares of the Company’s common stock reserved for purchase under the plan, of which approximately 162,900 shares remain available as of August 31, 2009. Eligible employees may participate at their discretion.
Note 7: Commitments and Contingencies
Self-Insurance
It is the policy of Zep to self-insure, up to certain limits, risks including workers’ compensation, comprehensive general liability, and auto liability. As of August 31, 2008, Zep’s self-insured retention for each claim involving workers’ compensation, comprehensive general liability (including toxic tort and other product liability claims), and auto liability was limited to $0.5 million per occurrence of such claims. However, due to our historical claims experience our comprehensive general liability self-insurance retention limits have been increased to $1.5 million for claims per occurrence incurred after
69
Table of Contents
Zep Inc.
NOTES TO CONSOLIDATED AND COMBINED FINANCIAL STATEMENTS—(Continued)
(Dollar amounts in thousands, except share and per-share data and as indicated)
August 31, 2008. Based on Zep’s estimate of the aggregate liability for claims incurred, a provision for claims under this self-insured program is revised and recorded annually. This estimate is derived from both internal and external sources including but not limited to Zep’s independent actuary. Zep is also self-insured up to certain limits for certain other insurable risks, primarily physical loss to property ($0.5 million per occurrence) and business interruptions resulting from such loss and lasting three days or more in duration. Based on our historical claims experience, the retention limits stipulated by policies addressing physical loss to properties located in North America have been increased to $1.0 million per occurrence for claims incurred after August 31, 2008. Insurance coverage is maintained for catastrophic property and casualty exposures as well as those risks required to be insured by law or contract. Zep is fully self-insured for certain other types of liabilities, including environmental, product recall, patent infringement and errors and omissions.
Zep is also self-insured for the majority of its medical benefits plans. The Company estimates its aggregate liability for claims incurred by applying a lag factor to the Company’s historical claims and administrative cost experience. The appropriateness of the Company’s lag factor is evaluated and revised annually, as necessary.
Leases
Zep leases certain of its buildings and equipment under non-cancelable operating lease agreements. Certain of these operating lease agreements contain rent escalation clauses. We expense rent on a straight-line basis over the life of our leases, which commences on the date we have the right to control leased property. Minimum lease payments under noncancelable leases for years subsequent to August 31, 2009, are as follows: 2010—$7.9 million; 2011—$6.5 million; 2012—$5.2 million; 2013—$4.0 million; 2014—$3.3 million; after 2014—$5.6 million.
Rent expense totaled $8.1 million in 2009, $12.2 million in 2008, and $9.2 million in 2007. Rental expense in fiscal year 2008 of $12.2 million includes the $3.3 million restructuring charge for facility lease contract termination cost discussed further in Note 8 of Notes to Consolidated and Combined Financial Statements.
Collective Bargaining Agreements
Approximately 11% of Zep’s total work force is covered by collective bargaining agreements. Collective bargaining agreements representing a de minimis amount (less than 1%) of the Company’s work force will expire within one year.
Litigation
Zep is subject to various legal claims arising in the normal course of business. Zep, as part of programs entered into by Acuity Brands, is self-insured up to specified limits for certain types of claims, including product liability, and is fully self-insured for certain other types of claims, including environmental, product recall, and patent infringement as part of the distribution agreement with Acuity Brands. Based on information currently available, it is the opinion of management that the ultimate resolution of pending and threatened legal proceedings will not have a material adverse effect on the results of operations, financial position, or cash flows of Zep. However, in the event of unexpected future developments, it is possible that the ultimate resolution of such matters, if unfavorable, could have a
70
Table of Contents
Zep Inc.
NOTES TO CONSOLIDATED AND COMBINED FINANCIAL STATEMENTS—(Continued)
(Dollar amounts in thousands, except share and per-share data and as indicated)
material adverse effect on results of operations, financial position, or cash flows of the Company in future periods. Zep establishes reserves for legal claims when the costs associated with the claims become probable and can be reasonably estimated. The actual costs of resolving legal claims may be substantially higher or lower than the amounts reserved for such claims. However, the Company cannot make a meaningful estimate of actual costs to be incurred that could possibly be higher or lower than the amounts reserved. Also, from time to time we may incur expense associated with efforts to enforce our non-compete agreements.
Environmental Matters
Our operations are subject to federal, state, local, and foreign laws and regulations relating to the generation, storage, handling, transportation, and disposal of hazardous substances and solid and hazardous wastes, and to the remediation of contaminated sites. Permits and environmental controls are required for certain of our operations to limit air and water pollution, and these permits are subject to modification, renewal, and revocation by issuing authorities. We will incur capital and operating costs relating to environmental compliance on an ongoing basis. Environmental laws and regulations have generally become stricter in recent years, and the cost of responding to future changes may be substantial. While we believe that we are currently in substantial compliance with all material environmental laws and regulations, there can be no assurance that we will not incur significant costs to remediate violations of such laws and regulations, particularly in connection with acquisitions of existing operating facilities, or to comply with changes in, or stricter or different interpretations of, existing laws and regulations. Such costs could have a material adverse effect on our results of operations.
In June 2007, we reached a final resolution of the investigation by the United States Department of Justice (the “DOJ”) of certain environmental issues at our primary manufacturing facility located in Atlanta, Georgia. In connection with this resolution, we are subject to a three-year probation period that incorporates a compliance agreement with the United States Environmental Protection Agency (the “EPA”). Under the compliance agreement, we are required to maintain an enhanced compliance program. This matter is not expected to lead to a material loss of business, any disruption of production, or materially higher operating costs. However, in the event of our material breach of the compliance agreement, those consequences could occur.
We are currently a party to federal and state administrative proceedings arising under federal and state laws enacted for the protection of the environment where a state or federal agency or a private party alleges that hazardous substances generated by Zep have been discharged into the environment and a state or federal agency is requiring a cleanup of soil and/or groundwater pursuant to federal or state superfund laws. In each of these proceedings in which Zep has been named as a party that allegedly generated hazardous substances that were transported to a waste site owned and operated by another party, either (1) Zep is one of many other identified generators who have reached an agreement on the allocation of costs for cleanup among the various generators and Zep’s potential liability is not material; (2) Zep has been identified as a potential generator and the sites have been remediated by the EPA or by a state for a cost that is not material; or (3) other generators have cleaned up the site and have not pursued a claim against Zep and Zep’s liability, if any, would not be material.
Our property on Seaboard Industrial Boulevard is the only active site involving property which we own and where we have been named as a potentially responsible party. We and the current and former owners of adjoining properties have agreed to share the expected costs and responsibilities of implementing an approved corrective action plan, submitted in 2004, under the Georgia Hazardous
71
Table of Contents
Zep Inc.
NOTES TO CONSOLIDATED AND COMBINED FINANCIAL STATEMENTS—(Continued)
(Dollar amounts in thousands, except share and per-share data and as indicated)
Response Act (“HSRA”) to periodically monitor property along a nearby stream for a period of five years ending in December 2009. The Georgia Environmental Protection Division (the “EPD”) is reviewing the monitoring program and will determine if additional monitoring is necessary and for what period of time. Subsequently, in connection with the DOJ investigation described earlier, we and the EPA each analyzed samples taken from certain sumps at the Seaboard facility. The sample results from some of the sump tests indicated the presence of certain hazardous substances. As a result, we notified the EPD and conducted additional soil and groundwater studies pursuant to HSRA. We are continuing to negotiate with the EPD on the scope of the Corrective Action Plan we submitted to address the subsurface contamination north of Seaboard Industrial Boulevard, and have executed a Consent Order with the EPD covering this remediation.
In January 2008, the EPA issued a Notice of Violation and document request regarding the use and management of certain trench drains at the Seaboard production facility as well as assorted minor waste labeling issues. The Company executed a Consent Order with the EPA in March 2009 that resolved this matter. Resolution involved the remittance of a penalty and modification of certain manufacturing practices, neither of which had a material impact on the Company’s results of operations or financial condition.
In May 2007, we accrued an undiscounted pre-tax liability of $5.0 million representing our best estimate of costs associated with voluntary subsurface remediation, primarily to remove contaminants from soil underlying one of our manufacturing facilities, and other related environmental issues. While over approximately the next three years we could expend an amount ranging up to $7.5 million on these efforts, our best estimate of voluntary remediation costs continues to be $5.0 million. To date, we have expended approximately $1.5 million of the $5.0 million reserve established in May 2007. Further sampling, engineering studies, changes in regulatory requirements and/or final resolution of the proposed consent order could cause us to revise the current estimate. We believe that additional expenditures after three years of remediation may be necessary and that those expenditures, based on currently available information, could range up to an additional $10.0 million during the subsequent twenty-five year period. It may be appropriate to capitalize certain of the expenditures that may be incurred in this twenty-five year period. We arrived at the current estimates on the basis of studies prepared by independent third party environmental consulting firms. The actual cost of remediation will vary depending upon the results of additional testing and geological studies, the success of initial remediation efforts in the first five years addressing the most significant areas of contamination, the rate at which site conditions may change, and the requirements of the EPD.
Product Recall
In cooperation with the United States Consumer Product Safety Commission (“CPSC”), conducted a voluntary product recall involving certain five-gallon plastic pails manufactured by an outside supplier after learning that, in a limited number of cases, a label intended for a different product was affixed by the third-party supplier to the back of the affected pails, even though the front of the pail was labeled properly. We worked cooperatively with our impacted retailer, who has reportedly removed the mislabeled product from store shelves. We do not believe that the mislabeled product, which is used in floor care, poses a risk to end-users. Nevertheless, we initiated a CPSC recall on February 20, 2009 to address the mislabeling. As of August 31, 2009, the Company estimated potential losses associated with this occurrence to be immaterial.
72
Table of Contents
Zep Inc.
NOTES TO CONSOLIDATED AND COMBINED FINANCIAL STATEMENTS—(Continued)
(Dollar amounts in thousands, except share and per-share data and as indicated)
Guarantees and Indemnities
As further discussed in Note 1 of Notes to Consolidated and Combined Financial Statements, in conjunction with the separation of their businesses, Zep and Acuity Brands entered into various agreements that address the allocation of assets and liabilities between them and that define their relationship after the separation, including the distribution agreement, the tax disaffiliation agreement, the employee benefits agreement, and the transition services agreement. Included in these agreements are certain general indemnifications granted by Zep to Acuity Brands, and by Acuity Brands to Zep, as well as specific limited tax liability indemnifications in the event that the Distribution is deemed to be taxable, or if any of the internal reorganization steps taken to effect the Distribution are not deemed to have been made on a tax-free basis. The Internal Revenue Service has issued a private letter ruling supporting the tax-free status of the spin-off, and Zep continues to conduct its operations in a manner that is compliant with the conditions set forth by that ruling. Further, Zep and Acuity Brands have received an opinion from their external counsel supporting the tax-free status of the spin-off. We believe the probability that the Distribution will be deemed taxable is remote, and the estimated fair value to be de minimis. Therefore, we have not recorded any related amounts in our Consolidated and Combined Financial Statements.
Note 8: Restructuring Charges
During the first quarter of fiscal year 2008, Zep’s management announced its intention to pursue a strategic plan focused upon achieving the Company’s long-term financial objectives. As part of this program, we recorded pretax charges of $10.0 million reflecting the cost of restructuring and other special items during fiscal year 2008. These charges are composed of severance related costs totaling approximately $5.3 million, product line simplification costs of $1.5 million (approximately $1.2 million of which is related to inventory disposal and is required to be reported within Cost of Products Sold), and facility lease contract termination costs of approximately $3.3 million. We will continue to make payments on the affected facility lease until it expires in 2015.
During the first quarter of fiscal year 2009, the Company recorded an additional $1.9 million restructuring charge composed of severance costs. The Company’s employee severance actions are collectively expected to affect approximately 330 employees, and the majority of related payments are expected to be settled during the next 12 months. In the second quarter of fiscal year 2009, the Company recorded a charge of $1.1 million as it exited two additional facilities, and, in accordance with SFAS No. 146, Accounting for Costs Associated with Exit or Disposal Activities, adjusted sub-lease rental income assumptions associated with the above mentioned fiscal year 2008 facility closure. In the fourth quarter of fiscal year 2009, Zep recorded a pretax restructuring charge of $0.4 million for costs associated with severances and facility consolidation.
The fiscal 2009 changes to our restructuring reserve (included within Accrued compensation and Other accrued liabilities on the Consolidated Balance Sheets) are summarized as follows:
| Severance Costs |
Facility Exit Costs |
|||||||
| Balance as of August 31, 2008 |
$ | 4,082 | $ | 3,130 | ||||
| Restructuring charges recorded during fiscal 2009 |
2,017 | 1,405 | ||||||
| Payments made from restructuring reserves |
(4,038 | ) | (1,323 | ) | ||||
| Balance as of August 31, 2009 |
$ | 2,061 | $ | 3,212 | ||||
73
Table of Contents
Zep Inc.
NOTES TO CONSOLIDATED AND COMBINED FINANCIAL STATEMENTS—(Continued)
(Dollar amounts in thousands, except share and per-share data and as indicated)
Note 9: Income Taxes
Zep accounts for income taxes using the asset and liability approach as prescribed by SFAS No. 109, Accounting for Income Taxes. This approach requires recognition of deferred tax liabilities and assets for the expected future tax consequences of events that have been included in the financial statements or tax returns.
Using the enacted tax rates in effect for the year in which the differences are expected to reverse, deferred tax liabilities and assets are determined based on the differences between the financial reporting and the tax basis of an asset or liability.
The provision for income taxes consists of the following components:
| Years Ended August 31, | |||||||||||
| 2009 | 2008 | 2007 | |||||||||
| Provision for current federal taxes |
$ | 3,804 | $ | 7,678 | $ | 7,644 | |||||
| Provision for current state taxes |
643 | 936 | 402 | ||||||||
| Provision for current foreign taxes |
1,296 | 3,489 | 4,024 | ||||||||
| Provision for deferred taxes |
181 | (2,434 | ) | (1,316 | ) | ||||||
| Total provision for income taxes |
$ | 5,924 | $ | 9,669 | $ | 10,754 | |||||
A reconciliation from the federal statutory rate to the total provision for income taxes is as follows:
| Years Ended August 31, | ||||||||||||
| 2009 | 2008 | 2007 | ||||||||||
| Federal income tax computed at statutory rate |
$ | 5,314 | $ | 9,097 | $ | 8,693 | ||||||
| State income tax, net of federal income tax benefit |
388 | 504 | 261 | |||||||||
| Foreign permanent differences and rate differential |
259 | 208 | 209 | |||||||||
| Deferred taxes |
— | — | 840 | |||||||||
| Change in valuation allowance |
67 | (76 | ) | (65 | ) | |||||||
| Repatriation of foreign earnings |
— | — | 420 | |||||||||
| Other, net |
(104 | ) | (64 | ) | 396 | |||||||
| Total provision for income taxes |
$ | 5,924 | $ | 9,669 | $ | 10,754 | ||||||
74
Table of Contents
Zep Inc.
NOTES TO CONSOLIDATED AND COMBINED FINANCIAL STATEMENTS—(Continued)
(Dollar amounts in thousands, except share and per-share data and as indicated)
Components of the net deferred income tax asset at August 31, 2009 and 2008 include:
| 2009 | 2008 | |||||||
| Deferred Income Tax Liabilities: |
||||||||
| Depreciation |
$ | (3,637 | ) | $ | (2,722 | ) | ||
| Goodwill and intangibles |
(762 | ) | (725 | ) | ||||
| Other liabilities |
(552 | ) | (559 | ) | ||||
| Total deferred income tax liabilities |
$ | (4,951 | ) | $ | (4,006 | ) | ||
| Deferred Income Tax Assets: |
||||||||
| Self-insurance |
4,075 | 4,470 | ||||||
| Deferred compensation |
3,864 | 3,694 | ||||||
| Foreign tax losses |
950 | 832 | ||||||
| Other accruals not yet deductible |
9,643 | 8,993 | ||||||
| Other assets |
1,233 | 903 | ||||||
| Total deferred income tax assets |
19,765 | 18,892 | ||||||
| Valuation allowance |
(1,337 | ) | (1,295 | ) | ||||
| Net deferred income tax asset |
$ | 13,477 | $ | 13,591 | ||||
Subsequent to the spin-off, we intend to indefinitely reinvest in our foreign subsidiaries all undistributed earnings of and original investments in such subsidiaries. If these earnings were distributed to the United States in the form of dividends or otherwise, or if the shares of the relevant foreign subsidiaries were sold or otherwise transferred, the Company would be subject to additional United States income taxes (subject to an adjustment for foreign tax credits) and foreign withholding taxes. Determination of the amount of unrecognized deferred income tax liability related to these earnings or investments is not practicable because such liability, if any, is dependent on events and circumstances existing if and when remittance occurs.
Deferred tax assets were partially offset by valuation allowances of $1.3 million at August 31, 2009 and August 31, 2008. The Company’s deferred tax asset valuation allowances are primarily the result of uncertainties regarding the future realization of recorded tax benefits of state tax credits and foreign capital loss carryforwards. In 2009, the Company recognized a net increase in its valuation allowance of less than $0.1 million reflecting a decrease in the expected realizable value of state tax credits. In 2008, the Company recognized a net decrease in its valuation allowances of less than $0.1 million also related to state tax credits.
At August 31, 2009, foreign net operating and capital loss carryforwards, the majority of which have no expiration, were approximately $1.4 million. Additionally, the Company has state tax credit carryforwards of approximately $1.6 million, which will expire between 2013 and 2019.
In June 2006, the FASB issued FIN 48, which clarifies the accounting for uncertainty in income taxes by prescribing a recognition threshold and measurement attribute for the financial statement implications of tax positions taken or expected to be taken in a company’s tax return. The interpretation also provides guidance on derecognition, classification, interest and penalties, accounting in interim periods, and disclosure of such positions. We adopted FIN 48 effective September 1, 2007. Federal and state income tax liabilities relating to periods prior to the spin-off remain the responsibility of Acuity Brands
75
Table of Contents
Zep Inc.
NOTES TO CONSOLIDATED AND COMBINED FINANCIAL STATEMENTS—(Continued)
(Dollar amounts in thousands, except share and per-share data and as indicated)
pursuant to the tax disaffiliation agreement, and, therefore, the adoption of this pronouncement had a de minimis impact on our results from operations and financial position during the twelve months ended August 31, 2008. As of the adoption date, we had gross tax-effected unrecognized tax benefits (including interest and penalties) of $1.1 million, none of which, if recognized, would affect our effective tax rate due to the offsetting receivable from Acuity Brands provided for in the tax disaffiliation agreement. In our results from operations during the twelve months ended August 31, 2009, we recognized less than $0.2 million additional income tax expense related to changes in gross tax-effected unrecognized tax benefits, including interest and penalties.
We recognize potential accrued interest and penalties related to unrecognized tax benefits in income tax expense. As of August 31, 2009, we had gross tax-effected unrecognized tax benefits of $1.5 million (including interest and penalties of $0.2 million), of which $0.3 million, if recognized, would affect our effective tax rate due to the offsetting receivable from Acuity Brands provided for in the tax disaffiliation agreement. Interest and penalties recognized had a de minimis impact on our fiscal year 2009 operating results due to the offsetting receivable from Acuity Brands. There are no significant increases or decreases to the amount of unrecognized tax benefits anticipated within the next twelve months.
A reconciliation of the beginning and ending amount of unrecognized tax benefits is as follows (in thousands):
| Balance at August 31, 2008 |
$ | 1,350 | ||
| Additions based on tax positions related to the current year |
182 | |||
| Reductions based on tax positions related to the current year |
— | |||
| Additions for tax positions of prior years |
160 | |||
| Reductions for tax positions of prior years |
(283 | ) | ||
| Reductions for settlements with taxing authorities |
(36 | ) | ||
| Reductions for closings of statutes of prior years |
(122 | ) | ||
| Balance at August 31, 2009 |
$ | 1,251 |
We conduct business globally, and as a result, one or more of our subsidiaries files income tax returns in the U.S. federal jurisdiction and various state and foreign jurisdictions. In the normal course of business we are subject to examination by taxing authorities throughout the world, including various jurisdictions in Europe, Canada and the United States. With few exceptions, we are no longer subject to U.S. federal, state and local income tax examinations for tax years before 2005, or non-U.S. income tax examinations for tax years before 2002.
76
Table of Contents
Zep Inc.
NOTES TO CONSOLIDATED AND COMBINED FINANCIAL STATEMENTS—(Continued)
(Dollar amounts in thousands, except share and per-share data and as indicated)
Note 10: Quarterly Financial Data (Unaudited)
| Net Sales |
Gross Profit |
Income Before Taxes |
Net Income |
Basic Earnings Per Share(1) |
Diluted Earnings Per Share(1) |
|||||||||||||||||
| 2009 |
||||||||||||||||||||||
| 1st Quarter (2) |
$ | 129,161 | $ | 67,801 | $ | (2,453 | ) | $ | (1,545 | ) | $ | (0.07 | ) | $ | (0.07 | ) | ||||||
| 2nd Quarter(2) |
114,608 | 58,732 | (1,511 | ) | (942 | ) | (0.04 | ) | (0.04 | ) | ||||||||||||
| 3rd Quarter |
122,961 | 66,302 | 8,674 | 5,407 | 0.26 | 0.25 | ||||||||||||||||
| 4th Quarter (2) |
134,302 | 71,684 | 10,474 | 6,340 | 0.44 | 0.43 | ||||||||||||||||
| 2008 |
||||||||||||||||||||||
| 1st Quarter |
$ | 143,576 | $ | 83,433 | $ | 9,783 | $ | 6,280 | $ | 0.30 | $ | 0.30 | ||||||||||
| 2nd Quarter(3) |
133,163 | 74,382 | 2,950 | 1,907 | 0.09 | 0.09 | ||||||||||||||||
| 3rd Quarter(3) |
145,202 | 80,474 | 478 | 168 | 0.01 | 0.01 | ||||||||||||||||
| 4th Quarter |
152,783 | 84,893 | 12,780 | 7,967 | 0.38 | 0.37 | ||||||||||||||||
| (1) | Basic and diluted earnings per share are calculated independently for each of the quarters presented in accordance with SFAS No. 128, Earnings per Share. Therefore, the sum of quarterly basic and diluted earnings per share may not total annual basic and diluted earnings per share. |
| (2) | During the first quarter of fiscal year 2009, Zep’s management initiated actions necessary to reduce non-sales headcount by 5%. Accordingly, we recorded a net pretax charge of $1.9 million during the three months ended November 30, 2008. This charge was entirely composed of severance related costs. In the second quarter of fiscal year 2009, the Company recorded a charge of $1.1 million as it exited two facilities, and, in accordance with SFAS No. 146, Accounting for Costs Associated with Exit or Disposal Activities, adjusted sub-lease rental income assumptions associated with a leased facility exited during the third quarter of fiscal year 2008. In the fourth quarter of fiscal year 2009, Zep recorded a pretax restructuring charge of $0.4 million for costs associated with severances and facility consolidation. The impact of these charges is included within first, second and fourth quarter fiscal year 2009 income before taxes and net income presented within the above listed table. |
| (3) | During the first quarter of fiscal year 2008, Zep’s management announced its intention to pursue a strategic plan focused upon achieving the Company’s long-term financial objectives. As part of this program, we recorded a net pretax charge $0.8 million during the second fiscal quarter of 2008 and $4.5 million during the third fiscal quarter of 2008. These charges were primarily composed of severance related costs. Additionally, in the third quarter of fiscal year 2008, we consolidated our corporate office operations and recorded a $3.3 million charge for facility lease termination costs. Finally, we recorded a $1.5 million charge related to discontinued inventory resulting from our product line simplification ($1.2 million for inventory write-downs was recorded within of Cost of Products Sold and $0.3 million for waste disposal was recorded within Selling, Distribution and Administrative Expenses) during that quarter. The impact of these charges is included within second and third quarter fiscal year 2008 gross profit, income before taxes and net income presented within the above listed table. |
Note 11: Geographic Distribution of Operations
The Company is managed as a single business unit that provides a wide range of cleaning and maintenance chemical solutions to our customers. Strategies and policies regarding Zep’s revenue growth, product sourcing, brand management, pricing, sales management, and marketing of product formulations are facilitated by personnel within the Company’s corporate office, which is located in Atlanta, Georgia. Additional functions including but not limited to tax, legal, treasury, environmental compliance, research and development, and risk management are managed through Zep’s central, shared-service organization, also located within Zep’s Atlanta-based headquarters. The Company reports revenues in one line item as a group of similar products, given its products have similar profit contributions, are marketed to a similar customer base, and share similar methods of production and distribution.
77
Table of Contents
Zep Inc.
NOTES TO CONSOLIDATED AND COMBINED FINANCIAL STATEMENTS—(Continued)
(Dollar amounts in thousands, except share and per-share data and as indicated)
The geographic distribution of Zep’s net sales, operating profit, and long-lived assets is summarized in the following table for the years ended August 31:
| 2009 | 2008 | 2007 | |||||||
| Net sales(1) |
|||||||||
| Domestic(2) |
$ | 394,280 | $ | 445,071 | $ | 453,606 | |||
| International |
106,752 | 129,653 | 112,280 | ||||||
| $ | 501,032 | $ | 574,724 | $ | 565,886 | ||||
| Operating profit(3) |
|||||||||
| Domestic(2) |
$ | 15,485 | $ | 21,414 | $ | 21,221 | |||
| International |
2,604 | 7,649 | 8,428 | ||||||
| $ | 18,089 | $ | 29,063 | $ | 29,649 | ||||
| Long-lived assets(4) |
|||||||||
| Domestic(2) |
$ | 55,848 | $ | 57,833 | $ | 52,295 | |||
| International |
5,870 | 5,789 | 6,233 | ||||||
| $ | 61,718 | $ | 63,622 | $ | 58,528 | ||||
| (1) | Net sales are attributed to each country based on the selling location. Sales generated in Canada approximated 12%, 13%, and 11% of total net sales for the three years ended August 31, 2009, respectively. None of the remaining countries categorized in the above table as “International” were responsible for more than 10% of the Company’s total consolidated net sales. |
| (2) | Domestic amounts include net sales, operating profit, and long-lived assets for U.S. based operations. |
| (3) | Certain costs related to corporate functions performed within our Atlanta, Georgia based headquarters and supporting offices have not been allocated among our international operating results. Fiscal year 2008 international operating results were impacted by transfer pricing actions undertaken by the Company in accordance with regulations promulgated within the jurisdictions where we conduct business. Interest costs incurred in connection with our debt instruments, all of which are maintained by our domestic operations, are primarily responsible for differences between Operating Profit and Income before Provision for Income Taxes as reported within our Consolidated and Combined Statements of Income. |
| (4) | Long-lived assets include net property, plant, and equipment, long-term deferred income tax assets, and other long-term assets. |
Note 12: Subsequent Events
We have evaluated subsequent events through October 29, 2009, the date on which our Annual Report on Form 10-K for the fiscal year ended August 31, 2009 was filed with the Securities and Exchange Commission (“SEC”). Included within Note 4 of Notes to Consolidated and Combined Financial Statements is a discussion of the three-year, $40 million Loan and Security Agreement entered into with Regions Bank on October 14, 2009. Also on that date, we filed a shelf registration statement on Form S-3 with the SEC. Upon being declared effective by the SEC, the shelf registration statement will allow Zep to raise up to an aggregate of $200 million through the sale of equity, debt, and certain other types of securities described in the registration statement, through one or more offerings, from time to time in the future. Pursuant to the shelf registration statement filed with the SEC, the net proceeds from the sale of any securities to be registered thereunder will be used for general corporate purposes, which may include funding capital expenditures, pursuing growth initiatives, whether through acquisitions, joint ventures or otherwise, repaying or refinancing indebtedness or other obligations, and financing working capital. On October 7, 2009, our Board of Directors declared a quarterly dividend of $0.04 per share.
78
Table of Contents
Zep Inc.
NOTES TO CONSOLIDATED AND COMBINED FINANCIAL STATEMENTS—(Continued)
(Dollar amounts in thousands, except share and per-share data and as indicated)
On September 1, 2009, we issued our fiscal year 2010 annual equity award grant (“2010 grant”). Through this grant, 451,744 shares were issued from the Zep LTIP to officers, key employees, and non-employee directors of the Company. The 2010 grant included restricted stock and stock option awards similar in structure to those issued in previous years. Also included in the 2010 grant were awards conditioned upon not only a holder’s service to the Company but also market-based requirements (“performance awards”). These performance awards will vest provided Zep’s stock reaches and sustains certain targets during specified periods over the next four years. While we have utilized the Black-Scholes model to determine fair value for certain awards in previous years’ grants, the fair value of performance awards will be determined by a more complex valuation model that can accommodate stock price appreciation and other provisions of the performance awards. We did not identify any further subsequent events warranting disclosure.
79
Table of Contents
Item 9. Changes in and Disagreements with Accountants on Accounting and Financial Disclosure
None.
Item 9a. Controls and Procedures
Disclosure controls and procedures are controls and other procedures that are designed to reasonably ensure that information required to be disclosed in the reports filed or submitted by the Company under the Securities Exchange Act is recorded, processed, summarized, and reported within the time periods specified in the Securities and Exchange Commission’s rules and forms. Disclosure controls and procedures include, without limitation, controls and procedures designed to reasonably ensure that information required to be disclosed by the Company in the reports filed under the Securities Exchange Act is accumulated and communicated to management, including the principal executive officer and principal financial officer, as appropriate to allow timely decisions regarding required disclosure.
As required by SEC rules, the Company has evaluated the effectiveness of the design and operation of its disclosure controls and procedures as of August 31, 2009. This evaluation was carried out under the supervision and with the participation of management, including the principal executive officer and principal financial officer. Based on this evaluation, these officers have concluded that the design and operation of the Company’s disclosure controls and procedures are effective at a reasonable assurance level. However, because all disclosure procedures must rely to a significant degree on actions or decisions made by employees throughout the organization, such as reporting of material events, the Company and its reporting officers believe that they cannot provide absolute assurance that all control issues and instances of fraud or errors and omissions, if any, within the Company will be detected. Limitations within any control system, including the Company’s control system, include faulty judgments in decision-making or simple errors or mistakes. In addition, controls can be circumvented by an individual, by collusion between two or more people, or by management override of the control. Because of these limitations, misstatements due to error or fraud may occur and may not be detected.
Management’s annual report on the Company’s internal control over financial reporting and the independent registered public accounting firm’s attestation report are included in the Company’s 2009 Financial Statements in Item 8 of this Annual Report on Form 10-K, under the headings, “Management’s Report on Internal Control over Financial Reporting” and “Report of Independent Registered Public Accounting Firm”, respectively, and are incorporated herein by reference.
There have been no changes in the Company’s internal control over financial reporting that occurred during the Company’s most recent completed fiscal quarter that have materially affected, or are reasonably likely to materially affect, the Company’s internal control over financial reporting.
CEO and CFO Certifications
The Company’s Chief Executive Officer as well as the Executive Vice President and Chief Financial Officer have filed with the Securities and Exchange Commission the certifications required by Section 302 of the Sarbanes-Oxley Act of 2002 as Exhibits 31.1 and 31.2 to the Company’s Annual Report on Form 10-K for the fiscal year ended August 31, 2009. In addition, on February 9, 2009, the Company’s CEO certified to the New York Stock Exchange that he was not aware of any violation by us of the NYSE corporate governance listing standards.
None.
80
Table of Contents
PART III
Item 10. Directors, Executive Officers and Corporate Governance
The information required by this item, with respect to directors, is included under the captions Director Nominees for the 2010 Annual Meeting and Directors with Terms Expiring at the 2011 and 2012 Annual Meetings of the Company’s proxy statement for the annual meeting of stockholders to be held January 7, 2010, to be filed with the Commission pursuant to Regulation 14A, and is incorporated herein by reference.
The information required by this item, with respect to executive officers, is included under the caption Management—Executive Compensation of the Company’s proxy statement for the annual meeting of stockholders to be held January 7, 2010, to be filed with the Commission pursuant to Regulation 14A, and is incorporated herein by reference.
The information required by this item, with respect to beneficial ownership reporting, is included under the caption Section 16(a) Beneficial Ownership Reporting Compliance of the Company’s proxy statement for the annual meeting of stockholders to be held January 7, 2010, to be filed with the Commission pursuant to Regulation 14A, and is incorporated herein by reference.
Item 11. Executive Compensation
The information required by this item is included under the captions Compensation of Directors, Information Concerning the Board and Its Committees, Compensation Committee Interlocks and Insider Participation, Fiscal 2009 Summary Compensation Table, Fiscal 2009 Grants of Plan-Based Awards, Outstanding Equity Awards at Fiscal 2009 Year-End, Option Exercises and Stock Vested in Fiscal 2009, Fiscal 2009 Nonqualified Deferred Compensation, Employment Contracts, Severance Agreements, Change in Control Agreements, Equity Award Agreements and Deferred Compensation Plans of the Company’s proxy statement for the annual meeting of stockholders to be held January 7, 2010, to be filed with the Commission pursuant to Regulation 14A, and is incorporated herein by reference.
Item 12. Security Ownership of Certain Beneficial Owners and Management and Related Stockholder Matters
The information required by this item is included under the captions Beneficial Ownership of the Company’s Securities and Disclosure with Respect to Equity Compensation Plans of the Company’s proxy statement for the annual meeting of stockholders to be held January 7, 2010, to be filed with the Commission pursuant to Regulation 14A, and is incorporated herein by reference.
Item 13. Certain Relationships and Related Transactions, and Director Independence
The information required by this item is included under the caption Certain Relationships and Related Party Transactions of the Company’s proxy statement for the annual meeting of stockholders to be held January 7, 2010, to be filed with the Commission pursuant to Regulation 14A, and is incorporated herein by reference.
Item 14. Principal Accounting Fees and Services
The information required by this item is included under the caption Fees Billed by Independent Registered Public Accounting Firm of the Company’s proxy statement for the annual meeting of stockholders to be held January 7, 2010, to be filed with the Commission pursuant to Regulation 14A, and is incorporated herein by reference.
81
Table of Contents
PART IV
Item 15. Exhibits and Financial Statement Schedules
(a) The following documents are filed as part of this report:
| (1) | Management’s Report on Internal Control Over Financial Reporting |
Report of Independent Registered Public Accounting Firm (Ernst & Young LLP)
Report of Independent Registered Public Accounting Firm on Internal Control Over Financial Reporting
Consolidated Balance Sheets as of August 31, 2009 and 2008
Consolidated and Combined Statements of Income for the years ended August 31, 2009, 2008, and 2007
Consolidated and Combined Statements of Cash Flows for the years ended August 31, 2009, 2008, and 2007
Consolidated and Combined Statements of Stockholders’ Equity and Comprehensive Income for the years ended August 31 2009, 2008, and 2007
Notes to Consolidated and Combined Financial Statements
| (2) | Financial Statement Schedules: |
Schedule II Valuation and Qualifying Accounts
Any of Schedules I through V not listed above have been omitted because they are not applicable or the required information is included in the consolidated and combined financial statements or notes thereto.
| (3) | Exhibits filed with this report (begins on next page): |
Copies of exhibits will be furnished to stockholders upon request at a nominal fee.
Requests should be sent to Zep Inc., Investor Relations Department, 1310 Seaboard Industrial Boulevard Atlanta, Georgia 30318-2825.
82
Table of Contents
INDEX TO EXHIBITS
| EXHIBIT 2 |
Agreement and Plan of Distribution by and between Acuity Brands, Inc. and Zep Inc., dated as of October 31, 2007. | Reference is made to Exhibit 2.1 of registrant’s Form 8-K as filed with the Commission on November 5, 2007, which is incorporated herein by reference. | ||||
| EXHIBIT 3 |
(a) |
Restated Certificate of Incorporation of Zep Inc. | Reference is made to Exhibit 3.1 of registrant’s Form 8-K as filed with the Commission on October 26, 2007, which is incorporated herein by reference. | |||
| (b) |
Amended and Restated By-Laws of Zep Inc. (effective January 7, 2010) | Reference is made to Exhibit 3.1 of registrant’s Form 8-K as filed with the Commission on October 6, 2008, which is incorporated herein by reference. | ||||
| EXHIBIT 4 |
(a) |
Form of Certificate representing Zep Inc. Common Stock. | Reference is made to Exhibit 4.1 of registrant’s Form 8-K as filed with the Commission on November 5, 2007, which is incorporated herein by reference. | |||
| (b) |
Stockholder Protection Rights Agreement, dated as of October 30, 2007, between Zep Inc. and Mellon Investor Services LLC, as rights agent. | Reference is made to Exhibit 4.2 of registrant’s Form 8-K as filed with the Commission on November 5, 2007, which is incorporated herein by reference. | ||||
| (c) |
First Amendment to Stockholder Protection Rights Agreement, between Zep Inc. and Mellon Investor Services LLC, as rights agent, dated as of January 22, 2009 | Reference is made to Exhibit 10(a) of registrant’s Form 10-Q as filed with the Commission on April 9, 2009, which is incorporated herein by reference. | ||||
| EXHIBIT 10(i)A |
(1) |
Tax Disaffiliation Agreement, dated as of October 31, 2007, by and between Zep Acuity Brands, Inc. and Zep Inc. | Reference is made to Exhibit 10.1 of registrant’s Form 8-K as filed with the Commission on November 5, 2007, which is incorporated herein by reference. | |||
| (2) |
Transition Services Agreement, dated as of October 31, 2007, by and between Acuity Brands, Inc. and Zep Inc. | Reference is made to Exhibit 10.2 of registrant’s Form 8-K as filed with the Commission on November 5, 2007, which is incorporated herein by reference. | ||||
| (3) |
Agreement and Plan of Distribution, dated as of October 31, 2007, by and between Acuity Brands, Inc. and Zep Inc. | Reference is made to Exhibit 2.1 of registrant’s Form 8-K as filed with the Commission on November 5, 2007, which is incorporated herein by reference. | ||||
83
Table of Contents
| (4) | 5-Year Revolving Credit Agreement, dated as of October 19, 2007 among Zep Inc., the Subsidiary Borrowers from time to time parties hereto, the Lenders from time to time parties hereto, JPMorgan Chase Bank, National Association; Bank of America, N.A.; KeyBank National Association; Wachovia Bank, National Association; Regions Bank; and Wells Fargo Bank, N.A. | Reference is made to Exhibit 10(i)A(4) of registrant’s Form 10-K as filed with the Commission on November 29, 2007, which is incorporated herein by reference. | ||||
| (5) | Amendment No. 1 to 5-Year Revolving Credit Agreement, dated as of October 2, 2007. | Reference is made to Exhibit 10.1 of registrant’s Form 8-K as filed with the Commission on October 8, 2009, which is incorporated herein by reference. | ||||
| (6) | Credit and Security Agreement among Acuity Enterprise Inc, as Borrower; Acuity Specialty Products, Inc., as Servicer; Variable Funding Capital Company, the Liquidity Banks from time to time party hereto; and Wachovia Bank National Association, as Agent, dated as of October 19, 2007. | Reference is made to Exhibit 10(i)A(5) of registrant’s Form 10-K as filed with the Commission on November 29, 2007, which is incorporated herein by reference. | ||||
| (7) | Loan and Security Agreement, by and between Acuity Enterprise, Inc., Acuity Specialty Products, Inc. and Regions Bank, as administrative agent, dated October 14, 2009. | Filed with the Securities and Exchange Commission as part of this Form 10-K. | ||||
| (8) | Performance Undertaking, by and between Zep Inc. and Acuity Enterprise, Inc., dated October 14, 2009. | Filed with the Securities and Exchange Commission as part of this Form 10-K. | ||||
| EXHIBIT 10(iii)A |
Management Contracts and Compensatory Arrangements: | |||||
| (1) | Employee Benefits Agreement, dated as of October 31, 2007. | Reference is made to Exhibit 10.3 of registrant’s Form 8-K as filed with the Commission on November 5, 2007, which is incorporated herein by reference. | ||||
| (2) | Zep Inc. Long-Term Incentive Plan. | Reference is made to Exhibit 10.4 of registrant’s Form 8-K as filed with the Commission on November 5, 2007, which is incorporated herein by reference. | ||||
| (3) | Zep Inc. Non-Employee Director Deferred Compensation Plan. | Reference is made to Exhibit 10.5 of registrant’s Form 8-K as filed with the Commission on November 5, 2007, which is incorporated herein by reference. | ||||
| (4) | Zep Inc. Supplemental Deferred Savings Plan. | Filed with the Securities and Exchange Commission as part of this Form 10-K. | ||||
84
Table of Contents
| (5) | Amendment No. 1 to the Zep Inc. Supplemental Deferred Savings Plan, dated October 7, 2009. | Filed with the Securities and Exchange Commission as part of this Form 10-K. | ||||
| (6) | Zep Inc. Employee Stock Purchase Plan | Reference is made to Exhibit 10.1 of registrant’s Form 8-K as filed with the Commission on August 31, 2009, which is incorporated herein by reference. | ||||
| (7) | Amendment of Zep Inc. Employee Stock Purchase Plan. | Reference is made to Exhibit 10.2 of registrant’s Form 8-K as filed with the Commission on August 31, 2009, which is incorporated herein by reference. | ||||
| (8) |
Form of Indemnification Agreement. | Reference is made to Exhibit 10.16 of registrant’s Form 8-K as filed with the Commission on November 5, 2007, which is incorporated herein by reference. | ||||
| (9) |
Form of Change-in-Control Agreement. | Reference is made to Exhibit 10.17 of registrant’s Form 8-K as filed with the Commission on November 5, 2007, which is incorporated herein by reference. | ||||
| (10) |
Form of Change-in-Control Agreement for Certain Executive Officers. | Reference is made to Exhibit 10.19 of the registrant’s Form 8-K as filed with the Commission on November 5, 2007, which is incorporated herein by reference. | ||||
| (11) |
Form of Severance Agreement. | Reference is made to Exhibit 10.18 of registrant’s Form 8-K as filed with the Commission on November 5, 2007, which is incorporated herein by reference. | ||||
| (12) |
Zep Inc. Management Compensation and Incentive Plan. | Reference is made to Exhibit 10.7 of registrant’s Form 8-K as filed with the Commission on November 5, 2007, which is incorporated herein by reference. | ||||
| (13) |
Zep Inc. Management Compensation and Incentive Plan, amended and restated as of September 1, 2008. | Reference is made to Exhibit A of the registrant’s Definitive Proxy Statement filed with the Commission on November 21, 2008, which is incorporated herein by reference. | ||||
| (14) |
John Morgan Employment Letter. | Reference is made to Exhibit 10.12 of registrant’s Form 10 as filed with the Commission on October 10, 2007, which is incorporated herein by reference. | ||||
85
Table of Contents
| (15) |
Amendment to Employment Letter Agreement, dated as of October 13, 2009, by and between Acuity Specialty Products, Inc., Zep Inc. and John K. Morgan. | Reference is made to Exhibit 10.1 of registrant’s Form 8-K as filed with the Commission on October 13, 2009, which is incorporated herein by reference. | ||||
| (16) |
Amendment No. 2 to Change in Control Agreement and Notice of Termination, dated as of October 13, 2009, by and between Acuity Specialty Products, Inc., Zep Inc. and John K. Morgan. | Reference is made to Exhibit 10.2 of registrant’s Form 8-K as filed with the Commission on October 13, 2009, which is incorporated herein by reference. | ||||
| (17) |
Amendment to Amended and Restated Severance Agreement and Notice of Termination, dated as of October 13, 2009, by and between Acuity Specialty Products, Inc., Zep Inc. and John K. Morgan. | Reference is made to Exhibit 10.3 of registrant’s Form 8-K as filed with the Commission on October 13, 2009, which is incorporated herein by reference. | ||||
| (19) |
Separation Agreement between Zep Inc. and William A. Holl dated January 15, 2009. | Reference is made to Exhibit 10(b) of registrant’s Form 10-Q as filed with the Commission on April 9, 2009, which is incorporated herein by reference. | ||||
| (20) |
Form of Stock Appreciation Rights Agreement for Executive Officers. | Reference is made to Exhibit 10.8 of the registrant’s Form 8-K as filed with the Commission on November 5, 2007, which is incorporated herein by reference. | ||||
| (21) |
Form of Stock Appreciation Rights Agreement for Key Employees. | Reference is made to Exhibit 10.20 of the registrant’s Form 8-K as filed with the Commission on November 5, 2007, which is incorporated herein by reference. | ||||
| (22) |
Form of Nonqualified Stock Option Agreement for Executive Officers. | Reference is made to Exhibit 10.9 of the registrant’s Form 8-K as filed with the Commission on November 5, 2007, which is incorporated herein by reference. | ||||
| (23) |
Form of Nonqualified Stock Option Agreement for Key Employees. | Reference is made to Exhibit 10.10 of the registrant’s Form 8-K as filed with the Commission on November 5, 2007, which is incorporated herein by reference. | ||||
| (24) |
Form of Incentive Stock Option Agreement for Executive Employees. | Reference is made to Exhibit 10.12of the registrant’s Form 8-K as filed with the Commission on November 5, 2007, which is incorporated herein by reference. | ||||
86
Table of Contents
| (25) |
Form of Incentive Stock Option Agreement for Key Officers. | Reference is made to Exhibit 10.11 of the registrant’s Form 8-K as filed with the Commission on November 5, 2007, which is incorporated herein by reference. | ||||
| (26) |
Form of Long-Term Incentive Plan Restricted Stock Award Agreement (without Restrictive Covenants). | Reference is made to Exhibit 10.13 of the registrant’s Form 8-K as filed with the Commission on November 5, 2007, which is incorporated herein by reference. | ||||
| (27) |
Form of Stock Appreciation Rights Agreement for Nonemployee Directors. | Reference is made to Exhibit 10.22 of the registrant’s Form 8-K as filed with the Commission on November 5, 2007, which is incorporated herein by reference. | ||||
| (30) |
Form of Long-Term Incentive Plan Restricted Stock Award Agreement for Nonemployee Directors. | Reference is made to Exhibit 10.23 of the registrant’s Form 8-K as filed with the Commission on November 5, 2007, which is incorporated herein by reference. | ||||
| (31) |
Form of Incentive Stock Option Agreement for Executive Employees. | Reference is made to Exhibit 10.1 of registrant’s Form 8-K as filed with the Commission on September 8, 2009, which is incorporated herein by reference. | ||||
| (32) |
Form of Non-Qualified Stock Option Agreement for Executive Employees. | Reference is made to Exhibit 10.2 of registrant’s Form 8-K as filed with the Commission on September 8, 2009, which is incorporated herein by reference. | ||||
| (33) |
Form of 2010 Performance Stock Award Agreement. | Reference is made to Exhibit 10.3 of registrant’s Form 8-K as filed with the Commission on September 8, 2009, which is incorporated herein by reference. | ||||
| (34) |
Form of Restricted Stock Award Agreement with restrictive covenants. | Reference is made to Exhibit 10.4 of registrant’s Form 8-K as filed with the Commission on September 8, 2009, which is incorporated herein by reference. | ||||
| EXHIBIT 12 |
Statement Regarding Computation of Ratios of Earnings to Fixed Charges | Filed with the Securities and Exchange Commission as part of this Form 10-K. | ||||
| EXHIBIT 21 |
List of Subsidiaries. | Filed with the Securities and Exchange Commission as part of this Form 10-K. | ||||
| EXHIBIT 23 |
Consent of Independent Auditors. | Filed with the Securities and Exchange Commission as part of this Form 10-K. | ||||
87
Table of Contents
| EXHIBIT 24 |
Powers of Attorney. | Filed with the Securities and Exchange Commission as part of this Form 10-K. | ||||
| EXHIBIT 31 |
(a) |
Rule 13a-14(a)/15d-14(a) Certification, signed by John K. Morgan | Filed with the Securities and Exchange Commission as part of this Form 10-K. | |||
| (b) |
Rule 13a-14(a)/15d-14(a) Certification, signed by Mark R. Bachmann | Filed with the Securities and Exchange Commission as part of this Form 10-K. | ||||
| EXHIBIT 32 |
(a) |
Section 1350 Certification, signed by John K. Morgan | Filed with the Securities and Exchange Commission as part of this Form 10-K. | |||
| (b) |
Section 1350 Certification, signed by Mark R. Bachmann | Filed with the Securities and Exchange Commission as part of this Form 10-K. | ||||
88
Table of Contents
Pursuant to the requirements of Section 13 or 15(d) of the Securities Exchange Act of 1934, the registrant has duly caused this report to be signed on its behalf by the undersigned, thereunto duly authorized.
| Zep Inc. | ||||
| Date: October 29, 2009 | By: | /s/ JOHN K. MORGAN | ||
| John K. Morgan Chairman, President, and Chief Executive Officer | ||||
Pursuant to the requirements of the Securities Exchange Act of 1934, this report has been signed below by the following persons on behalf of the registrant and in the capacities and on the dates indicated.
| Signature |
Title |
Date | ||||
| /s/ JOHN K. MORGAN John K. Morgan |
Chairman, President, and Chief Executive Officer (Principal Executive Officer) |
October 29, 2009 | ||||
| /s/ MARK R. BACHMANN Mark R. Bachmann |
Executive Vice President and Chief Financial Officer (Principal Financial |
October 29, 2009 | ||||
| * Earnest W. Deavenport, Jr. |
Director |
October 29, 2009 | ||||
| * Timothy T. Tevens |
Director |
October 29, 2009 | ||||
| * O.B. Grayson Hall, Jr. |
Director |
October 29, 2009 | ||||
| * Joseph Squicciarino |
Director |
October 29, 2009 | ||||
| * Sidney J. Nurkin |
Director |
October 29, 2009 | ||||
| * J. Veronica Biggins |
Director |
October 29, 2009 | ||||
| *BY: | /s/ Mark R. Bachmann Mark R. Bachmann |
Executive Vice President and Chief Financial Officer (Principal Financial and Accounting Officer) |
October 29, 2009 | |||
89
Table of Contents
Zep Inc.
VALUATION AND QUALIFYING ACCOUNTS
FOR THE YEARS ENDED AUGUST 31, 2009, 2008, AND 2007
(in thousands)
| Balance at Beginning of Year |
Additions and Reductions Charged to |
Deductions | Balance at End of Year | |||||||||
| Costs and Expenses |
Other Accounts |
|||||||||||
| Year Ended August 31, 2009: |
||||||||||||
| Reserve for doubtful accounts |
$ | 3,329 | 5,608 | — | 3,982 | $ | 4,955 | |||||
| Reserve for estimated returns and allowances |
$ | 420 | 13,516 | — | 13,436 | $ | 500 | |||||
| Year Ended August 31, 2008: |
||||||||||||
| Reserve for doubtful accounts |
$ | 3,503 | 2,532 | — | 2,706 | $ | 3,329 | |||||
| Reserve for estimated returns and allowances |
$ | 670 | 13,433 | — | 13,683 | $ | 420 | |||||
| Year Ended August 31, 2007: |
||||||||||||
| Reserve for doubtful accounts |
$ | 3,788 | 2,515 | 3 | 2,803 | $ | 3,503 | |||||
| Reserve for estimated returns and allowances |
$ | 783 | 13,419 | — | 13,532 | $ | 670 | |||||
90