Attached files
| file | filename |
|---|---|
| 8-K - 8-K - SEALY CORP | a11-16142_18k.htm |
Exhibit 99.1
|
|
July 2011 |
|
|
1 Forward-Looking Statements This document contains forward-looking statements within the meaning of the safe harbor provisions of the Securities Litigation Reform Act of 1995. Terms such as “expect,” “believe,” “continue,” and “grow,” as well as similar comments, are forward-looking in nature. Although the Company believes its growth plans are based upon reasonable assumptions, it can give no assurances that such expectations can be attained. Factors that could cause actual results to differ materially from the Company’s expectations include: general business and economic conditions, competitive factors, raw materials purchasing and fluctuations in demand. Please refer to the Company's Securities and Exchange Commission filings for further information. See Appendix for information regarding Non-GAAP Financial Measures utilized herein, including Adjusted EBITDA. |
|
|
2 Investment Highlights Stabilizing Industry Fundamentals with Attractive Long-Term Prospects Leading Global Brand with Significant Scale Innovative Market Leader with Broadest Branded Product Portfolio Industry Leading Advertising and Digital Media Assets Unprecedented Opportunity to Gain Profitable Market Share Continued Cost Reduction Programs Operational / Financial Flexibility, Strong Cash Flow and Deleveraging Opportunities Proven Management Team |
|
|
3 Company Overview Leading global bedding manufacturer with broadest portfolio of established brands Global Sales of $1.2Bn in Fiscal 2010 #1 - U.S. Market Position for over 20 years #1 - Canada and Mexico Industry’s Broadest Product Portfolio – Innerspring and Specialty Industry’s Largest Sales, Marketing and Training Team Approximately 3,000 Retailers with over 7,000 Domestic Points of Sale |
|
|
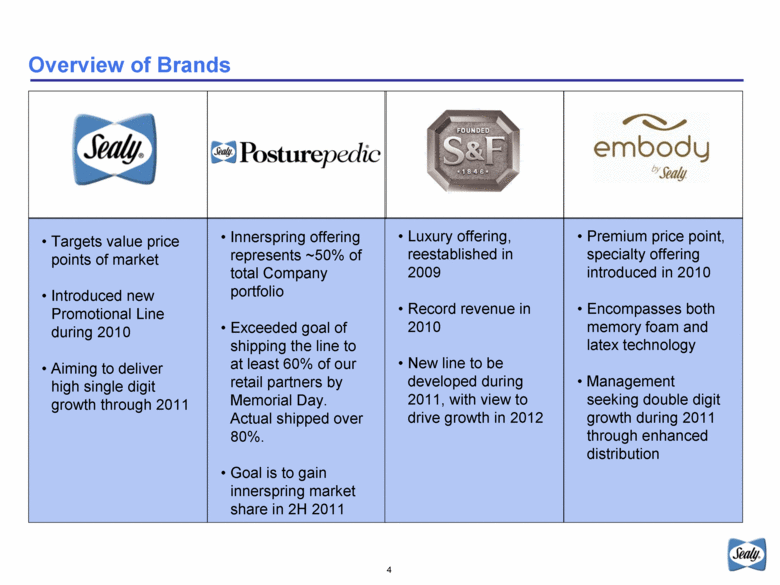
4 Overview of Brands Innerspring offering represents ~50% of total Company portfolio Exceeded goal of shipping the line to at least 60% of our retail partners by Memorial Day. Actual shipped over 80%. Goal is to gain innerspring market share in 2H 2011 Premium price point, specialty offering introduced in 2010 Encompasses both memory foam and latex technology Management seeking double digit growth during 2011 through enhanced distribution Luxury offering, reestablished in 2009 Record revenue in 2010 New line to be developed during 2011, with view to drive growth in 2012 Targets value price points of market Introduced new Promotional Line during 2010 Aiming to deliver high single digit growth through 2011 |
|
|
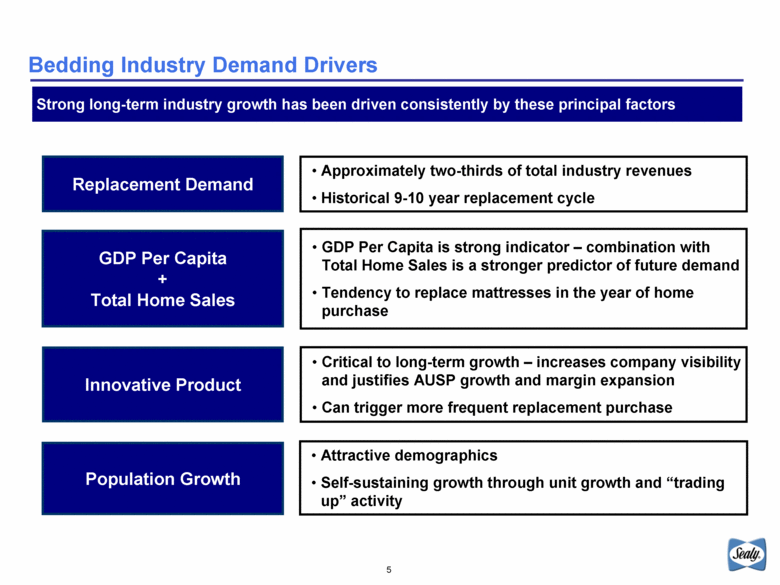
5 Bedding Industry Demand Drivers Approximately two-thirds of total industry revenues Historical 9-10 year replacement cycle Replacement Demand Strong long-term industry growth has been driven consistently by these principal factors Population Growth GDP Per Capita + Total Home Sales Innovative Product Attractive demographics Self-sustaining growth through unit growth and “trading up” activity GDP Per Capita is strong indicator – combination with Total Home Sales is a stronger predictor of future demand Tendency to replace mattresses in the year of home purchase Critical to long-term growth – increases company visibility and justifies AUSP growth and margin expansion Can trigger more frequent replacement purchase |
|
|
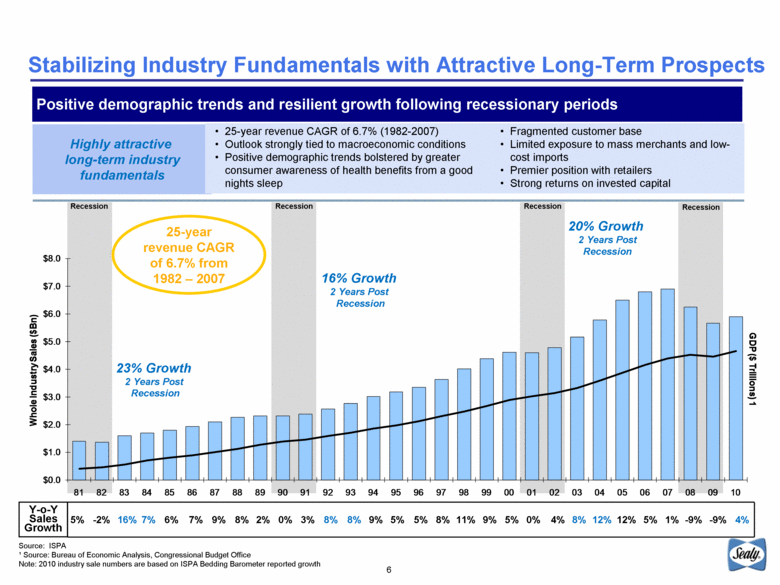
6 Stabilizing Industry Fundamentals with Attractive Long-Term Prospects Source: ISPA ¹ Source: Bureau of Economic Analysis, Congressional Budget Office Note: 2010 industry sale numbers are based on ISPA Bedding Barometer reported growth Positive demographic trends and resilient growth following recessionary periods 5% -2% 16% 7% 6% 7% 9% 8% 2% 0% 3% 8% 8% 9% 5% 5% 8% 11% 9% 5% 0% 4% 8% 12% 12% 5% 1% -9% -9% 4% Y-o-Y Sales Growth 20% Growth 2 Years Post Recession 16% Growth 2 Years Post Recession 23% Growth 2 Years Post Recession 25-year revenue CAGR of 6.7% from 1982 – 2007 Recession Recession Recession Recession Highly attractive long-term industry fundamentals 25-year revenue CAGR of 6.7% (1982-2007) Outlook strongly tied to macroeconomic conditions Positive demographic trends bolstered by greater consumer awareness of health benefits from a good nights sleep Fragmented customer base Limited exposure to mass merchants and low-cost imports Premier position with retailers Strong returns on invested capital $0.0 $1.0 $2.0 $3.0 $4.0 $5.0 $6.0 $7.0 $8.0 81 82 83 84 85 86 87 88 89 90 91 92 93 94 95 96 97 98 99 00 01 02 03 04 05 06 07 08 09 10 GDP ($ Trillions) 1 Whole Industry Sales ($Bn) |
|
|
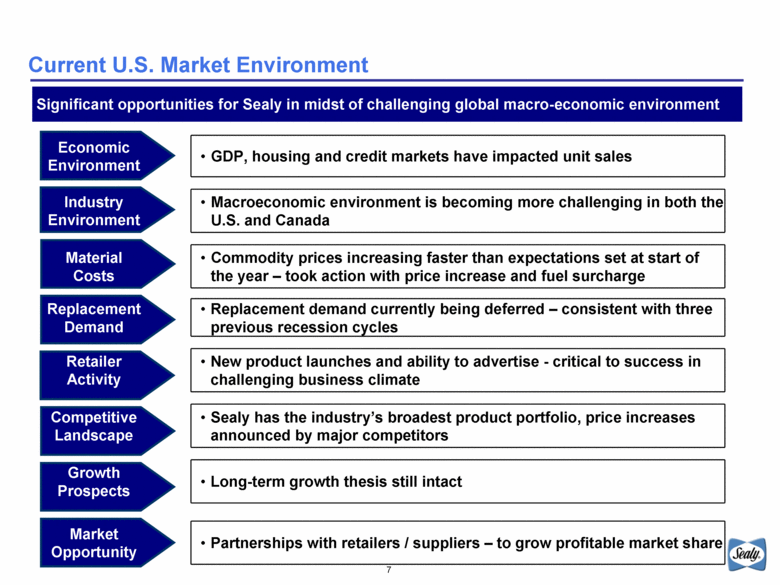
7 Current U.S. Market Environment Significant opportunities for Sealy in midst of challenging global macro-economic environment Economic Environment GDP, housing and credit markets have impacted unit sales Industry Environment Macroeconomic environment is becoming more challenging in both the U.S. and Canada Material Costs Commodity prices increasing faster than expectations set at start of the year – took action with price increase and fuel surcharge Replacement Demand Replacement demand currently being deferred – consistent with three previous recession cycles Retailer Activity New product launches and ability to advertise - critical to success in challenging business climate Competitive Landscape Sealy has the industry’s broadest product portfolio, price increases announced by major competitors Growth Prospects Long-term growth thesis still intact Market Opportunity Partnerships with retailers / suppliers – to grow profitable market share |
|
|
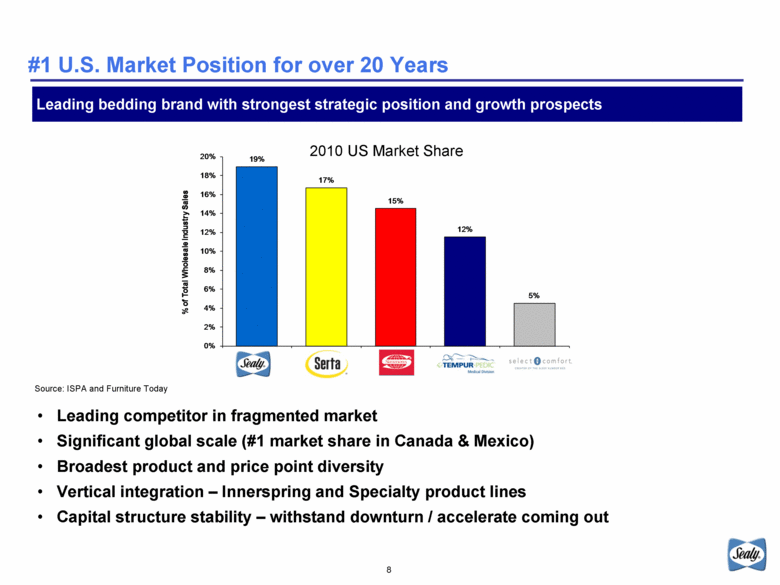
8 #1 U.S. Market Position for over 20 Years Leading competitor in fragmented market Significant global scale (#1 market share in Canada & Mexico) Broadest product and price point diversity Vertical integration – Innerspring and Specialty product lines Capital structure stability – withstand downturn / accelerate coming out Source: ISPA and Furniture Today Leading bedding brand with strongest strategic position and growth prospects 2010 US Market Share 19% 17% 15% 12% 5% 0% 2% 4% 6% 8% 10% 12% 14% 16% 18% 20% Sealy Serta Simmons Tempur - Pedic Select Comfort % of Total Wholesale Industry Sales |
|
|
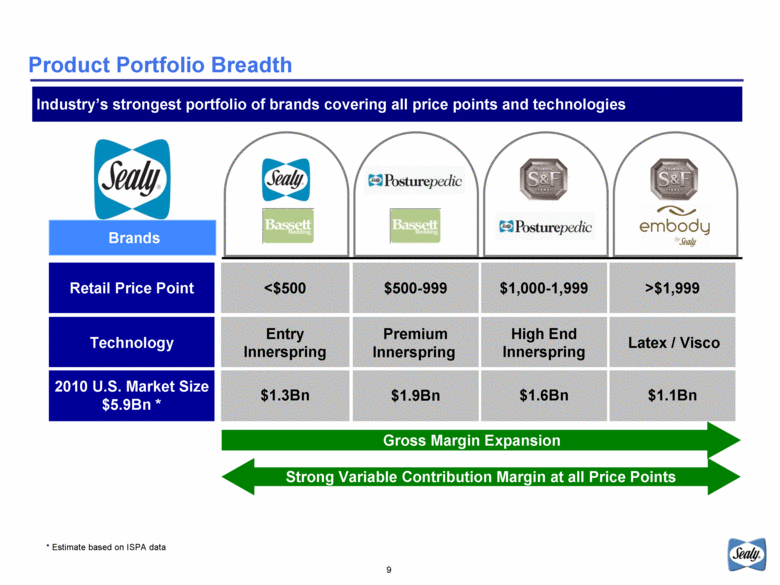
9 Product Portfolio Breadth Industry’s strongest portfolio of brands covering all price points and technologies Retail Price Point <$500 $500-999 $1,000-1,999 >$1,999 Technology Entry Innerspring Premium Innerspring High End Innerspring Latex / Visco 2010 U.S. Market Size $5.9Bn * $1.3Bn $1.9Bn $1.6Bn $1.1Bn Brands * Estimate based on ISPA data Strong Variable Contribution Margin at all Price Points Gross Margin Expansion |
|
|
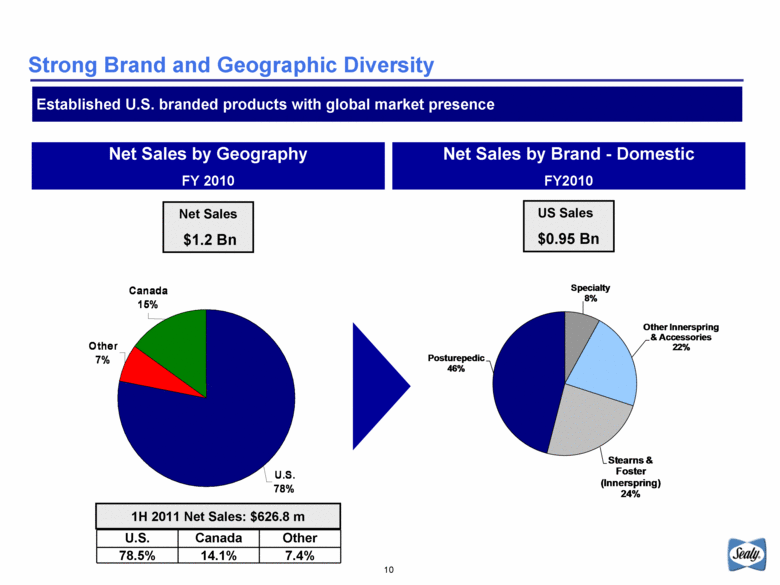
10 Net Sales by Geography FY 2010 Strong Brand and Geographic Diversity Established U.S. branded products with global market presence Net Sales by Brand - Domestic FY2010 US Sales $0.95 Bn U.S. Canada Other 78.5% 14.1% 7.4% 1H 2011 Net Sales: $626.8 m Net Sales $1.2 Bn Canada 15% U.S. 78% Other 7% Specialty 8% Other Innerspring & Accessories 22% Stearns & Foster (Innerspring) 24% Posturepedic 46% |
|
|
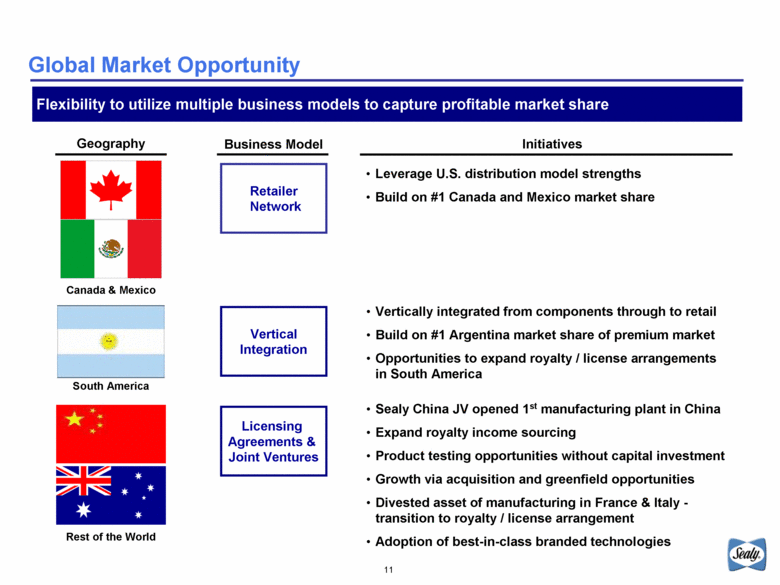
11 Global Market Opportunity Flexibility to utilize multiple business models to capture profitable market share Canada & Mexico Rest of the World Geography Business Model Retailer Network Vertical Integration Licensing Agreements & Joint Ventures Leverage U.S. distribution model strengths Build on #1 Canada and Mexico market share Vertically integrated from components through to retail Build on #1 Argentina market share of premium market Opportunities to expand royalty / license arrangements in South America Sealy China JV opened 1st manufacturing plant in China Expand royalty income sourcing Product testing opportunities without capital investment Growth via acquisition and greenfield opportunities Divested asset of manufacturing in France & Italy - transition to royalty / license arrangement Adoption of best-in-class branded technologies Initiatives South America |
|
|
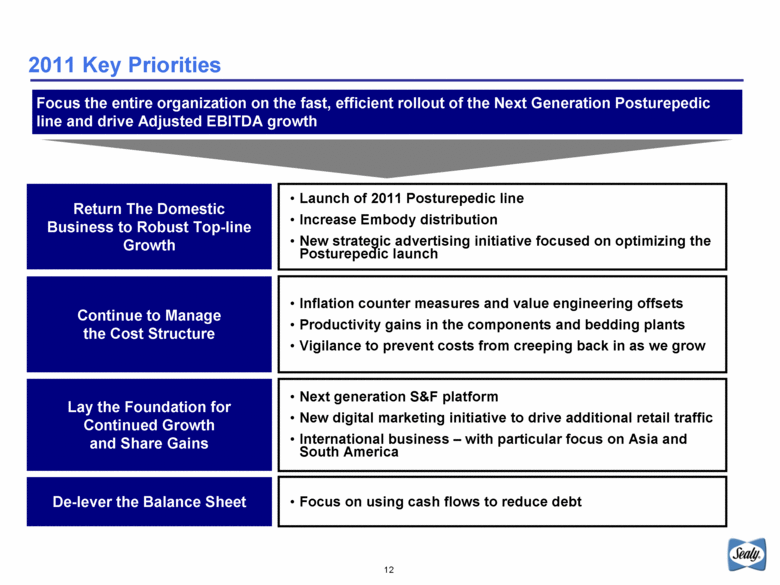
12 2011 Key Priorities Continue to Manage the Cost Structure Return The Domestic Business to Robust Top-line Growth De-lever the Balance Sheet Inflation counter measures and value engineering offsets Productivity gains in the components and bedding plants Vigilance to prevent costs from creeping back in as we grow Launch of 2011 Posturepedic line Increase Embody distribution New strategic advertising initiative focused on optimizing the Posturepedic launch Focus on using cash flows to reduce debt Focus the entire organization on the fast, efficient rollout of the Next Generation Posturepedic line and drive Adjusted EBITDA growth Lay the Foundation for Continued Growth and Share Gains Next generation S&F platform New digital marketing initiative to drive additional retail traffic International business – with particular focus on Asia and South America |
|
|
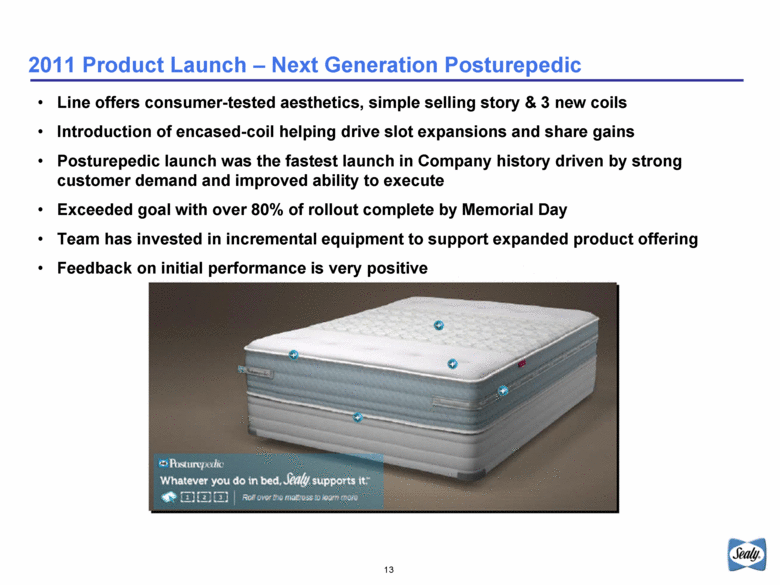
13 2011 Product Launch – Next Generation Posturepedic Line offers consumer-tested aesthetics, simple selling story & 3 new coils Introduction of encased-coil helping drive slot expansions and share gains Posturepedic launch was the fastest launch in Company history driven by strong customer demand and improved ability to execute Exceeded goal with over 80% of rollout complete by Memorial Day Team has invested in incremental equipment to support expanded product offering Feedback on initial performance is very positive |
|
|
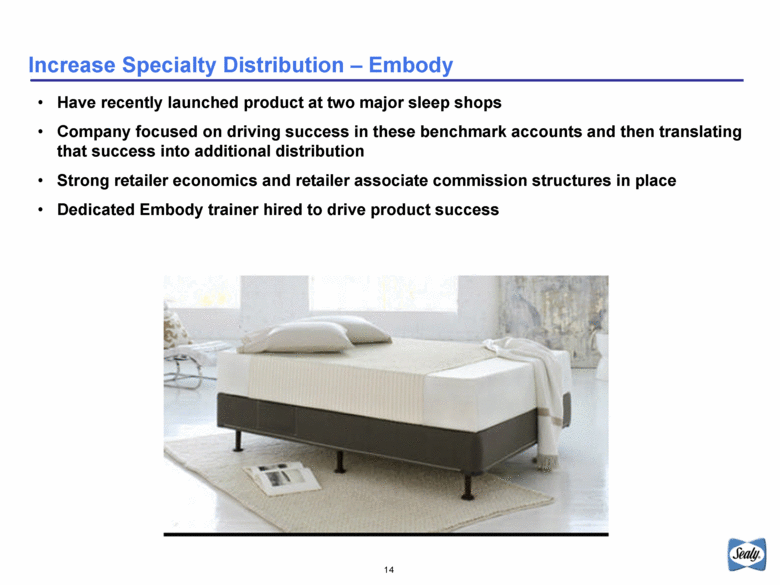
14 Increase Specialty Distribution – Embody Have recently launched product at two major sleep shops Company focused on driving success in these benchmark accounts and then translating that success into additional distribution Strong retailer economics and retailer associate commission structures in place Dedicated Embody trainer hired to drive product success |
|
|
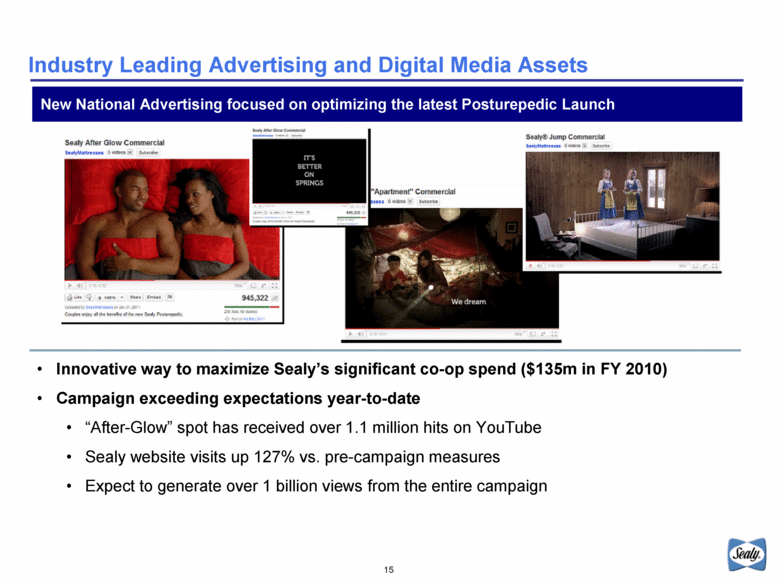
15 Industry Leading Advertising and Digital Media Assets New National Advertising focused on optimizing the latest Posturepedic Launch Innovative way to maximize Sealy’s significant co-op spend ($135m in FY 2010) Campaign exceeding expectations year-to-date “After-Glow” spot has received over 1.1 million hits on YouTube Sealy website visits up 127% vs. pre-campaign measures Expect to generate over 1 billion views from the entire campaign |
|
|
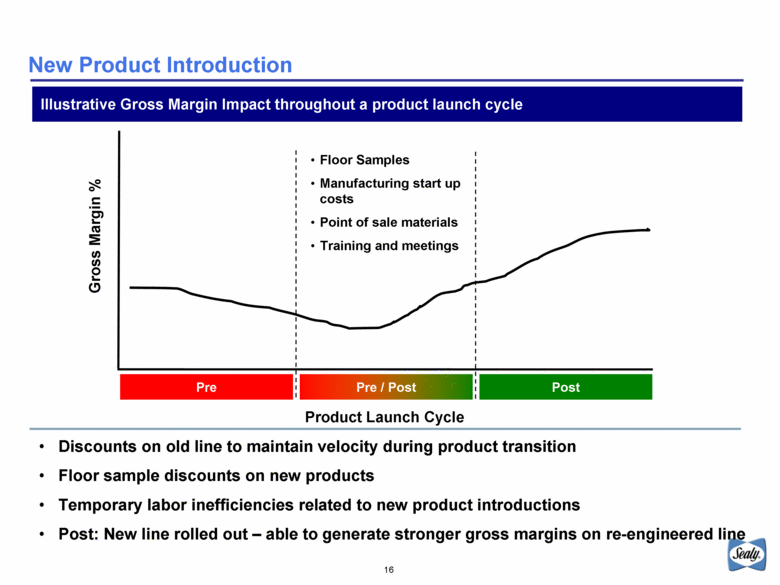
16 New Product Introduction Illustrative Gross Margin Impact throughout a product launch cycle Discounts on old line to maintain velocity during product transition Floor sample discounts on new products Temporary labor inefficiencies related to new product introductions Post: New line rolled out – able to generate stronger gross margins on re-engineered line Gross Margin % Product Launch Cycle Pre / Post Post Pre Floor Samples Manufacturing start up costs Point of sale materials Training and meetings |
|
|
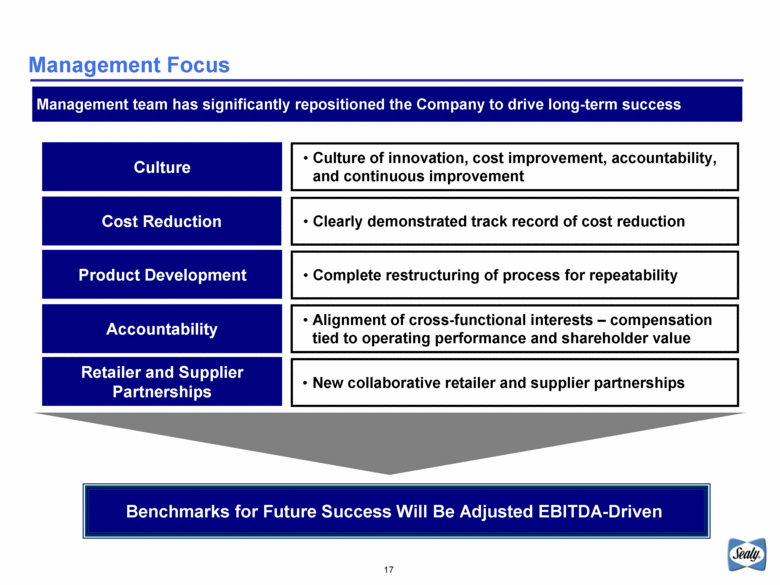
17 Management Focus Culture of innovation, cost improvement, accountability, and continuous improvement Management team has significantly repositioned the Company to drive long-term success Product Development Culture Cost Reduction Accountability Retailer and Supplier Partnerships Benchmarks for Future Success Will Be Adjusted EBITDA-Driven Clearly demonstrated track record of cost reduction Complete restructuring of process for repeatability Alignment of cross-functional interests – compensation tied to operating performance and shareholder value New collaborative retailer and supplier partnerships |
|
|
18 Financial Review |
|
|
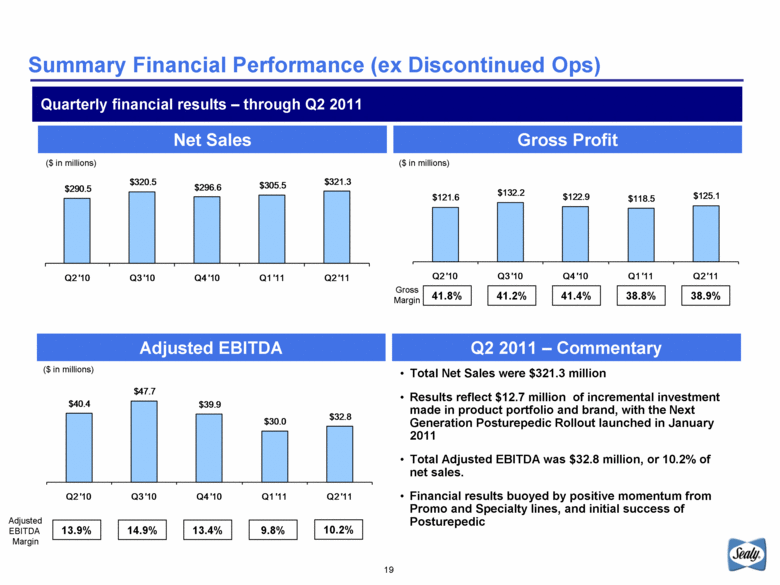
19 Net Sales Summary Financial Performance (ex Discontinued Ops) Quarterly financial results – through Q2 2011 Gross Profit Adjusted EBITDA Q2 2011 – Commentary Total Net Sales were $321.3 million Results reflect $12.7 million of incremental investment made in product portfolio and brand, with the Next Generation Posturepedic Rollout launched in January 2011 Total Adjusted EBITDA was $32.8 million, or 10.2% of net sales. Financial results buoyed by positive momentum from Promo and Specialty lines, and initial success of Posturepedic 13.9% Adjusted EBITDA Margin 14.9% 13.4% ($ in millions) ($ in millions) 41.8% 41.2% 41.4% 38.8% Gross Margin ($ in millions) 9.8% 38.9% 10.2% $290.5 $320.5 $296.6 $305.5 $321.3 Q2 '10 Q3 '10 Q4 '10 Q1 '11 Q2 '11 $40.4 $47.7 $39.9 $30.0 $32.8 Q2 '10 Q3 '10 Q4 '10 Q1 '11 Q2 '11 $121.6 $132.2 $122.9 $118.5 $125.1 Q2 '10 Q3 '10 Q4 '10 Q1 '11 Q2 '11 |
|
|
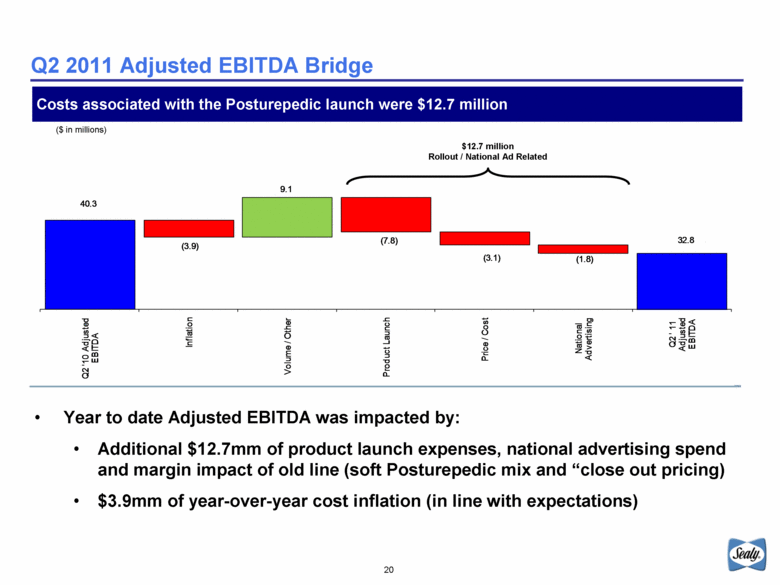
20 Q2 2011 Adjusted EBITDA Bridge Costs associated with the Posturepedic launch were $12.7 million Year to date Adjusted EBITDA was impacted by: Additional $12.7mm of product launch expenses, national advertising spend and margin impact of old line (soft Posturepedic mix and “close out pricing) $3.9mm of year-over-year cost inflation (in line with expectations) ($ in millions) $12.7 million Rollout / National Ad Related ($ in millions) 40.3 (3.9) 9.1 (7.8) (3.1) (1.8) 32.8 Q2 '10 Adjusted EBITDA Inflation Volume / Other Product Launch Price / Cost National Advertising Q2 ' 11 Adjusted EBITDA |
|
|
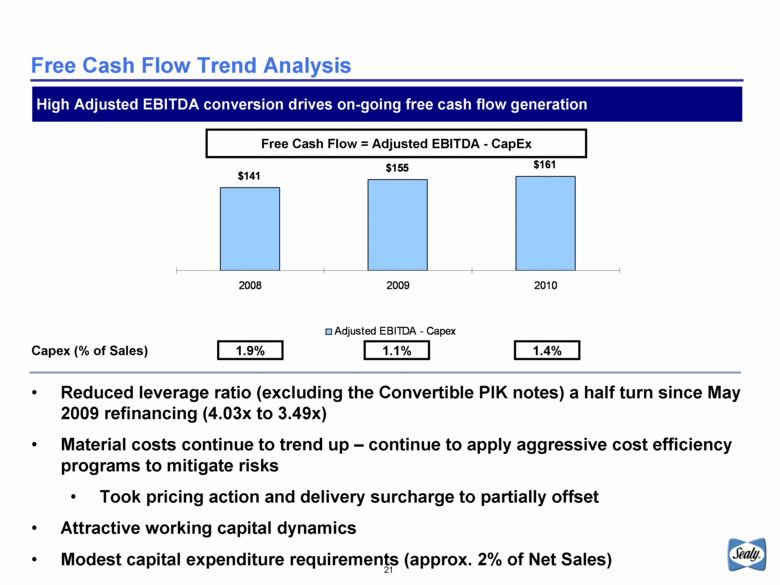
21 Free Cash Flow Trend Analysis Reduced leverage ratio (excluding the Convertible PIK notes) a half turn since May 2009 refinancing (4.03x to 3.49x) Material costs continue to trend up – continue to apply aggressive cost efficiency programs to mitigate risks Took pricing action and delivery surcharge to partially offset Attractive working capital dynamics Modest capital expenditure requirements (approx. 2% of Net Sales) High Adjusted EBITDA conversion drives on-going free cash flow generation Capex (% of Sales) 1.9% 1.1% Free Cash Flow = Adjusted EBITDA - CapEx 1.4% $141 $155 $161 2008 2009 2010 Adjusted EBITDA - Capex |
|
|
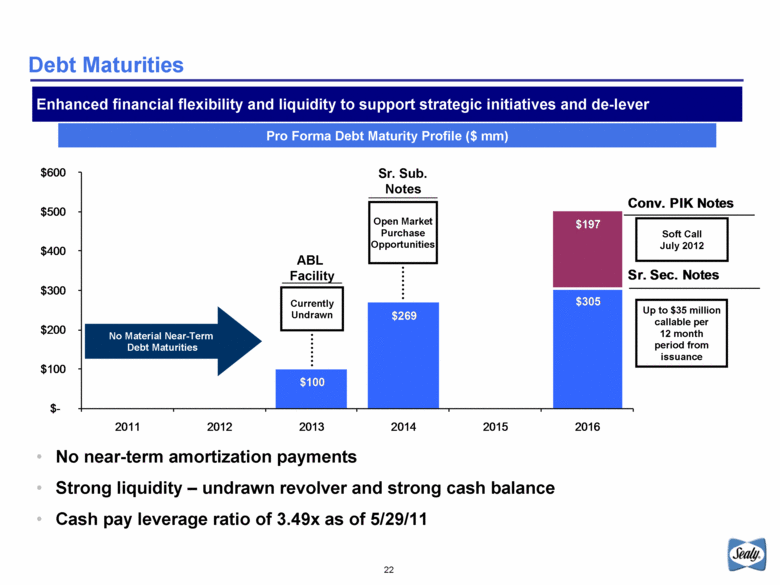
22 Debt Maturities No near-term amortization payments Strong liquidity – undrawn revolver and strong cash balance Cash pay leverage ratio of 3.49x as of 5/29/11 Pro Forma Debt Maturity Profile ($ mm) Enhanced financial flexibility and liquidity to support strategic initiatives and de-lever Currently Undrawn Open Market Purchase Opportunities Soft Call July 2012 Up to $35 million callable per 12 month period from issuance ABL Facility Sr. Sub. Notes No Material Near-Term Debt Maturities $100 $269 $305 $197 $ - $100 $200 $300 $400 $500 $600 2011 2012 2013 2014 2015 2016 Conv. PIK Notes Sr. Sec. Notes |
|
|
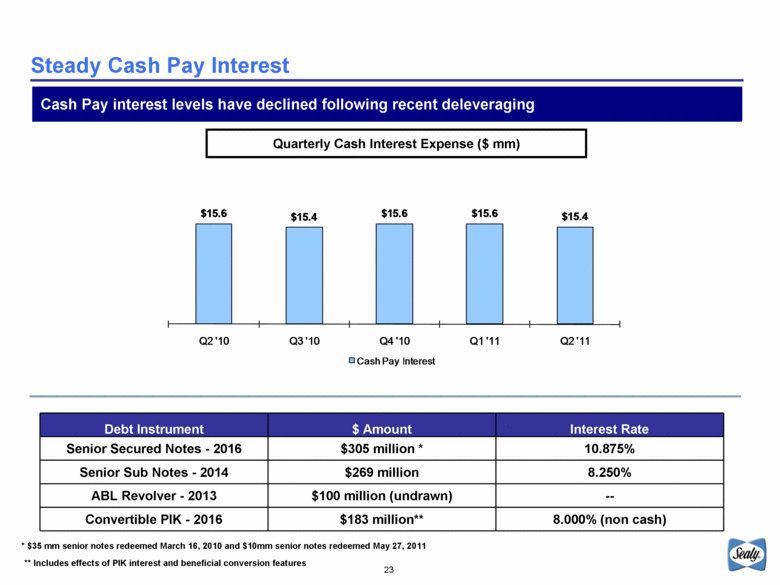
23 Steady Cash Pay Interest Cash Pay interest levels have declined following recent deleveraging Debt Instrument $ Amount Interest Rate Senior Secured Notes - 2016 $305 million * 10.875% Senior Sub Notes - 2014 $269 million 8.250% ABL Revolver - 2013 $100 million (undrawn) — Convertible PIK - 2016 $183 million** 8.000% (non cash) Quarterly Cash Interest Expense ($ mm) * $35 mm senior notes redeemed March 16, 2010 and $10mm senior notes redeemed May 27, 2011 ** Includes effects of PIK interest and beneficial conversion features $15.6 $15.4 $15.6 $15.6 $15.4 Q2 '10 Q3 '10 Q4 '10 Q1 '11 Q2 '11 Cash Pay Interest |
|
|
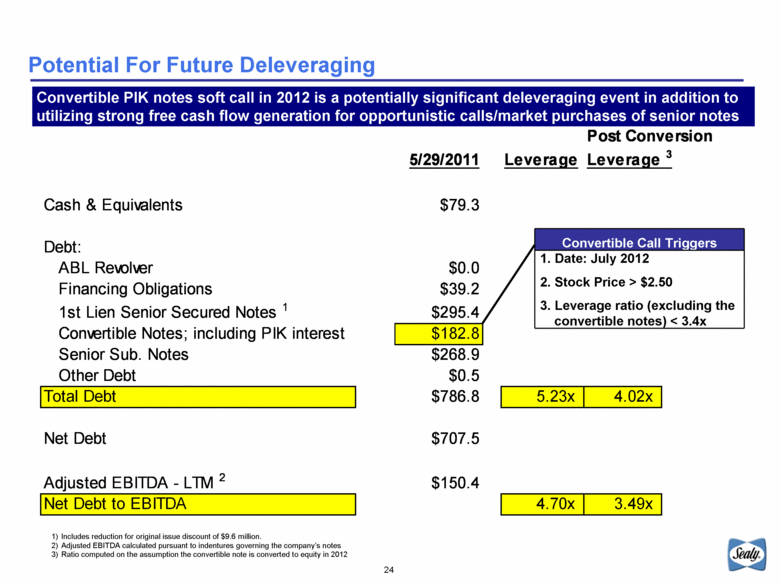
24 Potential For Future Deleveraging Convertible PIK notes soft call in 2012 is a potentially significant deleveraging event in addition to utilizing strong free cash flow generation for opportunistic calls/market purchases of senior notes Includes reduction for original issue discount of $9.6 million. Adjusted EBITDA calculated pursuant to indentures governing the company’s notes Ratio computed on the assumption the convertible note is converted to equity in 2012 Convertible Call Triggers 1. Date: July 2012 2. Stock Price > $2.50 3. Leverage ratio (excluding the convertible notes) < 3.4x Post Conversion 5/29/2011 Leverage Leverage 3 Cash & Equivalents $79.3 Debt: ABL Revolver $0.0 Financing Obligations $39.2 1st Lien Senior Secured Notes 1 $295.4 Convertible Notes; including PIK interest $182.8 Senior Sub. Notes $268.9 Other Debt $0.5 Total Debt $786.8 5.23x 4.02x Net Debt $707.5 Adjusted EBITDA - LTM 2 $150.4 Net Debt to EBITDA 4.70x 3.49x |
|
|
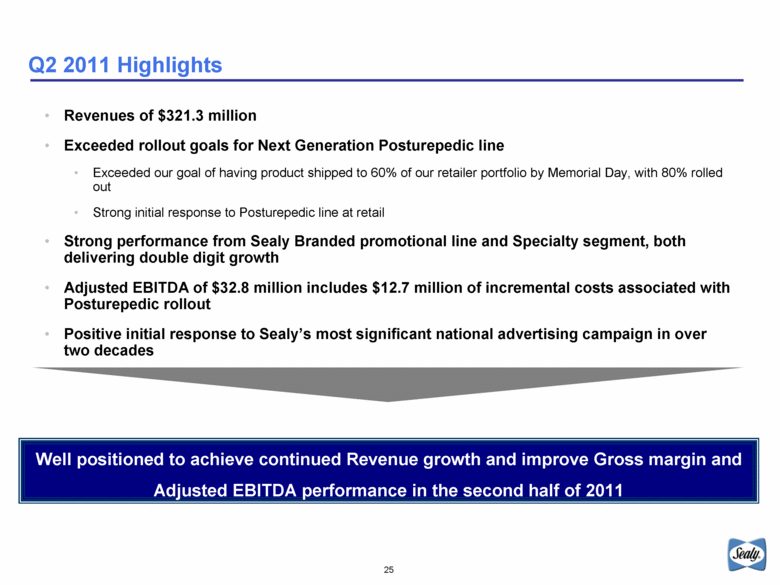
25 Q2 2011 Highlights Revenues of $321.3 million Exceeded rollout goals for Next Generation Posturepedic line Exceeded our goal of having product shipped to 60% of our retailer portfolio by Memorial Day, with 80% rolled out Strong initial response to Posturepedic line at retail Strong performance from Sealy Branded promotional line and Specialty segment, both delivering double digit growth Adjusted EBITDA of $32.8 million includes $12.7 million of incremental costs associated with Posturepedic rollout Positive initial response to Sealy’s most significant national advertising campaign in over two decades Well positioned to achieve continued Revenue growth and improve Gross margin and Adjusted EBITDA performance in the second half of 2011 |
|
|
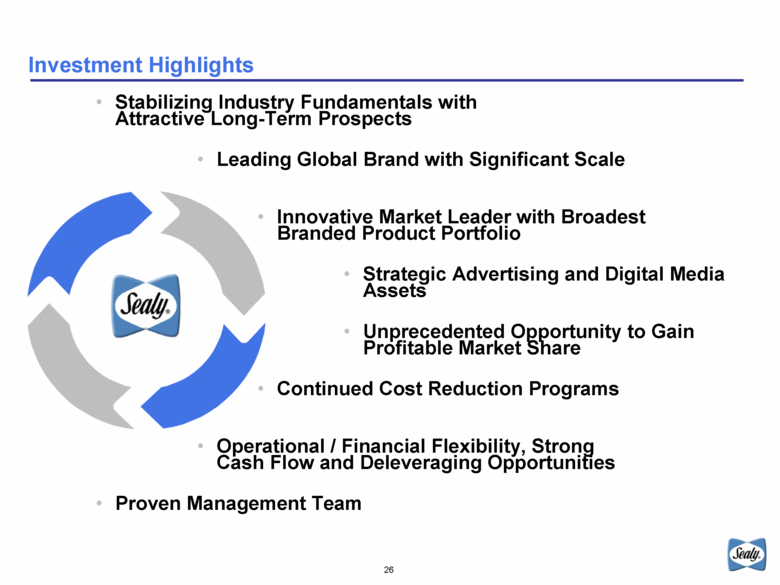
26 Investment Highlights Stabilizing Industry Fundamentals with Attractive Long-Term Prospects Leading Global Brand with Significant Scale Innovative Market Leader with Broadest Branded Product Portfolio Strategic Advertising and Digital Media Assets Unprecedented Opportunity to Gain Profitable Market Share Continued Cost Reduction Programs Operational / Financial Flexibility, Strong Cash Flow and Deleveraging Opportunities Proven Management Team |
|
|
27 Appendix |
|
|
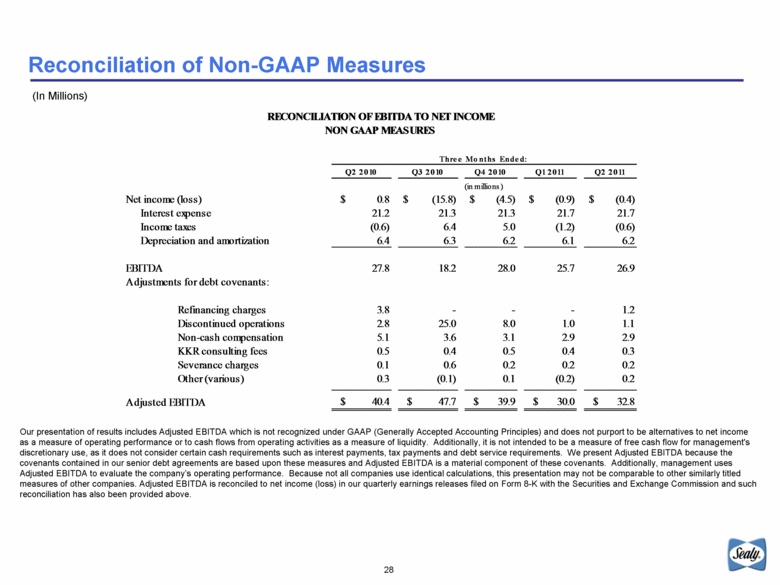
28 Reconciliation of Non-GAAP Measures (In Millions) Our presentation of results includes Adjusted EBITDA which is not recognized under GAAP (Generally Accepted Accounting Principles) and does not purport to be alternatives to net income as a measure of operating performance or to cash flows from operating activities as a measure of liquidity. Additionally, it is not intended to be a measure of free cash flow for management's discretionary use, as it does not consider certain cash requirements such as interest payments, tax payments and debt service requirements. We present Adjusted EBITDA because the covenants contained in our senior debt agreements are based upon these measures and Adjusted EBITDA is a material component of these covenants. Additionally, management uses Adjusted EBITDA to evaluate the company’s operating performance. Because not all companies use identical calculations, this presentation may not be comparable to other similarly titled measures of other companies. Adjusted EBITDA is reconciled to net income (loss) in our quarterly earnings releases filed on Form 8-K with the Securities and Exchange Commission and such reconciliation has also been provided above. Q2 2010 Q3 2010 Q4 2010 Q1 2011 Q2 2011 Net income (loss) $ 0.8 $ (15.8) $ (4.5) $ (0.9) $ (0.4) Interest expense 21.2 21.3 21.3 21.7 21.7 Income taxes (0.6) 6.4 5.0 (1.2) (0.6) Depreciation and amortization 6.4 6.3 6.2 6.1 6.2 EBITDA 27.8 18.2 28.0 25.7 26.9 Adjustments for debt covenants: Refinancing charges 3.8 — — — 1.2 Discontinued operations 2.8 25.0 8.0 1.0 1.1 Non-cash compensation 5.1 3.6 3.1 2.9 2.9 KKR consulting fees 0.5 0.4 0.5 0.4 0.3 Severance charges 0.1 0.6 0.2 0.2 0.2 Other (various) 0.3 (0.1) 0.1 (0.2) 0.2 Adjusted EBITDA $ 40.4 $ 47.7 $ 39.9 $ 30.0 $ 32.8 Three Months Ended: (in millions) RECONCILIATION OF EBITDA TO NET INCOME NON GAAP MEASURES |
|
|
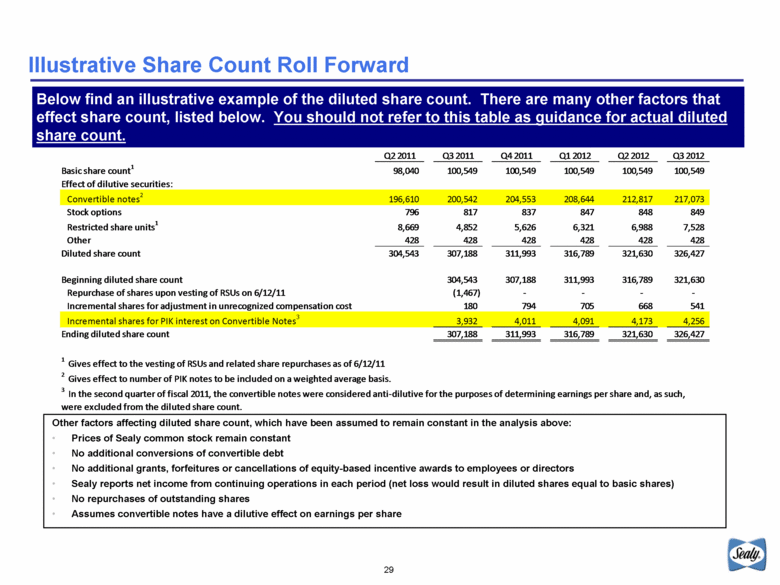
29 Illustrative Share Count Roll Forward Below find an illustrative example of the diluted share count. There are many other factors that effect share count, listed below. You should not refer to this table as guidance for actual diluted share count. Other factors affecting diluted share count, which have been assumed to remain constant in the analysis above: Prices of Sealy common stock remain constant No additional conversions of convertible debt No additional grants, forfeitures or cancellations of equity-based incentive awards to employees or directors Sealy reports net income from continuing operations in each period (net loss would result in diluted shares equal to basic shares) No repurchases of outstanding shares Assumes convertible notes have a dilutive effect on earnings per share Q2 2011 Q3 2011 Q4 2011 Q1 2012 Q2 2012 Q3 2012 Basic share count 1 98,040 100,549 100,549 100,549 100,549 100,549 Effect of dilutive securities: Convertible notes 2 196,610 200,542 204,553 208,644 212,817 217,073 Stock options 796 817 837 847 848 849 Restricted share units 1 8,669 4,852 5,626 6,321 6,988 7,528 Other 428 428 428 428 428 428 Diluted share count 304,543 307,188 311,993 316,789 321,630 326,427 Beginning diluted share count 304,543 307,188 311,993 316,789 321,630 Repurchase of shares upon vesting of RSUs on 6/12/11 (1,467) — — — — Incremental shares for adjustment in unrecognized compensation cost 180 794 705 668 541 Incremental shares for PIK interest on Convertible Notes 3 3,932 4,011 4,091 4,173 4,256 Ending diluted share count 307,188 311,993 316,789 321,630 326,427 1 Gives effect to the vesting of RSUs and related share repurchases as of 6/12/11 2 Gives effect to number of PIK notes to be included on a weighted average basis. 3 In the second quarter of fiscal 2011, the convertible notes were considered anti-dilutive for the purposes of determining earnings per share and, as such, were excluded from the diluted share count. |
|
|
July 2011 |

