Attached files
| file | filename |
|---|---|
| EX-23.1 - EX-23.1 - SEALY CORP | a2201619zex-23_1.htm |
| EX-31.2 - EX-31.2 - SEALY CORP | a2201619zex-31_2.htm |
| EX-12.1 - EX-12.1 - SEALY CORP | a2201619zex-12_1.htm |
| EX-21.1 - EX-21.1 - SEALY CORP | a2201619zex-21_1.htm |
| EX-10.41 - EX-10.41 - SEALY CORP | a2201619zex-10_41.htm |
| EX-10.39 - EX-10.39 - SEALY CORP | a2201619zex-10_39.htm |
| EX-10.38 - EX-10.38 - SEALY CORP | a2201619zex-10_38.htm |
| EX-10.40 - EX-10.40 - SEALY CORP | a2201619zex-10_40.htm |
| EX-31.1 - EX-31.1 - SEALY CORP | a2201619zex-31_1.htm |
| EX-32.1 - EX-32.1 - SEALY CORP | a2201619zex-32_1.htm |
QuickLinks -- Click here to rapidly navigate through this document
UNITED STATES
SECURITIES AND EXCHANGE COMMISSION
WASHINGTON, D.C. 20549
FORM 10-K
| ý | ANNUAL REPORT PURSUANT TO SECTION 13 OR 15(d) OF THE SECURITIES EXCHANGE ACT OF 1934 | |
For the fiscal year ended November 28, 2010 |
||
o |
TRANSITION REPORT PURSUANT TO SECTION 13 OR 15(d) SECURITIES EXCHANGE ACT OF 1934 |
|
For the Transition Period from to |
||
Commission file number 333-117081-27 |
||
SEALY CORPORATION
(Exact name of registrant as specified in its charter)
| Delaware | 36-3284147 | |
| (State or other jurisdiction of incorporation or organization) |
(I.R.S. Employer Identification No.) | |
Sealy Drive One Office Parkway Trinity, North Carolina |
27370 |
|
| (Address of principal executive offices) | (Zip Code) | |
Registrant's telephone number, including area code (336) 861-3500 |
||
Securities registered pursuant to Section 12(b) of the Act: |
||
Title of Each Class |
Name of Each Exchange on which Registered |
|
|---|---|---|
| Common Stock, par value $0.01 per share | New York Stock Exchange | |
Securities registered pursuant to Section 12(g) of the Act: None |
||
Indicate by check mark if the registrant is a well-known seasoned issuer as defined in Rule 405 of the Securities Act Yes o No ý
Indicate by check mark if the registrant is not required to file reports pursuant to Section 13 or Section 15(d) of the Act. Yes o No ý
Indicate by check mark whether the registrant (1) has filed all reports required to be filed by Section 13 or 15(d) of the Securities Exchange Act of 1934 during the preceding 12 months (or for such shorter period that the registrant was required to file such reports), and (2) has been subject to such filing requirements for the past 90 days. Yes ý No o
Indicate by check mark whether the registrant has submitted electronically and posted on its corporate Website, if any, every Interactive Data File required to be submitted and posted pursuant to Rule 405 of Regulation S-T during the preceding 12 months or(or for such shorter period that the registrant was required to submit and post such files). Yes o No o
Indicate by check mark if disclosure of delinquent filers pursuant to Item 405 of Regulation S-K is not contained herein, and will not be contained, to the best of registrant's knowledge, in definitive proxy or information statements incorporated by reference in Part III of this Form 10-K or any amendment to this Form 10-K. o
Indicated by check mark whether the registrant is a large accelerated filer, an accelerated filer, a non-accelerated filer, or a smaller reporting company. See definitions of "large accelerated filer," "accelerated filer," and "smaller reporting company" in Rule 12b-2 of the Exchange Act.
| Large accelerated filer o | Accelerated filer ý | Non-accelerated filer o (Do not check if a smaller reporting company) |
Smaller reporting company o |
Indicate by check mark whether registrant is a shell company (as defined in Rule 12b-2 of the Act). Yes o No ý
The aggregate market value of the registrant's voting and non-voting common equity held by non-affiliates as of May 30, 2010 was $157,026,773.
The number of shares of the registrant's common stock outstanding as of January 4, 2011 is approximately: 97,852,341.
DOCUMENTS INCORPORATED BY REFERENCE:
Portions of the Registrant's definitive proxy statement to be filed with the Securities and Exchange Commission ("SEC") pursuant to Regulation 14A related to the Registrant's 2011 Annual Meeting of Stockholders are incorporated by reference in Part III of this Form 10-K to the extent described herein. The definitive proxy statement will be filed with the SEC not later than 120 days after the registrant's fiscal year ended November 28, 2010.
General
Sealy Corporation (hereinafter referred to as the "Company", "Sealy", "we", "our", or "us"), a Delaware corporation organized in 1984, owns the largest bedding brand in the world (Sealy®). Based on Furniture/Today, a furniture industry publication, we are also the leading bedding manufacturer in the United States with a wholesale market share of approximately 19.6% in 2009.
We manufacture and market a complete line of bedding products, including mattresses and mattress foundations. Our conventional (innerspring) bedding products are manufactured and marketed in the Americas under our Sealy, Sealy Posturepedic, Stearns & Foster and Bassett brand names. In addition, we manufacture and market specialty (non-innerspring) latex and visco-elastic bedding products under the Embody, Stearns & Foster, Reflexions, Carrington Chase, and MirrorForm brand names, which we sell in the specialty bedding category in the United States and internationally.
We believe that our Sealy brand name has been the number one selling brand in the domestic bedding industry for over 25 years and our Stearns & Foster brand name is one of the leading brands devoted to the attractive luxury category, which sells at higher price points in the industry. We believe that going to market with the best selling and most recognized brand in the domestic bedding industry (Sealy), one of the leading luxury brands (Stearns & Foster), and differentiated specialty bedding offerings gives us a competitive advantage and strengthens our relationships with our customers by allowing us to offer sleep solutions to a broad group of consumers.
In November 2010, the Company divested the assets of our European manufacturing operations in France and Italy which represented our Europe segment. The Company also discontinued our operations in Brazil in the fourth quarter of fiscal 2010. In both of these markets, the Company has transitioned to a license arrangement with third parties. We accounted for these businesses as discontinued operations, and, accordingly, we have reclassified the financial results for all periods presented to reflect them as such. Unless otherwise noted, discussions in this Form 10-K pertain to our continuing operations.
We are subject to the informational requirements of the Securities Exchange Act of 1934 and, in accordance therewith, file reports, including annual, quarterly and current reports, proxy statements, any amendments to these reports and other information with the Securities and Exchange Commission ("SEC") Such reports and other information can be inspected and copied at the Public Reference Room of the SEC located at 100 F Street, N.E., Washington, D.C. 20549. You may obtain information on the operation of the Public Reference Room by calling the SEC at 1-800-SEC-0330. Such material may also be accessed electronically by means of the SEC's home page on the Internet at http://www.sec.gov. In addition, we maintain an internet website at www.sealy.com. We make available on our website, our annual report on Form 10-K, quarterly reports on Form 10-Q, current reports on Form 8-K, Proxy Statements, other reports, and any amendments to these reports as soon as reasonably practicable after they are electronically filed or furnished to the SEC.
Debt Refinancing
On May 13, 2009, we announced a comprehensive plan to refinance our existing senior secured credit facilities and replace them with indebtedness that has longer-dated maturities and eliminates quarterly financial ratio based maintenance covenants (the "Refinancing"). Through the Refinancing, we: 1) entered into a new asset-based revolving credit facility (the "ABL Revolver") which provides commitments of up to $100.0 million maturing in May 2013; 2) issued $350.0 million in aggregate principal amount of senior secured notes due April 2016 (the "Senior Notes"); and 3) issued $177.1 million in aggregate principal amount of senior secured convertible paid in kind ("PIK") notes
1
due July 2016 pursuant to a rights offering to all existing shareholders of the Company (the "Convertible Notes"). The proceeds from the Refinancing were used to repay all of the outstanding amounts due under our previously existing senior secured credit facilities, which consisted of a $125 million senior revolving credit facility and senior secured term loans, and to increase cash for general operating purposes.
Through a merger with affiliates of Kohlberg Kravis Roberts & Co. L.P. ("KKR") in 2004, KKR acquired approximately 92% of the Company's capital stock. Subsequent to the initial public offering in 2006, KKR's ownership decreased. At November 28, 2010, affiliates of KKR controlled approximately 47.7% of our issued and outstanding common stock.
Our Segments
In prior years, we had two reportable segments: the Americas and Europe. These segments were identified and aggregated based on our organizational structure, which is organized around geographic areas. During fiscal 2010, we divested the assets of our European manufacturing operations in France and Italy which represented our Europe segment. In 2010, we also discontinued our operations in Brazil and transitioned to a license arrangement with third parties in this market. The remaining operations are deemed to meet the criteria for aggregation under the applicable authoritative guidance and as such, these operations are reported as one segment within the Consolidated Financial Statements in Item 8. From a geographical perspective, our operations are concentrated in the United States, Canada, Mexico, Argentina, Uruguay, Chile and Puerto Rico, with our dominant operations being in the United States (also referred to as "Domestic" herein). For more information regarding revenues and assets by geographical area, see Note 21 to our Consolidated Financial Statements in Item 8.
Products
We produce sleep sets across a range of technologies, including innerspring, latex foam and visco-elastic "memory foam" and sell them in diverse geographies in North and South America. While our strategy is to drive sales growth through domestic specialty products, the majority of our products continue to be in the domestic innerspring market where we offer a complete line of innerspring bedding products in sizes ranging from twin to king size, selling at retail price points from under $300 to approximately $5,000 per queen set domestically. While we sell conventional innerspring products at all retail price points, we focus our product development and sales efforts toward mattress and box spring sets that sell at retail price points above $750 domestically. During fiscal 2010, we have seen increases in sales of product at the higher and lower end price points. In order to capture this growth potential, we have introduced new products in fiscal 2010 which are focused on the specialty category at luxury price points and innerspring products at value price points. We believe that these products have been well received by customers. For fiscal 2010, we derived approximately 65% of our total domestic sales from products with retail price points of $750 and above.
Our product development efforts include regular introductions across our product lines in order to maintain the competitiveness and the profitability of our products. In the past two years alone, we have introduced several new products including: 1) our redesigned Stearns & Foster product line which features our Variable Response Technology foam to provide a softer, more indulgent sleep surface, 2) three new Stearns & Foster models to target the upper-end luxury price points, 3) Embody by Sealy, a premium specialty brand featuring memory foam and latex technologies, 4) new 60th anniversary Posturepedic innerspring products and 5) new Sealy branded promotional bedding at lower retail prices. Further, in fiscal 2011, we plan to introduce our Next Generation Posturepedic line which comprises the largest portion of our portfolio.
2
We also produce a variety of innovative latex foam, and visco-elastic "memory foam" bedding products for the specialty bedding category. While the specialty bedding category saw significant decreases in calendar 2009, specialty sales have significantly recovered during the first three quarters of calendar 2010. For the first nine months of calendar 2010, specialty bedding sales reported by International Sleep Products Association ("ISPA") increased 29.5% compared to an increase of 2.7% for conventional mattress sales. In order to take advantage of this growth, we introduced Embody by Sealy, during fiscal 2010. Embody by Sealy is a single premium specialty brand that encompasses both memory foam and latex technologies and features products at retail price levels ranging from $1,999 to $3,299 per queen set. We believe that this product line serves the dual purpose of strengthening our market position within both the premium price points of the market and the specialty products arena. In our international markets, we also offer a wide range of products including a full line of innerspring and specialty products under the Sealy and local brand names.
Customers
Our five largest customers on a consolidated basis accounted for approximately 36.9% of our net sales for fiscal 2010 with one customer (Costco), representing more than 10% of our net sales during fiscal 2010. While we believe our relationships with these customers are stable, many arrangements are made by purchase order or are terminable at will at the option of either party. In the U.S., we serve a large and well diversified base of approximately 3,000 customers, including furniture stores, specialty bedding stores, department stores and warehouse club stores. While we have seen some improvement in the credit environment through 2010, the continued management of credit risk by financial institutions has caused a decrease in the availability of credit for mattress retailers. In certain instances, this has caused mattress retailers to exit the market or be forced into bankruptcy. Furthermore, many of our customers rely in part on consumers' ability to finance their mattress purchases with credit from third parties.
We continue to remain focused on monitoring our customer relationships and working with our customers during these unpredictable and difficult times. We have been able to maintain a leading market share among the top 25 U.S. bedding retailers by wholesale sales dollars. We believe this is due, in part, to the strength of our customer relationships, our large and well trained sales force, effective marketing, leading brand names and a broad portfolio of quality product offerings.
We believe our sales force is the largest and best trained in the U.S. bedding industry, as evidenced by our high market share among our major retail accounts, new account growth and strong customer retention rates. Our sales strategy supports strong retail relationships through the use of cooperative advertising programs, in-store product displays, and sales associate training to support our multiple brand platforms. A key component of our sales strategy is the leveraging of our portfolio of multiple leading brands across the full range of retail price points to capture and retain profitable long term customer relationships.
Sales and Marketing
Our sales depend primarily on our ability to provide quality products with recognized brand names at competitive prices. Additionally, we work to build brand loyalty with our end-use consumers, principally through cooperative advertising with our dealers, along with superior "point-of-sale" materials designed to emphasize the various features and benefits of our products that differentiate them from other brands and targeted in-country national advertising.
In 2011, we will be launching a fresh and innovative new national advertising campaign and product line for our flagship Posturepedic brand. From the new product aesthetics to the marketing and integral use of social media in connecting with consumers, everything in preparation for the Sealy
3
Posturepedic launch has been thoughtfully planned to transform the way consumers think about the brand.
In the U.S., we have two sales structures, customer aligned and geographically aligned. Our national account and regional account sales forces are organized along customer lines, and our field sales force is generally structured based on regions of the country and districts within those regions. These sales forces are measured on sales and customer profitability performance. We have a comprehensive training and development program for our sales force, including our University of Sleep curriculum, which provides ongoing training sessions with programs focusing on advertising, merchandising and sales education, including techniques to help optimize a dealer's business and profitability.
Our sales force emphasizes follow-up service to retail stores and provides retailers with promotional and merchandising assistance, as well as extensive specialized professional training and instructional materials. Training for retail sales personnel focuses on several programs designed to assist retailers in maximizing the effectiveness of their own sales personnel, store operations, and advertising and promotional programs, thereby creating loyalty to, and enhanced sales of, our products.
Operations
We manufacture and distribute products to our customers primarily on a just-in-time basis from our network of 27 company-operated bedding and component manufacturing facilities located around the world. We manufacture most bedding to order and employ just-in-time inventory techniques in our manufacturing process to more efficiently serve our dealers' needs and to minimize their inventory carrying costs. Most bedding orders are scheduled, produced and shipped within five business days of receipt from our plants located in close proximity to a majority of our customers. We believe there are a number of important advantages to this operating model such as the ability to provide superior service and custom products to regional, national and global accounts, a significant reduction in our required inventory investment and short delivery times. We believe these operating capabilities, and the ability to serve our customers, provide us with a competitive advantage.
We believe we are the most vertically integrated U.S. manufacturer of innerspring and latex components. We distinguish ourselves from our major competitors by maintaining our own component parts manufacturing capability for producing substantially all of our mattress innerspring and latex component parts requirements. This vertical integration lessens our reliance upon certain key suppliers to the innerspring bedding manufacturing industry and provides us with the following competitive advantages:
- •
- procurement advantage by lessening our reliance upon industry suppliers and thus increasing our flexibility in production;
- •
- production cost advantage via cost savings directly related to our vertically integrated components production
capabilities; and
- •
- response time advantage by improving our ability to react to shifts in market demands, thus improving time to market.
Sources and Availability of Raw Materials and Suppliers
Our primary raw materials consist of polyurethane foam, polyester, polyethylene foam and steel innerspring components which we purchase from various suppliers. In the U.S., we rely upon a single supplier for certain polyurethane foam components in our mattress units. Such components are purchased under a supply agreement. We continue to develop alternative supply sources, allowing acquisition of similar component parts that meet the functional requirements of various product lines. We also purchase a significant portion of our box spring parts from third party sources under supply
4
agreements which require that we maintain certain volume allocations based on a proportional amount of the material purchases. These volume allocations do not represent fixed purchase commitments. We are also dependent on a single supplier for the visco-elastic components and assembly of our TrueForm and Embody specialty product lines. Except for our dependence regarding polyurethane foam, visco-elastic components and assembly of our TrueForm and Embody specialty product lines, we do not consider ourselves to be dependent upon any single outside vendor as a source of supply to our bedding business, and we believe that sufficient alternative sources of supply for the same, similar or alternative components are available.
International
We derived approximately 22.0% of our fiscal 2010 net sales internationally, primarily from Canada. We attribute Canadian revenue from external customers based on the sales of the three manufacturing facilities located in Canada. We also generate income from royalties by licensing our brands, technology and trademarks to other manufacturers, including twelve international independent licensees.
We have 100% owned subsidiaries in Canada, Mexico, Puerto Rico, Argentina, Uruguay and Chile which have marketing and manufacturing responsibilities for those markets. We have three manufacturing and distribution center facilities in Canada and one each in Mexico, Puerto Rico, Argentina, and Uruguay, which comprise all of the company-owned manufacturing operations outside of the U.S. at November 28, 2010.
We also participate in a group of joint ventures with our Australian licensee to import, manufacture, distribute and sell Sealy products in Southeast Asia. On December 1, 2008, we sold a 50% interest in our operations in South Korea for $1.4 million to our Australian licensee and these operations became part of the group of joint ventures. The South Korean operation principally consists of a sales office that uses a contract manufacturer to service the South Korean market. On December 4, 2008, we acquired a 50% interest in a joint venture with our Australian licensee which owns the assets of our New Zealand licensee for $1.9 million. Additionally, our China joint venture recently announced its plans to open a manufacturing facility in China in order to better serve this growing market and increase the presence of the Sealy brand in this area. In addition to the above, we also ship products directly into many small international markets.
Our international operations are subject to the risks of operating in an international environment, including the potential imposition of trade or foreign exchange restrictions, tariff and other tax increases, fluctuations in exchange rates, inflation and unstable political situations, see "Risk Factors" in Item 1A.
For information regarding revenues and long lived assets by geographic area, see "Management's Discussion and Analysis of Financial Condition and Results of Operations—Results of Operations" in Item 7 as well as Note 21 to our Consolidated Financial Statements in Item 8.
Bedding Industry
General
Our U.S. business represents the dominant portion of our operations. The U.S. bedding industry generated wholesale revenues of approximately $5.7 billion during the calendar year 2009, according to ISPA. Based on a sample of leading mattress manufacturers, including Sealy, ISPA estimates that wholesale revenues for these manufacturers decreased approximately 9.4% in 2009. This trend appears to have reversed in 2010 and based on information published by ISPA, during the first nine months of calendar 2010, the sample of leading mattress manufacturers has seen an increase in volume, which has
5
caused wholesale revenues to increase approximately 8.0% from the revenues experienced in the first nine months of 2009.
One of our main operating strategies is to maintain a wide breadth of product offerings at various price points. In keeping with this strategy, we have continued our new product introductions during 2010 which include Sealy branded product at lower price points and our Embody specialty product which is at higher price points. We plan to continue to introduce new and innovative products in future periods including our Next Generation Posturepedic line in fiscal 2011. We believe that there continues to be significant growth opportunities at the premium end of the market (that is, retail prices greater than $750 per queen size set) as consumer sentiment strengthens. According to ISPA, mattress units sold in the United States by manufacturers at retail price points of at least $1,000, as a percentage of total industry mattress units sold, rose from 20.9% in 2004 to 23.3% in 2009. However, this growth was significantly impacted by the economic downturn in 2009 which drove a decrease in sales of 3.3% for this portion of the market as many consumers shifted to lower price points during this timeframe. During 2010, the upper end of the market has been recovering and is expected to return to previous growth levels. For 2009, the ISPA retail price point shipment data was based on data representing 44.5% of total industry units shipped. Additionally, queen and king size mattress units sold in the United States, as a percentage of total mattress units sold, rose from 46.4% in 2004 to 48.4% in 2009, according to ISPA. During the first nine months of calendar 2010, the domestic innerspring market has seen sales increases of approximately 2.7%.
The specialty bedding category, which represents non-innerspring bedding products including visco-elastic ("memory foam"), latex foam and other mattress products, accounted for approximately 16.7% of the overall U.S. mattress market revenue in 2009, according to ISPA. The strength of the specialty bedding category has seen significant increases in the first nine months of 2010 with wholesale revenue for specialty bedding from a sample of leading manufacturers increasing 29.5% from the levels experienced in the first nine months of 2009.
Competition
The bedding industry is highly competitive and we encounter competition from many manufacturers in both domestic and foreign markets. Manufacturers in the industry principally compete by developing new products and distributing these new products in retail outlets. While many bedding manufacturers, including Sealy, offer multiple types of bedding products, some of our competitors focus on single product types. The single product focus of these competitors may afford them with a competitive advantage, particularly in the specialty bedding market, but we believe going to market with the best selling and most recognized brand in the domestic bedding industry (Sealy) and differentiated specialty bedding offerings provides us a competitive advantage. We, together with Simmons Company and Serta, Inc., collectively accounted for approximately 51.0% of wholesale bedding industry revenues in 2009, based on figures obtained from ISPA and Furniture/Today industry publications. See "Risk Factors—The bedding industry is highly competitive, and if we are unable to compete effectively, we may lose customers and our sales may decline" in Item 1A below.
Our Strategy
We expect to deliver sales growth from three sources: U.S. innerspring products, U.S. specialty products and our International markets. To accomplish this, we intend to leverage our intellectual property, scale and vertical integration to grow profitable market share, and develop and launch innovative products. We believe these actions will allow us to maintain our leading position in the industry.
6
Grow profitable market share
We continue to focus on profitable market share growth through an emphasis on account penetration, new distribution and product launch execution.
As the largest bedding manufacturer in the world, the Sealy brand is well known by retailers and consumers in the United States, Canada and Mexico. In the United States, Sealy is the most recognized mattress brand in the industry. This position is coupled with the largest sales and training team in the United States bedding industry which we use to provide training and support at the store level for large and small customers. Effective training of the retail sales associates allows them to better educate consumers, who can in turn make more informed decisions when purchasing a Sealy product.
By continuing to develop new advertising and marketing strategies for our brands, we hope to better connect directly with consumers and motivate them to visit our retail partners which will drive increased sales of our product for our existing retail partners and encourages distribution of our product to new retail partners.
Our sales force works with each retailer to identify the best merchandise for its clientele and leverage our media assets to design successful promotions that maximize sales volumes. Our operations team works to deliver high quality product and ensure rapid replenishment to minimize a retailer's investments in inventory.
Develop and launch innovative products
We invest in the people, processes and resources necessary to build and maintain a steady stream of innovative new products that are preferred by consumers and our retail customers. With superior, innovative product, we intend to maintain a disproportionate share of the premium-priced products in the market. Our New Product Development ("NPD") process emphasizes five key areas to improve the probability of success with each product that we launch.
- •
- identifying product benefits that appeal most to consumers and retailers;
- •
- designing unique product attributes that deliver the identified benefits;
- •
- testing the durability and quality of individual materials, components and complete system designs;
- •
- conducting extensive consumer, retail customer and manufacturability tests; and
- •
- managing product development and execution to ensure an effective product launch.
In designing our products, we use a cross-functional team of Sealy resources supported on an as-needed basis by external industrial design firms, consumer researchers and development teams from current and prospective suppliers as well as back health experts such as orthopedic surgeons, chiropractors and physical therapists. To initiate the process, we conduct extensive consumer testing research to identify the processes and tools consumers use in making their purchasing decisions and the product features and benefits they value most. The output of this testing is used by the cross-functional team to develop proprietary attributes that distinguish our products in the minds of the consumers and retailers from others in the market. By developing attributes that provide demonstrable performance and quality benefits, we expect retail sales associates to be better able to sell our products and end consumers to find them more desirable.
The development of unique product attributes often involves the use of new materials and components. Before settling on specific materials or components that have the desired performance characteristics, the teams test the performance characteristics and durability of the individual materials, then as components and finally as a complete system. We also perform other extensive quantitative tests, some of which are proprietary, in our own labs to predict the expected performance profile of the design over the life of the mattress.
7
At various stages throughout the development process, we evaluate the look, feel and performance of prototypes with consumer and retailer focus groups. These tests allow us to identify preferences for specific attributes and designs. In parallel with these efforts, each design is evaluated for manufacturability to ensure that the ultimate design can be made efficiently and consistent with our quality standards.
During fiscal 2010, we utilized the above NPD process to introduce Embody by Sealy, a single premium specialty brand that encompasses both memory foam and latex technologies. The Embody line features products at retail price levels ranging from $1,999 to $3,299 per queen set. We believe that this product line serves a dual purpose to strengthen our market position both within the premium price points of the market and the specialty products arena.
We also introduced a new Sealy branded line of products during fiscal 2010. This line features products at retail price points from $250 to $750, per queen set. We believe that this product line serves to strengthen our market position within the value price points of the markets.
For the upcoming year 2011, we plan to launch our Next Generation Posturepedic line which is the single largest product line in our portfolio. This line of products will incorporate the knowledge gained from our consumer research and product reviews with key retail partners as well as new benefits and technologies developed specifically for this line.
To maximize the effectiveness and execution of our new product launches, we maintain a strong alignment between our operations, marketing, and sales functions. The alignment of these departments serves to ensure that each retailer has the right, high-quality merchandise displayed with best-in-class point of sale materials and supported by marketing activities that motivate consumers to ask for our products by name.
Aggressively manage the cost structure to improve operating margin
Over the past few years, we have implemented actions designed to reduce our fixed operating, selling, logistics and infrastructure costs, as well as product launch costs. Our actions have focused primarily on controlling costs, organizational realignments, and more efficient product launches in the U.S. Through these actions, we have streamlined our workforce and have worked to reduce discretionary expenses without sacrificing our execution or performance. We have implemented new processes and selectively automated others to improve process quality and the productivity of our associates.
We continue to leverage our vertical integration into the manufacturing of innersprings and latex foam to better control the design and costs of these components. Our expertise in these areas enables us to refine existing component designs and develop and manufacture proprietary designs, such as the IntelliCoil ®, while better controlling related costs.
We will also continue to leverage our scale and purchasing power to source technology and materials globally, acquire best-in-class equipment and buy in quantities sufficient to obtain the best pricing possible.
Maximize cash flows
Our business model relies in part on minimizing investments in working capital and capital expenditures to maximize cash flow. Our supply chain is designed to receive raw materials and ship finished goods on a just-in-time basis. By purchasing raw materials only when they are needed, we minimize our investment in inventory and material handling costs. Furthermore, we produce our finished goods on a make-to-order basis, which minimizes the level of finished goods inventory carried by us and our retail partners. Our lean approach to manufacturing also emphasizes productivity improvements that do not require intensive capital investments.
8
To increase shareholder value, we intend to utilize our cash flows to reduce our outstanding debt balances, drive an improvement in our leverage ratios and reduce our cash interest expense. During fiscal 2010, we elected to redeem 10%, or $35.0 million, of the principal amount of the Company's outstanding Senior Notes at a redemption price of 103% of the principal amount of the notes, plus accrued and unpaid interest to the redemption date. In future periods, such opportunities may include the redemption or repurchase of a portion of our Senior Notes, the 2014 Notes or the Convertible Notes to the extent permitted by our debt covenants.
Other Company Information
Licensing
At November 28, 2010, there were 18 separate license arrangements in effect with 6 domestic and 12 foreign independent licensees. Sealy New Jersey (a bedding manufacturer), Klaussner Corporation Services (a furniture manufacturer), Kolcraft Enterprises, Inc. (a crib mattress manufacturer), Pacific Coast Feather Company (a pillow, comforter and mattress pad manufacturer), Chairworks Manufacturing Group Limited (an office seating manufacturer), and Mantua Manufacturing Co. (a bed frame manufacturer) are the only domestic manufacturers that are licensed to use the Sealy trademark, subject to the terms of license agreements. Pacific Coast Feather also has a license to use the Stearns & Foster brand on certain approved products. Under license agreements between Sealy New Jersey and us, Sealy New Jersey has the perpetual right to use certain of our trademarks in the manufacture and sale of Sealy brand and Stearns & Foster brand products in selected markets in the United States.
Our 12 foreign license agreements provide exclusive rights to market the Sealy brand in Thailand, Japan, the United Kingdom, Continental European Union countries, Brazil, Australia, South Africa, Israel, Saudi Arabia, Jamaica, Bahamas and the Dominican Republic. These licensing agreements allow us to reduce our exposure to political and economic risk abroad by minimizing investments in those markets.
Our licensing group generates royalties by licensing Sealy brand technology and trademarks to manufacturers located throughout the world. We also provide our licensees with product specifications, research and development, statistical services and marketing programs. In the fiscal years ended November 28, 2010, November 29, 2009 and November 30, 2008, the licensing group as a whole generated unaffiliated gross royalties of approximately $17.6 million, $16.5 million and $17.6 million, respectively.
Intellectual Property
We have approximately 290 worldwide patents, of which the patents and pending patent applications relating to our UniCased technology and those patents that protect our proprietary spring and coil designs and our latex production process, are believed by us to be our most valuable. These patents, having been just recently issued or still pending, afford us multiple years of continuing protection of certain mattress designs. We have filed for patent protection for the core UniCased technology in 30 countries to date and expect similar competitive benefits from the issuance of those patents in those countries. Recent patents covering our proprietary spring and coil designs also provide Sealy with a competitive advantage in the U.S. and in other countries where we have a presence, and these patents have a remaining enforceable period of at least 15 years.
We own thousands of trademarks, tradenames, service marks, logos and design marks, including Sealy, Stearns & Foster and Posturepedic. We also license the Bassett tradename in various territories under a long term agreement. Through fiscal 2009, we licensed the Pirelli tradename in certain territories under an agreement that expired in December 2009. We strategically decided not to renew this contract upon its expiration and transition to sales under our Sealy brand in these territories, which are primarily concentrated in western Europe. With the exception of the Sealy New Jersey license, the
9
domestic licenses are predominantly trademark licenses. Also, with the exception of the Sealy New Jersey license (which is of perpetual duration), each domestic license is limited by a period of years, all of which are for a length of five years or less.
Of our over 750 worldwide trademarks, we believe that our Sealy, Posturepedic, and Stearns & Foster marks and affiliated logos (the Sealy script, the "butterfly logo" and the Stearns & Foster "seal") are the most well known. We have registered the Sealy, Posturepedic and Stearns & Foster marks in over 94 countries.
Our licenses include rights for the licensees to use trademarks as well as current proprietary or patented technology utilized by us. We also provide our licensees with product specifications, quality control inspections, research and development, statistical services and marketing programs. Only the New Jersey, Australia, United Kingdom and Jamaica licenses are of perpetual duration (with some rights of termination), while the other licenses are for a set duration or are indeterminate in length and subject to reasonable notice provisions. All licenses have provisions for termination for cause (such as bankruptcy, misuse of the mark or violation of standards), approval of marketing materials, audit rights and confidentiality of proprietary data.
Warranties and Product Returns
Sealy, Stearns & Foster and Bassett bedding offer limited warranties on our manufactured products. The periods for "no-charge" warranty service vary among products. Prior to fiscal year 1995, such warranties ranged from one year on promotional bedding to 20 years on certain Posturepedic and Stearns & Foster bedding. All currently manufactured Sealy Posturepedic models, Stearns & Foster bedding, Bassett and some other Sealy branded products offer a ten year non-prorated warranty service period. Our TrueForm and MirrorForm visco-elastic line of bedding as well as our SpringFree latex line of bedding, carry a twenty year warranty on the major component, the last ten years of which are prorated on a straight-line basis. In 2006, we introduced Right Touch (which was discontinued in the third quarter of fiscal 2008), that had a twenty year limited warranty that covers only certain parts of the product and is prorated for part of the twenty years. We amended our warranty policy on Sealy brand value-priced bedding to three years beginning with our new line introduced in fiscal 2007. The impact of the changes to the warranty policies did not have a significant impact on our financial results or position.
Employees
As of November 28, 2010 we had 4,270 full time employees. Approximately 67% of our employees at our 25 North American plants are represented by various labor unions with separate collective bargaining agreements. Due to the large number of collective bargaining agreements, we are periodically in negotiations with certain of the unions representing our employees. We consider our overall relations with our work force to be satisfactory. We have only experienced two work stoppages by some of our employees in the last ten years due to labor disputes. Due to the ability to shift production from one plant to another, these lost workdays have not had a material adverse effect on our financial results. The only significant organizing activity at our non-union plants during the last ten years was a petition filed by the Teamsters seeking to organize the production employees at our Mountain Top, Pennsylvania facility. At the subsequent election, the union was defeated by a wide margin. Our current collective bargaining agreements, which are typically three years in length, expire at various times beginning in 2011 through 2013. As of November 28, 2010, our domestic manufacturing plants employed 458, 448 and 895 employees covered under collective bargaining agreements expiring in fiscal 2011, 2012, and 2013, respectively. At our international facilities, there were 405, 430 and 422 employees covered under collective bargaining agreements expiring in fiscal 2011, 2012 and 2013, respectively.
10
Seasonality and Production Cycle
Our third fiscal quarter sales are typically 5% to 15% higher than other fiscal quarters. See Note 18 to our Consolidated Financial Statements in Item 8.
Most of our sales are by short term purchase orders. Since the level of production of products is generally promptly adjusted to meet customer order demand, we have a negligible backlog of orders. Most finished goods inventories of bedding products are physically stored at manufacturing locations until shipped (usually within five business days of accepting the order). See "Risk Factors—We may experience fluctuations in our operating results due to seasonality, which could make sequential quarter to quarter comparison an unreliable indication of our performance." in Item 1A below.
Regulatory Matters
Our conventional bedding product lines are subject to various federal and state laws and regulations relating to flammability and other standards. We believe that we are in compliance with all such laws and regulations.
Our principal waste products in North America are foam and fabric scraps, wood, cardboard and other non-hazardous materials derived from product component supplies and packaging. We also periodically dispose of (primarily by recycling) small amounts of used machine lubricating oil and air compressor waste oil. In the United States, we are subject to federal, state and local laws and regulations relating to environmental health and safety, including the Federal Water Pollution Control Act and the Comprehensive Environmental Response, Compensation and Liability Act. In our facilities in Mountain Top, Pennsylvania, and Argentina, we also manufacture foam. We believe that we are in compliance with all applicable international, federal, state and local environmental statutes and regulations. Except as set forth in "Item 3—Legal Proceedings" below, compliance with international, federal, state or local provisions that have been enacted or adopted regulating the discharge of materials into the environment, or otherwise relating to the protection of the environment, should not have any material effect upon our capital expenditures, earnings or competitive position. We are not aware of any pending federal environmental legislation which would have a material impact on our operations. Except as set forth in "Item 3—Legal Proceedings" below, we have not been required to make and do not expect to make any material capital expenditures for environmental control facilities in the foreseeable future.
The bedding industry is highly competitive, and if we are unable to compete effectively, we may lose customers and our sales may decline.
The bedding industry is highly competitive, and we encounter competition from many manufacturers in both domestic and foreign markets. We, along with Simmons Company and Serta, Inc., accounted for approximately 51.0% of U.S. wholesale revenues in 2009, according to figures obtained from ISPA and Furniture/Today industry publications. The highly competitive nature of the bedding industry means we are continually subject to the risk of loss of our market share, loss of significant customers, reduction in margins, the inability for us to gain market share or acquire new customers, and difficulty in raising our prices. Some of our principal competitors have less debt than we have and may be better able to withstand changes in market conditions within the bedding industry. Additionally, we may encounter increased future competition and further consolidaftion in our industry which could magnify the competitive risks previously outlined.
11
Our new product launches may not be successful due to development delays, failure of new products to achieve anticipated levels of market acceptance and significant costs associated with failed product introductions, which could adversely affect our revenues and profitability.
Each year we invest significant time and resources in research and development to improve our product offerings. There are a number of risks inherent in our new product line introductions, such as, the anticipated level of market acceptance may not be realized, which could negatively impact our sales. Also, introduction costs, the speed of the rollout of the product and manufacturing inefficiencies may be greater than anticipated, which could impact our profitability. During fiscal 2011, we will introduce our Next Generation Posturepedic line which represents approximately 50% of our domestic portfolio.
We may experience fluctuations in our operating results due to seasonality, which could make sequential quarter to quarter comparisons an unreliable indication of our performance.
We have historically experienced, and we expect to continue to experience, seasonal and quarterly fluctuations in net sales and operating income. As is the case with many bedding customers, the retail business is subject to seasonal influences, characterized by strong sales for the months of June through September, which impacts our third fiscal quarter results. Our third fiscal quarter sales are typically 5% to 15% higher than other fiscal quarters. Our first fiscal quarter cash flows are typically the most unfavorable due to working capital demands and coupon payments on our 2014 Notes. This seasonality means that a sequential quarter to quarter comparison may not be a good indication of our performance or of how we will perform in the future.
A substantial decrease in business from our significant customers could have a material adverse effect on our sales and market share.
Our five largest customers on a consolidated basis accounted for approximately 36.9% of our net sales for fiscal 2010 with one customer representing more than 10% of net sales for fiscal 2010. While we believe our relationships with these customers are stable, many arrangements are made by purchase order or are terminable at will at the option of either party. A substantial decrease or interruption in business from our significant customers could result in material write offs or loss of future business. The recent economic environment caused a higher occurrence of bankruptcies for mattress retailers, particularly in 2008 and 2009. While we have seen some improvement in this environment through 2010, the continued management of credit risk by financial institutions has held down the availability of credit for mattress retailers. In certain instances, this has caused mattress retailers to exit the market or be forced into bankruptcy. Furthermore, many of our customers rely in part on consumers' ability to finance their mattress purchases with credit from third parties. If consumers are unable to obtain financing, they may defer their purchases.
In the future, retailers may consolidate, restructure, reorganize or realign their affiliations, any of which could decrease the number of stores that carry our products or increase the ownership concentration in the retail industry. Some of these retailers may decide to carry only one brand of mattress products which could affect our ability to sell our products on favorable terms or to maintain or increase market share. As a result, our sales and profitability may decline.
Unfavorable economic conditions could continue to negatively affect our revenues and profitability.
Our business, financial condition and results of operations have and may continue to be affected by various economic factors. Periods of economic uncertainty, such as the recession experienced in 2008 and much of 2009, can lead to reduced consumer and business spending, including by our customers, and the purchasers of their products. Reduced access to credit has and may continue to adversely affect the ability of consumers to purchase our products from retailers. It has and may continue to adversely
12
affect the ability of our customers to pay us. If such conditions are experienced in future periods, our industry, business and results of operations may be severely impacted.
Our profitability may be materially and adversely affected by increases in the cost of petroleum-based products, steel and other raw materials.
Our industry has been challenged by volatility in the price of petroleum-based and steel products, which affects the cost of our polyurethane foam, polyester, polyethylene foam and steel innerspring component parts. Domestic supplies of these raw materials are being limited by supplier consolidation, the exporting of these raw materials outside of the U.S. due to the weakened dollar and other forces beyond our control. During fiscal 2009, the cost of these components decreased and ultimately became more stable in the latter part of fiscal 2009. While these costs remained relatively stable in the first half of fiscal 2010, the costs have shifted upwards during the latter half of fiscal 2010 as feed stocks adjust to market conditions. The manufacturers of products such as petro-chemicals and wire rod, which are the materials purchased by our suppliers of foam and drawn wire, may reduce supplies in an effort to maintain higher prices. These actions would delay or eliminate price reductions from our suppliers.
Our profitability may be materially and adversely affected by any interruption in supply from third party vendors.
We purchase our raw materials and certain components from a variety of suppliers, including box spring components from Leggett & Platt Inc., foam materials from Carpenter Co., and various subassemblies and components from national raw material and component suppliers. If we experience a loss or disruption in our supply of these components, we may have difficulty sourcing substitute components on terms favorable to us. In addition, any alternate source may impair product performance or require us to alter our manufacturing process, which could have an adverse effect on our profitability.
We are dependent upon a single supplier for certain polyurethane foam components in our mattress units. A disruption in the supply of these products and services could adversely affect our operations.
We are dependent upon a single supplier for certain key polyurethane foam components which make up our various mattress brands. Such components are purchased under a supply agreement and are manufactured in accordance with proprietary process designs exclusive to the supplier. If we experience a loss or disruption in our supply of these components, we may have difficulty sourcing substitute components on terms favorable to us. In addition, any alternative source may impair product performance or require us to alter our manufacturing process, which could have an adverse effect on our profitability.
We are dependent upon a single supplier for the visco-elastic components and assembly of our TrueForm and Embody specialty product line. A disruption in the supply of these products and services could adversely affect our operations.
We are dependent upon a single supplier for certain structural components and assembly of our TrueForm and Embody specialty product line. These products are purchased under a supply agreement and are manufactured in accordance with proprietary designs jointly owned by us and the supplier. If we experience a loss or disruption in our supply of these products, we may have difficulty sourcing substitute components on terms favorable to us. In addition, any alternative source may impair product performance or require us to alter our manufacturing process, which could have an adverse effect on our profitability. The related product in which these components and assembly processes are used does not represent a significant portion of our overall sales.
13
Our significant international operations are subject to foreign exchange, tariff, tax, inflation and political risks and our ability to expand in certain international markets is limited by the terms of licenses we have granted to manufacture and sell Sealy products.
We currently conduct significant international operations and may pursue additional international opportunities. Our international operations are subject to the risks of operating in an international environment, including the potential imposition of trade or foreign exchange restrictions, tariff and other tax increases, fluctuations in exchange rates, inflation and unstable political situations. We have also limited our ability to independently expand in certain international markets where we have granted licenses to manufacture and sell Sealy bedding products. Our licensees in Australia, Jamaica and the United Kingdom have perpetual licenses, subject to limited termination rights. Our licensees in the Dominican Republic, the Bahamas, Continental European Union countries, Brazil, Israel, Japan, Saudi Arabia, South Africa and Thailand hold licenses for fixed terms with limited renewal rights. Fluctuations in the rate of exchange between the U.S. dollar and other currencies may affect stockholders' equity and our financial condition or results of operations.
The loss of the services of one or more members of our senior management team could impair our ability to execute our business strategy and adversely affect our business.
We are dependent on the continued services of our senior management team, most of whom have substantial industry specific experience. For example, Lawrence J. Rogers, our current President and Chief Executive Officer (former President, Sealy North America from December 2006 through March 2008), has served in numerous capacities within our operations since joining us in 1979. The loss of key personnel could impair our ability to execute our business strategy and have a material adverse effect on our business.
Our substantial level of indebtedness could adversely affect our financial condition and prevent us from fulfilling our obligations under our outstanding indebtedness
After the completion of the Refinancing, we continue to have substantial indebtedness. As of November 28, 2010, we had a total of $795.3 million of debt outstanding, including $304.3 million Senior Notes, $181.3 million Convertible Notes and $268.9 million Senior Subordinated Notes. We also have approximately $41.4 million of undrawn availability under the ABL Revolver, after taking into account $16.0 million of outstanding letters of credit and borrowing base limitations.
Our outstanding indebtedness could have important consequences. For example, it could:
- •
- limit our ability to pay dividends on our common stock;
- •
- make it more difficult for us to satisfy our obligations with respect to our outstanding debt, including any repurchase
obligations that may arise thereunder;
- •
- limit our ability to obtain additional financing for working capital, capital expenditures, product development, debt
service requirements, restructuring, acquisitions or general corporate purposes, which could be exacerbated by further volatility in the credit markets;
- •
- require us to use a substantial portion of our cash flow from operations to pay interest on our outstanding debt which
will reduce the funds available to us for operations and other purposes;
- •
- place us at a competitive disadvantage compared to our competitors that may have proportionally less debt;
- •
- limit our flexibility in planning for, or reacting to, changes in our business and the industry in which we operate;
and
- •
- make us more vulnerable to economic downturns and adverse developments in our business.
14
Any of the above listed factors could materially and adversely affect our business, financial condition or results of operations.
Despite our current leverage, we may still be able to incur substantially more debt. This could further exacerbate the risks that we and our subsidiaries face
The terms of the ABL Revolver agreement and the indentures governing our Senior Notes, Convertible Notes and 2014 Notes will restrict us and our subsidiaries from incurring substantial additional indebtedness in the future, but will not completely prohibit us from doing so. Our ABL Revolver provides for revolving credit financing of up to $100.0 million, subject to borrowing base availability. At November 28, 2010, we have $41.4 million of undrawn availability under the ABL Revolver, after taking into account $16.0 million of letters of credit and borrowing base limitations. These restrictions are subject to a number of important qualifications and exceptions and the indebtedness incurred in compliance with these restrictions could be substantial. If new debt is added to our existing debt levels, the related risks that we now face, including those described above, could intensify.
The terms of our debt covenants could limit how we conduct our business and our ability to raise additional funds.
The agreements that govern the terms of our debt, including the indentures that govern the Senior Notes, Convertible Notes, and 2014 Notes and the credit agreement that governs our ABL Revolver, contain, and the agreements that govern our future indebtedness may contain, covenants that restrict our ability and the ability of our subsidiaries to:
- •
- incur and guarantee indebtedness or issue preferred stock;
- •
- repay certain subordinated indebtedness prior to its stated maturity;
- •
- pay dividends or make other distributions on or redeem or repurchase our stock;
- •
- issue capital stock;
- •
- make certain investments or acquisitions;
- •
- create liens;
- •
- engage in most asset sales;
- •
- merge with or into other companies;
- •
- enter into certain transactions with stockholders and affiliates;
- •
- make capital expenditures;
- •
- make certain investments or acquisitions; and
- •
- restrict dividends, distributions or other payments from our subsidiaries.
In addition, under the ABL Revolver, if our borrowing availability falls below the greater of 15% of the aggregate commitments thereunder and $15.0 million, we will be required to satisfy and maintain a fixed charge coverage ratio of not less than 1.1 to 1.0. Our ability to meet the required fixed charge coverage ratio can be affected by events beyond our control, and we may not be able to meet this ratio. A breach of any of these covenants could result in a default under the ABL Revolver.
A breach of the covenants or restrictions under our debt agreements and indentures governing our outstanding notes could result in a default under the applicable indebtedness. Such default may allow the creditors to accelerate the related debt and may result in the acceleration of any other debt to which a cross-acceleration or cross-default provision applies. In addition, an event of default under our
15
ABL Revolver would permit the lenders under our ABL Revolver to terminate all commitments to extend further credit under that facility. Furthermore, if we were unable to repay the amounts due and payable under our ABL Revolver, those lenders could proceed against the Collateral granted to them to secure that indebtedness. In the event our lenders and noteholders accelerate the repayment of our borrowings, we cannot assure that we and our subsidiaries would have sufficient assets to repay such indebtedness. As a result of these restrictions we may be:
- •
- limited in how we conduct our business;
- •
- unable to raise additional debt or equity financing to operate during general economic or business downturns; or
- •
- unable to compete effectively or to take advantage of new business opportunities.
These restrictions may affect our ability to grow in accordance with our plans.
We are a holding company and rely on dividends, interest and other payments, advances and transfers of funds from our subsidiaries to enable us to pay dividends.
We are a holding company and conduct all of our operations through our subsidiaries and currently have no significant assets other than the capital stock of Sealy Mattress Corporation. As a result, we rely on dividends and other payments or distributions from our subsidiaries to enable us to pay dividends. The ability of our subsidiaries to pay dividends or make other payments or distributions to us will depend on their respective operating results and may be restricted by, among other things, the laws of their jurisdiction of organization (which may limit the amount of funds available for the payment of dividends), agreements of those subsidiaries and the covenants of any existing and future outstanding indebtedness we or our subsidiaries incur, including Sealy Mattress Company's ABL revolver agreement and the indentures governing the Senior Notes, Convertible Notes and 2014 Notes. For instance, the agreement governing Sealy Mattress Company's ABL Revolver contains restrictions on the ability of Sealy Mattress Corporation to pay dividends or make other distributions to us subject to specified exceptions including the satisfaction of a minimum fixed charge coverage ratio and average daily availability levels. We are therefore limited in our ability to pay a dividend. In addition, the indentures governing the Senior Notes and the 2014 Notes contain restrictions on the ability of Sealy Mattress Company to pay dividends or make other distributions to Sealy Mattress Corporation subject to specified exceptions including an amount based upon 50% of cumulative consolidated net income from the issue date of the notes.
We may not be able to generate sufficient cash to service all of our indebtedness and may be forced to take other actions to satisfy our obligations under our indebtedness, which may not be successful
Our ability to make scheduled payments or to refinance our debt obligations depends on our financial and operating performance, which is subject to prevailing economic and competitive conditions and to certain financial, business and other factors beyond our control. We may not be able to maintain a level of cash flow from operating activities sufficient to permit us to pay the principal, premium, if any, and interest on our indebtedness.
If our cash flows and capital resources are insufficient to fund our debt service obligations, we may be forced to reduce or delay capital expenditures, sell assets, seek additional capital, or seek to restructure or refinance our indebtedness. These alternative measures may not be successful and may not permit us to meet our scheduled debt service obligations. In the absence of such operating results and resources, we could face substantial liquidity problems and might be required to sell material assets or operations to attempt to meet our debt service and other obligations. The ABL Revolver agreement and the indentures governing our Senior Notes, Convertible Notes and 2014 Notes will restrict our ability to use the proceeds from asset sales. We may not be able to consummate those asset sales to
16
raise capital or sell assets at prices that we believe are fair and proceeds that we do receive may not be adequate to meet any debt service obligations then due.
Changes in tax laws and regulations or other factors could cause our income tax rate to increase, potentially reducing our net income and adversely affecting our cash flows.
We are subject to taxation in various jurisdictions around the world. In preparing our financial statements, we calculate our effective income tax rate based on current tax laws and regulations and the estimated taxable income within each of these jurisdictions. Our effective income tax rate, however, may be higher due to numerous factors, including changes in tax laws or regulations. A significantly higher effective income tax rate could have an adverse effect on our business, results of operations and liquidity.
Officials in some of the jurisdictions in which we do business, including the United States, have proposed, or announced that they are reviewing tax increases and other revenue raising laws and regulations. Any resulting changes in tax laws or regulations could impose new restrictions, costs or prohibitions on our current practices and reduce our net income and adversely affect our cash flows.
The recently enacted United States federal legislation on healthcare reform and proposed amendments thereto could impact the healthcare benefits required to be provided by the Company and cause our compensation costs to increase, potentially reducing our net income and adversely affecting our cash flows.
The United States federal healthcare legislation enacted in 2010 and proposed amendments thereto contain provisions which could materially impact the future healthcare costs of the Company. While the legislation's ultimate impact is not yet known, it is possible that these changes could significantly increase our compensation costs which would reduce our net income and adversely affect our cash flows.
The time and expense of defending against challenges to our trademarks, patents and other intellectual property could divert our management's attention and substantial financial resources from our business. Our goodwill and ability to differentiate our products in the marketplace could be negatively affected if we were unsuccessful in defending against such challenges.
We hold over 750 worldwide trademarks, which we believe have significant value and are important to the marketing of our products to customers. We own 55 U.S. patents, a number of which have been registered in a total of 25 countries, and we have 27 domestic patents pending. In addition, we own U.S. and foreign registered trade names and service marks and have applications for the registration of trade names and service marks pending domestically and abroad. We also own several U.S. copyright registrations, and a wide array of unpatented proprietary technology and know-how. We also license certain intellectual property rights from third parties.
Our ability to compete effectively with other companies depends, to a significant extent, on our ability to maintain the proprietary nature of our owned and licensed intellectual property. Although our trademarks are currently registered in the United States and registered or pending in 96 foreign countries, we still face risks that our trademarks may be circumvented or violate the proprietary rights of others and we may be prevented from using our trademarks if challenged. A challenge to our use of our trademarks could result in a negative ruling regarding our use of our trademarks, their validity or their enforceability, or could prove expensive and time consuming in terms of legal costs and time spent defending against it. In addition, we may not have the financial resources necessary to enforce or defend our trademarks. We also face risks as to the degree of protection offered by the various patents, the likelihood that patents will be issued for pending patent applications or, with regard to the licensed intellectual property, that the licenses will not be terminated. If we were unable to maintain the proprietary nature of our intellectual property and our significant current or proposed products, our
17
goodwill and ability to differentiate our products in the marketplace could be negatively affected and our market share and profitability could be materially and adversely affected.
Regulatory requirements relating to our products may increase our costs, alter our manufacturing processes and impair our product performance.
Our products and raw materials are and will continue to be subject to regulation in the United States by various federal, state and local regulatory authorities. In addition, other governments and agencies in other jurisdictions regulate the sale and distribution of our products and raw materials. These rules and regulations may change from time to time. Compliance with these regulations may negatively impact our business. There may be continuing costs of regulatory compliance including continuous testing, additional quality control processes and appropriate auditing of design and process compliance.
In February 2005, the U.S. Consumer Product Safety Commission ("CPSC") passed 16 CFR Part 1633 that effectively applies the California open flame standard, but added significant quality control, record keeping and testing requirements on mattress manufacturers, including Sealy. This rule became effective on July 1, 2007. Further, some states and the U.S. Congress continue to consider open flame regulations for mattresses and bed sets or integral components that may be different or more stringent than the CPSC standard and we may be required to make different products for different states or change our processes or distribution practices nationwide. It is possible that some states' more stringent standards, if adopted and enforceable, could make it difficult to manufacture a cost effective product in those jurisdictions and compliance with proposed new rules and regulations may increase our costs, alter our manufacturing processes and impair the performance of our products.
In addition, our marketing and advertising practices could become the subject of proceedings before regulatory authorities or the subject of claims by other parties, which could require us to alter or end these practices or adopt new practices that are not as effective or are more expensive.
Environmental, health and safety requirements could expose us to material liabilities and changes in our operations as a result of environmental contamination, among other things.
As a manufacturer of bedding and related products, we use and dispose of a number of substances, such as glue, lubricating oil, solvents and other petroleum products, as well as certain foam ingredients that may subject us to regulation under numerous federal and state statutes governing the environment (including those environmental regulations that are applicable to our current and previously owned foreign operations such as Argentina, Brazil, Canada, France, Italy, Mexico, Uruguay and other jurisdictions). Among other statutes, we are subject to the Federal Water Pollution Control Act, the Comprehensive Environmental Response, Compensation and Liability Act, the Resource Conservation and Recovery Act, the Clean Air Act and related state statutes and regulations. As we abide by certain new open flame regulations, our products and processes may be governed more rigorously by certain state and federal environmental and OSHA standards as well as the provisions of California Proposition 65 and 16 CFR Part 1633.
We have made and will continue to make capital and other expenditures to comply with environmental requirements. We also have incurred and will continue to incur costs related to certain remediation activities. Under various environmental laws, we may be held liable for the costs of remediating releases of hazardous substances at any properties currently or previously owned or operated by us or at any site to which we sent hazardous substances for disposal. We are currently addressing the clean-up of environmental contamination at our former facility in Oakville, Connecticut and our former facility in South Brunswick, New Jersey. At November 28, 2010, we have accrued approximately $0.1 million and $2.0 million for the Oakville and South Brunswick clean-ups, respectively, and we believe that these reserves are adequate. While uncertainty exists as to the ultimate
18
resolution of these two environmental matters and we believe that the accruals recorded are adequate, in the event of an adverse decision by one or more of the governing environmental authorities or if additional contamination is discovered, these matters could have a material effect on our profitability.
A change or deterioration in labor relations could disrupt our business or increase costs, which could lead to a material decline in sales or profitability.
As of November 28, 2010, we had 4,270 full time employees. Approximately 67% of our employees at our 25 North American plants are represented by various labor unions with separate collective bargaining agreements. Our current collective bargaining agreements, which are typically three years in length, expire at various times beginning in 2011 through 2013. Due to the large number of collective bargaining agreements, we are periodically in negotiations with certain of the unions representing our employees. We may at some point be subject to work stoppages by some of our employees and, if such events were to occur, there may be a material adverse effect on our operations and profitability. Further, we may not be able to renew the various collective bargaining agreements on a timely basis or on favorable terms, or at all.
Our pension plans are currently underfunded and we will be required to make cash payments to the plans, reducing the cash available for our business.
We have noncontributory, defined benefit pension plans covering current and former hourly employees at four of our active plants and eight previously closed facilities as well as the employees of a facility of our Canadian operations. We record a liability associated with these plans equal to the excess of the benefit obligation over the fair value of plan assets. The benefit liability recorded at November 28, 2010 was $8.7 million, and we expect to make estimated minimum funding contributions totaling approximately $2.1 million in 2011. If the performance of the assets in these pension plans does not meet our expectations, or if other actuarial assumptions are modified, our future cash payments to the plans could be higher than we expect. The domestic pension plan is subject to the Employee Retirement Income Security Act of 1974, or ERISA. Under ERISA, the Pension Benefit Guaranty Corporation, or PBGC, has the authority to terminate an underfunded pension plan under limited circumstances. In the event our pension plan is terminated for any reason while it is underfunded, we will incur a liability to the PBGC that may be equal to the entire amount of the underfunding.
Item 1B. Unresolved Staff Comments
None.
Our principal executive offices are located on Sealy Drive at One Office Parkway, Trinity, North Carolina, 27370. Corporate and administrative services are provided to us by Sealy, Inc. (our 100%-owned subsidiary).
We administer our component operations at our Rensselaer, Indiana facility. Our leased facilities are occupied under operating leases, which expire from fiscal 2010 to 2043, including renewal options.
19
The following table sets forth certain information regarding manufacturing and distribution facilities operated by us at January 4, 2011:
Location
|
|
Approximate Square Footage |
Title | |||||
|---|---|---|---|---|---|---|---|---|
United States |
||||||||
Arizona |
Phoenix | 76,000 | Owned(a) | |||||
California |
Richmond | 238,000 | Owned(a) | |||||
|
South Gate | 185,000 | Leased | |||||
Colorado |
Colorado Springs | 70,000 | Owned(a) | |||||
|
Denver | 92,900 | Owned(a) | |||||
Florida |
Orlando | 225,000 | Owned(b) | |||||
Georgia |
Atlanta | 292,500 | Owned(a) | |||||
Illinois |
Batavia | 212,700 | Leased | |||||
Indiana |
Rensselaer | 131,000 | Owned(a) | |||||
|
Rensselaer | 124,000 | Owned(a) | |||||
Kansas |
Kansas City | 121,200 | Leased | |||||
Maryland |
Williamsport | 144,000 | Leased | |||||
Minnesota |
St. Paul | 93,600 | Owned(a) | |||||
New York |
Green Island | 257,000 | Owned(b) | |||||
North Carolina |
High Point | 151,200 | Owned(a) | |||||
Ohio |
Medina | 140,000 | Owned(a) | |||||
Oregon |
Portland | 140,000 | Owned(a) | |||||
Pennsylvania |
Delano | 143,000 | Owned(a) | |||||
|
Mountain Top | 210,000 | Owned(b) | |||||
Texas |
Brenham | 220,000 | Owned(a) | |||||
|
North Richland Hills | 124,500 | Owned(a) | |||||
Canada |
||||||||
Alberta |
Edmonton | 144,500 | Owned(a) | |||||
Quebec |
Saint Narcisse | 76,000 | Owned(a) | |||||
Ontario |
Toronto | 130,200 | Leased | |||||
Argentina |
Buenos Aires | 85,000 | Owned | |||||
Brazil |
Sorocaba | 92,000 | Owned(c) | |||||
Puerto Rico |
Carolina | 58,600 | Owned(a) | |||||
Mexico |
Toluca | 157,100 | Owned | |||||
Uruguay |
Montevideo | 39,500 | Leased | |||||
|
4,174,500 | |||||||
- (a)
- We
have granted a mortgage or otherwise encumbered our interest in this facility as collateral for secured indebtedness.
- (b)
- We
engaged third parties to construct these facilities to be leased by us. The FASB's authoritative guidance requiring the Company to be considered the
owner, for accounting purposes of certain leased facilities, is applied to entities involved with certain structural elements of the construction of an asset that will be leased when construction of
the asset is completed.
- (c)
- This facility represents our former manufacturing facility in Brazil which is currently being leased to a third party over a period of twelve years.
20
In addition to the locations listed above, we maintain additional warehousing facilities in several of the states and countries where our manufacturing facilities are located. We consider our present facilities to be generally well maintained and in sound operating condition.
We are subject to legal proceedings, claims, and litigation arising in the ordinary course of business. Management does not expect that the ultimate costs to resolve these matters will have a material adverse effect on our consolidated financial position, results of operations or cash flows.
During fiscal 2010, the Company was assessed $8.0 million by the Brazilian government for the failure to provide certain income tax filings. Due to the accumulated net operating losses in this jurisdiction, the Company's exposure is expected to be limited. At November 28, 2010, the Company has recorded a reserve of $1.1 million related to the expected requirement to pay certain sales taxes, fees and penalties associated with this assessment as a component of accrued expenses.
We are currently conducting an environmental cleanup at a formerly owned facility in South Brunswick, New Jersey pursuant to the New Jersey Industrial Site Recovery Act. We and one of our subsidiaries are parties to an Administrative Consent Order issued by the New Jersey Department of Environmental Protection. Pursuant to that order, we and our subsidiary agreed to conduct soil and groundwater remediation at the property. We do not believe that our manufacturing processes were the source of contamination. We sold the property in 1997. We and our subsidiary retained primary responsibility for the required remediation. We have completed essentially all soil remediation with the New Jersey Department of Environmental Protection's approval, and have installed a groundwater remediation system on the site. During 2005, with the approval from the New Jersey Department of Environmental Protection, we removed and disposed of sediment in Oakeys Brook adjoining the site. We continue to monitor groundwater remediation at this site. We have recorded a reserve as of November 28, 2010 of $2.0 million ($2.1 million prior to discounting at 4.75%) associated with this remediation project.
We are also remediating soil and groundwater contamination at an inactive facility located in Oakville, Connecticut. Although we are conducting the remediation voluntarily, we obtained Connecticut Department of Environmental Protection approval of the remediation plan. We have completed essentially all soil remediation under the remediation plan and are currently monitoring groundwater at the site. We identified cadmium in the soil and ground water at the site and removed the cadmium contaminated soil and rock from the site during fiscal 2007. At November 28, 2010, we have recorded a reserve of approximately $0.1 million associated with the additional work and ongoing monitoring. We believe the contamination is attributable to the manufacturing operations of previous unaffiliated occupants of the facility.
While we cannot predict the ultimate timing or costs of the South Brunswick and Oakville environmental matters, based on facts currently known, we believe that the accruals recorded are adequate and do not believe the resolution of these matters will have a material adverse effect on our financial position or our future operations; however, in the event of an adverse decision by the agencies involved, or an unfavorable result in the New Jersey natural resources damages matter, these matters could have a material adverse effect.
Item 4. [Removed and Reserved]
21
Item 5. Market for Registrant's Common Equity, Related Stockholder Matters, and Issuer Purchases of Equity Securities
Our common stock trades on the New York Stock Exchange under the symbol "ZZ." The table below highlights quarterly stock market information and the amount of cash dividends declared per share of our common stock for the past two fiscal years.
| |
Sales Price ($) | |
||||||||
|---|---|---|---|---|---|---|---|---|---|---|
| |
Cash Dividend Declared ($) |
|||||||||
| |
High | Low | ||||||||
Fiscal 2010 |
||||||||||
First quarter |
3.93 | 2.43 | — | |||||||
Second quarter |
4.24 | 2.90 | — | |||||||
Third quarter |
3.26 | 2.30 | — | |||||||
Fourth quarter |
3.11 | 2.30 | — | |||||||
| |
Sales Price ($) | |
||||||||
|---|---|---|---|---|---|---|---|---|---|---|
| |
Cash Dividend Declared ($) |
|||||||||
| |
High | Low | ||||||||
Fiscal 2009 |
||||||||||
First quarter |
3.68 | 0.80 | — | |||||||
Second quarter |
5.83 | 0.43 | — | |||||||
Third quarter |
2.80 | 2.02 | — | |||||||
Fourth quarter |
3.83 | 2.45 | — | |||||||
Our ability to pay dividends is restricted by our debt agreements. See "Management's Discussion and Analysis of Financial Condition and Results of Operations" in Item 7.
As of January 4, 2011, there were approximately 253 holders of record of our common stock.
Issuer Purchases of Equity Securities
The table below shows our repurchases of the Company's common stock during the fourth quarter of fiscal 2010:
Period
|
Total number of shares purchased(1) |
Average price paid per share |
Total number of shares purchased during quarter as part of publicly announced program(2) |
Approximate dollar value of shares that may yet be purchased under program |
||||||||||
|---|---|---|---|---|---|---|---|---|---|---|---|---|---|---|
August 30 - September 26, 2010 |
— | $ | — | — | $ | 83,746,985 | ||||||||
September 27 - October 24, 2010 |
35,098 | 2.70 | — | 83,746,985 | ||||||||||
October 25 - November 28, 2010 |
— | — | 83,746,985 | |||||||||||
Total |
35,098 | — | ||||||||||||
- (1)
- The
entire amounts presented above are comprised of common stock surrendered or withheld to cover the minimum tax withholding obligations related to the
vesting of restricted stock units as permitted under the 2004 Stock Option Plan.
- (2)
- Our common stock repurchase program, which authorizes us to repurchase up to $100 million of our Company's common stock, was initially approved by our Board of Directors on February 19, 2007.
22
Performance Graph
The following graph compares the performance through November 28, 2010 of a hypothetical $100 investment made on April 7, 2006 in (a) our common stock, (b) the S&P 500 Composite Index® and (c) an index of certain companies by the company as comparable to Sealy (the "Peer Group Index"). The companies selected to form the Peer Group Index are: Brunswick Corp., Church & Dwight Co, Energizer Holdings Inc., Ethan Allen Interiors Inc., Fortune Brands, Inc., Furniture Brands International, Harman International, Leggett & Platt Inc., La-Z-Boy Inc, Masco Corp., Mohawk Industries Inc., Nautilus Inc., Prestige Brands Holdings Inc., Polaris Industries Inc., Select Comfort Corp., Spectrum Brands, Inc., Tempur-pedic International Inc., and The Scotts Miracle-Gro Co., Playtex Products Inc., Chattem Inc. and Spectrum Brands, in 2006 had each been part of the Peer Group Index. In 2007 Playtex was acquired. In 2009, Spectrum Brands went bankrupt and cancelled its common shares. In 2010, Chattem Inc was acquired. As a result, each of these companies stopped being a public company and each was removed from the Peer Group Index. This peer group was determined at the time that Sealy became a public company with the assistance of the investment banking firms involved in taking Sealy public. The group includes public companies in home furnishings and consumer products industries. This graph is calculated assuming that all stock dividends are reinvested during the relevant period.
COMPARISON OF CUMULATIVE TOTAL RETURN
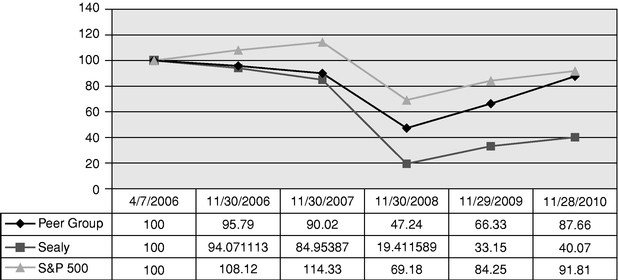
23
Item 6. Selected Financial Data
The following table presents selected historical financial and other data about us. The selected historical financial data for the years ended and as of November 28, 2010, November 29, 2009, November 30, 2008, December 2, 2007, and November 26, 2006 are derived from our audited Consolidated Financial Statements and the notes thereto. During fiscal 2010, we divested the assets of our European manufacturing operations in France and Italy which represented our Europe segment. Also during 2010, we discontinued our operations in Brazil and transitioned to a license arrangement with third parties in this market. We accounted for these businesses as discontinued operations, and, accordingly, we have reclassified the selected financial data for all periods presented to reflect them as such.
The consolidated financial statements for the three years ended November 28, 2010 have been audited by Deloitte & Touche LLP, an independent registered public accounting firm, and are included in "Financial Statements and Supplementary Data" in Item 8 below.
The selected historical financial and other data set forth below should be read together with the information contained in "Management's Discussion and Analysis of Financial Condition and Results of Operations" in Item 7 below and our financial statements and the notes thereto, appearing elsewhere in this report.
| |
Fiscal Year(1) | |||||||||||||||||
|---|---|---|---|---|---|---|---|---|---|---|---|---|---|---|---|---|---|---|
| |
2010 | 2009 | 2008 | 2007 | 2006 | |||||||||||||
| |
(in millions, except per share data) |
|||||||||||||||||
Statement of Operations Data: |
||||||||||||||||||
Net sales |
$ | 1,219.5 | $ | 1,174.6 | $ | 1,343.3 | $ | 1,549.8 | $ | 1,447.7 | ||||||||
Cost of goods sold |
710.0 | 687.1 | 794.8 | 878.7 | 779.0 | |||||||||||||
Selling, general and administrative expenses |
398.1 | 382.5 | 443.6 | 503.5 | 489.6 | |||||||||||||
Other (income) expense(2) |
(17.2 | ) | (13.7 | ) | (11.8 | ) | (17.9 | ) | (17.0 | ) | ||||||||
Income from operations |
128.6 | 118.7 | 116.7 | 185.5 | 196.1 | |||||||||||||
Interest expense |
85.6 | 76.6 | 56.5 | 60.5 | 66.5 | |||||||||||||
Other expense, net(3) |
3.5 | 20.6 | 5.0 | 0.8 | 8.1 | |||||||||||||
Income before provision for income taxes |
39.5 | 21.5 | 55.2 | 124.2 | 121.5 | |||||||||||||
Provision for income tax expense |
18.4 | (1.4 | ) | 21.5 | 34.5 | 39.4 | ||||||||||||
Equity in earnings of unconsolidated affiliates |
3.6 | — | — | — | — | |||||||||||||
Income before cumulative effect of change in accounting principle |
24.7 | 22.9 | 33.7 | 89.7 | 82.1 | |||||||||||||
Cumulative effect of change in accounting principle, net of tax |
— | — | — | — | 0.3 | |||||||||||||
Income from continuing operations |
24.7 | 22.9 | 33.7 | 89.7 | 81.8 | |||||||||||||
Loss from discontinued operations |
(38.4 | ) | (9.4 | ) | (37.5 | ) | (12.3 | ) | (8.9 | ) | ||||||||
Income (loss) available to common shareholders |
$ | (13.7 | ) | $ | 13.5 | $ | (3.8 | ) | $ | 77.4 | $ | 72.9 | ||||||
Basic net income (loss) per share: |
||||||||||||||||||
Net income per share |
$ | 0.26 | $ | 0.25 | $ | 0.37 | $ | 0.98 | $ | 0.98 | ||||||||
Cumulative effect of change in accounting principle |
— | — | — | — | — | |||||||||||||
Loss from discontinued operations |
(0.40 | ) | (0.10 | ) | (0.41 | ) | (0.14 | ) | (0.11 | ) | ||||||||
Earnings per common share—Basic |
$ | (0.14 | ) | $ | 0.15 | $ | (0.04 | ) | $ | 0.85 | $ | 0.87 | ||||||
Weighted average shares |
95.9 | 92.3 | 91.2 | 91.3 | 83.6 | |||||||||||||
24
| |
Fiscal Year(1) | |||||||||||||||||
|---|---|---|---|---|---|---|---|---|---|---|---|---|---|---|---|---|---|---|
| |
2010 | 2009 | 2008 | 2007 | 2006 | |||||||||||||
| |
(in millions, except per share data) |
|||||||||||||||||
Diluted net income (loss) per share: |
||||||||||||||||||
Net income per share |
$ | 0.14 | $ | 0.15 | $ | 0.36 | $ | 0.93 | $ | 0.92 | ||||||||
Cumulative effect of change in accounting principle |
— | — | — | — | — | |||||||||||||
Loss from discontinued operations |
(0.13 | ) | (0.05 | ) | (0.40 | ) | (0.13 | ) | (0.10 | ) | ||||||||
Earnings per common share—Diluted |
$ | 0.01 | $ | 0.10 | $ | (0.04 | ) | $ | 0.80 | $ | 0.81 | |||||||
Weighted average shares |
289.9 | 185.6 | 93.7 | 96.3 | 89.6 | |||||||||||||
Balance Sheet Data (at end of period): |
||||||||||||||||||
Current assets |
$ | 345.9 | $ | 386.4 | $ | 295.6 | $ | 343.7 | $ | 345.3 | ||||||||
Total assets |
936.8 | 1,015.5 | 913.5 | 1,019.0 | 999.1 | |||||||||||||
Current liabilities |
177.1 | 229.2 | 238.5 | 321.9 | 288.2 | |||||||||||||
Long term debt, net of current portion |
793.1 | 833.8 | 762.2 | 757.3 | 814.2 | |||||||||||||
Total debt |
795.3 | 847.5 | 783.4 | 793.8 | 832.5 | |||||||||||||
Common stock and options subject to redemption |
— | — | 8.9 | 16.2 | 20.3 | |||||||||||||
Stockholders' deficit |
(87.6 | ) | (108.0 | ) | (167.8 | ) | (131.8 | ) | (173.1 | ) | ||||||||
Other Financial Data: |
||||||||||||||||||
Dividends per common share |
$ | — | $ | — | $ | 0.08 | 0.30 | 0.23 | ||||||||||
Depreciation and amortization |
28.7 | 33.4 | 35.9 | 32.7 | 31.9 | |||||||||||||
Capital expenditures |
(16.6 | ) | (12.4 | ) | (25.0 | ) | (42.4 | ) | (30.9 | ) | ||||||||
Cash flows provided by (used in): |
||||||||||||||||||
Operating activities |
48.5 | 78.7 | 53.7 | 94.4 | 58.2 | |||||||||||||
Investing activities |
(13.6 | ) | (3.3 | ) | (24.9 | ) | (37.4 | ) | (30.3 | ) | ||||||||
Financing activities |
(50.5 | ) | 25.8 | (18.7 | ) | (86.2 | ) | (18.9 | ) | |||||||||
- (1)
- We
use a 52-53 week fiscal year ending on the closest Sunday to November 30, but no later than December 2. The fiscal years
ended November 28, 2010, November 29, 2009, November 30, 2008, and November 26, 2006 were all 52-week years. The fiscal year ended December 2, 2007 was a
53-week year. All stock share amounts have been restated to reflect the 0.7595 to 1 reverse stock split, which became effective on March 23, 2006.
- (2)
- Also
includes the following items to the extent applicable for the periods presented: IPO expenses, recapitalization expenses, stock based compensation,
goodwill impairment charges, business closure charges, plant closing and restructuring charges, amortization of intangibles, asset impairment charges and net royalty income.
- (3)
- Includes $17.4 million of charges related to the Refinancing and extinguishment of debt and interest rate derivatives in fiscal 2009.
25
Item 7. Management's Discussion and Analysis of Financial Condition and Results of Operations
The following management's discussion and analysis is provided as a supplement to, and should be read in conjunction with, our Consolidated Financial Statements and accompanying notes included in this filing. Except where the context suggests otherwise, the terms "we," "us" and "our" refer to Sealy Corporation and its subsidiaries.
We have reclassified the selected financial data for all periods presented to reflect the operations of our European manufacturing operations in France and Italy and our operations in Brazil as discontinued operations. See "Results of Operations—Discontinued Operations" later in this Item 7 for more information. Unless otherwise noted, discussions below pertain to our continuing operations.
Business Overview
We believe we are the largest bedding manufacturer in the world, with a wholesale domestic market share of approximately 19.6% in 2009. We believe our market share in 2010 is comparable to 2009. We manufacture and market a complete line of bedding (innerspring and non-innerspring) products, including mattresses and box springs, holding leading positions in key market categories such as luxury bedding products and among leading retailers. Our conventional bedding products include the Sealy, Sealy Posturepedic, Stearns & Foster and Bassett brands and account for approximately 91% of our total domestic net sales for the year ended November 28, 2010. In addition to our innerspring bedding, we also produce a variety of visco-elastic ("memory foam") and latex foam bedding products. We expect to gain market share in these product lines as we seek to strengthen our competitive position in the specialty bedding (non-innerspring mattress) market. We distinguish ourselves from our major competitors by maintaining our own component parts manufacturing capability and producing substantially all of our mattress innerspring and latex mattress components requirements.
During 2010, we saw the weak economic and retail environments begin to turn around and saw an increase in mattress sales across the industry. From January 2010 through September 2010, the total increase in sales levels, which was driven by the sale of specialty products, was 8.0% as reported by the International Sleep Products Association ("ISPA") sample of leading manufacturers. We expect to see continued improvement in industry sales in 2011.
We have continued our focus on new product development to bring new and innovative products to the market. In February 2010, we introduced Embody by Sealy, a single premium specialty brand that encompasses both memory foam and latex technologies. The Embody line features products at retail price levels ranging from $1,999 to $3,299 per queen set. We also introduced new 60th Anniversary Posturepedic mattresses which feature new innerspring product at retail price points ranging from $750 to $1,000 per queen set. We have recently begun shipping all of these products to retailers.
Our industry has experienced volatility in the price of petroleum-based and steel products, which affects the cost of our polyurethane foam, polyester, polyethylene foam and steel innerspring component parts. Domestic supplies of these raw materials are limited by supplier consolidation, specific exports of these raw materials outside of the United States and other forces beyond our control. During fiscal 2009, the cost of these components decreased and ultimately became more stable in the latter part of fiscal 2009. While these costs remained relatively stable in the first half of fiscal 2010, the costs have shifted upwards during the latter half of fiscal 2010 as feed stocks adjust to market conditions. The manufacturers of products such as petro-chemicals and wire rod, which are the feed stocks purchased by our suppliers of foam and drawn wire appear to be managing excess capacity in an effort to maintain higher prices.
Our foreign subsidiaries contributed 22.0% of our total revenues during fiscal 2010 compared to 19.4% in fiscal 2009. This increase from the prior year has been primarily driven by the favorable changes in foreign currency exchange rates and growth in our Canadian business.
26
Raw Materials
During fiscal 2009, the cost of our steel innerspring, polyurethane foam, polyester, and polyethlylene component parts decreased and ultimately became more stable in the latter part of fiscal 2009. While these costs remained relatively stable in the first half of fiscal 2010, the costs have shifted upwards during the latter half of fiscal 2010 as feed stocks adjust to market conditions. We periodically enter into commodity-based physical contracts to buy natural gas at agreed-upon fixed prices. These contracts are entered into in the normal course of business. During the first quarter of fiscal 2010, we entered into a program through which we hedge a portion of our expected diesel fuel consumption through the use of fixed price swap contracts. These contracts reduce the Company's exposure to the volatility in diesel fuel prices.
Critical Accounting Estimates
Our discussion and analysis of our financial condition and results of operations are based upon our Consolidated Financial Statements that have been prepared in accordance with generally accepted accounting principles in the United States of America ("US GAAP"). The preparation of financial statements in accordance with US GAAP requires our management to make estimates and assumptions that affect the reported amounts of assets, liabilities, revenues and expenses, and the disclosure of contingent assets and liabilities. US GAAP provides the framework from which to make these estimates, assumptions and disclosures. We choose accounting policies within US GAAP that our management believes are appropriate to accurately and fairly report our operating results and financial position in a consistent manner. Our management regularly assesses these policies in light of current and forecasted economic conditions. Our accounting policies are stated in Note 1 to our Consolidated Financial Statements included in Item 8. We believe the following accounting estimates are critical to understanding our results of operations and affect the more significant judgments and estimates used in the preparation of our Consolidated Financial Statements:
Cooperative Advertising, Rebate and Other Promotional Programs—We enter into agreements with our customers to provide funds to the customer for advertising and promotion of our products. We also enter into volume and other rebate programs with our customers whereby funds may be rebated to the customer. When sales are made to these customers, we record liabilities pursuant to these agreements. We periodically assess these liabilities based on actual sales and claims to determine whether all of the cooperative advertising earned will be used by the customer or whether the customers will meet the requirements to receive rebate funds. We generally negotiate these agreements on a customer-by-customer basis. Some of these agreements extend over several periods and are linked with supply agreements. Most of these agreements coincide with our fiscal year; however, our customers typically have ninety days following the end of a period to submit claims for reimbursement of advertising and promotional costs. Therefore, significant estimates are required at any point in time with regard to the ultimate reimbursement to be claimed by our customers. Subsequent revisions to such estimates are recorded and charged to earnings in the period in which they are identified. Changes in underlying spending patterns related to these incentive programs could impact our margins. Costs of these programs totaled $237.3 million, $212.6 million and $227.0 million in fiscal 2010, 2009 and 2008, respectively. Of these costs, amounts associated with volume rebates, supply agreement amortization, slotting fees, end consumer rebates and other customer allowances which were recorded as a reduction of sales were $102.5 million, $94.0 million and $93.9 million in fiscal 2010, 2009 and 2008, respectively. Amounts recorded as a reduction of sales in the U.S. were $78.7 million, $74.8 million and $78.9 million, respectively. The costs associated with cooperative advertising were recorded as selling, general and administrative expenses and were $134.8 million, $118.6 million and $133.1 million in fiscal 2010, 2009 and 2008, respectively.
Allowance for Doubtful Accounts—While we have seen some improvement in the credit environment through 2010, the continued management of credit risk by financial institutions has caused
27
a decrease in the availability of credit for mattress retailers. We continue to actively monitor the financial condition of our customers to determine the potential for any nonpayment of trade receivables. In determining our reserve for bad debts, we also consider other general economic factors. Our management believes that our process of specific review of customers, combined with overall analytical review provides a reliable evaluation of ultimate collectibility of trade receivables. We recorded a bad debt provision of $2.5 million, or approximately 0.2% percent of sales, in fiscal 2010. Provisions for bad debts recorded in fiscal 2009 and 2008 were $3.7 million (approximately 0.3% of sales) and $8.5 million (approximately 0.6% of sales), respectively.
Warranties and Product Returns—Our warranty policy provides a 10 year non-prorated warranty service period on all currently manufactured Sealy Posturepedic, Stearns & Foster and Bassett bedding products and some other Sealy branded products and a 20 year warranty period on the major components of our TrueForm and MirrorForm visco-elastic products as well as our SpringFree latex product, introduced in 2005, the last ten years of which are prorated on a straight-line basis. In 2006, we introduced and subsequently discontinued Right Touch, which has a twenty year limited warranty that covers only certain parts of the product and is prorated for part of the twenty years. We amended our warranty policy on Sealy brand value-priced bedding to three years beginning with our new line introduced in fiscal 2007. The impact of the changes to the warranty policies did not have a significant impact on our financial results or position. Our policy is to accrue the estimated cost of warranty coverage at the time the sale is recorded based on historical trends of warranty costs. We utilize warranty trends on existing similar product in order to estimate future warranty claims associated with newly introduced product. Changes in the historical trends of these returns could impact the estimates for future periods. Our accrued warranty liability totaled $17.6 million and $16.5 million as of November 28, 2010 and November 29, 2009, respectively.
In fiscal 2008, we completed an analysis of our returns claims experience for the U.S. business based on historical return trends using new information that is available which allows us to better track and match claims received to the sales for which those claims were initially recorded. This change in estimate resulted in a reduction of cost of sales of approximately $2.5 million for fiscal 2008 as well as a corresponding reduction in the accrued returns obligation. Our estimate involves an application of the lag time in days between the sale date and the date of its return applied to the current rate of returns.
Share-Based Compensation Plans—We have two share based compensation plans, as described more fully in Note 2 to our Consolidated Financial Statements included in Item 8. For new awards issued and awards modified, repurchased, or cancelled, the cost is equal to the fair value of the award at the date of the grant, and compensation expense is recognized for those awards earned over the service period. Certain of the equity awards vest based upon the Company achieving certain EBITDA performance targets. During the service period, management estimates whether or not the EBITDA performance targets will be met in order to determine the vesting period for those awards and what amount of compensation cost should be recognized related to these awards. At the date of grant, we determine the fair value of the awards using the Black-Scholes option pricing formula, the trinomial lattice model or the closing price of the Company's common stock, as appropriate under the circumstances. Management estimates the period of time the employee will hold the option prior to exercise and the expected volatility of Sealy Corporation's stock, each of which impacts the fair value of the stock options. The fair value of restricted shares and restricted share units is based upon the closing price of the Company's common stock as of the grant date. We also estimate the amount of share-based awards that are expected to be forfeited based on the historical forfeiture rates experienced for our outstanding awards.
Self-Insurance Liabilities—We are self-insured for certain losses related to medical claims with excess loss coverage of $375,000 per claim per year. We also utilize large deductible policies to insure claims related to general liability, product liability, automobile, and workers' compensation. Our
28
recorded liability represents an estimate of the ultimate cost of claims incurred as of the balance sheet date. The estimated workers' compensation liability is discounted and is established based upon analysis of historical data and actuarial estimates, and is reviewed by us and third-party actuaries on a quarterly basis to ensure that the liability is appropriate. While management believes these estimates are reasonable based on the information currently available, if actual trends, including the severity or frequency of claims, medical cost inflation, or fluctuations in premiums, differ from our estimates, our results of operations could be impacted. As of November 28, 2010 and November 29, 2009, $4.2 million and $3.9 million of the recorded liability for workers' compensation is included as a component of other accrued liabilities and $7.1 million and $6.5 million is included as a component of other noncurrent liabilities within the accompanying Consolidated Balance Sheets, respectively
Impairment of Goodwill—We assess goodwill at least annually for impairment as of the beginning of the fiscal fourth quarter or whenever events or circumstances indicate that the carrying value of goodwill may not be recoverable from future cash flows. We assess recoverability using several methodologies, including the present value of estimated future cash flows and comparisons of multiples of enterprise values to earnings before interest, taxes, depreciation and amortization ("EBITDA"). The analysis is based upon available information regarding expected future cash flows of each reporting unit discounted at rates consistent with the cost of capital specific to the reporting unit. If the carrying value of the reporting unit exceeds the indicated fair value of the reporting unit, a second analysis is performed to allocate the fair value to all assets and liabilities. If, based on the second analysis, it is determined that the implied fair value of the goodwill of the reporting unit is less than the carrying value, goodwill is considered impaired.
Our fiscal 2009 annual evaluation for goodwill impairment indicated a potential impairment of the goodwill for our Argentina reporting unit. As a result, we estimated the implied fair value of the goodwill in this reporting unit compared to carrying amounts and recorded an impairment charge of $1.2 million to impair the entire balance of goodwill recorded in the Argentina reporting unit. The impairment charge is based upon the fair value of the assets and liabilities of the reporting unit.
In the fourth quarter of fiscal 2008, market conditions deteriorated significantly. This deterioration resulting from the global economic downturn had not yet matured or been considered in our annual test of goodwill. Because of the potential impact of these conditions on our projections and the indicated fair value of our reporting units, we performed an interim evaluation of goodwill in the fourth quarter of 2008 reflecting our current views regarding the impact of the changed economic environment. This analysis indicated potential impairment in the goodwill of our Puerto Rico reporting unit. As a result, we estimated the implied fair value of the goodwill in this reporting unit compared to carrying amounts and recorded an impairment charge of $2.8 million for the entire balance. The impairment charge recorded in fiscal 2008 was based upon a measurement of the fair value of property and equipment and certain intangible assets, including customer relationships. During fiscal 2009, we completed our measurement of the impairment loss for the reporting unit and concluded that the entire balance of the goodwill of this reporting unit was determined to be impaired.
The total carrying value of our goodwill was $362.0 million and $360.6 million at November 28, 2010 and November 29, 2009, respectively. Based on the results of our annual impairment testing, the fair value of the reporting units that maintain goodwill balances at November 28, 2010 significantly exceeded their carrying value.
Commitments and Contingencies—We are subject to legal proceedings, claims, and litigation arising in the ordinary course of business. A negative outcome of these matters is considered remote, and management does not expect that the ultimate costs to resolve these matters will have a material adverse effect on our consolidated financial position, results of operations or cash flows.
29
Income Taxes—We record an income tax valuation allowance when the realization of certain deferred tax assets, including net operating losses, is not more likely than not. These deferred tax items represent expenses recognized for financial reporting purposes, which may result in tax deductions in the future. Certain judgments, assumptions and estimates may affect the carrying value of the valuation allowance and income tax expense in the Consolidated Financial Statements. Our net deferred tax assets at November 28, 2010 were $24.4 million, net of a $20.0 million valuation allowance.
Significant judgment is required in evaluating our federal, state and foreign tax positions and in the determination of our tax provision. Despite our belief that our liability for unrecognized tax benefits is adequate, it is often difficult to predict the final outcome or the timing of the resolution of any particular tax matters. We may adjust these liabilities as relevant circumstances evolve, such as guidance from the relevant tax authority, our tax advisors, or resolution of issues in the courts. These adjustments are recognized as a component of income tax expense entirely in the period in which they are identified.
Results of Operations
Tabular Information
The following table sets forth our summarized results of operations for fiscal years 2010, 2009 and 2008, expressed in thousands of dollars as well as a percentage of each year's net sales:
| |
Fiscal year(1) | |||||||||||||||||||
|---|---|---|---|---|---|---|---|---|---|---|---|---|---|---|---|---|---|---|---|---|
| |
2010 | 2009 | 2008 | |||||||||||||||||
| |
(in thousands) |
(percentage of net sales) |
(in thousands) |
(percentage of net sales) |
(in thousands) |
(percentage of net sales) |
||||||||||||||
Net sales |
$ | 1,219,471 | 100.0 | % | $ | 1,174,581 | 100.0 | % | $ | 1,343,323 | 100.0 | % | ||||||||
Cost of goods sold(2) |
709,971 | 58.2 | 687,095 | 58.5 | 794,824 | 59.2 | ||||||||||||||
Gross profit |
509,500 | 41.8 | 487,486 | 41.5 | 548,499 | 40.8 | ||||||||||||||
Selling, general and administrative expenses(2) |
398,053 | 32.6 | 382,514 | 32.6 | 443,606 | 33.0 | ||||||||||||||
Goodwill impairment loss |
— | — | 1,188 | 0.1 | 2,831 | — | ||||||||||||||
Amortization expense |
289 | — | 289 | — | 289 | — | ||||||||||||||
Restructuring expenses and asset impairment |
— | — | 1,256 | 0.1 | 2,465 | — | ||||||||||||||
Royalty income, net of royalty expense |
(17,529 | ) | (1.4 | ) | (16,432 | ) | (1.4 | ) | (17,323 | ) | (1.3 | ) | ||||||||
Income from operations |
128,687 | 10.6 | 118,671 | 10.1 | 116,631 | 9.1 | ||||||||||||||
Interest expense |
85,617 | 7.0 | 76,582 | 6.5 | 56,456 | 4.2 | ||||||||||||||
Loss on rights for convertible notes |
— | — | 4,549 | 0.4 | — | — | ||||||||||||||
Refinancing and extinguishment of debt and interest rate derivatives |
3,759 | 0.3 | 17,423 | 1.5 | 5,378 | 0.4 | ||||||||||||||
Gain on sale of subsidiary stock |
— | — | (1,292 | ) | (0.1 | ) | — | — | ||||||||||||
Other income, net |
(226 | ) | — | (70 | ) | — | (388 | ) | — | |||||||||||
Income before income taxes |
39,537 | 3.3 | 21,479 | 1.8 | 55,185 | 4.5 | ||||||||||||||
Income tax provision (benefit) |
18,488 | 1.5 | (1,380 | ) | (0.1 | ) | 21,548 | 1.6 | ||||||||||||
Equity in earnings of unconsolidated affiliates |
3,611 | 0.3 | — | — | — | — | ||||||||||||||
Income from continuing operations |
24,660 | 1.8 | 22,859 | 1.9 | 33,637 | 2.9 | ||||||||||||||
Loss from discontinued operations |
(38,399 | ) | (3.1 | ) | (9,374 | ) | (0.8 | ) | (37,440 | ) | (2.8 | ) | ||||||||
Net (loss) income |
$ | (13,739 | ) | (4.9 | %) | $ | 13,485 | 2.7 | % | $ | (3,803 | ) | (5.7 | %) | ||||||
- (1)
- We use a 52-53 week fiscal year ending on the closest Sunday to November 30, but no later than December 2. The fiscal years ended November 28, 2010, November 29, 2009 and November 30, 2008 were 52-week years.
30
- (2)
- Included in our selling, general and administrative expenses for fiscal years 2010, 2009 and 2008 were $67.4 million, $65.1 million and $78.8 million, respectively, in shipping and handling costs associated with the delivery of finished mattress products to our customers, including approximately $5.7 million, $5.7 million and $7.3 million, respectively, of costs associated with internal transfers between our plant locations. With respect to these costs, our cost of goods sold may not be comparable with that reported by other entities.
The following table indicates the percentage distribution of our net sales in U.S. dollars throughout our international operations:
Geographic distribution of sales:
| |
Fiscal year(1) | ||||||||||
|---|---|---|---|---|---|---|---|---|---|---|---|
| |
2010 | 2009 | 2008 | ||||||||
United States |
78.0 | % | 80.6 | % | 78.6 | % | |||||
Canada |
15.2 | 12.9 | 14.0 | ||||||||
Other |
6.8 | 6.5 | 7.4 | ||||||||
Total |
100.0 | % | 100.0 | % | 100.0 | % | |||||
- (1)
- We use a 52-53 week fiscal year ending on the closest Sunday to November 30, but no later than December 2. The fiscal years ended November 28, 2010, November 29, 2009 and November 30, 2008 were 52-week years.
31
The following table shows our net sales and margin profitability for the major geographic regions of our operations, including local currency results for the significant international operations:
| |
Fiscal year(1) | |||||||||||||||||||||
|---|---|---|---|---|---|---|---|---|---|---|---|---|---|---|---|---|---|---|---|---|---|---|
| |
2010 | 2009 | 2008 | |||||||||||||||||||
| |
(in thousands) |
(percentage of net sales) |
(in thousands) |
(percentage of net sales) |
(in thousands) |
(percentage of net sales) |
||||||||||||||||
United States (US Dollars): |
||||||||||||||||||||||
Net sales |
951,106 | 100.0 | 946,950 | 100.0 | 1,055,590 | 100.0 | ||||||||||||||||
Cost of goods sold |
558,607 | 58.7 | 546,486 | 57.7 | 626,903 | 59.4 | ||||||||||||||||
Gross profit |
392,499 | 41.3 | 400,464 | 42.3 | 428,687 | 40.6 | ||||||||||||||||
Total International (US Dollars): |
||||||||||||||||||||||
Net sales |
268,365 | 100.0 | 227,631 | 100.0 | 287,733 | 100.0 | ||||||||||||||||
Cost of goods sold |
151,364 | 56.4 | 140,609 | 61.8 | 167,921 | 58.4 | ||||||||||||||||
Gross profit |
117,001 | 43.6 | 87,022 | 38.2 | 119,812 | 41.6 | ||||||||||||||||
Canada: |
||||||||||||||||||||||
US Dollars: |
||||||||||||||||||||||
Net sales |
185,706 | 100.0 | 151,387 | 100.0 | 187,672 | 100.0 | ||||||||||||||||
Cost of goods sold |
102,785 | 55.3 | 95,004 | 62.8 | 108,672 | 57.9 | ||||||||||||||||
Gross profit |
82,921 | 44.7 | 56,383 | 37.2 | 79,000 | 42.1 | ||||||||||||||||
Canadian Dollars: |
||||||||||||||||||||||
Net sales |
192,713 | 100.0 | 173,121 | 100.0 | 195,373 | 100.0 | ||||||||||||||||
Cost of goods sold |
106,655 | 55.3 | 108,868 | 62.9 | 113,431 | 58.1 | ||||||||||||||||
Gross profit |
86,058 | 44.7 | 64,253 | 37.1 | 81,942 | 41.9 | ||||||||||||||||
Other International (US Dollars): |
||||||||||||||||||||||
Net sales |
82,659 | 100.0 | 76,244 | 100.0 | 100,061 | 100.0 | ||||||||||||||||
Cost of goods sold |
48,579 | 58.8 | 45,605 | 59.8 | 59,249 | 59.2 | ||||||||||||||||
Gross profit |
34,080 | 41.2 | 30,639 | 40.2 | 40,812 | 40.8 | ||||||||||||||||
- (1)
- We use a 52-53 week fiscal year ending on the closest Sunday to November 30, but no later than December 2. The fiscal years ended November 28, 2010, November 29, 2009 and November 30, 2008 were 52-week years.
Year Ended November 28, 2010 Compared With Year Ended November 29, 2009
Net Sales. Our consolidated net sales for the year ended November 28, 2010 were $1,219.5 million, a increase of $44.9 million, or 3.8% from the year ended November 29, 2009. This increase was primarily related to our Canadian operations. Total U.S. net sales increased $4.2 million to $951.1 million from $947.0 million in fiscal 2009, an increase of 0.4%. The U.S. net sales increase of $4.2 million was attributable primarily to a 0.6% increase in wholesale unit volume, coupled with a 0.3% decrease in wholesale average unit selling price. The increase in unit volume is primarily attributable to the successful launch of our new Stearns & Foster line which was partially offset by unit declines in other product lines. The decrease in wholesale average unit selling price was due to our response to competitive pressures. International net sales increased $40.7 million, or 17.9% from fiscal
32
2009 to $268.4 million. This increase was primarily attributable to the strong performance of our Canadian operations. In Canada, local currency sales increases of 11.3% translated into increases of 22.7% in U.S. dollars due to a higher average value of the Canadian dollar versus the U.S. dollar during the first three quarters of fiscal 2010. Local currency sales increases in our Canadian market were driven by a 16.4% increase in unit volume and a 4.4% decrease in average unit selling price. The increase in unit volume was driven by the performance of our value oriented beds and the strength of our new Stearns & Foster line. The lower average unit selling price was driven primarily by strategic merchandising and promotional activity. Elsewhere in the Company, we have experienced sales increases in our Mexican and South American markets.
Gross Profit. Gross profit for fiscal 2010 was $509.5 million, an increase of $22.0 million compared to fiscal 2009. As a percentage of net sales, gross profit in fiscal 2010 increased 0.3 percentage points to 41.8%. The increase in percentage of net sales was primarily due to an increase in gross profit margins in our Canadian operations. U.S. gross profit decreased $8.0 million to $392.5 million or 41.3% of net sales, which is a decrease of 1.0 percentage points of net sales from the prior year period. The decrease as a percent of sales was primarily attributable to our response to competitive pressures and greater discounting on products that are near the end of their life cycle in anticipation of our new Posturepedic product that is expected to be introduced in fiscal 2011. Partially offsetting these decreases were improvements in operating efficiencies and value engineering efforts. Material costs did not have a significant impact on the results as lower costs in the first half of the year were offset as prices increased during the third and fourth quarters. The local currency gross profit margin in Canada was 44.7% as a percentage of net sales which represents an increase of 7.6 percentage points from fiscal 2009. This performance represents a return to historical levels and was driven by a reduction in material costs per unit due to currency fluctuations on raw material purchases, operational efficiencies and higher absorption of fixed manufacturing expenses due to increased sales volume.
Selling, General, and Administrative. Selling, general, and administrative expenses increased $15.5 million to $398.1 million for fiscal 2010 compared to $382.5 million for fiscal 2009. As a percentage of net sales, selling, general, and administrative expenses were consistent between fiscal 2010 and 2009 at 32.6%. The increase in absolute dollars is primarily due to a $16.5 million increase in volume driven variable expenses primarily driven by a $15.4 million increase in cooperative advertising and promotional costs. Fixed operating costs, exclusive of non-cash compensation expense, decreased $12.8 million from the prior year period primarily due to an $11.3 million decrease in cash incentive-based compensation costs and expected defined contribution plan payments. These decreases were offset by increased product launch and advertising costs of $1.5 million. Non-cash compensation expense increased by $3.2 million compared to fiscal 2009 due primarily to the recognition of expense related to the restricted share unit grants that occurred in the third quarter of fiscal 2009.
Goodwill impairment loss. During fiscal 2009, we recognized a total non-cash charge of $1.2 million related to the impairment of goodwill of our Argentina reporting unit. The impairment was indicated by our fiscal 2009 annual impairment testing of goodwill performed in the fourth quarter of fiscal 2009. The goodwill impairment reflected a reduction in the fair value of Argentina as a result of lower expected cash flows for the business and represents the entire goodwill balances for this reporting unit. No such charges were recognized during fiscal 2010.
Restructuring expenses and asset impairment. We recognized pretax restructuring costs of $1.3 million during fiscal 2009. These charges primarily relate to the following actions:
In the second quarter of fiscal 2009, management made the decision to cease manufacturing of certain foundation components and begin purchasing all of these components from third-party suppliers. As a result, we incurred certain insignificant costs related to one-time terminations of
33
employees. Additionally, we recognized an impairment charge of approximately $1.2 million for the related equipment used in this manufacturing process that was not sold. This plan was completed in the second quarter of fiscal 2009.
No such restructuring charges were recognized in fiscal 2010.
Royalty Income, net of royalty expense. Our consolidated royalty income, net of royalty expense, for fiscal 2010 increased $1.1 million to $17.5 million from fiscal 2009 primarily due to increased sales by our international licensees along with favorable fluctuations in international currency rates.
Interest Expense. Our consolidated interest expense in fiscal 2010 increased by $9.0 million from the prior year period to $85.6 million. Our weighted average borrowing costs for fiscal 2010 and 2009 were 10.7% and 9.6%, respectively. Our borrowing cost was unfavorably impacted by our 2009 Refinancing which resulted in increased interest rates and outstanding debt balances.
We recognize non-cash interest related to the PIK interest on our outstanding Convertible Notes and the accretion or amortization of original issue discount and deferred debt issuance costs. The table below provides a breakout of cash and non-cash interest for fiscal 2010 and 2009:
| |
Twelve Months Ended | |||||||
|---|---|---|---|---|---|---|---|---|
| |
November 28, 2010 | November 29, 2009 | ||||||
| |
(in thousands) |
|||||||
Cash interest expense |
$ | 63,121 | $ | 65,684 | ||||
Non-cash interest expense |
22,496 | 10,898 | ||||||
Total interest expense |
$ | 85,617 | $ | 76,582 | ||||
Refinancing and extinguishment of debt and interest rate derivatives. Debt extinguishment and refinancing expenses for fiscal 2010 included non-cash charges of $2.7 million related to the write-off of debt issuance costs and original issue discount associated with the $35.0 million of Senior Notes that were repurchased this period. Also included was a cash charge of $1.1 million which represents the premium that was paid to repurchase these notes.
Debt extinguishment and refinancing expenses for fiscal 2009 includes non-cash charges of $2.1 million relating to the write-off of debt issuance costs related to our old senior term loans. Additionally, we incurred $15.2 million of charges associated with termination payments on our interest rate swap agreements that were associated with the old senior credit facility.
Income Tax. Our effective income tax rate generally differs from the federal statutory rate due to the effects of certain foreign tax rate differentials and state and local income taxes. Our effective tax rate for fiscal 2010 and fiscal 2009 was 46.8% and (6.4)%, respectively. The effective rate for the fiscal 2010 period increased primarily due to the effect of non-deductible paid-in-kind interest which resulted from the Refinancing in the second quarter of 2009. Additionally, fiscal 2009 results included a larger benefit resulting from the release of more uncertain tax positions than were recognized in fiscal 2010.
Discontinued Operations. During the fourth quarter of fiscal 2010, we divested the assets of our European manufacturing operations in France and Italy which represented our Europe segment. Also during the fourth quarter of fiscal 2010, we discontinued our operations in Brazil and transitioned to a license arrangement with third parties in this market. We accounted for these businesses as discontinued operations, and, accordingly, we have reclassified the results of operations and any losses resulting from disposition for all periods presented to reflect them as such. Amounts recognized in fiscal 2010 include an impairment charge of $23.0 million and a loss on disposal of $2.4 million.
34
Year Ended November 29, 2009 Compared With Year Ended November 30, 2008
Net Sales. Our consolidated net sales for the year ended November 29, 2009 were $1,174.6 million, a decrease of $168.7 million, or 12.6% from the year ended November 30, 2008. Total U.S. net sales of $947.0 million for fiscal 2009 decreased $108.6 million from $1,055.6 million in fiscal 2008, a decrease of 10.3%. The U.S. net sales decrease of $108.6 million was attributable primarily to a 9.8% decrease in wholesale unit volume, coupled with a 0.2% decrease in wholesale average unit selling price. The decrease in unit volume resulted from weak retail demand throughout the year. The slight decrease in average unit selling price was due to increased interest in our value-priced Sealy brand product as a result of its appeal to more price conscious consumers in this economic environment. However, those decreases were partially offset by increased interest in our newly designed Stearns & Foster product line which was introduced in the second quarter of fiscal 2009, the favorable impact of the July 2008 price increase, increased delivery revenue and fewer discounted floor samples in fiscal 2009 as the Stearns & Foster product launch was not distributed as widely as the Posturepedic product launched in fiscal 2008. International net sales decreased $60.1 million, or 20.9% from fiscal 2008 to $227.6 million. This decline was due to the weak retail environment in all of our major markets. In Canada, local currency sales decreases of 11.4% translated into decreases of 19.3% in U.S. dollars due to a lower average value of the Canadian dollar versus the U.S. dollar. Local currency sales decreases in our Canadian market were driven by a 10.3% decrease in unit volume and a 1.2% decrease in average unit selling price. The decrease in unit volume is primarily attributable to weak Canadian retail demand while the decrease in average unit selling price is due to increased sales of value oriented beds. We have experienced sales decreases in our Mexican and South American markets.
Gross Profit. Gross profit for fiscal 2009 was $487.5 million, a decrease of $61.0 million compared to fiscal 2008. As a percentage of net sales, gross profit in fiscal 2009 increased 0.7 percentage points to 41.5%. The increase as a percentage of net sales was driven by improvements in the U.S., partially offset by decreases in Canada and our other international businesses. U.S. gross profit decreased $28.2 million to $400.5 million or 42.3% of net sales, which is an increase of 1.7 percentage points of net sales from the prior year period. The increase in percentage of net sales was driven primarily by the continued favorable impact of operations efficiencies and lower material costs. Partially offsetting these improvements was a decrease in absorption of fixed costs. The local currency gross profit margin in Canada was 37.1% as a percentage of net sales which represents a decrease of 4.8 percentage points from fiscal 2008. This decrease as a percentage of sales was driven by the impact of currency fluctuations on raw materials purchases.
Selling, General, and Administrative. Selling, general, and administrative expenses decreased $61.1 million to $382.5 million for fiscal 2009 compared to $443.6 million for fiscal 2008. As a percentage of net sales, selling, general, and administrative expenses were 32.6% for fiscal 2009 compared to 33.0% for fiscal 2008. The slight decrease as a percent of sales is due to reductions in both fixed and variable expenses. The decrease in absolute dollars is primarily due to a $36.7 million reduction in volume driven variable expenses including an $18.1 million decrease in cooperative advertising and promotional costs, a $13.7 million decrease in delivery costs due primarily to a decrease in unit volume shipped and a $4.9 million decrease in bad debt expense. Fixed operating costs, exclusive of compensation expense, decreased $46.4 million from the prior year period primarily due to reductions in national advertising expenses of $14.5 million and discretionary expenditures such as professional fees and travel and entertainment. Compensation expense increased $19.1 million compared to fiscal 2008. This increase is primarily due to increases of $16.5 million for incentive-based payments and expected defined contribution plan payments, coupled with the recognition of share-based compensation expense of $9.3 million, which is non-cash in nature and the effects of which were partially offset by lower compensation expense due to reduced headcount. In addition, foreign exchange transaction and severance related costs improved $7.4 million and $4.7 million, respectively from fiscal 2008.
35
Goodwill impairment loss. During fiscal 2009, we recognized a total non-cash charge of $1.2 million related to the impairment of goodwill of our Argentina reporting unit. The impairment was indicated by our fiscal 2009 annual impairment testing of goodwill performed in the fourth quarter of fiscal 2009. The goodwill impairment reflected a reduction in the fair value of Argentina as a result of lower expected cash flows for the business and represents the entire goodwill balances for this reporting unit.
During fiscal 2008, we recognized a total non-cash charge of $2.8 million related to the impairment of goodwill of our Puerto Rico reporting unit. The impairment was indicated by an update to our fiscal 2008 annual impairment testing of goodwill performed in the fourth quarter of fiscal 2008. The goodwill impairment reflected a reduction in the fair value of Puerto Rico as a result of lower expected cash flows for the business and represents the entire goodwill balances for those reporting units.
Restructuring expenses and asset impairment. We recognized pretax restructuring costs of $1.3 million during fiscal 2009 as compared with costs of $2.5 million recognized in fiscal 2008. These charges primarily relate to the following actions:
In the second quarter of fiscal 2009, management made the decision to cease manufacturing of certain foundation components and begin purchasing all of these components from third-party suppliers. As a result, we incurred certain insignificant costs related to one-time terminations of employees. Additionally, we recognized an impairment charge of approximately $1.2 million for the related equipment used in this manufacturing process that was not sold. This plan was completed in the second quarter of fiscal 2009.
In the third quarter of fiscal 2008, management made the decision to close its manufacturing facility in Clarion, Pennsylvania. We recorded a pre-tax restructuring and impairment charge related to this action of $2.5 million during fiscal 2008, of which $1.6 million was related to employee severance and benefits and other exit costs, and $0.9 million of which was non-cash in nature, related to fixed asset impairment charges. During fiscal 2009, we incurred additional charges related to this action of $0.1 million primarily related to relocation costs. This plan was completed in the first quarter of fiscal 2009.
Royalty Income, net of royalty expense. Our consolidated royalty income, net of royalty expense, for fiscal 2009 decreased $0.9 million to $16.4 million from fiscal 2008 primarily due to the decreased domestic license sales along with unfavorable fluctuations in international currency rates.
Interest Expense. Our consolidated interest expense in fiscal 2009 increased by $20.1 million from the prior year period to $76.6 million which includes $5.3 million of non-cash interest expense related to our Convertible Notes. Our weighted average borrowing costs for fiscal 2009 and 2008 were 9.6% and 7.3%, respectively. Our borrowing cost was unfavorably impacted by our 2009 Refinancing which resulted in increased interest rates and outstanding debt balances.
Refinancing and extinguishment of debt and interest rate derivatives. Debt extinguishment and refinancing expenses for fiscal 2009 includes non-cash charges of $2.1 million relating to the write-off of debt issuance costs related to our old senior term loans. Additionally, we incurred $15.2 million of charges associated with termination payments on our interest rate swap agreements that were associated with the old senior credit facility. During fiscal 2008, we incurred cash charges of $5.4 million related to the amendment of our senior credit facility which represents amounts paid to the creditors in connection with the amendment.
Income Tax. Our effective income tax rate generally differs from the federal statutory rate due to the effects of certain foreign tax rate differentials and state and local income taxes. Our effective tax rate for fiscal 2009 and fiscal 2008 was (6.4)% and 39.0%, respectively. The effective rate for the fiscal
36
2009 period was decreased primarily due to the reversal of $11.0 million of the liability for uncertain tax positions and related interest (net) and penalties due to the expiration of statutes of limitations offset by lower pre-tax income in fiscal 2009. The effective rate for the fiscal 2008 period was also increased due to lower pre-tax income and the impairment of goodwill for our Puerto Rico reporting unit which is not tax deductible.
Discontinued Operations. During fiscal 2010, we divested the assets of our European manufacturing operations in France and Italy which represented our Europe segment. Also during 2010, we discontinued our operations in Brazil and transitioned to a license arrangement with third parties in this market. We accounted for these businesses as discontinued operations, and, accordingly, we have reclassified the results of operations for all periods presented to reflect them as such.
Liquidity and Capital Resources
Principal Sources of Funds
Our principal sources of funds are cash flows from operations and borrowings under our asset-based revolving credit facility which provides commitments of up to $100.0 million and matures in May 2013 (the "ABL Revolver"). No borrowings were made against the ABL Revolver during fiscal 2010. Our principal use of funds consists of operating expenditures, payments of interest on our senior debt, capital expenditures, and interest payments on our outstanding senior subordinated notes. Capital expenditures totaled $16.6 million for fiscal 2010. During fiscal 2010, there was no significant spending for additional production capacity. We believe that annual capital expenditure limitations in our current debt agreements will not prevent us from meeting our ongoing capital needs. Our introductions of new products typically require us to make initial cash investments in inventory, promotional supplies and employee training which may not be immediately recovered through new product sales. However, we believe that we have sufficient liquidity to absorb such expenditures related to new products and that these expenses will not have a significant adverse impact on our operating cash flow which we believe to be sufficient to support our operations. At November 28, 2010, we had approximately $41.4 million available for borrowing under the ABL Revolver which represents the calculated borrowing base reduced by outstanding letters of credit of $16.0 million. We currently believe that our liquidity is adequate to meet our anticipated cash requirements. The calculated borrowing base under the ABL Revolver is determined based on our domestic accounts receivable and inventory balances. Our net weighted average borrowing cost was 10.7%, 9.6% and 7.3% for fiscal 2010, 2009 and 2008, respectively. As of January 4, 2011, we had no borrowings outstanding under the ABL Revolver.
Approximately $41.0 million of our outstanding cash balance at November 29, 2010 is held in foreign jurisdictions. While we are not prohibited from repatriating these funds to the U.S., the cost of doing so may be significant depending upon the prevailing tax rates.
On May 13, 2009, we announced a comprehensive plan to refinance our old senior credit facility and replace it with indebtedness that has longer-dated maturities and eliminates quarterly financial ratio based maintenance covenants. The Refinancing converted much of the existing senior debt from debt bearing interest at variable rates to debt bearing interest at fixed rates. Our interest expense in future periods is expected to increase due to the accounting treatment of the beneficial conversion feature associated with our Convertible Notes (as discussed below). However, we do not expect cash interest payments to change significantly due to the payment in kind interest associated with the Convertible Notes. Based on our current cash position and the availability of funds through our ABL Revolver, we believe that we will be able to obtain additional funds as necessary during fiscal 2011 in order to support our operations.
37
Debt
In connection with the Refinancing, we: 1) entered into a new asset-based revolving credit facility which provides commitments of up to $100.0 million maturing in May 2013, which bears interest at our choice of either a base rate (determined by reference to the higher of several rates as defined by the ABL Revolver agreement) or a LIBOR rate for U.S. dollar deposits plus an applicable margin of 4.00%; 2) issued $350.0 million in aggregate principal amount of senior secured notes due April 2016 (the "Senior Notes"), which bear interest at 10.875% per annum payable semi-annually; and 3) issued $177.1 million in aggregate principal amount of senior secured convertible paid in kind ("PIK") notes due July 2016 which are convertible into shares of the Company's common stock (the "Convertible Notes") and bear interest at 8.00% per annum payable semi-annually in the form of additional Convertible Notes.
At November 28, 2010 there were no amounts outstanding under the ABL Revolver. The Company did not borrow any amounts under this agreement during the course of fiscal 2010. The Senior Notes have an outstanding balance of $304.3 million at November 28, 2010 which gives effect to an unamortized original issue discount of $10.7 million. As of November 28, 2010, the Convertible Notes have an outstanding balance of $181.3 million which includes accrued PIK interest and the effects of the accounting for the beneficial conversion features that were recognized upon each of the January 15, 2010 and July 15, 2010 interest payment dates. See Note 8 of our Consolidated Financial Statements included in Item 8 for further details. We also have an outstanding principal balance of $268.9 million at November 28, 2010 on the 8.25% Senior Subordinated Notes due 2014 (the "2014 Notes").
Future interest payments are expected to be paid out of cash flows from operations and borrowings on our ABL Revolver. The ABL Revolver provides for revolving credit financing, subject to borrowing base availability. The borrowing base consists of the following: 1) 85% of the net amount of eligible accounts receivable and 2) the lesser of (i) 85% of the net orderly liquidation value of eligible inventory or (ii) 65% of the net amount of eligible inventory. These amounts are reduced by reserves deemed necessary by the lenders. At November 28, 2010, there were no amounts outstanding under the ABL Revolver.
Prior to the Refinancing, we had outstanding three interest rate swap agreements related to term debt under our Old Senior Credit Facility. In connection with the Refinancing, we paid $15.2 million to terminate these interest rate swap agreements. As the future variable interest rate payments are no longer likely to be made, the amounts which had previously been recorded in accumulated other comprehensive income were charged to refinancing expense for the year ended November 29, 2009.
The outstanding 2014 Notes consist of an original $314 million aggregate principal amount maturing June 15, 2014, bearing interest at 8.25% per annum payable semiannually in arrears on June 15 and December 15, commencing on December 15, 2004. At November 28, 2010, the outstanding balance of the 2014 Notes was $268.9 million.
38
At November 28, 2010, we were in compliance with the covenants contained within our ABL Revolver agreement and the indentures governing the Senior Notes, the Convertible Notes and the 2014 Notes. These agreements also restrict our ability to pay dividends and repurchase common stock.
As part of our ongoing evaluation of our capital structure, we continually assess opportunities to reduce our debt, which opportunities may from time to time include the redemption or repurchase of a portion of our Senior Notes, the 2014 Notes or the Convertible Notes to the extent permitted by our debt covenants. During the second quarter of fiscal 2010, the Company redeemed 10%, or $35.0 million, of the principal amount of its outstanding Senior Notes at a redemption price of 103% of the principal amount of the notes, plus accrued and unpaid interest to the redemption date. During the fourth quarter of fiscal 2009, the Company repurchased and retired $5.0 million aggregate principal amount of the 2014 Notes on the open market at 99.06% of par, plus accrued interest. In addition, our Board authorized a common stock repurchase program on February 19, 2007 under which we may repurchase up to $100 million of our common stock. As of November 28, 2010, we have repurchased shares for $16.3 million under this program, none of which was repurchased during fiscal 2010. From November 28, 2010 through January 4, 2011, we did not repurchase any additional shares under this program.
Our ability to make scheduled payments of principal, or to pay the interest or liquidated damages, if any, on or to refinance our indebtedness, or to fund planned capital expenditures will depend on our future performance, which, to a certain extent, is subject to general economic, financial, competitive, legislative, regulatory and other factors that are beyond our control. We will be required to make scheduled principal payments of $2.2 million during the next twelve months, with $1.7 million for our financing obligations and capital leases and the remainder for debt owed by our international subsidiaries. However, as we continually evaluate our ability to make additional prepayments as permitted under our ABL Revolver agreement and the indentures governing the Senior Notes, the Convertible Notes and the 2014 Notes, it is possible that we will redeem or repurchase portions of our senior or subordinated debt during that time.
Dividend
The indentures governing the Senior Notes, the 2014 Notes and the Convertible Notes contain restrictions on our ability to pay dividends. Additionally, our ABL Revolver agreement includes a requirement that we meet a minimum fixed charge coverage ratio for the payment of dividends. Although we meet the minimum fixed charge coverage ratio requirement as of November 28, 2010, we do not expect to declare a dividend for the fourth quarter of fiscal 2010.
39
Cash Flow Analysis
The following table summarizes our changes in cash:
| |
Fiscal year(1) | ||||||||||||
|---|---|---|---|---|---|---|---|---|---|---|---|---|---|
| |
2010 | 2009 | 2008 | ||||||||||
| |
(in thousands) |
||||||||||||
Statement of Cash Flow Data: |
|||||||||||||
Cash flows provided by (used in): |
|||||||||||||
Operating activities |
$ | 48,466 | $ | 78,653 | $ | 53,713 | |||||||
Investing activities |
(13,589 | ) | (3,263 | ) | (24,913 | ) | |||||||
Financing activities |
(50,516 | ) | 26,494 | (18,669 | ) | ||||||||
Effect of exchange rate changes on cash |
(6,533 | ) | 2,947 | 1,858 | |||||||||
Change in cash and cash equivalents |
(22,172 | ) | 104,831 | 11,989 | |||||||||
Cash and cash equivalents: |
|||||||||||||
Beginning of period |
131,427 | 26,596 | 14,607 | ||||||||||
End of period |
$ | 109,255 | $ | 131,427 | $ | 26,596 | |||||||
- (1)
- We use a 52-53 week fiscal year ending on the closest Sunday to November 30, but no later than December 2. The fiscal years ended November 28, 2010, November 29, 2009 and November 30, 2008 were 52-week years.
Year Ended November 28, 2010 Compared With Year Ended November 29, 2009
Cash Flows from Operating Activities. Our cash flow from operations decreased $30.2 million to a $48.5 million net source of cash for the year ended November 28, 2010, compared to a $78.7 million net source of cash for the year ended November 29, 2009. Cash used for working capital in fiscal 2010 increased by $51.9 million compared with fiscal 2009. This decrease has been driven primarily by higher inventory levels due to changes in the sourcing of certain product, higher incentive compensation payments made in fiscal 2010 and the receipt of $8.0 million of income tax refunds during fiscal 2009. These decreases have been partially offset by higher net income after adjustments for the loss on disposition of the European and Brazilian business, non-cash interest and non-cash compensation.
Cash Flows used in Investing Activities. Our cash flows used in investing activities increased approximately $10.3 million from fiscal 2009 primarily due to higher capital expenditures in fiscal 2010 in addition to the $8.4 million of proceeds from the sale-leaseback of our South Gate, California facility received in fiscal 2009.
Cash Flows used in Financing Activities. Our cash flow used in financing activities for the year ended November 28, 2010 was $50.5 million compared with cash provided by financing activities in fiscal 2009 of $26.5 million. This significant use of cash in fiscal 2010 has been primarily driven by the redemption of $35.0 million of Senior Notes whereas the Refinancing provided approximately $44.0 million of cash after considering the effects of the payments of costs to issue our new debt in fiscal 2009.
Year Ended November 29, 2009 Compared With Year Ended November 30, 2008
Cash Flows from Operating Activities. Our cash flow from operations increased $24.9 million to a $78.7 million net source of cash for the year ended November 29, 2009, compared to a $53.7 million net source of cash for the year ended November 30, 2008. This increase has been driven by an increase in net income from fiscal 2008 of $17.3 million coupled with net cash provided by changes in working capital in fiscal 2009 of $14.9 million compared with a net use of cash for working capital in fiscal 2008
40
of $17.0 million. This increase has been driven, in part by the receipt of $8.0 million of income tax refunds and improved working capital management during fiscal 2009.
Cash Flows used in Investing Activities. Our cash flows used in investing activities decreased approximately $21.7 million from fiscal 2008 primarily due to $8.4 million of proceeds from the sale-leaseback of our South Gate, California facility coupled with $12.5 million lower capital expenditures as compared with fiscal 2008.
Cash Flows used in Financing Activities. Our cash flow provided by financing activities for the year ended November 29, 2009 was $26.5 million compared with cash used in financing activities in fiscal 2008 of $18.7 million. This change has been primarily driven by the Refinancing which provided approximately $44.0 million of cash after considering the effects of the payments of costs to issue our new debt.
Debt Covenants
Events of Default
Our long-term obligations contain various financial tests and covenants, but do not require that we meet quarterly financial ratio targets in order to maintain compliance with the terms of the obligations unless we are in a minimum availability period under the terms of the ABL Revolver.
Our ABL Revolver requires us to meet a minimum fixed charge coverage ratio in order to incur additional indebtedness and make dividend distributions to holders of our common stock, subject to certain exceptions. Additionally, the ABL Revolver requires us to maintain a fixed charge coverage ratio in excess of 1.1 to 1.0 in periods of minimum availability where the availability for two consecutive calendar days is less than the greater of 1) 15% of the total commitment under the ABL Revolver and 2) $15.0 million. As of November 28, 2010, we were not in a minimum availability period and did not have any outstanding borrowings under the ABL Revolver. The fixed charge coverage ratio is defined by the ABL Revolver as the ratio of Adjusted EBITDA less unfinanced capital expenditures and net cash taxes paid to fixed charges which include cash payments for interest, capital lease obligations, scheduled principal payments on debt and other restricted payments.
Restrictions on Certain Transactions
The covenants contained in our senior debt agreements also restrict our ability to enter into certain transactions (the most significant of which are summarized below). Our ABL Revolver requires us to meet a minimum fixed charge coverage ratio of 1.25 to 1.00 in order to make certain restricted payments including dividend distributions to holders of our common stock, dividends or distributions to the parent company (Sealy Corporation), and debt repayments, subject to certain exceptions. The fixed charge coverage ratio is defined by the ABL Revolver agreement as the ratio of Adjusted EBITDA less unfinanced capital expenditures and net cash paid to fixed charges which include cash payments for interest, capital lease obligations, scheduled principal payments on debt and restricted payments. At November 28, 2010, adjustments to Adjusted EBITDA for cash taxes paid and unfinanced capital expenditures were $36.5 million. Fixed charges as calculated under the terms of the ABL Revolver agreement were $67.7 million. This results in a fixed charge coverage ratio of 2.09 to 1.00 at November 28, 2010 under the terms of the ABL Revolver agreement.
The indentures governing our Senior Notes, Convertible Notes and Senior Subordinated Notes also require us to meet a fixed charge coverage ratio of 2.0 to 1.0 in order to incur additional indebtedness and make certain restricted payments, including dividends or equity distributions, subject to certain exceptions. The fixed charge coverage ratio is defined by the indentures related to these notes as the ratio of Adjusted EBITDA to fixed charges which include interest expense, and cash dividend payments on certain preferred stock. At November 28, 2010, fixed charges as calculated under
41
the terms of the indentures governing our Senior Notes, Convertible Notes and Senior Subordinated Notes were $81.3 million, resulting in a fixed charge coverage ratio of 2.19 to 1.00.
Non-compliance with the minimum fixed charge coverage ratio contained in the ABL Revolver agreement and the indentures governing the Senior Notes, Convertible Notes and 2014 Notes would prohibit Sealy Mattress Company and its subsidiaries from being able to incur additional indebtedness other than pursuant to specified exceptions.
The covenants contained within our debt agreements are based on what we refer to herein as "Adjusted EBITDA". In the senior debt agreements, Adjusted EBITDA is defined as net income plus interest, taxes, depreciation and amortization adjusted to exclude unusual items and other adjustments permitted in calculating covenant compliance. Adjusted EBITDA is presented herein as it is a material component of these covenants. Additionally, management uses Adjusted EBITDA to evaluate the Company's operating performance and we believe that this measure provides useful incremental information to investors regarding our operating performance. While the determination of "unusual items" is subject to interpretation and requires judgment, we believe the adjustments listed below are in accordance with the covenants.
Adjusted EBITDA is not a recognized term under GAAP and does not purport to be an alternative to net income as a measure of operating performance or to cash flows from operating activities as a measure of liquidity. Additionally, it is not intended to be a measure of free cash flow for management's discretionary use, as it does not consider certain cash requirements such as interest payments, tax payments and debt service requirements. Because not all companies use identical calculations, these presentations may not be comparable to other similarly titled measures of other companies.
The following table sets forth a reconciliation of net income to EBITDA and EBITDA to Adjusted EBITDA for the years ended November 28, 2010, November 29, 2009, and November 30, 2008 (in thousands):
| |
2010 | 2009 | 2008 | ||||||||
|---|---|---|---|---|---|---|---|---|---|---|---|
Net income (loss) |
$ | (13,739 | ) | $ | 13,485 | $ | (3,803 | ) | |||
Interest expense |
85,617 | 76,582 | 56,456 | ||||||||
Income taxes |
18,488 | (1,380 | ) | 21,548 | |||||||
Depreciation and amortization |
25,664 | 25,824 | 29,154 | ||||||||
EBITDA |
116,030 | 114,511 | 103,355 | ||||||||
Adjustments for debt covenants: |
|||||||||||
Refinancing charges |
3,759 | 17,488 | 5,378 | ||||||||
Non-cash compensation |
15,862 | 12,638 | 3,375 | ||||||||
KKR consulting fees |
1,881 | 2,862 | 2,195 | ||||||||
Severance charges |
2,150 | 2,502 | 6,019 | ||||||||
Goodwill impairment |
0 | 1,188 | 2,831 | ||||||||
Restructuring and impairment related charges |
0 | 3,623 | 3,402 | ||||||||
Loss on written option derivative |
0 | 4,549 | 0 | ||||||||
Discontinued operations |
38,399 | 9,374 | 37,440 | ||||||||
Other (various)(a) |
(196 | ) | (1,714 | ) | 1,554 | ||||||
Adjusted EBITDA |
$ | 177,885 | $ | 167,021 | $ | 165,549 | |||||
- (a)
- Consists of various immaterial adjustments.
As of and during the fiscal years ended November 28, 2010, November 29, 2009, and November 30, 2008, we were in compliance with the covenants contained within our debt instruments.
42
Off-Balance Sheet Arrangements
We occupy premises and utilize equipment under operating leases that expire at various dates through 2023. In accordance with generally accepted accounting principles, the obligations under those leases are not recorded on our balance sheet. Many of these leases provide for payment of certain expenses and contain renewal and purchase options. During the fiscal years ended November 28, 2010, November 29, 2009, and November 30, 2008, we recognized lease expenses of $19.2 million, $18.5 million and $18.1 million, respectively.
We are involved in a group of joint ventures to develop markets for Sealy branded products in Asia. These joint ventures are not considered to be variable interest entities and are therefore not consolidated for financial statement purposes. We account for our interest in the joint ventures under the equity method, and our net investment of $7.2 million is recorded as a component of other assets including debt issuance costs, net within the Consolidated Balance Sheet at November 28, 2010. We believe that any possible commitments arising from these joint ventures will not be significant to our consolidated financial position or results of operations.
In connection with the sale of our European manufacturing operations, we made certain guarantees with respect to the existence of liabilities and deficiencies related to assets as of the closing date that were not reflected in the European business' financial statements as of the closing date. Further, certain guarantees were made with respect to losses or damages incurred by the purchaser related to any misrepresentations or warranties made by us, outstanding disputes or judicial proceedings. Such guarantees are limited to an aggregate amount of 3.5 million Euro under the terms of the contract. As of November 28, 2010, we know of no outstanding contingencies that would be covered by this guarantee and we have concluded that the fair value is insignificant.
Contractual Obligations and Commercial Commitments
As previously discussed, our debt at November 28, 2010 consists of an asset-based revolving credit facility, under which no amounts are outstanding, $304.3 million of senior notes due 2016, $181.3 million of convertible paid-in kind notes due 2016, $268.9 million outstanding aggregate principal amount of senior subordinated notes due 2014, $39.9 million due on our financing obligations and an additional $0.8 million of other borrowings, most of which are owed by our international subsidiaries. The outstanding balance of the Convertible Notes indicated above includes accrued PIK interest and the effects of the accounting for the beneficial conversion features that were recognized upon the each of the January 15, 2010 and July 15, 2010 interest payment dates. See Note 8 of our Consolidated Financial Statements included in Item 8 for further details.
We engage in various hedging activities in order to mitigate the risk of variability in future cash flows resulting from floating interest rates on our debt and projected foreign currency and commodity purchase requirements. Accordingly, we have entered into contractual arrangements for interest rate swaps, foreign currency forward and option contracts, and fixed price swap agreements for diesel fuel. The related assets and liabilities associated with the fair value of such derivative instruments are recorded on our balance sheet. Changes in the fair value of these derivatives are recorded in our income statement, except for those associated with those agreements which have been designated as cash flow hedges for accounting purposes.
Significant judgment is required in evaluating our federal, state and foreign tax positions and in the determination of our tax provision. Despite our belief that the liability for unrecognized tax benefits is adequate, it is often difficult to predict the final outcome or the timing of the resolution of any particular tax matter. We may adjust these liabilities as relevant circumstances evolve, such as guidance from the relevant tax authority, or resolution of issues in the courts. These adjustments are recognized as a component of income tax expense entirely in the period in which they are identified. While we are currently undergoing examinations of certain of our corporate income tax returns by tax authorities, no issues related to these liabilities for uncertain tax positions have been presented to us and we have not been informed that such audits will result in an assessment or payment of taxes related to these positions during the one year period following November 28, 2010.
43
In accordance with FASB authoritative guidance on accounting for uncertainty in income taxes, we maintain a reserve for uncertain tax positions. At November 28, 2010, the entire net reserve for uncertain tax positions is $19.1 million and $1.4 million as a reduction of non-current deferred tax asset (including penalties and interest). At this time, we are unable to make a reasonably reliable estimate of the timing of payments in individual years beyond 12 months due to uncertainties in the timing of the effective settlement of tax positions. As such, the unrecognized tax benefit liabilities are not included in the table below.
Our contractual obligations and other commercial commitments as of November 28, 2010 are summarized below (in thousands):
Contractual Obligations
|
2011 | 2012 | 2013 | 2014 | 2015 | After 2016 | Total Obligations |
|||||||||||||||
|---|---|---|---|---|---|---|---|---|---|---|---|---|---|---|---|---|---|---|---|---|---|---|
Principal maturities of long-term debt |
$ | 2,166 | $ | 1,638 | $ | 1,849 | $ | 271,148 | $ | 2,431 | $ | 516,018 | $ | 795,250 | ||||||||
Projected interest on long-term debt(1) |
73,641 | 74,797 | 76,049 | 67,218 | 56,633 | 35,781 | 384,119 | |||||||||||||||
Projected cash flows on derivatives(2) |
163 | — | — | — | — | — | 163 | |||||||||||||||
Operating leases(3) |
11,651 | 10,262 | 8,200 | 5,952 | 4,662 | 17,435 | 58,162 | |||||||||||||||
Total |
$ | 87,621 | $ | 86,697 | $ | 86,098 | $ | 344,318 | $ | 63,726 | $ | 569,234 | $ | 1,237,694 | ||||||||
Other Commercial Commitments |
2011 |
2012 |
2013 |
2014 |
2015 |
After 2016 |
Total Commitments |
|||||||||||||||
Standby Letters of Credit(4) |
$ | 15,956 | — | — | — | — | — | $ | 15,956 | |||||||||||||
- (1)
- $0.8 million
of our outstanding debt at November 28, 2010 is subject to variable interest rates. Interest payments are projected based on
rates in effect at November 28, 2010 assuming no variable rate fluctuations going forward. An increase in the interest rates applicable to the unhedged portion of our variable rate debt by 1%
would result in an insignificant amount of additional annual cash interest expense. Further, these amounts include the paid in kind interest obligation related to our Convertible Notes which does not
represent a cash interest payment.
- (2)
- Our
hedging instruments consist of the projected net settlements of our interest rate swaps and foreign currency contracts as of November 28, 2010
based on the expected timing of the net payments to be received under the agreements and have not been included in the above presentation as they do not currently represent obligations of the Company.
The fair value of these instruments can fluctuate based on market conditions.
- (3)
- Obligations
under operating leases include only projected payments under current lease terms, excluding renewal options and assuming no exercise of any
purchase options.
- (4)
- We issue letters of credit in the ordinary course of business primarily to back our various obligations under workers compensation and other insurance programs, environmental liabilities, and open positions on certain of our derivative instruments. These obligations will renew automatically on an annual basis unless cancelled per our instructions.
As discussed in Note 17 to our Consolidated Financial Statements included in Item 8, we have an $8.7 million long term obligation arising from underfunded pension plans. Future minimum pension funding requirements are not included in the schedule above as they are not available for all periods presented. During fiscal 2011, we estimate that we will make approximately $2.1 million in contributions to the plans. In fiscal 2010, we contributed $1.6 million into the plans.
44
There are no agreements to purchase goods or services with fixed or minimum obligations. The schedule above does not include normal purchases which are made in the ordinary course of business.
Foreign Operations and Export Sales
We operate three manufacturing and distribution center facilities in Canada, and one each in Mexico, Argentina, and Uruguay. We participate in a group of joint ventures with our Australian licensee to import, manufacture, distribute and sell Sealy branded products in South East Asia. On December 1, 2008, a fifty percent interest in our operations in South Korea was sold for $1.4 million to our Australian licensee and these operations became part of the joint venture. On December 4, 2008, the Company and its Australian licensee each acquired a 50% interest in a joint venture that owns the assets of our former New Zealand licensee. The purchase price for the 50% ownership was $1.9 million. Additional contributions of $0.4 million were made by each party to the joint venture to fund the initial working capital of this entity. (See Note 12 to the Consolidated Financial Statements in Item 8). We also export products directly into many small international markets, and have license agreements in Thailand, Japan, the United Kingdom, Continental European Union countries, Brazil, Spain, Australia, South Africa, Israel, Jamaica, Saudi Arabia, the Bahamas and the Dominican Republic.
During fiscal 2010, we divested the assets of our European manufacturing operations in France and Italy which represented our Europe segment. Also during 2010, we discontinued our operations in Brazil and transitioned to a license arrangement with third parties in this market. We accounted for these businesses as discontinued operations, and, accordingly, we have reclassified the selected financial data for all periods presented to reflect them as such.
Impact of Recently Issued Authoritative Accounting Guidance
In December 2007, the Financial Accounting Standards Board ("FASB") issued authoritative guidance on noncontrolling interests in consolidated financial statements. This guidance establishes accounting and reporting standards for the noncontrolling interest in a subsidiary and for the deconsolidation of a subsidiary. The Company adopted this guidance in the first quarter of fiscal 2010, and it did not have a material impact on its financial statements.
In December 2007, the FASB issued authoritative guidance on business combinations, which significantly changes the principles and requirements for how the acquirer of a business recognizes and measures in its financial statements the identifiable assets acquired, the liabilities assumed, and any noncontrolling interest in the acquiree. The FASB also issued guidance for recognizing and measuring goodwill acquired in a business combination and what information to disclose to enable users of the financial statements to evaluate the nature and financial effects of the business combination. The Company adopted this guidance in the first quarter of fiscal 2010, and it did not have a material impact on its financial statements.
In April 2008, the FASB issued authoritative guidance on the determination of the useful lives of intangible assets, which amends the factors that should be considered in developing renewal or extension assumptions used to determine the useful life of an intangible asset. The Company adopted this guidance in the first quarter of fiscal 2010, and it did not have a material impact on its financial statements.
In June 2008, the FASB issued authoritative guidance which addresses whether instruments granted in share-based payment transactions are participating securities prior to vesting and, therefore, need to be included in the earnings allocation in computing earnings per share. The Company adopted this guidance in the first quarter of fiscal 2010 and retrospectively restated its earnings per share for previous periods in accordance with this guidance. The adoption did not have a material impact on the current or prior period financial statements presented herein.
45
In November 2008, the Emerging Issues Task Force ("EITF") of the FASB issued authoritative guidance which clarifies the accounting for certain transactions involving equity method investments. The Company adopted this guidance in the first quarter of fiscal 2010, and it did not have a material impact on its financial statements.
In June 2009, the FASB issued authoritative guidance on the consolidation of variable interest entities ("VIE"). This new guidance significantly affects the overall consolidation analysis. The Company adopted this guidance in the first quarter of fiscal 2010. The adoption of this guidance did not have a material impact on the Company's financial statements.
General Business Risk
Our customers include furniture stores, specialty sleep shops, department stores, membership warehouse clubs, hospitality customers and other stores. In the future, these customers may consolidate, undergo restructurings or reorganizations, or realign their affiliations, any of which could decrease the number of locations that carry our products. These customers are also subject to changes in consumer spending and the overall state of the economy, both domestically and internationally. As we have seen during the recent economic environment, our business, financial condition and results of operations may be affected by various economic factors. Unfavorable economic conditions such as the global economic recession we have experienced made it more difficult for us to maintain and continue our revenue growth. In an economic recession or under other adverse economic conditions, customers and vendors may be more likely to be unable to meet contractual terms or their payment obligations. Any of these factors could have a material adverse effect on our business, financial condition or results of operations.
Fiscal Year
We use a 52-53 week fiscal year ending on the closest Sunday to November 30, but no later than December 2. The fiscal years ended November 28, 2010, November 29, 2009 and November 30, 2008 were 52-week years.
Forward Looking Statements
"Safe Harbor" Statement Under the Private Securities Litigation Reform Act of 1995. When used in this Annual Report on Form 10-K, the words "believes," "anticipates," "expects," "intends," "projects" and similar expressions are used to identify forward-looking statements within the meaning of Private Securities Litigation Reform Act of 1995. Such forward-looking statements relate to future financial and operation results. Any forward-looking statements contained in this report represent our management's current expectations, based on present information and current assumptions, and are thus prospective and subject to risks and uncertainties which could cause actual results to differ materially from those expressed in such forward-looking statements. Actual results could differ materially from those anticipated or projected due to a number of factors. These factors include, but are not limited to:
- •
- the level of competition in the bedding industry;
- •
- legal and regulatory requirements;
- •
- the success of new products;
- •
- our relationships with our major suppliers;
- •
- fluctuations in costs of raw materials;
- •
- our relationship with significant customers and licensees;
46
- •
- our labor relations;
- •
- departure of key personnel;
- •
- encroachments on our intellectual property;
- •
- product liability claims;
- •
- the timing, cost and success of opening new manufacturing facilities;
- •
- our level of indebtedness;
- •
- interest rate risks;
- •
- access to financial credit by our customers, vendors or us;
- •
- future acquisitions;
- •
- an increase in return rates; and
- •
- other risks and factors identified from time to time in the Company's reports filed with the Securities and Exchange Commission, or the SEC.
All forward-looking statements attributable to us or persons acting on our behalf apply only as of the date of this Annual Report on Form 10-K and are expressly qualified in their entirety by the cautionary statements include in this Annual Report on Form 10-K. Except as may be required by law, we undertake no obligation to publicly update or revise forward-looking statements which may be made to reflect events or circumstances after the date made or to reflect the occurrence of unanticipated events.
Item 7A. Quantitative and Qualitative Disclosures About Market Risk
Foreign Currency Exposures
Our earnings are affected by fluctuations in the value of our subsidiaries' functional currency as compared to the currencies of our foreign denominated purchases. Foreign currency forward and option contracts are used to hedge against a portion of the earnings and cash flow effects of such fluctuations. The result of a uniform 10% change in the value of the U.S. dollar relative to currencies of countries in which we manufacture or sell our products would have an approximate $2.7 million dollar impact on our financial position for the year ended November 28, 2010. This calculation assumes that each exchange rate would change in the same direction relative to the U.S. dollar. We are also exposed to foreign currency fluctuations for license revenue, some of which is denominated in foreign currencies.
To protect against the reduction in value of forecasted foreign currency cash flows resulting from purchases in a foreign currency, we have instituted a forecasted cash flow hedging program. We hedge portions of our purchases denominated in foreign currencies and royalty payments to third parties with forward contracts. At November 28, 2010, we had outstanding forward and option foreign currency contracts to sell Canadian dollars for a total of 35.1 million US dollars. The expiration dates for the Canadian dollar contracts range from December 15, 2010 to November 15, 2011. At November 28, 2010, the fair value of these contracts was an asset of $0.1 million. The changes in fair value of the foreign currency hedges are included in net income, except for those contracts that have been designated as hedges for accounting purposes. For contracts designated as hedges for accounting purposes, the changes in fair value related to the effective portion of the hedge are recognized as a component of accumulated other comprehensive income.
47
Interest Rate Risk
Prior to the Refinancing and the disposition of the European operations, the Company was exposed to interest rate risk associated with fluctuations in the interest rates on its variable interest rate debt. However, the majority of our outstanding debt bears interest at fixed rates, thereby reducing our interest rate risk. We periodically utilize interest rate swap agreements to mitigate the risk related to fluctuations in variable interest rates associated with our outstanding debt instruments. Through the Refinancing and the disposition of our Europe segment, these interest rate swap agreements were terminated and at November 28, 2010, no such agreements were outstanding.
Based on the amount of our variable rate debt outstanding at November 28, 2010, a 12.5 basis point increase or decrease in variable interest rates would have an insignificant impact on our annual interest expense.
Commodity Price Risks
The cost of our steel innerspring, polyurethane foam, polyester, and polyethylene component parts were impacted sharply by the volatility in the prices of steel and petroleum in fiscal 2008. During fiscal 2009, the prices paid for steel and latex foam decreased from prior year levels and stabilized somewhat due to a reduction in the volatility in the related commodity prices through most of 2010. We periodically enter into commodity-based physical contracts to buy natural gas at agreed-upon fixed prices. These contracts are entered into in the normal course of business. During fiscal 2010, we entered into a forecasted cash flow hedging program through which we hedge a portion of our expected diesel fuel consumption through the use of fixed price swap contracts. These contracts reduce our exposure to the volatility in diesel fuel prices. At November 28, 2010, we had contracts outstanding for 0.2 million gallons of diesel fuel to be consumed through January 31, 2011. There were no such contracts outstanding at November 29, 2009.
48
Item 8. Financial Statements and Supplementary Data
REPORT OF INDEPENDENT REGISTERED PUBLIC ACCOUNTING FIRM
To
the Board of Directors and Stockholders of
Sealy Corporation
Trinity, North Carolina
We have audited the accompanying consolidated balance sheets of Sealy Corporation and subsidiaries (the "Company") as of November 28, 2010 and November 29, 2009 and the related consolidated statements of operations, stockholders' deficit, and cash flows for each of the three fiscal years in the period ended November 28, 2010. Our audits also included the financial statement schedule listed in the Index at Item 15. These financial statements and financial statement schedule are the responsibility of the Company's management. Our responsibility is to express an opinion on these financial statements and financial statement schedule based on our audits.
We conducted our audits in accordance with the standards of the Public Company Accounting Oversight Board (United States). Those standards require that we plan and perform the audit to obtain reasonable assurance about whether the financial statements are free of material misstatement. An audit includes examining, on a test basis, evidence supporting the amounts and disclosures in the financial statements. An audit also includes assessing the accounting principles used and significant estimates made by management, as well as evaluating the overall financial statement presentation. We believe that our audits provide a reasonable basis for our opinion.
In our opinion, such consolidated financial statements present fairly, in all material respects, the financial position of Sealy Corporation and subsidiaries as of November 28, 2010 and November 29, 2009 and the results of their operations and their cash flows for each of the three fiscal years in the period ended November 28, 2010, in conformity with accounting principles generally accepted in the United States of America. Also, in our opinion, such financial statement schedule, when considered in relation to the basic consolidated financial statements taken as a whole, presents fairly, in all material respects, the information set forth therein.
We have also audited, in accordance with the standards of the Public Company Accounting Oversight Board (United States), the Company's internal control over financial reporting as of November 28, 2010, based on the criteria established in Internal Control—Integrated Framework issued by the Committee of Sponsoring Organizations of the Treadway Commission, and our report dated January 20, 2011 expressed an unqualified opinion on the Company's internal control over financial reporting.
/s/ DELOITTE & TOUCHE LLP
Raleigh, North Carolina
January 20, 2011
49
SEALY CORPORATION
Consolidated Balance Sheets
(in thousands, except per share amounts)
| |
November 28, 2010 |
November 29, 2009 |
||||||
|---|---|---|---|---|---|---|---|---|
ASSETS |
||||||||
Current assets: |
||||||||
Cash and equivalents |
$ | 109,255 | $ | 131,427 | ||||
Accounts receivable (net of allowance for doubtful accounts, discounts and returns, 2010—$25,812; 2009—$26,675) |
140,778 | 156,850 | ||||||
Inventories |
57,178 | 56,810 | ||||||
Prepaid expenses and other current assets |
19,543 | 21,080 | ||||||
Deferred income taxes |
19,127 | 20,222 | ||||||
|
345,881 | 386,389 | ||||||
Property, plant and equipment—at cost: |
||||||||
Land |
7,414 | 10,555 | ||||||
Buildings and improvements |
126,645 | 147,415 | ||||||
Machinery and equipment |
241,766 | 284,468 | ||||||
Construction in progress |
9,645 | 4,551 | ||||||
|
385,470 | 446,989 | ||||||
Less accumulated depreciation |
(217,398 | ) | (239,508 | ) | ||||
|
168,072 | 207,481 | ||||||
Other assets: |
||||||||
Goodwill |
361,958 | 360,583 | ||||||
Other intangibles—net of accumulated amortization (2010—$3,201; 2009—$18,900) |
1,387 | 1,937 | ||||||
Deferred income taxes |
6,140 | 6,874 | ||||||
Debt issuance costs, net, and other assets |
53,319 | 52,206 | ||||||
|
422,804 | 421,600 | ||||||
Total Assets |
$ | 936,757 | $ | 1,015,470 | ||||
See accompanying notes to consolidated financial statements.
50
SEALY CORPORATION
Consolidated Balance Sheets (Continued)
(in thousands, except per share amounts)
| |
November 28, 2010 |
November 29, 2009 |
||||||||
|---|---|---|---|---|---|---|---|---|---|---|
LIABILITIES AND STOCKHOLDERS' DEFICIT |
||||||||||
Current liabilities: |
||||||||||
Current portion-long term obligations |
$ | 2,166 | $ | 13,693 | ||||||
Accounts payable |
66,507 | 88,971 | ||||||||
Accrued expenses: |
||||||||||
Customer incentives and advertising |
34,510 | 31,804 | ||||||||
Compensation |
22,390 | 43,105 | ||||||||
Interest |
14,359 | 15,230 | ||||||||
Warranty |
10,522 | 10,588 | ||||||||
Other |
26,676 | 25,848 | ||||||||
|
177,130 | 229,239 | ||||||||
Long term obligations, net of current portion |
793,084 | 833,766 | ||||||||
Other noncurrent liabilities |
53,357 | 59,625 | ||||||||
Deferred income taxes |
825 | 832 | ||||||||
Commitments and contingencies |
— |
— |
||||||||
Stockholders' deficit: |
||||||||||
Preferred stock, $0.01 par value; Authorized 50,000 shares; Issued, none |
— | — | ||||||||
Common stock, $0.01 par value; Authorized 600,000 shares; Issued and outstanding: 2010—97,688; 2009—94,654 |
979 | 947 | ||||||||
Additional paid-in capital |
911,066 | 885,064 | ||||||||
Accumulated deficit |
(1,006,689 | ) | (992,950 | ) | ||||||
Accumulated other comprehensive income (loss) |
7,005 | (1,053 | ) | |||||||
|
(87,639 | ) | (107,992 | ) | ||||||
Total Liabilities and Stockholders' Deficit |
$ | 936,757 | $ | 1,015,470 | ||||||
See accompanying notes to consolidated financial statements.
51
SEALY CORPORATION
Consolidated Statements of Operations
(in thousands, except per share amounts)
| |
Twelve Months Ended | |||||||||||
|---|---|---|---|---|---|---|---|---|---|---|---|---|
| |
November 28, 2010 |
November 29, 2009 |
November 30, 2008 |
|||||||||
Net sales |
$ | 1,219,471 | $ | 1,174,581 | $ | 1,343,323 | ||||||
Cost of goods sold |
709,971 | 687,095 | 794,824 | |||||||||
Gross profit |
509,500 | 487,486 | 548,499 | |||||||||
Selling, general and administrative expenses |
398,053 | 382,514 | 443,606 | |||||||||
Goodwill impairment loss |
— | 1,188 | 2,831 | |||||||||
Amortization expense |
289 | 289 | 289 | |||||||||
Restructuring expenses and asset impairment |
— | 1,256 | 2,465 | |||||||||
Royalty income, net of royalty expense |
(17,529 | ) | (16,432 | ) | (17,323 | ) | ||||||
Income from operations |
128,687 | 118,671 | 116,631 | |||||||||
Interest expense |
85,617 | 76,582 | 56,456 | |||||||||
Loss on rights for convertible notes |
— | 4,549 | — | |||||||||
Refinancing and extinguishment of debt and interest rate derivatives |
3,759 | 17,423 | 5,378 | |||||||||
Gain on sale of subsidiary stock |
— | (1,292 | ) | — | ||||||||
Other income, net |
(226 | ) | (70 | ) | (388 | ) | ||||||
Income before income taxes |
39,537 | 21,479 | 55,185 | |||||||||
Income tax provision (benefit) |
18,488 | (1,380 | ) | 21,548 | ||||||||
Equity in earnings of unconsolidated affiliates |
3,611 | — | — | |||||||||
Income (loss) from continuing operations |
24,660 | 22,859 | 33,637 | |||||||||
Loss from discontinued operations |
(38,399 | ) | (9,374 | ) | (37,440 | ) | ||||||
Net (loss) income |
$ | (13,739 | ) | $ | 13,485 | $ | (3,803 | ) | ||||
(Loss) earnings per common share—Basic |
||||||||||||
Income (loss) from continuing operations per common share |
$ | 0.26 | $ | 0.25 | $ | 0.37 | ||||||
Loss from discontinued operations per common share |
(0.40 | ) | (0.10 | ) | (0.41 | ) | ||||||
(Loss) earnings per common share—Basic |
$ | (0.14 | ) | $ | 0.15 | $ | (0.04 | ) | ||||
Earnings per common share—Diluted |
||||||||||||
Income (loss) from continuing operations per common share |
$ | 0.14 | $ | 0.15 | $ | 0.36 | ||||||
Loss from discontinued operations per common share |
(0.13 | ) | (0.05 | ) | (0.40 | ) | ||||||
Earnings per common share—Diluted |
$ | 0.01 | $ | 0.10 | $ | (0.04 | ) | |||||
Weighted average number of common shares outstanding: |
||||||||||||
Basic |
95,934 | 92,258 | 91,231 | |||||||||
Diluted |
289,857 | 185,639 | 93,729 | |||||||||
See accompanying notes to consolidated financial statements.
52
SEALY CORPORATION
Consolidated Statements of Stockholders' Deficit
(in thousands, except per share amounts)
| |
|
Common Stock | |
|
Accumulated Other Comprehensive Income (Loss) |
|
|||||||||||||||||
|---|---|---|---|---|---|---|---|---|---|---|---|---|---|---|---|---|---|---|---|---|---|---|---|
| |
Comprehensive Income (Loss) |
Additional Paid-in Capital |
Accumulated Deficit |
|
|||||||||||||||||||
| |
Shares | Amount | Total | ||||||||||||||||||||
Balance at December 2, 2007 |
$ | 79,758 | 90,814 | $ | 902 | $ | 654,626 | $ | (796,523 | ) | $ | 9,202 | $ | (131,793 | ) | ||||||||
Net loss |
(3,803 | ) | (3,803 | ) | (3,803 | ) | |||||||||||||||||
Foreign currency translation adjustment |
(24,731 | ) | (24,731 | ) | (24,731 | ) | |||||||||||||||||
Adjustment to defined benefit plan liability, net of tax of $1,045 |
(1,644 | ) | (1,644 | ) | (1,644 | ) | |||||||||||||||||
Change in fair value of cash flow hedge, net of tax of $1,559 |
(2,538 | ) | (2,538 | ) | (2,538 | ) | |||||||||||||||||
Cumulative effect of a change in accounting principle—adoption of certain provisions relating to uncertain tax positions |
(10,460 | ) | (10,460 | ) | |||||||||||||||||||
Share-based compensation: |
|||||||||||||||||||||||
Compensation associated with stock option grants |
2,981 | 2,981 | |||||||||||||||||||||
Directors' deferred stock compensation |
26 | 26 | |||||||||||||||||||||
Current period expense from restricted stock awards |
222 | 222 | |||||||||||||||||||||
Cash dividend ($0.08 per common share) |
(6,811 | ) | (6,811 | ) | |||||||||||||||||||
Exercise of stock options |
986 | 14 | (882 | ) | (868 | ) | |||||||||||||||||
Excess tax benefit on options exercised |
407 | 407 | |||||||||||||||||||||
Reversal of retiree put liability |
2,372 | 2,372 | |||||||||||||||||||||
Adjustment of common stock and options subject to redemption |
1 | 8,795 | 8,796 | ||||||||||||||||||||
Balance at November 30, 2008 |
$ | (32,716 | ) | 91,800 | $ | 917 | $ | 668,547 | $ | (817,597 | ) | $ | (19,711 | ) | $ | (167,844 | ) | ||||||
Net income |
13,485 | 13,485 | 13,485 | ||||||||||||||||||||
Foreign currency translation adjustment |
11,164 | 11,164 | 11,164 | ||||||||||||||||||||
Adjustment to defined benefit plan liability, net of tax of $680 |
(1,814 | ) | (1,814 | ) | (1,814 | ) | |||||||||||||||||
Change in fair value of cash flow hedges, net of tax of $44 |
(136 | ) | (136 | ) | (136 | ) | |||||||||||||||||
Loss on termination of interest rate swaps, net of tax of $5,834 |
9,444 | 9,444 | 9,444 | ||||||||||||||||||||
Share-based compensation: |
|||||||||||||||||||||||
Compensation associated with stock option grants |
4,819 | 4,819 | |||||||||||||||||||||
Directors' deferred stock compensation |
371 | 371 | |||||||||||||||||||||
Compensation associated with restricted stock awards |
667 | 667 | |||||||||||||||||||||
Compensation associated with restricted stock units |
6,776 | 6,776 | |||||||||||||||||||||
Exercise of stock options |
271 | 4 | 23 | 27 | |||||||||||||||||||
Excess tax benefit on options exercised |
(647 | ) | (647 | ) | |||||||||||||||||||
Distribution of rights to purchase convertible notes |
(188,838 | ) | (188,838 | ) | |||||||||||||||||||
Settlement of rights to purchase Convertible Notes |
193,388 | 193,388 | |||||||||||||||||||||
Conversion of Convertible Notes |
2346 | 23 | 2,267 | 2,290 | |||||||||||||||||||
Adjustment of common stock and options subject to redemption |
3 | 8,853 | 8,856 | ||||||||||||||||||||
Balance at November 29, 2009 |
$ | 32,143 | 94,417 | $ | 947 | $ | 885,064 | $ | (992,950 | ) | $ | (1,053 | ) | $ | (107,992 | ) | |||||||
Net loss |
(13,739 | ) | (13,739 | ) | (13,739 | ) | |||||||||||||||||
Foreign currency translation adjustment |
8,041 | 8,041 | 8,041 | ||||||||||||||||||||
Adjustment to defined benefit plan liability, net of tax of ($135) |
549 | 549 | 549 | ||||||||||||||||||||
Change in fair value of cash flow hedges, net of tax of $373 |
(532 | ) | (532 | ) | (532 | ) | |||||||||||||||||
Share-based compensation |
|||||||||||||||||||||||
Compensation associated with stock option grants |
1,771 | 1,771 | |||||||||||||||||||||
Directors' deferred stock compensation |
251 | 251 | |||||||||||||||||||||
Compensation associated with restricted stock awards |
667 | 667 | |||||||||||||||||||||
Compensation associated with restricted stock units |
13,175 | 13,175 | |||||||||||||||||||||
Exercise of stock options |
391 | 4 | 292 | 296 | |||||||||||||||||||
Vesting of restricted share units, net |
2,768 | 27 | (4,627 | ) | (4,600 | ) | |||||||||||||||||
Vesting of restricted shares, net |
112 | 1 | (207 | ) | (206 | ) | |||||||||||||||||
Excess tax benefit on share based awards |
417 | 417 | |||||||||||||||||||||
Beneficial conversion feature on Convertible paid-in-kind Notes |
14,263 | 14,263 | |||||||||||||||||||||
Balance at November 28, 2010 |
$ | (5,681 | ) | 97,688 | $ | 979 | $ | 911,066 | $ | (1,006,689 | ) | $ | 7,005 | $ | (87,639 | ) | |||||||
See accompanying notes to consolidated financial statements.
53
SEALY CORPORATION
Consolidated Statements of Cash Flows
(in thousands)
| |
Twelve Months Ended | ||||||||||||
|---|---|---|---|---|---|---|---|---|---|---|---|---|---|
| |
November 28, 2010 |
November 29, 2009 |
November 30, 2008 |
||||||||||
Operating activities: |
|||||||||||||
Net (loss) income |
$ | (13,739 | ) | $ | 13,485 | $ | (3,803 | ) | |||||
Adjustments to reconcile net income to cash provided by operating activities: |
|||||||||||||
Depreciation and amortization |
28,676 | 33,401 | 35,949 | ||||||||||
Deferred income taxes |
1,121 | (10,403 | ) | 8,318 | |||||||||
Impairment charges |
22.963 | 2,514 | 28,348 | ||||||||||
Amortization of deferred gain on sale-leaseback |
(646 | ) | (644 | ) | — | ||||||||
Paid in kind interest on convertible notes |
16,109 | 5,323 | — | ||||||||||
Amortization of discount on new senior secured notes |
1,431 | 709 | — | ||||||||||
Amortization of debt issuance costs and other |
4,750 | 4,124 | 2,395 | ||||||||||
Loss on rights for convertible notes |
— | 4,549 | — | ||||||||||
Share-based compensation |
15,864 | 12,633 | 3,392 | ||||||||||
Excess tax benefits from share-based payment arrangements |
(417 | ) | — | (406 | ) | ||||||||
Loss on sale of assets |
260 | 975 | 625 | ||||||||||
Write-off of debt issuance costs related to debt extinguishments |
2,709 | 2,195 | — | ||||||||||
Loss on repurchase of senior notes |
1,050 | 0 | — | ||||||||||
Loss on termination of interest rate swaps |
— | 15,232 | — | ||||||||||
Payment to terminate interest rate swaps |
— | (15,232 | ) | — | |||||||||
Loss (Gain) on disposition of subsidiary |
2,399 | (1,292 | ) | — | |||||||||
Other, net |
2,618 | (3,817 | ) | (4,104 | ) | ||||||||
Changes in operating assets and liabilities: |
|||||||||||||
Accounts receivable |
(3,226 | ) | 7,242 | 37,566 | |||||||||
Inventories |
(12,115 | ) | 7,142 | 5,844 | |||||||||
Other current assets |
(3,628 | ) | 16,676 | (3,035 | ) | ||||||||
Other assets |
(3,791 | ) | (1,161 | ) | — | ||||||||
Accounts payable |
(4,873 | ) | (13,064 | ) | (29,922 | ) | |||||||
Accrued expenses |
(8,711 | ) | 8,220 | (28,529 | ) | ||||||||
Other liabilities |
(338 | ) | (10,154 | ) | 1,075 | ||||||||
Net cash provided by operating activities |
48,466 | 78,653 | 53,713 | ||||||||||
Investing activities: |
|||||||||||||
Purchase of property, plant and equipment |
(16,578 | ) | (12,428 | ) | (24,975 | ) | |||||||
Proceeds from sale of property, plant and equipment |
124 | 10,388 | 62 | ||||||||||
Net proceeds (outflow) from disposition of subsidiary |
(340 | ) | 1,237 | — | |||||||||
Investments in and loans to unconsolidated affiliate |
— | (2,322 | ) | — | |||||||||
Repayments of loans and capital from unconsolidated affiliate |
3,205 | (138 | ) | — | |||||||||
Net cash used in investing activities |
(13,589 | ) | (3,263 | ) | (24,913 | ) | |||||||
Financing activities: |
|||||||||||||
Cash dividends |
— | — | (6,811 | ) | |||||||||
Proceeds from issuance of long-term obligations |
4,702 | 6,280 | 9,305 | ||||||||||
Repayments of long-term obligations |
(15,068 | ) | (18,285 | ) | (44,455 | ) | |||||||
Repayment of senior term loans |
— | (377,181 | ) | — | |||||||||
Proceeds from issuance of new senior secured notes |
— | 335,916 | — | ||||||||||
Proceeds from issuance of related party notes |
— | 177,132 | — | ||||||||||
Repayment of related party notes |
— | (83,284 | ) | — | |||||||||
Repayment of senior secured notes, including premium of $1,050 |
(36,050 | ) | — | ||||||||||
Proceeds from issuance of convertible notes |
— | 83,284 | — | ||||||||||
Repayment of subordinated notes, including discounts taken of $47 |
— | (4,953 | ) | — | |||||||||
Borrowings under revolving credit facilities |
— | 141,158 | 283,527 | ||||||||||
Repayments under revolving credit facilities |
— | (205,558 | ) | (260,617 | ) | ||||||||
Repurchase of common stock associated with vesting of employee share-based awards |
(4,806 | ) | — | — | |||||||||
Exercise of employee stock options, including related excess tax benefits |
714 | 30 | 482 | ||||||||||
Debt issuance costs |
— | (27,617 | ) | (100 | ) | ||||||||
Other |
(8 | ) | (428 | ) | — | ||||||||
Net cash (used in) provided by financing activities |
(50,516 | ) | 26,494 | (18,669 | ) | ||||||||
Effect of exchange rate changes on cash |
(6,533 | ) | 2,947 | 1,858 | |||||||||
Change in cash and equivalents |
(22,172 | ) | 104,831 | 11,989 | |||||||||
Cash and equivalents: |
|||||||||||||
Beginning of period |
131,427 | 26,596 | 14,607 | ||||||||||
End of period |
$ | 109,255 | $ | 131,427 | $ | 26,596 | |||||||
Supplemental disclosures: |
|||||||||||||
Taxes paid (net of tax refunds of $5, $8,000, and $159 in fiscal 2010, 2009 and 2008, respectively) |
$ | 20,069 | $ | 12,852 | $ | 22,882 | |||||||
Interest paid |
$ | 66,071 | $ | 69,397 | $ | 58,164 | |||||||
See accompanying notes to consolidated financial statements.
54
SEALY CORPORATION
Notes To Consolidated Financial Statements
Note 1: Basis of Presentation and Significant Accounting Policies
Business
Sealy Corporation and its subsidiaries (the "Company") are engaged in the consumer products business and manufacture, distribute and sell conventional bedding products including mattresses and box springs, as well as specialty bedding products which include latex and visco-elastic mattresses. The Company's products are manufactured in a number of countries in North and South America. Substantially all of the Company's trade accounts receivable are from retail customers. The Company also licenses its brands in markets both domestic and international and receives royalty income from these arrangements. Further, the Company participates in joint ventures which manufacture and distribute product under its brand names in various Asian markets.
Basis of Presentation and Principles of Consolidation
The Consolidated Financial Statements include the accounts of Sealy Corporation and its 100%-owned subsidiary companies. Intercompany transactions are eliminated. The equity method of accounting is used for joint ventures and investments in associated companies over which the Company has significant influence, but does not have effective control and consolidation is not otherwise required under the Financial Accounting Standards Board's (the "FASB") authoritative guidance surrounding the consolidation of variable interest entities ("VIE"). Significant influence is generally deemed to exist when the Company has an ownership interest in the voting stock of the investee of between 20% and 50%, although other factors, such as representation on the investee's Board of Directors, voting rights and the impact of commercial arrangements, are considered in determining whether the equity method of accounting is appropriate. The Company's equity in the net income and losses of these investments is reported in selling, general and administrative expenses in the accompanying Consolidated Statements of Operations. Also, based on triggering events, the Company assesses whether it has any primary beneficial interests in any VIE which would require consolidation of such entity. At November 28, 2010, the Company does not have a VIE for which it is currently required to evaluate whether it is the primary beneficiary.
As discussed in Note 13, in November 2010, the Company divested its European manufacturing operations in France and Italy which represented our Europe segment. The Company also discontinued our operations in Brazil in the fourth quarter of fiscal 2010. In both of these markets, the Company has transitioned to a license arrangement with third parties. We accounted for these businesses as discontinued operations, and, accordingly, we have reclassified the Consolidated Statements of Operations for all periods presented to reflect them as such. The Consolidated Balance Sheet and Statements of Cash Flows have not been adjusted for discontinued operations presentation. Unless otherwise noted, discussions in these notes pertain to our continuing operations.
At November 28, 2010, affiliates of Kohlberg Kravis Roberts & Co. L.P. ("KKR") controlled approximately 47.7% of the issued and outstanding common stock of the Company.
55
SEALY CORPORATION
Notes To Consolidated Financial Statements (Continued)
Note 1: Basis of Presentation and Significant Accounting Policies (Continued)
Significant accounting policies used in the preparation of the Consolidated Financial Statements are summarized below.
Fiscal Year
The Company uses a 52-53 week fiscal year ending on the closest Sunday to November 30, but no later than December 2. The fiscal years ended November 28, 2010, November 29, 2009 and November 30, 2008 were 52-week years.
Recently Issued Authoritative Accounting Guidance
In December 2007, the FASB issued authoritative guidance on noncontrolling interests in consolidated financial statements. This guidance establishes accounting and reporting standards for the noncontrolling interest in a subsidiary and for the deconsolidation of a subsidiary. The Company adopted this guidance in the first quarter of fiscal 2010, and it did not have a material impact on its financial statements.
In December 2007, the FASB issued authoritative guidance on business combinations, which significantly changes the principles and requirements for how the acquirer of a business recognizes and measures in its financial statements the identifiable assets acquired, the liabilities assumed, and any noncontrolling interest in the acquiree. The FASB also issued guidance for recognizing and measuring goodwill acquired in a business combination and what information to disclose to enable users of the financial statements to evaluate the nature and financial effects of the business combination. The Company adopted this guidance in the first quarter of fiscal 2010, and it did not have a material impact on its financial statements.
In April 2008, the FASB issued authoritative guidance on the determination of the useful lives of intangible assets, which amends the factors that should be considered in developing renewal or extension assumptions used to determine the useful life of an intangible asset. The Company adopted this guidance in the first quarter of fiscal 2010, and it did not have a material impact on its financial statements.
In June 2008, the FASB issued authoritative guidance which addresses whether instruments granted in share-based payment transactions are participating securities prior to vesting and, therefore, need to be included in the earnings allocation in computing basic and diluted earnings per share. The Company adopted this guidance in the first quarter of fiscal 2010 and retrospectively restated its basic and diluted earnings per share for previous periods in accordance with this guidance. The adoption did not have a material impact on the current or prior period financial statements presented herein.
In November 2008, the Emerging Issues Task Force ("EITF") of the FASB issued authoritative guidance which clarifies the accounting for certain transactions involving equity method investments. The Company adopted this guidance in the first quarter of fiscal 2010, and it did not have a material impact on its financial statements.
In December 2008, the FASB issued authoritative guidance on employers' disclosures about plan assets of a defined benefit pension or other postretirement plan. This interpretation is effective for financial statements issued for fiscal years ending after December 15, 2009. The Company has adopted this interpretation in the fourth quarter of fiscal 2010, and has included the required disclosures in the financial statements related to the assets of the Company's defined benefit pension plans.
56
SEALY CORPORATION
Notes To Consolidated Financial Statements (Continued)
Note 1: Basis of Presentation and Significant Accounting Policies (Continued)
In June 2009, the FASB issued authoritative guidance on the consolidation of VIEs. This new guidance significantly affects the overall consolidation analysis. The Company adopted this guidance in the first quarter of fiscal 2010. The adoption of this guidance did not have a material impact on the Company's financial statements.
In January 2010, the FASB issued authoritative guidance to amend the disclosure requirements related to recurring and nonrecurring fair value measurements. The guidance requires new disclosures on the transfers of assets and liabilities between Level 1 and Level 2 of the fair value measurement hierarchy, including the reasons and timing of the transfers, which the Company adopted in the second quarter of fiscal 2010. Additionally, the guidance requires a rollforward of activities related to the purchases, sales, issuance and settlements of assets and liabilities measured using Level 3 fair value measurements. The Company will adopt this guidance in the first quarter of fiscal 2012. The adoption of this guidance will increase the level of disclosures in the financial statements related to fair value measurements.
In January 2010, the FASB issued authoritative guidance to amend the accounting and reporting requirements for decreases in ownership of a subsidiary. This guidance requires that a decrease in the ownership interest of a subsidiary that does not result in a change of control be treated as an equity transaction. The guidance also expands the disclosure requirements about the deconsolidation of a subsidiary. The Company adopted this guidance in the first quarter of fiscal 2010 and it did not have a material impact on its financial statements.
In July 2010, the FASB issued authoritative guidance which requires expanded disclosures about the credit quality of an entity's financing receivables and its allowance for credit losses on a disaggregated basis. The Company will adopt the portion of this guidance which pertains to disclosures as of the end of a reporting period in the first quarter of fiscal 2011. The Company will adopt the portion of this guidance which pertains to the activity that occurs during a reporting period in the second quarter of fiscal 2011. The adoption of this guidance will increase the level of disclosures in the financial statements related to the credit quality of its financing receivables and allowance for credit losses.
In December 2010, the FASB issued authoritative guidance which modifies the requirements of step 1 of the goodwill impairment test for reporting units with zero or negative carrying amounts. The Company will adopt this guidance in the first quarter of fiscal 2012. The Company is still assessing the potential impact of adoption.
Revenue Recognition
The Company recognizes revenue when realized or realizable and earned, which is when the following criteria are met: persuasive evidence of an arrangement exists; delivery has occurred; the sales price is fixed or determinable; and collectibility is reasonably assured. The recognition criteria are met when title and risk of loss have transferred from the Company to the buyer, which is upon delivery to the customer sites or as determined by legal requirements in foreign jurisdictions. At the time revenue is recognized, the Company provides for the estimated costs of warranties and reduces revenue for estimated returns and cash discounts. The Company also records reductions to revenue for customer incentive programs offered including volume discounts, promotional allowances, slotting fees and supply agreement amortization, and records liabilities pursuant to these agreements. The Company periodically assesses these liabilities based on actual sales and claims to determine whether the customers will meet
57
SEALY CORPORATION
Notes To Consolidated Financial Statements (Continued)
Note 1: Basis of Presentation and Significant Accounting Policies (Continued)
the requirements to receive rebate funds. The Company generally negotiates these agreements on a customer-by-customer basis. Some of these agreements extend over several periods and are linked with supply agreements. Accordingly, $102.5 million, $94.0 million, and $93.9 million were recorded as a reduction of revenue for fiscal 2010, 2009 and 2008, respectively.
We continue to actively monitor the financial condition of our customers to determine the potential for nonpayment of trade receivables. In determining our allowance for doubtful accounts, we also consider other general economic factors. Our management believes that our process of specific review of customers, combined with overall analytical review provides a reliable evaluation of ultimate collectibility of trade receivables. We recorded a bad debt provision of $2.5 million, $3.7 million and $8.5 million in fiscal 2010, 2009 and 2008, respectively which is recorded as a component of selling, general and administrative expenses in the Consolidated Statements of Operations.
Product Delivery Costs
Included in the Company's selling, general and administrative expenses in the consolidated statement of operations for fiscal 2010, 2009 and 2008 were $67.4 million, $65.1 million and $78.8 million, respectively, in shipping and handling costs associated with the delivery of finished mattress products to its customers, including approximately $5.7 million, $5.8 million and $7.3 million, respectively, of costs associated with internal transfers between plant locations. Since we include these costs within selling, general and administrative expenses, our cost of goods sold may not be comparable with that reported by other entities.
Concentrations of Credit and Other Risk
Financial instruments that potentially subject the Company to significant concentrations of credit risk consist principally of cash and cash equivalents, receivables, foreign currency forward and option contracts and interest rate swap arrangements. The Company places its cash and cash equivalents with major financial institutions and limits the amount of credit exposure to any one institution.
The Company's accounts receivable arise from sales to numerous customers in a variety of markets and geographies around the world. Receivables arising from these sales are generally not collateralized. The Company's customers include furniture stores, national mass merchandisers, specialty sleep shops, department stores, contract customers and other stores. The top five customers accounted for approximately 36.9%, 32.6% and 28.4% of the Company's net sales for the years ended November 28, 2010, November 29, 2009 and November 30, 2008, respectively. One customer accounted for more than 10% of the Company's net sales in fiscal 2010, 2009 and 2008. The Company performs ongoing credit evaluations of its customers' financial conditions and maintains reserves for estimated credit losses. Such losses, in the aggregate, have not materially exceeded management's estimates.
The counterparties to the Company's foreign currency and commodity-based fixed price swap agreements are major financial institutions. The Company has not experienced non-performance by any of its counterparties nor does the Company expect there to be significant non-performance risks associated with its derivative counterparties at November 28, 2010.
The Company is presently dependent upon a single supplier for certain polyurethane foam components in its mattress units. Such components are purchased under a supply agreement, and are manufactured in accordance with proprietary process designs exclusive to the supplier. The Company has incorporated these methods of construction into many of its branded products. The Company
58
SEALY CORPORATION
Notes To Consolidated Financial Statements (Continued)
Note 1: Basis of Presentation and Significant Accounting Policies (Continued)
continually looks to develop alternative supply sources, allowing acquisition of similar component parts which meet the functional requirement of various product lines. The Company also purchases a significant portion of its box spring components from a single supplier and manufactures only a minor amount of these parts. The Company is also dependent on a single supplier for the visco-elastic components and assembly of its TrueForm and Embody specialty product lines. The related product in which these components and assembly processes are used does not represent a significant portion of overall sales. Except for its dependence regarding certain polyurethane foam and visco-elastic components and assembly of its TrueForm and Embody specialty product lines, the Company does not consider itself to be dependent upon any single outside vendor as a source of supply to its conventional bedding or specialty businesses, and the Company believes that sufficient sources of supply for the same, similar or alternative components are available.
Approximately 67% of the employees at the Company's 25 North American plants are represented by various labor unions with separate collective bargaining agreements. The Company's current collective bargaining agreements, which are typically three years in length, expire at various times beginning in fiscal 2011 through 2013. Of the employees covered by collective bargaining agreements, approximately 36% are under contracts expiring in fiscal 2011. Certain employees at the Company's international facilities are also covered by collective bargaining agreements, which expire at various terms between fiscal 2011 and 2013.
Use of Estimates
The preparation of financial statements in conformity with generally accepted accounting principles in the United States of America requires management to make estimates and assumptions that affect the amount of assets and liabilities and disclosures on contingent assets and liabilities at year end and the reported amounts of revenue and expenses during the reporting period. Actual results may differ from these estimates. Material estimates that are particularly susceptible to significant change relate to the determination of the accrued warranty obligation, allowance for doubtful accounts, discounts and returns, cooperative advertising and promotional accruals, share-based compensation, valuation of goodwill and intangible assets, reserve for workers' compensation claims, benefit plan obligations and expenses, environmental contingencies and tax assets, liabilities and expense.
See "Warranties" below regarding the effect of changes in estimates associated with the Company's reserve for product warranties.
See "Self-Insurance" below regarding estimates associated with the Company's reserve for workers' compensation claims.
See "Income Taxes" below regarding estimates associated with the Company's uncertain tax positions and valuation allowances against net deferred tax assets.
Foreign Currency
Subsidiaries located outside the U.S. use the local currency as the functional currency. Assets and liabilities are translated at exchange rates in effect at the balance sheet date and income and expense accounts at average exchange rates during the year. Resulting translation adjustments are recorded directly to a separate component of stockholders' deficit (accumulated other comprehensive income (loss)) and are not tax effected since they relate to investments which are permanent in nature. Foreign currency transaction gains and losses are recognized in cost of goods sold or selling, general and
59
SEALY CORPORATION
Notes To Consolidated Financial Statements (Continued)
Note 1: Basis of Presentation and Significant Accounting Policies (Continued)
administrative expenses at the time they occur. The Company recorded foreign currency transaction (losses) gains of ($4.2 million), $(5.9 million) and $0.7 million in fiscal 2010, 2009 and 2008, respectively.
Cash and Equivalents
The Company considers all highly liquid debt instruments with an original maturity at the time of purchase of three months or less to be cash equivalents. Included as cash equivalents are money market funds that are stated at cost, which approximates market value.
Checks Issued In Excess of Related Bank Account Balances
Accounts payable and accrued compensation expenses include book overdrafts in the amounts of $11.2 million and $0.0 million at November 28, 2010 and $7.0 million and $0.8 million at November 29, 2009, respectively. The change in the reclassified amount of checks issued in excess of the related bank account balance on our books (which does not represent a negative bank account balance) is included in cash flows from operations in the statements of cash flows.
Inventory
The cost of inventories is determined by the "first-in, first-out" ("FIFO") method, which approximates current cost. The cost of inventories includes raw materials, direct labor and manufacturing overhead costs. The Company adjusts the basis of its inventory value for excess, obsolete or slow moving inventory based on changes in customer demand, technology developments or other economic factors.
Supply Agreements
The Company from time to time enters into long term supply agreements with its customers to sell its branded products to customers in exchange for minimum sales volume or a minimum percentage of the customer's sales or space on the retail floor. Such agreements generally cover a period of two to five years. In these long term agreements, the Company reserves the right to pass on its cost increases to its customers. Other costs such as transportation and warranty costs are factored into the wholesale price of the Company's products and passed on to the customer. Initial cash outlays by the Company for such agreements are capitalized and amortized generally as a reduction of sales over the life of the contract. The majority of these cash outlays are ratably recoverable upon contract termination. Such capitalized amounts are included in "Prepaid expenses and other current assets" and "Debt issuance costs, net, and other assets" in the Company's Consolidated Balance Sheets.
Property, Plant and Equipment
Property, plant and equipment are recorded at cost less accumulated depreciation. Depreciation expense is provided based on historical cost and estimated useful lives ranging from approximately twenty to forty years for buildings and building improvements and three to fifteen years for machinery and equipment. The Company uses the straight-line method for calculating the provision for depreciation. Depreciation expense for fiscal 2010, 2009 and 2008 was $25.1million, $25.5 million, and $25.6 million, respectively and is primarily recorded in cost of goods sold on the consolidated statements of operations.
60
SEALY CORPORATION
Notes To Consolidated Financial Statements (Continued)
Note 1: Basis of Presentation and Significant Accounting Policies (Continued)
The Company reviews property, plant and equipment for impairment whenever events or changes in circumstances indicate that the carrying amount of an asset may not be recoverable. Recoverability of assets to be held and used is measured by a comparison of the carrying amount of an asset group to future net undiscounted cash flows expected to be generated by the asset group. If such assets are considered to be impaired, the impairment recognized is measured by the amount by which the carrying amount of the assets exceeds the fair value of the assets.
No impairment charges related to property, plant and equipment were recognized during fiscal 2010 other than those related to discontinued operations. Impairment charges recognized related to property, plant and equipment for fiscal 2009 were $1.3 million and relate to the decision to cease manufacturing of certain foundation components and begin purchasing all of these components from third party suppliers. Impairment charges recognized in fiscal 2008 were $0.9 million and relate to the closure of the Company's manufacturing facility in Clarion, Pennsylvania. These charges have been recorded as a component of restructuring expenses and asset impairments in the Consolidated Statements of Operations (See Note 25).
Assets to be disposed of are reported at the lower of the carrying amount or fair value less costs to sell. Fair value is determined based upon estimates of the amount to be recovered upon disposal of the facility. There were no assets qualifying as held for sale at November 28, 2010 or November 29, 2009.
It is Company policy to capitalize certain costs incurred in connection with developing or obtaining internal-use software.
Goodwill
Goodwill is recorded when the consideration paid for an acquisition exceeds the fair value of the identifiable net tangible and identifiable intangible assets acquired. Goodwill is not amortized but must be reviewed for impairment at least annually and if a triggering event were to occur in an interim period. The Company performs at least an annual assessment of goodwill for impairment as of the beginning of the fiscal fourth quarter or whenever events or circumstances indicate that the carrying value of goodwill may not be recoverable from future cash flows. The Company assesses recoverability using several methodologies to determine fair value of a reporting unit, which include the present value of estimated future cash flows and comparisons of multiples of enterprise values to earnings before interest, taxes, depreciation and amortization ("EBITDA"). The analysis is based upon available information regarding expected future cash flows of each reporting unit discounted at estimated market rates. Discount rates are based upon the cost of capital specific to the reporting unit. If the carrying value of the reporting unit exceeds the fair value of the reporting unit, a second analysis is performed to allocate the fair value to all assets and liabilities. If, based on the second analysis, it is determined that the indicated fair value of goodwill of the reporting unit is less than the carrying value, the Company would recognize impairment for the excess of carrying value over fair value of goodwill. In connection with its fiscal 2009 annual evaluation for goodwill impairment the Company recorded a non-cash charge of $1.2 million related to the impairment of the goodwill of its Argentina reporting unit. The impairment charge is based upon the fair value of the assets and liabilities of the reporting unit. In connection with an interim evaluation of goodwill in the fourth quarter of 2008, the Company recorded a non-cash charge of $2.8 million related to the impairment of the goodwill of its Puerto Rico reporting unit (See Note 6).
61
Notes To Consolidated Financial Statements (Continued)
Note 1: Basis of Presentation and Significant Accounting Policies (Continued)
Debt Issuance Costs
The Company capitalizes costs associated with the issuance of debt and amortizes them as additional interest expense over the lives of the debt on a straight-line basis which approximates the effective interest method. Upon the prepayment of the related debt, the Company accelerates the recognition of an appropriate amount of the costs as refinancing and extinguishment of debt and interest rate derivatives. Additional expense arising from such prepayments during fiscal 2010, 2009 and 2008 was $2.7 million, $0.1 million and $0.0 million, respectively.
In connection with the refinancing of the Company's senior secured credit facilities in May 2009, the Company recorded fees in the amount of $27.6 million which were deferred and will be amortized over the life of the new agreements. Since the old senior secured term loans are considered terminated, the remaining unamortized debt issuance costs of $2.1 million were expensed and recognized as a component of refinancing and extinguishment of debt and interest rate derivatives in the Consolidated Statements of Operations. The remaining unamortized debt issuance costs associated with the old senior revolving credit facility will continue to be amortized over the life of the Company's new asset-based revolving credit facility as such credit facility met the criteria for modification treatment rather than extinguishment.
In connection with the Second Amendment to the Third Amended and Restated Credit Agreement entered into in November 2008, the Company paid fees to the creditor in the amount of $5.4 million, which were recorded as a component of refinancing and extinguishment of debt and interest rate derivatives in the Consolidated Statements of Operations. In accordance with the FASB's authoritative guidance surrounding a debtor's accounting for a modification or exchange of debt instruments, these costs were expensed as incurred. The Company also paid approximately $0.1 million of fees to third parties that were deferred and will be amortized over the life of the amended agreement. The Company has the following amounts recorded in debt issuance costs, net, and other assets (in thousands):
| |
November 28, 2010 | November 29, 2009 | |||||
|---|---|---|---|---|---|---|---|
Gross cost |
$ | 27,744 | $ | 34,008 | |||
Accumulated amortization |
(5,603 | ) | (4,783 | ) | |||
Net deferred debt issuance costs |
$ | 22,141 | $ | 29,225 | |||
Royalty Income and Expense
The Company recognizes royalty income based on sales of Sealy, Stearns & Foster, and Bassett branded product by various licensees. The Company recognized gross royalty income of $17.6 million, $16.5 million and $17.6 million in fiscal 2010, 2009, and 2008, respectively. The increase in royalty income has been driven by increased sales by our international licensees along with favorable fluctuations in international currency rates The Company also pays royalties to other entities for the use of their names on product produced by the Company. The Company recognized royalty expense of $0.1 million in fiscal 2010 and 2009 and $0.3 million in fiscal 2008, respectively.
Income Taxes
Income taxes are accounted for under the asset and liability method in accordance with the FASB's authoritative guidance on accounting for income taxes. Deferred tax assets and liabilities are recognized
62
SEALY CORPORATION
Notes To Consolidated Financial Statements (Continued)
Note 1: Basis of Presentation and Significant Accounting Policies (Continued)
for future tax consequences attributable to differences between the financial statement carrying amounts of existing assets and liabilities and their respective tax bases and operating loss and tax credit carryforwards. Deferred tax assets and liabilities are measured using enacted tax rates expected to apply to taxable income in the years in which those temporary differences are expected to be recovered or settled. The effect on deferred tax assets and liabilities of a change in tax rates is recognized in income in the period that includes the enactment date. The Company provides valuation allowances against the net deferred tax asset for amounts that are not considered more likely than not to be realized (See Note 16 for disclosure of amounts related to deferred taxes and associated valuation allowances).
Significant judgment is required in evaluating the Company's federal, state and foreign tax positions and in the determination of its tax provision. Despite management's belief that the Company's liability for unrecognized tax benefits is adequate, it is often difficult to predict the final outcome or the timing of the resolution of any particular tax matters. The Company may adjust these reserves as relevant circumstances evolve, such as guidance from the relevant tax authority, its tax advisors, or resolution of issues in the courts. The Company's tax expense includes the impact of reserve provisions and changes to reserves that it considers appropriate, as well as related interest and penalties. These adjustments are recognized as a component of income tax expense entirely in the period in which they are identified. The Company is currently undergoing examinations of its corporate income tax returns by tax authorities. No issues related to these reserved positions have been presented to the Company. The Company believes that such audits will not result in an assessment and payment of taxes related to these positions during the one year following November 28, 2010.
Advertising Costs
The Company expenses all advertising costs as incurred. The estimated fair value of cooperative advertising costs paid to customers is recorded as a component of selling, general and administrative expense within the Consolidated Statements of Operations when the customer provides proof of advertising. The Company periodically assesses the liabilities recorded for cooperative advertising based on actual sales and claims to determine whether all of the cooperative advertising earned will be used by the customer. Advertising expenses, including cooperative advertising, for fiscal 2010, 2009 and 2008 amounted to $140.4 million, $125.7 million and $153.0 million, respectively.
Warranties
The Company's warranty policy provides a ten year non-prorated warranty service period on all currently manufactured Sealy Posturepedic, Stearns & Foster and Bassett bedding products and some other Sealy branded products and a twenty year warranty period on the major components of the Company's TrueForm and MirrorForm visco-elastic products as well as the Company's SpringFree latex product, the last ten years of which are prorated on a straight-line basis. Though discontinued in 2008, the Company's Right Touch products have a twenty year limited warranty that covers only certain parts of the product and is prorated for part of the twenty years. The Company's policy is to accrue the estimated cost of warranty coverage at the time the sale is recorded based on historical trends of warranty costs. The estimate involves an average lag time in days between the sale of a bed and the date of its return, applied to the current rate of warranty returns.
The Company amended its warranty policy on Sealy branded promotional bedding to three years for product produced after fiscal 2007. The impact of this change to the warranty policy did not have a significant impact on the Company's financial results or position.
63
SEALY CORPORATION
Notes To Consolidated Financial Statements (Continued)
Note 1: Basis of Presentation and Significant Accounting Policies (Continued)
During fiscal 2008, the Company completed an analysis of its returns claims experience based on historical return trends for the Company's U.S. business, which resulted in a change in estimate for warranty claims. See Note 3.
The change in the Company's accrued warranty obligations for the fiscal 2010, 2009 and 2008 was as follows (in thousands):
| |
November 28, 2010 | November 29, 2009 | November 30, 2008 | |||||||
|---|---|---|---|---|---|---|---|---|---|---|
Accrued warranty obligations at beginning of period |
$ | 16,464 | $ | 16,487 | $ | 15,964 | ||||
Warranty claims(1) |
(19,572 | ) | (18,082 | ) | (20,034 | ) | ||||
Warranty provisions(2) |
20,692 | 18,059 | 23,032 | |||||||
Change in estimate (Note 3) |
— | — | (2,475 | ) | ||||||
Accrued warranty obligations at end of period |
$ | 17,584 | $ | 16,464 | $ | 16,487 | ||||
- (1)
- Warranty
claims for the year ended November 28, 2010 include approximately $8.3 million for claims associated with products sold prior to
November 29, 2009 that are still under warranty. In estimating its warranty obligations, the Company considers the impact of recoverable salvage value on warranty cost in determining its
estimate of future warranty obligations. The Company utilizes warranty trends on existing similar product in order to estimate future warranty claims associated with newly introduced product. Warranty
claims and provisions shown above do not include estimated salvage recoveries that reduced cost of sales by $5.8 million, $5.9 million and $5.9 million for fiscal 2010, 2009 and
2008, respectively.
- (2)
- The provision for fiscal 2010 includes an increase of approximately $0.5 million relating to decreased recoverable salvage value included in the warranty obligation estimate. The provision for fiscal 2009 includes a decrease of an insignificant amount relating to increased recoverable salvage value included in the warranty obligation estimate. The provision for fiscal 2008 includes an increase of approximately $0.5 million relating to decreased recoverable salvage value included in the warranty obligation estimate.
As of November 28, 2010 and November 29, 2009, $10.5 million and $10.6 million is included as a component of other accrued liabilities and $7.1 million and $5.9 million is included as a component of other noncurrent liabilities within the accompanying Consolidated Balance Sheet, respectively.
Self-Insurance
The Company is self-insured for certain losses related to medical claims with excess loss coverage of $375,000 per claim per year. The Company also utilizes large deductible policies to insure claims related to general liability, product liability, automobile, and workers' compensation. The Company's recorded liability for workers' compensation represents an estimate of the ultimate cost of claims incurred as of the balance sheet date. The estimated workers' compensation liability is discounted and is established based upon analysis of historical data and actuarial estimates, and is reviewed by management and third-party actuaries on a quarterly basis to ensure that the liability is appropriate. The discount rate used to estimate the workers' compensation liability was 2% and 3% for fiscal 2010 and 2009, respectively. While the Company believes these estimates are reasonable based on the information currently available, if actual trends, including the severity or frequency of claims, medical
64
SEALY CORPORATION
Notes To Consolidated Financial Statements (Continued)
Note 1: Basis of Presentation and Significant Accounting Policies (Continued)
cost inflation, or fluctuations in premiums, differ from the Company's estimates, the Company's results of operations could be impacted. As of November 28, 2010 and November 29, 2009, $4.2 million and $6.0 million of the recorded liability is included as a component of other accrued liabilities and $7.1 million and $6.5 million is included as a component of other noncurrent liabilities within the accompanying Consolidated Balance Sheets, respectively.
Research and Development
Product development costs are charged to operations during the period incurred and are not considered material.
Environmental Costs
Environmental expenditures that relate to current operations are expensed or capitalized, as appropriate, under the FASB's authoritative guidance on environmental remediation liabilities. Expenditures that relate to an existing condition caused by past operations and that do not provide future benefits are expensed as incurred. Liabilities are recorded when environmental assessments are made or the requirement for remedial efforts is probable, and the costs can be reasonably estimated. The timing of accruing for these remediation liabilities is generally no later than the completion of feasibility studies. The Company has an ongoing monitoring and identification process to assess how the activities, with respect to the known exposures, are progressing against the accrued cost estimates, as well as to identify other potential remediation sites that are presently unknown.
Conditional Asset Retirement Obligations
The Company recognizes asset retirement obligations for obligations in certain of the Company's facility leases that require the Company to return those properties to the same or similar condition at the end of the lease as existed when the Company began using those facilities. Although the lease termination dates range from 2015 to 2023, the Company may be able to renegotiate such leases to extend the terms.
Additionally, the Company also owns certain factories that contain asbestos. Current regulations require that the Company remove and dispose of asbestos if the factory undergoes major renovations or is demolished. Although the Company is not required to remove the asbestos unless renovation or demolition occurs, it is required to monitor and ensure that it remains stable and is required to notify any potential buyer of its existence. The Company has not recognized asset retirement obligations in its financial statements for asbestos at any facilities because management believes that there is an indeterminate settlement date for the retirement obligation as the range of time over which the Company may be required to remove and dispose of the asbestos is unknown or cannot be estimated. The Company currently has no plans to demolish a factory or to undertake a major renovation that would require removal of the asbestos at any of these other facilities. Management will continue to monitor this issue and will record an asset retirement obligation if a determinate settlement date becomes known which is required in order to estimate an obligation.
Asset retirement obligations recorded as a component of other noncurrent liabilities in the Consolidated Balance Sheets were $1.2 million and $1.7 million at November 28, 2010 and November 29, 2009, respectively. An immaterial amount of accretion and depreciation expense was recognized in fiscal 2010, 2009 and 2008.
65
SEALY CORPORATION
Notes To Consolidated Financial Statements (Continued)
Note 1: Basis of Presentation and Significant Accounting Policies (Continued)
Derivative Financial Instruments
The Company uses financial instruments, including forward, option and swap contracts to manage its exposures to movements in interest rates, foreign exchange rates and diesel fuel prices. The use of these financial instruments allows the Company to reduce its overall exposure to fluctuations in interest rates, foreign exchange rates and diesel prices. The Company's hedging relationships are either designated as hedging instruments or are considered to be economic hedges which are not designated as hedging instruments.
The Company formally documents its designated hedging relationships by identifying the hedging instruments and the hedged items, as well as its risk management objectives and strategies for undertaking the hedge transaction. The Company also formally assesses, both at inception and at least quarterly thereafter, whether the derivatives that are used in hedging transactions are highly effective in offsetting changes in the cash flows of the hedged item. The effective portion of the change in fair value of a derivative is recorded as a component of accumulated other comprehensive income in the Consolidated Balance Sheets. When the hedged item affects the income statement, the gain or loss included in accumulated other comprehensive income is reported on the same line in the Consolidated Statements of Operations as the hedged item. In addition, any ineffective portion of the changes in the fair value of derivatives used as cash flow hedges and the changes in the fair value related to those hedging instruments that are not designated as hedges for accounting purposes are reported in the Consolidated Statements of Operations as the changes occur. If it is determined that a derivative ceases to be a highly effective hedge, or if the anticipated transaction is no longer likely to occur, the Company discontinues hedge accounting and any deferred gains or losses are recorded in the Consolidated Financial Statements.
The Company's hedging relationships that are considered to be economic hedges are recorded at their fair value at the end of each period. The resulting changes in fair value are included as a component of earnings in the period that they occur.
Derivatives are recorded in the Consolidated Balance Sheets at fair value which is based upon an income approach which consists of a discounted cash flow model that takes into account the present value of the future cash flows under the terms of the contracts using current market information as of the reporting date such as prevailing interest rates and foreign currency spot and forward rates.
Share-Based Compensation
For new share-based compensation awards issued and awards modified, repurchased, or cancelled, the cost is equal to the fair value of the award at the date of the grant, and compensation expense is recognized for those awards earned over the service period. Certain of the equity awards vest based upon the Company achieving certain EBITDA performance targets. During the service period, management estimates whether or not the EBITDA performance targets will be met in order to determine the vesting period for those awards and what amount of compensation cost should be recognized related to these awards. At the date of grant, we determine the fair value of the awards using the Black-Scholes option pricing formula, the trinomial lattice model or the closing price of the Company's common stock, as appropriate under the circumstances. Management estimates the period of time the employee will hold the option prior to exercise and the expected volatility of Sealy Corporation's stock, each of which impacts the fair value of the stock options. The fair value of restricted shares and restricted share units is based upon the closing price of the Company's common
66
SEALY CORPORATION
Notes To Consolidated Financial Statements (Continued)
Note 1: Basis of Presentation and Significant Accounting Policies (Continued)
stock as of the grant date. We also estimate the amount of share-based awards that are expected to be forfeited based on the historical forfeiture rates experienced for our outstanding awards.
Commitments and Contingencies
The Company is subject to legal proceedings, claims, and litigation arising in the ordinary course of business. While the outcome of these matters is currently not determinable, management does not expect that the ultimate costs to resolve these matters will have a material adverse effect on the Company's consolidated financial position, results of operations or cash flows.
Note 2: Share-Based Compensation
Share-Based Payment Arrangements
At November 28, 2010, the Company has share-based compensation plans as described below. Share-based compensation expense, related income tax benefits and cash received from the exercise of stock option awards, were as follows (in thousands):
| |
November 28, 2010 | November 29, 2009 | November 30, 2008 | ||||||||
|---|---|---|---|---|---|---|---|---|---|---|---|
Stock option awards |
$ | 1,499 | $ | 3,337 | $ | 2,097 | |||||
Restricted shares |
667 | 667 | 222 | ||||||||
Restricted share units |
13,445 | 6,703 | — | ||||||||
Directors' deferred stock compensation |
251 | 256 | 26 | ||||||||
Adjustment to options and shares subject to redemption |
— | — | 164 | ||||||||
Modifications of share-based awards |
— | 1,670 | 883 | ||||||||
Total share-based compensation |
$ | 15,862 | $ | 12,633 | $ | 3,392 | |||||
Income tax benefits related to share-based compensation |
6,150 | 5,372 | 1,310 | ||||||||
Cash received from exercise of stock option awards |
297 | 27 | 75 | ||||||||
Intrinsic value of awards excercised or issued |
10,594 | 634 | 8,374 | ||||||||
Tax benefits realized upon exercise |
4,107 | 280 | 3,044 | ||||||||
Share-based compensation cost has been recorded as a component of selling, general and administrative expense in the Consolidated Statements of Operations. No share-based compensation cost has been capitalized and included in any assets in the accompanying Consolidated Balance Sheets.
Modification of Awards
During the third quarter of fiscal 2009, the Company undertook a modification to the terms of its outstanding share-based compensation awards to give effect to the dilution caused by the issuance of rights to purchase notes convertible into shares of common stock. For outstanding stock option awards granted under the 1998 Stock Option Plan ("1998 Plan"), the number of awards was increased by 32.7696% and the strike price of the awards was reduced by 24.6815%. For awards granted under the 2004 Stock Option Plan for Key Employees of Sealy Corporation and its Subsidiaries ("2004 Plan"),
67
SEALY CORPORATION
Notes To Consolidated Financial Statements (Continued)
Note 2: Share-Based Compensation (Continued)
the number of awards outstanding was not adjusted, but the strike price of the outstanding awards was reduced by 24.6815%. The increase to the number of outstanding awards has been treated as an additional grant of stock options under the 1998 Plan as disclosed below.
The Company also modified the terms of its outstanding restricted share unit ("RSU") awards by increasing the number of awards by 32.7696%. This resulted in an additional 112,856 awards being granted. However, since the Company's restricted shares outstanding as of the modification date participated in the rights offering, there was no modification of these awards.
The number of units outstanding under the Sealy Corporation Directors' Deferred Compensation Plan was also increased by 32.7696% as part of this modification, resulting in an additional 62,953 awards being granted at a grant date fair value of $2.00 per unit.
In connection with the modification of its outstanding share-based compensation awards, the Company will recognize additional compensation expense of $2.1 million, which will be recorded as a component of selling, general and administrative expenses in the Consolidated Statements of Operations. Of this amount, $0.2 million and $1.7 million was recognized in fiscal 2010 and 2009, respectively. Unrecognized compensation cost related to this modification as of November 28, 2010 is $0.1 million and will be recognized over the remaining vesting period of the awards.
Assumptions used in valuing stock options modified in the third quarter of fiscal 2009 using the trinomial model were as follows:
Expected volatility |
60 | % | ||
Expected dividend yield |
0.00 | % | ||
Expected term (in years) |
0.00 - 7.47 | |||
Risk-free rate |
0.52% - 3.46 | % |
Modifications of awards given to certain former executive officers of the Company in fiscal 2008 resulted in charges of approximately $0.9 million. These charges have been recorded as a component of selling, general and administrative expenses in the Consolidated Statements of Operations.
1998 Plan
Prior to 2004, all outstanding options were issued under the 1998 Plan. On April 6, 2004, certain members of management who held options elected to rollover their options upon the completion of the merger with KKR (the "Rollover Options"). The expiration dates of the Rollover Options were uniformly extended to ten years from the date of the merger, thus resulting in a new measurement date and recognition of expense for the intrinsic value. Prior to the modification described above, the Rollover Options were accounted for using the intrinsic value method with the minimum value method having been used for disclosure purposes in previously issued financial statements. Therefore, no information was presented in previously issued financial statements with regard to significant assumptions used for fair value estimation purposes or regarding weighted average grant date fair value. Upon modification in 2009, outstanding options under the 1998 Plan were valued using the fair value method and, since these awards are fully vested, compensation expense attributable to the modification was recognized in fiscal 2009 as described above.
68
Notes To Consolidated Financial Statements (Continued)
Note 2: Share-Based Compensation (Continued)
A summary of options outstanding under the 1998 Plan as of November 28, 2010, and the activity for the year then ended, is presented below:
| |
Shares Subject to Options |
Weighted Average Exercise Price Per Share |
||||||
|---|---|---|---|---|---|---|---|---|
Outstanding November 29, 2009 |
2,102,162 | $ | 1.09 | |||||
Exercised |
(325,358 | ) | 0.62 | |||||
Outstanding November 28, 2010 (all fully vested and exercisable) |
1,776,804 | $ | 1.17 | |||||
Weighted average remaining contractual term |
3.4 years | |||||||
Aggregate intrinsic value of in-the-money options at November 28, 2010 (in thousands) |
$ | 3,379 | ||||||
2004 Plan
Stock Option Awards
The Company's Board of Directors adopted the 2004 Plan that provides for the grant of cash and cashless exercise stock options, restricted share awards, restricted share unit awards, stock appreciation rights and/or dividend equivalent rights to management, other key employees and non-employee directors on terms and subject to conditions as established by the Compensation Committee of Sealy Corporation's Board of Directors or certain of the committee's designees. Effective May 26, 2009, the Company adopted the Second Amended and Restated Equity Plan for Key Employees of Sealy Corporation and its Subsidiaries which, among other things, increases the number of shares available for issuance under the 2004 Plan from 15,190,000 to 40,190,000. Upon exercise, the Company will issue new shares of common stock.
Stock options under the 2004 Plan are granted in part as: 1) "time options," which vest and become exercisable ratably on a monthly basis generally over the first three to five years following the date of grant; 2) "old performance options," which were granted prior to fiscal 2008 and vest and become exercisable over the fiscal years through fiscal year 2008 upon the achievement of certain EBITDA performance targets, and in any event by the eighth anniversary of the date of grant; and 3) "new performance options," issued during fiscal 2008, which vest and become exercisable only upon achievement of certain EBITDA performance targets and do not have a time vesting component. As of November 28, 2010, approximately 4.2 million time options and 2.2 million performance options were issued and outstanding. The Company has not met the EBITDA performance targets for fiscal 2008 and 2007 for the old performance options; thus, the 2008 and 2007 portions of these options have not become vested based on the accelerated vesting provisions. Since management has determined that certain of the cumulative EBITDA performance targets for the old performance options granted prior to 2008 will not be met, these performance options are being amortized over the first eight years following the date of grant. Management has also determined that the cumulative EBITDA performance targets for the new performance options granted after fiscal 2008 will not be met and therefore has not recognized any compensation expense related to options to purchase 667,532 shares
69
SEALY CORPORATION
Notes To Consolidated Financial Statements (Continued)
Note 2: Share-Based Compensation (Continued)
of common stock since these options do not vest if the performance targets are not achieved. Approximately 46% of the total outstanding performance options are vested as of November 28, 2010.
Prior to the modification of awards in fiscal 2009 discussed above, all options issued under the 2004 Plan, which were outstanding at August 29, 2005, were accounted for using the intrinsic value method. Subsequent to the modification of these awards, all options granted under the 2004 Plan are accounted for using the fair value method.
As of November 28, 2010, there was $1.5 million of unrecognized compensation cost associated with grants under the 2004 Plan. That cost is expected to be recognized over a weighted average period of 3.1 years. The Company valued these stock option grants using the trinomial lattice model. No options were granted in fiscal 2010. The weighted average grant date fair value for all option grants, total intrinsic value of options exercised and assumptions used to value options, excluding those granted through the modification discussed above, for fiscal 2009 and 2008 were as follows:
| |
Year ended | |||||||
|---|---|---|---|---|---|---|---|---|
| |
November 29, 2009 |
November 30, 2008 |
||||||
Weighted average grant date fair value of options granted |
$ | 0.64 | $ | 2.04 | ||||
Total intrinsic value of options exercised (in thousands) |
$ | 633 | $ | 8,374 | ||||
Assumptions used to value options: |
||||||||
Expected volatility |
60 | % | 40% - 60 | % | ||||
Expected dividend yield |
0.00 | % | 0.00% - 3.35 | % | ||||
Expected term (in years) |
5.63 - 5.90 | 5.66 - 6.53 | ||||||
Risk free rate |
1.92% - 2.07 | % | 1.35% - 3.48 | % | ||||
Due to the lack of sufficient historical trading information with respect to its own shares, the Company estimates expected volatility based on its own shares weighted with a portfolio of selected stocks of companies believed to have market and economic characteristics similar to its own. The expected dividend yield is based on the Company's then current quarterly dividend of $0.075 per share relative to the fair value of the underlying stock at grant date for options granted prior to the suspension of the dividend in the second quarter of fiscal 2008. The expected dividend yield for options granted after the decision was made to suspend the dividend was assumed to be zero. Expected term is based on an analysis of the early exercise behavior of employees. The risk free rate is based on the U.S. Treasury yield curve in effect at the time of grant. The Company also estimates the amount of share-based awards that are expected to be forfeited based on the historical forfeiture rates experienced for its outstanding awards.
70
SEALY CORPORATION
Notes To Consolidated Financial Statements (Continued)
Note 2: Share-Based Compensation (Continued)
A summary of options outstanding under the 2004 Plan as of November 28, 2010, and the activity for the year then ended, is presented below:
| |
Shares Subject to Options |
Weighted Average Exercise Price Per Share |
||||||
|---|---|---|---|---|---|---|---|---|
Outstanding November 29, 2009 |
9,568,777 | $ | 5.20 | |||||
Exercised |
(59,135 | ) | $ | 1.64 | ||||
Forfeited |
(3,089,630 | ) | $ | 4.66 | ||||
Outstanding November 28, 2010 |
6,420,012 | $ | 5.50 | |||||
Weighted average remaining contractual term |
4.5 years | |||||||
Aggregate intrinsic value of in-the-money options (in thousands) |
$ | 2,195 | ||||||
Exercisable at November 28, 2010 |
4,535,917 | |||||||
Weighted average remaining contractual term |
4.5 years | |||||||
Aggregate intrinsic value of in-the-money options (in thousands) |
$ | 1,471 | ||||||
Restricted Shares and Share Unit Awards
At November 28, 2010, the Company has outstanding 97,324 restricted shares that are considered to be non-vested shares. The rights associated with these shares are the same as those of the Company's outstanding common shares, including participation in dividend rights, (Note 24) except that they cannot be sold by the holder until the end of the vesting period. During fiscal 2010, 194,647 of the outstanding restricted shares vested. The restricted shares that vested were settled on a net basis which provided for the repurchase and cancellation of 82,628 shares as a means to cover the required minimum withholding tax payments. A total of 112,019 common shares were delivered to the holder of these awards. The remaining outstanding restricted shares will vest on July 22, 2011. As of November 28, 2010, the remaining unrecognized compensation cost related to restricted stock awards was $0.4 million which is expected to be recognized over the remaining vesting period of 0.6 years.
During fiscal 2010 and fiscal 2009, the Company approved grants of 811,000 and 17,084,368 RSUs, respectively. The weighted average grant date fair value of these awards is based on the closing price of the Company's common stock as of the grant date. The RSUs granted during fiscal 2010 and 2009 have a weighted average grant date fair value of $2.98 and $2.01 per unit, respectively. The Company has outstanding RSU awards of several types: 1) Time-based RSU awards accrete in the number of RSUs at an annual rate of 8% payable semi-annually until the RSUs are vested or forfeited; 2) Time-based awards that vest ratably over a three year period; and 3) Performance-based RSUs which do not vest
71
SEALY CORPORATION
Notes To Consolidated Financial Statements (Continued)
Note 2: Share-Based Compensation (Continued)
unless certain targets that are tied to the Company's earnings performance are met. A summary of the outstanding unvested RSU awards by type as of November 28, 2010 follows:
| |
Number of Awards | Unrecognized Compensation Expense (in thousands) |
||||||
|---|---|---|---|---|---|---|---|---|
Time-based vesting awards with accretion factor |
11,569,988 | $ | 9,479 | |||||
Time-based vesting awards without accretion factor |
811,000 | 1,337 | ||||||
Performance-based awards outstanding |
430,968 | 22 | ||||||
Total |
12,811,956 | $ | 10,838 | |||||
Performance based awards where targets are not expected to be met |
114,800 | $ | 88 | |||||
In connection with the modification of share-based compensation awards discussed above, the RSUs outstanding as of June 12, 2009, which were all performance-based awards, were modified to increase the number of awards by 32.7696%. This resulted in an additional 112,856 awards being granted and additional compensation cost of $0.2 million which will be recognized based on the forecasted attainment of the performance targets over time. The additional awards granted as part of this modification are included as RSUs granted as disclosed below. As the restricted shares outstanding participated in the rights offering, there was no modification of these awards.
None of the Company's outstanding RSUs contain dividend participation rights.
A summary of restricted share unit awards outstanding as of November 28, 2010 and the activity for the year then ended, is presented below:
| |
Unvested Restricted Share Units |
Weighted Average Grant Date Fair Value |
||||||
|---|---|---|---|---|---|---|---|---|
Outstanding November 29, 2009 |
16,954,906 | $ | 2.02 | |||||
Granted |
811,000 | 3.00 | ||||||
Vested |
(4,183,326 | ) | 1.93 | |||||
Forfeited |
(770,624 | ) | 1.97 | |||||
Outstanding November 28, 2010 |
12,811,956 | $ | 2.07 | |||||
Weighted average remaining vesting period |
1.6 years | |||||||
Special Retiree Put Obligations
Concurrent with the merger with KKR in 2004, three officers of the Company were given options to sell their shares of stock in Sealy Corporation back to the Company upon their retirement. The Company recognized a retiree put obligation for the resulting obligation to repurchase shares retained by Company stockholders prior to the April 6, 2004 merger with KKR ("Rollover Shares") held by these officers. Subsequent changes in the calculated sales price per share, primarily resulting from the consolidated net income of Sealy Corporation and subsidiaries, dividend distributions, and certain other equity transactions resulted in compensation expense of $0.2 million for fiscal 2008. This expense is
72
SEALY CORPORATION
Notes To Consolidated Financial Statements (Continued)
Note 2: Share-Based Compensation (Continued)
recorded as a component of selling, general and administrative expense. The right to sell the vested shares of the Company's common stock expired during fiscal 2008 and $1.5 million of the related liability was reclassified from other noncurrent liabilities to common stock and options subject to redemption and $2.4 million of the related liability was reclassified from other noncurrent liabilities to additional paid-in capital within the accompanying Consolidated Statements of Stockholders' Deficit for the year ended November 30, 2008. Because of the expiration of these rights in fiscal 2008, no compensation expense was recognized in fiscal 2010 or 2009 related to this provision.
Directors' Deferred Stock Compensation
Under the Sealy Corporation Directors' Deferred Compensation Plan (the "Directors Plan"), the members of the Company's Board of Directors may make an annual election to receive their fees in the form of equity share units in lieu of cash. The number of units received is determined based on the number of shares that could be purchased with the directors' fees at the current fair value of the shares. Directors will receive additional units for shares that could be purchased with future dividends, if any. Following a director's departure from the board, but no sooner than six months thereafter, the director may receive payment for the balance of the deferred compensation share units. The form of payment, whether in shares of stock or in cash equivalent to the fair value of the shares at the time of payment, is at the discretion of the Company. The Company accounts for share units issued under the Directors Plan as equity awards, recognizing a charge against earnings for the expense associated with the Directors Plan, with a corresponding credit to additional paid-in capital. Share units issued following the adoption of the applicable authoritative guidance requiring the use of the fair value method are not adjusted for subsequent changes in the fair value of the underlying stock, although units outstanding at the date of adoption continue to be so adjusted. During fiscal 2010 and 2009, the Company recognized expense of $0.3 million and $0.4 million, respectively, related to the Directors Plan. During fiscal 2008, the Company recognized an insignificant amount of compensation expense related to the Directors Plan. A summary of share units outstanding under the Sealy Corporation Directors' Deferred Compensation Plan as of November 28, 2010, and activity for the year then ended, is presented below:
| |
Share Units | Weighted Average Grant Date Fair Value |
||||||
|---|---|---|---|---|---|---|---|---|
Outstanding November 29, 2009 |
312,788 | $ | 5.24 | |||||
Granted |
82,879 | 2.92 | ||||||
Outstanding November 28, 2010 (all fully vested at grant date) |
395,667 | $ | 3.75 | |||||
Note 3: Change in Estimate
During fiscal 2008, the Company completed an analysis of its returns claims experience based on historical return trends for the Company's U.S. business using newly available information as a result of a new and improved product return process that allows it to better track and match claims received to the sales for which those claims were initially recorded. This analysis was applied to both its warrantable and other product returns. The effect of this change in estimate for warranty claims was to reduce other accrued liabilities and cost of sales by approximately $2.5 million. The change in estimate
73
SEALY CORPORATION
Notes To Consolidated Financial Statements (Continued)
Note 3: Change in Estimate (Continued)
for other product returns increased accounts receivable balances by approximately $3.7 million, with a corresponding increase in net sales. For the year ended November 30, 2008, the change in estimate increased operating income by $6.2 million and net income by $3.8 million. This change in estimate also increased net income per both basic and diluted share by $0.04 for the year ended November 30, 2008.
Note 4: Inventories
The components of inventory as of November 28, 2010 and November 29, 2009 were as follows (in thousands):
| |
November 28, 2010 | November 29, 2009 | |||||
|---|---|---|---|---|---|---|---|
Raw materials |
$ | 26,449 | $ | 29,700 | |||
Work in process |
22,629 | 19,158 | |||||
Finished goods |
8,100 | 7,952 | |||||
|
$ | 57,178 | $ | 56,810 | |||
Note 5: Assets Constructed on Behalf of the Company
The Company has engaged third parties to construct production facilities to be leased by the Company. When entities are involved with certain structural elements of the construction of an asset that will be leased when construction of the asset is completed, the FASB's authoritative guidance requires the Company to be considered the owner, for accounting purposes, of these production facilities. In fiscal 2008, the Company amended one of these leases which had the effect of extending the lease term. Based on this amendment, an additional $1.6 million of property, plant and equipment with an offsetting financing obligation was recognized in the Consolidated Balance Sheets. During the lease terms, the Company recognizes building depreciation and interest expense for the obligations. The Company has recorded $31.8 million and $36.1 million as of November 28, 2010 and November 29, 2009, respectively in buildings related to these facilities. The associated financial obligations are $39.9 million and $41.3 million as of November 28, 2010 and November 29, 2009, respectively in the Consolidated Balance Sheets. The recording of these assets is a non-cash item for the purposes of the Consolidated Statements of Cash Flow.
Note 6: Goodwill and Other Intangible Assets
The Company assesses goodwill at least annually for impairment as of the beginning of the fiscal fourth quarter or whenever events or circumstances indicate that the carrying value of goodwill may not be recoverable from future cash flows. The Company assesses recoverability using several methodologies, including the present value of estimated future cash flows and comparisons of multiples of enterprise values to earnings before interest, taxes, depreciation and amortization ("EBITDA"). The analysis is based upon available information regarding expected future cash flows of each reporting unit discounted at rates consistent with the cost of capital specific to the reporting unit. If the carrying value of the reporting unit exceeds the indicated fair value of the reporting unit, a second analysis is performed to allocate the fair value to all assets and liabilities. If, based on the second analysis, it is determined that the implied fair value of the goodwill of the reporting unit is less than the carrying value, goodwill is considered impaired.
74
SEALY CORPORATION
Notes To Consolidated Financial Statements (Continued)
Note 6: Goodwill and Other Intangible Assets (Continued)
The Company's fiscal 2009 annual evaluation for goodwill impairment indicated a potential impairment of the goodwill for its Argentina reporting unit. As a result, the Company estimated the implied fair value of the goodwill in this reporting unit compared to carrying amounts and recorded an impairment charge of $1.2 million to impair the entire balance of goodwill recorded in the Argentina reporting unit. The impairment charge is based upon the fair value of the assets and liabilities of the reporting unit.
In the fourth quarter of fiscal 2008, market conditions deteriorated significantly. This deterioration resulting from the global economic downturn had not yet matured or been considered in the annual test of goodwill. Because of the potential impact of these conditions on the Company's projections and the indicated fair value of its reporting units, the Company performed an interim evaluation of goodwill in the fourth quarter of 2008 reflecting its current views regarding the impact of the changed economic environment. This analysis indicated potential impairment in the goodwill of the Puerto Rico reporting unit. As a result, the Company estimated the implied fair value of the goodwill compared to carrying amounts and recorded an impairment charge of $2.8 million recorded in the Puerto Rico reporting unit which represented the entire balance of goodwill for this entity.
No impairment of goodwill was identified related to the Company's other reporting units or its other intangible assets. The Company did not record any impairment charges during fiscal 2010 related to goodwill or other intangible assets. Accumulated goodwill impairment losses recorded as of November 28, 2010 and November 29, 2009 are $28.6 million.
The changes in the carrying amount of goodwill for the years ended November 28, 2010 and November 29, 2009 are as follows (in thousands):
Balance as of November 30, 2008 |
$ | 357,149 | ||
Impairment loss |
(1,188 | ) | ||
Increase due to foreign currency translation |
4,622 | |||
Balance as of November 29, 2009 |
$ | 360,583 | ||
Increase due to foreign currency translation |
1,375 | |||
Balance as of November 28, 2010 |
$ | 361,958 | ||
Other intangibles as of November 28, 2010 and November 29, 2009, consisted of the following:
| |
November 28, 2010 |
November 29, 2009 |
|||||
|---|---|---|---|---|---|---|---|
| |
(in thousands) |
||||||
Licenses |
$ | 4,588 | $ | 20,837 | |||
Less accumulated amortization |
(3,201 | ) | (18,900 | ) | |||
Licenses—net |
$ | 1,387 | $ | 1,937 | |||
Licenses are amortized on the straight-line method over periods ranging from 5 to 15 years. Amortization expense related to these licenses was $0.3 million for fiscal 2010, 2009 and 2008, and has been recorded as a component of royalty income, net within the accompanying Consolidated Statements of Operations. Costs to renew or extend the term of a recognized intangible asset are expensed as incurred. The Company has the ability to extend the license outstanding for an additional
75
SEALY CORPORATION
Notes To Consolidated Financial Statements (Continued)
Note 6: Goodwill and Other Intangible Assets (Continued)
term of five years after the completion of the initial term. The Company expects to recognize amortization expense relating to these intangibles of $0.3 million in each of the years from 2011 through 2015.
Note 7: Unconsolidated Affiliate Companies
The Company is involved in a group of joint ventures to develop markets for Sealy branded products in Asia. Our ownership interest in these joint ventures is 50% and is accounted for under the equity method. Our net investment of $7.2 million and $4.5 million at November 28, 2010 and November 29, 2009, respectively, is recorded as a component of other assets including debt issuance costs, net within the Consolidated Balance Sheets. The Company's share of earnings for fiscal 2010 is recorded in equity in earnings of unconsolidated affiliates. Due to its immateriality in fiscal 2009 and 2008, the Company's share of earnings was recorded as a component of selling, general and administrative expenses.
Summarized financial information for these joint ventures is as follows (in thousands):
| |
2010 | 2009 | |
|||||||
|---|---|---|---|---|---|---|---|---|---|---|
Current assets |
27,162 | 16,620 | ||||||||
Noncurrent assets |
5,772 | 5,455 | ||||||||
Current liabilities |
17,141 | 11,422 | ||||||||
Noncurrent liabilities |
— | — | ||||||||
| |
2010 | 2009 | 2008 | |||||||
Revenues |
44,946 |
31,588 |
19,004 |
|||||||
Gross profit |
27,481 | 19,409 | 12,478 | |||||||
Income from continuing operations |
8,372 | 4,037 | 4,145 | |||||||
Net income |
6,898 | 2,935 | 3,006 | |||||||
Note 8: Long Term Obligations
Long term debt as of November 28, 2010 and November 29, 2009 consisted of the following (in thousands):
| |
November 28, 2010 | November 29, 2009 | |||||
|---|---|---|---|---|---|---|---|
Asset-based revolving credit facility |
$ | — | $ | — | |||
Senior notes |
304,318 | 336,625 | |||||
Convertible notes(1) |
181,341 | 180,109 | |||||
Senior subordinated notes |
268,945 | 268,945 | |||||
Financing obligations(2) |
39,896 | 41,296 | |||||
Other |
750 | 20,484 | |||||
|
795,250 | 847,459 | |||||
Less current portion |
(2,166 | ) | (13,693 | ) | |||
|
$ | 793,084 | $ | 833,766 | |||
- (1)
- Convertible notes includes accrued paid in kind interest of $5.8 million and $5.3 million for which the principal balance of the Convertible Notes has not yet been increased at November 28, 2010 and November 29, 2009, respectively.
76
SEALY CORPORATION
Notes To Consolidated Financial Statements (Continued)
Note 8: Long Term Obligations (Continued)
- (2)
- Financing obligations are related to facilities in which the Company was involved in the construction that have been capitalized in accordance with the FASB's authoritative guidance on the effect of lessee involvement in asset construction. The related leases have terms ranging from 10 to 16 years.
Debt Refinancing
On May 13, 2009, the Company announced a comprehensive plan to refinance its existing senior secured credit facilities and replace them with indebtedness that has longer-dated maturities and eliminates quarterly financial ratio based maintenance covenants unless the Company is in a minimum availability period as discussed below (the "Refinancing"). Through the Refinancing, the Company has: 1) entered into a new asset-based revolving credit facility (the "ABL Revolver") which provides commitments of up to $100.0 million maturing in May 2013; 2) issued $350.0 million in aggregate principal amount of senior secured notes due April 2016 (the "Senior Notes"); and 3) issued $177.1 million in aggregate principal amount of senior secured convertible paid in kind ("PIK") notes due July 2016 which are convertible into shares of the Company's common stock (the "Convertible Notes").
The Convertible Notes were issued pursuant to a rights offering issued to all existing shareholders of the Company's common stock which expired on July 2, 2009. The Company issued the related $177.1 million of Convertible Notes on July 10, 2009. Approximately $93.8 million of the Convertible Notes were issued through a forward purchase agreement with a related party, Sealy Holding LLC (the "Purchaser"), an affiliate of KKR. The forward purchase agreement required the exercise of the rights assigned to the Purchaser as well as an oversubscription for those rights that were not exercised by other common shareholders.
The proceeds from the Refinancing were used to repay all of the outstanding amounts due under the Company's previously existing senior secured credit facilities, which consisted of a $125 million senior revolving credit facility and senior secured term loans, and to increase cash for general operating purposes.
ABL Revolver
The ABL Revolver provides for revolving credit financing of up to $100.0 million, subject to borrowing base availability, and matures in May 2013. The borrowing base consists of the following: 1) 85% of the net amount of eligible accounts receivable and 2) the lesser of (i) 85% of the net orderly liquidation value of eligible inventory or (ii) 65% of the net amount of eligible inventory. These amounts are reduced by reserves deemed necessary by the lenders. Borrowings under the ABL Revolver bear interest at the Company's choice of either 1) a base rate (determined by reference to the higher of i) the prime rate; ii) the federal funds effective rate plus one-half of one percent; or iii) the three month LIBOR rate for U.S. dollar deposits) plus 1% plus an applicable margin of 3.00% or 2) a three month LIBOR rate for U.S. dollar deposits plus an applicable margin of 4.00%. The ABL Revolver also requires the Company to pay a commitment fee for the unused portion. As of November 28, 2010, there were no amounts outstanding under the ABL Revolver. At November 28, 2010, the Company had approximately $41.4 million available for borrowing under the ABL Revolver which represents the calculated borrowing base reduced by outstanding letters of credit of $16.0 million.
77
SEALY CORPORATION
Notes To Consolidated Financial Statements (Continued)
Note 8: Long Term Obligations (Continued)
The obligations under the Company's ABL Revolver are guaranteed by the Company and all of its current and future domestic subsidiaries, and are also secured by substantially all of the assets of the Company and its current and future domestic subsidiaries through a first-priority security interest in the accounts receivable, inventory, cash, related general intangibles and instruments and proceeds of the foregoing, and a second-priority security interest in substantially all of the material real property, equipment, Intellectual Property, equity interests and equipment and all other assets of the Company and its current and future domestic subsidiaries that secure the Senior Notes on a first-priority basis.
The ABL Revolver imposes certain restrictions including, but not limited to, the payment of dividends or other equity distributions and the incurrence of debt or liens upon the assets of the Company or its subsidiaries. The ABL Revolver agreement also requires the Company to maintain a fixed charge coverage ratio in excess of 1.1 to 1.0 in periods of minimum availability where the availability for two consecutive calendar days is less than the greater of 1) 15% of the total commitment under the ABL Revolver and 2) $15.0 million. As of November 28, 2010, the Company is not in a minimum availability period under the ABL Revolver.
In accordance with FASB authoritative guidance, the Company will classify any outstanding borrowings on its ABL Revolver, which has a maturity date of more than one year from the balance sheet date, as a current liability since it includes both a lockbox arrangement and a subjective acceleration clause.
Senior Notes
On May 29, 2009, the Company issued $350.0 million aggregate principal amount of Senior Notes maturing April 2016 bearing interest at 10.875% per annum payable semi-annually in arrears on April 15 and October 15. The total proceeds received by the Company from the issuance of these notes was $335.9 million, resulting in an original issue discount ("OID") of $14.1 million which is based on an imputed interest rate of 11.75%. This discount will be accreted over the life of the agreement with the related expense recognized as a component of interest expense in the Consolidated Statement of Operations. For fiscal 2010 and 2009, the Company recognized additional interest expense of $1.4 million and $0.7 million, respectively related to the accretion of the OID. The Senior Notes rank equally in right of payment with all of the Company's existing and future senior indebtedness, including amounts outstanding under the ABL Revolver and the Convertible Notes and senior in right of payment to any existing and future subordinated indebtedness, including the existing 8.25% Senior Subordinated Notes due 2014 ("2014 Notes"). The obligations under the Senior Notes are guaranteed by the Company and all of its current and future domestic subsidiaries, and are also secured by substantially all of the assets of the Company and the assets of its current and future domestic subsidiaries through a first-priority security interest in substantially all of the Company's material real property and equipment and all other assets of its current and future domestic subsidiaries that secure the Senior Notes on a first-priority basis, and a second-priority security interest in the accounts receivable, inventory, cash, related general intangibles and instruments and proceeds of the foregoing.
As discussed further in Note 14, on March 16, 2010, the Company redeemed 10%, or $35.0 million, of the principal amount of its outstanding Senior Notes at a redemption price of 103% of the principal amount of the notes, plus accrued and unpaid interest to the redemption date.
78
Notes To Consolidated Financial Statements (Continued)
Note 8: Long Term Obligations (Continued)
The Senior Notes are governed by an indenture which calls for the Company to offer to repurchase the notes at a price equal to 101% of the outstanding principal amount in the event of a change in control as defined in the indenture. Further, during any twelve month period commencing on the date of issuance, the Company will be entitled to redeem up to 10% of the aggregate principal amount of the Senior Notes at a redemption price equal to 103.000% plus accrued and unpaid interest. Prior to April 15, 2011, the Company may redeem up to 40% of the aggregate principal amount of the Senior Notes at a redemption price equal to 110.875% of the aggregate principal amount plus accrued and unpaid interest thereon with the net proceeds of an equity offering. After April 15, 2012, the Senior Notes are subject to redemption by the Company at 30 to 60 days' notice at the redemption prices (expressed as percentages of principal amount) set forth below, plus accrued and unpaid interest thereon, to the applicable redemption date, if redeemed during the twelve month period beginning on April 15 of each of the years indicated below:
Year
|
Percentage of Principal Amount |
|||
|---|---|---|---|---|
2012 |
108.156 | % | ||
2013 |
105.438 | % | ||
2014 |
102.719 | % | ||
2015 and thereafter |
100.000 | % | ||
Convertible PIK Notes and Related Rights
On May 13, 2009, the Company announced a rights offering pursuant to which rights to subscribe for Convertible Notes were issued at no charge to all holders of the Company's common stock at the close of business on May 26, 2009 at a rate of one right per share of common stock. Each 13 rights entitled its holder to purchase a Convertible Note at a subscription price of $25.00 and each Convertible Note will initially be convertible into 25 shares of common stock. The rights offering expired on July 2, 2009 and the related Convertible Notes were issued on July 10, 2009.
The issuance of the 92,116,369 rights to purchase the Convertible Notes was considered a non-reciprocal transfer with owners and was therefore treated as a dividend of $188.8 million in the second quarter of fiscal 2009. The amount recorded as a dividend was calculated based on the initial fair value of the rights issued of $2.05 per right based on the initial trading value of the rights on the active market on which they trade. See Note 10. The rights are considered to constitute written options which were accounted for as derivative instruments and were adjusted, prior to exercise or expiration, to fair value through earnings. See Note 10.
On May 15, 2009, the Company entered into a forward purchase agreement (the "Forward Contract") with the Purchaser in connection with the distribution of the subscription rights discussed above. The Forward Contract required the Purchaser to purchase up to $177.1 million aggregate principal amount of Convertible Notes which represents the maximum number of Convertible Notes that the Purchaser could have been obligated to purchase. The Forward Contract was settled upon the expiration of the rights offering. Upon settlement, the Company delivered to the Purchaser the Convertible Notes that were not subscribed for by the Company's shareholders (other than the Purchaser) and cash in an amount equal to the purchase price of the Convertible Notes that were subscribed to by the Company's shareholders (other than the Purchaser) along with accrued interest. In consideration of the Forward Contract, the Purchaser posted cash of $177.1 million on May 29, 2009
79
SEALY CORPORATION
Notes To Consolidated Financial Statements (Continued)
Note 8: Long Term Obligations (Continued)
which bore interest during the rights offering period at the rate of LIBOR plus 3.00%. On July 10, 2009, the forward contract was settled resulting in a repayment to the Purchaser of $84.0 million which represented $83.3 million related to rights exercised by shareholders other than the Purchaser and an interest payment of $0.7 million. Under the terms of the Forward Contract, the Company paid the Purchaser a forward contract payment of $1.0 million which was recorded as a component of debt issuance costs, net, and other assets in the Consolidated Balance Sheets and is being amortized as a component of interest expense within the Consolidated Statements of Operations.
Due to the agreement by the Purchaser to exercise all of the rights distributed to it under the terms of the Forward Contract, the 46,625,921 rights allocable to the Purchaser have been considered to be exercised at issuance of the rights. The fair value of these rights was considered to represent a substantial premium related to the issuance of the Convertible Notes. As such, $95.6 million of this premium was recorded as a component of additional paid-in capital upon issuance of the rights. The amount of the premium recognized was based upon the $2.05 initial fair value of the rights. The 45,490,448 rights issued to the Company's other shareholders remained outstanding through the rights period and were adjusted to their fair value (See Note 10) until the issuance of the Convertible Notes on July 10, 2009 as the rights were considered to be written options and were accounted for as derivative liabilities while they were outstanding. Upon issuance of the Convertible Notes, the current fair value of these rights were also considered to represent a substantial premium related to the issuance of the Convertible Notes and $97.8 million of premium was recorded as a component of additional paid-in capital within the Consolidated Balance Sheets.
The Company accounts for the PIK interest on the Convertible Notes in accordance with the applicable FASB authoritative guidance pertaining to convertible instruments and derivative financial instruments indexed to, and potentially settled in, a company's own stock. This guidance requires an allocation of a portion of the issuance amount to an embedded beneficial conversion feature based on the difference between the effective conversion price of the convertible debt and the fair value of the underlying common stock. Upon each of the January 15, 2010 and July 15, 2010 interest payment dates, the fair value of the underlying common stock was more than double the conversion price of the Convertible Notes. Therefore, a beneficial conversion feature was recognized for the entire amount of the PIK interest payment of $7.0 million and $7.3 million, respectively. The recognition of these beneficial conversion features resulted in the recognition of a discount of $14.3 million, which was reflected as a reduction of the balance of the Convertible Notes with an offsetting increase to additional paid-in capital. The recognized discount will be accreted through interest expense over the remaining term of the Convertible Notes.
Senior Subordinated Notes
The outstanding 2014 Notes are publicly traded, registered securities and consist of a $268.9 million aggregate principal amount maturing June 2014, bearing interest at 8.25% per annum payable semiannually in arrears on June 15 and December 15, commencing on December 15, 2004. The 2014 Notes rank junior to all of the Company's existing and future senior indebtedness and secured indebtedness, including any borrowings under the senior secured credit facilities. The 2014 Notes are guaranteed by all of the Company's domestic subsidiaries.
The 2014 Notes are governed by an indenture which calls for the Company to offer prepayment of the notes at a price equal to 101% of the outstanding principal amount in the event of a change in
80
SEALY CORPORATION
Notes To Consolidated Financial Statements (Continued)
Note 8: Long Term Obligations (Continued)
control as defined in the indenture. The 2014 Notes are subject to redemption at 30 to 60 days' notice at the redemption prices (expressed as percentages of principal amount) set forth below, plus accrued and unpaid interest thereon and Special Interest, if any, to the applicable redemption date, if redeemed during the twelve month period beginning on June 15 of each of the years indicated below:
Year
|
Percentage of Principal Amount |
|||
|---|---|---|---|---|
2009 |
104.125 | % | ||
2010 |
102.750 | % | ||
2011 |
101.375 | % | ||
2012 and thereafter |
100.000 | % | ||
The Company may also from time to time repurchase outstanding 2014 Notes on the open market for the purpose of retiring such notes as allowed under the restrictions provided by the Company's other credit agreements and note indentures. During the fourth quarter of fiscal 2009, the Company repurchased and retired $5.0 million aggregate principal amount of the 2014 Notes on the open market at 99.06% of par, plus accrued interest. No such repurchases were made during fiscal 2010 or 2008.
Other Information
The indentures and agreements governing the ABL Revolver, Senior Notes, Convertible Notes and the 2014 Notes also impose certain restrictions including, but not limited to, the payment of dividends or other equity distributions and the incurrence of debt or liens upon the assets of the Company or its subsidiaries. For instance, the agreement governing Sealy Mattress Company's ABL Revolver contains restrictions on the ability of Sealy Corporation's subsidiaries to pay dividends or make other distributions to Sealy Corporation subject to specified exceptions including the satisfaction of a minimum fixed charge coverage ratio and average daily availability levels. Likewise, under the indentures governing our Senior Notes and the 2014 Notes, we are restricted from paying dividends or making other distributions to Sealy Corporation unless we are able to satisfy certain requirements or use an available exception from the limitation. As of November 28, 2010, Sealy Mattress Company is restricted in distributing the net assets of its subsidiaries in the amount of $236.7 million to its parent due to the provisions in its long-term debt agreements. However, $30.4 million would be available for distribution without restriction. At November 28, 2010, the Company was in compliance with the covenants contained within the related note indentures and agreements.
The Company's net weighted average borrowing cost was 10.7%, 9.6% and 7.3% for fiscal 2010, 2009 and 2008, respectively. At November 28, 2010, the annual scheduled maturities of the principal amounts of long term obligations are as follows (in thousands):
2011 |
$ | 2,166 | ||
2012 |
1,638 | |||
2013 |
1,849 | |||
2014 |
271,148 | |||
2015 |
2,431 | |||
Thereafter |
516,018 | |||
|
$ | 795,250 | ||
81
SEALY CORPORATION
Notes To Consolidated Financial Statements (Continued)
Note 8: Long Term Obligations (Continued)
In addition to the obligations and assets recorded as a result of lessee involvement during the asset construction period, the Company has entered into capital leases for the acquisition of machinery and equipment, computer hardware and software and a warehouse management system, all of which have been recorded in machinery and equipment in the Consolidated Balance Sheets. Amortization of the assets recorded under capital lease arrangements are recorded as a component of depreciation expense. Details of capitalized leased assets are as follows:
| |
November 28, 2010 | November 29, 2009 | |||||
|---|---|---|---|---|---|---|---|
| |
(in thousands) |
||||||
Machinery and equipment |
$ | 4,232 | $ | 5,014 | |||
Less: Accumulated depreciation |
(3,696 | ) | (3,896 | ) | |||
Net capitalized leased assets |
$ | 536 | $ | 1,118 | |||
Future minimum lease payments with the present value of the net minimum lease payments (included in other long term debt and current portion shown above) as of November 28, 2010 are as follows (in thousands):
Fiscal Year |
||||
2011 |
$ | 270 | ||
2012 |
35 | |||
2013 |
3 | |||
2014 |
— | |||
2015 |
— | |||
Thereafter |
— | |||
Total minimum lease payments |
308 | |||
Less: Amount representing interest |
(8 | ) | ||
Present value of net minimum lease payments |
$ | 300 | ||
Note 9: Commitments
Leases
The Company leases certain operating facilities, offices and equipment. The following is a schedule of future minimum annual operating lease commitments at November 28, 2010 (in thousands):
2011 |
$ | 11,651 | ||
2012 |
10,262 | |||
2013 |
8,200 | |||
2014 |
5,952 | |||
2015 |
4,662 | |||
Thereafter |
17,435 | |||
|
$ | 58,162 | ||
82
SEALY CORPORATION
Notes To Consolidated Financial Statements (Continued)
Note 9: Commitments (Continued)
Rental expense charged to operations is as follows:
| |
Year Ended Nov. 28, 2010 |
Year Ended Nov. 29, 2009 |
Year Ended Nov. 30, 2008 |
|||||||
|---|---|---|---|---|---|---|---|---|---|---|
| |
(in thousands) |
|||||||||
Minimum rentals |
$ | 17,184 | $ | 16,996 | $ | 16,695 | ||||
Contingent rentals (based upon delivery equipment mileage) |
2,006 | 1,468 | 1,391 | |||||||
|
$ | 19,190 | $ | 18,464 | $ | 18,086 | ||||
The Company has the option to renew certain plant operating leases, with the longest renewal period extending through 2043. Most of the operating leases provide for increased rent through increases in general price levels. The Company recognizes rent expense in these situations on a straight-line basis over the lease term. Additionally, some of the leases provide for contingent rental payments based on the use of the leased assets or adjustments to future payments based on specified indices. Contingent payments directly related to the use of the assets and future adjustments of payments based on indices are expensed in the period in which the use of the asset occurs and are not included in the schedule of future minimum annual operating lease commitments.
On December 1, 2008, the Company completed a sale-leaseback transaction of its South Gate, California facility, including the land, building and improvements affixed to the properties. The facility is being leased back over a seven year term and is classified as an operating lease. The net proceeds from the sale were $8.4 million and were reinvested in the business. The sale of this facility resulted in a gain of approximately $4.9 million. This gain has been deferred and is being amortized over the lease term. In both fiscal 2010 and 2009, the Company recognized $0.6 million of this gain. The remaining deferred gain was recorded as follows within the accompanying Consolidated Balance Sheets as of November 28, 2010 and November 29, 2009:
| |
November 28, 2010 | November 29, 2009 | ||||||
|---|---|---|---|---|---|---|---|---|
| |
(in thousands) |
|||||||
Other accrued liabilities |
$ | 668 | $ | 650 | ||||
Noncurrent liabilities |
2,851 | 3,581 | ||||||
Total deferred gain |
$ | 3,519 | $ | 4,231 | ||||
Severance Obligations
The Company has employment agreements with certain of its executive officers and key employees which, among other things, provide severance benefits to those employees. During fiscal 2010, 2009 and 2008, certain executive officers of the Company resigned. In accordance with their employment agreements and Company policy, certain benefits are to be paid to these executive officers in connection with their resignation. Additionally, during these years, the Company terminated other employees who were also entitled to severance benefits. In connection with the resignation of executive officers and the termination of the other employees, the Company recorded charges related to severance obligations due to these individuals. Severance costs of $2.4 million, $1.4 million and $6.4 million for fiscal 2010, 2009 and 2008, respectively, were recorded as a component of operating income within the accompanying Consolidated Statements of Operations. The fiscal 2008 amounts are
83
SEALY CORPORATION
Notes To Consolidated Financial Statements (Continued)
Note 9: Commitments (Continued)
inclusive of the $0.9 million of compensation cost that was recognized in connection with the modification of the terms of the former Executive Officers' stock options made in connection with their resignation (Note 2). Severance benefits of $0.5 million and $1.2 million have been accrued as of November 28, 2010 and November 29, 2009, respectively. The entire liability is recorded as a component of accrued compensation as of November 28, 2010 and November 29, 2009 within the accompanying Consolidated Balance Sheet.
Note 10: Fair Value Measurements
For assets and liabilities measured at fair value on a recurring basis during the period, the Company uses an income approach to value the assets and liabilities for outstanding derivative contracts, which include interest rate swap and foreign currency forward and option contracts discussed in Note 11 below. These contracts are valued using an income approach which consists of a discounted cash flow model that takes into account the present value of future cash flows under the terms of the contracts using current market information as of the reporting date such as prevailing interest rates and foreign currency spot and forward rates. The Company mitigates derivative credit risk by transacting with highly rated counterparties. The Company has evaluated the credit and non-performance risks associated with its derivative counterparties and believe them to be insignificant at November 28, 2010.
As discussed further in Note 11, the Company is party to a lease agreement which contains an embedded foreign currency derivative which has been bifurcated from the agreement and separately recorded as a component of debt issuance costs, net and other assets within the Consolidated Balance Sheets. This derivative is valued using an income approach which consists of a discounted cash flow model that takes into account the present value of future cash flows under the terms of the contract. Significant inputs to the computation of the fair value include forecasted interest rates, foreign currency rates and inflation expectations.
The following table provides a summary of the fair value of assets and liabilities (in thousands):
| |
|
Fair Value Measurements at November 28, 2010 Using | ||||||||||||
|---|---|---|---|---|---|---|---|---|---|---|---|---|---|---|
| |
November 28, 2010 | Quoted Prices in Active Markets for Identical Assets (Level 1) |
Significant Other Observable Inputs (Level 2) |
Significant Unobservable Inputs (Level 3) |
||||||||||
Foreign exchange and commodity derivative assets |
$ | 129 | $ | — | $ | 129 | $ | — | ||||||
Foreign exchange and commodity derivative liabilities |
(163 | ) | — | (163 | ) | — | ||||||||
Embedded foreign currency derivative in lease agreement |
380 | — | — | 380 | ||||||||||
Total |
$ | 346 | $ | — | $ | (34 | ) | $ | 380 | |||||
84
SEALY CORPORATION
Notes To Consolidated Financial Statements (Continued)
Note 10: Fair Value Measurements (Continued)
| |
|
Fair Value Measurements at November 29, 2009 Using | |||||||||||
|---|---|---|---|---|---|---|---|---|---|---|---|---|---|
| |
November 29, 2009 | Quoted Prices in Active Markets for Identical Assets (Level 1) |
Significant Other Observable Inputs (Level 2) |
Significant Unobservable Inputs (Level 3) |
|||||||||
Interest rate and foreign exchange derivative assets |
$ | 1,608 | $ | — | $ | 1,608 | $ | — | |||||
Due to the short maturity of cash and cash equivalents, accounts receivable, accounts payable and accrued expenses, their carrying values approximate fair value. The fair value of long term debt, based on quoted market prices, at November 28, 2010 was as follows (in thousands):
Senior Notes |
$ | 359,100 | ||
Convertible Notes |
608,341 | |||
Subordinated Notes |
275,669 |
Note 11: Derivative Instruments and Hedging Strategies
The Company uses hedging contracts to manage the risk of its overall exposure to interest rate, foreign currency and commodity price changes. All of the Company's designated hedging instruments are considered to be cash flow hedges.
Interest Rate Risk
Prior to the Refinancing and the disposition of the European operations, the Company was exposed to interest rate risk associated with fluctuations in the interest rates on its variable interest rate debt. However, the Company now has predominantly fixed rate debt outstanding. In order to manage the risk of variable interest rates prior to these events, the Company had entered into several interest rate swap agreements that converted the debt's variable interest rate to a fixed interest rate. These swap agreements were either designated as hedging instruments or were considered to be economic hedges which were not designated as hedging instruments. The gains and losses on both designated and undesignated swap agreements offset losses and gains on the transactions being hedged. The Company formally documented qualifying hedged transactions and hedging instruments, and assessed, both at inception of the contract and on an ongoing basis, whether the hedging instruments are effective in offsetting changes in cash flows of the hedged transaction. The fair values of the interest rate agreements were estimated as described in Note 10, taking into consideration current interest rates and the current creditworthiness of the counterparties or the Company, as applicable.
In connection with the Refinancing (Note 8), the Company paid $15.2 million to terminate the interest rate swaps. As the future variable interest rate payments are no longer probable of being made, the amounts which had previously been recorded in accumulated other comprehensive income were charged to refinancing expense for the year ended November 29, 2009.
As of November 28, 2010, the Company did not have any outstanding interest rate swap agreements.
85
SEALY CORPORATION
Notes To Consolidated Financial Statements (Continued)
Note 11: Derivative Instruments and Hedging Strategies (Continued)
Foreign Currency Exposure
The Company is exposed to foreign currency risk related to purchases of materials made in a foreign currency. To manage the risk associated with fluctuations in foreign currencies, the Company enters into foreign currency forward and option contracts. The Company designates certain of these forward contract hedges as hedging instruments and enters into some forward and option contracts that are considered to be economic hedges which are not designated as hedging instruments. Whether designated or undesignated, these forward and option contracts protect against the reduction in value of forecasted foreign currency cash flows resulting from payments in a foreign currency. The fair values of foreign currency agreements are estimated as described in Note 10, taking into consideration current interest rates and the current creditworthiness of the counterparties or the Company, as applicable. Details of the specific instruments used by the Company to hedge its exposure to foreign currency fluctuations follow:
At November 28, 2010, the Company had 47 forward foreign currency contracts and 3 foreign currency option contracts to sell Canadian dollars and receive a total of 35.1 million US dollars at specified exchange rates with expiration dates ranging from December 15, 2010 through November 15, 2011. These hedges were entered into to protect against the fluctuation in the Canadian subsidiary's US dollar denominated purchases of raw materials. The Company has formally designated these contracts as cash flow hedges, and they are expected to be highly effective in offsetting fluctuations in the forecasted purchases of these raw materials related to changes in the foreign currency exchange rates.
The Company also enters into forward foreign currency contracts that are not designated as hedges for accounting purposes. The changes in fair value of these foreign currency hedges are included as a part of selling, general and administrative expenses in the Consolidated Statements of Operations. As of November 28, 2010, the Company did not have any outstanding foreign currency contracts that were not designated as hedges for accounting purposes. At November 29, 2009 the Company had foreign currency contracts with notional amounts of $36.2 million outstanding, all of which were designated as hedges for accounting purposes.
The maximum length of time over which the Company is hedging its exposure to the reduction in value of forecasted foreign currency cash flows through foreign currency forward agreements is through November 2011. Over the next twelve months, the Company expects to reclassify $0.1 million of deferred losses from accumulated other comprehensive income to selling, general and administrative expense as related forecasted foreign currency payments are made.
Commodity Price Exposure
The Company is exposed to risk associated with fluctuations in the prices of diesel fuel used in the transportation of its finished product to its customers. To manage this risk, the Company enters into fixed price swap agreements. The Company designates these fixed price swap contracts as hedging instruments. These contracts protect against the reduction in value of forecasted cash flows resulting from the purchases of diesel fuel. The fair values of the fixed price swap agreements are estimated as described in Note 10, taking into consideration current interest rates and the current creditworthiness
86
SEALY CORPORATION
Notes To Consolidated Financial Statements (Continued)
Note 11: Derivative Instruments and Hedging Strategies (Continued)
of the counterparties or the Company, as applicable. Details of the specific instruments used by the Company to hedge its exposure to diesel price fluctuations are as follows:
At November 28, 2010, the Company had 2 fixed price swap contracts outstanding to purchase 0.2 million gallons of diesel fuel at specified prices with expiration dates through January 31, 2011. These hedges were entered into to protect against the fluctuations in the prices of diesel fuel purchased by certain of the Company's U.S. manufacturing facilities. The Company has formally designated these contracts as cash flow hedges, and they are expected to be highly effective in offsetting fluctuations in the forecasted purchases of diesel fuel related to changes in the underlying diesel fuel prices.
Embedded Derivatives
The Company evaluates its outstanding debt arrangements and other contracts in accordance with the applicable authoritative guidance on derivative instruments and hedging, which requires bifurcation of embedded derivative instruments and measurement of fair value for accounting purposes. The Company concluded that the contingent redemption option upon a change of control or a qualifying asset sale within its Senior Notes qualifies as an embedded derivative instrument which should be bundled as a compound embedded derivative and bifurcated from the Senior Notes. Due to the low probability of the occurrence of the contingent events requiring redemption, the fair value of this derivative was determined to be immaterial.
The Company concluded that the floor on the foreign exchange rate related to the payments to be made associated with the lease of its former Brazilian manufacturing facility and the related purchase option qualifies as an embedded derivative instrument that should be bifurcated from the lease agreement and recorded at fair value at the end of each reporting period. As of November 28, 2010, the fair value of this derivative was $0.4 million and is recorded as a component of debt issuance costs, net, and other assets in the Consolidated Balance Sheet. The initial fair value of the embedded derivative was recorded as deferred lease income and is being amortized over the term of the lease.
Rights to Purchase Convertible Notes
During the second quarter of fiscal 2009, the Company issued rights to holders of its common stock at close of business on May 26, 2009. As described in Note 8, these rights entitled holders to purchase the Company's Convertible Notes issued in connection with the Refinancing and expired on July 2, 2009. These rights were considered to be written options and therefore were accounted for as derivative instruments requiring that they be adjusted, after issuance, to fair value through earnings. Based on the terms of the forward purchase agreement with the Purchaser, the rights related to the Purchaser's then approximate 50.6% ownership, as of the date of issuance, are considered to be exercised as of the date of the issuance of the right. The fair value of the rights attributable to the Purchaser, which was $95.6 million at May 27, 2009, was recorded as additional paid-in capital upon issuance. The rights issued to other shareholders remained outstanding through the issuance of the Convertible Notes on July 10, 2009, and were adjusted to their market value through that date. The Company recognized losses on these rights of $4.5 million during fiscal 2009. At the expiration of the rights, the fair value of the rights issued to other shareholders of $97.8 million was recorded as additional paid-in capital.
87
SEALY CORPORATION
Notes To Consolidated Financial Statements (Continued)
Note 11: Derivative Instruments and Hedging Strategies (Continued)
At November 28, 2010 and November 29, 2009, the fair value carrying amount of the Company's derivative instruments was recorded as follows (in thousands):
| |
Asset Derivatives | Liability Derivatives | ||||||||||
|---|---|---|---|---|---|---|---|---|---|---|---|---|
| |
November 28, 2010 | November 28, 2010 | ||||||||||
| |
Balance Sheet Location | Fair Value | Balance Sheet Location | Fair Value | ||||||||
Derivatives designated as hedging instruments |
||||||||||||
Foreign exchange contracts |
Other current assets | $ | 85 | Other current liabilities | $ | (163 | ) | |||||
Commodity fixed price swap contracts |
Other current assets | 44 | Other current liabilities | — | ||||||||
Total derivatives designated as hedging instruments |
129 | (163 | ) | |||||||||
Derivatives not designated as hedging instruments |
||||||||||||
Interest rate contracts |
Other noncurrent assets | — | Other noncurrent liabilities | — | ||||||||
Foreign exchange contracts |
Other current assets | — | Other current liabilities | — | ||||||||
Embedded foreign currency derivative |
Other noncurrent assets | 380 | Other noncurrent liabilities | — | ||||||||
Total derivatives not designated as hedging instruments |
380 | — | ||||||||||
Total derivatives |
$ | 509 | $ | (163 | ) | |||||||
| |
|
|
Liability Derivatives | |||||||||
|---|---|---|---|---|---|---|---|---|---|---|---|---|
| |
Asset Derivatives | |||||||||||
| |
November 29, 2009 | |||||||||||
| |
November 29, 2009 | |||||||||||
| |
|
Fair Value | ||||||||||
| |
Balance Sheet Location | Fair Value | Balance Sheet Location | |||||||||
Derivatives designated as hedging instruments |
||||||||||||
Foreign exchange contracts |
Other current assets | $ | 1,133 | Other current liabilities | $ | — | ||||||
Total derivatives designated as hedging instruments |
1,133 | — | ||||||||||
Derivatives not designated as hedging instruments |
||||||||||||
Interest rate contracts |
Other noncurrent assets | 475 | Other noncurrent liabilities | — | ||||||||
Total derivatives not designated as hedging instruments |
475 | — | ||||||||||
Total derivatives |
$ | 1,608 | $ | — | ||||||||
88
SEALY CORPORATION
Notes To Consolidated Financial Statements (Continued)
Note 11: Derivative Instruments and Hedging Strategies (Continued)
The effect of derivative instruments on the Consolidated Statement of Operations for fiscal 2010 and 2009, was as follows (in thousands):
Twelve Months Ended November 28, 2010
Derivatives in Designated Cash Flow Hedging Relationships |
Amount of Gain/(Loss) Recognized in OCI on Derivatives (Effective Portion) |
Location of Gain/(Loss) Reclassified from Accumulated OCI into Income (Effective Portion) |
Amount of Gain/(Loss) Reclassified from Accumulated OCI into Income (Effective Portion) |
Location of Gain/(Loss) Recognized in Income on Derivatives (Ineffective Portion and Amount Excluded from Effectiveness Testing) |
Amount of Gain/(Loss) Recognized in Income on Derivatives (Ineffective Portion and Amount Excluded from Effectiveness Testing) |
||||||||||
|---|---|---|---|---|---|---|---|---|---|---|---|---|---|---|---|
Diesel fixed price swap contracts |
27 | Selling, general and administrative expenses | 74 | Selling, general and administrative expenses | — | ||||||||||
Foreign exchange contracts |
(800 | ) | Cost of goods sold | 56 | Cost of goods sold | — | |||||||||
Total |
$ | (773 | ) | $ | 130 | $ | — | ||||||||
Twelve Months Ended November 29, 2009
Derivatives in Designated Cash Flow Hedging Relationships |
Amount of Gain/(Loss) Recognized in OCI on Derivatives (Effective Portion) |
Location of Gain/(Loss) Reclassified from Accumulated OCI into Income (Effective Portion) |
Amount of Gain/(Loss) Reclassified from Accumulated OCI into Income (Effective Portion) |
Location of Gain/(Loss) Recognized in Income on Derivatives (Ineffective Portion and Amount Excluded from Effectiveness Testing) |
Amount of Gain/(Loss) Recognized in Income on Derivatives (Ineffective Portion Effectiveness Testing) |
||||||||||
|---|---|---|---|---|---|---|---|---|---|---|---|---|---|---|---|
Interest rate contracts |
$ | (3,864 | ) | Interest income (expense) | $ | (5,266 | ) | Interest income (expense) | $ | — | |||||
Interest rate contracts |
— | Refinancing expense | — | Refinancing expense | (15,232 | ) | |||||||||
Foreign exchange contracts |
465 | Selling, general and administrative expenses | 43 | Selling, general and administrative expenses | — | ||||||||||
Total |
$ | (3,399 | ) | $ | (5,223 | ) | $ | (15,232 | ) | ||||||
| |
|
November 28, 2010 | November 29, 2009 | |||||||
|---|---|---|---|---|---|---|---|---|---|---|
Derivatives Not Designated as Hedging Instruments |
Location of Gain/(Loss) Recognized in Income on Derivatives |
Amount of Gain/(Loss) Recognized in Income on Derivatives |
Amount of Gain/(Loss) Recognized in Income on Derivatives |
|||||||
Interest rate contracts |
Interest income (expense) | $ | (475 | ) | $ | 88 | ||||
Rights to purchase convertible notes |
Loss on rights for convertible notes | — | (4,549 | ) | ||||||
Total |
$ | (475 | ) | $ | (4,461 | ) | ||||
Note 12: Acquisitions and Dispositions
On December 1, 2008, the Company sold fifty percent of its ownership interest in its 100% owned subsidiary Sealy Korea Company to the Company's Australian licensee and these operations became
89
SEALY CORPORATION
Notes To Consolidated Financial Statements (Continued)
Note 12: Acquisitions and Dispositions (Continued)
part of the group of joint ventures that the Company participates in with the Australian licensee. In consideration of the sale of the fifty percent interest, the Company received net cash of $1.2 million and recognized a gain on the sale of the subsidiary of $1.3 million which has been recorded as a gain on sale of subsidiary stock in the accompanying Consolidated Statements of Operations. Upon the close of this transaction, the subsidiary was deconsolidated. The joint venture to which these operations were added is not considered to be a variable interest entity and is therefore not consolidated for financial statement purposes. The Company accounts for its interest in this joint venture under the equity method.
On December 4, 2008, the Company and its Australian licensee each acquired a 50% interest in a joint venture that owns the assets of the Company's former New Zealand licensee. The purchase price for the 50% ownership was $1.9 million. Additional contributions of $0.4 million were made by each party to the joint venture to fund the initial working capital of this entity. The New Zealand joint venture is not considered to be a variable interest entity and is therefore not consolidated for financial statement purposes. The Company accounts for its interest in this joint venture under the equity method.
Note 13: Discontinued Operations
European Operations
On November 18, 2010, management committed to a plan to divest the assets of its European manufacturing operations in France and Italy which represented its Europe segment. Through this transaction, the assets and liabilities of the European manufacturing operations were assumed by C.F.G. S.r.L. ("CFG"). Consideration received in this transaction was the assumption of the net debt of the European operations, which approximated 6.5 million Euro, by CFG. Concurrent with this transaction, CFG has entered into a license agreement with Sealy Corporation through which the Company will receive royalty payments on sales of Sealy and Stearns & Foster branded product in the Western European market.
In the third quarter of fiscal 2010, the Company recorded an impairment charge of $23.0 million, net of tax, on the European manufacturing facility based on the estimated cash flows associated with the business. In the fourth quarter of fiscal 2010, the Company recorded a net loss on disposal of $2.4 million in connection with the sale of the business to CFG. This charge included the accumulated foreign currency translation adjustment previously recorded in other comprenhensive income.
The Company expects to receive income in future periods from the license arrangement to sell Sealy branded product in these markets over the term of the agreement which, initially, is five years with options to extend or renew the contract. The Company has concluded that the license fees constitute a passive royalty interest and the Company has no continuing involvement in the disposed business.
In connection with the sale of the Company's European manufacturing operations, the Company made certain guarantees with respect to the existence of liabilities and deficiencies related to assets as of the closing date that were not reflected in the European business' financial statements as of the closing date. Further, certain guarantees were made with respect to losses or damages incurred by the purchaser related to any misrepresentations or warranties made by the Company, outstanding disputes or judicial proceedings. Such guarantees are limited to an aggregate amount of 3.5 million Euro under
90
SEALY CORPORATION
Notes To Consolidated Financial Statements (Continued)
Note 13: Discontinued Operations (Continued)
the terms of the contract. As of November 28, 2010, the Company knows of no outstanding contingencies that would be covered by this guarantee.
There are no remaining assets or liabilities recorded as of November 28, 2010 related to the European manufacturing operations.
Brazilian Operations
In November 2010, management ceased manufacturing operations in Brazil. Concurrently, the Company entered into a license agreement with a third party to sell Sealy product in certain regions of this market. Additionally, the Company entered into a lease agreement with another third party to lease the manufacturing facility and related equipment. The property that will continue to be leased is not considered part of discontinued operations. See Note 22 for further details surrounding the terms of the leasing arrangement.
The Company expects to receive income in future periods from the license arrangement to sell Sealy branded product in the Brazilian markets over the term of the agreement which, initially, is 5 years with options to extend or renew the contracts. The Company has concluded that this constitutes a passive royalty interest and the Company has no continuing involvement in the disposed business.
The remaining current assets and liabilities of the Brazilian operations reflected within the Consolidated Balance Sheet at November 28, 2010 were immaterial and are being liquidated.
Total Discontinued Operations
The operating results of the discontinued operations in total are summarized below (in thousands):
| |
November 28, 2010 |
November 29, 2009 |
November 30, 2008 |
||||||||
|---|---|---|---|---|---|---|---|---|---|---|---|
Net sales |
$ | 101,105 | $ | 115,482 | $ | 154,700 | |||||
Loss before income taxes(a) |
(36,679 |
) |
(10,119 |
) |
(38,116 |
) |
|||||
Income tax provision (benefit) |
(679 | ) | (745 | ) | (676 | ) | |||||
Loss from operations of discontinued operations |
(36,000 | ) | (9,374 | ) | (37,440 | ) | |||||
Loss on disposition of business |
(2,399 | ) | — | — | |||||||
Loss from discontinued operations |
$ | (38,399 | ) | $ | (9,374 | ) | $ | (37,440 | ) | ||
- (a)
- Loss before income taxes for fiscal 2010 includes a $23.0 million impairment charge related to the assets of the Company's European manufacturing operations. Loss before income taxes for fiscal 2008 includes a $24.7 million impairment charge related to the goodwill of its Europe segment.
Note 14: Refinancing and Extinguishment of Debt and Interest Rate Derivatives
Expenses related to refinancing and extinguishment of debt and related interest rate derivatives for the year ended November 28, 2010 included non-cash charges of $2.7 million related to the write-off of debt issuance costs and original issue discount associated with the $35.0 million of principal amount of
91
SEALY CORPORATION
Notes To Consolidated Financial Statements (Continued)
Note 14: Refinancing and Extinguishment of Debt and Interest Rate Derivatives (Continued)
the Senior Notes that were repurchased during the year ended November 28, 2010. Also included was a cash charge of $1.1 million which represents the premium that was paid to repurchase these notes. See Note 8.
Expenses related to refinancing and extinguishment of debt and related interest rate derivatives for the year ended November 29, 2009 includes non-cash charges of $2.1 million relating to the write-off of debt issuance costs associated with the old senior term loans as well as $15.2 million of cash charges associated with the termination of the interest rate swap agreements that were associated with the old senior credit facility. Additionally, $0.1 million of debt issuance costs were written off related to the repurchase of $5.0 million of aggregate principal value of 2014 Notes. See Note 8
Expenses related to refinancing and extinguishment of debt and related interest rate derivatives for the year ended November 30, 2008 include $5.4 million of refinancing expenses consisting of fees paid in connection with the Second Amendment to the Third Amended and Restated Credit Agreement in November 2008. See Note 8
Note 15: Other Income, Net
Other (income) expense, net includes interest income of $0.2 million, $0.1 million, and $0.4 million for the years ended November 28, 2010, November 29, 2009, and November 30, 2008, respectively.
Note 16: Income Taxes
The Company and its domestic subsidiaries file a consolidated U.S. Federal income tax return. Income tax provision (benefit) consists of:
| |
Year Ended | |||||||||
|---|---|---|---|---|---|---|---|---|---|---|
| |
November 28, 2010 |
November 29, 2009 |
November 30, 2008 |
|||||||
| |
(in thousands) |
|||||||||
Current: |
||||||||||
Federal |
$ | 97 | $ | (740 | ) | $ | 2,047 | |||
International |
15,168 | 8,503 | 12,053 | |||||||
State and local |
2,102 | 1,658 | (584 | ) | ||||||
|
17,367 | 9,421 | 13,516 | |||||||
Deferred: |
||||||||||
Federal |
1,975 | (9,940 | ) | 6,193 | ||||||
International |
(1,164 | ) | 155 | (529 | ) | |||||
State and local |
310 | (1,016 | ) | 2,368 | ||||||
|
1,121 | (10,801 | ) | 8,032 | ||||||
Total tax provision (benefit) |
$ | 18,488 | $ | (1,380 | ) | $ | 21,548 | |||
92
SEALY CORPORATION
Notes To Consolidated Financial Statements (Continued)
Note 16: Income Taxes (Continued)
Earnings before income taxes consisted of the following:
| |
Year Ended | |||||||||
|---|---|---|---|---|---|---|---|---|---|---|
| |
November 28, 2010 |
November 29, 2009 |
November 30, 2008 |
|||||||
| |
(in thousands) |
|||||||||
United States |
$ | (133 | ) | $ | (8,828 | ) | $ | 19,855 | ||
International |
39,670 | 30,307 | 35,330 | |||||||
|
$ | 39,537 | $ | 21,479 | $ | 55,185 | ||||
The differences between the actual tax expense and tax expense computed at the statutory U.S. Federal tax rate are explained as follows:
| |
Year Ended | |||||||||
|---|---|---|---|---|---|---|---|---|---|---|
| |
November 28, 2010 |
November 29, 2009 |
November 30, 2008 |
|||||||
| |
(in thousands) |
|||||||||
Income tax provision computed at statutory rates |
||||||||||
Federal income tax provision |
$ | 13,838 | $ | 7,518 | $ | 19,315 | ||||
State and local income taxes, net of federal tax benefit |
1,783 | (672 | ) | 2,106 | ||||||
Country mix impacts of foreign operations |
524 | (1,738 | ) | (3,559 | ) | |||||
Change in valuation allowance on deferred tax assets |
(911 | ) | (1,977 | ) | 1,293 | |||||
Effect of non deductible meals and entertainment |
322 | 307 | 388 | |||||||
Convertible debt costs |
— | 1,878 | — | |||||||
Non-deductible paid-in-kind interest |
5,040 | 1,863 | — | |||||||
Unrecognized tax benefit adjustments |
(671 | ) | (11,052 | ) | 1,530 | |||||
Goodwill impairment |
— | 416 | 991 | |||||||
Other items, net |
(1,437 | ) | 2,077 | (516 | ) | |||||
Total income tax provision (benefit) |
$ | 18,488 | $ | (1,380 | ) | $ | 21,548 | |||
Unrecognized tax benefit adjustments result from a reduction in the income tax reserve as a result of the elimination of certain federal and state tax exposures during fiscal 2010 and 2009 due to the expiration of the statute of limitations.
93
SEALY CORPORATION
Notes To Consolidated Financial Statements (Continued)
Note 16: Income Taxes (Continued)
Deferred income taxes reflect the tax effect of temporary differences between carrying amounts of assets and liabilities for financial reporting purposes and the amounts for income tax purposes. The Company's total deferred tax assets and liabilities and their significant components are as follows:
| |
2010 | 2009 | |||||||||||
|---|---|---|---|---|---|---|---|---|---|---|---|---|---|
| |
Current Asset (Liability) |
Noncurrent Asset (Liability) |
Current Asset (Liability) |
Noncurrent Asset (Liability) |
|||||||||
| |
(in thousands) |
||||||||||||
Accrued salaries and benefits |
$ | 4,610 | $ | 10,429 | $ | 9,852 | $ | 10,743 | |||||
Allowance for doubtful accounts |
4,560 | — | 5,408 | — | |||||||||
Plant shutdown, idle facilities, and environmental costs |
146 | 674 | 269 | 685 | |||||||||
Tax credit and loss carryforward benefit |
524 | 24,665 | 1,278 | 39,512 | |||||||||
Accrued warranty reserve |
3,749 | 2,680 | 3,454 | 2,237 | |||||||||
Other accrued reserves |
2,035 | — | 1,102 | — | |||||||||
Property, plant and equipment |
917 | (14,492 | ) | 383 | (17,066 | ) | |||||||
Intangible assets |
224 | (8,888 | ) | 606 | (9,419 | ) | |||||||
Debt financing costs |
— | 1,122 | — | 782 | |||||||||
Pension obligation |
— | 4,488 | — | 4,565 | |||||||||
Cash discounts |
3,186 | — | 3,242 | — | |||||||||
Inventory |
1,696 | — | 1,612 | — | |||||||||
All other |
1,264 | 823 | 753 | 518 | |||||||||
|
22,911 | 21,502 | 27,959 | 32,557 | |||||||||
Valuation allowance |
(3,784 | ) | (16,187 | ) | (7,737 | ) | (26,515 | ) | |||||
|
$ | 19,127 | $ | 5,315 | $ | 20,222 | $ | 6,042 | |||||
The fiscal 2010 and 2009 current and noncurrent deferred tax asset (liability), above, include amounts that are recorded in other current liabilities and noncurrent assets on the consolidated balance sheets, as appropriate.
The Company has a valuation allowance against certain deferred tax assets of $20.0 million at November 28, 2010 and $34.3 million at November 29, 2009, primarily reflecting uncertainties regarding utilization of loss carryforward benefits in certain foreign and state jurisdictions.
At November 28, 2010, the Company had unused state net operating loss and tax credit benefits of $7.4 million generally expiring from 2011 through 2027. There is a valuation allowance against these benefits in the amount of $7.4 million which represents the portion that the Company, at this time, expects to expire unused.
A provision has not been made for U.S. or foreign taxes on undistributed earnings of foreign subsidiaries considered indefinitely invested outside the United States. Should the Company repatriate foreign earnings, the Company would have to adjust the income tax provision in the period management determined that the Company would repatriate the earnings. The calculation of such additional taxes is not practicable.
94
Notes To Consolidated Financial Statements (Continued)
Note 16: Income Taxes (Continued)
The Company adopted new FASB authoritative guidance on accounting for uncertainty in income taxes effective December 3, 2007. As a result of the adoption, the Company recognized a $10.5 million net increase to the liability for uncertain tax positions including interest and penalties of $0.7 million and $2.5 million, respectively. These increases were accounted for as a cumulative effect adjustment and recognized as an increase in the beginning accumulated deficit in the Consolidated Balance Sheets.
A reconciliation of the beginning and ending amount of unrecognized tax benefits is as follows:
| |
2010 | 2009 | |||||
|---|---|---|---|---|---|---|---|
| |
(in thousands) |
||||||
Unrecognized tax benefits, beginning of year |
$ | 16,597 | $ | 27,654 | |||
Gross increases—tax positions related to the current year |
1,797 | 300 | |||||
Gross increases—tax positions related to the prior year |
1,700 | — | |||||
Gross decreases—tax positions related to the current year |
— | — | |||||
Gross decreases—tax positions related to the prior year |
(1,202 | ) | — | ||||
Decreases for lapses in statutes of limitations |
(2,390 | ) | (11,357 | ) | |||
Decreases for settlements with taxing authorities |
(1,732 | ) | |||||
Unrecognized tax benefits, end of year |
$ | 14,770 | $ | 16,597 | |||
Net change |
($ | 1,827 | ) | ($ | 11,057 | ) | |
As of November 28, 2010, $6.2 million represents the amount of unrecognized tax benefits that, if recognized, would favorably impact the effective tax rate in future periods.
The Company recognizes interest and penalties related to unrecognized tax benefits in income tax expense. Additional interest and penalties, recorded as a component of income tax expense during fiscal 2010 and 2009, were as follows:
| |
Twelve Months Ended | ||||||
|---|---|---|---|---|---|---|---|
| |
November 28, 2010 | November 29, 2009 | |||||
| |
(in thousands) |
||||||
Additional (reduction in) interest, net |
95 | (1,746 | ) | ||||
Additional (reduction in) penalties |
(936 | ) | (280 | ) | |||
Accrued interest and penalties related to the Company's uncertain tax positions recognized in the Consolidated Balance Sheets are as follows:
| |
November 28, 2010 | November 29, 2009 | |||||
|---|---|---|---|---|---|---|---|
| |
(in thousands) |
||||||
Accrued interest |
3,677 | 3,582 | |||||
Accrued penalties |
2,172 | 3,109 | |||||
The Company expects the liability for uncertain tax positions to decrease by $2.3 million within the succeeding twelve months due to expiration of income tax statute of limitations.
Significant judgment is required in evaluating the Company's federal, state and foreign tax positions and in the determination of its tax provision. Despite the Company's belief that its liability for
95
SEALY CORPORATION
Notes To Consolidated Financial Statements (Continued)
Note 16: Income Taxes (Continued)
unrecognized tax benefits is adequate, it is often difficult to predict the final outcome or the timing of the resolution of any particular tax matter. The Company may adjust these liabilities as relevant circumstances evolve, such as guidance from the relevant tax authority, or resolution of issues in the courts. These adjustments are recognized as a component of income tax provision (benefit) entirely in the period in which they are identified. While the Company is currently undergoing examinations of certain of its corporate income tax returns by tax authorities, no issues related to these reserves have been presented to the Company and the Company has not been informed that such audits will result in an assessment or payment of taxes related to these positions during the one year period following November 28, 2010. The Company also cannot predict when or if any other future tax payments related to these tax positions may occur.
Federal years open to examination are fiscal year 2004 and forward. State and international jurisdictions remain open to examination for various years from fiscal year 2000 and forward.
Note 17: Retirement Plans
Defined Contribution Plans
Substantially all employees are covered by defined contribution profit sharing plans, where specific amounts (as annually established by the Company's Board of Directors) are set aside in trust for retirement benefits. Profit sharing expense was $4.5 million, $6.1 million, and $4.5 million for the years ended November 28, 2010, November 29, 2009, and November 30, 2008, respectively.
Pension Plans
Hourly employees working at ten of the Company's domestic manufacturing facilities are covered by union sponsored retirement plans. The Company's pension cost associated with these plans consists of periodic contributions to these plans based upon employee participation. The Company recognized expense for such contributions of $4.8 million, $4.6 million, and $4.7 million, for the years ended November, 28, 2010, November 29, 2009, and November 30, 2008, respectively.
The Company has a noncontributory, defined benefit pension plan covering current and former hourly employees at four of its active plants and eight previously closed U.S. facilities. Sealy Canada, Ltd. (a 100% owned subsidiary of the Company) also sponsors a noncontributory, defined benefit pension plan covering hourly employees at one of its facilities. Both plans provide retirement and survivorship benefits based on the employees' credited years of service. The Company's funding policy provides for contributions of an amount between the minimum required and maximum amount that can be deducted for federal income tax purposes.
Pension plan assets consist of investments in various equity and fixed income mutual funds as well as money market mutual funds. The long-term rate of return for the plans is based on the weighted average of the plans' invested allocation and the historical returns for those asset categories. Because future compensation levels are not a factor in these plans' benefit formula, the accumulated benefit obligation is approximately equal to the projected benefit obligation as reported below. The discount
96
SEALY CORPORATION
Notes To Consolidated Financial Statements (Continued)
Note 17: Retirement Plans (Continued)
rate is based on the returns on long-term bonds in the private sector and incorporates a long-term inflation rate. Summarized information for the plans follows:
Expenses and Status
Components of net periodic pension cost for employees included in the Consolidated Statements of Operations were as follows:
| |
2010 | 2009 | 2008 | ||||||||
|---|---|---|---|---|---|---|---|---|---|---|---|
| |
(in thousands) |
||||||||||
Service cost |
$ | 1,258 | $ | 751 | $ | 1,081 | |||||
Interest cost |
1,713 | 1,422 | 1,352 | ||||||||
Expected return on assets |
(1,246 | ) | (944 | ) | (1,333 | ) | |||||
Curtailment loss(a) |
— | — | 219 | ||||||||
Amortization of unrecognized net loss |
498 | 366 | 157 | ||||||||
Amortization of unrecognized transition asset |
— | — | (87 | ) | |||||||
Amortization of unrecognized prior service cost |
226 | 253 | 276 | ||||||||
Total net periodic pension cost |
2,449 | 1,848 | 1,665 | ||||||||
Less: Net periodic pension cost of discontinued operations |
(506 | ) | (505 | ) | (528 | ) | |||||
Net periodic pension cost |
$ | 1,943 | $ | 1,343 | $ | 1,137 | |||||
- (a)
- This curtailment loss relates to the closure of the Clarion, Pennsylvania manufacturing facility. See Note 25.
The other changes in plan assets and benefit obligations recognized in accumulated other comprehensive income were:
| |
2010 | 2009 | 2008 | ||||||||
|---|---|---|---|---|---|---|---|---|---|---|---|
| |
(in thousands) |
||||||||||
Net loss |
$ | 1,179 | $ | 2,883 | $ | 3,141 | |||||
Prior service cost |
— | 16 | 276 | ||||||||
Effect of curtailment(a) |
— | — | (233 | ) | |||||||
Amortization of prior service cost |
(169 | ) | (253 | ) | (276 | ) | |||||
Amortization of net loss |
(498 | ) | (366 | ) | (157 | ) | |||||
Amortization of transition asset |
— | — | 87 | ||||||||
Total recognized in other comprehensive income |
$ | 512 | $ | 2,280 | $ | 2,838 | |||||
- (a)
- This curtailment loss relates to the closure of the Clarion, Pennsylvania manufacturing facility. See Note 25.
97
SEALY CORPORATION
Notes To Consolidated Financial Statements (Continued)
Note 17: Retirement Plans (Continued)
The following assumptions, calculated on a weighted-average basis, were used to determine pension costs for the Company's pension plans:
| |
2010 | 2009 | 2008 | |||||||
|---|---|---|---|---|---|---|---|---|---|---|
Settlement (discount) rate(a) |
5.70 | % | 5.70 | % | 6.78 | % | ||||
Expected long term return on plan assets |
7.85 | % | 7.86 | % | 6.64 | % | ||||
Weighted average rate of increase in future compensation levels |
0.00 | % | 0.00 | % | 0.40 | % | ||||
- (a)
- Due to current economic differences in the interest rates in the jurisdictions of the retirement plans, the discount rates used in fiscal 2010 to determine the expenses for the United States retirement plan and Canadian retirement plan were 5.75% and 5.25%, respectively.
Obligations and Funded Status
The measurement date for all of the Company's pension plans is the date of the fiscal year end. The funded status of the pension plans as of November 28, 2010 and November 29, 2009, was as follows:
| |
2010 | 2009 | ||||||
|---|---|---|---|---|---|---|---|---|
| |
(in thousands) |
|||||||
Change in Benefit Obligation: |
||||||||
Projected benefit obligation at beginning of year |
$ | 27,455 | $ | 20,886 | ||||
Service cost |
994 | 500 | ||||||
Interest cost |
1,527 | 1,225 | ||||||
Plan changes |
— | 16 | ||||||
Actuarial losses |
1,492 | 4,869 | ||||||
Benefits paid |
(465 | ) | (646 | ) | ||||
Expenses paid |
(239 | ) | (196 | ) | ||||
Divestitures |
(4,315 | ) | 528 | |||||
Foreign currency exchange rate changes |
131 | 273 | ||||||
Projected benefit obligation at end of year |
$ | 26,580 | $ | 27,455 | ||||
Change in Plan Assets: |
||||||||
Fair value of plan assets at beginning of year |
$ | 15,367 | $ | 11,673 | ||||
Actual return on assets |
1,556 | 2,928 | ||||||
Employer contribution |
1,607 | 1,400 | ||||||
Benefits paid |
(465 | ) | (646 | ) | ||||
Expenses paid |
(239 | ) | (196 | ) | ||||
Foreign currency exchange rate changes |
79 | 208 | ||||||
Fair value of plan assets at end of year |
$ | 17,905 | $ | 15,367 | ||||
Funded status |
$ |
(8,675 |
) |
$ |
(12,088 |
) |
||
98
SEALY CORPORATION
Notes To Consolidated Financial Statements (Continued)
Note 17: Retirement Plans (Continued)
| |
2010 | 2009 | ||||||
|---|---|---|---|---|---|---|---|---|
| |
(in thousands) |
|||||||
Amounts Recognized in the Consolidated Balance Sheets: |
||||||||
Noncurrent portion of benefit liability |
$ | (8,675 | ) | $ | (12,087 | ) | ||
Accumulated other comprehensive income |
12,104 | 12,484 | ||||||
Net amount recognized as of fiscal year end |
$ | 3,429 | $ | 397 | ||||
Accumulated Benefit Obligation and Fair Value of Assets: |
||||||||
Accumulated benefit obligation |
$ | (26,580 | ) | $ | (27,455 | ) | ||
Projected benefit obligation |
(26,580 | ) | (27,455 | ) | ||||
Fair value of assets |
17,905 | 15,367 | ||||||
Unfunded Projected Benefit Obligation |
$ | (8,675 | ) | $ | (12,088 | ) | ||
| |
2010 | 2009 | ||||||
|---|---|---|---|---|---|---|---|---|
| |
(in thousands) |
|||||||
Amounts Recognized in Accumulated Other Comprehensive Income: |
||||||||
Net loss |
$ | 10,678 | $ | 9,989 | ||||
Prior service credit |
1,426 | 2,495 | ||||||
Net amount recognized as of fiscal year end |
$ | 12,104 | $ | 12,484 | ||||
The following assumptions, calculated on a weighted-average basis, were used to determine benefit obligations for the Company's pension plans as of November 28, 2010 and November 29, 2009:
| |
2010 | 2009 | 2008 | |||||||
|---|---|---|---|---|---|---|---|---|---|---|
Settlement (discount) rate(a) |
5.48 | % | 5.70 | % | 6.78 | % | ||||
Expected long term return on plan assets |
7.85 | % | 7.86 | % | 6.64 | % | ||||
Weighted average rate of increase in future compensation levels |
0.00 | % | 0.00 | % | 0.40 | % | ||||
- (a)
- Due to current economic differences in the interest rates in the jurisdictions of the retirement plans, the discount rates used in fiscal 2010 to determine the benefit obligations for the United States retirement plan and Canadian retirement plan were 5.50% and 5.25%, respectively.
The amounts in accumulated other comprehensive income/(loss) that are expected to be recognized as components of net income during the next year are as follows:
Amortization of net loss |
$ | 519 | ||
Amortization of prior service cost |
157 |
99
SEALY CORPORATION
Notes To Consolidated Financial Statements (Continued)
Note 17: Retirement Plans (Continued)