Attached files
| file | filename |
|---|---|
| 8-K - MAXIMUS, INC. 8-K - MAXIMUS, INC. | a6781226.htm |
| EX-99.1 - EXHIBIT 99.1 - MAXIMUS, INC. | a6781226ex991.htm |
Exhibit 99.2

MAXIMUS Investor Day Welcome Richard A. Montoni Chief Executive Officer A number of statements being made today will be forward-looking in nature. Such statements are only predictions and actual events or results may differ materially as a result of risks we face, including those discussed in our SEC filings. We encourage you to review the summary of these risks in Exhibit 99.1 to our most recent Form 10-K filed with the SEC. The Company does not assume any obligation to revise or update these forward-looking statements to reflect subsequent events or circumstances. 1
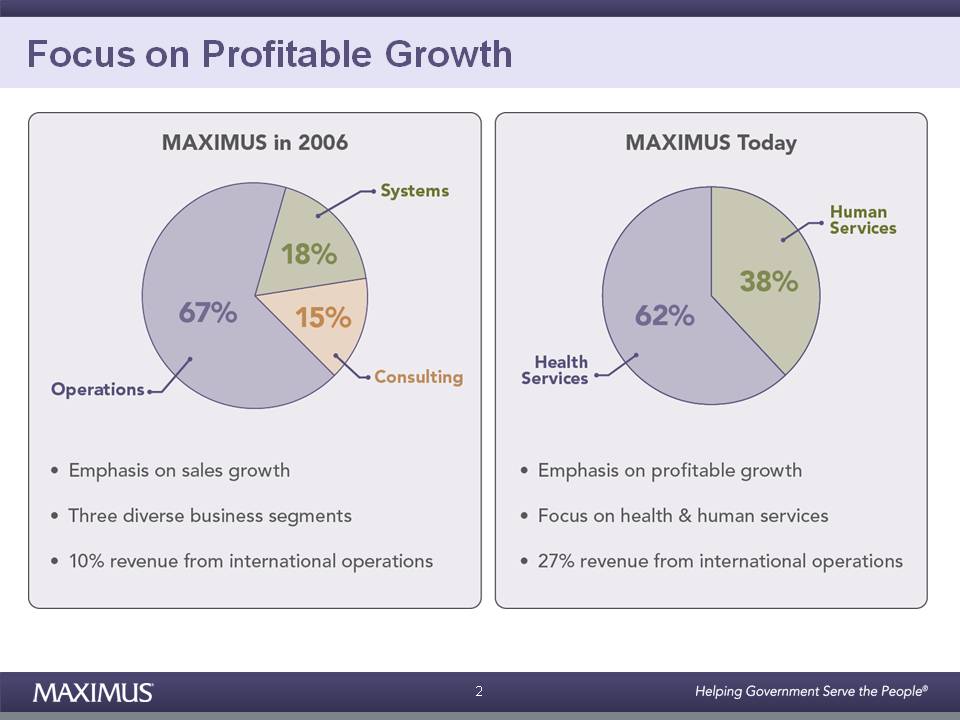
Focus on Profitable Growth 2
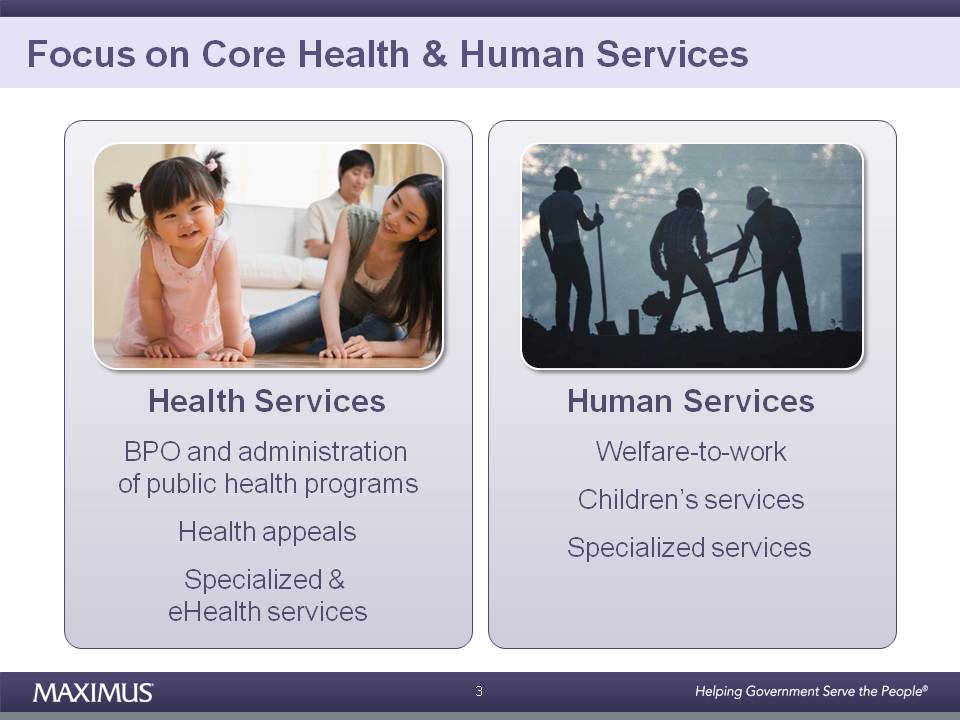
Focus on Core Health & Human Services Health Services BPO and administration of public health programs Human Services Welfare-to-work Children’s services Health appeals Specialized & eHealth services Specialized services 3
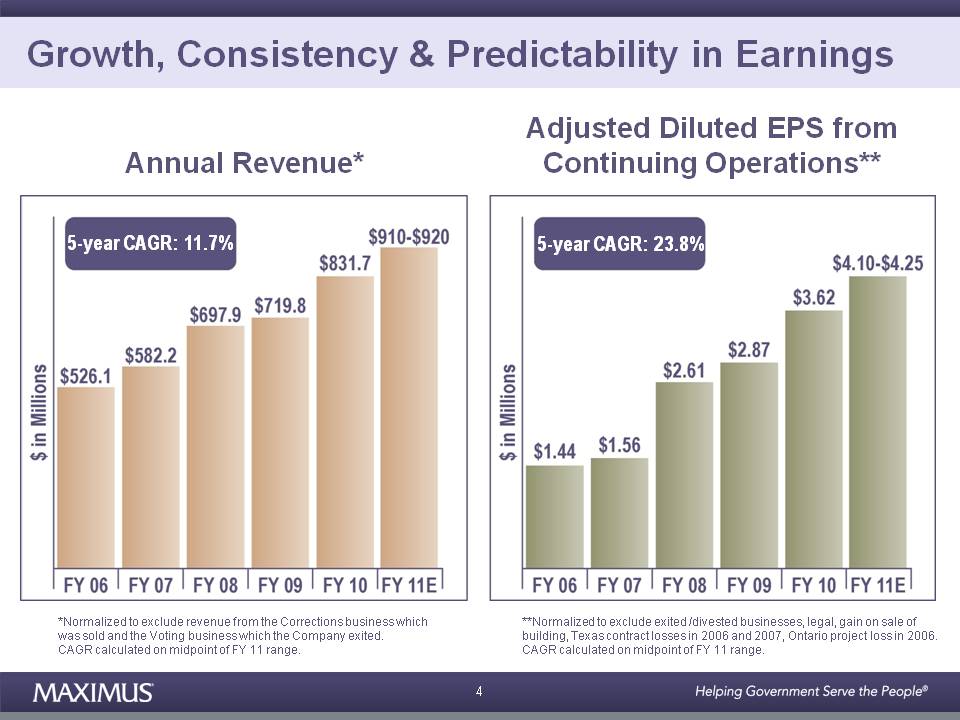
Growth, Consistency & Predictability in Earnings Annual Revenue* Adjusted Diluted EPS from Continuing Operations** 5-year CAGR: 11.7% 5-year CAGR: 23.8% 4 *Normalized to exclude revenue from the Corrections business which was sold and the Voting business which the Company exited. CAGR calculated on midpoint of FY 11 range. **Normalized to exclude exited /divested businesses, legal, gain on sale of building, Texas contract losses in 2006 and 2007, Ontario project loss in 2006. CAGR calculated on midpoint of FY 11 range.
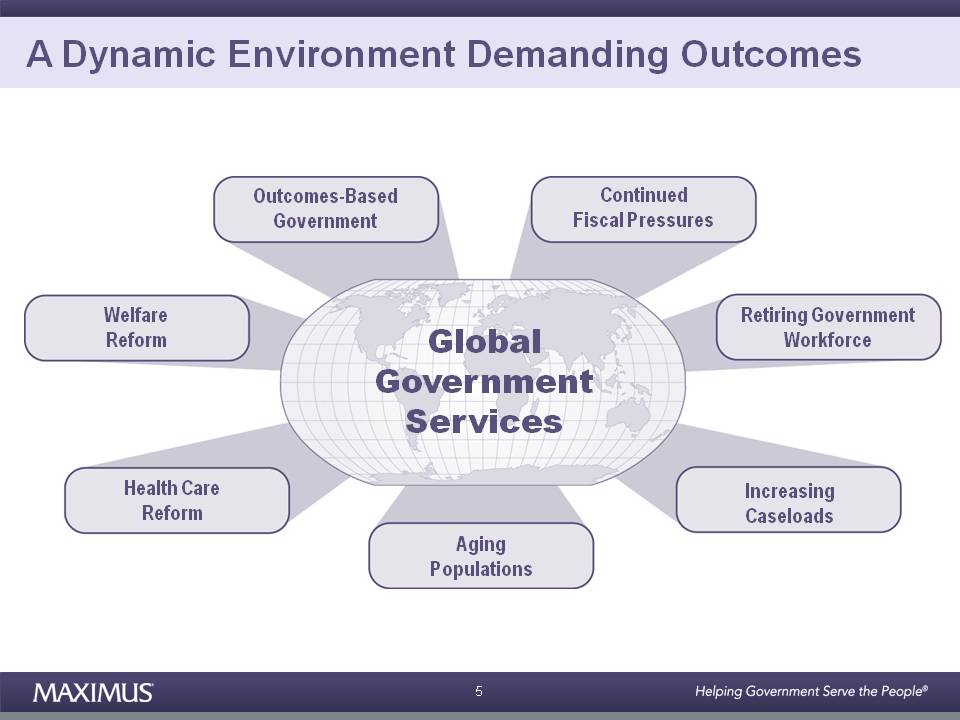
A Dynamic Environment Demanding Outcomes Continued Outcomes-Based Fiscal Pressures W lf Government R ti i G t Global Government S i Welfare Reform Retiring Government Workforce Services Health Care Reform Increasing Caseloads Aging Populations 5
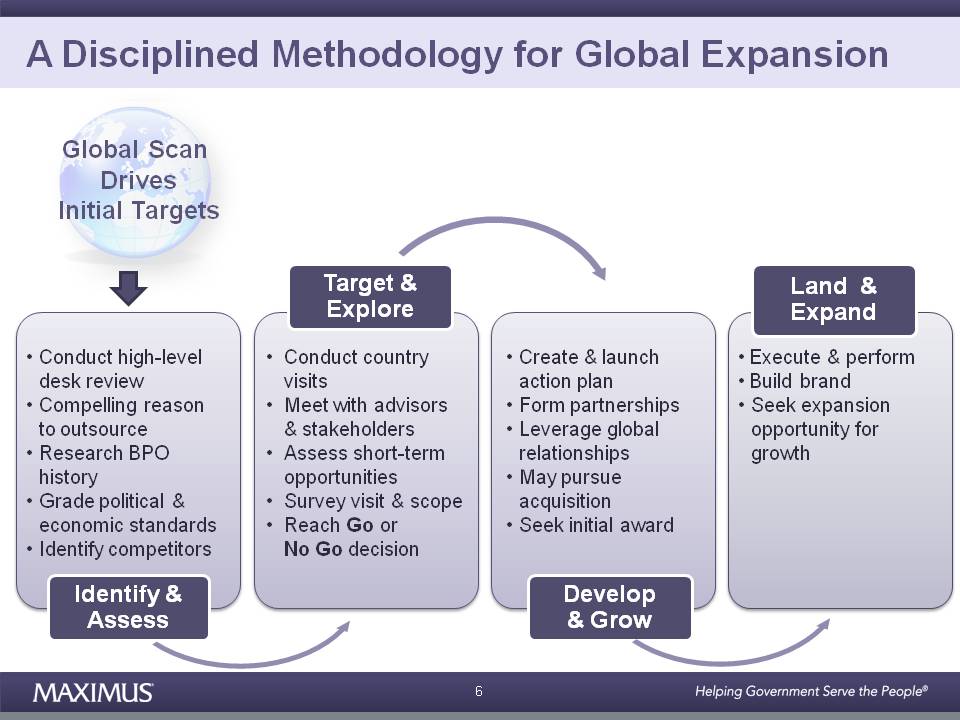
A Disciplined Methodology for Global Expansion Global Scan Drives Initial Targets Target & Explore Land & Expand • Conduct high-level desk review • • Conduct country visits • Meet • Create & launch action plan • Form • Execute & perform • Build brand • Seek Compelling reason to outsource • Research BPO history • Grade political & with advisors & stakeholders • Assess short-term opportunities • Survey visit & scope partnerships • Leverage global relationships • May pursue acquisition expansion opportunity for growth Identify & Assess Develop & Grow economic standards • Identify competitors • Reach Go or No Go decision • Seek initial award 6
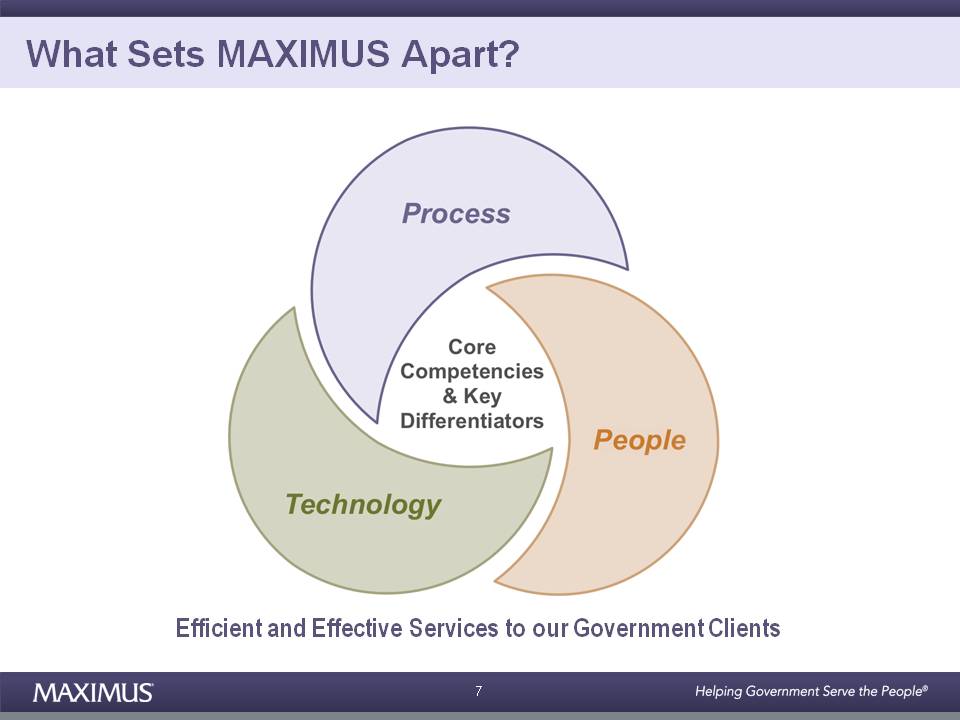
What Sets MAXIMUS Apart? 7 Efficient and Effective Services to our Government Clients
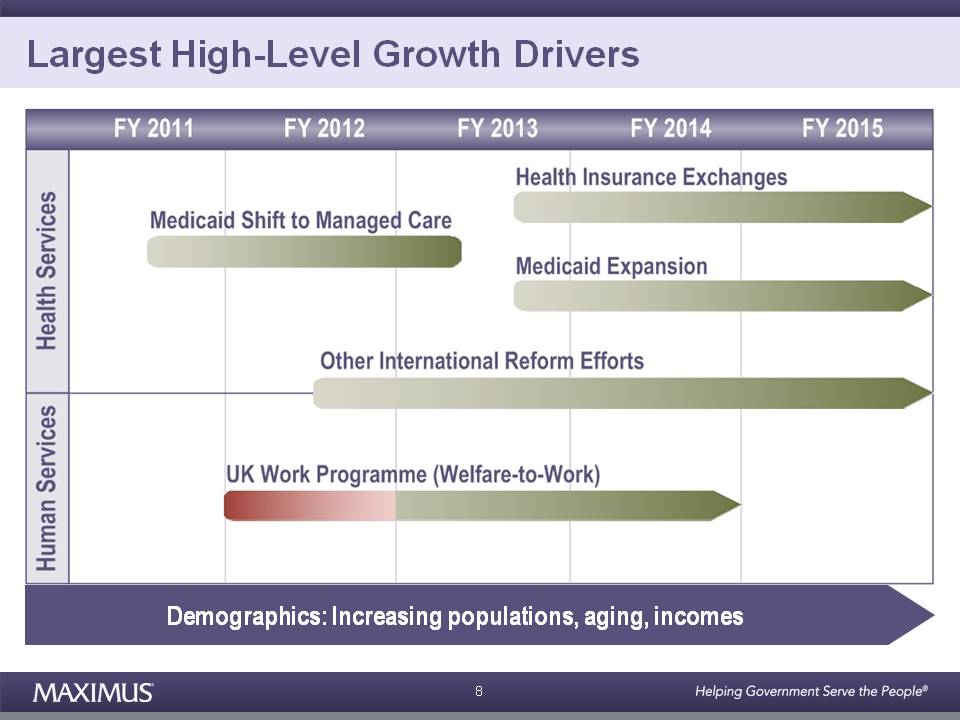
Largest High-Level Growth Drivers Demographics: populations aging 8 Increasing populations, aging, incomes
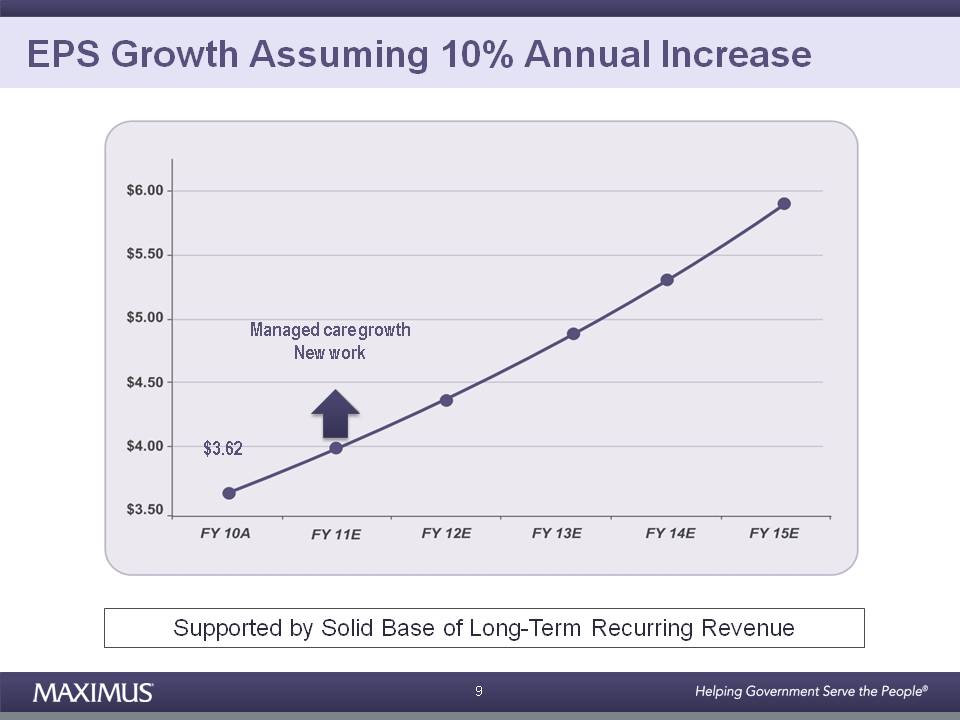
EPS Growth Assuming 10% Annual Increase Managed care growth New work $3.62 9 Supported by Solid Base of Long-Term Recurring Revenue
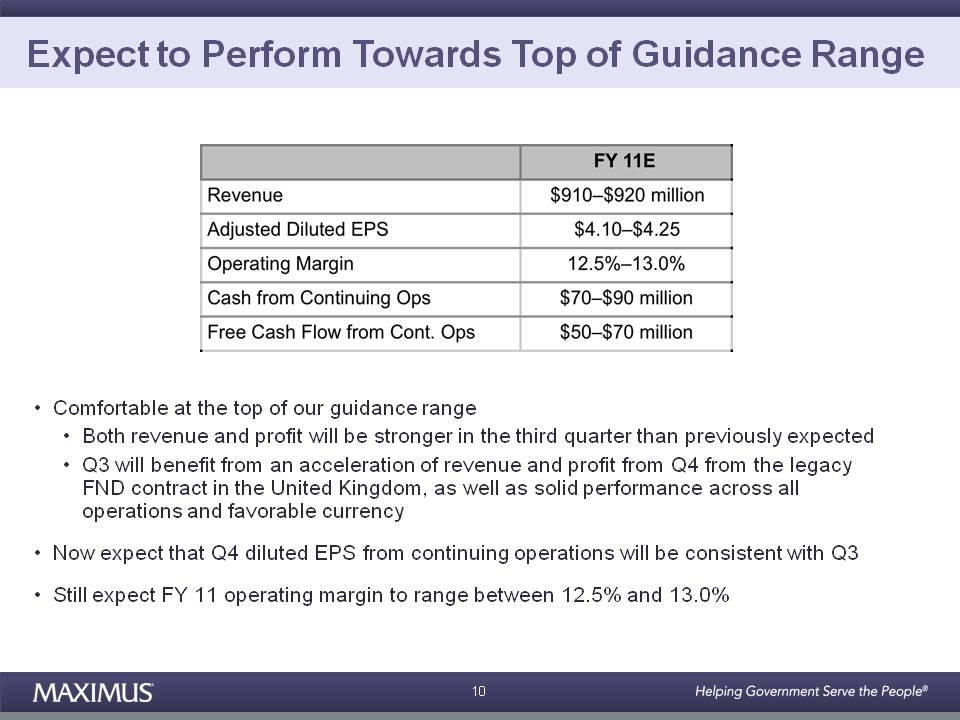
Expect to Perform Towards Top of Guidance Range • Comfortable at the top of our guidance range • Both revenue and profit will be stronger in the third quarter than previously expected • Q3 will benefit from an acceleration of revenue and profit from Q4 from the legacy FND contract in the United Kingdom, as well as solid performance across all operations and favorable currency • Now expect that Q4 diluted EPS from continuing operations will be consistent with Q3 • Still expect FY 11 operating margin to range between 12.5% and 13.0% 10
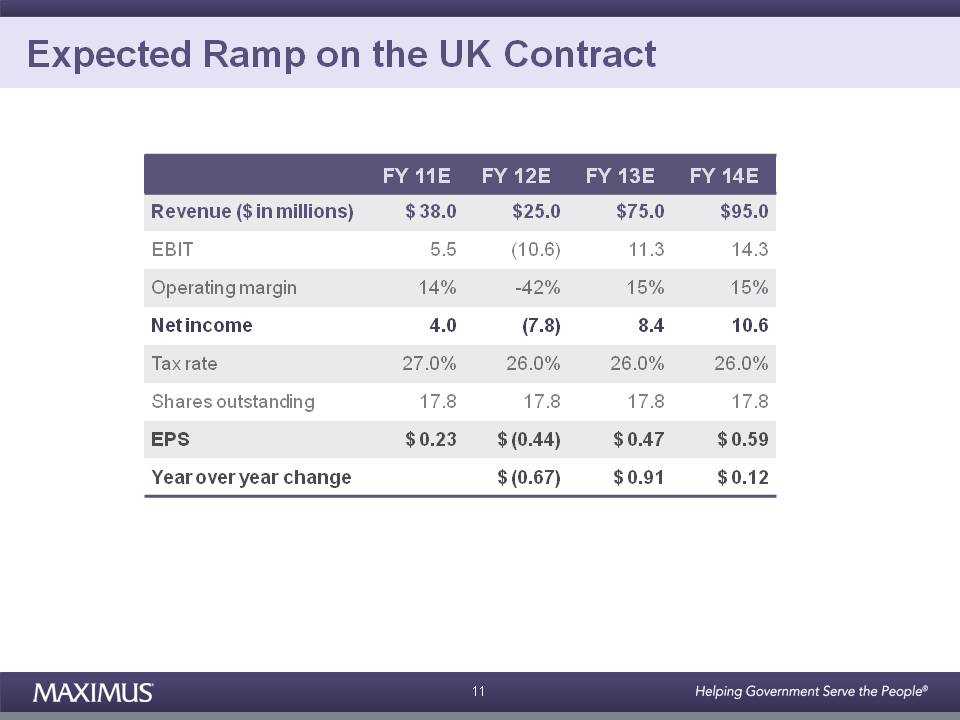
Expected Ramp on the UK Contract FY 11E FY 12E FY 13E FY 14E R ($ i illi ) $ 38 0 $25 0 $75 0 $95 0 Revenue in millions) 38.0 25.0 75.0 95.0 EBIT 5.5 (10.6) 11.3 14.3 Operating margin 14% -42% 15% 15% Net income 4.0 (7.8) 8.4 10.6 Tax rate 27.0% 26.0% 26.0% 26.0% Shares outstanding 17.8 17.8 17.8 17.8 g EPS $ 0.23 $ (0.44) $ 0.47 $ 0.59 Year over year change $ (0.67) $ 0.91 $ 0.12 11
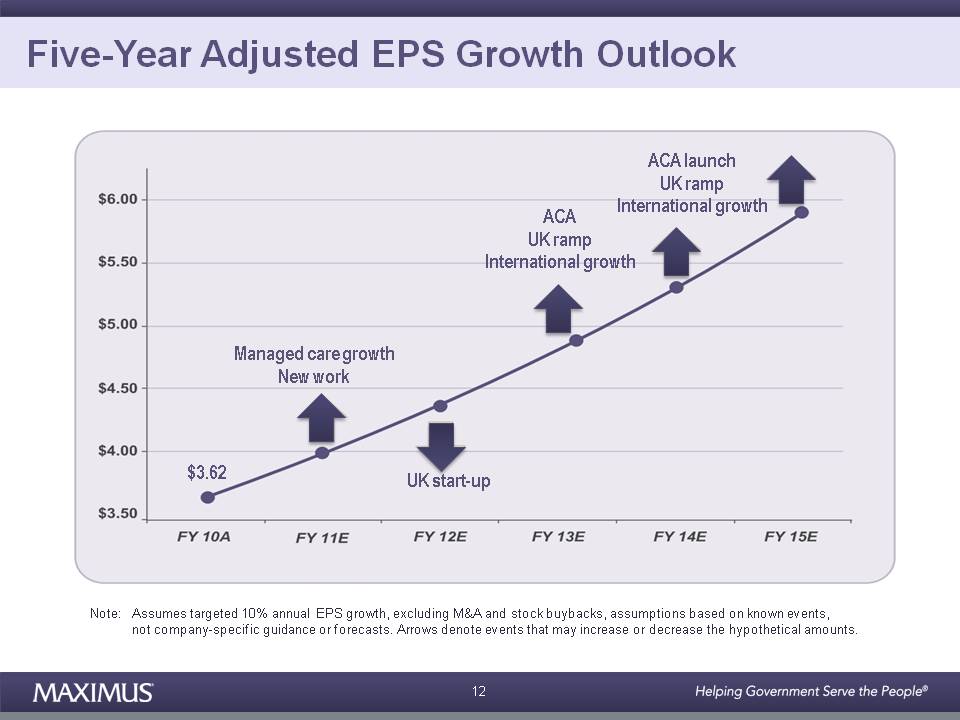
Five-Year Adjusted EPS Growth Outlook ACA launch UK ramp International growth ACA UK ramp International growth Managed care growth New work $3.62 UK start-up annual EPS assumptions 12 Note: Assumes targeted 10% growth, excluding M&A and stock buybacks, based on known events, not company-specific guidance or forecasts. Arrows denote events that may increase or decrease the hypothetical amounts.

MAXIMUS Investor Day Bruce Caswell President, Health Segment Michael Lemberg President, Health West 13
Virtual Tour: Colorado Medical Assistance Program 14 video
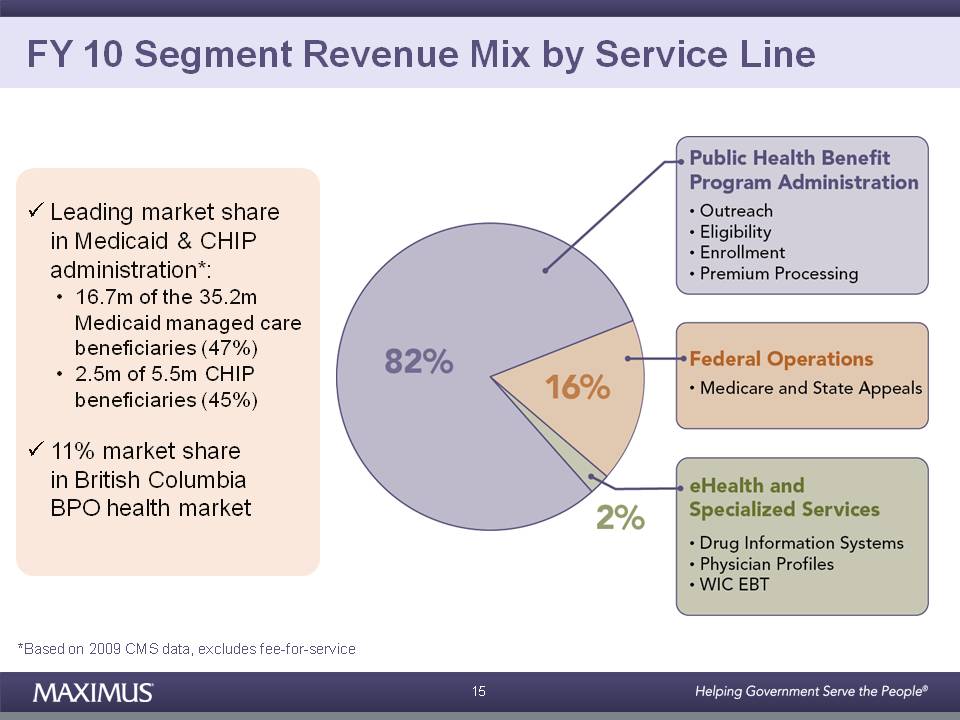
FY 10 Segment Revenue Mix by Service Line Leading market share in Medicaid & CHIP administration*: • 16.7m of the 35.2m Medicaid managed care beneficiaries (47%) • 2.5m of 5.5m CHIP beneficiaries (45%) 11% market share in British Columbia BPO health market 15 *Based on 2009 CMS data, excludes fee-for-service
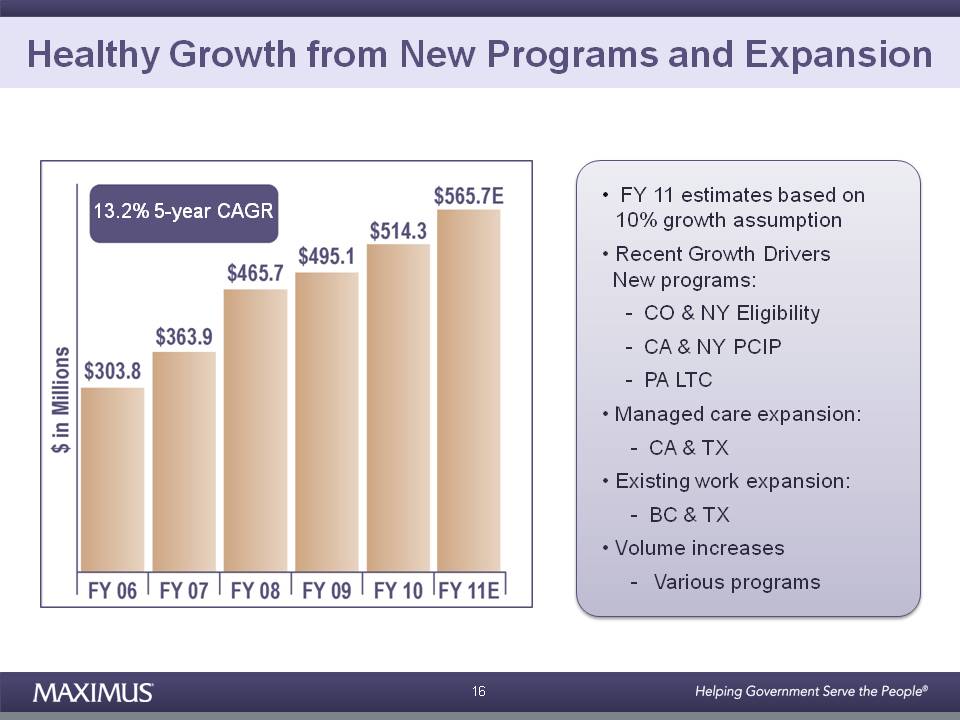
Healthy Growth from New Programs and Expansion • FY 11 estimates based on 13 2% 5 CAGR 10% growth assumption • Recent Growth Drivers New programs: 13.2% 5-year - CO & NY Eligibility - CA & NY PCIP - PA LTC • Managed care expansion: - CA & TX • Existing work expansion: BC - & TX • Volume increases - Various programs 16
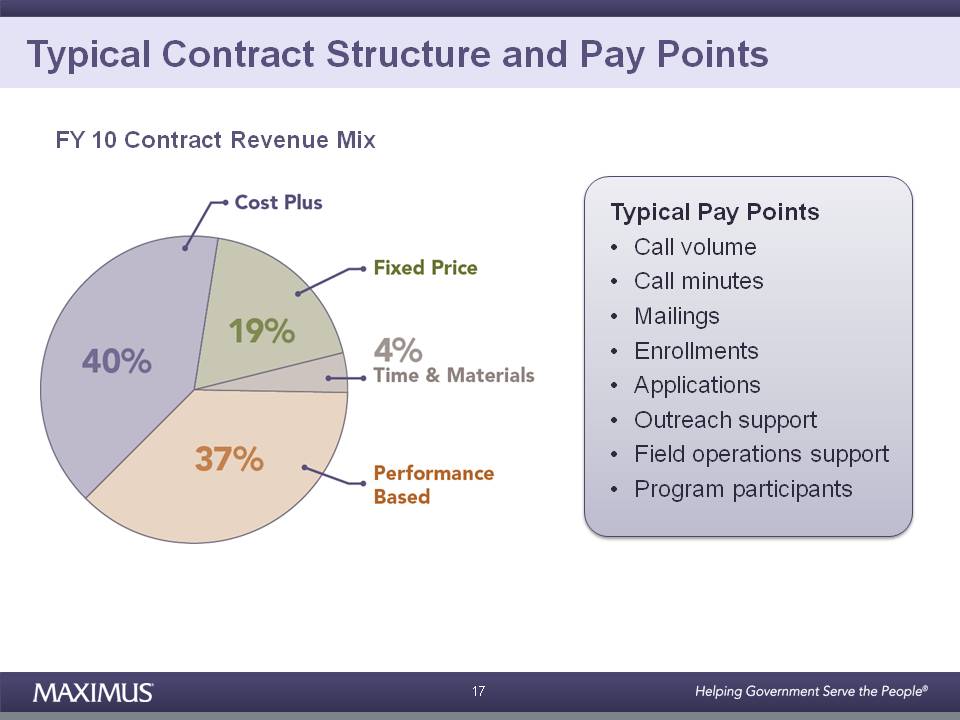
Typical Contract Structure and Pay Points FY 10 Contract Revenue Mix Typical Pay Points • Call volume • Call minutes • Mailings • Enrollments • Applications • Outreach support • Field operations support • Program participants 17
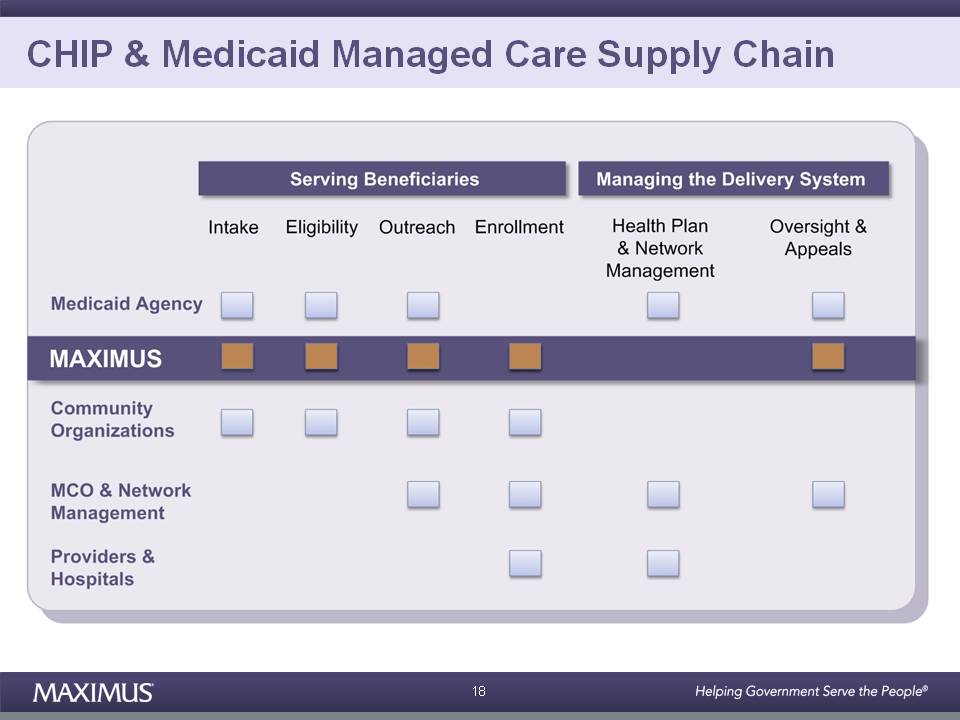
CHIP & Medicaid Managed Care Supply Chain 18
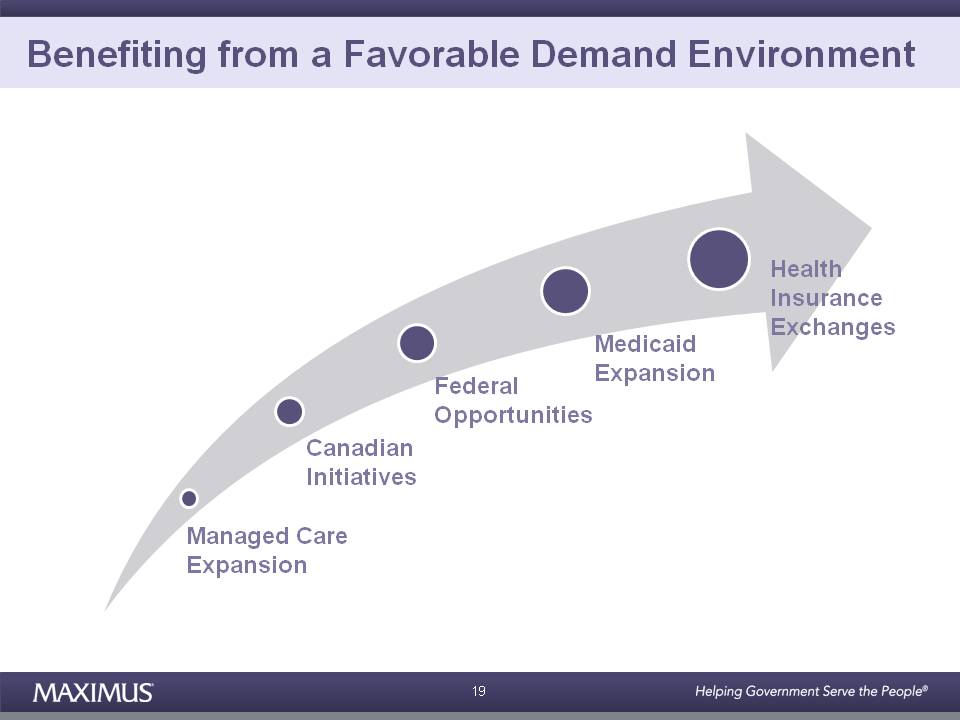
Benefiting from a Favorable Demand Environment Health Insurance Federal Opportunities Medicaid Expansion Exchanges Canadian Initiatives Managed Care Expansion 19
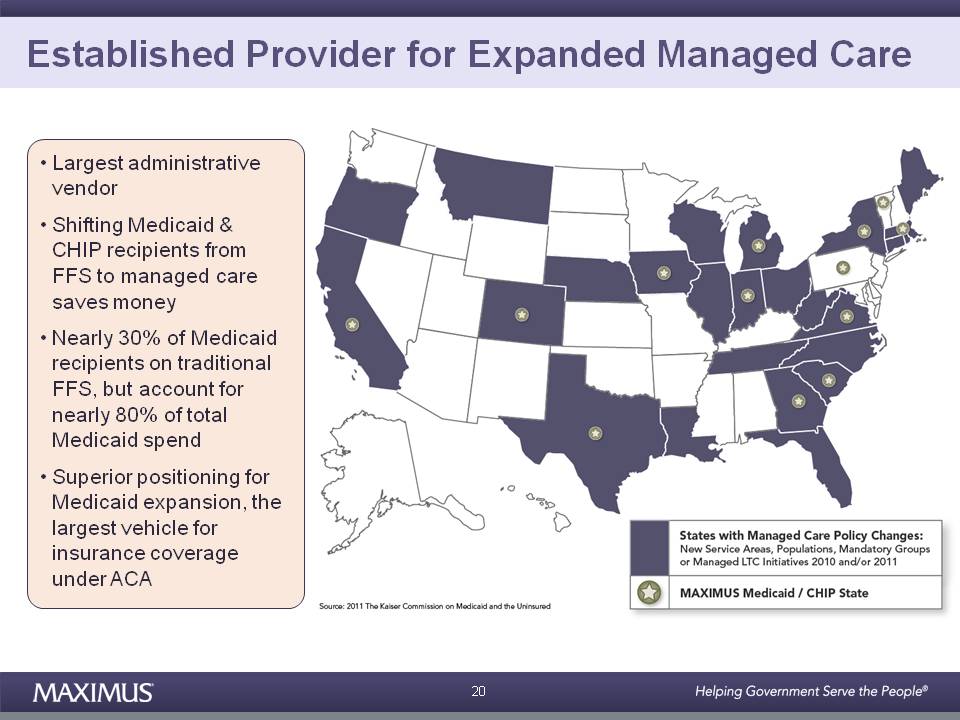
Established Provider for Expanded Managed Care • Largest administrative vendor • Shifting Medicaid & CHIP recipients from FFS to managed care saves money • Nearly 30% of Medicaid recipients on traditional FFS, but account for nearly 80% of total Medicaid spend • Superior positioning for Medicaid expansion, the largest vehicle for insurance coverage under ACA 20
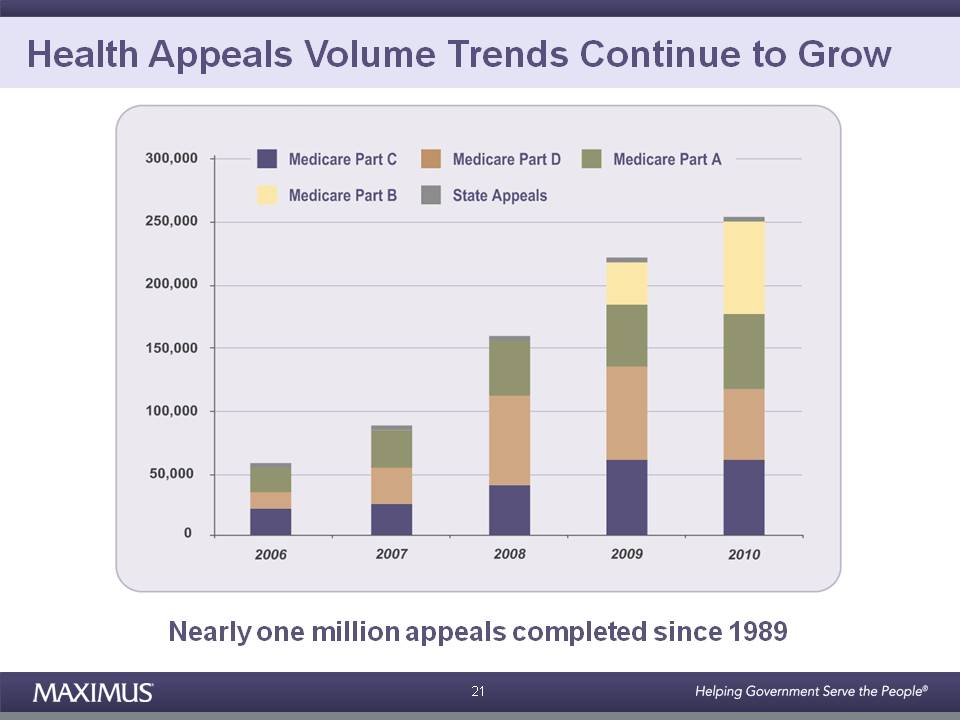
Health Appeals Volume Trends Continue to Grow 21
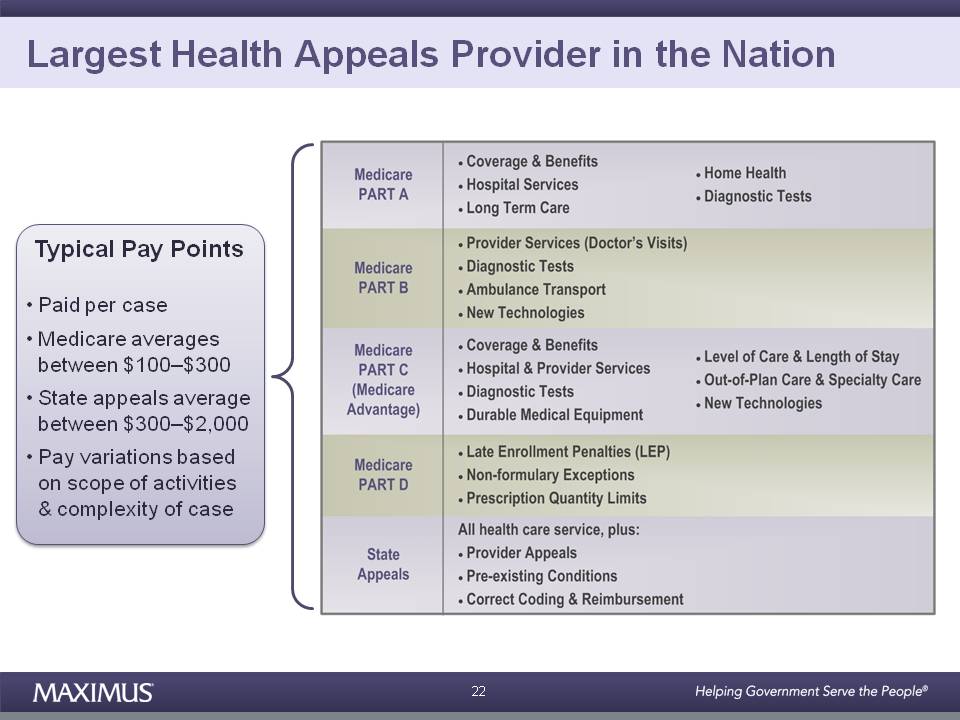
Nearly one million appeals completed since 1989 Largest Health Appeals Provider in the Nation Typical Pay Points • Paid per case • Medicare averages between $100–$300 • State appeals average between $300–$2,000 • Pay variations based on scope of activities & complexity of case 22
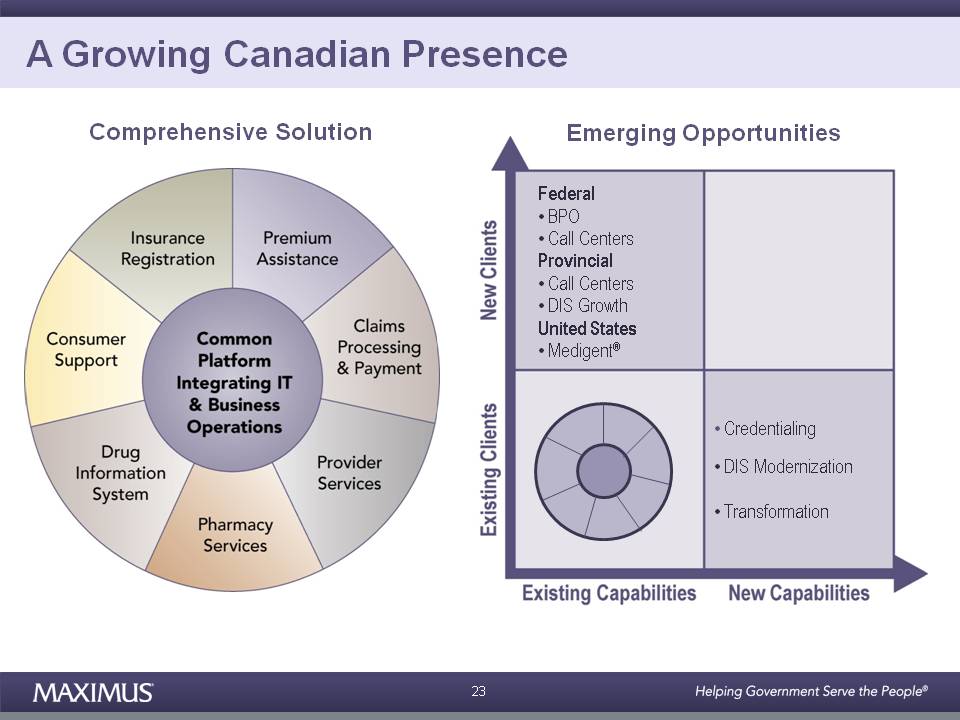
A Growing Canadian Presence Federal Comprehensive Solution Emerging Opportunities • BPO • Call Centers Provincial • Call Centers • DIS Growth United States • Medigent® • Credentialing • DIS Modernization • Transformation 23
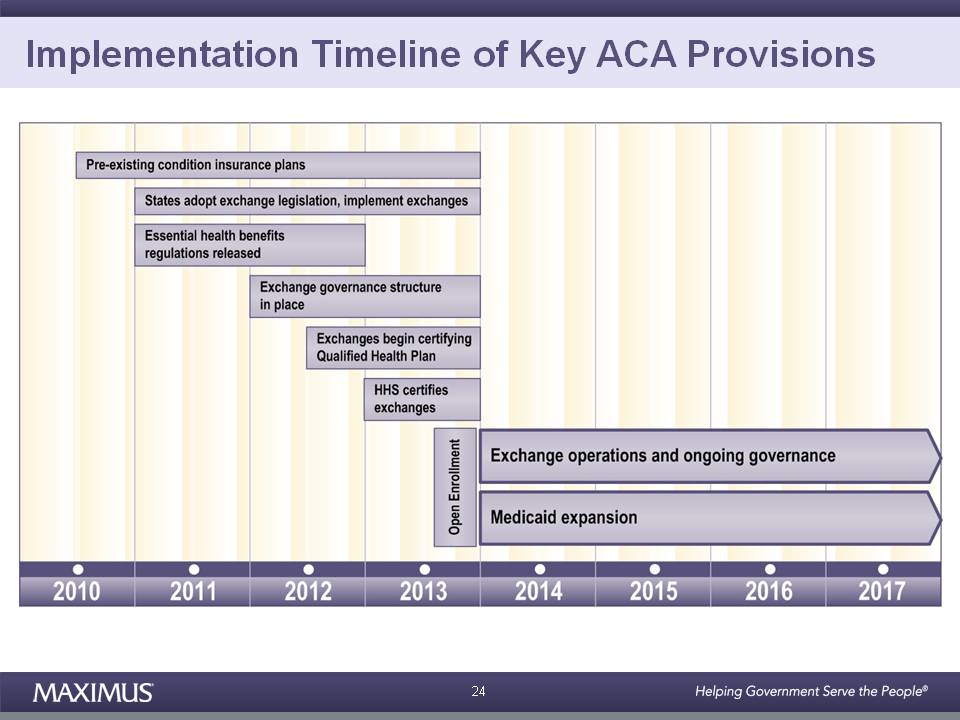
Implementation Timeline of Key ACA Provisions 24
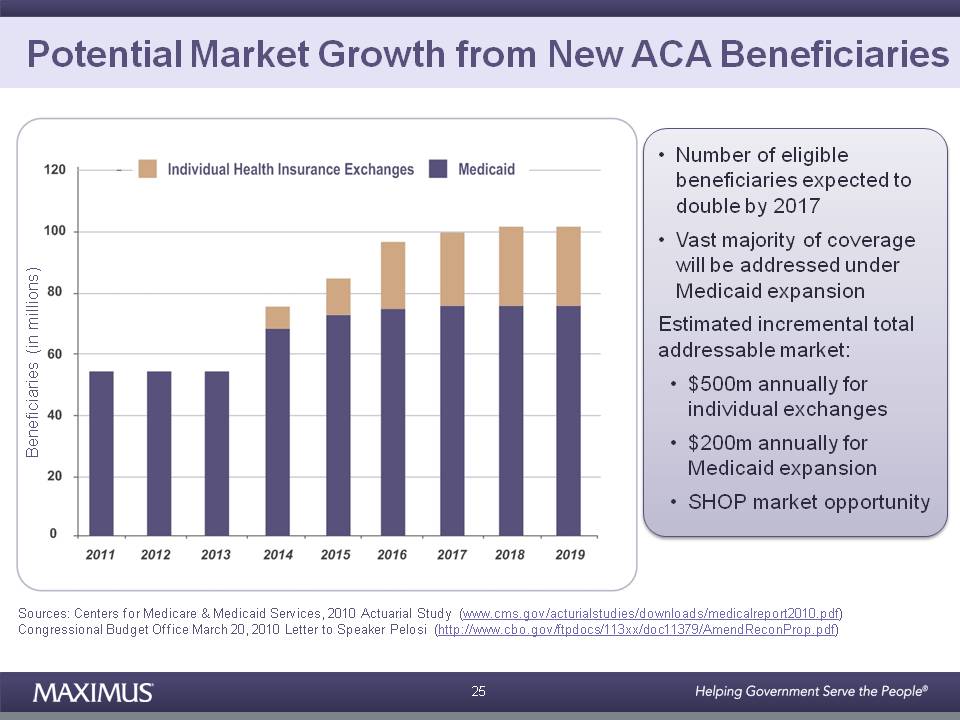
Potential Market Growth from New ACA Beneficiaries • Number of eligible beneficiaries expected to double by 2017 • Vast majority of coverage will be addressed under Medicaid expansion Beneficiaries (in millions) Estimated incremental total addressable market: • $500m annually for individual exchanges • $200m annually for Medicaid expansion • SHOP market opportunity Sources: Centers for www.cms.gov/acturialstudies/downloads/medicalreport2010.pdf) 25 Medicare & Medicaid Services, 2010 Actuarial Study (Congressional Budget Office March 20, 2010 Letter to Speaker Pelosi (http://www.cbo.gov/ftpdocs/113xx/doc11379/AmendReconProp.pdf)
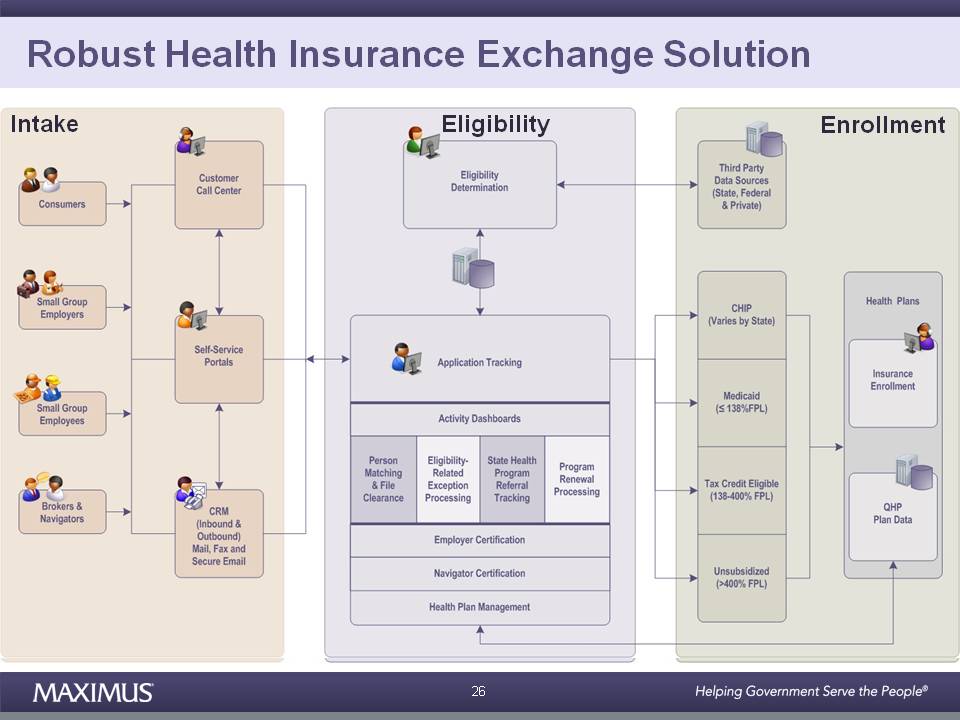
Robust Health Insurance Exchange Solution Intake Eligibility Enrollment 26
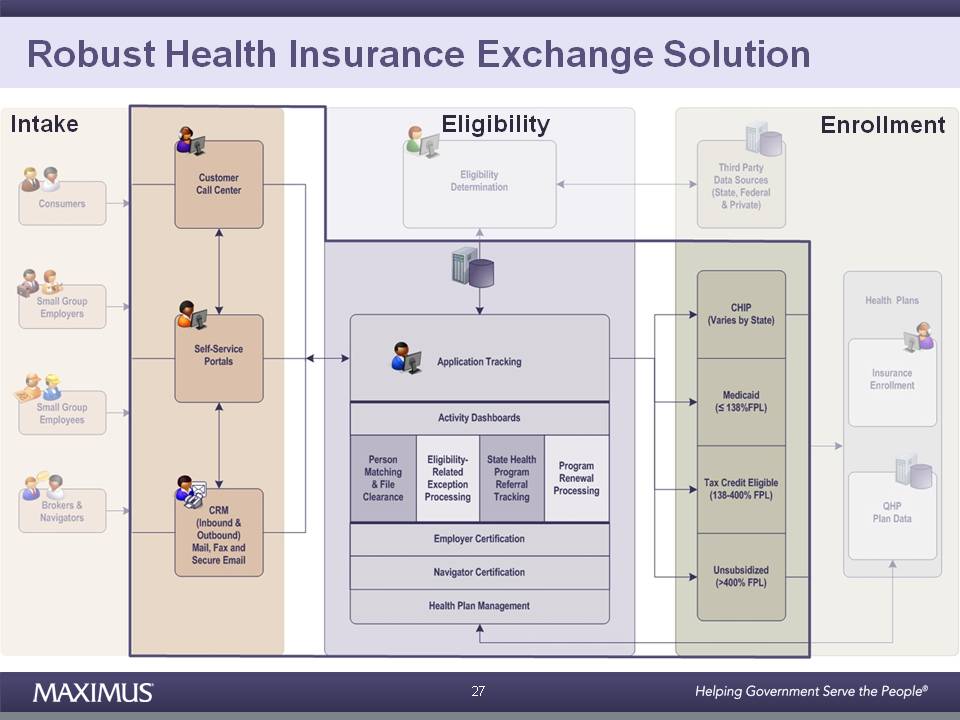
Robust Health Insurance Exchange Solution Intake Eligibility Enrollment 27
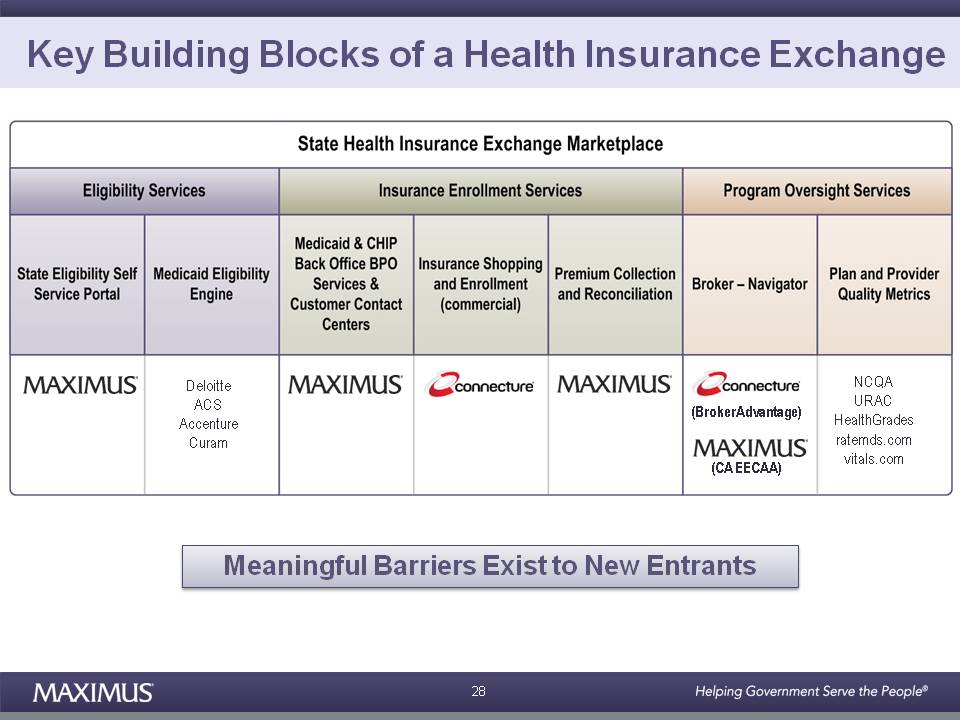
Key Building Blocks of a Health Insurance Exchange Deloitte ACS NCQA URAC (BrokerAdvantage) Accenture Curam HealthGrades ratemds.com vitals.com (CA EECAA) Meaningful Barriers Exist to New Entrants 28
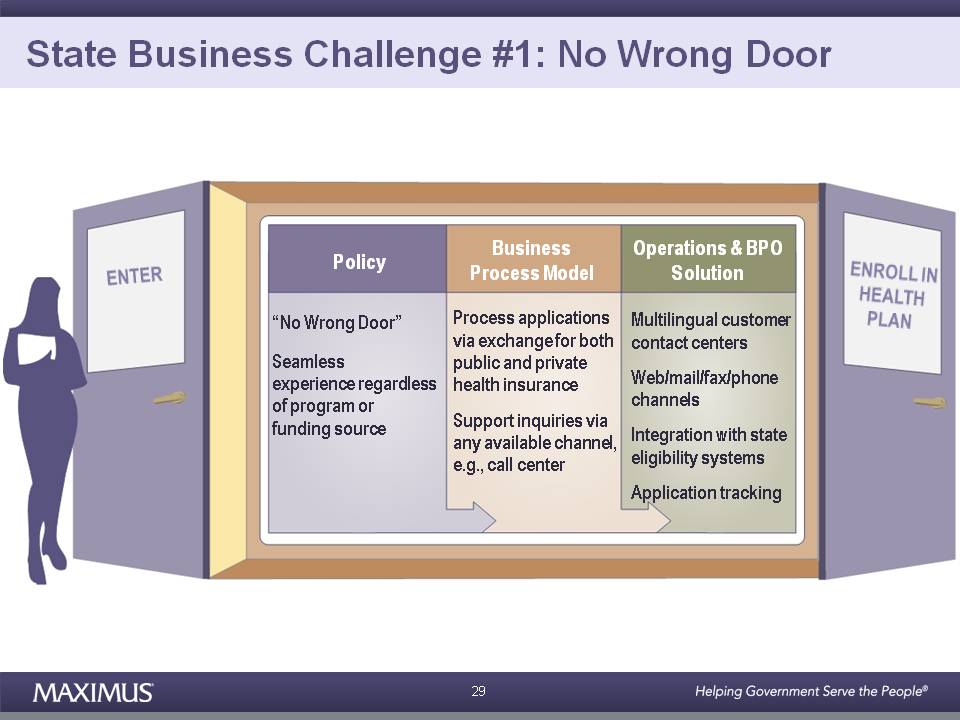
State Business Challenge #1: No Wrong Door Policy Business Process Model Operations & BPO Solution “No Wrong Door” Seamless experience regardless of program or Process applications via exchange for both public and private health insurance Multilingual customer contact centers Web/mail/fax/phone channels funding source Support inquiries via any available channel, e.g., call center Integration with state eligibility systems Application tracking 29
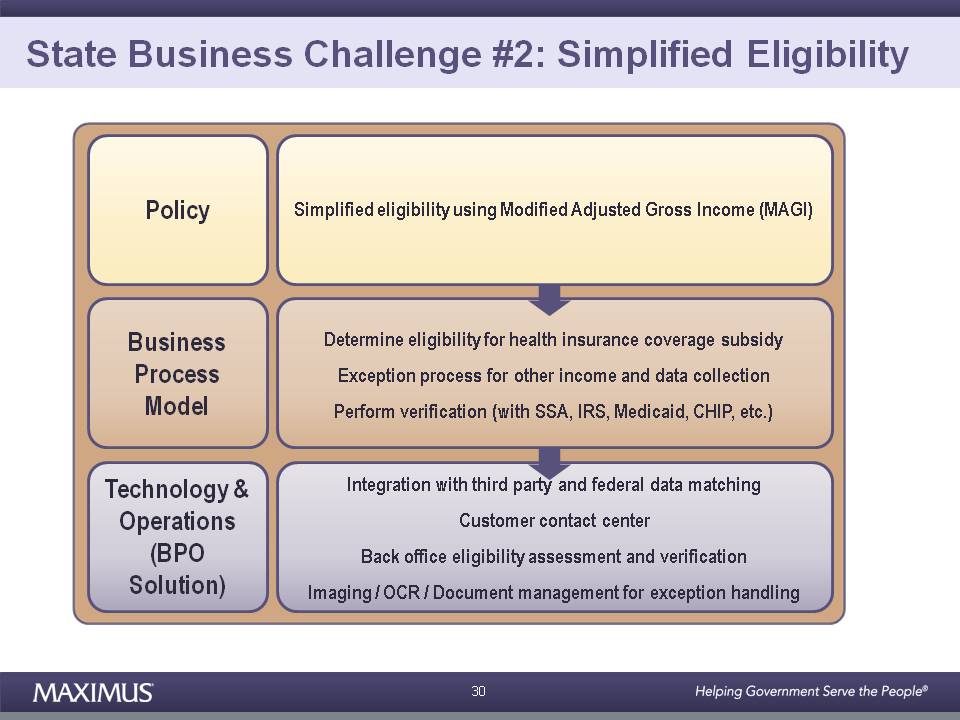
State Business Challenge #2: Simplified Eligibility Policy (MAGI) Simplified eligibility using Modified Adjusted Gross Income Determine eligibility for health insurance coverage subsidy Exception process for other income and data collection Perform (with SSA IRS Medicaid CHIP etc ) Business Process Model Integration with third party and federal data matching verification SSA, IRS, Medicaid, CHIP, etc.) Technology & Operations Customer contact center Back office eligibility assessment and verification Imaging / OCR / Document management for exception handling (BPO Solution) 30
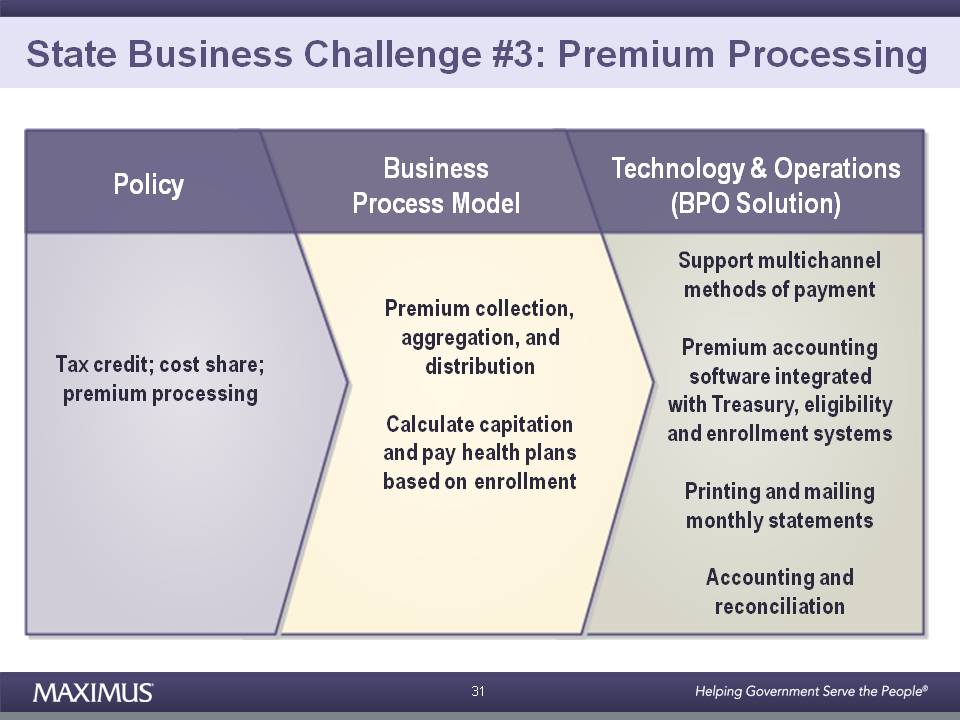
State Business Challenge #3: Premium Processing Policy Business Technology & Operations (BPO Solution) Process Model Premium collection Support multichannel methods of payment Tax credit; cost share; premium processing collection, aggregation, and distribution Premium accounting software integrated with Treasury, eligibility Calculate capitation and pay health plans based on enrollment and enrollment systems Printing and mailing monthly statements Accounting and reconciliation 31
State Business Challenge #3: Premium Processing Policy Business Technology & Operations (BPO Solution) Process Model Premium collection Support multichannel methods of payment Tax credit; cost share; premium processing collection, aggregation, and distribution Premium accounting software integrated with Treasury, eligibility Calculate capitation and pay health plans based on enrollment and enrollment systems Printing and mailing monthly statements Accounting and reconciliation 31
Driving Long-Term Growth Leading Market Position Market Growth Drivers MAXIMUS Growth 32

Questions? 33

MAXIMUS Investor Day MAXIMUS Investor Day Health Services Panel Governor Jim Douglas Cindy Gillespie Bruce Caswell Michael Lemberg Moderated by: Judy Feder 34
Break 35
MAXIMUS Investor Day Akbar Piloti President, Human Services Segment Kathleen Kerr President, Human Services North America Michael Hobday President, Human Services International 36
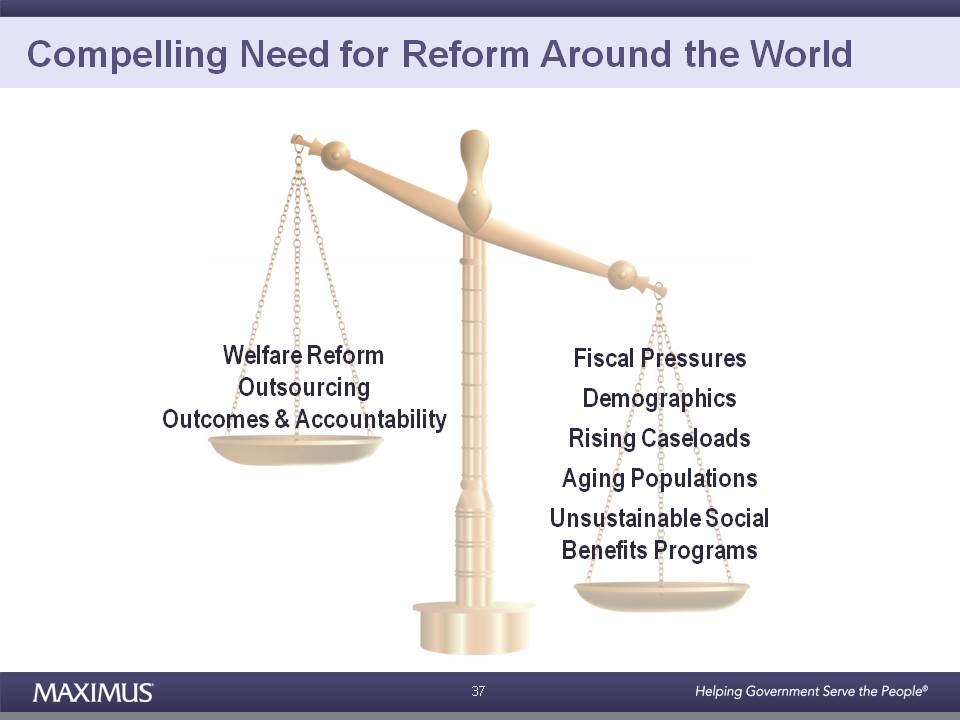
Compelling Need for Reform Around the World Fiscal Pressures Demographics Welfare Reform Outsourcing Rising Caseloads Aging Populations Unsustainable Social Outcomes & Accountability Benefits Programs 37
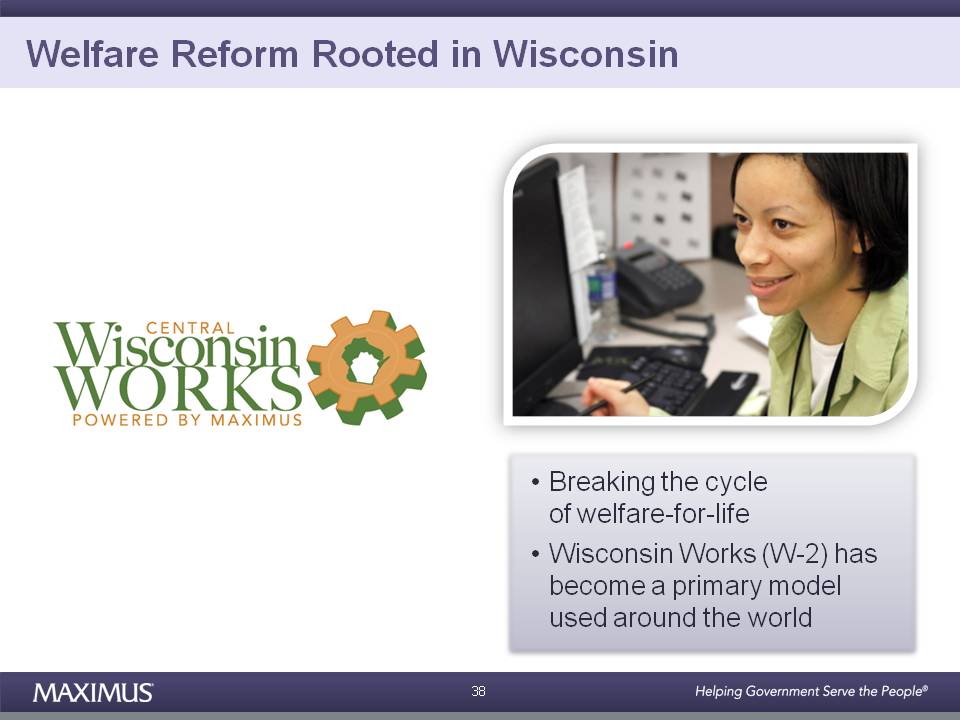
Welfare Reform Rooted in Wisconsin • Breaking the cycle of welfare for life welfare-for- • Wisconsin Works (W-2) has become a primary model used around 38 the world
Wisconsin Works: Deanna’s Success Story 39 video
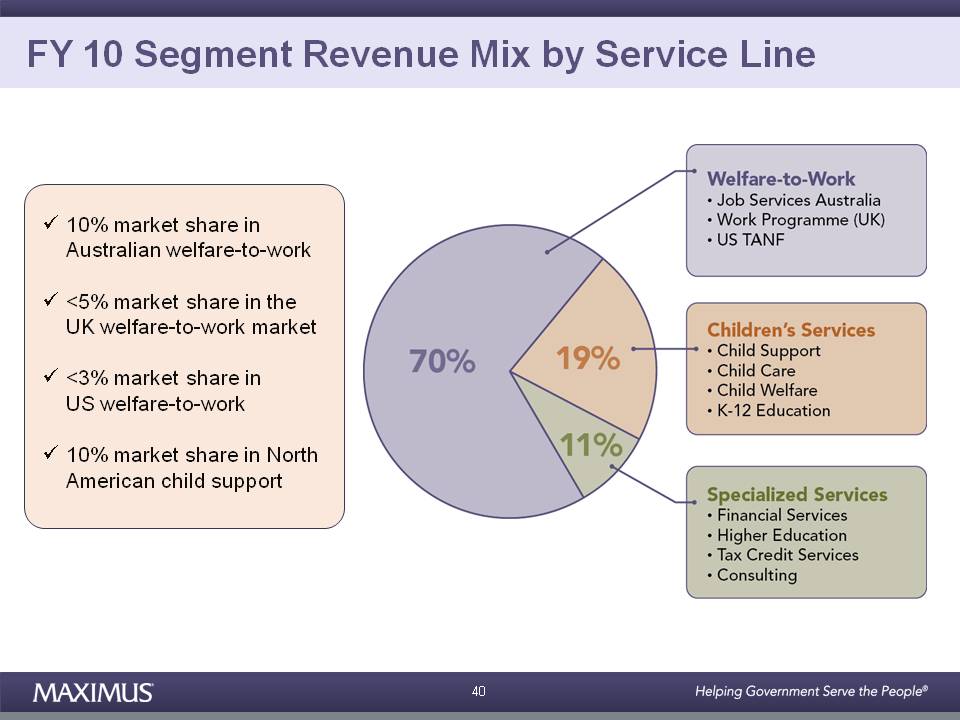
FY 10 Segment Revenue Mix by Service Line 10% market share in Australian welfare-to-work <5% market share in the UK welfare-to-work market <3% market share in US welfare-to-work 10% market share in North American child support 40
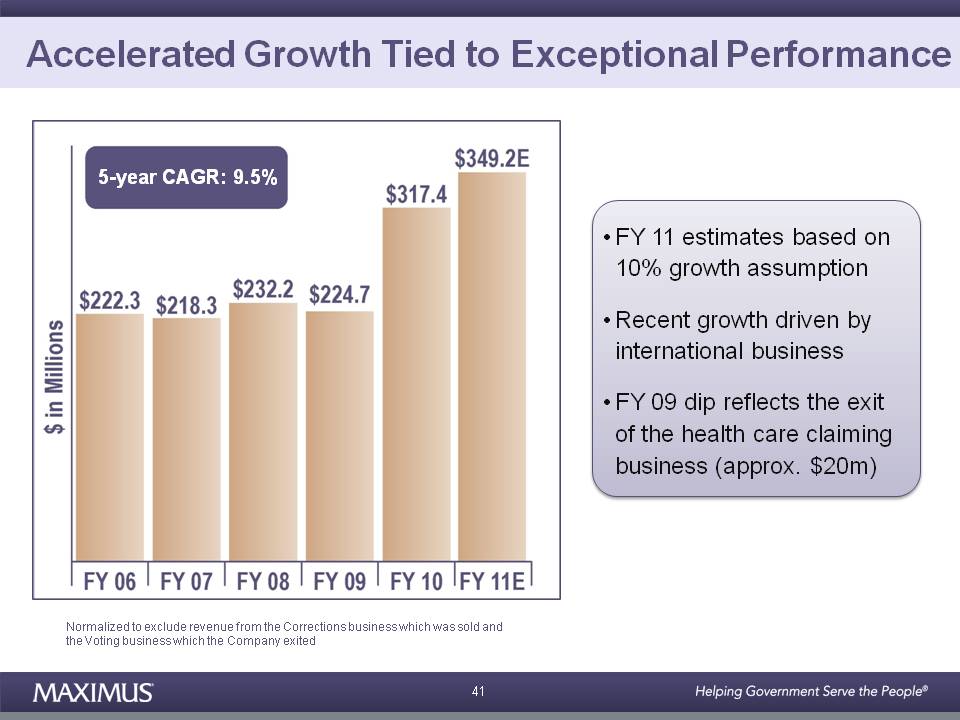
Accelerated Growth Tied to Exceptional Performance 5-year CAGR: 9.5% • FY 11 estimates based on 10% growth assumption • Recent growth driven by international business • FY 09 dip reflects the exit of the health care claiming business (approx. $20m) 41 Normalized to exclude revenue from the Corrections business which was sold and the Voting business which the Company exited
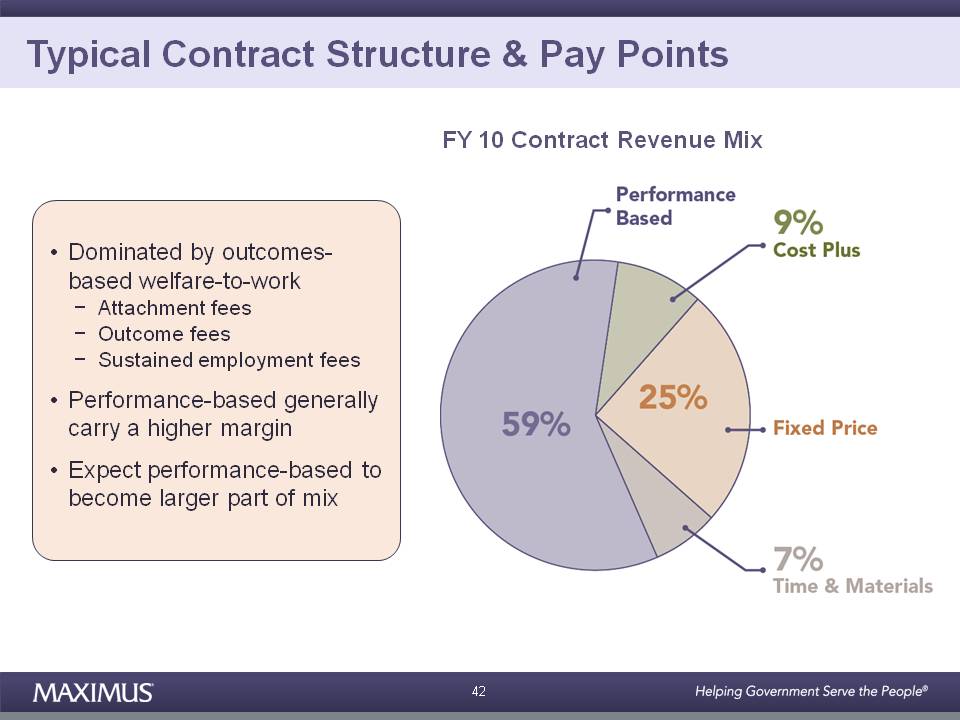
Typical Contract Structure & Pay Points FY 10 Contract Revenue Mix • Dominated by outcomes based welfare-to-work − Attachment fees − Outcome fees − Sustained employment fees • Performance-based generally carry a higher margin • Expect performance-based to become larger part of mix 42
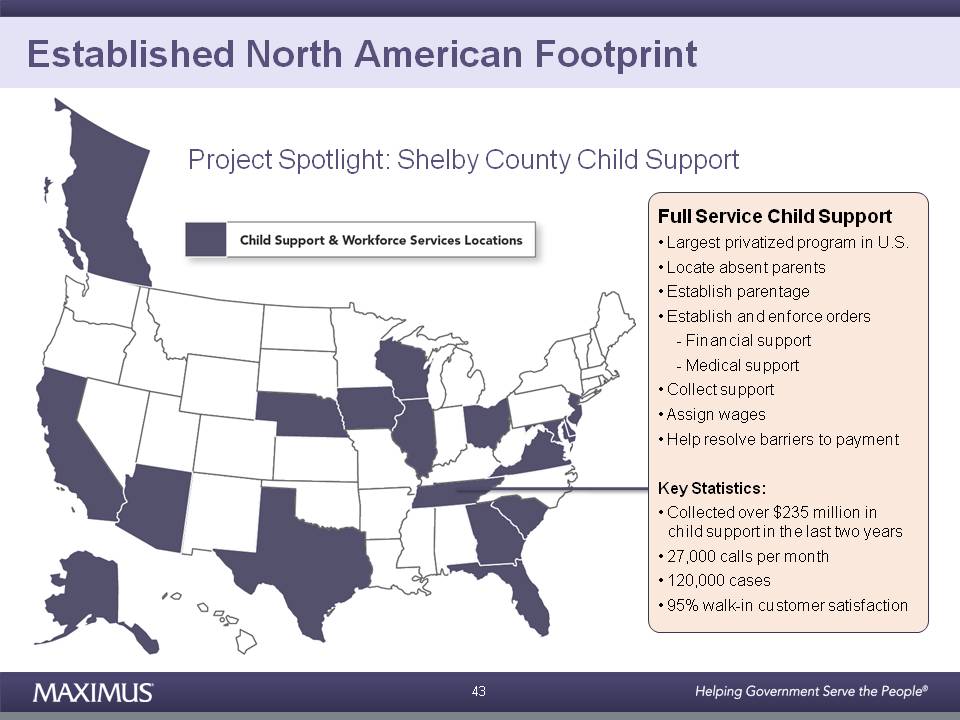
Established North American Footprint Project Spotlight: Shelby County Child Support Full Service Child Support • Largest privatized program in U.S. • Locate absent parents • Establish parentage • Establish and enforce orders - Financial support - Medical support • Collect support • Assign wages • Help resolve barriers to payment Key Statistics: • Collected over $235 million in child support in the last two years • 27,000 calls per month • 120,000 cases • 95% walk-in customer satisfaction 43
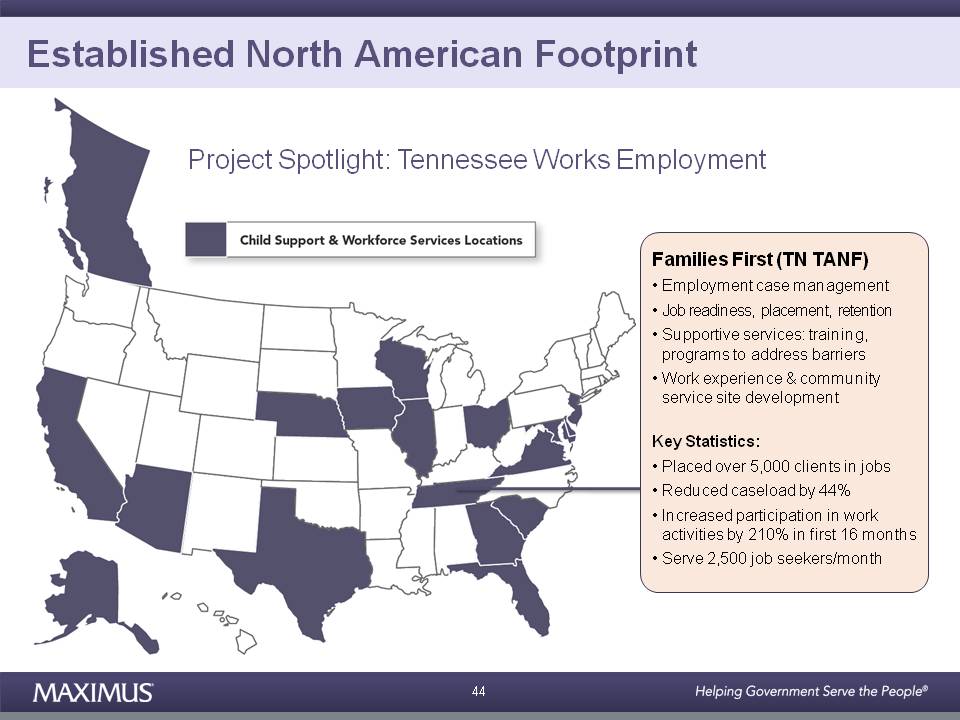
Established North American Footprint Project Spotlight: Tennessee Works Employment Families First (TN TANF) • Employment case management Job readiness placement • readiness, placement, retention • Supportive services: training, programs to address barriers • Work experience & community service site development Key Statistics: • Placed over 5,000 clients in jobs • Reduced caseload by 44% • Increased participation in work activities by 210% in first 16 months • Serve 2,500 job seekers/month 44
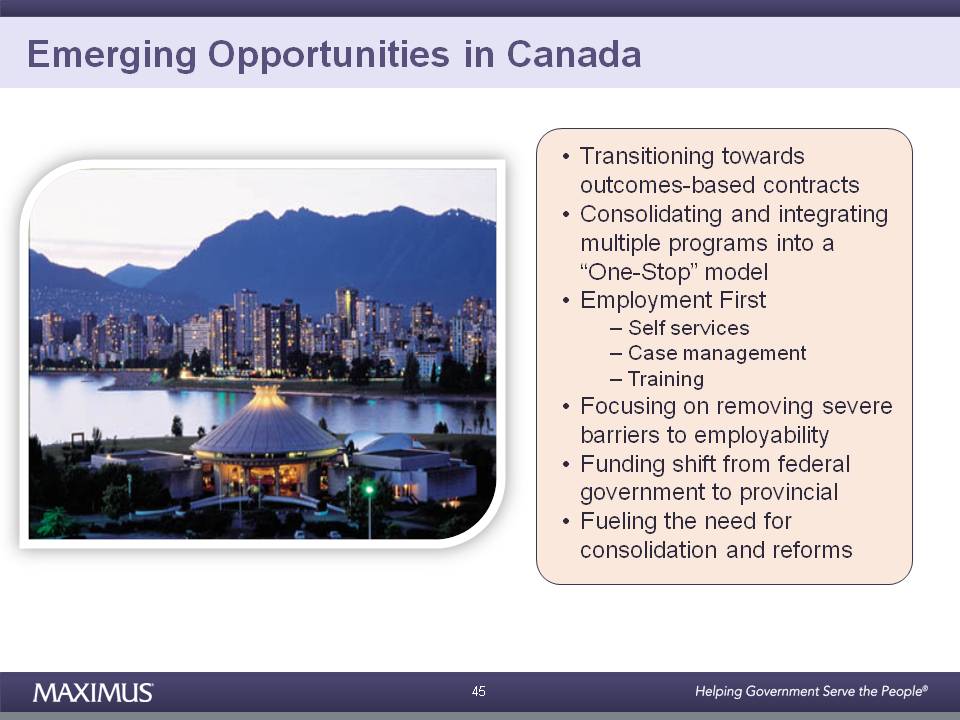
Emerging Opportunities in Canada • Transitioning towards outcomes-based contracts • Consolidating and integrating multiple programs into a “One-Stop” model • Employment First – Self services – Case management – Training • Focusing on removing severe barriers to employability • Funding shift from federal government to provincial • Fueling the need for consolidation and reforms 45
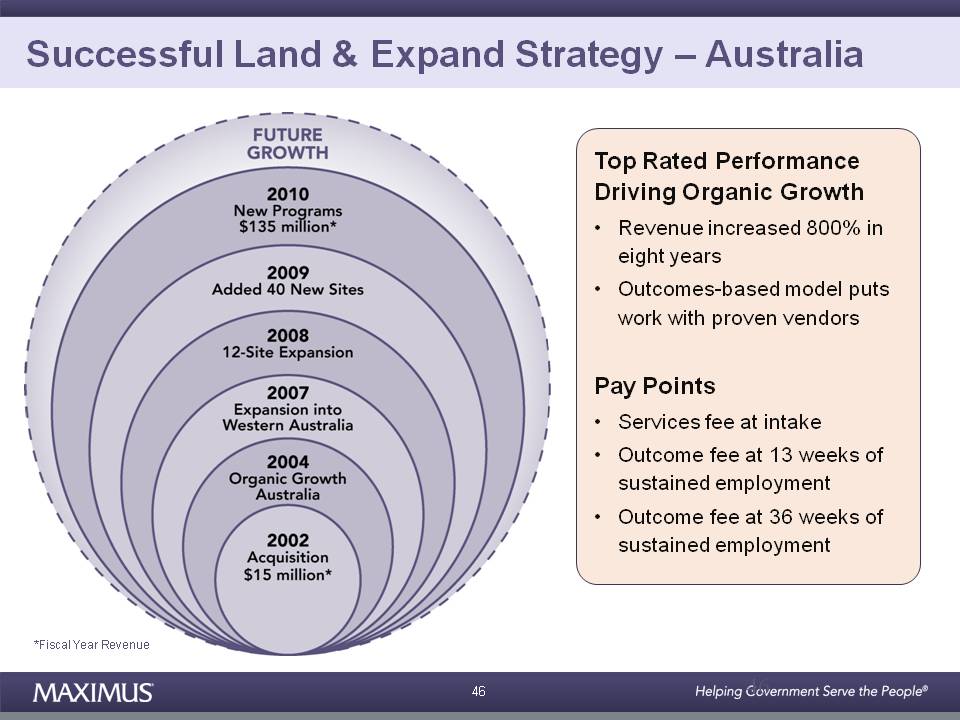
Successful Land & Expand Strategy – Australia Top Rated Performance Driving Organic Growth • Revenue increased 800% in eight years • Outcomes-based model puts work with proven vendors Pay Points • Services fee at intake • Outcome fee at 13 weeks of sustained employment • 36 Outcome fee at weeks of sustained employment 46 *Fiscal Year Revenue
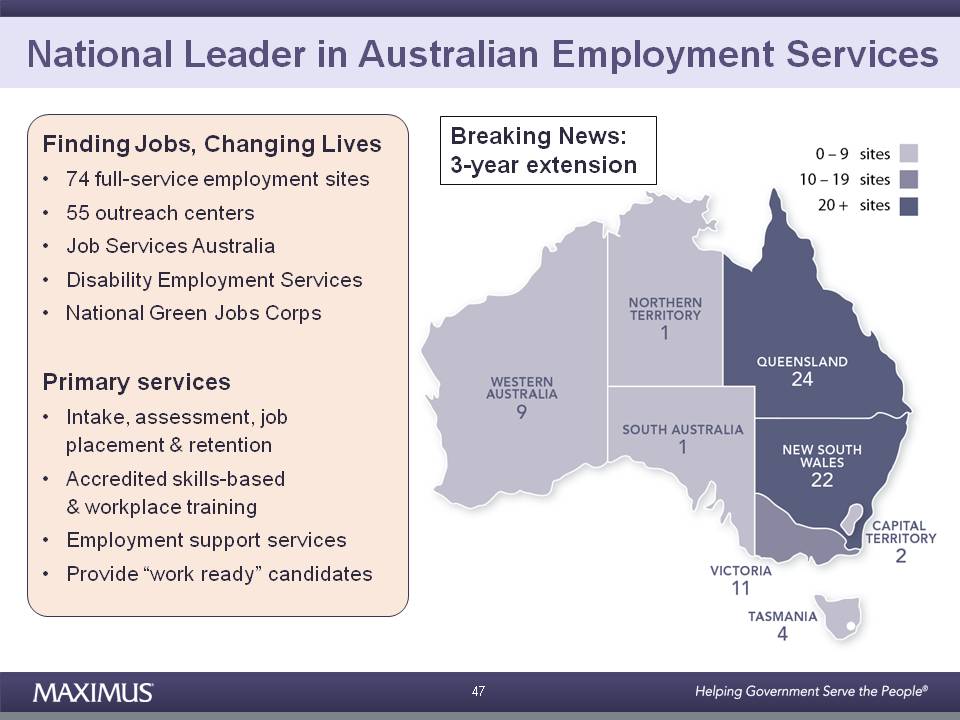
National Leader in Australian Employment Services Finding Jobs, Changing Lives • 74 full-service employment sites 55 Breaking News: 3-year extension • outreach centers • Job Services Australia • Disability Employment Services • National Green Jobs Corps Primary services • Intake, assessment, job placement & retention • Accredited skills-based & training workplace • Employment support services • Provide “work ready” candidates 47
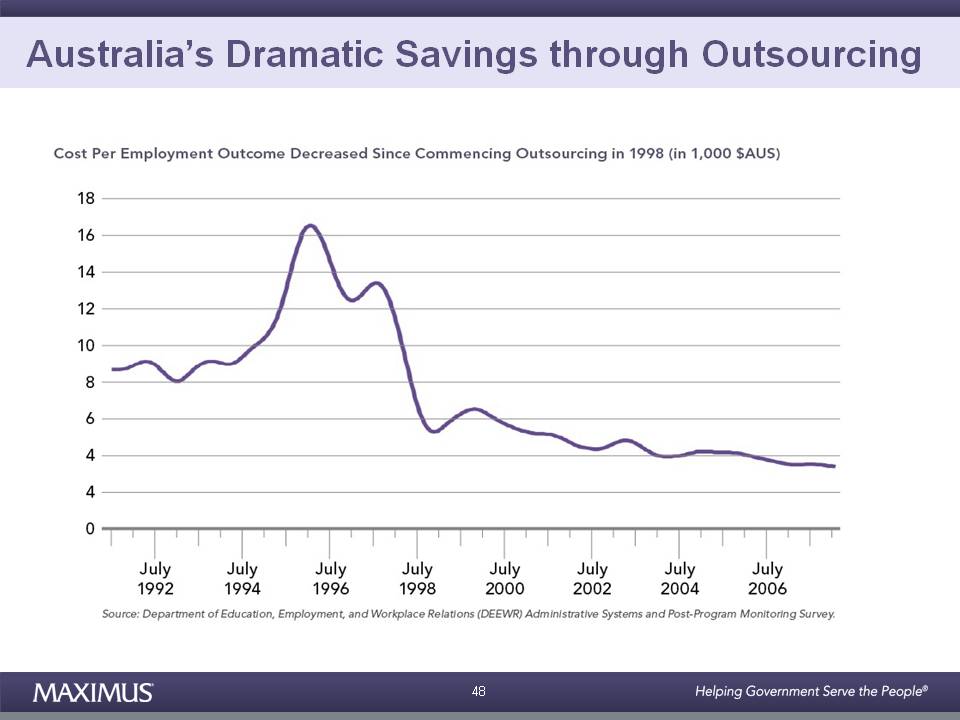
Australia’s Dramatic Savings through Outsourcing 48
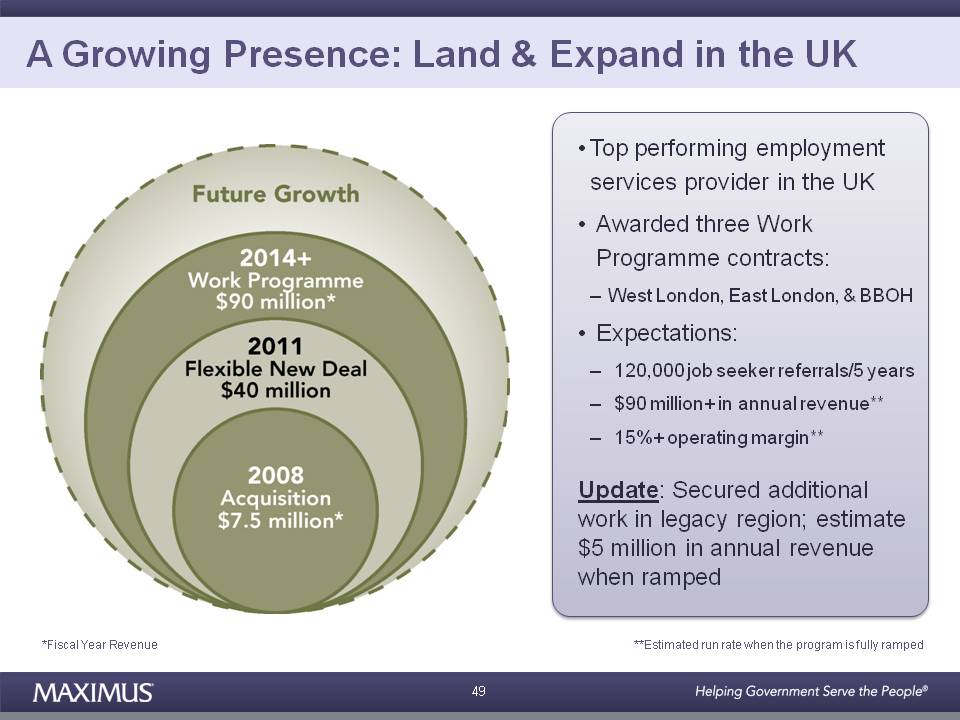
A Growing Presence: Land & Expand in the UK •Top performing employment services provider in the UK • Awarded three Work Programme contracts: – West London, East London, & BBOH • Expectations: – 120,000 job seeker referrals/5 years – $ 90 million+ in annual revenue** – 15%+ operating margin** Update: Secured additional work in legacy region; estimate $5 million in annual revenue when ramped 49 **Estimated run rate when the program is fully ramped *Fiscal Year Revenue
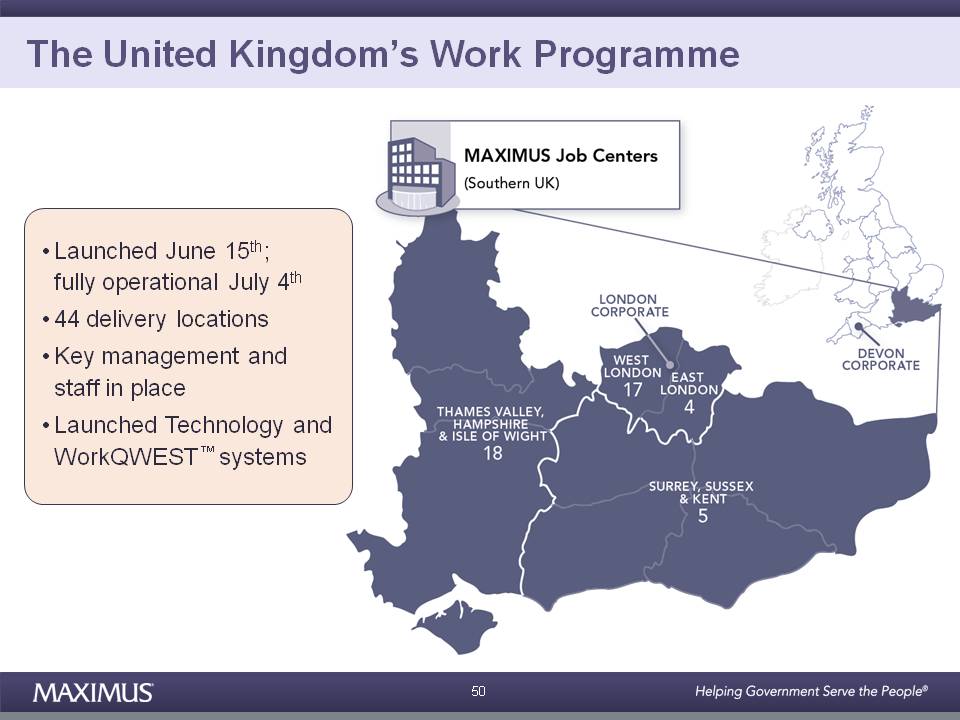
The United Kingdom’s Work Programme • Launched June 15th; fully operational July 4th • 44 delivery locations •Key management and staff in place • Launched Technology and WorkQWEST™ systems 50
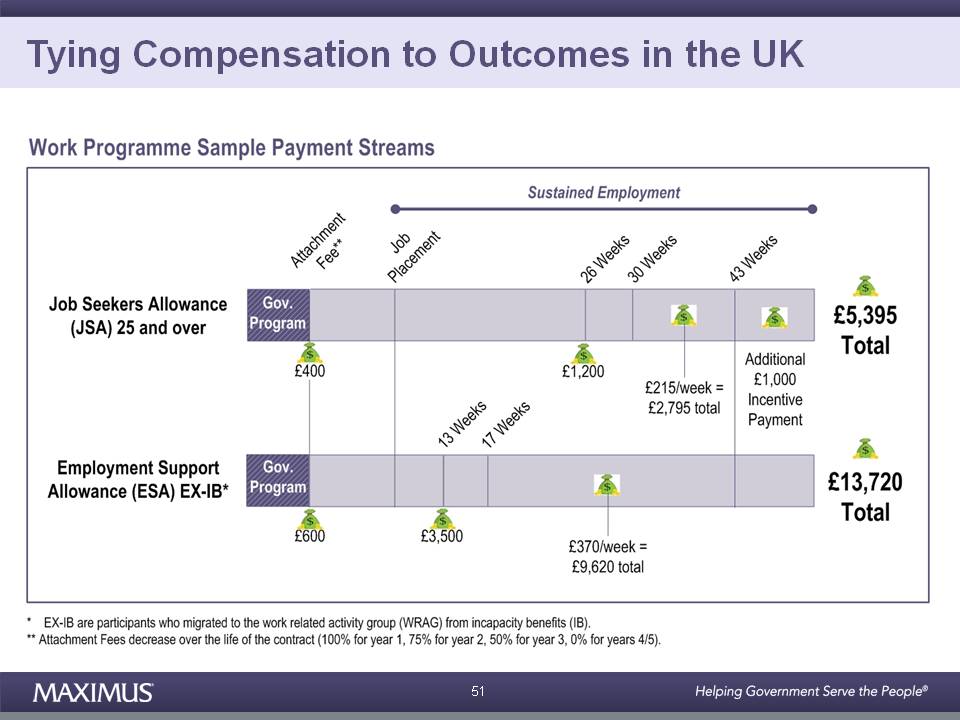
Tying Compensation to Outcomes in the UK 51
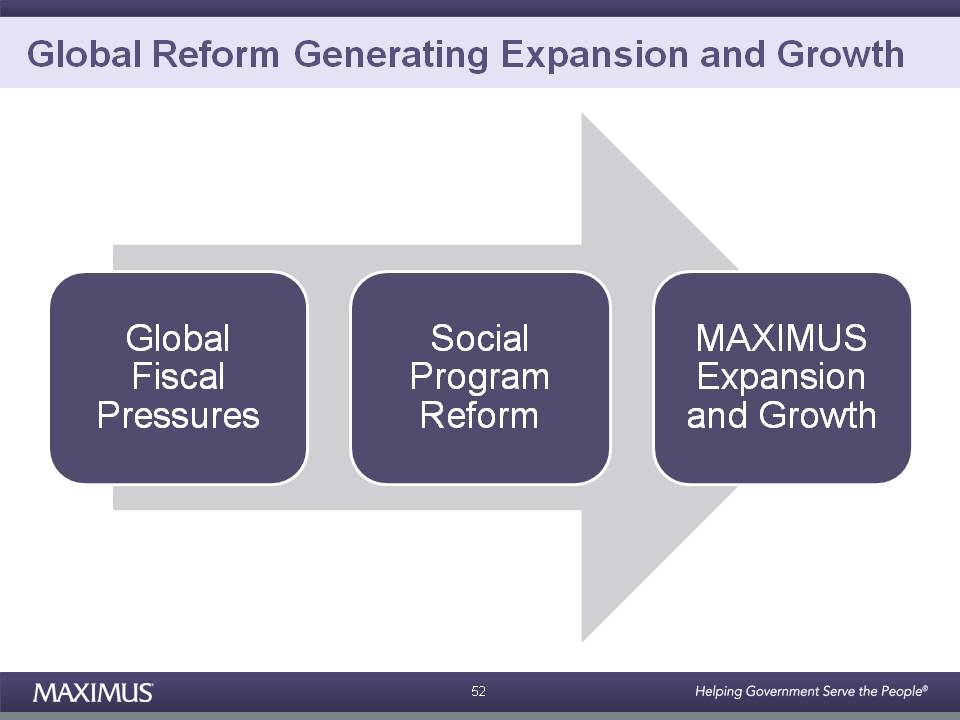
Global Reform Generating Expansion and Growth Global Fiscal Pressures Social Program Reform MAXIMUS Expansion and Growth 52
MAXIMUS Investor Day Human Services Panel Governor Jim Hodges Akbar Piloti Kathleen Kerr Michael Hobday M d t Ji H Moderator: Jim Hoge 53

MAXIMUS Investor Day Conclusion Richard A. Montoni Chief Executive Officer 54
Poised to Capitalize on Growth Opportunities Established global leader Capitalizing On Growing Positioned for significant growth across both SegmentsDemand Strong financial dynamics Great management team 55

Questions? 56