Attached files
UNITED STATES
SECURITIES AND EXCHANGE COMMISSION
Washington, D.C. 20549
FORM 10-K
(Mark One)
x Annual Report Pursuant to Section 13 or 15(d) of the Securities Exchange Act of 1934
For the fiscal year ended September 30, 2010; OR
o Transition Report Pursuant to Section 13 or 15(d) of the Securities Exchange Act of 1934
For the transition period from ______ to _______
Commission file Number: 000-51208
| BROOKLYN FEDERAL BANCORP, INC. | ||
| (Exact name of registrant as specified in its charter) | ||
| Federal | 20-2659598 | |||||
| (State or other jurisdiction of incorporation or organization) | (I.R.S. Employer Identification No.) | |||||
| 81 Court Street, Brooklyn, New York | 11201 | |||
| (Address of principal executive offices) | (Zip Code) | |||
| (718) 855-8500 | ||
| (Registrant’s telephone number, including area code) | ||
| Common Stock, $.01 par value | ||
| (Securities registered pursuant to Section 12(b) of the Act) | ||
| None | ||
| (Securities registered pursuant to Section 12(g) of the Act) | ||
Indicate by check mark if the registrant is a well-known seasoned issuer, as defined in Rule 405 of the Securities Act.
Yes o No x
Indicate by check mark if the registrant is not required to file reports pursuant to Section 13 or Section 15(d) of the Act. Yes o No x
Indicate by check mark whether the registrant (1) has filed all reports required to be filed by Section 13 or 15(d) of the Securities Exchange Act of 1934 during the preceding 12 months (or for such shorter period that the registrant was required to file such reports), and (2) has been subject to such filing requirements for the past 90 days. Yes o No x
Indicate by check mark whether the registrant has submitted electronically and posted on its corporate Web site, if any, every Interactive Data File required to be submitted and posted pursuant to Rule 405 of Regulation S-T (§232.405 of this chapter) during the preceding 12 months (or for such shorter period that the registrant was required to submit and post such files). Yes o No o.
Indicate by check mark if disclosure of delinquent filers pursuant to Item 405 of Regulation S-K is not contained herein, and will not be contained, to the best of the registrant’s knowledge, in definitive proxy or information statements incorporated by reference in Part III of this Form 10-K of any amendment to this Form 10-K. x
Indicate by check mark whether the registrant is a large accelerated filer, an accelerated filer, a non-accelerated filer or a smaller reporting company. See the definitions of “large accelerated filer,” “accelerated filer” and “smaller reporting company” in Rule 12b-2 of the Exchange Act.
| Large accelerated filer o | Accelerated filer o |
| Non-accelerated filer o (Do not check if a smaller reporting company) | Smaller reporting company x |
Indicate by check mark whether the registrant is a shell company. Yes o No x
The aggregate market value of the voting and non-voting common equity held by non-affiliates of the registrant, computed by reference to the price at which the common equity was last sold on the NASDAQ Stock Market as of the last business day of the registrant’s 2010 second fiscal quarter was $30,508,111.
The number of shares outstanding of the registrant’s common stock was 12,882,607 as of June 15, 2011 (including 9,257,500 shares owned by BFS Bancorp, MHC, a federal mutual holding company).
DOCUMENTS INCORPORATED BY REFERENCE
|
None.
|
|
BROOKLYN FEDERAL BANCORP, INC.
|
|
2010 FORM 10-K
|
|
TABLE OF CONTENTS
|
|
|
Page
Number |
||
|
PART I
|
|||
|
Item 1.
|
Business
|
1
|
|
|
Item 1A.
|
Risk Factors
|
36
|
|
|
Item 1B.
|
Unresolved Staff Comments
|
43
|
|
|
Item 2.
|
Properties
|
44
|
|
|
Item 3.
|
Legal Proceedings
|
44
|
|
|
Item 4.
|
[Removed and Reserved]
|
44
|
|
|
PART II
|
|||
|
Item 5.
|
Market for Registrant’s Common Equity, Related Stockholder Matters and Issuer Purchases of Equity Securities
|
45
|
|
|
Item 6.
|
Selected Financial Data
|
48
|
|
|
Item 7.
|
Management’s Discussion and Analysis of Financial Condition and Results of Operation
|
50
|
|
|
Item 7A.
|
Quantitative and Qualitative Disclosures about Market Risk
|
58
|
|
|
Item 8.
|
Financial Statements and Supplementary Data
|
60
|
|
|
Item 9.
|
Changes in and Disagreements With Accountants on Accounting and Financial Disclosure
|
103
|
|
|
Item 9A.
|
Controls and Procedures
|
104
|
|
|
Item 9B.
|
Other Information
|
105
|
|
|
PART III
|
|||
|
Item 10.
|
Directors, Executive Officers and Corporate Governance
|
106
|
|
|
Item 11.
|
Executive Compensation
|
109
|
|
|
Item 12.
|
Security Ownership of Certain Beneficial Owners and Management and Related Stockholder Matters
|
118
|
|
|
Item 13.
|
Certain Relationships and Related Transactions, and Director Independence
|
120
|
|
|
Item 14.
|
Principal Accounting Fees and Services
|
121
|
|
|
PART IV
|
|||
|
Item 15.
|
Exhibits, Financial Statement Schedules
|
121
|
|
|
SIGNATURES
|
124
|
||
Warning About Forward-Looking Statements
Certain statements contained herein are not based on historical facts and are “forward-looking statements” within the meaning of Section 27A of the Securities Act of 1933 and Section 21E of the Securities Exchange Act of 1934. Such forward-looking statements may be identified by reference to a future period or periods, or by the use of forward-looking terminology, such as “may,” “could,” “will,” “believe,” “expect,” “intend,” “should,” “potential,” “will likely result,” “are expected to,” “projected,” “estimate,” “anticipate,” “continue,” or similar terms or variations on those terms, or the negative of those terms. Forward-looking statements are subject to numerous risks and uncertainties, including, but not limited to, those related to the economic environment, particularly in the market areas in which the Company operates and which affect the creditworthiness of borrowers; competitive products and pricing; the timing and occurrence or non-occurrence of events that may be subject to circumstances beyond our control; the difficulty or expense of implementing successfully our new business strategy; fiscal and monetary policies of the U.S. Government; the ability of customers to repay their obligations; the adequacy of the allowance for loan losses (and position of banking regulators with respect to the adequacy of loan losses); changes in deposit flows; changes in loan delinquency rates or in our levels of non-performing assets; changes in real estate values; changes in accounting or tax principles, policies, or guidelines; changes in legislation and regulation, particularly those affecting financial institutions, including regulatory fees and capital requirements; changes in prevailing interest rates; acquisitions and the integration of acquired businesses; credit risk management; asset-liability management; the financial and securities markets and the availability of and costs associated with sources of liquidity.
The Company wishes to caution readers not to place undue reliance on any forward-looking statements, which speak only as of the date made. The Company wishes to advise readers that the factors listed above could affect the Company’s financial performance and could cause the Company’s actual results for future periods to differ materially from any opinions or statements expressed with respect to future periods in any current statements. The Company does not undertake and specifically declines any obligation to publicly release the result of any revisions which may be made to any forward-looking statements to reflect events or circumstances after the date of the original statement or to reflect the occurrence of anticipated or unanticipated events.
PART I
Item 1 Business
BFS Bancorp, MHC
BFS Bancorp, MHC is the federally chartered mutual holding company parent of Brooklyn Federal Bancorp, Inc. The only business that BFS Bancorp, MHC has engaged in is managing its majority ownership of Brooklyn Federal Bancorp, Inc. BFS Bancorp, MHC was formed upon completion of Brooklyn Federal Savings Bank’s reorganization into the mutual holding company structure. So long as BFS Bancorp, MHC exists, it will own a majority of the voting stock of Brooklyn Federal Bancorp, Inc.
Brooklyn Federal Bancorp, Inc.
Brooklyn Federal Bancorp, Inc. (the “Company”) was formed to serve as the stock holding company for Brooklyn Federal Savings Bank (the “Bank”) as part of the Bank’s reorganization into the mutual holding company structure. For further discussion of the Company’s formation and operations, see the Company’s Registration Statement on Form S-1, as amended, declared effective by the Securities and Exchange Commission (the “SEC”) on February 11, 2005 (File Number 333-121580). The Company completed its initial public offering on April 5, 2005.
The Company issued 9,257,500 shares to BFS Bancorp, MHC, resulting in a total of 13,225,000 shares issued and outstanding after completion of the reorganization. At September 30, 2010, there were 12,889,344 total shares outstanding resulting in a 71.8% ownership by BFS Bancorp, MHC.
Brooklyn Federal Savings Bank
The Bank is a federally chartered savings bank headquartered in Brooklyn, New York. The Bank was originally founded in 1887. We conduct our business from our main office and four branch offices. All of our offices are located in New York. The telephone number at our main office is (718) 855-8500.
At September 30, 2010, we had total assets of $487.8 million, total deposits of $423.4 million and stockholders’ equity of $45.7 million. Our net loss for the fiscal year ended September 30, 2010 was $38.9 million. Our principal business activity is the origination of mortgage loans secured by one- to four-family residential real estate, multi-family real estate, commercial real estate, construction loans, land loans and, to a limited extent, a variety of consumer loans and home equity loans. The Bank offers a variety of deposit accounts, including checking, savings and certificates of deposit, and it emphasizes personal and efficient service for its customers.
Our website address is www.brooklynbank.com. Information on our website should not be considered a part of this document.
Recent Developments:
Change in Accountants
On January 6, 2010, the “Company” dismissed ParenteBeard LLC (“ParenteBeard”) as the Company’s independent registered public accounting firm. For the fiscal years ended September 30, 2009 and September 30, 2008 and from October 1, 2009 through January 6, 2010, there were no disagreements with ParenteBeard on any matter of accounting principles or practices, financial statement disclosure or auditing scope or procedures, which disagreements, if not resolved to the satisfaction of ParenteBeard, would have caused it to make reference to such disagreements in its reports. In addition, there were no “reportable events” as such term is described in Item 304(a)(1)(iv) of Regulation S-K. The dismissal was approved by the Audit Committee of the Company’s Board of Directors.
1
On January 7, 2010, Grant Thorton LLP (“Grant Thorton”) was engaged as the Company’s independent registered public accounting firm. Prior to engaging Grant Thorton, the Company did not consult with Grant Thorton regarding the application of accounting principles to a specific completed or contemplated transaction or regarding the type of audit opinions that might be rendered by Grant Thorton on the Company’s financial statements, and Grant Thorton did not provide any written or oral advice that was an important factor considered by the Company in reaching a decision as to any such accounting, auditing or financial reporting issue.
On December 20, 2010, Grant Thorton LLP informed the Company of its resignation as the Company’s independent registered public accounting firm effective as of December 20, 2010. Grant Thorton was engaged by the Company after the Company filed its Annual Report on Form 10-K for the fiscal year ended September 30, 2009. Grant Thorton resigned prior to completing an audit of the Company’s financial statements for the fiscal year ended September 30, 2010, and did not issue any audit reports on the consolidated financial statements of the Company during the time it was engaged as the Company’s independent registered public accounting firm. Accordingly, there were no reports issued by Grant Thorton during the past two years that contained an adverse opinion or disclaimer of opinion, or that were qualified or modified as to uncertainty, audit scope or accounting principles. From the date Grant Thorton was engaged through December 20, 2010, the date of resignation, there were no disagreements with Grant Thorton on any matter of accounting principles or practices, financial statement disclosure or auditing scope or procedures, which disagreements, if not resolved to the satisfaction of Grant Thorton would have caused it to make reference to such disagreement in connection with its report.
During the period of Grant Thorton’s engagement there was one reportable event as described in Item 304(a)(1)(v) of Regulation S-K. As a result of its review of interim financial statements for the period ended March 31, 2010, Grant Thorton reported one material weakness in the Company’s internal control over financial reporting for its allowance for loan and lease losses.
Management also concluded that the Company’s disclosure controls and procedures were not effective as of March 31, 2010. Management’s conclusion was primarily related to the methodologies the Company used to assess the adequacy of the allowance for loan losses and concluded such methodologies relied too heavily on subjective factors, and did not adequately take into account directional trends. Management concluded that this was a material weakness in the Company’s internal control over financial reporting. Disclosure of this material weakness was included in Item 4T on the Company’s Form 10-Q for the quarterly period ended March 31, 2010.
From December 21, 2010 through February 3, 2011, the Company considered prospective independent registered public accounting firms and selected an appropriate firm for engagement with the Company. On February 4, 2011, the Company engaged Crowe Horwath LLP (“Crowe Horwath”) as the Company’s independent registered public accounting firm. Prior to engaging Crowe Horwath, the Company did not consult with Crowe Horwath regarding the application of accounting principles to a specific completed or contemplated transaction or regarding the type of audit opinions that might be rendered by Crowe Horwath on the Company’s financial statements, and Crowe Horwath did not provide any written or oral advice that was an important factor considered by the Company in reaching a decision as to any such accounting, auditing or financial reporting issue.
Entry Into Cease and Desist Orders
On September 28, 2010, the Company entered into a supervisory agreement with the Office of Thrift Supervision (the “OTS”). An itemization of the requirements of the supervisory agreement and attached Exhibits by and between the Company and OTS was disclosed in the Company’s Current Report on Form 8-K filed with the SEC on October 4, 2010.
In order to meet the requirements of the supervisory agreement, the Company’s management determined that it was in the best interest of the Company to enter into an engagement with a financial advisor to assist the Company in evaluating strategic alternatives. On February 7, 2011, following notification by OTS of its non-objection to the engagement, the Company engaged Sandler O’Neill & Partners, L.P for this purpose.
2
On March 31, 2011, the OTS terminated the supervisory agreement and both the Company and BFS Bancorp, MHC consented to the issuance of a Cease and Desist Order (the “Company Order”) from the OTS. On the same date, the Bank consented to the issuance of a separate Cease and Desist order (the “Bank Order”, together with the Company Order, the “Orders”). An itemization of the requirements of the Orders and attached Exhibits by and between BFS Bancorp, MHC, the Company, the Bank and OTS was disclosed in the Company’s Current Report on Form 8-K filed with the SEC on April 1, 2011. Among other requirements of the Orders, the Company and Bank are subject to the following requirements:
|
|
●
|
Maintain a Tier 1 Capital Ratio equal or greater than 10% and a Total Risk-Based Capital Ratio equal to or greater than 15%, after the funding of its allowance for loan and lease losses;
|
|
|
●
|
Submit for review and approval by the OTS a written capital plan to maintain the Bank’s Minimum Capital Levels;
|
|
|
●
|
Submit a contingency plan for review and approval by the OTS that, should the Bank fail to meet the Minimum Capital Levels, the Bank will merge with, or be acquired by another federally insured depository institution or voluntarily liquidate;
|
|
|
●
|
Submit for review and approval by the OTS an updated business plan to improve the Bank’s core earnings, reduce expenses, maintain appropriate levels of liquidity and achieve profitability on a consistent basis and submit quarterly reports to the OTS regarding compliance with the plan;
|
|
|
●
|
Revise its current liquidity and fund management policy to include a contingency funding plan that will identify alternative funding sources, establish appropriate lines of credit, and retain investment securities and other liquid assets at the Bank;
|
|
|
●
|
Submit for review and approval by the OTS an updated written program for identifying, monitoring and controlling risks associated with concentrations of credit and submit quarterly reports to the OTS regarding compliance with this program;
|
|
|
●
|
Submit for review and approval by the OTS a plan for enhancing its staffing resources in loan underwriting and credit administration at the Bank;
|
|
|
●
|
Submit for review and approval by the OTS an updated plan with specific strategies, targets and timeframes to reduce the Bank’s level of problem assets;
|
|
|
●
|
Refrain from making, investing in or purchasing any new commercial real estate loans, refinancing or modifying classified or special mention loans, except under certain conditions;
|
|
|
●
|
Conduct and review a management study performed by an independent consultant and submit to the OTS a written management plan that addresses all the conclusions and recommendations noted in the management study, including a specific plan to obtain at least three new independent directors for its Board and to retain a new Chief Executive Officer;
|
|
|
●
|
Refrain from increasing its total assets during any quarter in excess of an amount equal to the net interest credited on deposit liabilities, without the prior written non-objection of the OTS;
|
|
|
●
|
Comply with regulations limiting its ability to accept, renew, or roll over brokered deposits;
|
|
|
●
|
Refrain from declaring a dividend or any other capital distributions without the prior written approval of the OTS;
|
|
|
●
|
Refrain from entering into, renewing, or modifying any contractual arrangement relating to compensation or benefits for any senior executive officers or directors, without prior written notice of the transaction to the OTS;
|
|
|
●
|
Submit for review and approval by the OTS a plan to revise its compensation and remuneration of directors and senior executive officers;
|
|
|
●
|
Comply with regulatory prior notification requirements with respect to changes in directors and senior executive officers;
|
|
|
●
|
Comply with regulatory prior notification requirements before entering into any arrangement or contract with a third party service provider that is significant to the overall operation or financial condition of the Bank, or is outside the Bank’s normal course of business; and
|
|
|
●
|
Submit for review and approval by the OTS a written plan to maintain and enhance the capital of the Company, BFS Bancorp, the MHC, and the Bank, and ensure that the Bank complies with the capital requirements imposed by the Orders.
|
Notice of Potential Delisting from The NASDAQ Stock Market
On January 12, 2011, the Company received a letter from the NASDAQ Stock Market (“NASDAQ”) stating that the Company is not in compliance with NASDAQ Listing Rule 5250(c)(1) because the Company did not timely file its Annual Report on Form 10-K for the year ended September 30, 2010 and that the Company also failed to comply with NASDAQ’s minimum market value of publicly held shares of $5.0 million. As disclosed to the SEC via a Form 12b-25 on December 27, 2010, the Company’s Form 10-K for the year ended September 30, 2010 was delayed due to the resignation of the Company’s independent registered public accounting firm on December 20, 2010. The Company had until March 14, 2011 to submit a plan to regain compliance with delinquent periodic reports (which requirement it met timely) and now has until June 27, 2011 to regain compliance. The Company has until July 11, 2011 to regain compliance with the minimum market value of publicly held stock.
3
On February 15, 2011, the Company received an additional letter from the NASDAQ stating that the Company was not in compliance with NASDAQ Listing Rule 5250(c)(1) because the Company did not timely file its Quarterly Report on Form 10-Q for the quarter ended December 31, 2010. As previously mentioned, the Company’s independent registered public accounting firm resigned on December 20, 2010. This delayed the filing of both the Form 10-K for the year ended September 30, 2010, the Form 10-Q for the period ended December 31, 2010, as well as the Form 10-Q for the period ended March 31, 2011.
On March 7, 2011, the Company received a letter from the NASDAQ stating that the Company was not in compliance with the NASDAQ Listing Rules because the Company did not maintain a minimum bid price of $1.00 per share for the requisite period of time. The Company has until September 6, 2011 to regain compliance with the minimum bid requirement.
Changes in Directorships & Management
On January 21, 2010, Ralph Walther, the Vice President and Chief Financial Officer of the Company, resigned effective February 26, 2010. His decision to resign was not related to any disagreement with the Company’s financial or reporting practices or the Company or its management. On February 16, 2010, the Company appointed Michael A. Trinidad as the Company’s Chief Financial Officer. Mr. Trinidad served with the Company as its Vice President and Controller since April 2009. Mr. Trinidad has been employed in community banking since 1977.
On August 27, 2010, Robert J.A. Zito resigned as a director of the Company. Mr. Zito served as a member of the Company’s Compensation, Governance, Nominating and Auditing Committees.
On November 9, 2010, the Company appointed Joanne B. Gallo as Vice President and Chief Credit Officer with OTS approval.
On November 9, 2010, the Company also appointed Rebecca Northey to the Boards of Directors of the Company, the Bank, and BFS Bancorp, MHC with OTS approval.
On January 21, 2011, John C. Gallin resigned as a director of the Company. Mr. Gallin served as a member of the Company’s Compensation, Nominating and Auditing Committees.
On March 15, 2011, the Company accepted the resignation of Marc Leno as Executive Vice President and Chief Lending Officer.
On April 7, 2011, John A. Loconsolo resigned as a director of the Company, Bank, and BFS Bancorp, MHC. Mr. Loconsolo was a member of the Company’s Compensation Committee.
On May 9, 2011, the Company appointed Mark Hughes to the Boards of Directors of the Company, Bank, and BFS Bancorp, MHC with OTS approval.
Effective May 23, 2011, Richard A. Kielty resigned as President and Chief Executive Officer of the Company, Bank and BFS Bancorp, MHC and Gregg J. Wagner was appointed as his replacement with OTS approval.
On June 6, 2011, the Company appointed Gregg J. Wagner to the Board of Directors of the Company, Bank and BFS Bancorp, MHC with OTS approval.
4
Management’s Plan
The consolidated financial statements have been prepared assuming the Company will continue as a going concern. The Company reported a net loss of $38.9 million in 2010. This was largely due to a significant increase in the provision for loan losses from $8.5 million in 2009 to $42.7 million in 2010, as well as an $11.6 million net loss on other-than-temporary impairment recognized in earnings in 2010 compared to $2.9 million in 2009.
The Company and the Bank are subject to enforcement actions and other requirements imposed by federal banking regulators. In particular, and as noted above, the Bank is subject to a Cease and Desist Order (the “Bank Order”) issued by the OTS on March 31, 2011 that requires, among other things, the Bank to implement an updated business plan to improve the Bank’s core earnings, reduce expenses, maintain an appropriate level of liquidity and achieve profitability. The Bank Order also requires that the Bank achieve and maintain a Tier 1 Capital Ratio equal to or greater than 10% and a Total Risk-Based Capital Ratio equal to or greater than 15%, after the funding of its allowance for loan and lease losses, by April 30, 2011. As of April 30, 2011, the Bank did not meet these capital requirements.
As the Bank failed to achieve the capital ratios required by the Bank Order, the Bank was required to file a Contingency Plan with the OTS within 15 days of April 30, 2011. The Bank Order required that the Contingency Plan detail actions to be taken and specific time frames to achieve either a merger with, or acquisition by, another federally insured depository institution or holding company thereof, or a voluntary dissolution by the later of the date of all required regulatory approvals or sixty (60) days after implementation of the Contingency Plan. The Bank filed the Contingency Plan with the OTS on May 12, 2011 and by letter dated June 15, 2011 the OTS directed the Bank to immediately implement and adhere to such Contingency Plan. The Bank intends to comply with the Contingency Plan and the directive. Moreover, as the holding companies of the Bank, the Company and BFS Bancorp, MHC also are subject to a separate but related Cease and Desist Order issued by the OTS on the same date as the Bank’s Order, which requires, among other terms, that the Company and BFS Bancorp, MHC ensure the Bank’s compliance with the terms of the Bank Order. The Company and BFS Bancorp, MHC intend to comply with their respective orders to ensure the Bank’s compliance with the terms of the Bank Order, including the implementation of the Contingency Plan.
The Bank experienced a significant increase in 2010 in non-accrual loans to $71.9 million at September 30, 2010, or 18.5% of total loans, from $22.1 million at September 30, 2009, or 5.1% of total loans. The Bank has agreed to not originate any commercial real estate, construction or multi-family loans without prior OTS approval. This restricts the Bank’s efforts to increase core earnings.
From 2010 through 2011, the Company and Bank recruited new senior executive leadership to consider and pursue strategies in the Contingency Plan and focus towards continuing as a going concern. Imposition of additional enforcement actions could damage our reputation and have a material adverse effect on our business.
However, in light of the OTS directive in the letter dated June 15, 2011, our primary focus to address the Bank’s challenges is to successfully implement the Contingency Plan.
There can be no assurance that the actions referred to above will successfully resolve all of the concerns of the federal banking regulatory authorities. The consolidated financial statements do not include any adjustments that might result from the outcome of these uncertainties.
5
Competition
We face intense competition within our market area both in making loans and attracting deposits. The New York City metropolitan area has a high concentration of financial institutions including large money center and regional banks, community banks and credit unions. Some of our competitors offer products and services that we currently do not offer, such as trust services and private banking. As of June 30, 2010, our market share of deposits represented 0.56%, 0.26% and 0.28% of deposits in each of Kings, Nassau and Suffolk Counties, New York, respectively.
Our competition for loans and deposits comes principally from commercial banks, savings institutions, mortgage banking firms and credit unions. We face additional competition for deposits from short-term money market funds, brokerage firms, mutual funds and insurance companies. Our primary focus is to develop and build profitable customer relationships across all lines of business while maintaining our role as a community bank.
Market Area
We are part of the diverse economy of the New York City metropolitan area. Brooklyn (Kings County) is an urban market area while Nassau and Suffolk Counties are suburban. Our market area has a stable population and household base. In 2009, the median household income for Kings, Nassau, and Suffolk Counties was $43,166, $92,776 and $83,620, respectively. Our primary lending area is concentrated in Brooklyn and Nassau and Suffolk Counties, New York, although we originate loans in all five boroughs of New York City as well as Westchester County, New York. One- to four-family residential real estate in our market area is characterized by a large number of attached and semi-detached houses, including a number of two- and three-family homes and cooperative apartments. Most of our deposit customers are residents of the greater New York metropolitan area. Our customer base consists primarily of middle-income households, and to a lesser extent, low- to moderate-income households. The median household income for Brooklyn is below the national and New York state median household incomes. In addition, the unemployment rate in Kings County is higher than in the surrounding suburbs.
Lending Activities
Commercial real estate loans totaled $119.7 million, or 30.8% of our total loans receivable at September 30, 2010. One- to four-family residential real estate mortgage loans represented $73.5 million, or 18.9%, of our loans receivable at September 30, 2010. Multi-family real estate loans totaled $65.3 million, or 16.8% of the total loans receivable at September 30, 2010. Construction loans totaled $95.7 million, or 24.6% and land loans totaled $34.1 million, or 8.8% of the total loans receivable at September 30, 2010. We originate consumer loans on a limited basis. We sell most of our longer-term residential loans to the Federal Home Loan Bank of New York and other investors, on a servicing-retained basis. We syndicate and sell participation interests in portions of our multi-family, commercial real estate and construction loans because of our legal lending limits and our internal portfolio management guidelines. The Bank agreed with the OTS that the Bank will not originate any commercial real estate, construction or multi-family loans without prior OTS approval.
6
Loans Receivable Portfolio Composition. The following table sets forth the composition of our loan portfolio, excluding loans held-for-sale (which were zero in 2010 and 2009), by type of loan at the dates indicated.
|
At September 30,
|
||||||||||||||||||||||||||||||||||||||||
|
2010
|
2009
|
2008
|
2007
|
2006
|
||||||||||||||||||||||||||||||||||||
|
Amount
|
Percent
|
Amount
|
Percent
|
Amount
|
Percent
|
Amount
|
Percent
|
Amount
|
Percent
|
|||||||||||||||||||||||||||||||
|
(Dollars in thousands)
|
||||||||||||||||||||||||||||||||||||||||
|
Mortgage loans:
|
||||||||||||||||||||||||||||||||||||||||
|
One-to four-family
|
$ | 73,457 | 18.90 | % | $ | 77,064 | 17.85 | % | $ | 82,144 | 33.99 | % | $ | 74,103 | 32.57 | % | $ | 56,722 | 28.88 | % | ||||||||||||||||||||
|
Multi-family
|
65,300 | 16.80 | % | 92,399 | 21.40 | % | 32,243 | 13.34 | % | 42,192 | 18.54 | % | 46,255 | 23.55 | % | |||||||||||||||||||||||||
|
Commercial real estate
|
119,728 | 30.80 | % | 143,239 | 33.18 | % | 103,336 | 42.76 | % | 96,534 | 42.43 | % | 71,805 | 36.56 | % | |||||||||||||||||||||||||
|
Construction
|
95,732 | 24.63 | % | 73,314 | 16.98 | % | 13,761 | 5.69 | % | 11,926 | 5.24 | % | 18,169 | 9.25 | % | |||||||||||||||||||||||||
|
Land
|
34,084 | 8.77 | % | 45,027 | 10.43 | % | 9,288 | 3.84 | % | 1,793 | 0.79 | % | 2,924 | 1.49 | % | |||||||||||||||||||||||||
|
Consumer and other
|
449 | 0.12 | % | 684 | 0.16 | % | 909 | 0.38 | % | 970 | 0.43 | % | 551 | 0.28 | % | |||||||||||||||||||||||||
|
Total loans receivable
|
388,750 | 100.00 | % | 431,727 | 100.00 | % | 241,681 | 100.00 | % | 227,518 | 100.00 | % | 196,426 | 100.00 | % | |||||||||||||||||||||||||
|
Other items:
|
||||||||||||||||||||||||||||||||||||||||
|
Unearned discounts
|
- | (87 | ) | - | - | - | ||||||||||||||||||||||||||||||||||
|
Net deferred loan fees
|
(967 | ) | (1,205 | ) | (327 | ) | (245 | ) | (314 | ) | ||||||||||||||||||||||||||||||
|
Allowance for loan losses
|
(17,941 | ) | (10,750 | ) | (2,205 | ) | (1,806 | ) | (1,757 | ) | ||||||||||||||||||||||||||||||
|
Total loans receivable, net
|
$ | 369,842 | $ | 419,685 | $ | 239,149 | $ | 225,467 | $ | 194,355 | ||||||||||||||||||||||||||||||
Due to the impact of the recent economic downturn and increased tightening in the credit markets affecting the Company’s ability to sell the loans in the held-for-sale portfolio during fiscal year 2009, the Company transferred all of the loans held-for-sale amounting to $200.5 million to the loans receivable portfolio. These loan transfers occurred throughout the fiscal year ended September 30, 2009 and are reflected in the loans receivable portfolio balances as of September 30, 2009. As of September 30, 2010 and 2009, the Company held no loans in the loans held-for-sale portfolio.
Loan Portfolio Maturities. The following table summarizes the scheduled repayments of our loan portfolio at September 30, 2010. Demand loans, loans having no stated repayment schedule or maturity, and overdraft loans are reported as being due in one year or less.
|
One-to
|
Commercial
|
Consumer
|
||||||||||||||||||||||||||
|
Four-Family
|
Multi-Family
|
Real Estate
|
Construction
|
Land
|
and Other
|
Total
|
||||||||||||||||||||||
|
(In thousands)
|
||||||||||||||||||||||||||||
|
Due During the Years
|
||||||||||||||||||||||||||||
|
Ending September 30,
|
||||||||||||||||||||||||||||
|
2011
|
$ | 5,592 | $ | 42,901 | $ | 60,665 | $ | 95,732 | $ | 32,851 | $ | 289 | $ | 238,030 | ||||||||||||||
|
2012
|
4,506 | 1,724 | 16,921 | - | 21 | 114 | 23,286 | |||||||||||||||||||||
|
2013
|
4,382 | 1,970 | 24,202 | - | 23 | 40 | 30,617 | |||||||||||||||||||||
|
2014 to 2015
|
8,544 | 13,360 | 13,649 | - | 1,189 | 6 | 36,748 | |||||||||||||||||||||
|
2016 to 2020
|
16,132 | 5,345 | 4,137 | - | - | - | 25,614 | |||||||||||||||||||||
|
2021 to 2025
|
10,717 | - | 154 | - | - | - | 10,871 | |||||||||||||||||||||
|
2026 and beyond
|
23,584 | - | - | - | - | - | 23,584 | |||||||||||||||||||||
|
Total
|
$ | 73,457 | $ | 65,300 | $ | 119,728 | $ | 95,732 | $ | 34,084 | $ | 449 | $ | 388,750 | ||||||||||||||
7
The following table sets forth the scheduled repayments of fixed- and adjustable-rate loans at September 30, 2010 that are contractually due after September 30, 2011.
|
Due After September 30, 2011
|
|||||||||||||
|
Fixed
|
Adjustable
|
Total
|
|||||||||||
|
(In thousands)
|
|||||||||||||
|
One-to four-family
|
$ | 49,081 | $ | 18,784 | 67,865 | ||||||||
|
Multi-family
|
18,362 | 4,037 | 22,399 | ||||||||||
|
Commercial real estate
|
46,844 | 12,219 | 59,063 | ||||||||||
|
Construction
|
- | - | - | ||||||||||
|
Land
|
1,233 | - | 1,233 | ||||||||||
|
Consumer and other
|
160 | - | 160 | ||||||||||
|
Total loans
|
$ | 115,680 | $ | 35,040 | $ | 150,720 | |||||||
Loan Originations, Sales and Repayments. Historically, we have originated one- to four-family mortgage loans pursuant to underwriting standards that generally conform to government-sponsored agency guidelines. Loan origination activities are primarily concentrated in New York, Kings, Nassau and Suffolk Counties, New York. New loans are generated primarily from walk-in customers, customer referrals, a network of mortgage brokers, and other parties with whom we do business, and from the efforts of employees and advertising. Loan applications are underwritten and processed at our main office in Brooklyn, New York. We syndicate and sell participation interests in portions of our multi-family, commercial real estate and construction loans because of our legal lending limits and our internal portfolio management guidelines. We generally sell longer-term, fixed rate mortgage loans and generally retain in our portfolio the majority of our adjustable rate and shorter-term, fixed rate mortgage loans.
8
The following table shows loan originations (including loans held-for-sale), sales and principal repayments for the years indicated.
|
Years Ended September 30,
|
|||||||||||||
|
2010
|
2009
|
2008
|
|||||||||||
|
(In thousands)
|
|||||||||||||
|
Total loans at beginning of period
|
$ | 431,727 | $ | 376,719 | $ | 286,869 | |||||||
|
Loans originated:
|
|||||||||||||
|
One- to four-family
|
26,806 | 21,255 | 26,071 | ||||||||||
|
Multi-family
|
6,729 | 24,966 | 56,421 | ||||||||||
|
Commercial real estate
|
2,808 | 13,443 | 70,930 | ||||||||||
|
Construction
|
59,052 | 62,392 | 35,583 | ||||||||||
|
Land
|
8,994 | 9,745 | 10,892 | ||||||||||
|
Consumer and other
|
171 | 340 | 574 | ||||||||||
|
Total loans originated
|
104,560 | 132,141 | 200,471 | ||||||||||
|
Loans purchased
|
1,500 | - | 5,848 | ||||||||||
|
Deduct:
|
|||||||||||||
|
Principal repayments
|
(97,659 | ) | (61,696 | ) | (82,623 | ) | |||||||
|
Charge-offs
|
(35,522 | ) | - | - | |||||||||
|
Sales of whole loans
|
(7,215 | ) | (8,476 | ) | (4,430 | ) | |||||||
|
Sales of participation interests
|
(8,641 | ) | (6,961 | ) | (29,416 | ) | |||||||
|
Net loan activity
|
(42,977 | ) | 55,008 | 89,850 | |||||||||
|
Total loans at end of period
|
$ | 388,750 | $ | 431,727 | $ | 376,719 | |||||||
In loan participation transactions, we originate and fund the full loan amount and subsequently identify other lending institutions that purchase participation interests in the loan. For purposes of the table above, originations of these loans are included within our total origination activity and the subsequent sales are shown as deductions. Participations differ from loan syndication transactions that are not transfers of financial assets for financial reporting purposes. As the manager of a loan syndication, prior to closing the loan, we identify other lenders who agree to fund portions of the total loan at closing. We record our share of the loan syndication as a loans receivable and therefore have included in the table above only those amounts within total loan originations. The amounts funded by other syndication lenders, which are not reflected as loan originations and sales in our consolidated financial statements and therefore are excluded from the table, totaled $41.4 million, $59.4 million and $129.7 million for syndications completed during the years ended September 30, 2010, 2009 and 2008, respectively.
One- to Four-Family Residential Loans. At September 30, 2010, approximately $73.5 million, or 18.9% of our loans receivable consisted of one- to four-family residential loans. Our originations of one- to four-family loans increased by $5.6 million compared to 2009. Generally, one- to four-family residential mortgage loans are originated in amounts up to 95% of the lesser of the appraised value or purchase price of the property. Private mortgage insurance is required on loans with a loan-to-value ratio in excess of 80%. At the Bank’s discretion, we originate and sell some of the one-to-four family residential mortgage loans into the secondary market. Fixed-rate loans are originated for terms of 10, 15, 20, 25 and 30 years. At September 30, 2010, our largest loan secured by one- to four-family real estate had a principal balance of approximately $2.6 million and our second largest loan secured by one- to four-family real estate had a principal balance of approximately $1.4 million. The loans were secured by a two-family and a one-family residence, respectively.
We also offer adjustable rate mortgage loans with one, three and five-year adjustment periods based on changes in a designated U.S. Treasury index. We originated $5.6 million of adjustable rate one- to four-family residential loans during the year ended September 30, 2010 and $9.3 million during the year ended September 30, 2009. Our adjustable rate mortgage loans provide for maximum rate adjustments of 200 basis points per adjustment, with a lifetime maximum adjustment of 600 basis points. We currently do not offer adjustable rate mortgage loans with interest rates that adjust below the initial interest rate or adjustable rate mortgage loans with terms that provide the borrower options with regard to the amount or timing of periodic payments. Our adjustable rate mortgage loans amortize over terms of up to 30 years.
9
Adjustable rate mortgage loans decrease the risk associated with changes in market interest rates by periodically re-pricing, but involve other risks because, as interest rates increase, the interest payments on the loan increase, thus increasing the potential for default by the borrower. At the same time, the marketability of the underlying collateral may be adversely affected by higher interest rates. Upward adjustment of the contractual interest rate is also limited by the maximum periodic and lifetime interest rate adjustments permitted by our loan documents, and therefore, is potentially limited in effectiveness during periods of extended or rapidly rising interest rates. At September 30, 2010, $18.9 million, or 25.8%, of our one- to four-family residential loans had adjustable rates of interest.
All one- to four-family residential mortgage loans that we originate include “due-on-sale” clauses, which give us the right to declare a loan immediately due and payable in the event that, among other things, the borrower sells or otherwise disposes of the real property subject to the mortgage and the loan is not repaid.
Investor guidelines limit the amount that a savings association may lend relative to the appraised value of the real estate securing the loan, as determined by an appraisal of the property at the time the loan is originated. For all loans, we utilize outside independent appraisers approved by our board of directors. All borrowers are required to obtain title insurance, except for equity loans with balances under $50,000. We also require fire and casualty insurance and, where circumstances warrant, flood insurance.
Multi-Family Real Estate Loans. Loans secured by multi-family real estate totaled approximately $65.3 million, or 16.8% of the total loans receivable at September 30, 2010. Multi-family real estate loans generally are secured by rental properties (including multi-family apartment buildings). Substantially all multi-family real estate loans are secured by properties located within our lending area. At September 30, 2010, we had 47 multi-family real estate loans with an average principal balance of $1.5 million. At September 30, 2010, our largest multi-family real estate loan balance was $8.7 million. Multi-family real estate loans generally are offered with fixed interest rates. Multi-family real estate loans also generally are originated for terms ranging from one year to 15 years with the majority of these loans being originated for shorter terms within this range.
We consider a number of factors in originating multi-family real estate loans. We evaluate the qualifications and financial condition of the borrower (including credit history), profitability and expertise, as well as the value and condition of the mortgaged property securing the loan. When evaluating the qualifications of a borrower, we consider the financial resources of the borrower, the borrower’s experience in owning or managing similar property and the borrower’s payment history with us and other financial institutions. In evaluating the property securing the loan, the factors we consider include the net operating income of the mortgaged property before debt service and depreciation, the ratio of the loan amount to the appraised value of the mortgaged property and the debt service coverage ratio (the ratio of net operating income to debt service) to ensure that it is at least 120% of the monthly debt service. Multi-family real estate loans are originated in amounts up to 75% of the appraised value of the mortgaged property securing the loan. All multi-family loans are appraised by outside independent appraisers approved by our board of directors.
Loans secured by multi-family real estate generally involve a greater degree of credit risk than one- to four-family residential mortgage loans and carry larger loan balances. This increased credit risk is a result of several factors, including the concentration of principal in a limited number of loans and borrowers, the effects of general economic conditions on income producing properties, and the increased difficulty of evaluating and monitoring these types of loans. Furthermore, the repayment of loans secured by multi-family real estate typically depends upon the successful operation of the real estate property securing the loan. If the cash flow from the project is reduced, the borrower’s ability to repay the loan may be impaired. All borrowers are required to obtain title insurance. We also require fire and casualty insurance and, where circumstances warrant, flood insurance.
Commercial Real Estate Loans. At September 30, 2010, $119.7 million, or 30.8% of our total loans receivable, consisted of commercial real estate loans. Commercial real estate loans are secured by office buildings, mixed-use properties and other commercial properties. We generally originate fixed-rate commercial real estate loans with an initial term ranging from one to five years and a re-pricing option, and a maximum term of up to 20 years. The majority of commercial real estate loans originated have shorter terms within this range. The maximum loan-to-value ratio at origination of our commercial real estate loans is 75%. At September 30, 2010, we had 88 commercial real estate loans with an average outstanding balance of $1.4 million. At September 30, 2010, our largest commercial real estate loan balance was $6.2 million.
10
We consider a number of factors in originating commercial real estate loans. We evaluate the qualifications and financial condition of the borrower, including credit history, profitability and expertise, as well as the value and condition of the mortgaged property securing the loan. When evaluating the qualifications of the borrower, we consider the financial resources of the borrower, the borrower’s experience in owning or managing similar property and the borrower’s payment history with us and other financial institutions. In evaluating the property securing the loan, the factors we consider include the net operating income of the mortgaged property before debt service and depreciation, the ratio of the loan amount to the appraised value of the mortgaged property and the debt service coverage ratio (the ratio of net operating income to debt service) to ensure that it is at least 120% of the monthly debt service. All commercial real estate loans are appraised by outside independent appraisers approved by our board of directors. Personal guarantees are obtained from commercial real estate borrowers although we will consider waiving this requirement based upon the loan-to-value ratio of the proposed loan. All borrowers are required to obtain title insurance. We also require fire and casualty insurance and, where circumstances warrant, flood insurance.
Loans secured by commercial real estate generally are larger than one- to four-family residential loans and involve greater credit risk. Commercial real estate loans often involve large loan balances to single borrowers or groups of related borrowers. Repayment of these loans depends to a large degree on the results of operations and management of the properties securing the loans or the businesses conducted on this property, and may be affected to a greater extent by adverse conditions in the real estate market or the economy in general. Accordingly, the nature of these loans makes them more difficult for management to monitor and evaluate.
Construction Loans. At September 30, 2010, $95.7 million, or 24.6%, of our total loans receivable consisted of construction loans. Most of our construction loans are for the construction of multi-family and mixed-use properties. The majority of our construction loans are referred by mortgage brokers who make the initial contact with the potential borrower and forward to us additional loan information that we review to determine whether the applicant satisfies our underwriting criteria. If the loan information meets our criteria, we issue a letter of intent listing the terms and conditions of any potential loan. If the potential borrower agrees to these terms and conditions, we will continue our standard underwriting practice. We offer primarily adjustable rate residential construction loans. Construction loans are generally structured with an option for permanent mortgage financing once the construction is completed. Construction loans generally have a two-year term and are generally repaid from the sale of units or refinancing upon completion. These loans generally have interest rates that adjust daily with prime and generally will not have an interest rate that adjusts below the initial interest rate. Construction loans require only the payment of interest during the construction period. Construction loans will generally be made in amounts of up to 75% of the appraised value of the completed property, or the actual cost of the improvements. Funds are disbursed based on our inspections in accordance with a schedule reflecting the completion of portions of the project. At September 30, 2010, our largest construction loan balance was $7.4 million.
Construction loans generally involve a greater degree of credit risk than one- to four-family residential mortgage loans. The risk of loss on a construction loan depends upon the accuracy of the initial estimate of the value of the property at completion of construction compared to the estimated cost of construction as well as the ability to complete construction on a timely basis, and the ability to sell or refinance the property. For all loans, we utilize outside independent appraisers approved by our board of directors. All borrowers are required to obtain title insurance. We also require fire and casualty insurance and, where circumstances warrant, flood insurance.
Land Loans. In 2005, we began to originate land loans based on our increased construction loan activity. At September 30, 2010, $34.1 million, or 8.8% of our total loans receivable consisted of land loans. Our land loans are made generally in conjunction with anticipated construction loan financing. The highest combined exposure is $11.6 million. In most cases the value of the land represents the borrower’s up-front equity in our construction loans. When the land value exceeds the borrower’s equity requirement, which is usually 25% of total project costs, including land, we will consider originating this type of land loan. The majority of our land loans are referred by mortgage brokers who make the initial contact with the potential borrower and forward to us additional loan information that we review to determine whether the applicant satisfies our underwriting criteria. If the loan information meets our criteria, we issue a letter of intent listing the terms and conditions of any potential loan. If the potential borrower agrees to these terms and conditions, we will continue our standard underwriting practice. We currently offer primarily adjustable rate residential land loans. At September 30, 2010, our largest land loan balance was $3.7 million, and the average land loan balance was $1.4 million. Land loans are generally repaid at the end of a two-year period. These loans generally have interest rates that adjust daily in conjunction with the prime rate and generally will not have an interest rate that adjusts below the initial interest rate. Land loans will generally be made in amounts of up to 75% of the appraised value.
11
Land loans generally involve a greater degree of credit risk than one- to four-family residential mortgage loans. The risk of loss on a land loan depends upon the accuracy of the initial estimate of the value of the property as well as being able to complete development on a timely basis. For all loans, we utilize outside independent appraisers approved by our board of directors. All borrowers are required to obtain title insurance. We also require fire and casualty insurance and, where circumstances warrant, flood insurance.
Other Loans. We offer loans that are either unsecured or secured by property other than real estate. These loans include loans secured by deposits and personal loans. At September 30, 2010, these other loans totaled $449,000 or 0.1% of the loans receivable portfolio.
Loan Approval Procedures and Authority. The loan approval process is intended to assess the borrower’s ability to repay the loan, the viability of the loan, and the adequacy of the value of the property that will secure the loan. To assess the borrower’s ability to repay, we review each borrower’s employment and credit history and information on the historical and projected income and expenses of mortgagors. All mortgage loans up to $850,000 must be approved by two of the following officers: the President, the Chief Lending Officer, the Senior Vice President and the Manager of Residential Lending. All loans in excess of $850,000 must be approved by the Directors’ Loan Committee. In addition, the board of directors ratifies all loans approved by management including those approved by the Management Loan Committee. The Bank agreed with the OTS that the Bank will not originate any multi-family, commercial real estate, construction and land loans without prior OTS approval.
Non-Performing Loans and Potential Problem Assets
After a one- to four-family residential loan becomes 15 days late, we deliver a computer generated late charge notice to the borrower. Approximately one week later, we deliver a reminder notice. When a loan becomes 30 days delinquent, the loan servicing department manager determines whether to send an acceleration letter to the borrower and attempts to make personal contact. After 60 days, we will generally refer the matter to legal counsel who is authorized to commence foreclosure proceedings. Management is authorized to begin foreclosure proceedings on any loan after 60 days, after determining that it is prudent to do so and the proper acceleration letter has been sent.
After a multi-family, commercial real estate or construction loan becomes 10 days delinquent, we deliver a computer generated late charge notice to the borrower and attempt to make personal contact with the borrower. If there is no successful resolution of the delinquency at that time, we may accelerate the payment terms of the loan and issue a letter notifying the borrower of this acceleration. After such a loan is 15 days delinquent, we may refer the matter to legal counsel who is authorized to commence foreclosure proceedings. Management is authorized to begin foreclosure proceedings on any loan after determining that it is prudent to do so.
Mortgage loans are reviewed on a regular basis by management’s Asset Classification Committee and are placed on non-accrual status when they become 90 days or more delinquent and collection is doubtful or when, regardless of how many days delinquent the loan is, other factors indicate that the collection of these amounts is doubtful. When loans are placed on non-accrual status, unpaid accrued interest is reversed, and further income is recognized only to the extent received.
Non-Performing Loans. Non-performing loans are either in non-accrual status, past due 90 days or more and still accruing, and/or past contractual maturity date. At September 30, 2010, $86.2 million of our loans net of specific allowances of $1.1 million, or 22.2% of our total loans, were non-accrual and/or past maturity and therefore non-performing. These loans consist of multi-family loans of $25.3 million, commercial real estate loans of $38.6 million, construction loans of $14.5 million and land loans of $7.7 million. At September 30, 2010, there were no loans past due 90 days or more and still accruing.
12
Non-Performing Assets. The table below sets forth the amounts and categories of our non-performing assets, net of specific allowances at the dates indicated. We may from time to time agree to modify the contractual terms of a borrower’s loan. In cases where these modifications represent a concession (for which a portion of interest or principal has been forgiven and loans modified at interest rates materially less than current market rates) to a borrower experiencing financial difficulty, the modification is considered a troubled debt restructuring. Loans modified in a troubled debt restructuring are generally placed on non-accrual status until we determine that future collection of principal and interest is reasonably assured, which requires that the borrower demonstrate performance according to the restructured terms generally for a period of six months. Loans modified in a troubled debt restructuring that are not placed on non-accrual status are loans that have demonstrated performance up to the time that the loan has been restructured. At September 30, 2010, fourteen loans were modified in troubled debt restructurings totaling $28.7 million versus $0.4 million at September 30, 2009. Of the fourteen, one loan totaling $0.4 million was performing at the time its terms were modified and is performing in accordance with its new terms. Therefore, it is not included in the table below. For the periods presented from September 2006 through 2008, we had no troubled debt restructurings. The recent sharp deterioration in the real estate market has resulted in a deterioration of the Bank’s loans receivable portfolio, which in turn has caused increases in non-performing loans. At September 30, 2010, 49 loans totaling $86.2 million, net of specific allowances, were in non-performing status versus nine loans totaling $22.1 million in non-performing status at September 30, 2009.
|
At September 30,
|
||||||||||||||||||||
|
2010
|
2009
|
2008
|
2007
|
2006
|
||||||||||||||||
|
(Dollars in thousands)
|
||||||||||||||||||||
|
Non-accrual loans:
|
||||||||||||||||||||
|
One-to four-family
|
$ | - | $ | - | $ | - | $ | - | $ | 154 | ||||||||||
|
Multi-family
|
23,956 | 902 | 1,883 | 41 | 145 | |||||||||||||||
|
Commercial real estate
|
34,908 | 15,623 | 130 | - | - | |||||||||||||||
|
Construction
|
7,890 | 832 | - | 611 | - | |||||||||||||||
|
Land
|
5,103 | 4,722 | - | - | - | |||||||||||||||
|
Consumer
|
- | - | - | - | - | |||||||||||||||
|
Total non-accrual loans
|
71,857 | 22,079 | 2,013 | 652 | 299 | |||||||||||||||
|
Loans past maturity and still accruing
|
14,321 | - | - | - | - | |||||||||||||||
|
Loans past due 90 days or more and still accruing
|
- | - | - | - | - | |||||||||||||||
|
Total non-performing loans
|
86,178 | 22,079 | 2,013 | 652 | 299 | |||||||||||||||
| Real estate owned | - | - | - | - | - | |||||||||||||||
|
Total non-performing assets
|
$ | 86,178 | $ | 22,079 | $ | 2,013 | $ | 652 | $ | 299 | ||||||||||
|
Ratios:
|
||||||||||||||||||||
|
Total non-performing loans to total loans
|
22.22 | % | 5.13 | % | 0.54 | % | 0.23 | % | 0.10 | % | ||||||||||
|
Total non-performing loans to total assets
|
17.72 | % | 4.23 | % | 0.42 | % | 0.17 | % | 0.07 | % | ||||||||||
|
Total non-performing assets to total assets
|
17.72 | % | 4.23 | % | 0.42 | % | 0.17 | % | 0.07 | % | ||||||||||
Delinquencies. The following table sets forth certain information with respect to our loan portfolio delinquencies at the dates indicated, net of specific reserves of $1.1 million.
13
|
Loans Delinquent For
|
||||||||||||||||||||||||
|
30-89 Days
|
90 Days and Over
|
Total
|
||||||||||||||||||||||
|
Number
|
Amount
|
Number
|
Amount
|
Number
|
Amount
|
|||||||||||||||||||
|
(Dollars in thousands)
|
||||||||||||||||||||||||
|
At September 30, 2010
|
||||||||||||||||||||||||
|
Mortgage Loans:
|
||||||||||||||||||||||||
|
1-4 Family(secured by first liens)
|
3 | $ | 115 | - | $ | - | 3 | $ | 115 | |||||||||||||||
|
1-4 Family(secured by junior liens)
|
- | - | - | - | - | - | ||||||||||||||||||
|
Multi-family
|
3 | 2,807 | 7 | 23,956 | 10 | 26,763 | ||||||||||||||||||
|
Construction
|
2 | 6,615 | 7 | 7,890 | 9 | 14,505 | ||||||||||||||||||
|
Commercial Real Estate
|
3 | 5,922 | 22 | 34,908 | 25 | 40,830 | ||||||||||||||||||
|
Land
|
2 | 2,628 | 7 | 5,103 | 9 | 7,731 | ||||||||||||||||||
|
Non-Mortgage Loans:
|
||||||||||||||||||||||||
|
Other-Personal (64-)
|
- | - | - | - | - | - | ||||||||||||||||||
|
Total
|
13 | $ | 18,087 | 43 | $ | 71,857 | 56 | $ | 89,944 | |||||||||||||||
|
At September 30, 2009
|
||||||||||||||||||||||||
|
Mortgage Loans:
|
||||||||||||||||||||||||
|
1-4 Family(secured by first liens)
|
- | $ | - | - | $ | - | - | $ | - | |||||||||||||||
|
1-4 Family(secured by junior liens)
|
- | - | - | - | - | - | ||||||||||||||||||
|
Multi-family
|
1 | 345 | 1 | 902 | 2 | 1,247 | ||||||||||||||||||
|
Construction
|
2 | 311 | 1 | 832 | 3 | 1,143 | ||||||||||||||||||
|
Commercial Real Estate
|
2 | 3,979 | 6 | 15,623 | 8 | 19,602 | ||||||||||||||||||
|
Land
|
- | - | 1 | 4,722 | 1 | 4,722 | ||||||||||||||||||
|
Non-Mortgage Loans:
|
||||||||||||||||||||||||
|
Other-Personal (64-)
|
- | - | - | - | - | - | ||||||||||||||||||
|
Total
|
5 | $ | 4,635 | 9 | $ | 22,079 | 14 | $ | 26,714 | |||||||||||||||
|
At September 30, 2008
|
||||||||||||||||||||||||
|
Multi-family
|
- | $ | - | - | $ | - | - | $ | - | |||||||||||||||
|
Construction
|
- | - | - | - | - | - | ||||||||||||||||||
|
Total
|
- | $ | - | - | $ | - | - | $ | - | |||||||||||||||
For the fiscal year ended September 30, 2010, there was $5.5 million in interest income that would have been recorded had our non-accruing loans been current in accordance with their original terms. Interest of $0.6 million was recognized on these loans and recorded in net income for fiscal 2010.
Classified Assets. OTS regulations and our Asset Classification Policy provide that loans and other assets should be classified as “substandard,” “doubtful” or “loss” assets where a significant question as to collectability arises. An asset is considered “substandard” if it is inadequately protected by the current net worth and paying capacity of the obligor or of the collateral pledged, if any. “Substandard” assets include those characterized by the “distinct possibility” that the institution will sustain “some loss” if the deficiencies are not corrected. Assets classified as “doubtful” have all of the weaknesses inherent in those classified “substandard,” with the added characteristic that the weaknesses present make “collection or liquidation in full,” on the basis of currently existing facts, conditions, and values, “highly questionable and improbable.” Assets classified as “loss” are those considered “uncollectible” and of such little value that they should be entirely charged-off. We classify an asset as “special mention” if the asset has a potential weakness that warrants management’s close attention. While “special mention” assets have not deteriorated to the point of being classified as “substandard,” management has concluded that if the potential weakness in the asset is not addressed, the value of the asset may deteriorate, thereby adversely affecting the repayment of the asset.
14
An institution is required to establish general allowances for loan losses in an amount deemed prudent by management for loans classified as “special mention.” General allowances represent loss allowances which have been established to recognize the inherent losses associated with lending activities, but which, unlike specific allowances, have not been allocated to particular problem assets. When an institution classifies assets as “substandard or doubtful”, it is required either to establish a specific allowance for losses equal to the amount its internal analysis determines the potential loss to be on the asset or to charge off the amount. When an institution classifies problem assets as “loss,” it is required either to establish a specific allowance for losses equal to 100% of the amount of the asset so classified or deemed uncollectable to charge off the amount. An institution’s determination as to the classification of its assets and the amount of its valuation allowances is subject to review by the OTS which can order the establishment of additional general or specific loss allowances.
On the basis of management’s review of assets, at September 30, 2010, we classified $62.5 million of our assets as special mention or potential problem loans compared to $56.4 million at September 30, 2009. In addition, at September 30, 2010 we classified $125.0 million as substandard compared to $54.4 million at September 30, 2009. We have provided $1.1 million in specific allowances for $5.9 million of the loans classified as substandard, which were comprised of four commercial real estate loans.
The majority of the specific allowance is attributable to a $2.2 million loan which is secured by a middle school. The Company is recording a $1.0 million specific allowance based on the current appraised value.
The loan portfolio is reviewed on a regular basis by management’s Asset Classification Committee to determine whether any loans require classification in accordance with applicable regulations. Not all classified assets constitute non-performing assets.
The following table sets forth certain information related to our assets classified as substandard:
|
September 30, 2010
|
||||||||||||
|
Recorded Balance
|
Unpaid Principal
Balance |
Specific Allowance
|
||||||||||
|
Loans without a specific valuation allowance:
|
||||||||||||
|
One-to-Four Family
|
$ | - | $ | - | ||||||||
|
Multi-Family
|
31,380 | 38,903 | ||||||||||
|
Commercial Real Estate
|
47,146 | 64,191 | ||||||||||
|
Construction
|
24,660 | 25,726 | ||||||||||
|
Land
|
15,938 | 22,582 | ||||||||||
|
Consumer and Other
|
- | - | ||||||||||
|
Loans with a specific valuation allowance:
|
||||||||||||
|
One-to-Four Family
|
- | - | $ | - | ||||||||
|
Multi-Family
|
- | - | - | |||||||||
|
Commercial Real Estate
|
5,414 | 5,414 | 1,081 | |||||||||
|
Construction
|
- | - | - | |||||||||
|
Land
|
437 | 437 | 6 | |||||||||
|
Consumer and Other
|
- | - | - | |||||||||
|
Total:
|
||||||||||||
|
One-to-Four Family
|
- | - | - | |||||||||
|
Multi-Family
|
31,380 | 38,903 | - | |||||||||
|
Commercial Real Estate
|
52,560 | 69,605 | 1,081 | |||||||||
|
Construction
|
24,660 | 25,726 | - | |||||||||
|
Land
|
16,375 | 23,019 | 6 | |||||||||
|
Consumer and Other
|
- | - | - | |||||||||
|
Total substandard loans
|
$ | 124,975 | $ | 157,253 | $ | 1,087 | ||||||
15
Allowance for Loan Losses
Our allowance for loan losses is intended to be maintained at a level necessary to absorb loan losses that are both probable and reasonably estimable. Management, in determining the allowance for loan losses, considers the losses inherent in its loan portfolio and changes in the nature and volume of loan activities, along with the general economic and real estate market conditions. We utilize a two-tier approach: (1) identification of impaired loans and establishment of specific loss allowances on impaired loans, if any; and (2) establishment of general valuation allowances on the remainder of our loan portfolio. We maintain a loan review system, which provides for a periodic review of our loan portfolio and the identification of potential impaired loans. This system takes into consideration, among other things, delinquency status, size of loans, type and market value of collateral and financial condition of the borrowers. Specific loan loss allowances are established for identified losses based on a review of this information. A loan evaluated for impairment is considered to be impaired when, based on current information and events, it is probable that we will be unable to collect all amounts due according to the contractual terms of the loan agreement. We do not aggregate these loans for evaluation purposes. Loan impairment is measured based on the present value of expected future cash flows discounted at the loan’s effective interest rate or, as a practical expedient, at the loan’s observable market price or the fair value of the collateral if the loan is collateral dependent. General loan loss allowances are based upon a combination of factors including, but not limited to, actual loan loss experience, composition of the loan portfolio, current economic conditions and management’s judgment. The allowance is increased through provisions charged against current earnings and recoveries of previously charged-off loans. Loans that are determined to be uncollectible are charged against the allowance. While management uses available information to recognize probable and reasonably estimable loan losses, future loss provisions may be necessary based on changing economic conditions, particularly in the real estate sector.
As discussed in Item 9A. “Controls and Procedures” in this annual report, following the end of fiscal year 2010 and in connection with the preparation of our consolidated financial statements for the fiscal year ended September 30, 2010, we identified certain miscalculations in our allowance for loan losses resulting from delays in the provision of updated appraisal information to our accounting staff to enable us to identify impaired loans and appropriately recognize charge-offs as needed. During the third quarter of fiscal year 2011 we have modified our procedures related to the handling of appraisals and the timing of impairment analysis to ensure that charge-offs are recognized in a timely manner.
A federally chartered savings association’s determinations as to the classification of its assets, charge-offs and the amount of its valuation allowances are subject to review by the OTS. The OTS, in conjunction with the other federal banking agencies, provides guidance for financial institutions on both the responsibilities of management for the assessment and establishment of adequate valuation allowances and guidance for banking agency examiners to use in determining the adequacy of valuation allowances. All institutions are required to have effective systems and controls to identify, monitor and address asset quality problems, analyze all significant factors that affect the collectability of the portfolio in a reasonable manner and establish acceptable allowance evaluation processes that meet the objectives of the federal regulatory agencies. There can be no assurance that the Office of Thrift Supervision, as a result of reviewing our loan portfolio and/or allowance, will not request that we alter our allowance for loan losses or require additional charge-offs, thereby affecting our financial condition and earnings.
Allowance for loan losses increased by $7.1 million, to $17.9 million for the fiscal year ended September 30, 2010 from $10.8 million for the fiscal year ended September 30, 2009. There were charge-offs of $35.5 million during the fiscal year ended September 30, 2010. The loan loss provision also increased $34.1 million to $42.7 million for fiscal year 2010 compared to $8.6 million for fiscal year 2009. The increases are primarily the result of general decline in economic conditions in our lending footprint which has increased loans classified as sub-standard and special mention. The national and local economies were generally considered to be in a recession from December 2007 through the middle of 2009. This has resulted in increased unemployment and declining property values. While the national and local economies have shown signs of improvement since the second half of 2009, unemployment has remained at elevated levels.
16
The transfer of the held-for-sale portfolio in fiscal year 2009 was due to the increased tightening in the credit markets, which has hampered the Company’s ability to sell these loans. Management decided to transfer these loans to its loans receivable portfolio and in accordance with its allowance for loan and lease losses policy established a general provision. Loans held-for-sale are carried at the lower of cost or market and therefore do not require a general allowance for loan losses. The Company also increased its general provision due to an increase in potential problem loans. Potential problem loans are loans that may or may not be delinquent but are loans that the Company has identified as showing characteristics of potential inability on the part of the borrower to make payments in accordance with the terms of the loan agreement.
The following table sets forth activity in our allowance for loan losses for the periods indicated.
|
At or For the Years Ended September 30,
|
||||||||||||||||||||
|
2010
|
2009
|
2008
|
2007
|
2006
|
||||||||||||||||
|
(Dollars in thousands)
|
||||||||||||||||||||
|
Balance at beginning of year
|
$ | 10,750 | $ | 2,205 | $ | 1,806 | $ | 1,757 | $ | 1,321 | ||||||||||
|
Charge-offs:
|
||||||||||||||||||||
|
One-to-four-family
|
216 | - | - | - | - | |||||||||||||||
|
Multi-family
|
8,741 | - | - | - | - | |||||||||||||||
|
Commercial real estate
|
18,035 | - | - | - | - | |||||||||||||||
|
Construction
|
6,644 | - | - | - | - | |||||||||||||||
|
Land
|
1,853 | - | - | - | - | |||||||||||||||
|
Consumer and other
|
35 | - | - | - | - | |||||||||||||||
|
Recoveries
|
(33 | ) | - | - | - | - | ||||||||||||||
|
Net charge-offs
|
35,491 | - | - | - | - | |||||||||||||||
|
Provision for loan losses
|
42,682 | 8,545 | 399 | 49 | 436 | |||||||||||||||
|
Balance at end of year
|
$ | 17,941 | $ | 10,750 | $ | 2,205 | $ | 1,806 | $ | 1,757 | ||||||||||
|
Ratios:
|
||||||||||||||||||||
|
Net charge-offs to average loans outstanding
|
8.83 | % | 0.00 | % | 0.00 | % | 0.00 | % | 0.00 | % | ||||||||||
|
Allowance for loan losses to total loans at end of period
|
4.63 | % | 2.50 | % | 0.59 | % | 0.63 | % | 0.61 | % | ||||||||||
The recent sharp deterioration in the real estate market, related to the extended recession of 2008 through mid-2009 and current elevated unemployment rates, has resulted in a deterioration of the Bank’s loan portfolio, including increases in non-performing loans and problem assets which led to charge-offs. At September 30, 2010 total charge-offs of $35.5 million consisted of two one-to-four-family, eight multi-family, thirty commercial, eight construction, twelve land and one consumer loans.
Allocation of Allowance for Loan Losses. The following table sets forth the allowance for loan losses allocated by loan category, the percentage of the allowance for loan losses in each category to the total allowance for loan losses, and the percent of loans in each category to total loans at the dates indicated. The allowance for loan losses allocated to each category is not necessarily indicative of future losses in any particular category and does not restrict the use of the allowance to absorb losses in other categories.
17
|
At September 30,
|
||||||||||||||||||||||||||||||||||||
|
2010
|
2009
|
2008
|
||||||||||||||||||||||||||||||||||
|
Amount
|
Percent of Allowance
to Total Allowance
|
Percent of Loans in
Each
Category
to Total
Loans
|
Amount
|
Percent of Allowance
to Total Allowance
|
Percent of Loans in
Each
Category
to Total
Loans
|
Amount
|
Percent of Allowance
to Total Allowance
|
Percent of Loans in
Each Category
to Total
Loans
|
||||||||||||||||||||||||||||
|
(Dollars in thousands)
|
||||||||||||||||||||||||||||||||||||
|
Mortgage loans:
|
||||||||||||||||||||||||||||||||||||
|
One-to four-family
|
$ | 547 | 3.05 | % | 18.90 | % | $ | 79 | 0.73 | % | 17.85 | % | $ | 80 | 3.63 | % | 33.99 | % | ||||||||||||||||||
|
Multi-family
|
3,125 | 17.42 | % | 16.77 | % | 1,682 | 15.65 | % | 21.40 | % | 248 | 11.25 | % | 13.34 | % | |||||||||||||||||||||
|
Commercial real estate
|
9,485 | 52.87 | % | 30.79 | % | 5,529 | 51.43 | % | 33.18 | % | 1,316 | 59.68 | % | 42.76 | % | |||||||||||||||||||||
|
Construction
|
3,104 | 17.30 | % | 24.65 | % | 1,170 | 10.88 | % | 16.98 | % | 196 | 8.89 | % | 5.69 | % | |||||||||||||||||||||
|
Land
|
1,664 | 9.27 | % | 8.77 | % | 2,268 | 21.10 | % | 10.43 | % | 357 | 16.19 | % | 3.84 | % | |||||||||||||||||||||
|
Consumer and other
|
16 | 0.09 | % | 0.12 | % | 22 | 0.20 | % | 0.16 | % | 8 | 0.36 | % | 0.38 | % | |||||||||||||||||||||
|
Total allowance for loan losses
|
$ | 17,941 | 100.00 | % | 100.00 | % | $ | 10,750 | 100.00 | % | 100.00 | % | $ | 2,205 | 100.00 | % | 100.00 | % | ||||||||||||||||||
|
At September 30,
|
||||||||||||||||||||||||||||||||||||
| 2007 | 2006 | |||||||||||||||||||||||||||||||||||
|
Amount
|
Percent of Allowance
to Total Allowance
|
Percent of Loans in
Each Category
to Total Loans
|
Amount
|
Percent of Allowance
to Total Allowance
|
Percent of Loans in
Each Category
to Total
Loans
|
|||||||||||||||||||||||||||||||
|
(Dollars in thousands)
|
||||||||||||||||||||||||||||||||||||
|
Mortgage loans:
|
||||||||||||||||||||||||||||||||||||
|
One-to four-family
|
$ | 69 | 3.82 | % | 32.57 | % | $ | 60 | 3.41 | % | 28.87 | % | ||||||||||||||||||||||||
|
Multi-family
|
365 | 20.21 | % | 18.54 | % | 496 | 28.23 | % | 23.55 | % | ||||||||||||||||||||||||||
|
Commercial real estate
|
1,089 | 60.30 | % | 42.43 | % | 666 | 37.91 | % | 36.56 | % | ||||||||||||||||||||||||||
|
Construction
|
185 | 10.24 | % | 5.24 | % | 292 | 16.62 | % | 9.25 | % | ||||||||||||||||||||||||||
|
Land
|
90 | 4.98 | % | 0.79 | % | 239 | 13.60 | % | 1.49 | % | ||||||||||||||||||||||||||
|
Consumer and other
|
8 | 0.44 | % | 0.43 | % | 4 | 0.23 | % | 0.28 | % | ||||||||||||||||||||||||||
|
Total allowance for loan losses
|
$ | 1,806 | 100.00 | % | 100.00 | % | $ | 1,757 | 100.00 | % | 100.00 | % | ||||||||||||||||||||||||
Each quarter, management evaluates the total balance of the allowance for loan losses based on several factors that are reflective of the inherent losses in the loan portfolio. This process includes, but is not limited to, a periodic review of loan collectability in light of historical experience, the nature and volume of loan activity, conditions that may affect the ability of the borrower to repay, the underlying value of collateral, if applicable, and economic conditions in our immediate market area. First, we group loans by delinquency status. All loans deemed impaired are evaluated individually, based primarily on the value of the collateral securing the loan. Specific loss allowances are established as required by this analysis. All loans for which a specific loss allowance has not been assigned are segregated by type and delinquency status and a loss allowance is established by using loss experience data and management’s judgment concerning other matters it considers significant. The allowance is allocated to each category of loans based on the results of the above analysis.
18
This analysis process is inherently subjective, as it requires us to make estimates that are susceptible to revisions as more information becomes available. Although we believe that we have established the allowance at levels to absorb probable and estimable losses, future additions may be necessary if economic or other conditions continue to deteriorate in the future from the current environment.
Investments
Investments and Mortgage-Backed Securities. Our investment portfolio at September 30, 2010 is classified as available for sale and included $63.0 million of mortgage-backed securities, $3.0 million of US government agency bonds and $3.1 million of mutual fund shares, comprised primarily of a $2.6 million ultra-short term mutual fund. Our investment policy objectives are to maintain liquidity within the guidelines established by the board of directors. We also hold at cost $1.8 million of Federal Home Loan Bank of New York stock.
At September 30, 2010, we held in mortgage-backed securities $24.4 million issued by Freddie Mac and Fannie Mae, which are United States government-sponsored enterprises, $16.5 million issued by Ginnie Mae, which is a United States government agency and $22.1 million in mortgage-backed securities representing securities of private issuers. Private issuer securities typically offer rates above those paid on securities of government-sponsored enterprises, but lack the guaranty of those enterprises and are often less liquid. The government-sponsored enterprises’ portion of the mortgage-backed securities portfolio consisted of $37.7 million in fixed-rate mortgage-backed securities and $3.3 million in adjustable rate mortgage-backed securities.
The only securities of individual issuers that we hold with an aggregate book value exceeding 10% of our equity at September 30, 2010, were mortgage-backed securities issued by government agencies and government-sponsored enterprises.
For further discussion of our securities portfolio, please see Note 4 of Notes to Consolidated Financial Statements in Item 8, “Financial Statements and Supplementary Data.”
The following table sets forth the composition of our investment securities portfolio at the dates indicated
|
At September 30,
|
||||||||||||||||||||||||
|
2010
|
2009
|
2008
|
||||||||||||||||||||||
|
Carrying
Cost
|
Estimated
Fair
Value
|
Carrying
Cost
|
Estimated
Fair
Value
|
Carrying
Cost
|
Estimated
Fair
Value
|
|||||||||||||||||||
|
(In thousands)
|
||||||||||||||||||||||||
|
Securities available-for-sale:
|
||||||||||||||||||||||||
|
Mortgage-backed securities:
|
||||||||||||||||||||||||
|
Government agency
|
$ | 16,522 | $ | 16,737 | $ | - | $ | - | $ | - | $ | - | ||||||||||||
|
Government-sponsored enterprises
|
24,440 | 24,889 | - | - | - | - | ||||||||||||||||||
|
Private issuers
|
22,055 | 21,352 | - | - | - | - | ||||||||||||||||||
|
Government debentures
|
2,990 | 3,029 | - | - | - | - | ||||||||||||||||||
|
Mutual funds
|
3,079 | 3,100 | 3,305 | 3,305 | 3,655 | 3,655 | ||||||||||||||||||
|
Total securities available-for-sale
|
$ | 69,086 | $ | 69,107 | $ | 3,305 | $ | 3,305 | $ | 3,655 | $ | 3,655 | ||||||||||||
|
Securities held-to-maturity:
|
||||||||||||||||||||||||
|
Mortgage-backed securities:
|
||||||||||||||||||||||||
|
Government-sponsored enterprises
|
$ | - | $ | - | $ | 20,474 | $ | 20,863 | $ | 30,136 | $ | 29,222 | ||||||||||||
|
Government agency
|
- | - | 125 | 123 | 152 | 146 | ||||||||||||||||||
|
Private issuers
|
- | - | 45,602 | 38,348 | 47,798 | 41,628 | ||||||||||||||||||
|
Total securities held-to-maturity
|
$ | - | $ | - | $ | 66,201 | $ | 59,334 | $ | 78,086 | $ | 70,996 | ||||||||||||
19
Portfolio Maturities and Yields. The composition and maturities of the investment securities portfolio at September 30, 2010 are summarized in the following table. Maturities are based on the final contractual payment dates, and do not reflect the impact of prepayments or early redemptions that may occur. This table does not reflect the Bank’s investment in mutual funds which have no contractual maturity date and are classified as available-for-sale.
|
One Year or Less
|
More than One Year through Five Years
|
More than Five Years through Ten Years
|
More than Ten Years
|
Total Securities
|
||||||||||||||||||||||||||||||||||||||||
|
Carrying Value
|
Weighted Average Yield
|
Carrying Value
|
Weighted Average Yield
|
Carrying Value
|
Weighted Average Yield
|
Carrying Value
|
Weighted Average Yield
|
Carrying Value
|
Fair Value
|
Weighted Average Yield
|
||||||||||||||||||||||||||||||||||
|
(Dollars in thousands)
|
||||||||||||||||||||||||||||||||||||||||||||
|
Government-sponsored enterprises
|
$ | - | 0.00 | % | $ | 143 | 4.50 | % | $ | 6,485 | 4.18 | % | $ | 17,812 | 3.51 | % | 24,440 | $ | 24,889 | 3.70 | % | |||||||||||||||||||||||
|
Government agency
|
- | 0.00 | % | - | 0.00 | % | 90 | 4.62 | % | 16,432 | 2.77 | % | 16,522 | 16,737 | 2.78 | % | ||||||||||||||||||||||||||||
|
Government debentures
|
- | 0.00 | % | - | 0.00 | % | - | 0.00 | % | 2,990 | 2.01 | % | 2,990 | 3,029 | 2.01 | % | ||||||||||||||||||||||||||||
|
Private issuers
|
- | 0.00 | % | - | 0.00 | % | 8,153 | 4.92 | % | 13,902 | 4.57 | % | 22,055 | 21,352 | 4.70 | % | ||||||||||||||||||||||||||||
|
Total securities available-for-sale
|
$ | - | 0.00 | % | $ | 143 | 4.50 | % | $ | 14,728 | 13.72 | % | $ | 51,136 | 12.86 | % | $ | 66,007 | $ | 66,007 | 3.73 | % | ||||||||||||||||||||||
Sources of Funds
General. Deposits have traditionally been our primary source of funds for our lending and investment activities. In addition to deposits, funds are derived from scheduled loan payments, investment maturities, loan prepayments and income on earning assets. While scheduled loan payments and income on earning assets have been relatively stable sources of funds, deposit inflows and outflows can vary widely and are influenced by prevailing interest rates, market conditions and levels of competition. Borrowings from the Federal Home Loan Bank of New York may be used to compensate for reductions in deposits and to fund loan and securities growth. As of September 30, 2010, we had $10.5 million of borrowings outstanding from the Federal Home Loan Bank of New York.
Deposits. Substantially all of our depositors are persons who work or reside in Kings, Nassau or Suffolk Counties, New York. We offer a variety of deposit instruments. These include demand deposits consisting of non-interest bearing checking accounts, NOW accounts, money market accounts, passbook savings and club accounts, and fixed-term certificates of deposit. Deposit account terms vary, with the principal differences being the minimum balance required, the amount of time the funds must remain on deposit and the interest rate. We do not have any brokered deposits at this time.
We establish and adjust periodically the interest rates paid, maturity terms, service fees and withdrawal penalties on our deposits. Deposit rates and terms are based primarily on current operating strategies and market rates, liquidity requirements, rates paid by competitors and growth goals. We rely on personalized customer service and long-standing relationships with customers to attract and retain deposits.
The flow of deposits is influenced significantly by general economic conditions, changes in money market and other prevailing interest rates and competition. The variety of deposit accounts offered allows us to be competitive in obtaining funds and responding to changes in consumer demand. Based on experience, management believes that our deposits are relatively stable. However, our ability to attract and maintain certificates of deposit, and the rates paid on these deposits, have been and will continue to be significantly affected by market conditions. At September 30, 2010, $252.6 million, or 59.7%, of our deposit accounts were certificates of deposit, of which $149.2 million had maturities of one year or less.
20
Deposit Accounts. The following table sets forth the distribution of total deposit accounts, by account type, at the dates indicated.
|
At September 30,
|
||||||||||||||||||||||||||||||||||||
|
2010
|
2009
|
2008
|
||||||||||||||||||||||||||||||||||
|
Balance
|
Percent
|
Weighted Average
Rate
|
Balance
|
Percent
|
Weighted Average
Rate
|
Balance
|
Percent
|
Weighted Average
Rate
|
||||||||||||||||||||||||||||
|
(Dollars in thousands)
|
||||||||||||||||||||||||||||||||||||
|
Deposit type:
|
||||||||||||||||||||||||||||||||||||
|
NOW accounts
|
$ | 12,817 | 3.03 | % | 0.35 | % | $ | 11,068 | 2.75 | % | 0.75 | % | $ | 10,251 | 2.99 | % | 0.75 | % | ||||||||||||||||||
|
Checking accounts
|
16,033 | 3.79 | % | 0.00 | % | 16,595 | 4.13 | % | 0.00 | % | 18,773 | 5.48 | % | 0.00 | % | |||||||||||||||||||||
|
Money market accounts
|
75,341 | 17.79 | % | 0.73 | % | 61,716 | 15.35 | % | 1.48 | % | 44,890 | 13.11 | % | 2.58 | % | |||||||||||||||||||||
|
Total deposit accounts
|
104,191 | 24.61 | % | 0.57 | % | 89,379 | 22.23 | % | 1.11 | % | 73,914 | 21.58 | % | 1.67 | % | |||||||||||||||||||||
|
Passbook savings accounts
|
66,642 | 15.74 | % | 0.40 | % | 61,880 | 15.39 | % | 0.65 | % | 58,162 | 16.98 | % | 1.05 | % | |||||||||||||||||||||
|
Certificates of deposit
|
252,573 | 59.65 | % | 2.14 | % | 250,811 | 62.38 | % | 2.87 | % | 210,399 | 61.44 | % | 3.87 | % | |||||||||||||||||||||
|
Total deposits
|
$ | 423,406 | 100.00 | % | 1.48 | % | $ | 402,070 | 100.00 | % | 2.14 | % | $ | 342,475 | 100.00 | % | 2.92 | % | ||||||||||||||||||
Deposit Activity. The following table sets forth our deposit activity for the periods indicated.
|
Years Ended September 30,
|
||||||||||||
|
2010
|
2009
|
2008
|
||||||||||
|
(In thousands)
|
||||||||||||
|
Beginning balance
|
$ | 402,070 | $ | 342,475 | $ | 287,155 | ||||||
|
Net increase before interest credited
|
13,982 | 50,146 | 45,721 | |||||||||
|
Interest credited
|
7,354 | 9,449 | 9,599 | |||||||||
|
Net increase in deposits
|
21,336 | 59,595 | 55,320 | |||||||||
|
Ending balance
|
$ | 423,406 | $ | 402,070 | $ | 342,475 | ||||||
Large Certificates of Deposits. As of September 30, 2010 the aggregate amount of outstanding certificates of deposit in amounts greater than or equal to $100,000 was approximately $86.2 million. The following table sets forth the maturity of those certificates as of September 30, 2010.
21
|
At
|
|||||
|
September 30, 2010
|
|||||
|
(In thousands)
|
|||||
|
Three months or less
|
$ | 20,790 | |||
|
Over three months through six months
|
10,060 | ||||
|
Over six months through one year
|
18,085 | ||||
|
Over one year to three years
|
26,641 | ||||
|
Over three years
|
10,662 | ||||
|
Total
|
$ | 86,238 | |||
Certificate of Deposit Maturity Schedule. The following table presents, by rate category, the remaining period to maturity of certificate of deposit accounts outstanding as of September 30, 2010.
|
Percentage
|
||||||||||||||||||||||||||||
|
Over one
|
Over two
|
Over three
|
Over four
|
of total
|
||||||||||||||||||||||||
|
Less than
|
year to
|
years to
|
years to
|
years to
|
certificate
|
|||||||||||||||||||||||
|
one year
|
two years
|
three years
|
four years
|
five years
|
Total
|
accounts
|
||||||||||||||||||||||
|
(Dollars in thousands)
|
||||||||||||||||||||||||||||
|
Interest Rate
|
||||||||||||||||||||||||||||
|
0.00% - 1.99%
|
$ | 116,158 | $ | 20,707 | $ | 3,489 | $ | - | $ | - | $ | 140,354 | 55.57 | % | ||||||||||||||
|
2.00% - 2.99%
|
22,037 | 15,946 | 5,964 | 10 | 10,639 | 54,596 | 21.62 | % | ||||||||||||||||||||
|
3.00% - 3.99%
|
6,280 | - | 1,980 | 12,021 | 15,485 | 35,766 | 14.16 | % | ||||||||||||||||||||
|
4.00% - 4.99%
|
4,091 | 5,364 | 8,922 | 2,827 | - | 21,204 | 8.40 | % | ||||||||||||||||||||
|
5.00% - 5.99%
|
653 | - | - | - | - | 653 | 0.26 | % | ||||||||||||||||||||
|
Total
|
$ | 149,219 | $ | 42,017 | $ | 20,355 | $ | 14,858 | $ | 26,124 | $ | 252,573 | 100.00 | % | ||||||||||||||
Certificates of Deposit Classified By Rate. The following table sets forth certificates of deposit classified by range of interest rates as of the dates indicated.
|
At September 30,
|
||||||||||||
|
2010
|
2009
|
2008
|
||||||||||
|
(In thousands)
|
||||||||||||
|
Interest Rate
|
||||||||||||
|
Less than 2%
|
$ | 140,354 | $ | 52,367 | $ | - | ||||||
|
2.00% - 2.99%
|
54,596 | 107,003 | 27,861 | |||||||||
|
3.00% - 3.99%
|
35,766 | 46,862 | 101,909 | |||||||||
|
4.00% - 4.99%
|
21,204 | 43,930 | 59,950 | |||||||||
|
5.00% - 5.99%
|
653 | 649 | 20,679 | |||||||||
|
Total
|
$ | 252,573 | $ | 250,811 | $ | 210,399 | ||||||
Borrowings. Our borrowings consist of advances from the Federal Home Loan Bank of New York. At September 30, 2010, we had access to Federal Home Loan Bank advances of up to $62.4 million. The following table sets forth information concerning balances and interest rates on our borrowings at the dates and for the periods indicated.
22
|
At or For the Years Ended September 30,
|
||||||||||||
|
2010
|
2009
|
2008
|
||||||||||
|
(Dollars in thousands)
|
||||||||||||
|
Balance at end of year
|
$ | 10,500 | $ | 27,300 | $ | 44,239 | ||||||
|
Average balance during year
|
11,833 | 42,281 | 21,480 | |||||||||
|
Maximum outstanding at any month end
|
25,300 | 64,439 | 44,239 | |||||||||
|
Weighted average interest rate at end of year
|
2.51 | % | 0.78 | % | 1.73 | % | ||||||
|
Average interest rate during the year
|
2.04 | % | 0.84 | % | 3.03 | % | ||||||
Subsidiary Activities
OTS regulations permit federal savings associations to invest in the capital stock, obligations or other specified types of securities of subsidiaries (referred to as “service corporations”) and to make loans to service corporations and joint ventures in which service corporations are participants in an aggregate amount not exceeding 2% of the association’s assets, plus an additional 1% of assets if the amount over 2% is used for specified community or inner-city development purposes. Service corporations may engage in certain activities not otherwise permissible for the Company but may not take deposits. In addition, Federal regulations permit associations to make specified types of loans to service corporations (other than special-purpose finance subsidiaries) in which the association owns more than 10% of the stock, in an aggregate amount not exceeding 50% of the association’s regulatory capital if the association’s regulatory capital is in compliance with applicable regulations.
3D Holding Company was incorporated in New York in 1993, for the purpose of acquiring, managing, and disposing of real estate held by the Bank. As of September 30, 2010, the subsidiary did not hold any real estate owned. As of September 30, 2010, total assets of 3D Holding Company were $157,000, and consisted solely of cash at that date.
BFS REIT, Inc. was incorporated in New York in 1999. The corporation is a wholly-owned subsidiary created for the purpose of acquiring, holding, and investing in certain real estate-related loans and other assets that constitute permissible investments by the Bank. As of September 30, 2010, BFS REIT, Inc.’s total aggregate assets were $88.1 million.
Thrift Investors Service Corporation (“TISCO”) was incorporated in New York in 1982, for the purpose of holding BFS Agency, Inc., a company that sells insurance and fixed annuity products through licensed employees in the Bank’s branches. As of September 30, 2010, TISCO’s total aggregate assets were $275,000 of which $243,000 represented the investment in BFS Agency, Inc.
Legal Proceedings
Except as disclosed in Item 3. “Legal Proceedings”, we are not involved in any pending legal proceedings as a defendant other than routine legal proceedings occurring in the ordinary course of business. At September 30, 2010, we were not involved in any legal proceedings, the outcome of which would be material to our financial condition or results of operations. As previously disclosed, we have entered into Cease and Desist Orders with the OTS that affect the way we conduct our business.
Personnel
As of September 30, 2010, we had 79 full-time employees and 29 part-time employees. Our employees are not represented by any collective bargaining group. Management believes that we have good relations with our employees.
23
FEDERAL, STATE AND LOCAL TAXATION
General. The Bank’s Federal and state tax returns have not been audited during the past five years. The Company’s New York City tax returns have been audited for the 2005, 2006 and 2007 tax years. No adjustments to taxable income resulted from these audits.
Federal Taxation
General. The Company and the Bank are subject to Federal income taxation in the same general manner as other corporations, with some exceptions discussed below. The Company and the Bank file consolidated income tax returns. The following discussion of Federal taxation is intended only to summarize certain pertinent Federal income tax matters and is not a comprehensive description of the tax rules applicable to the Company or the Bank.
Method of Accounting. For Federal income tax purposes, the Bank and Company report their income and expenses on the accrual method of accounting and use a tax year ending September 30 for filing Federal income tax returns.
Bad Debt Reserve and Recapture. Prior to the Small Business Protection Act of 1996 (the “1996 Act”), the Bank was permitted to establish a reserve for bad debts and to make annual additions to the reserve. These additions could, within specified formula limits, be deducted in arriving at our taxable income. The Bank was required to use the specific charge off method (i.e., to claim a deduction equal to its actual loan loss experience) in computing its bad debt deduction beginning with its 1996 Federal tax return. The Bank was required to recapture any excess reserves established after December 31, 1987. The Bank now maintains a frozen reserve equal to the balance of the bad debt reserves as of December 31, 1987 (the “base year reserve”).
Taxable Distributions and Recapture. As described above, the 1996 Act modified the methods by which the Bank computes its bad debt deduction and the Bank now maintains a frozen base year reserve. The base year reserve is subject to recapture if the Bank makes certain non-dividend distributions. In such cases, an amount based on the amounts distributed will be includable into the Bank’s taxable income. “Non-dividend distributions” include distributions in excess of the Bank’s current and accumulated earnings and profits, as calculated for federal income tax purposes; distributions in redemption of its stock; and distributions in partial or complete liquidation.
At September 30, 2010, our total Federal pre-1988 base year tax bad debt reserve was approximately $1.6 million.
Alternative Minimum Tax. The Internal Revenue Code of 1986, as amended (the “Code”), imposes an alternative minimum tax (“AMT”) at a rate of 20% on a base of regular taxable income plus certain tax preferences (“alternative minimum taxable income” or “AMTI”). The AMT is payable to the extent such AMTI is in excess of an exemption amount and the AMT exceeds the regular income tax. Net operating losses can offset no more than 90% of AMTI. Certain payments of AMT may be used as credits against regular tax liabilities in future years. The Bank has not been subject to the AMT and has no such amounts available as credits for carryover.
Net Operating Loss Carryovers. The Company may carry back net operating losses to the preceding two taxable years and forward to the succeeding 20 taxable years. The Worker, Homeownership, and Business Assistance Act of 2009 generally allows the Bank to elect a 3, 4, or 5-year carry-back period on net operating losses incurred in either 2008 or 2009. At September 30, 2010, the Company is carrying back the fiscal year 2010 net operating loss 5 years and will carry the balance forward. New York State and New York City do not allow any carry back of the net operating loss but do permit such losses to be carried forward for 20 years, subject to certain limitations.
Corporate Dividends-Received Deduction. The Company may exclude from its income 100% of dividends received from the Bank as a member of the same affiliated group of corporations. The corporate dividends received deduction is 80% in the case of dividends received from corporations with which a corporate recipient does not file a consolidated return, and corporations which own less than 20% of the stock of a corporation distributing a dividend may deduct only 70% of dividends received or accrued on their behalf.
24
State and Local Taxation
New York State Taxation. The Company and the Bank are subject to the New York State banking corporation tax. This tax is imposed in an amount equal to the greater of (a) 7.1% of “entire net income” allocable to New York State, (b) 3% of “alternative entire net income” allocable to New York State, (c) 0.01% of the average value of assets allocable to New York State, or (d) a nominal minimum tax. Entire net income is based on Federal taxable income, subject to certain modifications. Alternative entire net income is equal to entire net income without certain modifications. The Company and the Bank are also subject to the New York State tax surcharge equal to 17.0% of the New York State banking corporation tax allocable to business activities carried on in the Metropolitan Commuter Transportation District.
Dividends received by the Bank from BFS REIT, Inc., a real estate investment trust, are subject to a 60% dividends-received deduction, which generally results in only 40% of BFS REIT, Inc.’s earnings being subject to New York State tax.
New York City Taxation. The Bank is also subject to the New York City banking corporation tax, which is calculated, subject to a New York City income and expense allocation, on a similar basis as the New York State banking corporation tax. The New York City tax on entire net income is imposed at a 9.0% tax rate.
Bad Debt Reserves. New York State and New York City enacted legislation for tax years beginning in 2010 to comply with the federal tax law with regards to bad debt reserves and deductions. Thrifts are now required to follow either the reserve method of accounting for loan losses or the specific charge off method. New York State and New York City do not require a recapture of the excess bad debt deductions over the amount deducted for federal purposes. Prior to this change in law, New York State and New York City decoupled from the Federal tax law in 1996, when the federal tax law changed, with regards to bad debt deduction for thrifts. New York State and City continued to permit the use of the bad debt provisions that applied under Federal tax law prior to the enactment of the 1996 Act. Provided the Bank continued to satisfy certain definitional tests of a thrift and a specified qualifying-assets ratio for New York State and New York City income tax purposes, it was permitted to continue to take deductions from entire net income for additions to reserves for losses on bad debts. The deductible annual addition to such reserves was computed using a specific formula based on an institution’s loss history (the “experience method”) or a statutory percentage equal to 32% of its New York State and New York City taxable income (the “percentage method”) before bad debt deduction.
Recapture of Bad Debt Reserves. Bad debt reserves consist of a defined “base-year” amount, plus additional amounts accumulated after the base year. As of September 30, 2010, our federal, New York State and New York City pre-1988 base-year reserve for the purposes of calculating any recapture of bad debt reserves was approximately $1.6 million. Under current federal, New York State and New York City tax laws, bad debt reserves are subject to recapture if the Bank (i) makes certain “non-dividend distributions” – see “Taxable Distributions and Recapture” under the Federal taxation analysis above.
SUPERVISION AND REGULATION
General
The Bank is a federal savings association that is examined and supervised by the Office of Thrift Supervision (“OTS”). The Bank is regulated to a lesser extent by the Federal Deposit Insurance Corporation (“FDIC”), with respect to the insurance of deposit accounts held at the Bank. The Bank is also subject to the regulations of Board of Governors of the Federal Reserve System (“Federal Reserve”), with respect to reserves required to be maintained against deposits and other matters. This regulation and supervision establishes a comprehensive framework for the types of permissible activities in which an institution may engage and is intended primarily for the protection of the Deposit Insurance Fund, which is administered by the FDIC for the benefit of the Bank’s depositors. Under this system of federal regulation, financial institutions are periodically examined to ensure that they satisfy applicable standards with respect to their capital adequacy, assets, management, earnings, liquidity and sensitivity to market interest rates. Following completion of its examination, the primary federal agency of an institution critiques the institution’s operations and assigns its rating (known as an institution’s CAMELS rating). As the Bank’s primary regulator, the OTS examines the Bank and prepares reports of examination with respect to any operating deficiencies. Under federal law, an institution may not disclose its CAMELS rating to the public. The Bank also is a member of and owns stock in the Federal Home Loan Bank of New York, which is one of the 12 regional banks in the Federal Home Loan Bank System. The Bank’s relationship with its depositors and borrowers is regulated to a great extent by both federal and state laws, e.g., with respect to matters concerning the ownership of deposit accounts and laws that govern the form and content of the Bank’s mortgage documents.
25
Any change in these laws or regulations, whether by the FDIC, OTS, Federal Reserve or the United States Congress, could have a material adverse impact on the Company and the Bank and their operations.
On July 21, 2010, the President signed the Dodd-Frank Wall Street Reform and Consumer Protect Act (“Dodd-Frank Act”) into law. Among other things, the Dodd-Frank Act dramatically impacts the rules governing the provision of consumer financial products and services, and implementation of the many requirements of the new law will require new mandatory and discretionary rulemakings by numerous federal regulatory agencies over the next several years. The Dodd-Frank Act significantly affects the operations of federal savings associations and their holding companies as, among other things, the Dodd-Frank Act: (1) abolishes our primary federal regulator, the OTS, effective 90 days after the transfer of the OTS’s supervisory and other functions to the Federal Reserve, FDIC, and the OCC; (2) creates the Bureau of Consumer Financial Protection, a new independent consumer watchdog agency housed within the Federal Reserve that will have primary rulemaking authority with respect to all federal consumer financial laws; (3) requires that formal capital requirements be imposed on savings and loan holding companies generally commencing July 2015; (4) codifies the “source of strength” doctrine for all depository institution holding companies; (5) grants to the U.S. Department of the Treasury, FDIC and the Federal Reserve broad new powers to seize, close and wind down “too big to fail” financial (including non-bank) institutions in an orderly fashion; (6) establishes a new Financial Stability Oversight Council that is charged with identifying and responding to emerging risks throughout the financial system, composed primarily of federal financial services regulators and chaired by the Secretary of the Treasury Department; (7) adopts new standards and rules for the mortgage industry; (8) adopts new bank, thrift and holding company regulation; (9) permanently increases the standard maximum deposit insurance limit to $250,000 per depositor, per institution for each account ownership category; (10) temporarily provides for unlimited deposit insurance coverage for “noninterest-bearing transaction accounts;” (11) repeals the long-standing statutory prohibition on the payment of interest on demand deposits including commercial transaction accounts; (12) adopts new federal regulation of the derivatives market; (13) adopts the so-called Volcker Rule, which substantially restricts proprietary trading by depository institutions and their holding companies; (14) imposes requirements for “funeral plans” by large, complex financial companies; (15) establishes new regulation of the asset securitization market through “skin in the game” and enhanced disclosure requirements; (16) establishes new regulation of interchange fees; (17) establishes new and enhanced compensation and corporate governance oversight for the financial services industry; (18) provides enhanced oversight of municipal securities; (19) provides a specific framework for payment, clearing and settlement regulation; (20) tasks the federal banking agencies with adopting new and enhanced capital standards for all depository institutions; and (21) significantly narrows the scope of federal preemption for national banks and federal savings associations.
Many of the provisions of the Dodd-Frank Act affecting the Company and Bank have effective dates ranging from immediately upon enactment of the legislation to several years following enactment. Given that many of the new laws mandated by the Dodd-Frank Act which affect the Company and Bank are not yet effective at this time and much of the details and substance of such new laws will be shaped through the rulemaking process, the full impact of the Dodd-Frank Act on the business and operations of the Company and Bank currently cannot be fully assessed. For example, the Dodd-Frank Act repealed the federal prohibition on the payment of interest on demand deposits, thereby permitting depository institutions to pay interest on business transaction and other accounts beginning July 21, 2011. The ultimate impact of this change in law on the operations of the Company and Bank has not yet been determined. Additionally, the Dodd-Frank Act provides that the functions of the OTS in regard to the Company and Bank will formally be transferred to the FRB and the OCC respectively on July 21, 2011. The Federal Reserve has indicated its intent to apply certain parts of its current consolidated supervisory program for bank holding companies (including significantly enhanced reporting requirements) to savings and loan holding companies after assuming supervisory responsibility for savings and loan holding companies on the transfer date. Accordingly, we may see changes in the way we are supervised and examined sooner, and may experience operational challenges in the course of transition to our new regulators.
26
Like all other financial institutions and in particular, community thrift organizations, the Company and Bank are continuing to closely monitor developments and is currently evaluating the potential impact of the Dodd-Frank Act on our business, financial condition, results of operations and prospects and expect that some provisions of the new law may have adverse effects on us, such as the cost of complying with the numerous new regulations and reporting requirements mandated by the Dodd-Frank Act.
The following discussion summarizes material laws and regulations applicable to the Bank, Company and BFS Bancorp, MHC. It is not intended to be a comprehensive explanation of all applicable laws and regulations and is qualified in its entirety by reference to the actual laws and regulations involved.
Regulation of Federal Savings Associations
Business Activities. A federal savings association derives its lending and investment powers from the Home Owners’ Loan Act, as amended (“HOLA”), and the implementing regulations of the OTS. Under these laws and regulations, the Bank may originate mortgage loans secured by residential and commercial real estate, commercial business and consumer loans, and it may invest in certain types of debt securities and certain other assets. Certain types of lending, such as commercial and consumer loans, are subject to an aggregate limit calculated as a specified percentage of the Bank’s capital assets. The Bank also may establish subsidiaries that may engage in activities not otherwise permissible for the Bank, including real estate investment and securities and insurance brokerage.
As noted above, the Dodd-Frank Act authorizes depository institutions to pay interest on business transaction accounts, effective July 21, 2011, prior to which payment of interest on such accounts was prohibited.
Capital Requirements. OTS regulations require savings associations such as the Bank to meet three minimum capital standards:
(1) a tangible capital ratio requirement of 1.5% of total assets, as adjusted under the OTS regulations;
(2) a leverage ratio requirement of 4.0% of core capital to such adjusted total assets (3.0% if a savings association has been assigned the highest composite rating of 1 under the Uniform Financial Institutions Rating System); and
(3) a risk-based capital ratio requirement of 8.0% of core and supplementary capital to total risk-based assets, provided that the amount of supplementary capital used to satisfy this requirement shall not exceed the amount of core capital.
The risk-based capital standard for savings associations requires the maintenance of Tier 1 (core) and total capital (which is defined as core capital and supplementary capital) to risk-weighted assets of at least 4% and 8%, respectively. In determining the amount of risk-weighted assets, all assets, including certain off-balance sheet assets, are multiplied by a risk-weight factor of 0% to 100% assigned by the OTS based on the risks believed inherent in the type of asset. Core capital is defined to include common stockholders’ equity (including retained earnings), certain noncumulative perpetual preferred stock, certain accounts and deposits and related surplus and minority interests in equity accounts of consolidated subsidiaries, less goodwill, certain credit-enhancing credit only strips, certain deferred tax assets and intangibles other than certain servicing assets and credit card relationships. The components of Tier2 (supplementary) capital currently include cumulative preferred stock, long-term perpetual preferred stock, mandatory convertible securities, subordinated debt and intermediate preferred stock, the allowance for loan and lease losses limited to a maximum of 1.25% of risk-weighted assets and up to 45% of net unrealized gains on available-for-sale equity securities with readily determinable fair market values. Overall, the amount of supplementary capital included as part of total capital cannot exceed 100% of core capital.
Loans to One Borrower. A federal savings association generally may not make a loan or extend credit to a single or related group of borrowers in excess of 15% of its unimpaired capital and surplus. An additional amount may be loaned, equal to 10% of the Bank’s unimpaired capital and surplus, if the loan is secured by readily marketable collateral, which generally does not include real estate. As of September 30, 2010, the Bank was in compliance with the loans-to-one borrower limitations.
27
Qualified Thrift Lender Test. As a federal savings association, the Bank is subject to a qualified thrift lender, or “QTL,” test. Under the QTL test, the Bank must maintain at least 65% of its “portfolio assets” in “qualified thrift investments” in at least nine months of the most recent 12-month period. “Portfolio assets” means, in general, the Bank’s total assets less the sum of:
|
|
●
|
specified liquid assets up to 20% of total assets;
|
|
|
●
|
goodwill and other intangible assets; and
|
|
|
●
|
the value of property used to conduct the Bank’s business.
|
“Qualified thrift investments” includes various types of loans made for residential and housing purposes, investments related to those purposes, including certain mortgage-backed and related securities, and loans for personal, family, household and certain other purposes up to a limit of 20% of portfolio assets. “Qualified thrift investments” also include 100% of an institution’s credit card loans, education loans and small business loans. The Bank also may satisfy the QTL test by qualifying as a “domestic building and loan association” as defined in the Internal Revenue Code.
A savings association that fails the QTL test must operate under specified restrictions. As provided under the Dodd-Frank Act, noncompliance with the QTL test would trigger dividend restrictions on the savings association and a potential enforcement action by the OTS for a violation of law.
At September 30, 2010, the Bank maintained substantially all of its portfolio assets in qualified thrift investments and in each of the prior 12 months, and therefore is a “qualified thrift lender.”
Capital Distributions. OTS regulations govern capital distributions by a federal savings association, which include cash dividends, stock repurchases and other transactions charged to the capital account. A savings association must file an application for approval of a capital distribution if:
|
|
●
|
the total capital distributions for the applicable calendar year exceed the sum of the association’s net income for that year to date plus the association’s retained net income for the preceding two years;
|
|
|
●
|
the association would not be at least adequately capitalized following the distribution;
|
|
|
●
|
the distribution would violate any applicable statute, regulation, agreement or OTS-imposed condition; or
|
|
|
●
|
the association is not eligible for expedited treatment of its filings.
|
Even if an application is not otherwise required, every savings association that is a subsidiary of a holding company must still file a notice with the OTS at least 30 days before the board of directors declares a dividend or approves a capital distribution.
The OTS may disapprove a notice or application if:
|
|
●
|
the association would be undercapitalized following the distribution;
|
|
|
●
|
the proposed capital distribution raises safety and soundness concerns; or
|
|
|
●
|
the capital distribution would violate a prohibition contained in any statute, regulation or agreement.
|
In addition, the Federal Deposit Insurance Act provides that an insured depository institution shall not make any capital distribution, if after making the distribution the institution would be undercapitalized.
28
Liquidity. OTS regulations require a federal savings association is required to maintain a sufficient amount of liquid assets to ensure its safe and sound operation.
Community Reinvestment Act. All savings associations have a responsibility under the Community Reinvestment Act (“CRA”) and related regulations of the OTS to help meet the credit needs of their communities, including low- and moderate-income neighborhoods. The CRA does not establish specific lending requirements or programs for the Bank, nor does it limit the Bank’s discretion to develop the types of products and services that it believes are best suited to its particular community, consistent with the CRA. Rather, the CRA requires the OTS, in connection with its examination of the Bank, to assess the association’s record of meeting the credit needs of its community and to take such record into account in its evaluation of certain applications by the Bank. An association’s failure to comply with the provisions of the CRA could result in denial of certain corporate applications, such as branches or mergers, or restrictions on its activities.
The CRA also requires all institutions to publicly disclose their CRA ratings. The Bank received a CRA rating of “satisfactory” in its most recent federal examination.
Consumer Protection and Other Laws and Regulations. The Bank is subject to various laws and regulations dealing generally with consumer protection matters. The Bank may be subject to potential liability under these laws and regulations for material violations, in the form of litigation by governmental and consumer groups, as well as enforcement actions by the OTS and other federal regulatory agencies including the Department of Justice. The Bank’s lending operations are subject to federal laws applicable to credit transactions, such as the:
|
|
●
|
Federal Truth In Lending Act, governing disclosures of credit terms for open-end and closed-end loan products to consumer borrowers;
|
|
|
●
|
Home Mortgage Disclosure Act of 1975, requiring financial institutions to provide information to enable the public to determine whether a financial institution is fulfilling its obligation to help meet the housing needs of the community it serves;
|
|
|
●
|
Equal Credit Opportunity Act, prohibiting discrimination on the basis of race, creed or other prohibited factors in extending credit;
|
|
|
●
|
Fair Credit Reporting Act of 1978, as amended by the Fair and Accurate Credit Transactions Act, governing the use and provision of information to credit reporting agencies, certain identity theft protections and certain credit and other disclosures;
|
|
|
●
|
Fair Debt Collection Act, governing the manner in which consumer debts may be collected by collection agencies;
|
|
|
●
|
Servicemembers’ Civil Relief Act, providing certain protections to members of the armed forces while in active military service;
|
|
|
●
|
Real Estate Settlement Procedures Act, governing disclosures of fee estimates that would be incurred by a borrower during the mortgage process; and
|
|
|
●
|
Rules and regulations of the various federal agencies charged with the responsibility of implementing these federal laws.
|
The Bank’s deposit operations are subject to federal laws applicable to deposit transactions, such as the:
|
|
●
|
Truth in Savings Act, which imposes disclosure obligations to enable consumers to make informed decisions about their deposit accounts at depository institutions;
|
29
|
|
●
|
Electronic Funds Transfer Act, which governs automatic deposits to and withdrawals from deposit accounts and customers’ rights and liabilities arising from the use of automated teller machines and other electronic banking services;
|
|
|
●
|
Right to Financial Privacy Act, which imposes a duty to maintain confidentiality of consumer financial records and prescribes procedures for complying with administrative subpoenas of financial records; and
|
|
|
●
|
Rules and regulations of the various federal agencies charged with the responsibility of implementing these federal laws.
|
Transactions with Related Parties. A federal savings association’s authority to engage in transactions with its “affiliates” is limited by Sections 23A and 23B of the Federal Reserve Act and its implementing regulations. The term “affiliates” for these purposes generally means any company that controls, is controlled by, or is under common control with an institution. The Company is an affiliate of the Bank. In general, transactions with affiliates must be on terms that are as favorable to the association as comparable transactions with non-affiliates. In addition, certain types of these transactions are restricted to an aggregate percentage of the association’s capital. Collateral in specified amounts must usually be provided by affiliates in order to receive loans from the association. In addition, OTS regulations prohibit a savings association from lending to any of its affiliates that are engaged in activities that are not permissible for bank holding companies and from purchasing the securities of any affiliate, other than the shares of a subsidiary.
The Bank’s authority to extend credit to its directors, executive officers and 10% shareholders (“Insiders”), as well as to entities controlled by insiders, is currently governed by the requirements of Sections 22(g) and 22(h) of the Federal Reserve Act and Regulation O of the Board of Governors of the Federal Reserve System. Among other things, these provisions generally require that extensions of credit to Insiders (i) be made on terms that are substantially the same as, and follow credit underwriting procedures that are not less stringent than, those prevailing for comparable transactions with unaffiliated persons and that do not involve more than the normal risk of repayment or present other unfavorable features, and (ii) not exceed certain limitations on the amount of credit extended to Insiders, individually and in the aggregate, which limits are based, in part, on the amount of the Bank’s capital. In addition, the Bank’s board of directors must approve extensions of credit in excess of certain limits.
Enforcement. The OTS has primary enforcement responsibility over federal savings associations and has the authority to bring enforcement action against all “institution-affiliated parties,” including stockholders, attorneys, appraisers and accountants who knowingly or recklessly participate in wrongful action likely to have an adverse effect on an insured institution. Formal enforcement action may range from the issuance of a capital directive or cease and desist order to prohibition or removal of officers and/or directors of the institution, receivership, conservatorship or the termination of deposit insurance. Civil money penalties cover a wide range of violations and actions, and can range up to $1.375 million per day for findings of knowing or reckless conduct that results in a substantial loss to the savings associations or a substantial pecuniary gain or other benefit to such party by reason of a violation of law, unsafe or unsound practice, or breach of fiduciary duty. The FDIC also has the authority to recommend to the Director of the OTS that enforcement action be taken with respect to a particular savings association. If the Director does not take action, the FDIC has authority to take action under specified circumstances.
As noted above, on July 21, 2011, as a result of regulatory restructuring called for by the Dodd-Frank Act, the supervisory and rulemaking (except with respect to consumer protection laws) functions of the OTS pertaining to all federal savings associations will formally be transferred to the OCC, and the OTS will be abolished 90 days thereafter.
Standards for Safety and Soundness. Federal law requires each federal banking agency to prescribe certain standards for all insured depository institutions. These standards relate to, among other things, internal controls, information systems and audit systems, loan documentation, credit underwriting, interest rate risk exposure, asset growth, compensation, and other operational and managerial standards as the agency deems appropriate. The federal banking agencies adopted Interagency Guidelines Establishing Standards for Safety and Soundness to implement the safety and soundness standards required under federal law. The guidelines set forth the safety and soundness standards that the federal banking agencies use to identify and address problems at insured depository institutions before capital becomes impaired. The guidelines address internal controls and information systems, internal audit systems, credit underwriting, loan documentation, interest rate risk exposure, asset growth, compensation, fees and benefits.
30
The OTS has adopted regulations that authorize, but do not require, the OTS to require the submission of a compliance plan from a savings association that has been given notice that it is not satisfying safety and soundness standards. If, after being notified, a savings association fails to submit an acceptable plan or fails in any material respect to implement an accepted plan, the OTS must issue an order directing action to correct the deficiency. Further, the OTS may issue an order directing other actions of the types to which an undercapitalized association is subject under the “prompt corrective action” provisions of federal law. If a savings association fails to comply with such an order, the OTS may seek to enforce the order in judicial proceedings and/or impose civil money penalties.
Prompt Corrective Action Regulations. Under the “prompt corrective action regulations” of the OTS the agency is required to take certain, and is authorized to take other, supervisory actions against undercapitalized savings associations. For this purpose, a savings association is placed in one of the following five categories based on the association’s capital:
|
|
●
|
well-capitalized (at least 5% leverage capital, 6% Tier 1 risk-based capital and 10% total risk-based capital);
|
|
|
●
|
adequately capitalized (at least 4% leverage capital (or at least 3% for associations receiving the highest CAMELS rating), 4% Tier 1 risk-based capital and 8% total risk-based capital);
|
|
|
●
|
undercapitalized (less than 4% leverage capital (or less than 3% for associations receiving the highest CAMELS rating) , 4% Tier 1 risk-based capital and 8% total risk-based capital);
|
|
|
●
|
significantly undercapitalized (less than 3% leverage capital, 3% Tier 1 risk-based capital and 6% total risk-based capital); and
|
|
|
●
|
critically undercapitalized (less than 2% tangible capital).
|
Generally, the OTS is required by law to appoint a receiver or conservator for a federal savings association within a specific time frame from when the association becomes “critically undercapitalized.” The OTS regulations provide that a capital restoration plan must be filed with the OTS within 45 days of the date an association receives notice that it is “undercapitalized,” “significantly undercapitalized” or “critically undercapitalized,” the performance of which must be guaranteed by any company controlling the association up to specified limits. In addition, numerous mandatory supervisory actions become immediately applicable to the association, including, but not limited to, restrictions on growth, investment activities, capital distributions and affiliate transactions. The OTS may also take any one of a number of discretionary supervisory actions against undercapitalized associations, including the issuance of a capital directive and the replacement of senior executive officers and directors.
Insurance of Deposit Accounts. The Bank is a member of, and pays deposit assessments to, the Deposit Insurance Fund (“DIF”) which is administered by the FDIC. As a result of such membership, all deposit accounts held at the Bank are insured up to $250,000 per depositor, per institution for each account ownership category. This standard maximum deposit insurance coverage was raised from $100,000 first on a temporary basis under the Emergency Economic Stabilization Act of 2008 and then made permanent under the Dodd-Frank Act. In order to maintain the DIF, member institutions are assessed an insurance premium. The amount of each institution’s premium has historically generally been based on the balance of insured deposits and the degree of risk the institution poses to the DIF.
31
On December 31, 2009, along with each institution’s risk-based deposit insurance assessment for the third quarter of 2009, all non-exempt insured depository institutions were required to prepay their quarterly risk-based assessments for the fourth quarter of 2009, and for all of 2010, 2011 and 2012. For purposes of calculating the prepaid amount, the base assessment rate in effect at September 30, 2009 was used for 2010. That rate is to be increased by an annualized 3 basis points for 2011 and 2012 assessments. The prepayment calculation also assumes a five percent annual deposit growth rate, increased quarterly, through the end of 2012. As provided for in the final rule implementing the prepaid assessment requirement, institutions accounted for the prepayment by recording the entire amount of its prepaid assessment as a prepaid expense (an asset) as of December 31, 2009. Subsequently, each institution will record an expense (charge to earnings) for its regular quarterly assessment and an offsetting credit to the prepaid assessment until the asset is exhausted. Once the asset is exhausted, the institution will resume paying and accounting for quarterly deposit insurance assessments as they would normally. Under the final rule, the FDIC stated that its requirement for prepaid assessments does not preclude the FDIC from changing assessment rates or from further revising the risk-based assessment system in future years, pursuant to notice-and-comment rulemaking procedures provided by statute. Therefore, continued actions by the FDIC could significantly increase the Bank’s noninterest expense in fiscal 2011 and for the foreseeable future.
The Dodd-Frank Act extended the FDIC’s provision of unlimited deposit insurance on non-interest bearing transaction accounts (subject to a modified definition for eligible accounts) through December 31, 2012. The FDIC charges the insured financial institutions premiums to maintain the Deposit Insurance Fund; no institution may pay a dividend if in default of its FDIC assessment.
On February 7, 2011, the FDIC Board approved a final rule that implements a new deposit insurance assessment system for insured depository institutions, including a new pricing structure for institutions with more than $10 billion in assets. The new assessment structure modifies an institution’s current deposit insurance assessment base from adjusted domestic deposits to an institution’s average consolidated total assets minus average tangible equity, as required by the Dodd-Frank Act. Pursuant to the final rule, Tier 1 capital is used as the measure for tangible equity. Depository institutions with less than $1 billion in assets will report average weekly balances during the calendar quarter, unless they elect to report daily averages. The new assessment base is larger than the former base and includes revisions to the total base assessment rate schedule by lowering assessment rates, after adjustments, to a range between 2.5 and 9 basis points for depository institutions in the lowest risk category, and 30 to 45 basis points for institutions in the highest risk category. The various adjustments incorporated into the schedule take into account the heightened risk with respect to certain types of funding such as unsecured debt and brokered deposits. The final rule eliminated the secured liability adjustment and includes a new adjustment requirement for long-term debt held by an insured depository institution where the debt is issued by another insured depository institution.
The new deposit insurance assessment base changes generally took effect on April 1, 2011 and will be reflected in the June 30, 2011 fund balance and the invoices for assessments due September 30, 2011. The Company and Bank are currently evaluating the impact that the new assessment base final rule will have on our financial position and results of operations. While the final rule is expected to have a positive effect on small institutions (those with less than $10 billion in assets) given that, in the aggregate, the large bulk of such institutions are expected to see a decrease in assessments, the impact of the final rule, and/or additional FDIC special assessments or other regulatory changes affecting the financial services industry could negatively affect the Company’s liquidity and financial results in future periods.
The FDIC has authority to increase insurance assessments. A significant increase in insured premiums would likely have an adverse effect on the operating expenses and results of operations of the Bank. Management cannot predict what insurance assessment rates will be in the future.
Insurance of deposits may be terminated by the FDIC upon a finding that an institution has engaged in unsafe or unsound practices, is in an unsafe or unsound condition to continue operations or has violated any applicable law, regulation, rule, order or condition imposed by the FDIC. We do not currently know of any practice, condition or violation that may lead to termination of our deposit insurance.
In addition to the FDIC assessments, the Financing Corporation (“FICO”) is authorized to impose and collect, with the approval of the FDIC, assessments for anticipated payments, issuance costs and custodial fees on bonds issued by FICO in the 1980s to recapitalize the former Federal Savings and Loan Insurance Corporation. The bonds issued by FICO are due to mature in 2017 through 2019. For the quarter ended September 30, 2010, the annualized FICO assessment was equal to 1.02 basis points for each $100 in domestic deposits maintained at an institution. Assessments related to the FICO bond obligations were not subject to the prepayment requirements described above.
32
Reserve Requirements. Under the Federal Reserve Act and the Federal Reserve’s regulations, the Bank is required to maintain reserves against its transaction accounts (primarily negotiable order of withdrawal (“NOW”) and regular checking accounts). The regulations exempt the first $10.7 million of otherwise reservable balances from the reserve requirements. A 3% reserve is required for transaction account balances over $10.7 million and up to $58.8 million. Transaction account balances over $58.8 million are subject to a reserve requirement of approximately $1.44 million plus 10% of any amount over $58.8 million. The Bank is in compliance with the foregoing reserve requirements. Because required reserves must be maintained in the form of vault cash, a noninterest-bearing account at a Federal Reserve Bank, or a pass-through account as defined by the Federal Reserve, the effect of this reserve requirement is to reduce the Bank’s interest-earning assets. The balances maintained to meet the reserve requirements imposed by the Federal Reserve may be used to satisfy liquidity requirements imposed by the OTS. At September 30, 2010, the Bank was in compliance with these reserve requirements.
Prohibitions Against Tying Arrangements. Federal savings associations are prohibited, subject to some exceptions, from extending credit to or offering any other service, or fixing or varying the consideration for an extension of credit or service, on the condition that the customer obtain some additional service from the association or its affiliates or not obtain services of a competitor of the association.
Privacy Provisions. The Bank has a privacy policy in place and is required to disclose its privacy policy, which includes identifying parties with whom it shares a customer’s “non-public personal information,” to customers at the time of establishing the customer relationship and annually thereafter. The Bank is required to provide its customers with the ability to “opt-out” of having their personal information shared with unaffiliated third parties except under limited circumstances, such as the processing of transactions requested by the consumer or when the financial institution is jointly sponsoring a product or service with a nonaffiliated third party. Additionally, financial institutions generally may not disclose consumer account numbers to any nonaffiliated third party for use in telemarketing, direct mail marketing or other marketing to consumers.
Affiliate Marketing. The federal banking agencies, including the OTS, have issued a joint rule implementing Section 214 of the Fair and Accurate Credit Transactions Act of 2003, or the “FACT Act,” which provides consumers with the ability to restrict companies from using certain information obtained from affiliates to make marketing solicitations. In general, a person is prohibited from using information received from an affiliate to make a solicitation for marketing purposes to a consumer, unless the consumer is given notice and had a reasonable opportunity to opt out of such solicitations. The rule permits opt-out notices to be given by any affiliate that has a preexisting business relationship with the consumer and permits a joint notice from two or more affiliates. Moreover, such notice would not be applicable to the company using the information if it has a pre-existing business relationship with the consumer. The notice that is required under the FACT Act may be combined with other required disclosures to be provided under other provisions of law, including notices required under the privacy provisions of the Gramm-Leach-Bliley Act.
Federal Home Loan Bank System. The Bank is a member of the Federal Home Loan Bank System, which consists of 12 regional Federal Home Loan Banks. The Federal Home Loan Bank System provides a central credit facility primarily for member institutions. As a member of the Federal Home Loan Bank of New York, the Bank is required to acquire and hold a certain minimum number of shares of capital stock in the Federal Home Loan Bank. As of September 30, 2010, the Bank was in compliance with this requirement.
The USA PATRIOT Act
The Bank and Company are subject to the Bank Secrecy Act, as amended by the Uniting and Strengthening America by Providing Appropriate Tools Required to Intercept and Obstruct Terrorism Act (“USA PATRIOT Act”), which gives the federal government powers to address money laundering and terrorist threats through enhanced domestic security measures, expanded surveillance powers, and mandatory transaction reporting obligations.
33
Title III of the USA PATRIOT Act takes measures intended to encourage information sharing among financial institutions, bank regulatory agencies and law enforcement bodies. Further, certain provisions of Title III impose affirmative obligations on a broad range of financial institutions, including banks, thrifts, brokers, dealers, credit unions, money transfer agents and parties registered under the Commodity Exchange Act. Among other requirements, the USA PATRIOT Act imposes the following obligations on financial institutions:
|
|
●
|
financial institutions must establish an anti-money laundering program that includes, at a minimum: (i) internal policies, procedures, and controls designed to detect and prevent money laundering activities, (ii) specific designation of an anti-money laundering compliance officer, (iii) ongoing employee training programs, and (iv) an independent audit function to test the anti-money laundering program;
|
|
|
●
|
financial institutions must establish and meet minimum standards for customer due diligence, identification and verification;
|
|
|
●
|
financial institutions that establish, maintain, administer, or manage private banking accounts or correspondent accounts in the United States for non-United States persons or their representatives (including foreign individuals visiting the United States) must establish appropriate, specific and, where necessary, enhanced due diligence policies, procedures, and controls to detect and report instances of money laundering through those accounts;
|
|
|
●
|
financial institutions are prohibited from establishing, maintaining, administering or managing correspondent accounts for foreign shell banks (foreign banks that do not have a physical presence in any country) and are subject to certain recordkeeping obligations with respect to correspondent accounts of foreign banks; and
|
|
|
●
|
bank regulators are directed to consider a bank’s or holding company’s effectiveness in combating money laundering when ruling on Federal Reserve Act and Bank Merger Act applications.
|
The Office of Foreign Assets Control (“OFAC”), which is a division of the U.S. Department of the Treasury (“Treasury”), is responsible for helping to ensure that United States entities do not engage in transactions with “enemies” of the United States, as defined by various Executive Orders and Acts of Congress. The Bank and the Company, like all United States companies and individuals, are prohibited from transacting business with the individuals and entities named on OFAC’s list of Specially Designated Nationals and Blocked Persons. If the Bank finds a name on any transaction account or wire transfer that is on an OFAC list, the Bank is required to investigate, and if the match is confirmed, the Bank must take additional actions including freezing such account, filing a suspicious activity report and notifying the FBI. Failure to comply may result in fines and other penalties. OFAC has issued guidance directed at financial institutions in which it asserted that it may, in its discretion, examine institutions determined to be high-risk or to be lacking in their efforts to comply with these prohibitions.
The USA PATRIOT Act also requires the federal banking agencies to take into consideration the effectiveness of controls designed to combat money laundering activities in determining whether to approve a merger or other acquisition application of a member institution. Accordingly, if we engage in a merger or other acquisition, our controls designed to combat money laundering would be considered as part of the application process. We have established policies, procedures and systems designed to comply with these regulations.
Holding Company Regulation
General. BFS Bancorp, MHC and the Company are non-diversified savings and loan holding companies within the meaning of the HOLA. Accordingly, BFS Bancorp, MHC and the Company are registered with the OTS and are subject to OTS’ regulations, examinations, supervision and reporting requirements. In addition, the OTS has enforcement authority over the Company and BFS Bancorp, MHC, and their subsidiaries. Among other things, this authority permits the OTS to restrict or prohibit activities that are determined to be a serious risk to the subsidiary savings institution.
As noted above, on July 21, 2011, as a result of regulatory restructuring called for by the Dodd-Frank Act, the supervisory and rulemaking functions of the OTS pertaining to all savings and loan holding companies and their non-institution subsidiaries will formally be transferred to the Federal Reserve, and the OTS will be abolished 90 days thereafter.
34
Federal law prohibits a savings and loan holding company, directly or indirectly, or through one or more subsidiaries, from acquiring “control” (as defined under OTS Regulations) of another savings association or holding company thereof, without prior written approval of the OTS. It also prohibits the acquisition or retention of, with specified exceptions, more than 5% of the equity securities of a company engaged in activities that are not closely related to banking or financial in nature or acquiring or retaining control of an institution that is not federally insured. In evaluating applications by holding companies to acquire savings associations, the OTS must consider the financial and managerial resources and future prospects of the savings association involved, the effect of the acquisition on the risk to the insurance fund, the convenience and needs of the community and competitive factors.
Capital. Savings and loan holding companies are not currently subject to specific regulatory capital requirements. The Dodd-Frank Act, however, requires the Federal Reserve to promulgate consolidated capital requirements for depository institution holding companies that are not less stringent, both quantitatively and in terms of components of capital, than those applicable to institutions themselves. Accordingly, such mandate eliminates the inclusion of certain instruments, such as trust preferred securities, from Tier 1 holding company capital. Instruments issued by mutual holding companies before May 19, 2010 are grandfathered. There is a five year transition period from the July 21, 2010 date of enactment of the Dodd-Frank Act before the consolidated capital requirements will apply to savings and loan holding companies.
Source of Strength. The Dodd-Frank Act also extends the Federal Reserve “source of strength” doctrine to savings and loan holding companies. Such policy requires holding companies to act as a source of financial strength to their subsidiary depository institutions by providing capital, liquidity and other support in times of an institution’s financial distress. The regulatory agencies must issue joint regulations implementing this policy.
Waivers of Dividends by BFS Bancorp, MHC. OTS regulations allow federally chartered mutual holding companies to waive dividends without taking into account the amount of waived dividends in determining an appropriate exchange ratio in the event of a conversion of a mutual holding company to stock form. However, under the Dodd-Frank Act, the powers and duties of the OTS relating to mutual holding companies will be transferred to the Federal Reserve, and the OTS will be eliminated. Accordingly, the Federal Reserve will become the new regulator of the Company and BFS Bancorp, MHC. The Dodd-Frank Act provides that a mutual holding company will be required to give the Federal Reserve notice before waiving the receipt of dividends, and sets forth the standards for granting a waiver. The Dodd-Frank Act further provides that the Federal Reserve shall consider waived dividends in determining an appropriate exchange ratio in the event of a full conversion of the mutual holding company to stock form, except that the Federal Reserve may not consider waived dividends in determining an appropriate exchange ratio in a conversion to stock form by any federal mutual holding company that has waived dividends prior to December 1, 2009. There can be no assurance that the Federal Reserve would approve waivers in the future or predictions as to what conditions, if any, the Federal Reserve would place on future dividend waiver, if approved.
Conversion of BFS Bancorp, MHC to Stock Form. The OTS regulations permit BFS Bancorp, MHC to convert from the mutual form of organization to the capital stock form of organization (a “Conversion Transaction”). There can be no assurance when, if ever, a Conversion Transaction will occur, and the board of directors of BFS Bancorp, MHC currently has no intention or plan to undertake a Conversion Transaction. In the event of a Conversion Transaction, a new holding company would be formed as the successor to the Company (the “New Holding Company”), BFS Bancorp, MHC’s corporate existence would end, and certain depositors of the Bank would receive the right to subscribe for additional shares of the New Holding Company. In a Conversion Transaction, each share of common stock held by stockholders other than BFS Bancorp, MHC (“Minority Stockholders”) would be automatically converted into a number of shares of common stock of the New Holding Company determined pursuant to an exchange ratio that ensures that Minority Stockholders own the same percentage of common stock in the New Holding Company as they owned in the Company immediately prior to the Conversion Transaction. Under OTS regulations, Minority Stockholders would not be diluted because of any dividends waived by BFS Bancorp, MHC (and waived dividends would not be considered in determining an appropriate exchange ratio), in the event BFS Bancorp, MHC converts to stock form. The Dodd-Frank Act addresses exchange ratios and waived dividends, as discussed in the preceding paragraph. The total number of shares held by Minority Stockholders after a Conversion Transaction also would be increased by any purchases by Minority Stockholders in the stock offering conducted as part of the Conversion Transaction.
35
Effect of Governmental Monetary Polices
Our earnings are affected by domestic economic conditions and the monetary and fiscal policies of the United States government and its agencies. The Federal Reserve has, and is likely to continue to have, an important impact on the operating results of financial institutions through its power to implement national monetary policy, among other things, in order to curb inflation or combat a recession. The Federal Reserve affects the levels of bank loans, investments and deposits through its control over the issuance of United States government securities, its regulation of the discount rate applicable to member banks and its influence over reserve requirements to which member banks are subject. We cannot predict the nature or impact of future changes in monetary and fiscal policies.
Federal Securities Laws
Shares of our common stock are registered with the SEC under Section 12(b) of the Securities Exchange Act of 1934, as amended (the “Exchange Act”). We are also subject to the proxy rules, tender offer rules, insider trading restrictions, annual and periodic reporting, and other requirements of the Exchange Act.
Sarbanes-Oxley Act of 2002
The Sarbanes-Oxley Act of 2002 was enacted in response to public concerns regarding corporate accountability in connection with certain accounting scandals. The stated goals of the Sarbanes-Oxley Act are to increase corporate responsibility, to provide for enhanced penalties for accounting and auditing improprieties at publicly traded companies, and to protect investors by improving the accuracy and reliability of corporate disclosures pursuant to the securities laws. The Sarbanes-Oxley Act generally applies to all companies that file or are required to file periodic reports with the SEC, under the Securities Exchange Act of 1934.
The Sarbanes-Oxley Act includes specific additional disclosure requirements, requires the SEC and national securities exchanges to adopt extensive additional disclosure, corporate governance and other related rules, and mandates further studies of certain issues by the SEC. The Sarbanes-Oxley Act represents significant Federal involvement in matters traditionally left to state regulatory systems, such as the regulation of the accounting profession, and to state corporate law, such as the relationship between a board of directors and management and between a board of directors and its committees.
We have incurred and anticipate that we will continue to incur additional expense in complying with the provisions of the Sarbanes-Oxley Act and the regulations that have been promulgated to implement the Sarbanes-Oxley Act, particularly those regulations relating to the establishment of internal controls over financial reporting.
Item 1A. Risk Factors
We Have Stipulated To Cease And Desist Orders With The OTS. These Orders Will Significantly Restrict Our Operations. The Failure To Comply With These Orders Can Result In Significant Penalties.
Effective March 31, 2011, the Company, BFS Bancorp, MHC and the Bank, consented to the issuance of Cease and Desist Orders from the OTS. The Orders provide, among other things, that within specified time frames:
|
|
●
|
the Bank must obtain and maintain a Tier 1 Capital Ratio equal to or greater than 10% and a Total Risk-Based Capital Ratio equal to or greater than 15% (the “Minimum Capital Levels”), after the funding of its allowance for loan and lease losses;
|
|
|
●
|
the Bank must submit for review and approval by the OTS a written capital plan to maintain the Bank’s Minimum Capital Levels;
|
|
|
●
|
the Bank must submit a contingency plan for review and approval by the OTS if it fails to meet the Minimum Capital Levels, or comply with the terms of the capital plan, or is otherwise requested by the OTS to submit the contingency plan, which contingency plan would require the Bank to merge with, or be acquired by another federally insured depository institution or voluntarily liquidate;
|
36
|
|
●
|
the Bank must submit for review and approval by the OTS an updated business plan to improve the Bank’s core earnings, reduce expenses, maintain appropriate levels of liquidity and achieve profitability on a consistent basis and submit quarterly reports to the OTS regarding compliance with the plan;
|
|
|
●
|
the Bank must revise its current liquidity and funds management policy to include a contingency funding plan that will identify alternative funding sources, establish appropriate lines of credit, and retain investment securities and other liquid assets at the Bank;
|
|
|
●
|
the Bank must submit for review and approval by the OTS an updated written program for identifying, monitoring and controlling risks associated with concentrations of credit and submit quarterly reports to the OTS regarding compliance with the program;
|
|
|
●
|
the Bank must submit for review and approval by the OTS a plan for enhancing its staffing resources in the loan underwriting/credit administration functions at the Bank;
|
|
|
●
|
the Bank must submit for review and approval by the OTS an updated plan with specific strategies, targets and timeframes to reduce the Bank’s level of problem assets;
|
|
|
●
|
the Bank may not make, invest in or purchase any new commercial real estate loans, and may not extend, refinance or otherwise modify classified or special mention loans, except under certain conditions;
|
|
|
●
|
the Bank must conduct a review and analysis of the management study performed by the independent consultant and shall prepare and submit to the OTS for its review and approval a written management plan that addresses all of the conclusions and recommendations noted in that management study, including a plan with specific timeframes to obtain at least three new independent directors for its Board and to retain a new Chief Executive Officer;
|
|
|
●
|
the Bank will not be permitted to increase its total assets during any quarter in excess of an amount equal to the net interest credited on deposit liabilities during the prior quarter, without the prior written non-objection of the OTS;
|
|
|
●
|
the Bank must comply with regulations limiting its ability to accept, renew or roll over brokered deposits;
|
|
|
●
|
the Bank will not be permitted to declare a dividend without the prior written approval of the OTS, and the Company and BFS Bancorp, MHC cannot declare or pay dividends or make any other capital distributions without prior OTS approval;
|
|
|
●
|
the Bank will not be permitted to enter into, renew or modify any contractual arrangement relating to compensation or benefits for any senior executive officers or directors, unless it provides prior written notice of the proposed transaction to the OTS;
|
|
|
●
|
the Bank must submit for review and approval of the OTS a plan to revise its compensation and remuneration of directors and senior executive officers;
|
|
|
●
|
the Bank must comply with regulatory prior notification requirements with respect to changes in directors and senior executive officers;
|
37
|
|
●
|
the Bank must comply with regulatory prior notification requirements before entering into any arrangement or contract with a third party service provider that is significant to the overall operation or financial condition of the Bank, or is outside the Bank’s normal course of business;
|
|
|
●
|
the Company and BFS Bancorp, MHC must submit for review and approval by the OTS a written plan to maintain and enhance the capital of the Company, BFS Bancorp, MHC and the Bank, and to ensure that the Bank complies with the capital requirements imposed by its enforcement order with the OTS; and
|
|
|
●
|
the Company and BFS Bancorp, MHC cannot declare or pay dividends or make any other capital distributions without prior OTS approval.
|
In the event we are in material non-compliance with the terms of such cease and desist orders, the OTS has the authority to subject us to the terms of a more restrictive enforcement order, to impose civil money penalties on us and our directors and officers, and to remove directors and officers from their positions with the Company and the Bank.
An Inability To Improve Our Regulatory Capital Position Could Adversely Affect Our Operations.
At March 31, 2011, the Bank was classified as “adequately capitalized,” and not “well capitalized.” This further restricts our operations beyond restrictions that have been imposed by the cease and desist orders. As a result of our capital levels: (i) our loans to one borrower limit has been reduced, which affects the size of the loans that we can originate and also requires us to sell, participate, or refuse to renew loans that exceed our lower loans to one borrower limit, both of which could negatively impact our earnings; (ii) we cannot renew or accept brokered deposits without prior regulatory approval; (iii) we must obtain prior regulatory approval to undertake any branch expansion activities; and (iv) we will pay higher insurance premiums to the Federal Deposit Insurance Corporation, which will reduce our earnings. We may not be able to raise additional capital or reduce the Bank’s assets on favorable terms. In addition, equity offerings may dilute the holdings of our existing stockholders or reduce the market price of our common stock, or both. Holders of our common stock are not entitled to preemptive rights or other protections against dilution.
We Experienced An Operating Loss During The Year Ended September 30, 2010 And We May Not Return To Profitability In The Future.
We experienced a net loss of $38.9 million for the year ended September 30, 2010. The loss was caused primarily by a significant increase in non-performing assets, which necessitated a provision for loan losses of $42.7 million, compared to a provision of $8.5 million for the year ended September 30, 2009. We charged off $35.5 million of loans during fiscal 2010 (compared to none during fiscal 2009), and non-accrual loans (generally loans 90 days or more past due in principal or interest payments) increased to $71.9 million, or 18.5% of total loans at September 30, 2010, compared to $22.1 million, or 5.1% of total loans at September 30, 2009. In addition, we recognized $11.6 million of other-than-temporary impairment losses on securities during the year ended September 30, 2010, compared to $9.0 million of such losses during the year ended September 30, 2009 (of which $2.9 million was recognized as expenses). We may not be able to generate net income or achieve profitability in the future.
We have had material weaknesses in our internal control over financial reporting that have required remediation. If we fail to maintain an effective system of internal controls, we may not be able to accurately report our financial results or prevent or detect fraud.
Management is responsible for establishing and maintaining adequate internal control over financial reporting. Internal control over financial reporting is a process designed to provide reasonable assurance regarding the reliability of financial reporting and the preparation of financial statements in accordance with U. S. generally accepted accounting principles. Effective internal controls are necessary for us to provide reliable financial reports and effectively prevent or detect fraud. Any inability to provide reliable financial reports or prevent or detect fraud could harm our business. In the second quarter of fiscal year 2010 and as of the end of fiscal year 2010, certain material weaknesses were identified in our internal control over financial reporting related to our determination of our allowance for loan losses, which we have endeavored to remediate. We are continuing to evaluate and, where appropriate, enhance our policies, procedures and internal controls. However, we may in the future discover additional areas of our internal controls that need improvement or that constitute deficiencies or material weaknesses. Our failure to maintain the adequacy of our internal controls, as such standards are modified, supplemented or amended from time to time, could result in material misstatements in our financial statements or failure to prevent or detect fraud. We may be required to incur significant costs in the future to remediate any additional inadequacies or material weaknesses in our internal controls, which could materially adversely impact our results of operations.
38
Our Commercial Real Estate, Multi-Family, Construction and Land Loan Portfolios Have Increased, Increasing the Risk that Some of Our Loans Will Not Be Paid.
Our lending in commercial real estate, construction and land has expanded during the previous five years. Lending in these sectors has increased as a percentage of our total loan portfolio from 47.3% at September 30, 2006 to 64.2% at September 30, 2010. Lending in these sectors generally exposes a lender to greater credit risk than loans secured by residential lending. At September 30, 2010, we had forty three loans for an aggregate of $71.9 million in non-accrual status compared to nine loans for an aggregate of $22.1 million in non-accrual status at September 30, 2009. In addition, our multi-family, commercial real estate and construction loan portfolio is not as seasoned as the loan portfolio of some of our competitors. If the local real estate market or economy continues to weaken, we may continue to experience higher levels of non-performing loans. The Bank agreed with the OTS that the Bank will not originate any commercial real estate loans without prior OTS approval.
We May Experience Increased Costs Of Liquidity In Future Periods As A Result Of Our Current Financial Condition.
In recent periods, we have experienced an increase in non-performing assets, an increase in our allowance for loan losses and an increase in competition in our primary market area, as well as a decrease in interest rates. As a result of the cease and desist orders minimum capital levels requirement the Bank may not accept brokered deposits without prior regulatory approval. Collectively, these factors reduce our liquidity and require us to seek alternative sources of liquidity to fund our operations and, in particular, the origination of new loans, the support of our continued growth and other strategic initiatives. Historically, we have had access to a number of alternative sources of liquidity, but given our financial performance and the recent downturn in the credit and liquidity markets, there is no assurance that we will have access to funding sources or whether terms will be favorable to us. If our funding costs increase, this will impede our growth and will have an adverse effect on our business, financial condition and results of operations.
If Our Non-Performing Loans And Other Non-Performing Assets Increase, Our Earnings Will Decrease.
At September 30, 2010, our non-performing assets (which consist of non-accrual loans, loans 90 days or more delinquent, loans past contractual maturity and still accruing, and real estate owned) totaled $86.2 million, which is an increase of $64.1 million over our non-performing assets at September 30, 2009. Our non-performing assets adversely affect our net income in various ways. We do not record interest income on non-accrual loans, and we must establish reserves for probable losses on non-performing loans. These reserves are established through a current period charge to income in the provision for loan losses. There are also legal fees associated with the resolution of problem assets. Additionally, our real estate owned results in carrying costs such as taxes, insurance and maintenance fees. Further, the resolution of non-performing assets requires the active involvement of management, which can distract us from the overall supervision of operations and other income-producing activities of the Bank. Finally, if our estimate of the allowance for loan losses is inadequate, we will have to increase the allowance accordingly, which is affected by recording a provision for loan losses.
If Economic Conditions Continue to Deteriorate, Particularly in the Metropolitan New York Area, Our Results of Operations and Financial Condition Will Continue to Be Adversely Affected as Borrowers’ Ability to Repay Loans Declines and the Value of the Collateral Securing Our Loans Decreases.
Our financial results have been and will continue to be adversely affected by changes in prevailing economic conditions, particularly in the metropolitan New York area, including decreases in real estate values, changes in interest rates which may cause a decrease in interest rate spreads, adverse employment conditions, the monetary and fiscal policies of the Federal government and other significant external events. At September 30, 2010, loans secured by real estate represented nearly all of our total loans, with substantially all of these loans being made in the New York metropolitan area. Decreases in local real estate values would continue to adversely affect the value of property used as collateral for our loans. Adverse changes in the economy also may have a negative effect on the ability of our borrowers to make timely repayments of their loans, which would have an adverse impact on our earnings.
39
The Current Economic Downturn Coupled With Turmoil and Uncertainty in the Financial Markets May Adversely Impact Our Earnings and Our Ability to Successfully Execute Our Business Plan.
The current economic downturn may adversely impact the financial condition of the households and businesses comprising our loan customers. Such a deteriorating financial condition could arise from loss of employment or business revenue exacerbated by a reduction in the value of real estate collateralizing our customers’ loans. As a consequence, we may continue to experience an increase in nonperforming loans that will negatively impact earnings through reduced collections of interest income coupled with possible increases in the provision for loan losses and associated charge offs. Additionally, our ability to originate new loans in accordance with our business plan goals and objectives may be diminished as a result of these same factors.
If Our Allowance for Loan Losses is Not Sufficient to Cover Actual Loan Losses, Our Earnings Could Decrease.
We make various assumptions and judgments about the collectability of our loan portfolio, including the creditworthiness of our borrowers and the value of the real estate and other assets serving as collateral for the repayment of many of our loans. In determining the amount of the allowance for loan losses, we review our loans and our loss and delinquency experience, and we evaluate economic conditions. If our assumptions are incorrect, our allowance for loan losses may not be sufficient to cover losses inherent in our loan portfolio, resulting in additions to our allowance. Material additions to our allowance would materially decrease our net income.
In addition, bank regulators periodically review our allowance for loan losses and may require us to increase our provision for loan losses or recognize further loan charge-offs. Any increase in our allowance for loan losses or loan charge-offs as required by these regulatory authorities might have a material adverse effect on our financial condition and results of operations.
We Are Subject to the Risk of Additional Impairment Charges Relating to Our Securities Portfolio.
The value of our investment portfolio has been adversely affected by the unfavorable conditions of the capital markets in general as well as declines in values of the securities we hold. We have taken an aggregate of $11.6 million in charges against earnings since October 1, 2009 for impairments to the value of securities that we have concluded were “other than temporary.” There may be additional material impairment charges that could have a material adverse effect on our financial condition and results of operations.
The Dodd-Frank Wall Street Reform and Consumer Protection Act Will, Among Other Things, Tighten Capital Standards, Create A New Consumer Financial Protection Bureau And Result In New Laws And Regulations That Are Expected To Increase Our Costs Of Operations.
The Dodd-Frank Wall Street Reform and Consumer Protection Act (the “Dodd-Frank Act”) will significantly change the current bank regulatory structure and affect the lending, deposit, investment, trading and operating activities of financial institutions and their holding companies. The Dodd-Frank Act requires various federal agencies to adopt a broad range of new implementing rules and regulations, and to prepare numerous studies and reports for Congress. The federal agencies are given significant discretion in drafting the implementing rules and regulations, and consequently, many of the details and much of the impact of the Dodd-Frank Act may not be known for many months or years.
40
Certain provisions of the Dodd-Frank Act are expected to have a near term effect on us. For example, the new law provides that the supervisory and rulemaking functions of the OTS, which is the current primary federal regulator for the Company and the Bank, will formally be transferred to other banking agencies on July 21, 2011, unless extended by up to six months by the Secretary of the Treasury. The Office of the Comptroller of the Currency, which is currently the primary federal regulator for national banks, will become the primary federal regulator for federal savings associations including the Bank. Moreover, the Board of Governors of the Federal Reserve System will supervise and regulate all savings and loan holding companies that were formerly regulated by the OTS, including the Company and BFS Bancorp, MHC.
Also effective by July 21, 2011, is a provision of the Dodd-Frank Act that eliminates the federal prohibitions on paying interest on demand deposits, thus allowing businesses to have interest-bearing checking accounts. Depending on competitive responses, this significant change to existing law could have an adverse effect on our interest expense.
The Dodd-Frank Act creates a new Consumer Financial Protection Bureau with broad powers to supervise and enforce consumer protection laws. The Consumer Financial Protection Bureau has broad rule-making authority for a wide range of consumer protection laws that apply to all banks and savings institutions, including the authority to prohibit “unfair, deceptive or abusive” acts and practices. The Consumer Financial Protection Bureau has examination and enforcement authority over all banks and savings institutions with more than $10 billion in assets. Banks and savings institutions with $10 billion or less in assets will be examined by their applicable bank regulators. The Dodd-Frank Act also weakens the federal preemption rules that have been applicable for national banks and federal savings associations, and gives state attorneys general the ability to enforce federal consumer protection laws.
It is difficult to predict at this time what specific impact the Dodd-Frank Act and the yet to be written implementing rules and regulations will have on community banks. However, it is expected that at a minimum they will increase our operating and compliance costs and could increase our interest expense.
Recently enacted legislation may not result in stabilization of the U.S. financial system, which could have a material adverse effect on our business and various aspects of our financial results.
In recent years, the U.S. Congress and the Obama Administration have taken actions that were intended to help stabilize and provide liquidity to the financial system. There can be no assurance, however, as to the actual impact that the various legislative actions taken by Congress or any governmental programs will have on the financial markets. The failure of the legislation or programs to serve their intended purposes, or the worsening of the current financial market conditions, could have a material adverse effect on our business, our financial condition, the results of our operations, our access to credit or the trading price of our common stock as well as the financial condition of our customers. It could also result in declines in our investment portfolio which could be “other-than-temporary impairments.”
We operate in a highly regulated environment, and changes in laws and regulations to which we are subject may adversely affect our results of operations.
We are subject to extensive regulation, supervision and examination by the OTS, as the current primary regulator of BFS Bancorp, MHC, the Company and the Bank, and by the FDIC as the insurer of the Bank’s deposits up to certain limits. (As noted above, BFS Bancorp, MHC, the Company and Bank will be transitioning to the jurisdiction of new primary federal regulators in July 2011 as a result of the Dodd-Frank Act.) We also belong to the FHLB System and, as a member of such system, we are subject to certain limited regulations promulgated by the FHLB of New York. This regulation and supervision limits the activities in which we may engage. The purpose of regulation and supervision is primarily to protect our depositors and borrowers and, in the case of FDIC regulation, the FDIC’s insurance fund. Regulatory authorities have extensive discretion in the exercise of their supervisory and enforcement powers. They may, among other things, impose restrictions on the operation of a banking institution, the classification of assets by such institution and such institution’s allowance for loan losses. Regulatory and law enforcement authorities also have wide discretion and extensive enforcement powers under various consumer protection and civil rights laws, including the Truth in Lending Act, the Equal Credit Opportunity Act, the Fair Housing Act, and the Real Estate Settlement Procedures Act. Any change in the laws or regulations applicable to us, or in a banking regulator’s supervisory policies or examination procedures, whether by our primary federal banking regulator, the FDIC, other state or federal regulators, the U.S. Congress or the New York legislature, could have a material adverse effect on our business, financial condition, results of operations and cash flows.
41
The soundness of other financial institutions could adversely affect us.
Our ability to engage in routine funding transactions could be adversely affected by the actions and commercial soundness of other financial institutions. Financial services institutions are interrelated as a result of trading, clearing, counterparty or other relationships. As a result, defaults by, or even rumors or questions about, one or more financial services institutions, or the financial services industry generally, have led to market-wide liquidity problems and could lead to losses or defaults by us or by other institutions. Many of these transactions expose us to credit risk in the event of default of our counterparty or client. In addition, our credit risk may be exacerbated when the collateral held by us cannot be relied upon or is liquidated at prices not sufficient to recover the full amount of the financial instrument exposure. There is no assurance that any such losses would not materially and adversely affect our results of operations.
The results of our operations may be adversely affected if asset valuations cause additional other-than-temporary impairment charges.
We may be required to record future impairment charges on our investment securities if they suffer declines in value that are considered other-than-temporary. Numerous factors, including lack of liquidity for re-sales of certain investment securities, absence of reliable pricing information for investment securities, adverse changes in business climate, adverse actions by regulators, or unanticipated changes in the competitive environment could have a negative effect on the Company’s investment portfolio in future periods. If an impairment charge is significant enough, it could affect the ability of the Bank to upstream dividends to the Company, which could have a material adverse effect on the Company’s liquidity and its ability to pay dividends to shareholders and could also negatively impact its regulatory capital ratios.
Changes in interest rates could adversely affect our results of operations and financial condition.
Our profitability, like that of most financial institutions, depends substantially on our net interest income, which is the difference between the interest income earned on our interest-earning assets and the interest expense paid on our interest-bearing liabilities. Increases in interest rates may decrease loan demand and make it more difficult for borrowers to repay adjustable rate loans. In addition, as market interest rates rise, we will have competitive pressures to increase the rates we pay on deposits, which could result in a decrease in our net interest income.
We also are subject to reinvestment risk associated with changes in interest rates. Changes in interest rates may affect the average life of loans and mortgage-related securities. Decreases in interest rates can result in increased prepayments of loans and mortgage-related securities as borrowers refinance to reduce borrowing costs. Under these circumstances, we are subject to reinvestment risk to the extent that we are unable to reinvest the cash received from such prepayments at rates that are comparable to the rates on existing loans and securities.
Competition in our primary market area may reduce our ability to attract and retain deposits and originate loans.
We operate in a competitive market for both attracting deposits, which is our primary source of funds, and originating loans. Historically, our most direct competition for savings deposits has come from credit unions, community banks, large commercial banks and thrift institutions in our primary market area. Particularly in times of extremely low or extremely high interest rates, we have faced additional significant competition for investors’ funds from brokerage firms and other firms’ short-term money market securities and corporate and government securities. Our competition for loans comes principally from mortgage brokers, commercial banks, other thrift institutions, and insurance companies. Such competition for the origination of loans may limit our future growth and earnings prospects. Competition for loan originations and deposits may limit our future growth and earnings prospects.
42
If external funds were not available, this could adversely impact our growth and prospects.
We rely on retail deposits, the amortization and prepayment of loans, the maturity and calls of investment securities, our operations and advances from the FHLB of New York to fund our operations. Although we have historically been able to replace maturing deposits and advances as necessary, we might not be able to replace such funds in the future if, among other things, our results of operations or financial condition or the results of operations or financial condition of the FHLB of New York or market conditions were to change. In addition, certain Federal Home Loan Banks have experienced lower earnings from time to time and paid out lower dividends to its members. Future problems at the Federal Home Loan Banks may impact the collateral necessary to secure borrowings and limit the borrowings extended to its member banks, require additional capital contributions by its member banks, and reduce or eliminate the dividends paid by the FHLB of New York. Should this occur, we could have difficulty meeting our short term liquidity needs and the Bank’s net interest income could be affected. In addition, future problems at the Federal Home Loan Banks could also cause the value of the equity investment we have in the stock of FHLB of New York to decline or become impaired. In addition, if we fall below the FDIC’s thresholds to be considered “well capitalized” we will be unable to continue with uninterrupted access to the brokered funds markets.
We may not be able to pay dividends in the future in accordance with past practice as our ability to pay dividends in the future is subject to regulatory approval.
Our ability to pay dividends to our stockholders is primarily dependent on the Bank’s earnings. The payment of dividends also is subject to legal and regulatory restrictions. Any payment of dividends in the future will depend, in large part, on the Bank’s earnings, capital requirements, financial condition and other factors considered relevant by the Company’s board of directors. Moreover, in connection with the Cease and Desist Orders to which BFS Bancorp, MHC, the Company and Bank are currently subject, any payment of dividends or other capital distributions is subject to the prior written non-objection of the OTS Regional Director.
Item 1B. Unresolved Staff Comments
None.
43
Item 2. Properties
Properties
The following table provides certain information with respect to our offices as of September 30, 2010:
|
Leased
|
Year Acquired
|
|||
|
Location
|
or Owned
|
or Leased
|
||
|
Main Office
|
Owned
|
1965
|
||
|
81 Court Street
|
||||
|
Brooklyn, NY 11201
|
||||
|
Branch Office
|
Leased
|
1960
|
||
|
3780 Nostrand Avenue
|
||||
|
Brooklyn, NY 11235
|
||||
|
Branch Office
|
Leased
|
1973
|
||
|
1164 Wantagh Avenue
|
||||
|
Wantagh, NY 11793
|
||||
|
Branch Office
|
Leased
|
1999
|
||
|
1752 Veterans Memorial Highway
|
||||
|
Islandia, NY 11749
|
||||
|
Branch Office
|
Leased
|
2007
|
||
|
1174 Jericho Turnpike
|
||||
|
Commack, NY 11725
|
The net book value of our premises and equipment was approximately $1.8 million at September 30, 2010.
Item 3. Legal Proceedings
Except as set forth below, there are no material pending legal proceedings to which the Company or it subsidiaries is a party other than ordinary routine litigation incidental to their respective businesses.
The Bank is currently subject to two cases filed after the end of the second quarter of fiscal year 2011, as described below, that resulted from actions taken by borrowers whose loans were in default. We believe that such defensive actions are often taken by defaulting borrowers during times of economic uncertainty in an attempt to incentivize the negotiation of more favorable payment terms, but we are not routinely subject to such actions and thus cannot characterize them as ordinary routine litigation incidental to the Bank’s business.
The Bank is a defendant in an action brought by 50-01 Realty LLC filed on April 13, 2011 in the Supreme Court of the State of New York County of Kings. 50-01 Realty LLC is claiming damages of approximately $44 million for alleged breach of contract and misrepresentation regarding a right of first refusal to purchase an outstanding loan. The Bank has filed a motion to dismiss the complaint. Management believes that this case is without merit and intends to vigorously defend the case. It is too preliminary in the proceedings to predict the ultimate results of this matter; however, management does not currently expect that the resolution of these proceedings will have a material adverse effect on the Company’s consolidated financial position or results of operations.
The Bank is also a defendant in an action brought by The Mazel Group and Yehuda Backer on May 23, 2011 in Supreme Court of the State of New York County of Kings. The plaintiffs are claiming damages of up to $100 million, including punitive damages, for alleged breach of contract, tortious interference with precontractual negotiations and breach of duty to protect confidential information. Management intends to vigorously defend the matter. It is too preliminary in the proceedings to predict the ultimate results of this matter; however, management does not currently expect that the resolution of these proceedings will have a material adverse effect on the Company’s consolidated financial position or results of operations.
Effective March 31, 2011, the Company, BFS Bancorp, MHC and the Bank, consented to the issuance of Cease and Desist Orders from the OTS.
Item 4. [Removed and Reserved]
44
PART II.
Item 5. Market for Registrant’s Common Equity, Related Stockholder Matters and Issuer Purchases of Equity Securities
The Company’s common stock trades on the Nasdaq Global Market under the symbol “BFSB.” Trading in the Company’s common stock commenced on April 6, 2005.
On January 12, 2011, the Company received a letter from the NASDAQ Stock Market (“NASDAQ”) stating that the Company is not in compliance with NASDAQ Listing Rule 5250(c)(1) because the Company did not timely file its Annual Report on Form 10-K for the year ended September 30, 2010 and that the Company also failed to comply with NASDAQ’s minimum market value of publicly held shares of $5.0 million. As disclosed to the SEC via a Form 12b-25 on December 27, 2010, the Company’s Form 10-K for the year ended September 30, 2010 was delayed due to the resignation of the Company’s independent registered public accounting firm on December 20, 2010. The Company had until March 14, 2011 to submit a plan to regain compliance with delinquent periodic reports (which requirement it met timely) and now has and until June 27, 2011 to regain compliance. The Company has until July 11, 2011 to regain compliance with the minimum market value of publicly held stock.
On February 15, 2011, the Company received an additional letter from the NASDAQ stating that the Company was not in compliance with NASDAQ Listing Rule 5250(c)(1) because the Company did not timely file its Quarterly Report on Form 10-Q for the quarter ended December 31, 2010. As previously mentioned, the Company’s independent registered public accounting firm resigned on December 20, 2010. This delayed the filing of the Form 10-K for the fiscal year ended September 30, 2010, as well as the Form 10-Q for the period ended December 31, 2010, and the Form 10-Q for the period ended March 31, 2011.
On March 7, 2011, the Company received a letter from the NASDAQ stating that the Company was not in compliance with the NASDAQ Listing Rules because the Company did not maintain a minimum bid price of $1.00 per share for the requisite period of time. The Company has until September 6, 2011 to regain compliance with the minimum bid requirement.
As of June 15, 2011, there were 13,484,210 shares of Company common stock issued and 12,882,607 common shares outstanding and approximately 674 stockholders of record. Of the total outstanding shares 9,257,500 were held by BFS Bancorp, MHC and 3,625,107 were held by other shareholders.
The table below shows the high and low closing prices reported on the Nasdaq Global Market for the Company’s common stock during the periods indicated.
|
2010
|
High
|
Low
|
Dividend
|
|||||||||
|
Fourth Quarter (July 1, 2010 – September 30, 2010)
|
$ | 4.83 | $ | 1.78 | $ | 0.01 | ||||||
|
Third Quarter (April 1, 2010 – June 30, 2010)
|
$ | 9.48 | $ | 4.20 | $ | 0.06 | ||||||
|
Second Quarter (January 1, 2010 – March 31, 2010)
|
$ | 10.20 | $ | 7.36 | $ | 0.11 | ||||||
|
First Quarter (October 1, 2009 - December 31, 2009)
|
$ | 12.98 | $ | 9.90 | $ | 0.11 | ||||||
|
2009
|
High
|
Low
|
Dividend
|
|||||||||
|
Fourth Quarter (July 1, 2009 – September 30, 2009)
|
$ | 14.19 | $ | 11.15 | $ | 0.10 | ||||||
|
Third Quarter (April 1, 2009 – June 30, 2009)
|
$ | 12.67 | $ | 10.25 | $ | 0.10 | ||||||
|
Second Quarter (January 1, 2009 – March 31, 2009)
|
$ | 14.20 | $ | 9.50 | $ | 0.10 | ||||||
|
First Quarter (October 1, 2008 - December 31, 2008)
|
$ | 14.99 | $ | 12.31 | $ | 0.10 | ||||||
45
See Part I, Item 1. “Business—Supervision and Regulation––Regulation of Federal Savings Associations––Capital Distributions” for a discussion of certain limitations imposed on the Bank’s ability to declare and pay dividends to the Company.
See Part III. Item 12 below regarding equity compensation plan information categorized by those plans that have been approved by stockholders. At September 30, 2010, there were no plans that have not been approved by stockholders.
Stock Performance Graph
Set forth hereunder is a stock performance graph comparing (a) the cumulative total return on the Common Stock between September 30, 2005 and September 30, 2010, (b) the cumulative total return on stock included in the SNL Thrift Index over those periods, and (c) the cumulative total return on stocks included in the Russell 2000 Index over those periods. Cumulative return assumes the reinvestment of dividends, and is expressed in dollars based on an assumed investment of $100.
|
Brooklyn Federal Bancorp, Inc.
|
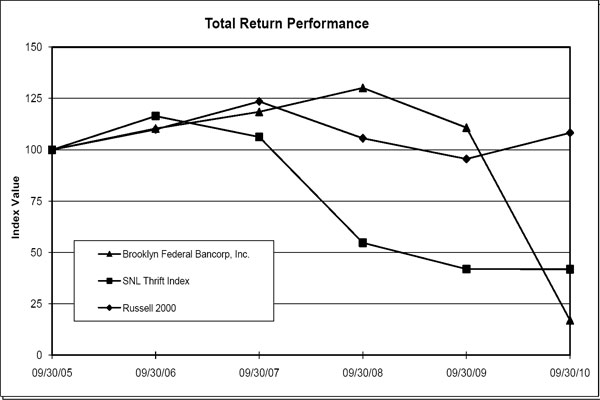
|
Period Ending
|
||||||||||||||||||||||||
|
Index
|
09/30/05
|
09/30/06
|
09/30/07
|
09/30/08
|
09/30/09
|
09/30/10
|
||||||||||||||||||
|
Brooklyn Federal Bancorp, Inc.
|
100.00 | 110.35 | 118.46 | 130.17 | 110.81 | 16.93 | ||||||||||||||||||
|
SNL Thrift Index
|
100.00 | 116.40 | 106.23 | 54.72 | 41.91 | 41.85 | ||||||||||||||||||
|
Russell 2000
|
100.00 | 109.92 | 123.49 | 105.60 | 95.52 | 108.27 | ||||||||||||||||||
46
There can be no assurance that the Company’s stock performance will continue in the future with the same or similar trend depicted in the graph. The Company will not make or endorse any predictions as to future stock performance.
When the Company pays dividends to its minority stockholders, it also is required to pay dividends to BFS Bancorp, MHC, unless BFS Bancorp, MHC elects to waive the receipt of dividends. We anticipate that BFS Bancorp, MHC would waive any dividends paid by the Company. Any decision to waive dividends is subject to regulatory approval. See Part I. Item 1. “Business––Holding Company Regulation––Waivers of Dividends by BFS Bancorp, MHC” for the regulatory guidelines for requesting a waiver and conditions for regulatory approval in BFS Bancorp, MHC received regulatory approval to waive dividends for the fiscal year ended September 30, 2010. Under OTS regulations, public stockholders would not be diluted for any dividends waived by BFS Bancorp, MHC in the event that BFS Bancorp, MHC converts to stock form.
Dividends are payable at the sole discretion of the Company, and any dividends will depend, in part, upon receipt of dividends from the Bank, because the Company presently has no source of income other than dividends from the Bank, earnings from the investment of offering proceeds it retained and interest on the Company’s loan to the employee stock ownership plan. During the 12 months ended September 30, 2010, we paid a quarterly dividend of $0.11 per common share of our stock during the first and second quarters of fiscal year 2010, $0.06 per common share during the third quarter and $0.01 per common share during the last quarter of fiscal year 2010 compared to $0.10 per common share for all four quarters of fiscal year 2009. The OTS regulations impose limitations on “capital distributions” by savings associations such as the Bank. As disclosed further below in Part II. Item 7 in “Management’s Discussion and Analysis of Financial Condition and Results of Operations – Business Strategy,” the OTS issued a supervisory directive and entered into supervisory agreements, dated September 28, 2010, with each of the Bank and the Company, and on March 31, 2011, the Bank, the Company and BFS Bancorp, MHC entered into Cease and Desist Orders with the OTS, all of which impose significant restrictions on the business and operations of the Bank, including restrictions on growth, commercial real estate lending and capital distributions. These restrictions include, but are not limited to, the Company declaring or paying dividends or making any other capital distributions without the prior written approval of the OTS Regional Director.
The Company did not repurchase any of our common stock in the quarter ending September 30, 2010. Through September 30, 2010 the Board of Directors of the Company approved four common stock repurchase plans. The first repurchase plan was completed in August 2007, purchasing $1.5 million or 102,370 shares at an average cost of $14.65 per share. The second repurchase plan was completed in March 2008, purchasing $2.0 million or 147,339 shares at an average cost of $13.57 per share. The third repurchase plan was completed in October 2008, purchasing $3.0 million or 238,483 shares at an average cost of $12.58 per share. The fourth plan was authorized in November 2008 and through September 30, 2010 the Company has repurchased 106,674 shares at an average cost of $11.44 per share. Stock repurchases will be made from time to time and may be effected through open market purchases, block trades and in privately negotiated transactions. Repurchased stock will be held as treasury stock and will be available for general corporate purposes.
47
Item 6. Selected Financial Data
The summary information presented below is derived in part from and should be read in conjunction with the consolidated financial statements of the Company presented in Item 8. On April 5, 2005, the Bank completed its reorganization into the mutual holding company structure, and in connection therewith the Company sold 3,967,500 shares of common stock which resulted in $37.9 million of net proceeds of which $20.5 million was utilized to acquire all of the outstanding common stock of the Bank. The Company issued 9,257,500 shares of its common stock to BFS Bancorp, MHC.
|
At September 30,
|
||||||||||||||||||||
|
2010
|
2009
|
2008
|
2007
|
2006
|
||||||||||||||||
|
(In thousands)
|
||||||||||||||||||||
|
Selected Financial Condition Data:
|
||||||||||||||||||||
|
Total assets
|
$ | 487,755 | $ | 521,445 | $ | 483,833 | $ | 390,434 | $ | 408,045 | ||||||||||
|
Cash and cash equivalents
|
14,201 | 3,472 | 5,053 | 5,398 | 4,078 | |||||||||||||||
|
Investments in certificates of deposit
|
- | - | 1,397 | 3,890 | 7,160 | |||||||||||||||
|
Securities available-for-sale
|
69,107 | 3,305 | 3,655 | 4,601 | 4,389 | |||||||||||||||
|
Securities held-to-maturity
|
- | 66,201 | 78,086 | 73,354 | 86,972 | |||||||||||||||
|
Loans receivable, net
|
369,842 | 419,685 | 239,149 | 225,467 | 194,355 | |||||||||||||||
|
Loans held-for-sale
|
- | - | 134,171 | 59,153 | 92,243 | |||||||||||||||
|
Deposits
|
423,406 | 402,070 | 342,475 | 287,155 | 271,003 | |||||||||||||||
|
Borrowings
|
10,500 | 27,300 | 44,239 | 9,271 | 49,407 | |||||||||||||||
|
Stockholders’ equity
|
45,739 | 81,874 | 86,323 | 85,259 | 79,963 | |||||||||||||||
|
Years Ended September 30,
|
||||||||||||||||||||
| 2010 | 2009 | 2008 | 2007 | 2006 | ||||||||||||||||
|
(In thousands, except per share data)
|
||||||||||||||||||||
|
Selected Operating Data:
|
||||||||||||||||||||
|
Interest income
|
$ | 30,447 | $ | 34,111 | $ | 28,314 | $ | 27,736 | $ | 22,035 | ||||||||||
|
Interest expense
|
7,597 | 9,810 | 10,265 | 10,703 | 7,338 | |||||||||||||||
|
Net interest income before provision for loan losses
|
22,850 | 24,301 | 18,049 | 17,033 | 14,697 | |||||||||||||||
|
Provision for loan losses
|
42,682 | 8,545 | 399 | 49 | 436 | |||||||||||||||
|
Net interest income after provision for loan losses
|
(19,832 | ) | 15,756 | 17,650 | 16,984 | 14,261 | ||||||||||||||
|
Non-interest (loss) income
|
(9,855 | ) | (736 | ) | 2,703 | 3,135 | 2,336 | |||||||||||||
|
Non-interest expense
|
14,630 | 13,648 | 11,454 | 14,091 | 9,274 | |||||||||||||||
|
Income before income taxes
|
(44,317 | ) | 1,372 | 8,899 | 6,028 | 7,323 | ||||||||||||||
|
(Benefit) provision for income taxes
|
(5,386 | ) | 85 | 3,318 | 2,181 | 2,765 | ||||||||||||||
|
Net (loss) income
|
$ | (38,931 | ) | $ | 1,287 | $ | 5,581 | $ | 3,847 | $ | 4,558 | |||||||||
|
Dividends paid per common share
|
$ | 0.29 | $ | 0.40 | $ | 0.29 | $ | 0.10 | $ | - | ||||||||||
48
|
At or For the Years Ended September 30,
|
||||||||||||||||||||
|
2010
|
2009
|
2008
|
2007
|
2006
|
||||||||||||||||
|
Selected Financial Ratios and Other Data:
|
||||||||||||||||||||
|
Performance Ratios:
|
||||||||||||||||||||
|
Return on average assets
|
-7.40 | % | 0.25 | % | 1.30 | % | 0.96 | % | 1.25 | % | ||||||||||
|
Return on average equity
|
-53.09 | % | 1.47 | % | 6.49 | % | 4.61 | % | 5.91 | % | ||||||||||
|
Interest rate spread (1)
|
4.21 | % | 4.32 | % | 3.67 | % | 3.55 | % | 3.52 | % | ||||||||||
|
Net interest margin (2)
|
4.50 | % | 4.88 | % | 4.40 | % | 4.43 | % | 4.21 | % | ||||||||||
|
Efficiency ratio (3)
|
60.36 | % | 52.13 | % | 52.84 | % | 70.76 | % | 54.60 | % | ||||||||||
|
Non-interest expense to average total assets
|
2.78 | % | 2.65 | % | 2.66 | % | 3.50 | % | 2.55 | % | ||||||||||
|
Average interest-earning assets to average interest-bearing liabilities
|
119.40 | % | 128.51 | % | 129.55 | % | 131.40 | % | 132.97 | % | ||||||||||
|
Asset Quality Ratios:
|
||||||||||||||||||||
|
Non-performing assets as a percent of total assets
|
17.72 | % | 4.23 | % | 0.42 | % | 0.17 | % | 0.07 | % | ||||||||||
|
Non-performing loans as a percent of total loans
|
22.22 | % | 5.13 | % | 0.54 | % | 0.23 | % | 0.10 | % | ||||||||||
|
Allowance for loan losses as a percent of total loans
|
4.63 | % | 2.50 | % | 0.59 | % | 0.63 | % | 0.61 | % | ||||||||||
|
Capital Ratios (4):
|
||||||||||||||||||||
|
Total risk-based capital (to risk weighted assets)
|
10.90 | % | 14.50 | % | 20.90 | % | 25.50 | % | 21.90 | % | ||||||||||
|
Tier 1 risk-based capital (to risk weighted assets)
|
9.30 | % | 13.00 | % | 20.20 | % | 24.90 | % | 21.40 | % | ||||||||||
|
Tangible capital (to tangible assets)
|
8.00 | % | 13.80 | % | 15.60 | % | 18.00 | % | 15.50 | % | ||||||||||
|
Tier 1 leverage (core) capital (to adjusted tangible assets)
|
8.00 | % | 13.80 | % | 15.60 | % | 18.00 | % | 15.50 | % | ||||||||||
|
Equity to total assets (consolidated)
|
9.38 | % | 15.70 | % | 17.80 | % | 21.80 | % | 19.60 | % | ||||||||||
|
Other Data:
|
||||||||||||||||||||
|
Number of full service offices
|
5 | 5 | 5 | 4 | 4 | |||||||||||||||
|
(1)
|
Represents the difference between the weighted-average yield on interest-earning assets and the weighted-average cost of interest-bearing liabilities for the period.
|
|
(2)
|
Represents net interest income as a percent of average interest-earning assets for the period.
|
|
(3)
|
Represents non-interest expense divided by the sum of net interest income and non-interest income less impairment charges and gain/loss on securities.
|
|
(4)
|
Ratios other than equity to total assets are for the Bank.
|
49
Item 7. Management’s Discussion and Analysis of Financial Condition and Results of Operations
Overview
Our results of operations depend mainly on our net interest income, which is the difference between the interest income earned on our loan and investment portfolios and interest expense paid on our deposits and borrowed funds. Results of operations are also affected by fee income from banking operations, provisions for loan losses, gains (losses) on sales of loans and securities available-for-sale and other miscellaneous income. Our non-interest expenses consist primarily of compensation and employee benefits, office occupancy, technology, marketing, general administrative expenses and income tax expense.
Our results of operations are also significantly affected by general economic and competitive conditions, particularly with respect to changes in interest rates, government policies and actions of regulatory authorities. Future changes in applicable laws, regulations or government policies may materially affect our financial condition and results of operations.
Critical Accounting Policies
We consider accounting policies that require management to exercise significant judgment or discretion or make significant assumptions that have, or could have, a material impact on the carrying value of certain assets or on income, to be critical accounting policies. We consider the following to be our critical accounting policies:
Allowance for Loan Losses. The allowance for loan losses is the estimated amount considered necessary to cover credit losses inherent in the loan portfolio at the balance sheet date. The allowance is established through the provision for loan losses that is charged against income. In determining the allowance for loan losses, management makes significant estimates and has identified this policy as one of the most critical for the Bank. The methodology for determining the allowance for loan losses is considered a critical accounting policy by management due to the high degree of judgment involved, the subjectivity of the assumptions utilized and the potential for changes in the economic environment that could result in changes to the amount of the recorded allowance for loan losses.
As a substantial amount of our loan portfolio is collateralized by real estate, appraisals of the underlying value of property securing loans and discounted cash flow valuations of properties are critical in determining the amount of the allowance required for specific loans. Assumptions for appraisals and discounted cash flow valuations are instrumental in determining the value of properties. Overly optimistic assumptions or negative changes to assumptions could significantly impact the valuation of a property securing a loan and the related allowance determined. The assumptions supporting appraisals and discounted cash flow valuations are carefully reviewed by management to determine that the resulting values reasonably reflect amounts realizable on the related loans. As discussed in Item 9A. “Controls and Procedures” in this annual report, we identified certain miscalculations in our allowance for loan losses resulting from delays in the provision of updated appraisal information to our accounting staff. During the third quarter of fiscal year 2011, we have modified our procedures related to the handling of appraisals and the timing of impairment analysis to ensure that charge-offs are recognized in a timely manner.
Management performs a quarterly evaluation of the adequacy of the allowance for loan losses. Consideration is given to a variety of factors in establishing this estimate including, but not limited to, current economic conditions, delinquency statistics, geographic and industry concentrations, the adequacy of the underlying collateral, the financial strength of the borrower, results of internal and external loan reviews and other relevant factors. This evaluation is inherently subjective as it requires material estimates that may be susceptible to significant revision based on changes in economic and real estate market conditions.
The analysis of the allowance for loan losses has two components: specific and general allocations. Specific allocations are made for loans that are determined to be impaired. Impairment is measured by determining the present value of expected future cash flows or, for collateral-dependent loans, the fair value of the collateral adjusted for market conditions and selling expenses. The general allocation is determined by segregating the remaining loans by type of loan, risk weighting (if applicable) and payment history. We also analyze historical loss experience, delinquency trends, general economic conditions and geographic and industry concentrations. This analysis establishes factors that are applied to the loan groups to determine the amount of the general allocations. Actual loan losses may be significantly more than the allowance for loan losses we have established which could have a material negative effect on our financial results.
50
Other-than-Temporary Impairment of Securities. We evaluate on a quarterly basis whether any securities are other-than-temporarily impaired. In making this determination, we consider the extent and duration of the impairment, the nature and financial health of the issuer and our intent to hold or requirement to sell the securities for a period sufficient to allow for any anticipated recovery in market value. Other considerations include, without limitation, a review of the credit quality of the issuer and the existence of a guarantee or insurance, if applicable to the security. If a security is determined to be other-than-temporarily impaired, we record an impairment loss as a charge to income for the period in which the impairment loss is determined to exist, resulting in a reduction to our earnings for that period.
The fair value of the Bank’s investment in a mutual fund that invests primarily in agency and private label mortgage-backed securities has been steadily decreasing, which has caused a corresponding decrease in the fund’s net asset value. In addition, the fund implemented a temporary prohibition on cash redemptions, lessening the ability of the Bank to dispose of its remaining $2.6 million investment in this asset. During the year ended September 30, 2010, we concluded that this available-for-sale investment did incur an other-than-temporary impairment and the Bank charged current earnings for the impairment. In October 2010, the fund lifted the prohibition on cash redemptions.
Regarding the remaining securities classified available-for-sale, which until June 30, 2010, were classified held-to-maturity and are composed completely of debt securities, an other-than-temporary impairment loss must be fully recognized in earnings if an investor has the intent to sell the debt security or if it is more likely than not that the investor will be required to sell the debt security before recovery of its amortized cost basis. However, even if an investor does not expect to sell a debt security, it must evaluate the expected cash flows to be received and determine if a credit loss has occurred. In the event of an other-than-temporary impairment loss, only the amount of impairment associated with the credit loss is recognized in earnings. An other-than-temporary impairment loss relating to factors other than credit losses are recorded in accumulated other comprehensive loss. For certain securities available-for-sale, we concluded that the unrealized loss was an other-than-temporary impairment in nature due to the underlying credit quality of the issuers of the securities and did incur an other-than-temporary impairment. The Bank charged current earnings for the impairment.
Deferred Income Taxes. We use the asset and liability method of accounting for income taxes. Under this method, deferred tax assets and liabilities are recognized for the future tax consequences attributable to differences between the financial statement carrying amounts of existing assets and liabilities and their respective tax bases. Deferred tax assets and liabilities are measured using enacted tax rates expected to apply to taxable income in the years in which those temporary differences are expected to be recovered or settled. If current available information raises doubt as to the realization of the deferred tax assets, a valuation allowance is established. We consider the determination of this valuation allowance to be a critical accounting policy because of the need to exercise significant judgment in evaluating the amount and timing of recognition of deferred tax liabilities and assets, including projections of future taxable income. These judgments and estimates are reviewed on a continual basis as regulatory and business factors change. A valuation allowance for deferred tax assets may be required if the amount of taxes recoverable through loss carry-back declines, or if we project lower levels of future taxable income. Such a valuation allowance would be established through a charge to income tax expense which would adversely affect our operating results.
Business Strategy
Historically, we operated as a traditional savings and loan association by originating primarily one- to four-family residential mortgage loans. However, the market for these mortgage loans is highly competitive, which has reduced the profitability of one- to four-family mortgage lending for lower volume lenders such as the Bank. While we have continued to originate one- to four-family mortgage loans, since 2001 we expanded the range of our loan products and services with the objective of increasing profitability. In particular, we significantly increased commercial real estate, construction and development, and multi-family lending during that period. At September 30, 2010, these loans totaled 30.8%, 24.6% and 16.8%, respectively, of our total loan portfolio. We have also introduced additional products and services, such as debit cards and internet banking.
51
The significant downturn in the New York City economy and real estate market since 2008 has adversely affected our loan portfolio and our earnings. Our nonperforming loans have increased significantly since 2009, and totaled 22.2% of total loans at September 30, 2010 compared to 5.1% of total loans at September 30, 2009. Of these non-performing loans, 49.7% consisted of commercial real estate and construction and development loans. The collateral value of these loans has decreased significantly and, as a result, we have substantially increased our provision for loan losses in each of the past three fiscal years which has adversely affected our earnings and equity capital. Our provision for loan losses totaled $0.4 million, $8.5 million and $42.7 million for fiscal years ended September 30, 2008, 2009 and 2010, respectively.
As a result of a regular examination of the Bank during the past fiscal year, the OTS issued a supervisory directive and entered into a supervisory agreement, dated September 28, 2010, with the Bank and the Company which imposed significant restrictions on the business and operations of the Bank, including restrictions on growth, commercial real estate lending, and capital distributions. On March 31, 2011, the Bank entered into a Cease and Desist Order with the OTS. On that same date, the Company and BFS Bancorp, MHC jointly entered into a related Cease and Desist Order with the OTS which, among other terms, requires each holding company to ensure that the Bank complies with the terms of its Cease and Desist Order. The Cease and Desist Orders impose significant restrictions on the business operations of the Bank as outlined under Item 1. “Business – Recent Developments –Entry into Cease and Desist Orders.”
The Bank’s goal is to continue to work through its problem loans while attempting to comply with the Cease and Desist Orders. However, earnings will continue to be affected adversely so long as the current weakness in the New York City economy and real estate market persists.
We cannot assure you that we will successfully implement our business strategy or comply with the restrictions or timeframes mandated by the Cease and Desist Orders.
Comparison of Financial Condition at September 30, 2010 and September 30, 2009
Total Assets. Total assets decreased by $33.7 million, or 6.5%, to $487.8 million at September 30, 2010 from $521.4 million at September 30, 2009. This decrease was primarily due to decreases in securities, net loans, Federal Home Loan Bank of New York stock, accrued interest receivable, and premises and equipment, net offset by increases in cash due from banks, bank owned life insurance and prepaid expenses and other assets.
Cash and Due from Banks. Cash and due from banks increased by $10.7 million, or 309.0%, to $14.2 million at September 30, 2010 from $3.5 million at September 30, 2009.
Securities. Investment securities, which represent the available-for-sale and held-to-maturity portfolios, decreased $0.4 million, or 0.6%, to $69.1 million at September 30, 2010, from $69.5 million at September 30, 2009. Our holdings of securities available-for-sale totaled $69.1 million at September 30, 2010.
Loans receivable. Loans receivable before allowance for loan losses, which include deferred fees decreased $42.6 million, or 9.9%, to $387.8 million at September 30, 2010 from $430.4 million at September 30, 2009. This decrease was primarily due to charge-offs and OTS-mandated restrictions relating to the type of lending we can originate.
Federal Home Loan Bank of New York Stock. Federal Home Loan Bank of New York stock decreased by $0.6 million, or 24.3%, to $1.8 million at September 30, 2010, from $2.4 million at September 30, 2009.
Bank-Owned Life Insurance. Bank-owned life insurance increased $0.4 million, or 3.9%, to $9.9 million at September 30, 2010, from $9.5 million at September 30, 2009. This increase was primarily due to the increase in the cash surrender value of the policies.
52
Accrued interest receivable. Accrued interest receivable decreased $0.7 million, or 26.4%, to $2.1 million at September 30, 2010, from $2.8 million at September 30, 2009. This decrease was primarily due to the decrease in the loans receivable portfolio.
Premises and equipment, net. Premises and equipment decreased $0.2 million, or 10.2%, to $1.8 million at September 30, 2010, from $2.0 million at September 30, 2009. The decrease was primarily due to the accumulated depreciation of $0.5 million offset by equipment purchases of $0.3 million.
Prepaid Expenses and Other Assets. Prepaid expenses and other assets increased $7.0 million, or 57.9%, to $19.1 million at September 30, 2010, from $12.1 million at September 30, 2009. The increase was primarily due to an increase in prepaid FDIC insurance and prepaid income taxes.
Deposits. Deposits increased by $21.3 million, or 5.3%, to $423.4 million at September 30, 2010, from $402.1 million at September 30, 2009. The increase was attributable to a $1.8 million increase in certificates of deposit, an increase in other interest bearing deposits of $20.1 million, offset in part by a decrease in non-interest bearing deposits of $0.6 million. The net deposit inflow was primarily used to reduce our borrowing position. The Bank maintains marketing and promotional efforts in its market area, including efforts to remain competitive in all of its deposit offerings.
Borrowed Funds. Borrowed funds from the Federal Home Loan Bank of New York decreased by $16.8 million, or 61.5%, to $10.5 million at September 30, 2010, from $27.3 million at September 30, 2009.
Accrued Expenses and Other Liabilities. Accrued expenses and other liabilities decreased by $2.5 million, or 31.3%, to $5.5 million at September 30, 2010 from $8.0 million at September 30, 2009. The decrease was mainly attributable to a decrease in income taxes payable of $1.8 million and N.O.W. accounts payable of $0.8 offset by an increase in Supplemental Executive Retirement Plan (“SERP”) benefit of $0.2 million.
Stockholders’ Equity. Stockholders’ equity decreased by $36.2 million, or 44.1%, to $45.7 million at September 30, 2010, from $81.9 million at September 30, 2009. The primary reasons for the decrease were a net loss of $38.9 million offset by the recovery of the prior year net unrealized loss, net of tax, in the securities portfolio of $3.6 million.
Comparison of Operating Results for the Years Ended September 30, 2010 and September 30, 2009
Net Income. Net income decreased by $40.2 million to a net loss of $38.9 million in fiscal year 2010 from net income of $1.3 million in fiscal year 2009. The primary reasons for the decrease in net income were a $3.7 million decrease in interest income, a $34.1 million increase in provision for loan losses, a reduction of $9.2 million in non-interest income and an increase of $1.0 million in non-interest expenses, offset in part by a $2.2 million decrease in interest expense and a $5.5 million decrease in income tax expense to a benefit of $5.4 million primarily due to the net loss offset by a valuation allowance on deferred tax assets.
Net Interest Income Before Provision for Loan Losses. Net interest income before provision for loan losses decreased by $1.5 million, or 6.0%, to $22.8 million for fiscal year 2010 from $24.3 million for fiscal year 2009. This decrease was primarily due to increased average interest-bearing liabilities of $37.6 million, or 9.7%, to $425.0 million in fiscal year 2010 from $387.3 million in fiscal year 2009 offset by an increase in total average interest-earning assets of $9.6 million, or 1.9%, to $507.4 million in fiscal year 2010 from $497.8 million in fiscal year 2009. The Bank’s interest rate spread was 4.21% and 4.32% for the fiscal years 2010 and 2009, respectively.
Interest Income. Interest income decreased by $3.7 million, or 10.7%, to $30.4 million for fiscal year 2010 from $34.1 million for the prior fiscal year. The decrease was due to a $3.3 million decrease in interest income on first mortgage and other loans, $0.3 million in interest income from mortgage-backed securities and interest income of $0.1 million from investment securities and other interest-earning assets. The yield on the mortgage loan portfolio decreased 109 basis points to 6.24% in fiscal year 2010 from 7.33% in fiscal year 2009. For the fiscal year ended September 30, 2010, there was $5.5 million in interest income that would have been recorded had our non-accruing loans been current in accordance with their original terms. The yield on mortgage-backed securities increased 32 basis points to 5.07% in fiscal year 2010 from 4.75% in fiscal year 2009. The yield on investment securities and other interest-earning assets decreased 124 basis points to 2.33% in fiscal year 2010 from 3.57% in fiscal year 2009. Average balances of interest-earning assets increased $9.6 million, or 1.9%, to $507.4 million in fiscal year 2010 from $497.8 million in fiscal year 2009. The average yield on total interest-earning assets decreased by 85 basis points to 6.0% in fiscal year 2010 from 6.85% in fiscal year 2009.
53
Interest Expense. Interest expense decreased $2.2 million, or 22.6%, to $7.6 million for fiscal year 2010 from $9.8 million in fiscal year 2009. The decrease in interest expense reflected a 74 basis point decrease in the cost of interest-bearing liabilities to 1.79% for fiscal year 2010 from 2.53% for fiscal year 2009 offset by a $37.6 million increase in average balances of interest-bearing liabilities. The decrease in interest expense reflected reduced market interest rates during fiscal year 2010 compared to fiscal year 2009. Interest expense on savings accounts decreased by $227,000, or 40.8%, to $330,000 for fiscal year 2010 from $557,000 for fiscal year 2009, as the average cost on savings accounts decreased by 41 basis points to 0.52% for fiscal year 2010 compared to 0.93% for fiscal year 2009. The average balance of savings accounts increased $3.9 million, or 6.5%, to $64.0 million for fiscal year 2010 from $60.1 million for fiscal year 2009. Interest expense on Money Market and NOW accounts decreased $0.2 million, or 20.0% to $0.8 million in fiscal year 2010 from $1.0 million in fiscal year 2009, as the average cost on these deposits decreased 104 basis points to 0.92% in fiscal year 2010 from 1.96% in fiscal year 2009 and the average balances increased $38.7 million, or 73.8%, to $91.3 million in fiscal year 2010 from $52.6 million in fiscal year 2009. Interest expense on certificates of deposit decreased by $1.7 million, or 21.5%, to $6.2 million for fiscal year 2010 from $7.9 million for fiscal year 2009, as the average cost on certificates of deposit decreased by 99 basis points to 2.40% in fiscal year 2010 from 3.39% in fiscal year 2009. The average balance of certificates of deposit increased $25.4 million, or 10.9%, to $257.8 million for fiscal year 2010 from $232.4 million for fiscal year 2009. Interest expense on Federal Home Loan Bank advances decreased by $0.1 million, or 31.6%, to $0.3 million in fiscal year 2010 from $0.4 million in fiscal year 2009, as the average cost on these borrowings increased 121 basis points to 2.05% in fiscal year 2010 from 0.84% in fiscal year 2009, partially offset by an decrease in the average balance of the Federal Home Loan Bank advances of $30.5 million, or 71.9%, to $11.8 million in fiscal year 2010 from $42.3 million in fiscal year 2009.
Provision for Loan Losses. Our provision for loan losses increased $34.1 million to $42.7 million for fiscal year 2010 compared to $8.5 million for fiscal year 2009. The increase is primarily due to a significant increase in non-performing commercial real estate and land loans. Total non-performing loans in non-accrual status totaled $71.9 million at September 30, 2010 compared to $22.1 million at September 30, 2009. The allowance for loan losses at September 30, 2010 represented 4.6% of total loans, compared to 2.5% of total loans at September 30, 2009. During the quarter ended September 30, 2010, non-performing loans and related problem assets increased significantly requiring charge-off of certain loan balances and an increase in the provision for loan losses for specific problem assets. This was due generally to the severe and lengthy economic downturn, which dramatically affected real estate values as well as the financial well-being of many of our borrowers, leading to an increase in potential problem loans. Please see “Business— Non-Performing Loans and Potential Problem Assets – Classified Assets” for a discussion relating to non-performing loans and problem assets.
Non-interest Income. Non-interest income decreased by $9.1 million to a loss of $9.8 million for fiscal year 2010, from a loss of $0.7 million for fiscal year 2009. The decrease was mainly the result of an increase in other-than-temporary charges of $8.7 million, or 301.0%, to $11.6 million for fiscal year 2010 from $2.9 million for fiscal year 2009 and a decrease of $0.6 million in banking fees and service charges. The impairment charges increased $9.3 million for fiscal year 2010 to $11.3 million from $2.0 million in fiscal year 2009 for securities held for maturity. The impairment charges for available-for-sale securities decreased $0.6 million for fiscal year 2010 to $0.3 million from $0.9 million in fiscal year 2009. The decrease in banking fees and service charges was primarily the result of decreased loan syndication and other related loan fees earned of approximately $0.5 million.
Non-interest Expense. Non-interest expense increased by $1.0 million, or 7.2%, to $14.7 million in fiscal year 2010 compared to $13.7 million in fiscal year 2009. The largest component of the increase was in professional fees which increased $1.3 million, or 259.9%, to $1.8 million for fiscal year 2010 from $0.5 million in fiscal year 2009. This increase was mainly due to increased legal fees. In addition, the Bank incurred an increase in its FDIC insurance assessment of $0.1 million, occupancy and equipment expense increased $0.1 million and other miscellaneous expenses, which is comprised of advertising and public relations, insurance and other expenses, increased $0.3 million. This was offset by decreased compensation and fringe benefits of $0.7 million and data processing fees of $0.1 million.
54
Income Taxes. Income tax expense decreased $5.5 million to a benefit of $5.4 million for fiscal year 2010, from $0.1 million for fiscal year 2009. This decrease was primarily due to the net loss offset by a valuation allowance on deferred tax assets. The effective tax rate increased to12.2% in fiscal year 2010, as compared to 6.2% in fiscal year 2009.
The following table sets forth average balance sheets, average yields and costs, and certain other information for the periods indicated. All average balances are daily average balances at and for the years ended September 30, 2010 and 2009, respectively. Non-accrual loans were included in the computation of average balances but have been reflected in the table as loans carrying a zero yield. The yields set forth below include the effect of deferred fees, discounts and premiums that are amortized or accreted to interest income.
|
Years Ended September 30,
|
||||||||||||||||||||||||
|
2010
|
2009
|
|||||||||||||||||||||||
|
Average
|
Yield/
|
Average
|
Yield/
|
|||||||||||||||||||||
|
Balance
|
Interest
|
Cost
|
Balance
|
Interest
|
Cost
|
|||||||||||||||||||
|
Interest-earning assets:
|
||||||||||||||||||||||||
|
Loans
|
$ | 429,166 | $ | 26,777 | 6.24 | % | $ | 410,445 | $ | 30,074 | 7.33 | % | ||||||||||||
|
Mortgage-backed securities
|
67,386 | 3,417 | 5.07 | % | 77,784 | 3,696 | 4.75 | % | ||||||||||||||||
|
Investment securities and other interest-earning assets
|
10,841 | 253 | 2.33 | % | 9,546 | 341 | 3.57 | % | ||||||||||||||||
|
Total interest-earning assets
|
507,393 | 30,447 | 6.00 | % | 497,775 | 34,111 | 6.85 | % | ||||||||||||||||
|
Non interest-earning assets
|
19,042 | 18,049 | ||||||||||||||||||||||
|
Total assets
|
$ | 526,435 | $ | 515,824 | ||||||||||||||||||||
|
Interest-bearing liabilities:
|
||||||||||||||||||||||||
|
Savings accounts
|
$ | 64,036 | $ | 330 | 0.52 | % | $ | 60,110 | $ | 557 | 0.93 | % | ||||||||||||
|
Money market/NOW accounts
|
91,313 | 842 | 0.92 | % | 52,561 | 1,028 | 1.96 | % | ||||||||||||||||
|
Certificates of deposit
|
257,782 | 6,182 | 2.40 | % | 232,398 | 7,871 | 3.39 | % | ||||||||||||||||
|
Total interest-bearing deposits
|
413,131 | 7,354 | 1.78 | % | 345,069 | 9,456 | 2.74 | % | ||||||||||||||||
|
FHLB advances
|
11,833 | 242 | 2.04 | % | 42,281 | 354 | 0.84 | % | ||||||||||||||||
|
Total interest-bearing liabilities
|
424,964 | 7,596 | 1.79 | % | 387,350 | 9,810 | 2.53 | % | ||||||||||||||||
|
Non interest-bearing liabilities
|
28,141 | 41,214 | ||||||||||||||||||||||
|
Total liabilities
|
453,105 | 428,564 | ||||||||||||||||||||||
|
Retained earnings
|
73,330 | 87,260 | ||||||||||||||||||||||
|
Total liabilities and retained earnings
|
$ | 526,435 | $ | 515,824 | ||||||||||||||||||||
|
Net interest income
|
22,851 | 24,301 | ||||||||||||||||||||||
|
Interest rate spread
|
4.21 | % | 4.32 | % | ||||||||||||||||||||
|
Net interest-earning assets
|
$ | 82,429 | $ | 110,425 | ||||||||||||||||||||
|
Net interest margin
|
4.50 | % | 4.88 | % | ||||||||||||||||||||
|
Interest-earning assets to interest-bearing liabilities
|
119.40 | % | 128.51 | % | ||||||||||||||||||||
55
Rate/Volume Analysis
The following table presents the dollar amount of changes in interest income and interest expense for the major categories of our interest-earning assets and interest-bearing liabilities. Information is provided for each category of interest-earning assets and interest-bearing liabilities with respect to (i) changes attributable to changes in volume (i.e., changes in average balances multiplied by the prior-period average rate) and (ii) changes attributable to rate (i.e., changes in average rate multiplied by prior-period average balances). For purposes of this table, changes attributable to both rate and volume, which cannot be segregated, have been allocated proportionately to the change due to volume and the change due to rate.
|
Years Ended September 30,
|
||||||||||||
|
2010 vs. 2009
|
||||||||||||
|
Increase (Decrease) Due to
|
||||||||||||
|
Volume
|
Rate
|
Net
|
||||||||||
|
(In thousands)
|
||||||||||||
|
Interest-earning assets:
|
||||||||||||
|
Loans receivable
|
$ | 1,270 | $ | (4,567 | ) | $ | (3,297 | ) | ||||
|
Mortgage Backed Securities
|
$ | (511 | ) | $ | 231 | (280 | ) | |||||
|
Investment securities and other interest-earning assets
|
38 | (126 | ) | (88 | ) | |||||||
|
Total interest-earning assets
|
797 | (4,462 | ) | (3,665 | ) | |||||||
|
Interest-bearing liabilities:
|
||||||||||||
|
Savings accounts
|
28 | (255 | ) | (227 | ) | |||||||
|
Money market/NOW accounts
|
558 | (744 | ) | (186 | ) | |||||||
|
Certificates of deposit
|
734 | (2,423 | ) | (1,689 | ) | |||||||
|
Total interest-bearing deposits
|
1,320 | (3,422 | ) | (2,102 | ) | |||||||
|
FHLB advances
|
(438 | ) | 326 | (112 | ) | |||||||
|
Total interest-bearing liabilities
|
882 | (3,096 | ) | (2,214 | ) | |||||||
|
Net change in net interest income
|
$ | (85 | ) | $ | (1,366 | ) | $ | (1,451 | ) | |||
Liquidity and Capital Resources
We maintain liquid assets at levels we consider adequate to meet our liquidity needs. We adjust our liquidity levels to fund deposit outflows, pay real estate taxes on mortgage loans, repay our borrowings and to fund loan commitments. We also adjust liquidity as appropriate to meet asset and liability management objectives.
Our primary sources of liquidity are deposits, amortization and prepayment of loans and mortgage-backed securities, maturities of investment securities and other short-term investments, and earnings and funds provided from operations, as well as access to Federal Home Loan Bank advances. While scheduled principal repayments on loans and mortgage-backed securities are a relatively predictable source of funds, deposit flows and loan prepayments are greatly influenced by market interest rates, economic conditions and rates offered by our competition. We set the interest rates on our deposits to maintain a desired level of total deposits. In addition, we invest excess funds in short-term interest-earning assets, which provide liquidity to meet lending requirements.
56
A significant portion of our liquidity consists of cash and cash equivalents, which are a product of our operating, investing and financing activities. At September 30, 2010, $14.2 million of our assets were invested in cash and due from banks. Our primary sources of cash are principal repayments on loans, proceeds from the calls and maturities of investment securities, principal repayments of mortgage-backed securities and increases in deposit accounts. We invest excess funds in short-term interest-earning assets and other assets, which provide liquidity to meet our lending requirements. As of September 30, 2010, we had $10.5 million in borrowings outstanding from the Federal Home Loan Bank of New York and we have access to additional amounts in advances of up to $52.9 million from the Federal Home Loan Bank.
At September 30, 2010, we had $54.3 million in loan commitments outstanding, which included $36.0 million in undisbursed construction loans, $1.9 million in one- to four-family loans, $11.8 million in commercial real estate lines of credit and $4.6 million in unused home equity lines of credit. There were no commitments outstanding to originate primarily multi-family and nonresidential mortgage loans and no commercial letters of credit. Certificates of deposit due within one year of September 30, 2010 totaled $149.2 million, or 59.1%, of certificates of deposit. The large percentage of certificates of deposits that mature within one year reflects customers’ hesitancy to invest their funds for long periods in the current low interest rate environment. If these maturing deposits do not remain with us, we will be required to seek other sources of funds, including other certificates of deposit and borrowings. Depending on market conditions, we may be required to pay higher rates on these deposits or other borrowings than we currently pay on the certificates of deposit due on or before September 30, 2011. We believe, however, based on past experience that a significant portion of our certificates of deposit will remain with us. We have the ability to attract and retain deposits by adjusting the interest rates offered.
As reported in the consolidated statements of cash flows, our cash flows are classified by source for financial reporting purposes as operating, investing or financing cash flows. Net cash provided by (used in) operating activities was $3.5 million and $(58.3) million and $(79.3) million for the years ended September 30, 2010, 2009, and 2008, respectively. These amounts differ from our net income because of a variety of cash receipts and disbursements that did not affect net income for the respective periods. In 2010, the most significant components were the provision for loan losses and loss on other than temporary impairment, which totaled $42.7 million and $11.6 million, respectively. For prior years the most significant were originations and sales of loans held-for-sale. The net effect of these originations and sales was a cash outflow of $78.1 million and $110.7 million in fiscal years 2009, and 2008, respectively. Net cash provided by (used in) investing activities was $3.4 million, $17.0 million, and $(6.2) million in fiscal years 2010, 2009 and 2008, respectively, principally reflecting our loan and investment security activities in the respective periods. Investment securities net cash (purchases net of sales, principal repayments and maturities) provided by (used in) amounted to $(14.2) million, $3.5 million and $(4.9) million in the years ended September 30, 2010, 2009 and 2008, respectively. In fiscal year 2010 and 2009, the cash flows from financing activities were utilized primarily for the repayment of borrowings after funding loan originations and investment security purchases. In fiscal year 2008, the cash flows generated from financing activities were utilized primarily for loan originations and investment security purchases. Net deposit inflow of $21.3 million, net repayments of Federal Home Loan Bank overnight and term advances of $16.8 million and payment of dividends of $1.1 million comprised most of our financing activities that resulted in net cash provided by financing activities of $3.9 million in fiscal year 2010. Net deposit inflow of $59.6 million, net repayments of Federal Home Loan Bank overnight and term advances of $16.9 million, purchase of treasury shares of $1.3 million and payment of dividends of $1.5 million comprised most of our financing activities that resulted in net cash provided by financing activities of $39.7 million in fiscal year 2009 and net proceeds of $34.9 million of Federal Home Loan Bank advances, purchase of treasury shares of $4.0 million and net deposit inflow of $55.3 million comprised most of our financing activities which resulted in net cash provided by financing activities of $85.1 million in fiscal year 2008. The net effect of our operating, investing and financing activities was to increase our cash and cash equivalents from $5.4 million at the beginning of fiscal year 2008 to $14.2 million at the end of fiscal year 2010.
As of September 30, 2010, the most recent notification from the FDIC categorized the Bank as “well capitalized” under the regulatory framework for prompt corrective action. To be categorized as “well capitalized” the Bank must maintain minimum total risk-based, Tier I risk-based and Tier I leverage ratios as set forth in the table in Note 15. On March 31, 2011, the Bank entered into a cease and desist order issued by the OTS, under which, among other things, the Bank has agreed to achieve and maintain a Tier 1 Capital Ratio of at least 10% and a Total Risk-Based Capital Ratio of at least 15% by April 30, 2011. As a result of the cease and desist order, the Bank is no longer considered “well capitalized”. See Note 3 for additional requirements pertaining to the cease and desist order.
57
Off-Balance Sheet Arrangements. In the normal course of operations, we engage in a variety of financial transactions that, in accordance with generally accepted accounting principles, are not recorded in our financial statements. These transactions involve, to varying degrees, elements of credit, interest rate and liquidity risk and are used primarily to manage customers’ requests for funding and take the form of loan commitments and lines of credit. For information about our loan commitments and unused lines of credit, see note 15 of the Notes to the Consolidated Financial Statements.
For fiscal year 2010, we did not engage in any off-balance-sheet transactions other than loan origination and loan sale commitments in the normal course of our lending activities.
Impact of Inflation and Changing Prices
The consolidated financial statements and related notes have been prepared in accordance with United States generally accepted accounting principles (“GAAP”). GAAP generally requires the measurement of financial position and operating results in terms of historical dollars without consideration for changes in the relative purchasing power of money over time due to inflation. The impact of inflation is reflected in the increased cost of our operations. Unlike industrial companies, our assets and liabilities are primarily monetary in nature. As a result, changes in market interest rates have a greater impact on performance than do the effects of inflation.
Item 7A. Quantitative and Qualitative Disclosures About Market Risk
General. The majority of our assets and liabilities are monetary in nature. Consequently, our most significant form of market risk is interest rate risk. Our assets, consisting primarily of mortgage loans, have longer maturities than our liabilities, consisting primarily of deposits. As a result, a principal part of our business strategy is to manage interest rate risk and reduce the exposure of our net interest income to changes in market interest rates. Accordingly, our board of directors has approved guidelines for managing the interest rate risk inherent in our assets and liabilities, given our business strategy, operating environment, capital, liquidity and performance objectives. Senior management monitors the level of interest rate risk on a regular basis and the audit committee of the board of directors meets as needed to review our asset/liability policies and interest rate risk position.
We have sought to manage our interest rate risk in order to minimize the exposure of our earnings and capital to changes in interest rates. During the low interest rate environment that has existed in recent years, we have implemented the following strategies to manage our interest rate risk: (i) maintaining a high level of short-term liquid assets invested in cash and cash equivalents, short-term securities and mortgage-related securities that provide significant cash flows; (ii) generally selling longer-term mortgage loans; and (iii) lengthening the average term of our certificates of deposit. By investing in short-term, liquid instruments, we believe we are better positioned to react to increases in market interest rates. However, investments in shorter-term securities and cash and cash equivalents generally bear lower yields than longer-term investments. Thus, during periods of declining interest rates, our strategy of investing in liquid instruments has resulted in lower levels of interest income than would have resulted from investing in longer-term loans and investments. Management intends to lengthen the maturity of our earning assets as interest rates increase, which, in turn, should result in a higher yielding portfolio of interest-earning assets.
Net Portfolio Value. The OTS requires the computation of amounts by which the net present value of an institution’s cash flow from assets, liabilities and off-balance sheet items (the institution’s net portfolio value or “NPV”) would change in the event of a range of assumed changes in market interest rates. The OTS provides all institutions that file a Consolidated Maturity/Rate Schedule as a part of their quarterly Thrift Financial Report with an interest rate sensitivity report of net portfolio value. The OTS simulation model uses a discounted cash flow analysis and an option-based pricing approach to measuring the interest rate sensitivity of net portfolio value. Historically, the OTS model estimated the economic value of each type of asset, liability and off-balance sheet contract under the assumption that the United States Treasury yield curve increases or decreases instantaneously by 100 to 300 basis points in 100 basis point increments. A basis point equals one-hundredth of one percent, and 100 basis points equals one percent. An increase in interest rates from 3% to 4% would mean, for example, a 100 basis point increase in the “Change in Interest Rates” column below. The OTS provides us the results of the interest rate sensitivity model, which is based on information we provide to the OTS to estimate the sensitivity of our net portfolio value.
58
The table below sets forth, as of September 30, 2010, the latest date for which the OTS has provided the Bank an interest rate sensitivity report of its net portfolio value and the estimated changes in the Bank’s net portfolio value that would result from the designated instantaneous changes in the United States Treasury yield curve.
|
Estimated Increase
(Decrease) in NPV
|
NPV as a Percentage of
Present Value of Assets (3)
|
|||||||||||||||||||
|
Change in
Interest
Rates (basis
points) (1)
|
Estimated
NPV (2)
|
Amount
|
Percent
|
NPV Ratio
(4)
|
Increase
(Decrease)
(basis
points)
|
|||||||||||||||
|
(Dollars in thousands)
|
||||||||||||||||||||
|
+300
|
21,271 | 568 | 3.00 | % | 4.55 | % | 21 | bp | ||||||||||||
|
+200
|
22,710 | 2,007 | 10.00 | % | 4.81 | % | 47 | bp | ||||||||||||
|
+100
|
22,693 | 1,990 | 10.00 | % | 4.77 | % | 43 | bp | ||||||||||||
|
+50
|
21,641 | 937 | 5.00 | % | 4.54 | % | 21 | bp | ||||||||||||
|
0
|
20,703 | 4.33 | % | |||||||||||||||||
|
(50)
|
20,222 | (481 | ) | -2.00 | % | 4.22 | % | -11 | bp | |||||||||||
|
(100)
|
18,865 | (1,838 | ) | -9.00 | % | 3.94 | % | -39 | bp | |||||||||||
|
(1)
|
Assumes an instantaneous uniform change in interest rates at all maturities.
|
|
(2)
|
NPV is the discounted present value of expected cash flows from assets, liabilities and off-balance sheet contracts.
|
|
(3)
|
Present value of assets represents the discounted present value of incoming cash flows on interest-earning assets.
|
|
(4)
|
NPV Ratio represents NPV divided by the present value of assets.
|
The table above indicates that at September 30, 2010, in the event of a 100 basis point decrease in interest rates, we would experience a 9% decrease in net portfolio value. In the event of a 200 basis point increase in interest rates, we would experience a 10% increase in net portfolio value. Our interest rate risk management policy in the low interest rate environment that has existed in recent years has emphasized maintaining a significant percentage of our assets in cash and cash equivalents, shorter-term securities and mortgage-related securities that provide significant cash flows. The effect of this policy has been to reduce our level of net interest income. We have been willing to accept reduced levels of income in low interest rate environments in order to be better positioned to reinvest our assets in longer-term, higher yielding investments as interest rates rise.
Certain shortcomings are inherent in the methodology used in the above interest rate risk measurement. Modeling changes in net portfolio value requires making certain assumptions that may or may not reflect the manner in which actual yields and costs respond to changes in market interest rates. In this regard, the net portfolio value table presented assumes that the composition of our interest-sensitive assets and liabilities existing at the beginning of a period remains constant over the period being measured and assumes that a particular change in interest rates is reflected uniformly across the yield curve regardless of the duration or re-pricing of specific assets and liabilities. Accordingly, although the net portfolio value table provides an indication of our interest rate risk exposure at a particular point in time, it is not intended to and does not provide a precise forecast of the effect of changes in market interest rates on our net interest income and will differ from actual results.
59
PART II
Item 8. Financial Statements and Supplementary Data
The following are included in this item:
|
|
(a)
|
Report of Independent Registered Public Accounting Firm
|
|
|
(b)
|
Consolidated Financial Statements:
|
|
|
1.
|
Consolidated Statements of Financial Condition as of September 30, 2010 and 2009.
|
|
|
2.
|
Consolidated Statements of Operations for the years ended September 30, 2010 and 2009.
|
|
|
3.
|
Consolidated Statements of Changes in Stockholders’ Equity for the years ended September 30, 2010 and 2009.
|
|
|
4.
|
Consolidated Statements of Cash Flows for the years ended September 30, 2010 and 2009.
|
|
|
5.
|
Notes to the Consolidated Financial Statements.
|
60
BROOKLYN FEDERAL BANCORP, INC.
AND SUBSIDIARY
Index to Consolidated Financial Statements
|
Page
|
|
|
Report of Independent Registered Public Accounting Firms
|
62
|
|
Consolidated Statements of Financial Condition at September 30, 2010 and 2009
|
64
|
|
Consolidated Statements of Operations for the Years Ended September 30, 2010 and 2009
|
65
|
|
Consolidated Statements of Changes in Stockholders’ Equity for the Years Ended September 30, 2010 and 2009
|
66
|
|
Consolidated Statements of Cash Flows for the Years Ended September 30, 2010 and 2009
|
67
|
|
Notes to Consolidated Financial Statements
|
68
|
All schedules are omitted because the required information is not applicable or is included in the consolidated financial statements and related notes.
61
REPORT OF INDEPENDENT REGISTERED PUBLIC ACCOUNTING FIRM
Board of Directors and Stockholders
Brooklyn Federal Bancorp, Inc.
Brooklyn, New York
We have audited the accompanying consolidated statement of financial condition of Brooklyn Federal Bancorp, Inc. as of September 30, 2010, and the related consolidated statements of operations, changes in stockholders’ equity, and cash flows for the year then ended. The Company’s management is responsible for these financial statements. Our responsibility is to express an opinion on these financial statements based on our audit.
We conducted our audit in accordance with the standards of the Public Company Accounting Oversight Board (United States). Those standards require that we plan and perform the audit to obtain reasonable assurance about whether the financial statements are free of material misstatement. The Company is not required to, nor were we engaged to perform, an audit of its internal control over financial reporting. Our audit included consideration of internal control over financial reporting as a basis for designing audit procedures that are appropriate in the circumstances, but not for the purpose of expressing an opinion on the effectiveness of the Company’s internal control over financial reporting. Accordingly, we express no such opinion. An audit includes examining, on a test basis, evidence supporting the amounts and disclosures in the financial statements. An audit also includes assessing the accounting principles used and significant estimates made by management, as well as evaluating the overall financial statement presentation. We believe that our audit provide a reasonable basis for our opinion.
In our opinion, the consolidated financial statements referred to above present fairly, in all material respects, the financial position of Brooklyn Federal Bancorp, Inc. as of September 30, 2010, and the results of its operations and its cash flows for the year then ended, in conformity with accounting principles generally accepted in the United States of America.
As discussed in Note 3 to the consolidated financial statements, the Company has incurred significant net losses which have resulted in the Company being placed under a regulatory order. The regulatory order requires management to submit a contingency plan and places additional capital requirements on the Company, limitations on the use of certain funding sources, and restrictions on certain of the Company’s operations. Management’s plans in regard to these matters are also described in Note 3.
/s/ Crowe Horwath LLP
Crowe Horwath LLP
New York, New York
June 27, 2011
62
REPORT OF INDEPENDENT REGISTERED PUBLIC ACCOUNTING FIRM
To the Board of Directors and Stockholders
Brooklyn Federal Bancorp, Inc.
We have audited the accompanying consolidated statement of financial condition of Brooklyn Federal Bancorp, Inc. and Subsidiary (collectively, the “Company”) as of September 30, 2009, and the related consolidated statements of operations, changes in stockholders’ equity and cash flows for the year then ended. The Company’s management is responsible for these consolidated financial statements. Our responsibility is to express an opinion on these consolidated financial statements based on our audit.
We conducted our audit in accordance with the standards of the Public Company Accounting Oversight Board (United States). Those standards require that we plan and perform the audit to obtain reasonable assurance about whether the consolidated financial statements are free of material misstatement. The Company is not required to have, nor were we engaged to perform, an audit of its internal control over financial reporting. Our audit included consideration of internal control over financial reporting as a basis for designing audit procedures that are appropriate in the circumstances, but not for the purpose of expressing an opinion on the effectiveness of the Company’s internal control over financial reporting. Accordingly, we express no such opinion. An audit also includes examining, on a test basis, evidence supporting the amounts and disclosures in the consolidated financial statements, assessing the accounting principles used and significant estimates made by management, as well as evaluating the overall consolidated financial statement presentation. We believe that our audit provides a reasonable basis for our opinion.
In our opinion, the consolidated financial statements referred to above present fairly, in all material respects, the financial position of Brooklyn Federal Bancorp, Inc. and Subsidiary as of September 30, 2009 and the results of their operations and cash flows for the year then ended, in conformity with accounting principles generally accepted in the United States of America.
/ s / ParenteBeard LLC
ParenteBeard LLC
Clark, New Jersey
January 6, 2010
63
BROOKLYN FEDERAL BANCORP, INC. AND SUBSIDIARY
Consolidated Statements of Financial Condition
September 30, 2010 and 2009
(In thousands, except per share amounts and share data)
|
Assets
|
2010
|
2009
|
||||||
|
Cash and due from banks (including interest-earning balances of $12,559 and $2,105, respectively)
|
$ | 14,201 | $ | 3,472 | ||||
|
Securities:
|
||||||||
|
Available-for-sale
|
69,107 | 3,305 | ||||||
|
Held-to-maturity (estimated fair value of $59,334 at September 30, 2009)
|
-- | 66,201 | ||||||
|
Total securities
|
69,107 | 69,506 | ||||||
|
Loans receivable
|
387,783 | 430,435 | ||||||
|
Less: Allowance for loan losses
|
17,941 | 10,750 | ||||||
|
Loans receivable, net
|
369,842 | 419,685 | ||||||
|
Federal Home Loan Bank of New York (“FHLB”) stock, at cost
|
1,803 | 2,382 | ||||||
|
Bank owned life insurance
|
9,880 | 9,511 | ||||||
|
Accrued interest receivable
|
2,061 | 2,799 | ||||||
|
Premises and equipment, net
|
1,822 | 2,030 | ||||||
|
Prepaid expenses and other assets
|
19,039 | 12,060 | ||||||
|
Total assets
|
$ | 487,755 | $ | 521,445 | ||||
|
Liabilities and Stockholders’ Equity
|
||||||||
|
Liabilities:
|
||||||||
|
Deposits:
|
||||||||
|
Non-interest-bearing deposits
|
$ | 16,033 | $ | 16,595 | ||||
|
Interest-bearing deposits
|
154,800 | 134,664 | ||||||
|
Certificates of deposit
|
252,573 | 250,811 | ||||||
|
Total deposits
|
423,406 | 402,070 | ||||||
|
Borrowings
|
10,500 | 27,300 | ||||||
|
Advance payments by borrowers for taxes and insurance
|
2,576 | 2,142 | ||||||
|
Accrued expenses and other liabilities
|
5,534 | 8,059 | ||||||
|
Total liabilities
|
442,016 | 439,571 | ||||||
|
Stockholders’ equity:
|
||||||||
|
Preferred stock, $0.01 par value, 1,000,000 shares authorized; none issued
|
-- | -- | ||||||
|
Common stock, $0.01 par value, 20,000,000 shares authorized; 13,484,210 issued and 12,889,344 and 12,890,754 outstanding, respectively
|
135 | 135 | ||||||
|
Additional paid-in capital
|
43,119 | 43,112 | ||||||
|
Retained earnings - substantially restricted
|
12,687 | 52,671 | ||||||
|
Treasury shares - at cost, 594,866 shares and 593,456 shares, respectively
|
(7,720 | ) | (7,707 | ) | ||||
|
Unallocated common stock held by employee stock ownership plan (“ESOP”)
|
(2,235 | ) | (2,394 | ) | ||||
|
Unallocated shares of the stock-based incentive plan
|
(259 | ) | (417 | ) | ||||
|
Accumulated other comprehensive income (loss):
|
||||||||
|
Net unrealized gain (loss) on securities, net of income tax benefit
|
12 | (3,526 | ) | |||||
|
Total stockholders’ equity
|
45,739 | 81,874 | ||||||
|
Total liabilities and stockholders’ equity
|
$ | 487,755 | $ | 521,445 | ||||
See accompanying notes to consolidated financial statements.
64
BROOKLYN FEDERAL BANCORP, INC. AND SUBSIDIARY
Consolidated Statements of Operations
Years Ended September 30, 2010 and 2009
(In thousands, except per share amounts and share data)
|
2010
|
2009
|
|||||||
|
Interest income:
|
||||||||
|
First mortgage and other loans
|
$ | 26,777 | $ | 30,074 | ||||
|
Mortgage-backed securities
|
3,417 | 3,696 | ||||||
|
Other securities and interest-earning assets
|
253 | 341 | ||||||
|
Total interest income
|
30,447 | 34,111 | ||||||
|
Interest expense:
|
||||||||
|
Deposits
|
7,355 | 9,456 | ||||||
|
Borrowings
|
242 | 354 | ||||||
|
Total interest expense
|
7,597 | 9,810 | ||||||
|
Net interest income before provision for loan losses
|
22,850 | 24,301 | ||||||
|
Provision for loan losses
|
42,682 | 8,545 | ||||||
|
Net interest (loss) income after provision for loan losses
|
(19,832 | ) | 15,756 | |||||
|
Non-interest income:
|
||||||||
|
Total loss on OTTI of securities
|
(11,589 | ) | (8,951 | ) | ||||
|
Less:
|
||||||||
|
Non-credit portion of OTTI recorded in other comprehensive income (before taxes)
|
- | 6,061 | ||||||
|
Net loss on OTTI recognized in earnings
|
(11,589 | ) | (2,890 | ) | ||||
|
Banking fees and service charges
|
801 | 1,358 | ||||||
|
Net gain on sale of loans held-for-sale
|
254 | 277 | ||||||
|
Net gain on sales of securities available-for-sale
|
92 | - | ||||||
|
Other
|
587 | 519 | ||||||
|
Total non-interest income (loss)
|
(9,855 | ) | (736 | ) | ||||
|
Non-interest expense:
|
||||||||
|
Compensation and fringe benefits
|
7,847 | 8,591 | ||||||
|
Occupancy and equipment
|
1,843 | 1,750 | ||||||
|
FDIC Insurance
|
786 | 687 | ||||||
|
Professional fees
|
1,760 | 489 | ||||||
|
Data processing fees
|
668 | 718 | ||||||
|
Other
|
1,726 | 1,413 | ||||||
|
Total non-interest expense
|
14,630 | 13,648 | ||||||
|
(Loss) income before income tax expense
|
(44,317 | ) | 1,372 | |||||
|
Income tax (benefit) expense
|
(5,386 | ) | 85 | |||||
|
Net (loss) income
|
$ | (38,931 | ) | $ | 1,287 | |||
|
(Loss) earnings per common share:
|
||||||||
|
Basic
|
$ | (3.08 | ) | $ | 0.10 | |||
|
Diluted
|
$ | (3.08 | ) | $ | 0.10 | |||
|
Average common shares outstanding:
|
||||||||
|
Basic
|
12,626,880 | 12,638,722 | ||||||
|
Diluted
|
12,626,880 | 12,643,613 | ||||||
See accompanying notes to consolidated financial statements.
65
BROOKLYN FEDERAL BANCORP, INC. AND SUBSIDIARY
Consolidated Statements of Changes in Stockholders’ Equity
Years Ended September 30, 2010 and 2009
(In thousands, except share data)
|
Common
Stock
|
Additional
Paid-in
Capital
|
Retained
Earnings-
Substantially
Restricted
|
Treasury
Stock
|
Unallocated
Common
Stock Held
by ESOP
|
Unallocated
Shares of
the Stock-
based
Incentive
Plan
|
Accumulated
Other
Comprehensive
Income (Loss)
|
Total
|
|||||||||||||||||||||||||
|
Balance at October 1, 2008
|
$ | 135 | $ | 42,939 | $ | 52,839 | $ | (6,443 | ) | $ | (2,552 | ) | $ | (595 | ) | $ | -- | $ | 86,323 | |||||||||||||
|
Comprehensive income:
|
||||||||||||||||||||||||||||||||
|
Net income
|
-- | -- | 1,287 | -- | -- | -- | -- | 1,287 | ||||||||||||||||||||||||
|
Net unrealized loss on securities available-for-sale, net of income tax benefit of $377
|
-- | -- | -- | -- | -- | -- | (473 | ) | (473 | ) | ||||||||||||||||||||||
|
Loss on impairment of securities available-for- sale, net of income tax benefit of $383
|
-- | -- | -- | -- | -- | -- | 483 | 483 | ||||||||||||||||||||||||
|
Unrealized loss on securities held-to-maturity, net of income tax benefit of $3,386
|
-- | -- | -- | -- | -- | -- | (4,666 | ) | (4,666 | ) | ||||||||||||||||||||||
|
Loss on impairment of securities held-to-maturity, net of income tax benefit of $894
|
-- | -- | -- | -- | -- | -- | 1,130 | 1,130 | ||||||||||||||||||||||||
|
Total comprehensive loss
|
(2,239 | ) | ||||||||||||||||||||||||||||||
|
Treasury stock purchased (109,327 shares)
|
-- | -- | -- | (1,264 | ) | -- | -- | -- | (1,264 | ) | ||||||||||||||||||||||
|
Allocation of ESOP stock
|
-- | 38 | -- | -- | 158 | -- | -- | 196 | ||||||||||||||||||||||||
|
Stock-based incentive plan expense
|
-- | 135 | -- | -- | -- | 178 | -- | 313 | ||||||||||||||||||||||||
|
Dividends paid on common stock, $0.40 per share
|
-- | -- | (1,455 | ) | -- | -- | -- | -- | (1,455 | ) | ||||||||||||||||||||||
|
Balance at September 30, 2009
|
$ | 135 | $ | 43,112 | $ | 52,671 | $ | (7,707 | ) | $ | (2,394 | ) | $ | (417 | ) | $ | (3,526 | ) | $ | 81,874 | ||||||||||||
|
Balance at October 1, 2009
|
$ | 135 | $ | 43,112 | $ | 52,671 | $ | (7,707 | ) | $ | (2,394 | ) | $ | (417 | ) | $ | (3,526 | ) | $ | 81,874 | ||||||||||||
|
Comprehensive income:
|
||||||||||||||||||||||||||||||||
|
Net loss
|
-- | -- | (38,931 | ) | -- | -- | -- | -- | (38,931 | ) | ||||||||||||||||||||||
|
Net unrealized loss on securities available-for-sale, net of income tax benefit of $2,317
|
-- | -- | -- | -- | -- | -- | (3,019 | ) | (3,019 | ) | ||||||||||||||||||||||
|
Loss on impairment of securities available-for- sale, net of income tax benefit of $5,032
|
-- | -- | -- | -- | -- | -- | 6,557 | 6,557 | ||||||||||||||||||||||||
|
Total comprehensive loss
|
(35,393 | ) | ||||||||||||||||||||||||||||||
|
Treasury stock purchased (1,410 shares)
|
-- | -- | -- | (13 | ) | -- | -- | -- | (13 | ) | ||||||||||||||||||||||
|
Allocation of ESOP stock
|
-- | (60 | ) | -- | -- | 159 | -- | -- | 99 | |||||||||||||||||||||||
|
Stock-based incentive plan expense
|
-- | 67 | -- | -- | -- | 158 | -- | 225 | ||||||||||||||||||||||||
|
Dividends paid on common stock, $0.29 per share
|
-- | -- | (1,053 | ) | -- | -- | -- | -- | (1,053 | ) | ||||||||||||||||||||||
|
Balance at September 30, 2010
|
$ | 135 | $ | 43,119 | $ | 12,687 | $ | (7,720 | ) | $ | (2,235 | ) | $ | (259 | ) | $ | 12 | $ | 45,739 | |||||||||||||
|
See accompanying notes to consolidated financial statements.
|
||||||||||||||||||||||||||||||||
66
BROOKLYN FEDERAL BANCORP, INC. AND SUBSIDIARY
Consolidated Statements of Cash Flows
Years Ended September 30, 2010 and 2009
(In thousands)
|
|
For the Year Ended
|
|||||||
|
September 30,
|
||||||||
|
2010
|
2009
|
|||||||
|
Cash flows from operating activities:
|
|
|
||||||
|
Net income
|
$ | (38,931 | ) | $ | 1,287 | |||
|
Adjustments to reconcile net income to net cash used in operating activities:
|
||||||||
|
ESOP expense
|
118 | 196 | ||||||
|
Stock-based incentive plan expense
|
225 | 313 | ||||||
|
Depreciation and amortization
|
458 | 447 | ||||||
|
Provision for loan losses
|
42,682 | 8,545 | ||||||
|
Income from bank-owned life insurance
|
(354 | ) | (365 | ) | ||||
|
Gross loss on OTTI recognized in earnings
|
11,589 | 2,890 | ||||||
|
Amortization of servicing rights
|
76 | 188 | ||||||
|
Accretion of deferred loan fees, net
|
(615 | ) | (508 | ) | ||||
|
Accretion of discounts, net of amortization of premiums
|
(330 | ) | (186 | ) | ||||
|
Originations of loans held-for-sale
|
(7,217 | ) | (93,695 | ) | ||||
|
Proceeds from sales of loans held-for-sale
|
7,351 | 15,560 | ||||||
|
Principal repayments on loans held-for-sale
|
2 | 11,887 | ||||||
|
Net gain on sales of loans held-for-sale
|
(136 | ) | (277 | ) | ||||
|
(Increase) decrease in accrued interest receivable
|
738 | (322 | ) | |||||
|
Deferred income tax expense (benefit)
|
6,856 | (4,791 | ) | |||||
|
Net gain on sales of securities available-for-sale
|
(92 | ) | -- | |||||
|
(Increase) decrease in prepaid expenses and other assets
|
(16,426 | ) | 911 | |||||
|
Decrease in accrued expenses and other liabilities
|
(2,524 | ) | (348 | ) | ||||
|
Net cash provided by (used in) operating activities
|
3,470 | (58,268 | ) | |||||
|
Cash flows from investing activities:
|
||||||||
|
Repayments in excess of loan originations
|
9,276 | 11,884 | ||||||
|
Purchase of loans receivable
|
(1,500 | ) | -- | |||||
|
Principal repayments on mortgage-backed securities held-to-maturity
|
16,319 | 19,247 | ||||||
|
Principal repayments on mortgage-backed securities available-for-sale
|
5,413 | -- | ||||||
|
Purchases of mortgage-backed securities held-to-maturity
|
(15,699 | ) | (15,228 | ) | ||||
|
Purchases of securities available-for-sale
|
(20,222 | ) | (500 | ) | ||||
|
Proceeds from sale of securities available-for-sale
|
9,454 | -- | ||||||
|
Purchase of certificates of deposit
|
(3,000 | ) | -- | |||||
|
Maturities of certificates of deposit
|
3,000 | 1,397 | ||||||
|
Net redemptions of FHLB stock
|
579 | 420 | ||||||
|
Increase in cash surrender value of bank-owned life insurance
|
(15 | ) | (15 | ) | ||||
|
Purchases of premises and equipment, net
|
(250 | ) | (192 | ) | ||||
|
Net cash provided by (used in) investing activities
|
3,355 | 17,013 | ||||||
|
Cash flows from financing activities:
|
||||||||
|
Increase in deposits
|
21,336 | 59,595 | ||||||
|
Net decrease in short term borrowings
|
(21,500 | ) | (20,439 | ) | ||||
|
Proceeds from long term borrowings
|
5,000 | 3,500 | ||||||
|
Repayments of long term borrowings
|
(300 | ) | -- | |||||
|
Increase (decrease) in advance payments by borrowers for taxes and insurance
|
434 | (247 | ) | |||||
|
Purchase of treasury stock
|
(13 | ) | (1,264 | ) | ||||
|
Payment of cash dividend
|
(1,053 | ) | (1,471 | ) | ||||
|
Net cash provided by financing activities
|
3,904 | 39,674 | ||||||
|
Net increase (decrease) in cash and cash equivalents
|
10,729 | (1,581 | ) | |||||
|
Cash and cash equivalents at beginning of year
|
3,472 | 5,053 | ||||||
|
Cash and cash equivalents at end of period
|
$ | 14,201 | $ | 3,472 | ||||
|
Supplemental disclosure of cash flow information:
|
||||||||
|
Cash paid during the period for:
|
||||||||
|
Interest
|
$ | 7,593 | $ | 9,829 | ||||
|
Taxes
|
4,622 | 4,120 | ||||||
|
Other:
|
||||||||
|
Securities held-to-maturity transferred to available-for-sale
|
61,280 | -- | ||||||
|
Mortgage loans held-for-sale transferred to held-to-maturity
|
-- | 200,455 | ||||||
See accompanying notes to consolidated financial statements.
67
Notes to Consolidated Financial Statements
|
(1)
|
Reorganization and Stock Offering
|
On April 5, 2005, Brooklyn Federal Savings Bank (the “Bank”) completed its reorganization into a mutual holding company structure (the “Reorganization”). As part of the Reorganization, the Bank converted from a federally-chartered mutual savings bank to a federally-chartered stock savings bank (the “Conversion”). The Bank became the wholly-owned subsidiary of Brooklyn Federal Bancorp, Inc., a federal corporation (the “Company”), which became the majority-owned subsidiary of BFS Bancorp, MHC (the “Mutual Holding Company”). The Company issued a total of 13,225,000 common shares on April 5, 2005, consisting of 3,967,500 shares (30%) sold to the public (the “Offering”) and 9,257,500 shares (70%) issued to the Mutual Holding Company. The gross proceeds from the offering were approximately $39.7 million, less offering costs of approximately $1.8 million.
|
(2)
|
Nature of Business and Summary of Significant Accounting Policies
|
The Bank is a community-oriented savings institution whose business primarily consists of accepting deposits from customers within its market area (Brooklyn, Nassau and Suffolk Counties, New York) and investing those funds principally in mortgage loans secured by one- to four-family residences, multi-family properties and commercial properties, and in mortgage-backed securities. Substantially all of the Bank’s loans are collateralized or dependent on real estate.
Effective July 1, 2009, we adopted the provisions of Financial Accounting Standards Board, or FASB, Accounting Standards Codification™, (the “FASB ASC”), which is now the source of authoritative, non-governmental U.S. generally accepted accounting principles (“GAAP”). While the FASB ASC did not change GAAP, all existing authoritative accounting literature, with certain exceptions, was superseded and codified into the FASB ASC. The references to authoritative accounting literature contained in our disclosures have been modified to refer to general accounting topics within the FASB ASC.
Deposits are insured up to applicable limits by the Deposit Insurance Fund of the Federal Deposit Insurance Corporation (“FDIC”). The Bank’s and the Company’s primary regulator is the OTS.
|
|
(a)
|
Basis of Presentation
|
The accompanying consolidated financial statements are prepared in conformity with GAAP and include the accounts of the Company, the Bank and the Bank’s wholly owned subsidiaries (collectively, the “Company”). The Bank’s wholly-owned subsidiaries are Thrift Investors Service Corporation (“TISCO”), 3D Holding Corp., Inc., and BFS REIT, Inc. (“BFS REIT”). BFS REIT is a real estate investment trust formed to hold mortgage-related assets. TISCO’s wholly owned subsidiary, BFS Agency, provides insurance services to the customers of the Bank. 3D Holding Corp., Inc. was formed to hold title to certain properties acquired by the Bank through foreclosure. All significant inter-company balances and transactions are eliminated in consolidation.
The preparation of consolidated financial statements, in conformity with GAAP, requires management to make estimates and assumptions that affect the reported amounts of assets and liabilities and disclosures of contingent assets and liabilities at the date of the financial statements and the reported amounts of revenues and expenses during the reporting periods. Material estimates that are particularly susceptible to significant change relate to the determination of the allowance for loan losses, identification of other-than-temporary impairment of securities and the determination of the amount of deferred tax assets that are more likely than not to be realized.
68
(b) Cash and Cash Equivalents
Cash and cash equivalents include cash, due from banks, federal funds sold and term deposits with the Federal Home Loan Bank with original maturities of less than 90 days.
(c) Securities
The Company reports debt and equity securities in one of the following categories: (i) “held-to-maturity” (management has positive intent and ability to hold debt securities to maturity) which are reported at cost adjusted for the amortization of premiums and accretion of discounts; (ii) “trading” (held for current resale) which are reported at fair value, with unrealized gains and losses included in earnings; or (iii) “available-for-sale” (all other debt and equity securities) which are reported at fair value, with unrealized gains and losses excluded from earnings and reported net of deferred income taxes as a separate component of accumulated other comprehensive income (loss), a component of stockholders’ equity. The Company classifies its securities in one of these categories based upon determinations made at the time of purchase.
Premiums and discounts on debt securities are amortized and accreted to interest income using the level-yield method over the term of the security, adjusted for the effect of actual prepayments in the case of mortgage-backed securities. Gains and losses on the sales of securities are recognized when sold using the specific identification method.
In April 2009, the FASB issued guidance regarding the recognition and presentation of Other-Than-Temporary Impairments (“OTTI”). Equity securities deemed to be other-than-temporarily impaired are written down from their original cost basis to fair value by a charge to current earnings. The guidance clarified the interaction of the factors that should be considered when determining whether a debt security is other-than-temporarily impaired. For debt securities, management must assess whether (a) it has the intent to sell the security or (b) it is more likely than not that it will be required to sell the security prior to its anticipated recovery. These steps are done before assessing whether the entity will recover the cost basis of the investment. Previously, this assessment required management to assert it has both the intent and the ability to hold a security for a period of time sufficient to allow for an anticipated recovery in fair value to avoid recognizing an OTTI charge. This change does not affect the need to forecast recovery of the value of the security through either cash flows or market price. For equity securities, when OTTI has been determined, OTTI charge is recognized through earnings.
In instances when a determination is made that an OTTI exists but the investor does not intend to sell the debt security and it is not more likely than not that it will be required to sell the debt security prior to its anticipated recovery, the guidance changes the presentation and amount of the OTTI recognized in the income statement. The OTTI is separated into (a) the amount of the total OTTI related to a decrease in cash flows expected to be collected from the debt security (the credit loss) and (b) the amount of the total OTTI related to all other factors. The amount of the total OTTI related to the credit loss is recognized in earnings. The amount of the total OTTI related to all other factors is recognized in accumulated other comprehensive income.
Management evaluates securities for other-than-temporary impairment on a quarterly basis.
69
(d) Federal Home Loan Bank of New York Stock
As a member of the Federal Home Loan Bank, the Bank is required by law to hold a certain amount of Federal Home Loan Bank stock. The stock is a nonmarketable equity security and, accordingly, is recorded at cost.
(e) Loan Sales and Syndications
From time to time, the Company sells whole loans (principally commercial mortgage and residential mortgage loans) and loan participation interests (principally portions of multi-family, commercial mortgage and construction loans). Sales are generally made on a servicing-retained basis, except for certain sales of whole commercial mortgage loans for which servicing is released to the purchaser. These transactions are accounted for as sales based on application of the criteria set forth in FASB-issued guidance. These criteria provide that the Company, as transferor, must surrender control over the transferred assets (i.e., the loans sold) in order to record a sale. The criteria specify that (i) the transferred assets have been isolated from the transferor (put presumptively beyond the reach of the transferor and its creditors, even in bankruptcy or other receivership); (ii) each transferee has the right to pledge or exchange the assets it received; and (iii) the transferor does not maintain effective control over the transferred assets through an agreement to repurchase the assets or an ability to unilaterally cause the holder to return specific assets. For sales of loan participation interests, FASB-issued guidance specifies that the criteria are met if the purchaser has the right to pledge or exchange its participation interests after obtaining the Company’s permission to do so (which permission shall not be unreasonably withheld). All of the Company’s whole loan and loan participation transactions have met the required criteria and, accordingly, have been accounted for as sales. The principal effects of sales accounting are the de-recognition of the whole loans and loan participation interests sold, and the recognition of a gain or loss on sale.
Gains and losses on sales of whole loans and loan participation interests are recognized when the sales proceeds are received, and are measured in accordance with FASB-issued guidance. The cost basis of the loan sold is allocated, based on relative fair values, between the loan sold and the servicing right retained which is included in other assets. All but a minor portion of the Company’s loan sales have been made on a non-recourse basis. Recourse obligations, if any, are determined based on an estimate of probable credit losses over the term of the loans. Servicing assets and recourse liabilities on loan sales through September 30, 2010 have had an immaterial effect on the Company’s financial position and results of operations. Loan servicing income is reported in non-interest income.
The Company also engages in loan syndication transactions, which are not transfers of financial assets. A syndication of a loan is distinguished from a loan participation in that, in a syndication, the other lenders are identified prior to loan closing and are committed to fund a portion of the total loan at closing. In a loan participation, however, the other participants purchase a portion of the total loan from the lead lender after the lead lender has closed and funded the entire loan. As the enterprise managing loan syndications, the Company receives loan syndication fees from the borrower and accounts for these fees in accordance with FASB-issued guidance. Accordingly, syndication fees are recognized in income when the syndication is complete if the yield on the portion of the loan retained by the Company is at least equal to the average yield earned by the other lenders in the syndication. The Company does not assume any recourse obligations on its loan syndications, as each lender’s credit risk is based on its own portion of the loan.
70
(f) Loans Receivable, Net
Loans receivable are stated at unpaid principal balances adjusted for net deferred loan origination fees and the allowance for loan losses. Loan origination fees, net of certain loan origination costs, are deferred and subsequently recognized in interest income as a yield adjustment using the level-yield method over the contractual life of the loan. When loans are prepaid prior to contractual maturity, any remaining deferred amounts are recognized in interest income. Prepayment penalties are also recognized in interest income, at the time of receipt, when the borrower does not refinance with the Company or when the terms (including effective yield) of a refinanced loan are at least as favorable as the terms of comparable loans to other borrowers of similar creditworthiness.
Interest is accrued monthly on the outstanding balance of mortgages and other loans unless management considers collection to be doubtful. Loans are generally placed on non-accrual status when principal or interest payments are in arrears 90 days or more or when other factors indicate that the collection of these amounts is doubtful. When loans are placed on non-accrual status, interest previously accrued but not received is reversed and charged against current income. Income on non-accrual loans is subsequently recognized only to the extent cash is received and full collectability of principal is anticipated.
(g) Allowance for Loan Losses
The allowance for loan losses is established through provisions for losses charged to earnings. Losses on loans (including impaired loans) are charged to the allowance for loan losses when management believes that the collection of principal is unlikely. Recoveries of loans previously charged-off are credited to the allowance when realized.
Loans are charged-off in whole or in part when it has been determined that there has been a loss of principal. For real estate secured loans, this determination is normally made in conjunction with a current appraisal analysis. Initial write-downs on foreclosed assets are also charged-off against the allowance for loan losses.
Factors considered in management’s periodic evaluation of the adequacy of the allowance for loan losses include the Company’s historical loss experience, current economic conditions, delinquency statistics, geographic concentrations, the financial strength of the borrower, the estimated value of underlying collateral and the results of internal and external loan reviews. While management uses available information to recognize losses on loans, future additions to the allowance may be necessary based on changes in economic conditions.
The Company considers a loan to be impaired when, based upon current information and events, it is probable that it will be unable to collect all principal and interest contractually due. The Company applies these criteria primarily to its commercial, multi-family and construction loans on at least a quarterly basis. Impairment is measured as the excess of the loan balance over (i) the present value of the loan’s expected future cash flows (including principal and interest) discounted at the loan’s effective interest rate or (ii) the fair value of the underlying collateral if the loan is collateral dependent. These impairments are specific allocations within the allowance for loan losses. Impairment criteria generally do not apply to those smaller-balance homogeneous loans that are collectively evaluated for impairment, such as the Company’s one-to-four family mortgage loans. These collective evaluations result in general allocations within the allowance for loan losses that are determined by applying loss factors to the loan balances in the various portfolio categories. These loss factors are determined by management in consideration of the degree of credit risk involved in each portfolio category, historical loss experience, current economic conditions, delinquency statistics and geographic concentrations.
71
(h) Premises and Equipment
Premises and equipment are carried at cost less accumulated depreciation and amortization. Depreciation expense is provided on a straight-line basis over the estimated useful lives of the related assets, which are 50 years for buildings and three to ten years for furniture and equipment. Amortization of leasehold improvements is recognized on a straight-line basis over the shorter of the terms of the related leases or the estimated useful lives of the assets, resulting in amortization periods ranging from 12 to 15 years.
(i) Bank-Owned and Split-Dollar Life Insurance
The Bank owns life insurance policies on the lives of certain of its officers. The cash surrender value of the policies is recorded as an asset and the change in that value is recorded as non-interest income. Death benefit proceeds received in excess of a policy’s cash surrender value are recognized in income upon receipt. Cash surrender values totaling $9.9 million and $9.5 million are reflected in the consolidated statements of financial condition as of September 30, 2010 and 2009, respectively. There are no policy loans offset against the cash surrender values or restrictions on the use of the proceeds.
The Bank has also entered into agreements with certain of its officers with respect to split-dollar life insurance policies owned by the officer. The Bank pays the policy premiums and holds an assignment of policy proceeds payable at death sufficient to repay all premiums. The amount by which any death benefits exceeds the premiums paid by the Bank will be paid to the beneficiary or beneficiaries designated by the Bank officer. Aggregate premiums paid by the Bank of $0.6 million are included in other assets in the consolidated statements of financial condition as of September 30, 2010 and 2009, respectively.
|
|
(j)
|
Income Taxes
|
Using the asset and liability method, deferred tax assets and liabilities are recognized for the future tax consequences attributable to differences between the financial statement carrying amounts of existing assets and liabilities and their respective tax bases. To the extent that current available evidence about the future raises doubt about the realization of a deferred tax asset, a valuation allowance is established. Deferred tax assets and liabilities are measured using enacted tax rates expected to apply to taxable income in the years in which those temporary differences are expected to be recovered or settled. The effect on deferred tax assets and liabilities of a change in tax rates is recognized in income tax expense in the period that includes the enactment date.
The Company follows FASB guidance which provides clarification on accounting for uncertainty in income taxes recognized in an enterprise’s financial statements in accordance with FASB ASC 740. The guidance prescribes a recognition threshold and measurement attribute for the financial statement recognition and measurement of a tax position taken or expected to be taken in a tax return, and also provides guidance on derecognition, classification, interest and penalties, accounting in interim periods, disclosure and transition. As a result of the Company’s evaluation of the FASB-issued guidance, no significant income tax uncertainties were identified. Therefore, the Company recognized no adjustment for unrecognized income tax benefits for the years ended September 30, 2010 and 2009. Our policy is to recognize interest and penalties on unrecognized tax benefits in income tax expense in the Consolidated Statements of Operations. The Company recognized no interest and penalties during the fiscal years ended September 30, 2010 and 2009. The tax years subject to examination by the taxing authorities are the years ended September 30, 2009, 2008 and 2007. On December 22, 2009, the New York City Department of Finance commenced an audit for the 2008, 2007 and 2006 fiscal year ends and concluded that no adjustment is necessary pursuant to the audit.
72
|
|
(k)
|
Comprehensive Income
|
Comprehensive income consists of net income, the change in net unrealized appreciation or depreciation in the fair value of securities available-for-sale, net of taxes, and the non-credit related unrealized losses of other-than-temporarily impaired held-to-maturity securities, net of taxes.
|
|
(l)
|
Employee Stock Ownership Plan (“ESOP”)
|
Compensation expense is recognized for the ESOP equal to the fair value of shares that have been allocated or committed to be released for allocation to participants. Any difference between the fair value at that time and the ESOP’s original acquisition cost is charged or credited to stockholders’ equity (additional paid-in capital). The cost of ESOP shares that have not yet been allocated or committed to be released for allocation is deducted from stockholders’ equity.
(m) Stock Compensation Plans
The Company follows FASB ASC 718-10 for equity instruments awarded under the Brooklyn Federal Bancorp, Inc. 2006 Stock-Based Incentive Plan which became effective on April 11, 2006. Under FASB-issued guidance, the Company measures the cost of employee services received in exchange for any award of equity instruments based on the grant-date fair value of the award and recognizes that cost over the period during which an employee is required to provide service in exchange for the award (usually the vesting period). For stock options and similar instruments, grant-date fair value will be estimated using option-pricing models adjusted for the unique characteristics of instruments.
(n) Advertising
The company expenses advertising and marketing costs as incurred. For the fiscal year ended September 30, 2010, these costs were $0.1 million compared to $0.1 million for the year ended September 30, 2009.
(o) Earnings Per Share (“EPS”)
Basic EPS is based on the weighted average number of common shares actually outstanding, and is adjusted for ESOP shares not yet committed to be released, unvested restricted stock awards and deferred compensation obligations required to be settled in shares of Company stock. Diluted EPS reflects the potential dilution that could occur if securities or other contracts to issue common stock, such as unvested restricted stock awards and outstanding stock options, were exercised or converted into common stock or resulted in the issuance of common stock that then shared in the earnings of the Company. Diluted EPS is calculated by adjusting the weighted average number of shares of common stock outstanding to include the effect of contracts or securities exercisable (such as stock awards and options) or which could be converted into common stock, if dilutive, using the treasury stock method. The calculation of diluted EPS for the year ended September 30, 2010 includes incremental shares related to unvested restricted stock awards of which there were none in 2010. At September 30, 2010, there were no incremental shares related to outstanding stock options. The calculation of diluted EPS for the year ended September 30, 2009 includes incremental shares related to unvested restricted stock awards of 4,891. At September 30, 2009, there were no incremental shares related to outstanding stock options. Shares issued and reacquired during any period are weighted for the portion of the period they were outstanding.
73
(p) Segment Information
Public companies are required to report certain financial information about significant revenue-producing segments of the business for which this financial information is available and utilized by the chief operating decision maker. As a community-oriented financial institution, substantially all of the Company’s operations involve the delivery of loan and deposit products to customers. Management makes operating decisions and assesses performance based on an ongoing review of these community banking operations, which constitute the Company’s only operating segment for financial reporting purposes.
(q) Concentration of Risk
Financial instruments which potentially subject the Company and its subsidiaries to concentrations of credit risk consist of cash and cash equivalents, loans receivable and mortgage-backed securities. Cash and cash equivalents include deposits placed in other financial institutions. At September 30, 2010, the Company had $9.6 million and $3.0 million on deposit with the Federal Home Loan Bank of New York and Federal Reserve Bank of New York, respectively. Securities include concentrations of investments in mortgage-backed securities and to a lesser extent in U.S. Government agency securities and mutual funds. The Bank’s lending activity is primarily concentrated in loans collateralized by real estate in the State of New York. As a result, credit risk is broadly dependent on the real estate market and general economic conditions in the state. Additionally, the Bank’s lending policies limit the amount of credit extended to any single borrower and their related interests thereby limiting the concentration of credit risk to any single borrower.
(r) Interest Rate Risk
The Bank is principally engaged in the business of attracting deposits from the general public and using these deposits, together with other funds, to originate or purchase loans for its portfolio and invest in securities. Taken together, these activities present interest rate risk to the Company’s earnings and capital that generally arise from differences between the timing of rate changes and the timing of cash flows (re-pricing risk); from changing rate relationships among yield curves that affect bank activities (basis risk); from changing rate relationships across the spectrum of maturities (yield curve risk); and from interest-rate-related options embedded in bank products (option risk).
In particular, interest rate risk within the Bank’s balance sheet results from the generally shorter duration of its interest-sensitive liabilities compared to the generally longer duration of its interest-sensitive assets. In a rising rate environment, liabilities will re-price faster than assets. As a result, the Bank’s cost of interest-bearing liabilities will increase faster than its yield on interest-earning assets, thereby reducing the Bank’s net interest rate spread and net interest margin and adversely impacting net income. A similar result occurs when the interest rate yield curve “flattens”; that is, when increases in shorter term market interest rates outpace the change in longer term market interest rates or when decreases in longer term interest rates outpace the change in shorter term interest rates. In both cases, the re-pricing characteristics of the Bank’s assets and liabilities result in a decrease in the Bank’s net interest rate spread and net interest margin.
74
Conversely, an overall reduction in market interest rates, or a “steepening” of the yield curve, generally enhances the Bank’s net interest rate spread and net interest margin which, in turn, enhances net income. However, the positive effect on earnings from movements in interest rates may be diminished as the pace of borrower refinancing increases resulting in the Company’s higher yielding loans and mortgage-backed securities being replaced with lower yielding assets at an accelerated rate.
For these reasons, management regularly monitors the maturity and re-pricing structure of the Bank’s assets and liabilities throughout a variety of interest rate scenarios in order to measure and manage its level of interest-rate risk in relation to the goals and objectives of its strategic business plan.
|
(3)
|
Management’s Plans
|
The consolidated financial statements have been prepared assuming the Company will continue as a going concern. The Company reported a net loss of $38.9 million in 2010. This was largely due to a significant increase in the provision for loan losses from $8.5 million in 2009 to $42.7 million in 2010, as well as an $11.6 million net loss on other-than-temporary impairment recognized in earnings in 2010 compared to $2.9 million in 2009.
The Company and the Bank are subject to enforcement actions and other requirements imposed by federal banking regulators. In particular, and as noted above, the Bank is subject to a Cease and Desist Order (the “Bank Order”) issued by the OTS on March 31, 2011 that requires, among other things, the Bank to implement an updated business plan to improve the Bank’s core earnings, reduce expenses, maintain an appropriate level of liquidity and achieve profitability. The Bank Order also requires that the Bank achieve and maintain a Tier 1 Capital Ratio equal to or greater than 10% and a Total Risk-Based Capital Ratio equal to or greater than 15%, after the funding of its allowance for loan and lease losses, by April 30, 2011. As of April 30, 2011, the Bank did not meet these capital requirements.
As the Bank failed to achieve the capital ratios required by the Bank Order, the Bank was required to file a Contingency Plan with the OTS within 15 days of April 30, 2011. The Bank Order required that the Contingency Plan detail actions to be taken and specific time frames to achieve either a merger with, or acquisition by, another federally insured depository institution or holding company thereof, or a voluntary dissolution by the later of the date of all required regulatory approvals or sixty (60) days after implementation of the Contingency Plan. The Bank filed the Contingency Plan with the OTS on May 12, 2011 and by letter dated June 15, 2011 the OTS directed the Bank to immediately implement and adhere to such Contingency Plan. The Bank intends to comply with the Contingency Plan and the directive. Moreover, as the holding companies of the Bank, the Company and BFS Bancorp, MHC also are subject to a separate but related Cease and Desist Order issued by the OTS on the same date as the Bank’s Order, which requires, among other terms, that the Company and BFS Bancorp, MHC ensure the Bank’s compliance with the terms of the Bank Order. The Company and BFS Bancorp, MHC intend to comply with their respective orders to ensure the Bank’s compliance with the terms of the Bank Order, including the implementation of the Contingency Plan.
75
The Bank experienced a significant increase in 2010 in non-accrual loans to $71.9 million at September 30, 2010, or 18.5% of total loans, from $22.1 million at September 30, 2009, or 5.1% of total loans. The Bank has agreed to not originate any commercial real estate, construction or multi-family loans without prior OTS approval. This restricts the Bank’s efforts to increase core earnings.
From 2010 through 2011, the Company and Bank recruited new senior executive leadership to consider and pursue strategies in the Contingency Plan and focus towards continuing as a going concern. Imposition of additional enforcement actions could damage our reputation and have a material adverse effect on our business.
However, in light of the OTS directive in the letter dated June 15, 2011, our primary focus to address the Bank’s challenges is to successfully implement the Contingency Plan.
There can be no assurance that the actions referred to above will successfully resolve all of the concerns of the federal banking regulatory authorities. The consolidated financial statements do not include any adjustments that might result from the outcome of these uncertainties.
76
|
(4)
|
Securities
|
Investments in securities available-for-sale held-to-maturity at September 30, 2010 and 2009 are summarized as follows:
| 2010 | ||||||||||||||||
|
Gross
|
Gross
|
|||||||||||||||
|
Amortized
|
unrealized
|
unrealized
|
Estimated
|
|||||||||||||
|
cost
|
gains
|
losses
|
fair value
|
|||||||||||||
|
(In thousands)
|
||||||||||||||||
|
Securities available-for-sale:
|
||||||||||||||||
|
Mortgage-backed securities - residential:
|
||||||||||||||||
|
Government agency
|
$ | 16,522 | $ | 217 | $ | (2 | ) | $ | 16,737 | |||||||
|
Government-sponsored enterprises
|
24,440 | 464 | (15 | ) | 24,889 | |||||||||||
|
Private issuers
|
22,055 | 680 | (1,383 | ) | 21,352 | |||||||||||
|
Government debentures
|
2,990 | 39 | - | 3,029 | ||||||||||||
|
Mutual funds
|
3,079 | 21 | - | 3,100 | ||||||||||||
|
Total securities available-for-sale
|
$ | 69,086 | $ | 1,421 | $ | (1,400 | ) | $ | 69,107 | |||||||
| 2009 | ||||||||||||||||||||
|
Gross
|
Gross
|
|||||||||||||||||||
|
Amortized
|
Carrying
|
unrealized
|
unrealized
|
Estimated
|
||||||||||||||||
|
cost
|
Cost
|
gains
|
losses
|
fair value
|
||||||||||||||||
|
(In thousands)
|
||||||||||||||||||||
|
Securities available-for-sale:
|
||||||||||||||||||||
|
Mutual funds
|
$ | 3,289 | $ | 3,289 | $ | 16 | $ | - | $ | 3,305 | ||||||||||
|
Gross
|
Gross
|
|||||||||||||||||||
|
Amortized
|
Carrying
|
unrealized
|
unrealized
|
Estimated
|
||||||||||||||||
|
cost
|
Cost
|
gains
|
losses
|
fair value
|
||||||||||||||||
|
Securities held-to-maturity:
|
||||||||||||||||||||
|
Mortgage-backed securities - residential:
|
||||||||||||||||||||
|
Government agency
|
$ | 125 | $ | 125 | $ | 3 | $ | (5 | ) | $ | 123 | |||||||||
|
Government-sponsored enterprises
|
20,474 | 20,474 | 391 | (2 | ) | 20,863 | ||||||||||||||
|
Private issuers
|
51,630 | 45,602 | 259 | (7,513 | ) | 38,348 | ||||||||||||||
|
Total securities held-to-maturity
|
$ | 72,229 | $ | 66,201 | $ | 653 | $ | (7,520 | ) | $ | 59,334 | |||||||||
All of the Company’s mortgage-backed securities were acquired by purchase (none resulted from retained interests in loans sold or securitized by the Company). Mortgage-backed securities issued by government-sponsored enterprises at September 30, 2010 consist of (i) Freddie Mac securities with an amortized cost of $6.9 million (compared to $12.2 million at September 30, 2009) and an estimated fair value of $7.2 million (compared to $12.5 million at September 30, 2009), (ii) Fannie Mae securities with an amortized cost of $17.5 million (compared to $8.2 million at September 30, 2009) and an estimated fair value of $17.7 million (compared to $8.3 million at September 30, 2009). Mortgage-backed securities issued by government agencies at September 30, 2010 consist of Ginnie Mae securities with an amortized cost of $16.5 million (compared to $0.1 million at September 30, 2009) and an estimated fair value of $16.7 million (compared to $0.1 million at September 30, 2009). These are the only securities of individual issuers held by the Company with an aggregate book value exceeding 10% of the Company’s equity at September 30, 2010.
During the fiscal year ended September 30, 2010, the Company changed its intention regarding its mortgage-backed securities that were previously classified as held-to-maturity, due to the increased capital required to be held against these securities. Based upon the change in intent, all of the Company’s held-to-maturity securities were transferred to available-for-sale. The held-to-maturity securities transferred to available-for-sale were carried at an amortized cost of approximately $61.3 million (after previously recognized other-than-temporary-impairment charges) and a fair value of $60.4 million on the date of transfer, with the net unrealized loss recorded in accumulated other comprehensive loss. The Company sold 14 of these securities during the year with no material additional loss or gain.
77
Total pre-tax other-than-temporary impairment (“OTTI”) for the year ended September 30, 2010 was $11.6 million, compared to $2.9 million for the year ended September 30, 2009, which was recognized in earnings for both periods. OTTI is a non-cash charge and not necessarily an indicator of a permanent decline in value. Of this amount $11.4 million and $2.0 million for the years ended September 30 2010 and 2009, respectively, was related to credit loss and was attributable to private issued mortgage-backed securities. The remaining charge of $0.2 million and $0.9 million for the years ended September 30 2010 and 2009, respectively, relates to our investment in a mutual fund with a book value of $2.6 million that invests primarily in agency and private label mortgage-backed securities. The Bank’s investment in a mutual fund that invests primarily in agency and private label mortgage backed securities has been steadily losing value, which has caused a corresponding decrease in the fund’s net asset value. In addition, the fund implemented a temporary prohibition on cash redemptions, lessening the ability of the Bank to dispose of its remaining $2.6 million investment in this asset. This prohibition was lifted on October 1, 2010.
The Company sold $9.9 million of securities, realizing gross gains of $0.2 million and gross losses of $0.1 million, during the year ended September 30, 2010. There were no sales of securities during the year ended September 30, 2009.
At September 30, 2010, the Bank pledged securities of $28.5 million in amortized cost, with an estimated fair value of $29.1 million, as collateral for advances from the Federal Home Loan Bank.
The following table summarizes debt securities available-for-sale at estimated fair value by contractual final maturity as of September 30, 2010. Actual maturities will differ from contractual final maturity due to scheduled monthly payments and due to borrowers having the right to prepay obligations with or without prepayment penalty.
|
Amortized
|
Estimated
|
||||||||
|
cost
|
fair value
|
||||||||
|
(In thousands)
|
|||||||||
|
Mortgage-backed securities and government debentures:
|
|||||||||
|
One year or less
|
$ | - | $ | - | |||||
|
Over one year through five years
|
143 | 147 | |||||||
|
Over five years through ten years
|
14,728 | 15,257 | |||||||
|
More than ten years
|
51,136 | 50,603 | |||||||
|
Total debt securities available-for-sale
|
$ | 66,007 | $ | 66,007 | |||||
78
The following table summarizes securities at September 30, 2010 and 2009 with gross unrealized losses, segregated by the length of time the securities had been in a continuous loss position:
|
As of September 30, 2010
|
||||||||||||||||||||||||
|
Less than 12 months
|
12 months or more
|
Total
|
||||||||||||||||||||||
|
Gross
|
Gross
|
Gross
|
||||||||||||||||||||||
|
Estimated
|
unrealized
|
Estimated
|
unrealized
|
Estimated
|
unrealized
|
|||||||||||||||||||
|
fair value
|
losses
|
fair value
|
losses
|
fair value
|
losses
|
|||||||||||||||||||
|
(In thousands)
|
||||||||||||||||||||||||
|
Government agency
|
$ | 73 | $ | (2 | ) | $ | - | $ | - | $ | 73 | $ | (2 | ) | ||||||||||
|
Government-sponsored enterprises
|
2,899 | (15 | ) | - | - | 2,899 | (15 | ) | ||||||||||||||||
|
Private issuers
|
- | - | 5,316 | (1,383 | ) | 5,316 | (1,383 | ) | ||||||||||||||||
|
Total temporarily impaired securities
|
$ | 2,972 | $ | (17 | ) | $ | 5,316 | $ | (1,383 | ) | $ | 8,288 | $ | (1,400 | ) | |||||||||
| As of September 30, 2009 | ||||||||||||||||||||||||
|
Less than 12 months
|
12 months or more | Total | ||||||||||||||||||||||
|
Gross
|
Gross
|
Gross
|
||||||||||||||||||||||
| Estimated |
unrealized
|
Estimated
|
unrealized
|
Estimated
|
unrealized
|
|||||||||||||||||||
| fair value |
losses
|
fair value
|
losses
|
fair value
|
losses
|
|||||||||||||||||||
|
(In thousands)
|
||||||||||||||||||||||||
|
Government agency
|
$ | - | $ | - | $ | 104 | $ | (5 | ) | $ | 104 | $ | (5 | ) | ||||||||||
|
Government-sponsored enterprises
|
450 | (1 | ) | 39 | (1 | ) | 489 | (2 | ) | |||||||||||||||
|
Private issuers
|
7,493 | (152 | ) | 22,418 | (7,361 | ) | 29,911 | (7,513 | ) | |||||||||||||||
|
Total temporarily impaired securities
|
$ | 7,943 | $ | (153 | ) | $ | 22,561 | $ | (7,367 | ) | $ | 30,504 | $ | (7,520 | ) | |||||||||
In April 2009, the FASB amended the OTTI model for debt securities. The impairment model for equity securities was not affected. Under the new guidance, an OTTI loss must be fully recognized in earnings if an investor has the intent to sell the debt security or if it is more likely than not that the investor will be required to sell the debt security before recovery of its amortized cost basis. However, even if an investor does not expect to sell a debt security, it must evaluate the expected cash flows to be received and determine if a credit loss has occurred. In the event of OTTI, only the amount of impairment associated with the credit loss is recognized in earnings. Amounts relating to factors other than credit losses are recorded in accumulated other comprehensive loss (“AOCL”). The guidance also requires additional disclosures regarding the calculation of credit losses as well as factors considered in reaching a conclusion that an investment is not other-than-temporarily impaired. The Company adopted the new guidance effective April 1, 2009.
Securities in unrealized loss positions are analyzed as part of the Company’s ongoing assessment of OTTI. When the Company intends to sell or is required to sell securities, the Company recognizes an impairment loss equal to the full difference between the amortized cost basis and fair value of those securities. When the Company does not intend to sell or is required to sell equity or debt securities in an unrealized loss position, potential OTTI is considered based on a variety of factors, including the length of time and extent to which the fair value has been less than cost; adverse conditions specifically related to the industry, the geographic area or financial condition of the issuer or the underlying collateral of a security; the payment structure of the security; changes to the rating of the security by a rating agency; the volatility of the fair value changes; and changes in fair value of the security after the balance sheet date. For debt securities, the Company estimates cash flows over the remaining lives of the underlying collateral to assess whether credit losses exist and determine if any adverse changes in cash flows have occurred. The Company’s cash flow estimates take into account expectations of relevant market and economic data as of the end of the reporting period. As of September 30, 2010, the Company does not intend to sell the securities with an unrealized loss position in AOCL, and it is not more likely than not that the Company will be required to sell these securities before recovery of their amortized cost basis. The Company believes that the securities with an unrealized loss in AOCL are not other-than-temporarily impaired as of September 30, 2010.
79
U.S. Government Agency and Government Sponsored Enterprise Mortgage-backed Securities
The carrying value of the Company’s U.S. Government Agency and Government Sponsored mortgage-backed securities totaled $41.6 million at September 30, 2010 and comprised 60.2% of total available-for-sale investments and 8.7% of total assets as of that date. At September 30, 2010, there were three securities of this type in a unrealized loss position for less than 12 months. This category of securities generally includes mortgage pass-through securities and collateralized mortgage obligations issued by U.S. government agencies, such as Ginnie Mae which guarantees the contractual cash flows associated with those securities and U.S. government-sponsored entities such as Fannie Mae and Freddie Mac that carried the implicit guarantee of the U.S. government to guarantee the contractual cash flows associated with those securities. Those guarantees were strengthened during the 2008-2009 financial crisis during which time Fannie Mae and Freddie Mac were placed into receivership by the federal government. Through those actions, the U.S. government effectively reinforced the guarantees of those agencies, thereby assuring the creditworthiness of the mortgage-backed securities issued by those agencies.
With credit risk being reduced to negligible levels due to the U.S. government’s support of these agencies, the unrealized losses on the Company’s investment in U.S. Government Agency mortgage-backed securities are due largely to the combined effects of several market-related factors. First, movements in market interest rates significantly impact the average lives of mortgage-backed securities by influencing the rate of principal prepayment attributable to refinancing activity. Changes in the expected average lives of these securities significantly impact their fair values due to the extension or contraction of the cash flows that an investor expects to receive over the life of the security.
Historically, lower market interest rates generally prompt greater refinancing activity thereby shortening the average lives of mortgage-backed securities and vice-versa. However, prepayment rates are also influenced by fluctuating real estate values and the overall availability of credit in the marketplace which significantly impacts the ability of borrowers to refinance. The deteriorating real estate market values and reduced availability of credit that has characterized the residential real estate marketplace over the past two years has significantly slowed both real estate purchase and refinancing activities. Consequently, prepayment rates on mortgage-backed securities have generally slowed thereby extending their average lives.
The market price of mortgage-backed securities, being the key measure of the fair value to an investor in those securities, is also influenced by the overall supply and demand for those securities in the marketplace. Absent other factors, an increase in the demand for, or a decrease in the supply of a security increases its price. Conversely, a decrease in the demand for, or an increase in the supply of a security decreases its price.
In sum, the factors influencing the fair value of the Company’s U.S. Government Agency mortgage-backed securities, as described above, generally result from movements in market interest rates and changing real estate and financial market conditions which affect the supply and demand for those securities. Inasmuch as market conditions fluctuate over time, the impairments of value arising from these changing market conditions are both “noncredit-related” and “temporary” in nature.
Finally, the Company purchased these securities at either discounts or nominal premiums relative to their par amounts. Accordingly, the Company expects that the securities will not be settled for a price less than their amortized cost.
80
In light of the factors noted above, the Company does not consider its U.S. Government Agency mortgage-backed securities with unrealized losses at September 30, 2010 to be “other-than-temporarily” impaired as of that date.
Private Issuer Mortgage-backed Securities
The carrying value of the Company’s private issuer mortgage-backed securities totaled $21.4 million at September 30, 2010 and 30.9% of total available-for-sale investments and 4.5% of total assets as of that date. At September 30, 2010, there were seven securities of this type in an unrealized loss position for 12 months or longer.
Unlike agency mortgage-backed securities, private issuer collateralized mortgage obligations are not explicitly guaranteed by a U.S. government sponsored entity. Rather, these securities generally utilize the structure of the larger investment vehicle to reallocate credit risk among the individual tranches comprised within that vehicle. Through this process, investors in different tranches are subject to varying degrees of risk that the cash flows of their tranche will be adversely impacted by borrowers defaulting on the underlying mortgage loans. The creditworthiness of certain tranches may also be further enhanced by additional credit insurance protection embedded within the terms of the total investment vehicle.
The Company monitors the general level of credit risk for each of its private issuer mortgage-backed securities based upon the ratings assigned to its specific tranches by one or more credit rating agencies. The level of these ratings, and changes thereto, is one of several factors considered by the Company in identifying those securities that may be other-than-temporarily impaired. For example, all impaired private issuer mortgage-backed securities that are rated below investment grade are reviewed individually to determine if the impairment is other-than temporary.
Additional factors considered by the Company in identifying its other-than-temporarily impaired securities include, but are not limited to, the severity and duration of the impairment, the payment performance of the underlying mortgage loans and trends relating thereto, the original terms of the underlying loans regarding credit quality (ex. Prime, Alt-A), the geographic distribution of the real estate collateral supporting those loans and any current or anticipated declines in associated collateral values, as well as the degree of protection against credit losses afforded to the Company’s security through the structural characteristics of the larger investment vehicle as noted above. Based upon these additional factors, the impairment of certain investment grade securities may also be reviewed for other-than-temporary impairment.
Securities determined to be potentially other-than-temporarily impaired are individually analyzed to determine the “credit-related” and “noncredit-related” portions of the impairment. As noted earlier, a credit-related impairment generally represents the amount by which the present value of the cash flows that are expected to be collected on an other-than-temporarily impaired security fall below its amortized cost. Projected cash flows for the Company’s private issuer mortgage-backed securities are modeled using an automated securities analytics system that is commonly used by institutional investors and the broker/dealer community. The system generates an individual tranche’s projected cash flows based upon several input assumptions regarding the payment performance of the mortgage loans underlying the larger investment vehicle of which the Company’s tranche is a part. These assumptions include, but may not be limited to, loan prepayment rates, loan default rates, and the severity of actual losses on defaulting loans. The Company generally bases the input values for these assumptions on historical data reported by the analytics system. The Company then calculates the present value of those cash flows based upon the appropriate discount rate required by the applicable accounting guidance.
The impairments of those securities whose cash flows, when present valued, fall below the Company’s carrying value due to expected principal losses are identified as other-than-temporary. The amount by which the present value of the expected cash flows falls below the Company’s carrying value of the security is identified as the credit-related portion of the other-than-temporary impairment. The remaining portion, where applicable, is identified as noncredit-related, other-than-temporary impairment.
81
The impairments of those individually analyzed securities whose cash flows, when present valued, exceed the Company’s carrying value or otherwise reflect no expected principal losses, are generally identified as temporary. Similarly, the impairments associated with those securities that have generally retained their investment-grade credit rating and whose additional factors, as noted above, are not characterized by potentially adverse attributes, are also generally identified as temporary. In these cases, the Company attributes the unrealized losses to the same fluctuating market-related factors as those affecting agency mortgage-backed securities, noting, in particular, the comparatively greater temporary adverse effect on fair value arising from the general illiquidity of private issuer, investment grade mortgage-backed securities in the marketplace compared to agency-guaranteed mortgage-backed securities. In light of these factors, the related impairments are defined as “temporary”.
The classification of impairment as “temporary” is further reinforced by the fact that as of September 30, 2010 the Company has not decided to sell the securities. Additionally, the Company has concluded that the possibility of being required to sell the securities prior to their anticipated recovery is unlikely.
82
The following tables present a roll-forward of the credit loss component of OTTI on private issuer mortgage-backed securities for which a non-credit component of OTTI was recognized in other comprehensive loss for the years ended September 30, 2010 and 2009. OTTI recognized in earnings after that date for credit-impaired debt securities is presented as additions in two components, based upon whether the current period is the first time a debt security was credit-impaired (initial credit impairment) or is not the first time a debt security was credit impaired (subsequent credit impairment). Changes in the credit loss component of credit-impaired debt securities were as follows:
|
For the year ended September 30, 2010
|
Total Other-
Than- Temporary Impairment Loss |
Other-Than-
Temporary Impairment Credit Losses recorded in Earnings |
Other-Than-
Temporary Impairment Credit Losses recorded in Other Comprehensive Income |
|||||||||
|
(in thousands)
|
||||||||||||
|
Beginning balance as of September 30, 2009
|
$ | 8,085 | $ | 2,024 | $ | 6,061 | ||||||
|
Add: Initial other-than-temporary credit losses
|
4,955 | 4,179 | 776 | |||||||||
|
Additional other-than-temporary credit losses
|
400 | 7,237 | (6,837 | ) | ||||||||
|
Ending balance as of September 30, 2010
|
$ | 13,440 | $ | 13,440 | $ | - | ||||||
|
For the year ended September 30, 2009
|
Total Other-
Than- Temporary Impairment Loss |
Other-Than-
Temporary Impairment Credit Losses recorded in Earnings |
Other-Than-
Temporary Impairment Credit Losses recorded in Other Comprehensive Income |
|||||||||
|
(in thousands)
|
||||||||||||
|
Beginning balance as of September 30, 2008
|
$ | - | $ | - | $ | - | ||||||
|
Add: Initial other-than-temporary credit losses
|
8,085 | 2,024 | 6,061 | |||||||||
|
Additional other-than-temporary credit losses
|
- | - | - | |||||||||
|
Ending balance as of September 30, 2009
|
$ | 8,085 | $ | 2,024 | $ | 6,061 | ||||||
|
(5)
|
Loans, Sales and Syndications
|
The following is a summary, by type of loans, of the principal balances of whole loans and loan participation interests sold during the years ended September 30, 2010 and 2009.
|
2010
|
2009
|
||||||||
|
(In thousands)
|
|||||||||
|
Mortgage loans:
|
|||||||||
|
Multi-family
|
$ | 7,100 | $ | 2,183 | |||||
|
Commercial
|
- | 1,474 | |||||||
|
Construction
|
1,541 | 3,903 | |||||||
|
One- to four-family
|
7,215 | 7,877 | |||||||
|
Total
|
$ | 15,856 | $ | 15,437 | |||||
The portion of loans retained by the Bank on sales of participation interests during the years ended September 30, 2010 and 2009 were $8.3 million and $34.5 million, respectively.
83
In loan participation transactions, the Bank originates the full loan amount and subsequently identifies participants that purchase participation interests from the Bank. This differs from loan syndication transactions where, prior to closing the loan, the Bank identifies other lenders who agree to fund a portion of the total loan at closing. The Bank records its share of the loan syndication as a loan receivable. The amounts funded by other lenders are not reflected as loan originations and sales in the Bank’s consolidated financial statements.
The following is a summary of loan syndication transactions completed during the years ended September 30, 2010 and 2009:
|
2010
|
2009
|
|||||||
|
(In thousands)
|
||||||||
|
Total loan amounts
|
$ | 73,072 | $ | 102,201 | ||||
|
Less portion funded by other lenders
|
41,389 | 59,357 | ||||||
|
Loans receivable recorded by the Bank
|
$ | 31,683 | $ | 42,844 | ||||
The unpaid principal balances of whole loans and loan participation interests sold by the Bank and serviced for others at September 30, 2010 and 2009 are summarized as follows:
|
2010
|
2009
|
|||||||
|
(In thousands)
|
||||||||
|
Mortgage loans:
|
||||||||
|
Multi-family
|
$ | 18,775 | $ | 45,012 | ||||
|
Commercial
|
20,685 | 17,268 | ||||||
|
Construction
|
2,599 | 14,788 | ||||||
|
One- to four-family
|
19,180 | 14,573 | ||||||
|
Total
|
$ | 61,239 | $ | 91,641 | ||||
In addition, the Bank serviced syndicated loan balances owned by other lenders totaling $136.1 million and $202.6 million at September 30, 2010 and 2009, respectively. At September 30, 2010 and 2009, the Bank serviced one- to four-family loans involving limited recourse of $14.2 million and $11.3 million, respectively.
84
|
(6)
|
Loans Receivable, Net
|
The components of the loan portfolio are summarized as follows:
|
2010
|
2009
|
|||||||
|
(In thousands)
|
||||||||
|
Mortgage loans:
|
||||||||
|
One- to four-family
|
$ | 73,457 | $ | 77,064 | ||||
|
Multi-family
|
65,209 | 92,399 | ||||||
|
Commercial
|
119,727 | 143,239 | ||||||
|
Construction
|
95,824 | 73,314 | ||||||
|
Land
|
34,084 | 45,027 | ||||||
| 388,301 | 431,043 | |||||||
|
Consumer and other loans:
|
||||||||
|
Personal loans
|
331 | 605 | ||||||
|
Loans secured by deposit accounts
|
118 | 79 | ||||||
| 449 | 684 | |||||||
|
Total loans receivable
|
388,750 | 431,727 | ||||||
|
Unearned Discounts
|
- | (87 | ) | |||||
|
Deferred net loan origination fees
|
(967 | ) | (1,205 | ) | ||||
|
Allowance for loan losses
|
(17,941 | ) | (10,750 | ) | ||||
|
Total loans receivable, net
|
$ | 369,842 | $ | 419,685 | ||||
At September 30, 2010 the Bank pledged $36.4 million in mortgage loans as collateral for borrowings from the Federal Home Loan Bank.
The Company’s loan portfolio consists primarily of residential and commercial real estate mortgage loans secured by properties located in the Company’s primary market area of New York, Kings, Nassau and Suffolk Counties of New York. The ability of the Company’s borrowers to make principal and interest payments is dependent upon, among other things, the level of overall economic activity and the real estate market conditions prevailing within the Company’s concentrated lending area. Commercial real estate and construction loans are considered by management to be of somewhat greater credit risk than loans to fund the purchase of a primary residence due to the generally larger loan amounts and dependency on income production or sale of the real estate.
The principal balance of non-accrual loans, net of specific allowances, were as follows:
|
2010
|
2009
|
|||||||
|
(In thousands)
|
||||||||
|
Mortgage Loans:
|
||||||||
|
One- to four-family residential mortgage loans
|
$ | - | $ | - | ||||
|
Multi-family loans
|
23,956 | 902 | ||||||
|
Commercial real estate loans
|
34,908 | 15,623 | ||||||
|
Construction Loans
|
7,890 | 4,722 | ||||||
|
Land
|
5,103 | 832 | ||||||
|
Total non-accrual loans
|
$ | 71,857 | $ | 22,079 | ||||
85
The Company’s total recorded investment in impaired loans, as defined by FASB ASC 310-40, was $125.0 million and $32.4 million at September 30, 2010 and September 30, 2009, respectively. All of these loans were collateral-dependent loans based on the fair value of the collateral. The Company determines the need for an allowance for loan impairment under FASB-issued guidance on a loan-by-loan basis. An impairment allowance of $1.1 million was required at September 30, 2010 due to the inadequacy of collateral values on $5.9 million in impaired loans. $119.1 million did not require an impairment allowance at September 30, 2010. Interest income on impaired loans was $0.6 million for the period of impairment. An impairment allowance of $5.1 million was required at September 30, 2009 due to the inadequacy of collateral values on $23.0 million in impaired loans. $9.4 million did not require an impairment allowance at September 30, 2009. Interest income on impaired loans was $38,000 for the period of impairment. The Company’s average recorded investment in impaired loans was $77.7 million during the year ended September 30, 2010 and $4.8 million during the year ended September 30, 2009.
Activity in the allowance for loan losses for each of the years in the two-year period ended September 30, 2010 is summarized below. There were no recoveries during these years.
|
2010
|
2009
|
|||||||
|
(In thousands)
|
||||||||
|
Balance, beginning of year
|
$ | 10,750 | $ | 2,205 | ||||
|
Charge-offs, net
|
35,491 | - | ||||||
|
Provision for loan losses
|
42,682 | 8,545 | ||||||
|
Balance, end of year
|
$ | 17,941 | $ | 10,750 | ||||
|
(7)
|
Premises and Equipment
|
Premises and equipment at September 30, 2010 and 2009 is summarized as follows:
|
2010
|
2009
|
|||||||
|
Land
|
$ | 115 | $ | 115 | ||||
|
Buildings and improvements
|
1,642 | 1,635 | ||||||
|
Leasehold improvements
|
2,292 | 2,279 | ||||||
|
Furnishings and equipment
|
782 | 1,579 | ||||||
|
Construction in progress
|
- | - | ||||||
| $ | 4,831 | $ | 5,608 | |||||
|
Less accumulated depreciation
|
3,009 | 3,578 | ||||||
| $ | 1,822 | $ | 2,030 | |||||
The Company wrote off $1.0 million of fully depreciated assets during the year ended September 30, 2010. Depreciation expense was $0.4 million for the years ended September 30, 2010 and 2009.
|
(8)
|
Accrued Interest Receivable
|
Accrued interest receivable at September 30, 2010 and 2009 is summarized as follows:
|
2010
|
2009
|
|||||||
|
(In thousands)
|
||||||||
|
First mortgage and other loans
|
$ | 1,847 | $ | 2,495 | ||||
|
Mortgage-backed securities
|
203 | 287 | ||||||
|
Other securities and interest-earning assets
|
11 | 17 | ||||||
| $ | 2,061 | $ | 2,799 | |||||
86
|
(9)
|
Deposits
|
Scheduled maturities of certificates of deposit at September 30, 2010 and 2009 are summarized as follows:
|
2010
|
2009
|
|||||||||||||||
|
Amount
|
Percent
|
Amount
|
Percent
|
|||||||||||||
|
(Dollars in thousands)
|
||||||||||||||||
|
Within one year
|
$ | 149,219 | 59.08 | % | $ | 190,800 | 76.07 | % | ||||||||
|
After one but within two years
|
42,017 | 16.64 | % | 27,342 | 10.90 | % | ||||||||||
|
After two but within three years
|
20,355 | 8.06 | % | 7,336 | 2.93 | % | ||||||||||
|
After three but within four years
|
14,858 | 5.88 | % | 10,656 | 4.25 | % | ||||||||||
|
After four years
|
26,124 | 10.34 | % | 14,677 | 5.85 | % | ||||||||||
| $ | 252,573 | 100.00 | % | $ | 250,811 | 100.00 | % | |||||||||
The aggregate amount of certificates of deposit with balances equal to or greater than $100,000 was $86.2 million and $76.9 million at September 30, 2010 and 2009, respectively. In prior years, the FDIC generally insured deposit amounts up to $100,000, as defined in the applicable regulations. The maximum deposit insurance amount has since been permanently increased from $100,000 to $250,000.
|
(10)
|
Borrowings
|
The Bank’s borrowings at September 30, 2010 and 2009 consist of Federal Home Loan Bank advances with interest rates and maturity dates as summarized below. None of these advances are callable by the Federal Home Loan Bank prior to maturity.
As a member of the Federal Home Loan Bank, the Bank may have outstanding Federal Home Loan Bank borrowings of up to approximately $62.4 million and $76.0 million at September 30, 2010 and 2009, respectively, in a combination of term advances and overnight funds. The Bank’s unused Federal Home Loan Bank borrowing capacity was approximately $52.9 million and $48.7 million at September 30, 2010 and 2009, respectively.
Borrowings are secured by the Bank’s investment in Federal Home Loan Bank stock and by a security agreement. This agreement requires the Bank to maintain as collateral certain qualifying assets (principally securities and residential mortgage loans) not otherwise pledged, with a fair value (as defined) at least equal to 120% of outstanding advances, or $12.6 million as of September 30, 2010. The Bank satisfied its collateral requirement at September 30, 2010 and 2009.
At September 30, 2010 the Bank pledged $36.4 million of its mortgage portfolio and $28.5 million in amortized cost of its securities portfolio having a fair market value of $29.1 million.
87
|
2010
|
2009
|
||||||||||||||||||||
|
Principal
|
Rate
|
Maturity
|
Principal
|
Rate
|
Maturity
|
||||||||||||||||
|
(Dollars in thousands)
|
|||||||||||||||||||||
| $ | 1,500 | 0.41 | % |
10/1/2010
|
$ | 23,000 | 0.36 | % |
10/1/2009
|
||||||||||||
|
Short-term
|
1,500 | 0.41 | % | 23,000 | 0.36 | % | |||||||||||||||
| 500 | 1.64 | % |
7/25/2011
|
300 | 4.65 | % |
8/30/2010
|
||||||||||||||
| 300 | 4.67 | % |
8/30/2011
|
500 | 1.64 | % |
7/25/2011
|
||||||||||||||
| 500 | 2.36 | % |
8/20/2012
|
300 | 4.67 | % |
8/30/2011
|
||||||||||||||
| 500 | 2.27 | % |
8/22/2012
|
500 | 2.36 | % |
8/20/2012
|
||||||||||||||
| 200 | 4.71 | % |
8/30/2012
|
500 | 2.29 | % |
8/22/2012
|
||||||||||||||
| 1,000 | 2.14 | % |
3/25/2013
|
200 | 4.71 | % |
8/30/2012
|
||||||||||||||
| 1,000 | 2.94 | % |
5/14/2013
|
1,000 | 2.94 | % |
5/14/2013
|
||||||||||||||
| 1,000 | 2.73 | % |
3/24/2014
|
1,000 | 3.20 | % |
6/18/2014
|
||||||||||||||
| 1,000 | 3.20 | % |
6/18/2014
|
||||||||||||||||||
| 1,000 | 3.02 | % |
10/8/2014
|
||||||||||||||||||
| 1,000 | 3.05 | % |
12/16/2014
|
||||||||||||||||||
| 1,000 | 3.20 | % |
3/24/2015
|
||||||||||||||||||
|
Long-term
|
9,000 | 2.86 | % | 4,300 | 3.03 | % | |||||||||||||||
|
Total
|
$ | 10,500 | $ | 27,300 | |||||||||||||||||
|
(11)
|
Federal, State, and Local Taxes
|
The Company’s provision (benefit) for income taxes included in the consolidated statements of operations for the years ended September 30, 2010 and 2009 are as follows:
|
2010
|
2009
|
|||||||
|
(In thousands)
|
||||||||
|
Current tax expense:
|
||||||||
|
Federal
|
$ | (10,452 | ) | $ | 3,556 | |||
|
State and local
|
115 | 1,320 | ||||||
|
Total current tax expense
|
(10,337 | ) | 4,876 | |||||
|
Deferred tax benefit:
|
||||||||
|
Federal
|
2,257 | (3,136 | ) | |||||
|
State and local
|
2,694 | (1,655 | ) | |||||
|
Total deferred tax benefit
|
4,951 | (4,791 | ) | |||||
|
Total provision for income taxes
|
$ | (5,386 | ) | $ | 85 | |||
88
The reconciliation of the Company’s U.S. statutory rate to the Company’s effective tax rate for the years ended September 30, 2010 and 2009 is as follows:
|
2010
|
2009
|
|||||||
|
Statutory Federal income tax rate
|
34.0 | % | 34.0 | % | ||||
|
State and local income taxes, net of Federal income tax benefits
|
9.8 | % | -16.0 | % | ||||
|
Bank Owned Life Insurance
|
0.3 | % | -8.9 | % | ||||
|
Valuation Allowance
|
-32.7 | % | 0.0 | % | ||||
|
Other
|
0.8 | % | -2.9 | % | ||||
|
Effective tax rate
|
12.2 | % | 6.2 | % | ||||
The Company files a consolidated Federal income tax return on a September 30 fiscal year basis. The Company also filed New York State franchise tax and New York City financial corporation tax returns on a September 30 fiscal year basis. The Company’s annual state and city tax liability for each tax year is the greater of a tax based on entire net income, as defined, taxable assets or an alternative tax based on a specified formula. Further, the Company is subject to a metropolitan transportation business tax surcharge based upon New York State tax liability.
The Company has no uncertain tax positions. The Company and its subsidiaries are subject to U.S. Federal, New York State and New York City income taxation. The Company is no longer subject to examination by taxing authorities for years before September 30, 2007.
89
The tax effects of temporary differences that give rise to significant portions of the deferred tax assets and deferred tax liabilities at September 30, 2010 and 2009 are as follows:
|
2010
|
2009
|
|||||||
|
(In thousands)
|
||||||||
|
Deferred tax assets:
|
||||||||
|
Allowance for loan losses
|
$ | 7,791 | $ | 4,734 | ||||
|
Supplemental retirement plan
|
364 | 278 | ||||||
|
Employee benefits
|
21 | 165 | ||||||
|
Stock-based incentive plan
|
697 | 819 | ||||||
|
Other than temporary impairment
|
1,023 | 1,806 | ||||||
|
Net unrealized loss on securities
|
- | 2,485 | ||||||
|
Non-accrual interest
|
2,405 | 325 | ||||||
|
Net operating loss carryforward
|
3,205 | - | ||||||
|
Depreciation
|
812 | 758 | ||||||
|
Other
|
169 | 28 | ||||||
|
Total deferred tax assets
|
16,487 | 11,398 | ||||||
|
Deferred tax liabilities:
|
||||||||
|
Deferred loan costs
|
(258 | ) | (291 | ) | ||||
|
Deferred REIT income
|
(377 | ) | (1,650 | ) | ||||
|
Net unrealized gain on securities
|
(9 | ) | - | |||||
|
Net loan servicing liabilities
|
- | (10 | ) | |||||
|
Total deferred tax liabilities
|
(644 | ) | (1,951 | ) | ||||
|
Valuation Allowance
|
(14,508 | ) | - | |||||
|
Net deferred tax assets (included in other assets)
|
$ | 1,335 | $ | 9,447 | ||||
The Company’s ability to utilize the deferred tax asset generated by the allowance for loan losses, as well as other deferred tax assets, depends on its ability to generate sufficient taxable income and its ability to recover taxes paid in prior years through statutory loss carryback provisions. Since the Company cannot demonstrate the ability to generate sufficient taxable income in the near future, a valuation allowance against the net deferred tax assets of $14.5 million was established at September 30, 2010. The remaining deferred tax asset of $1.3 million represents refunds recordable from the anticipated carryback of tax losses generated in the fiscal year ended September 30, 2011. If tax losses are not generated in an amount sufficient to recover this balance in full, any remaining deferred tax balance will be written off through income tax expense as of September 30, 2011. No valuation allowance was required at September 30, 2009.
90
The future recognition of the Company’s net deferred tax asset is highly dependent upon the Company’s ability to generate sufficient taxable income. A valuation allowance is required to be maintained for any deferred tax assets that we estimate are more likely than not to be unrealizable, based on available evidence at the time the estimate is made. In assessing Company’s need for a valuation allowance, we rely upon estimates of future taxable income. Although we use the best available information to estimate future taxable income, underlying estimates and assumptions can change over time as a result of unanticipated events or circumstances influencing our projections. Valuation allowances related to deferred tax assets can be affected by changes to tax laws, statutory tax rates, and future taxable income levels. In the event that we were to determine that we would not be able to realize all or a portion of our net deferred tax assets in the future, we would reduce such amounts through a charge to income tax expense in the period in which that determination was made. Conversely, if we were to determine that we would be able to realize our deferred tax assets in the future in excess of the net carrying amounts, we would decrease the recorded valuation allowance through a decrease in income tax expense in the period in which that determination was made. No assurances can be made that the Company will be able to generate sufficient taxable income in the future to realize the deferred tax asset.
The Company has New York State and New York City net operating losses. These losses can be carried forward for 20 years to offset future taxable income. The amount of the New York State and New York City net operating losses are $34.0 million. The net operating losses will expire in 2030.
The Company’s base-year tax bad debt reserves totaled $1.6 million for Federal and State tax purposes at September 30, 2010 and 2009. Deferred tax liabilities have not been recognized with respect to these reserves, since the Company does not expect that these amounts will become taxable in the foreseeable future. The base-year reserves are subject to recapture if the Company makes certain non-dividend distributions, repurchases any of its stock, pays dividends in excess of tax earnings and profits, or ceases to engage in the business of banking. The unrecognized deferred tax liabilities with respect to the Company’s base-year reserves totaled approximately $0.8 million at both September 30, 2010 and 2009.
|
(12)
|
Defined Contribution Plan and Supplemental Executive Retirement Plan
|
The Company has a non-contributory defined contribution plan, which covers all employees with a minimum of two years of service who are at least 21 years of age. The Company recorded pension expenses of $205,000 and $275,000 for the years ended September 30, 2010 and 2009, respectively. Contributions are made annually for each employee based upon a fixed percentage of compensation and were $261,000 and $230,000 for the years ended September 30, 2010 and 2009, respectively.
The Company has also established a Supplemental Executive Retirement Plan, which is a non-qualified plan providing certain executives with supplemental retirement benefits. The periodic pension expense for the supplemental plan amounted to $260,000 and $851,000 for the years ended September 30, 2010 and 2009, respectively. The accrued liability on the supplemental plan was $0.8 million and $0.6 million at September 30, 2010 and 2009, respectively, all of which is unfunded.
|
(13)
|
Employee Stock Ownership Plan
|
In connection with the Reorganization and Offering in April 2005, the Company established an ESOP for eligible employees who meet certain age and service requirements. The ESOP borrowed $3,174,000 from the Company and used the funds to purchase 317,400 shares of common stock as part of the Offering. The Bank makes a periodic contribution to the ESOP sufficient to satisfy the debt service requirements of the loan, which has a 20-year term and bears interest at the prime rate set on November 1st of each year. The ESOP uses this contribution and any dividends received by the ESOP on unallocated shares to make the principal and interest payment on the loan.
91
ESOP shares are held by the plan trustee in a suspense account until allocated to participant accounts. Shares released from the suspense account are allocated to participants on the basis of their relative compensation in the year of allocation. Participants become vested in the allocated shares over a period not to exceed five years. Any forfeited shares are allocated to other participants in the same proportion as contributions.
ESOP expense was $118,000 and $196,000 for the years ended September 30, 2010 and 2009, respectively. At September 30, 2010, 14,548 shares have been committed to be released for allocation and 79,350 shares have been allocated. The cost of ESOP shares that have not yet been allocated to participants or committed to be released for allocation is deducted from stockholders’ equity (223,502 shares with a cost of approximately $2,235,020 and fair value of approximately $402,304 at September 30, 2010).
|
(14)
|
Stock-Based Incentive Plan
|
The Company has a stock-based incentive plan that consists of: stock options and restricted stock awards. At the annual meeting held on April 11, 2006, stockholders of the Company approved the Brooklyn Federal Bancorp, Inc. 2006 Stock-Based Incentive Plan. The plan authorizes the award of up to 648,025 shares as stock options and 259,210 shares as restricted stock awards. As of September 30, 2010 there are 61,000 stock options and 20,596 restricted stock rewards available for grant under the plan. The Company adopted FASB-issued guidance upon approval of the Plan, and began to expense the fair value of all options over their vesting periods and began to expense the fair value of all restricted stock grants over the requisite vesting periods.
Employee options and non-employee director options generally vest over a seven-year service period, except in cases where retirement qualifications come into effect, which accelerates the vesting upon granting. Management estimated the fair values relating to all of the fiscal year 2007 option grants using the Black-Sholes option-pricing model. Since there was limited historical information on the volatility of the Company’s stock, management based expectations about future volatility on the average volatilities of similar entities for an appropriate period following their initial public offering. Management estimated the expected life of the options assuming that it must be more than the vesting period, and no greater than the contractual life, ten years, in conjunction with an evaluation of the grantees’ ages and lengths of service. The Treasury yield in effect at the time of the grant provides the risk-free rate for periods within the vesting life of the option. Management recognizes compensation expense for the fair values of these awards, which have graded vesting, on a straight-line basis over the requisite vesting and service period of the awards. The weighted-average grant-date fair value of options granted during the year ended September 30, 2007 was $3.57. There were no options granted during the years ended September 30, 2010 and 2009.
Restricted shares generally vest in full after five years. The product of the number of shares granted and the grant date market price of the Company’s common stock determine the fair value of restricted shares under the Company’s stock-based incentive plan. Management recognizes compensation expense for the fair value of restricted shares on a straight-line basis over the requisite vesting or service period of five years. The weighted-average grant-date fair value of restricted stock awards during the year ended September 30, 2007 was $13.68. There were no restricted stock awards granted during the years ended September 30, 2010 and 2009.
During the years ended September 30, 2010 and 2009, the Company recorded $225,000 and $313,000 of stock-based incentive compensation expense, comprised of stock option expense of $67,000 and $133,000 and $158,000 and $180,000 of restricted stock expense, respectively.
92
The following is a summary of the Company’s stock option activity and related information for its option plan for the year ended September 30, 2010:
|
Options
|
Weighted
Average Exercise Price |
Weighted Average
Remaining Contractual Term |
Aggregate
Intrinsic Value |
|||||||||||||
|
(In thousands, except per share amounts)
|
||||||||||||||||
|
Outstanding at September 30, 2009
|
621 | $ | 13.37 | |||||||||||||
|
Granted
|
- | $ | - | |||||||||||||
|
Exercised
|
- | $ | - | |||||||||||||
|
Forfeited
|
(34 | ) | $ | 13.44 | ||||||||||||
|
Outstanding at September 30, 2010
|
587 | $ | 13.37 |
3.5 years
|
$ | - | ||||||||||
|
Exercisable at September 30, 2010
|
465 | $ | 13.35 |
3.5 years
|
$ | - | ||||||||||
Upon exercise of vested options, management expects to draw on treasury stock as the source of the shares. As of September 30, 2010, the Company has 594,866 shares of treasury stock.
Expected future compensation expense relating to the 114,529 un-exercisable options outstanding as of September 30, 2010 is approximately $401,265 over a weighted average period of 3.5 years. As of September 30, 2010, there were 61,000 shares remaining available for future option grants under the plan.
The following is a summary of the status of the Company’s restricted share awards as of September 30, 2010:
|
|
Restricted Shares
|
Weighted
Average Grant Date Fair Value |
||||||
|
(In thousands, except per share amounts)
|
||||||||
|
Non-vested at September 30, 2009
|
40 | $ | 13.50 | |||||
|
Granted
|
- | $ | - | |||||
|
Vested
|
(13 | ) | $ | 13.50 | ||||
|
Forfeited
|
(4 | ) | $ | 13.41 | ||||
|
Non-vested at September 30, 2010
|
23 | $ | 13.51 | |||||
During the years ended September 30, 2010 and 2009, the total fair value of restricted shares that vested was $216,000 and $175,000, respectively. Expected future compensation expense relating to the 22,643 non-vested restricted shares at September 30, 2010 is $206,000 over a weighted average period of 1.4 years. As of September 30, 2010, there were 20,596 shares remaining available for future restricted stock grants under the plan.
93
|
(15)
|
Regulatory Capital
|
The Bank is subject to various regulatory capital requirements administered by the federal banking agencies. Failure to meet minimum capital requirements can initiate certain mandatory and possibly additional discretionary, actions by regulators that, if undertaken, could have a direct material effect on a bank’s financial statements. Under capital adequacy guidelines and the regulatory framework for prompt corrective action, the Bank must meet specific capital guidelines that involve quantitative measures of the Bank’s assets, liabilities, and certain off-balance-sheet items as calculated under regulatory accounting practices. The Bank’s capital amounts and classifications are also subject to qualitative judgments by the regulators about components, risk weightings, and other factors.
Quantitative measures established by regulation to ensure capital adequacy require the Bank to maintain minimum amounts and ratios (set forth in the table below) of total and Tier I risk-based capital to risk-weighted assets, and of leverage and tangible capital to adjusted total assets. Management believes, as of September 30, 2010 and 2009, that the Bank met all capital adequacy requirements to which it was subject.
As of September 30, 2010, the most recent notification from the FDIC categorized the Bank as “well capitalized” under the regulatory framework for prompt corrective action. To be categorized as “well capitalized” the Bank must maintain minimum total risk-based, Tier I risk-based and Tier I leverage ratios as set forth in the table. On March 31, 2011, the Bank entered into a cease and desist order issued by the OTS, under which, among other things, the Bank has agreed to achieve and maintain a Tier 1 Capital Ratio of at least 10% and a Total Risk-Based Capital Ratio of at least 15% by April 30, 2011. As a result of the cease and desist order, the Bank is no longer considered “well capitalized”. See Note 3 for additional requirements pertaining to the cease and desist order.
The Bank’s actual capital amounts and ratios are also presented in the table:
|
Actual
|
For capital adequacy
purposes |
To be well capitalized
under prompt corrective action provisions |
||||||||||||||||||||||
|
Amount
|
Ratio
|
Amount
|
Ratio
|
Amount
|
Ratio
|
|||||||||||||||||||
|
(Dollars in thousands)
|
||||||||||||||||||||||||
|
At September 30, 2010:
|
||||||||||||||||||||||||
|
Total risk-based capital (to risk weighted assets)
|
$ | 45,912 | 10.9 | % | $ | 33,603 | 8.0 | % | $ | 42,004 | 10.0 | % | ||||||||||||
|
Tier I risk-based capital (to risk weighted assets)
|
39,094 | 9.3 | % | 16,802 | 4.0 | % | 25,202 | 6.0 | % | |||||||||||||||
|
Tangible capital (to tangible assets)
|
39,094 | 8.0 | % | 7,289 | 1.5 | % | N/A | N/A | ||||||||||||||||
|
Tier I leverage (core) capital (to adjusted tangible assets)
|
39,094 | 8.0 | % | 14,577 | 3.0 | % | 24,295 | 5.0 | % | |||||||||||||||
|
At September 30, 2009:
|
||||||||||||||||||||||||
|
Total risk-based capital (to risk weighted assets)
|
$ | 79,779 | 14.5 | % | $ | 43,938 | 8.0 | % | $ | 54,922 | 10.0 | % | ||||||||||||
|
Tier I risk-based capital (to risk weighted assets)
|
71,192 | 13.0 | % | 21,969 | 4.0 | % | 32,953 | 6.0 | % | |||||||||||||||
|
Tangible capital (to tangible assets)
|
71,192 | 13.8 | % | 7,760 | 1.5 | % | N/A | N/A | ||||||||||||||||
|
Tier I leverage (core) capital (to adjusted tangible assets)
|
71,192 | 13.8 | % | 15,521 | 3.0 | % | 25,868 | 5.0 | % | |||||||||||||||
94
The following is a reconciliation of the Bank’s equity under GAAP and its regulatory capital amounts at September 30, 2010 and 2009:
|
2010
|
2009
|
|||||||
|
(In thousands)
|
||||||||
|
Equity under GAAP
|
$ | 40,505 | $ | 74,161 | ||||
|
Deduct:
|
||||||||
|
Disallowed servicing assets, disallowed deferred tax assets
|
1,399 | 2,959 | ||||||
|
Net unrealized (loss) gain on securities available for sale, net of income taxes
|
12 | 10 | ||||||
|
Tangible capital, Tier I (core) capital and Tier 1 risk-based capital
|
39,094 | 71,192 | ||||||
|
Allowance for loan losses includable in regulatory capital
|
5,398 | 5,618 | ||||||
|
Net unrealized loss on securities available for sale, net of income taxes
|
21 | 10 | ||||||
|
Disallowed servicing assets, disallowed deferred tax assets
|
1,399 | 2,959 | ||||||
|
Total risk-based capital
|
$ | 45,912 | $ | 79,779 | ||||
Dividends
When the Company pays dividends to its minority stockholders, it is also required to pay dividends to BFS Bancorp, MHC, unless BFS Bancorp, MHC elects to waive the receipt of dividends. Any decision to waive dividends will be subject to regulatory approval. Under OTS regulations, public stockholders would not be diluted for any dividends waived by BFS Bancorp, MHC in the event that BFS Bancorp, MHC converts to stock form. The cumulative amount of dividends waived by BFS Bancorp, MHC through September 30, 2010 was $10.0 million. The amount of dividends waived by BFS Bancorp, MHC for fiscal year 2010 was $2.7 million. The dividends waived are considered as a restriction on the retained earnings of the Company.
Dividends from the Company will depend, in part, upon receipt of dividends from the Bank, because the Company presently has no source of income other than dividends from the Bank, earnings from the investment of offering proceeds it retained and interest on the Company’s loan to the employee stock ownership plan. A regulation of the OTS imposes limitations on “capital distributions” by savings institutions such as the Bank. The Bank agreed with the OTS that dividends will not be declared without prior OTS approval.
|
(16)
|
Commitments and Contingencies
|
In the ordinary course of the Bank’s business, there are various outstanding legal proceedings. In the opinion of management, after consultation with legal counsel, the outcome of these legal proceedings will not have a material effect on the financial position, results of operations or liquidity position of the Bank or the Company.
The principal commitments and contingent liabilities of the Bank are discussed below.
Lease Commitments
At September 30, 2010, the Bank was obligated under non-cancelable operating leases on property used for banking purposes. These leases contain escalation clauses, which provide for minimum annual rental payments and payment of real estate taxes and other occupancy expense, that may be increased based upon increases in real estate taxes and in the other occupancy expenses. Rental expense was $718,000 and $690,000 for the years ended September 30, 2010 and 2009, respectively.
95
The projected minimum rental payments by fiscal year under the terms of the leases at September 30, 2010 are approximately as follows:
|
Year
|
Amount
|
|||
|
(In thousands)
|
||||
|
2011
|
$ | 546 | ||
|
2012
|
566 | |||
|
2013
|
521 | |||
|
2014
|
494 | |||
|
2015
|
434 | |||
|
Thereafter
|
2,933 | |||
| $ | 5,494 | |||
Loan Commitments
At September 30, 2010 and 2009, outstanding commitments made by the Bank for commercial and residential mortgages, undisbursed construction loans, and home equity lines of credit approximated $54.3 million and $121.4 million, respectively. The commitments at September 30, 2010 consisted of adjustable or variable rate commitments. The adjustable or variable rate commitments carry interest rates ranging from 2.25% to 10.00%. At September 30, 2010 there were no commitments to sell whole loans and the Bank had no standby letters of credit.
For commitments to originate loans, the Bank’s maximum exposure to credit risk is represented by the contractual amount of those instruments. Commitments represent exposure to credit risk only to the extent that they are subsequently drawn upon by customers. Some commitments have fixed expirations and, consequently, may not represent future cash requirements. The Bank uses the same credit policies and underwriting standards in making loan commitments as it does for on-balance-sheet instruments. For loan commitments, the Bank would generally be exposed to interest rate risk from the time a commitment is issued with a defined contractual interest rate.
|
(17)
|
Related Party Transactions
|
As of September 30, 2010 and 2009, the Bank had approximately $0.1 million, at both dates, of mortgage loans to its officers and related parties, with an interest rate of 5.0% at September 30, 2010 and 2009. There were no new loans or advances during the year ended September 30, 2010, and the remaining loan will mature within 8 years.
|
(18)
|
Fair Value Disclosures
|
FASB issued guidance regarding Fair Value Measurements, which defines fair value, establishes a framework for measuring fair value under GAAP, and expands disclosures about fair value measurements. This guidance applies to other accounting pronouncements that require or permit fair value measurements. The Company adopted the guidance effective for its fiscal year beginning October 1, 2008. The primary effect of the FASB-issued guidance on the Company was to expand the required disclosures pertaining to the methods used to determine fair values.
96
The FASB-issued guidance establishes a fair value hierarchy that prioritizes the inputs to valuation methods used to measure fair value. The hierarchy gives the highest priority to unadjusted quoted prices in active markets for identical assets or liabilities (Level 1 measurements) and the lowest priority to unobservable inputs (Level 3 measurements). The three levels of the fair value hierarchy under this guidance are as follows:
Level 1: Quoted prices in active markets for identical assets or liabilities.
Level 2: Observable inputs other than Level 1 prices, such as quoted for similar assets or liabilities; quoted prices in markets that are not active; or inputs that are observable or can be corroborated by observable market data for substantially the full term of the assets or liabilities.
Level 3: Unobservable inputs that are supported by little or no market activity and that are significant to the fair value of the assets or liabilities. Level 3 assets and liabilities include financial instruments whose value is determined using pricing models, discounted cash flow methodologies, or similar techniques, as well as instruments for which the determination of fair value requires significant management judgment or estimation.
An asset’s or liability’s level within the fair value hierarchy is based on the lowest level of input that is significant to the fair value measurement.
For financial assets measured at fair value on a recurring basis, the fair value measurements by level within the fair value hierarchy as reported on the consolidated statement of financial condition at September 30, 2010 and 2009 are as follows (in thousands):
|
(Level 1)
|
||||||||||||||||
|
Quoted Prices
|
(Level 2)
|
|||||||||||||||
|
in Active
|
Significant
|
(Level 3)
|
||||||||||||||
|
Markets for
|
Other
|
Significant
|
||||||||||||||
|
Identical
|
Observable
|
Unobservable
|
||||||||||||||
|
Description
|
September 30, 2010
|
Assets
|
Inputs
|
Inputs
|
||||||||||||
|
Mortgage-backed securities:
|
||||||||||||||||
|
Government agency
|
$ | 16,737 | $ | -- | $ | 16,737 | $ | -- | ||||||||
|
Government-sponsored enterprises
|
24,889 | -- | 24,889 | -- | ||||||||||||
|
Private issuers
|
21,352 | -- | 21,352 | -- | ||||||||||||
|
Government debentures
|
3,029 | 3,029 | -- | -- | ||||||||||||
|
Mutual funds
|
3,100 | 3,100 | -- | -- | ||||||||||||
|
Total securities available-for-sale
|
$ | 69,107 | $ | 6,129 | $ | 62,978 | $ | -- | ||||||||
|
(Level 1)
|
||||||||||||||||
|
Quoted Prices
|
(Level 2)
|
|||||||||||||||
|
in Active
|
Significant
|
(Level 3)
|
||||||||||||||
|
Markets for
|
Other
|
Significant
|
||||||||||||||
|
Identical
|
Observable
|
Unobservable
|
||||||||||||||
|
Description
|
September 30, 2009
|
Assets
|
Inputs
|
Inputs
|
||||||||||||
|
Mutual funds
|
$ | 3,305 | $ | 3,305 | $ | -- | $ | -- | ||||||||
97
For financial assets measured at fair value on a nonrecurring basis, the fair value measurements by level within the fair value hierarchy as reported on the consolidated statement of financial condition at September 30, 2010 and 2009 is as follows (in thousands):
|
(Level 1)
|
||||||||||||||||
|
Quoted Prices
|
(Level 2)
|
|||||||||||||||
|
in Active
|
Significant
|
(Level 3)
|
||||||||||||||
|
Markets for
|
Other
|
Significant
|
||||||||||||||
|
Identical
|
Observable
|
Unobservable
|
||||||||||||||
|
Description
|
September 30, 2010
|
Assets
|
Inputs
|
Inputs
|
||||||||||||
|
Impaired loans
|
$ | 123,888 | $ | -- | $ | -- | $ | 123,888 | ||||||||
|
(Level 1)
|
||||||||||||||||
|
Quoted Prices
|
(Level 2)
|
|||||||||||||||
|
in Active
|
Significant
|
(Level 3)
|
||||||||||||||
|
Markets for
|
Other
|
Significant
|
||||||||||||||
|
Identical
|
Observable
|
Unobservable
|
||||||||||||||
|
Description
|
September 30, 2009
|
Assets
|
Inputs
|
Inputs
|
||||||||||||
|
Impaired loans
|
$ | 17,880 | $ | -- | $ | -- | $ | 17,880 | ||||||||
|
Impaired securities
|
$ | 724 | $ | -- | $ | 724 | $ | -- | ||||||||
The following valuation techniques were used to measure fair value of assets in the tables above:
Securities available-for-sale – The fair value of the securities available-for-sale, which includes mortgage-backed securities, was obtained either through a primary broker/dealer or other third party provider from readily available price quotes as of September 30, 2010 (Level 1) or by obtaining matrix pricing, which is a mathematical technique widely used in the industry to value debt securities without relying exclusively on quoted prices for the specific securities but rather by relying on the securities’ relationship to other benchmark quoted securities (Level 2).
Impaired loans – The Company has measured impairment generally based on the fair value of the loan’s collateral. Fair value is generally determined based upon independent third party appraisals of the properties, or discounted cash flows based upon the expected proceeds. These assets are included as Level 3 fair values, based upon the lowest level of input that is significant to the fair value measurements. The fair value consists of the loan balances less their specific valuation allowances.
Impaired securities – The Company has measured impairment generally based on the fair values of securities (impaired) that are primarily determined by obtaining matrix pricing, which is a mathematical technique widely used in the industry to value debt securities without relying exclusively on quoted prices for the specific securities but rather by relying on the securities’ relationship to other benchmark quoted securities (Level 2 inputs).
98
The following table summarizes the carrying value and estimated fair value of the Company’s financial instruments at September 30, 2010 and 2009:
|
September 30, 2010
|
September 30, 2009
|
|||||||||||||||
|
Carrying
value
|
Estimated
fair value
|
Carrying
value
|
Estimated
fair value
|
|||||||||||||
|
(In thousands)
|
||||||||||||||||
|
Financial assets:
|
||||||||||||||||
|
Cash and due from banks
|
$ | 14,201 | $ | 14,201 | $ | 3,472 | $ | 3,472 | ||||||||
|
Securities available-for-sale
|
69,107 | 69,107 | 3,305 | 3,305 | ||||||||||||
|
Securities held-to-maturity
|
- | - | 66,201 | 59,334 | ||||||||||||
|
Loans receivable, net
|
369,842 | 369,750 | 419,685 | 421,085 | ||||||||||||
|
FHLB stock
|
1,803 | N/A | 2,382 | N/A | ||||||||||||
|
Accrued interest receivable
|
2,061 | 2,061 | 2,799 | 2,799 | ||||||||||||
|
Financial liabilities:
|
||||||||||||||||
|
Deposits
|
423,406 | 428,667 | 402,070 | 405,548 | ||||||||||||
|
Borrowings
|
10,500 | 10,936 | 27,300 | 27,390 | ||||||||||||
|
Accrued interest payable
|
28 | 28 | 24 | 24 | ||||||||||||
The methods and assumptions, not previously presented, used to estimate fair value are described as follows:
Carrying amount is the estimated fair value for cash and due from banks, accrued interest receivable and payable, demand deposits, short-term borrowings, and variable rate loans or deposits that reprice frequently and fully. For fixed rate loans or deposits and for variable rate loans or deposits with infrequent repricing or repricing limits, fair value is based on discounted cash flows using current market rates applied to the estimated life and credit risk. Fair value of borrowings is based on current rates for similar financing. It was not practicable to determine the fair value of FHLB stock due to restrictions placed on its transferability. The fair value of off-balance sheet items is not considered material.
99
|
(19)
|
(Loss) Earnings Per Common Share
|
The following is a summary of the calculation of (loss) earnings per share (EPS) (dollars in thousands, except per share amounts):
|
Years Ended September 30,
|
||||||||
|
2010
|
2009
|
|||||||
|
Net (loss) income
|
$ | (38,931 | ) | $ | 1,287 | |||
|
Weighted average common shares outstanding for computation of basic EPS
|
12,626,880 | 12,638,722 | ||||||
|
Dilutive common-equivalent shares
|
-- | 4,891 | ||||||
|
Weighted average common shares for computation of diluted EPS
|
12,626,880 | 12,643,613 | ||||||
|
(Loss) earnings per common share:
|
||||||||
|
Basic
|
$ | (3.08 | ) | $ | 0.10 | |||
|
Diluted
|
$ | (3.08 | ) | $ | 0.10 | |||
For the year ended September 30, 2010 609,668 potentially dilutive shares represented by restricted share awards and stock options were not included in the computation of diluted net loss per share because to do so would be anti-dilutive as the Company had a net loss.
|
(20)
|
Impact of Accounting Standards and Interpretations
|
In January 2010, the Financial Accounting Standards Board (the “FASB”) issued Accounting Standards Update (“ASU”) 2010-06, Fair Value Measurements and Disclosures (“Topic 820”): Improving Disclosures about Fair Value Measurements (“ASU 10-06”). ASU 10-06 revises two disclosure requirements concerning fair value measurements and clarifies two others. It requires separate presentation of significant transfers into and out of Levels 1 and 2 of the fair value hierarchy and disclosure of the reasons for such transfers. It will also require the presentation of purchases, sales, issuances and settlements within Level 3 on a gross basis rather than a net basis. The amendments also clarify that disclosures should be disaggregated by class of asset or liability and that disclosures about inputs and valuation techniques should be provided for both recurring and non-recurring fair value measurements. The new disclosures and clarifications of existing disclosures are effective for interim and annual reporting periods beginning after December 15, 2009, except for the disclosures about purchases, sales, issuances and settlements in the roll forward of activity in Level 3 fair value measurements. Those disclosures are effective for fiscal years beginning after December 15, 2010, and for interim periods within those fiscal years. These new disclosure requirements were adopted by the Company during the current period, with the exception of the requirement concerning gross presentation of Level 3 activity, which is effective for fiscal years beginning after December 15, 2010. With respect to the portions of this ASU that were adopted during the current period, the adoption of this standard did not have a material impact on the Company’s financial position, results of operations, cash flows, or disclosures. Management does not believe that the adoption of the remaining portion of this ASU will have a material impact on the Company’s financial position, results of operation, cash flows, or disclosures.
In February 2010, the FASB issued ASU 2010-09, Subsequent Events (“Topic 855”): Amendments to Certain Recognition and Disclosure Requirements. The amendments remove the requirement for a Securities and Exchange Commission (“SEC”) registrant to disclose the date through which subsequent events were evaluated as this requirement would have potentially conflicted with SEC reporting requirements. Removal of the disclosure requirement is not expected to affect the nature or timing of subsequent events evaluations performed by the Company. This ASU became effective upon issuance.
100
In July 2010, the FASB issued ASU No. 2010-20 which amends the authoritative accounting guidance under Topic 310, Receivables. The guidance amends existing disclosures to provide financial statement users with greater transparency about an entity’s allowance for loan and lease losses and the credit quality of its loan and lease portfolio. Under the new guidelines, the allowance for loan and lease losses and fair value are to be disclosed by portfolio segment, while credit quality information, impaired loans and leases and non-accrual status are to be presented by class of loans and leases. Disclosure of the nature and extent, the financial impact and segment information of troubled debt restructurings will also be required. The disclosures are to be presented at the level of disaggregation that management uses when assessing and monitoring the loan and lease portfolio’s risk and performance. This guidance is effective for interim and annual reporting periods ending on or after December 15, 2010. Adoption of this guidance is not expected to have a material effect on the Company’s results of operations or financial condition.
|
(21)
|
Condensed Parent Company Financial Statements
|
Set forth below are the condensed statements of financial condition and related condensed statements of income and cash flows as of September 30, 2010 and 2009:
|
2010
|
2009
|
|||||||
|
(In thousands)
|
||||||||
|
Condensed Statements of Financial Condition
|
||||||||
|
Assets:
|
||||||||
|
Cash
|
$ | 2,602 | $ | 4,594 | ||||
|
Loans receivable from ESOP
|
2,641 | 2,768 | ||||||
|
Investment in Brooklyn Federal Savings Bank
|
39,108 | 74,100 | ||||||
|
Other investments
|
100 | 100 | ||||||
|
Accrued interest receivable
|
79 | 101 | ||||||
|
Other assets
|
374 | 1,232 | ||||||
|
Total assets
|
$ | 44,904 | $ | 82,895 | ||||
|
Liabilities
|
$ | 500 | $ | 1,021 | ||||
|
Stockholders’ equity
|
44,404 | 81,874 | ||||||
|
Total liabilities and stockholders’ equity
|
$ | 44,904 | $ | 82,895 | ||||
| 2010 | 2009 | |||||||
|
(In thousands)
|
||||||||
|
Condensed Statements of Income
|
||||||||
|
Interest income
|
$ | 88 | $ | 119 | ||||
|
Non-interest expense
|
1,431 | 898 | ||||||
|
Income tax expense (benefit)
|
276 | (343 | ) | |||||
|
Loss before equity in undistributed earnings of subsidiary
|
(1,619 | ) | (436 | ) | ||||
|
Equity in undistributed earnings of Brooklyn Federal Savings Bank
|
(38,647 | ) | 1,723 | |||||
|
Net income
|
$ | (40,266 | ) | $ | 1,287 | |||
101
|
2010
|
2009
|
|||||||
|
(In thousands)
|
||||||||
|
Condensed Statements of Cash Flows
|
||||||||
|
Cash flows from operating activities:
|
||||||||
|
Net income:
|
$ | (40,266 | ) | $ | 1,287 | |||
|
Adjustments to reconcile net income to net cash provided by (used in) operating activities:
|
||||||||
|
Equity in undistributed (losses) earnings of the Bank
|
38,647 | (1,723 | ) | |||||
|
Stock-based incentive plan
|
207 | 313 | ||||||
|
Decrease in accrued interest receivable
|
22 | 95 | ||||||
|
(Increase) decrease in other assets
|
858 | 372 | ||||||
|
(Decrease) increase in other liabilities
|
(521 | ) | 872 | |||||
|
Net cash (used in) provided by operating activities
|
(1,053 | ) | 1,216 | |||||
|
Cash flows from investing activities:
|
||||||||
|
Repayment on ESOP loan
|
127 | 88 | ||||||
|
Net cash provided by investing activities
|
127 | 88 | ||||||
|
Cash flows from financing activities:
|
||||||||
|
Purchase of treasury stock
|
(13 | ) | (1,264 | ) | ||||
|
Payment of cash dividend
|
(1,053 | ) | (1,455 | ) | ||||
|
Net cash used in financing activities
|
(1,066 | ) | (2,719 | ) | ||||
|
Net decrease in cash
|
(1,992 | ) | (1,415 | ) | ||||
|
Cash at beginning of period
|
4,594 | 6,009 | ||||||
|
Cash at end of period
|
$ | 2,602 | $ | 4,594 | ||||
102
Item 9. Changes in and Disagreements with Accountants on Accounting and Financial Disclosure
During the period of Grant Thorton’s engagement from January 7, 2010 through December 20, 2010, there was one reportable event as described in Item 304(a)(1)(v) of Regulation S-K. As a result of its review of interim financial statements for the period ended March 31, 2010, Grant Thorton reported one material weakness in the Company’s internal control over financial reporting for its allowance for loan and lease losses.
Management also concluded that the Company’s disclosure controls and procedures were not effective as of March 31, 2010. Management’s conclusion was primarily related to the methodologies the Company used to assess the adequacy of the allowance for loan losses and concluded that such methodologies relied too heavily on subjective factors, and did not adequately take into account directional trends. Management concluded that this was a material weakness in the Company’s internal control over financial reporting. Disclosure of this material weakness was included in Item 4T of the Company’s Form 10-Q for the quarterly period ended March 31, 2010. As disclosed in the Company Quarterly Report on Form 10-Q for the period ended June 30, 2010, an evaluation was performed under the supervision and with the participation of the Company’s Chief Executive Officer and Chief Financial Officer of the effectiveness, as of June 30, 2010, of the Company’s disclosure controls and procedures (as defined in Rule 13a-15(e) under the Securities Exchange Act of 1934, as amended). Based upon that evaluation, the Company concluded that its disclosure controls and procedures were effective as of June 30, 2010 at a reasonable assurance level. The Company’s conclusion was predicated on the fact that it believed that it had corrected the material weakness related to its methodologies used to assess the adequacy of the allowance for loan losses as noted in the Form 10-Q for the period ended March 31, 2010. The Company has amended and restated its Form 10-Q for the period ended June 30, 2010 (as well as its Forms 10-Q for the other fiscal year 2010 quarterly periods) to address certain other miscalculations in the allowance for loan losses, as further discussed below, and has amended the discussion of its disclosure controls and procedures as of June 30, 2010 to present its revised conclusion that such controls were not adequate as of June 30, 2010.
On January 6, 2010, the “Company” dismissed ParenteBeard LLC (“ParenteBeard”) as the Company’s independent registered public accounting firm. For the fiscal years ended September 30, 2009 and September 30, 2008 and from October 1, 2009 through January 6, 2010, there were no disagreements with ParenteBeard on any matter of accounting principles or practices, financial statement disclosure or auditing scope or procedures, which disagreements, if not resolved to the satisfaction of ParenteBeard, would have caused it to make reference to such disagreements in its reports. In addition, there were no “reportable events” as such term is described in Item 304(a)(1)(iv) of Regulation S-K. The dismissal was approved by the Audit Committee of the Company’s Board of Directors.
On January 7, 2010, Grant Thorton LLP (“Grant Thorton”) was engaged as the Company’s independent registered public accounting firm. Prior to engaging Grant Thorton, the Company did not consult with Grant Thorton regarding the application of accounting principles to a specific completed or contemplated transaction or regarding the type of audit opinions that might be rendered by Grant Thorton on the Company’s financial statements, and Grant Thorton did not provide any written or oral advice that was an important factor considered by the Company in reaching a decision as to any such accounting, auditing or financial reporting issue.
Grant Thornton resigned prior to completing an audit of the Company’s financial statements for the fiscal year ended September 30, 2010, and did not issue any audit reports on the consolidated financial statements of the Company during the time it was engaged as the Company’s independent registered public accounting firm. Accordingly, there were no reports issued by Grant Thornton during the past two years that contained an adverse opinion or disclaimer of opinion, or that were qualified or modified as to uncertainty, audit scope or accounting principles. From the date Grant Thornton was engaged through December 20, 2010, the date of resignation, there were no disagreements with Grant Thornton on any matter of accounting principles or practices, financial statement disclosure or auditing scope or procedures, which disagreements, if not resolved to the satisfaction of Grant Thornton would have caused it to make reference to such disagreement in connection with its report.
103
On February 4, 2011, the Company engaged Crowe Horwath LLP as the Company’s independent registered public accounting firm. The opinion of Crowe Horwath as to the financial condition of the Company is included herein. The audit provided by Crowe Horwath does not include, and is not required to include, an audit of the Company’s internal control over financial reporting.
As discussed in further detail below, management has received an audit of the financial condition of the Company from Crowe Horwath, which has identified a material weakness in the Company’s internal control over financial reporting associated with the determination of the Bank’s allowance for loan losses on a quarterly basis, a reportable event as described in Item 304(a)(1)(v). Solely as a result of this material weakness, the Chief Executive Officer and Chief Financial Officer have concluded that, as of September 30, 2010, our disclosure controls and procedures were not effective in alerting them in a timely manner to material information relating to us (including the Bank) required to be included in our periodic SEC filings.
Item 9A. Controls and Procedures
|
|
(a)
|
Evaluation of disclosure controls and procedures.
|
Under the supervision and with the participation of our management, including our Chief Executive Officer and Chief Financial Officer, we evaluated the effectiveness of the design and operation of our disclosure controls and procedures (as defined in Rule 13a-15(e) and 15d-15(e) under the Exchange Act) as of the end of the fiscal year covered in this annual report on Form 10-K (the “Evaluation Date”).
In connection with the completion and audit of the Company’s consolidated financial statements for the fiscal year ended September 30, 2010, management, together with Crowe Horwath, identified certain miscalculations in its allowance for loan losses during and between fiscal year 2010 quarterly periods. The miscalculations resulted from delays in the provision of updated appraisal information to the Company’s accounting personnel after new appraisals were secured, ultimately delaying the completion of impairment testing and, at times, delaying the recognition of partial loan charge-offs until subsequent periods, which is the base factor in the calculation of the allowance for loan losses. Control procedures in place for reviewing the Company’s methodology for determining the allowance for loan losses did not timely identify the miscalculations, and as such, the Company did not have adequately designed procedures. Together with the filing of this annual report on Form 10-K, the Company is filing amended and restated Forms 10-Q for the first three quarterly periods of fiscal year 2010 to correct the allowance for loan losses as set forth in the quarterly consolidated financial statements. As part of their audit of our financial statements, Crowe Horwath indentified a material weakness associated with the procedure for determining the allowance for loan losses. Crowe Horwath has not conducted, nor are they required to conduct, an audit of the Company’s internal controls. As a result of the material weakness identified and the resulting restatement of the quarterly results during fiscal year 2010, the Chief Executive Officer and Chief Financial Officer have concluded that, as of the Evaluation Date, our disclosure controls and procedures were not effective in alerting them in a timely manner to material information relating to us (or our consolidated subsidiary) required to be included in our periodic SEC filings.
In connection with completing the Company’s financial statements for fiscal year 2010 and this annual report on Form 10-K, management has initiated changes to its appraisal review procedures to remediate the material weakness described above and to enhance our internal control over financial reporting. Specifically, management has initiated procedures that require the results of appraisals be provided to the Company’s internal accounting staff and any related impairment testing conducted immediately upon receipt of new appraisals, subject to updating for any additional information identified following full review of the appraisals. Prior to identification of the problems described above, the appraisal information was provided to the internal accounting staff only after internal review of the appraisal and completion of any required third party review, which resulted in the identified delays.
104
Notwithstanding the evaluation and initiation of these remediation actions, the identified material weakness in our internal control over financial reporting will not be considered remediated until the new control procedures are fully implemented, in operation for a sufficient period of time, tested and concluded by management to be operating effectively.
|
|
(b)
|
Management’s Annual Report on Internal Control over Financial Reporting.
|
Management of the Company is responsible for establishing and maintaining adequate internal control over financial reporting. The Company’s system of internal control is designed under the supervision of management, including our Chief Executive Officer and Chief Financial Officer, to provide reasonable assurance regarding the reliability of our financial reporting and the preparation of the Company’s consolidated financial statements for external reporting purposes in accordance with U.S. generally accepted accounting principles (“GAAP”).
Our internal control over financial reporting including policies and procedures that pertain to the maintenance of records that, in reasonable detail, accurately and fairly reflect transactions and dispositions of assets; provide reasonable assurances that transactions are recorded as necessary to permit preparation of financial statements in accordance with GAAP, and that receipts and expenditures are made only in accordance with the authorization of management and the Board of Directors; and provide reasonable assurance regarding prevention or timely detection of unauthorized acquisition, use, or disposition of the Company’s assets that could have a material effect on our consolidated financial statements.
Because of its inherent limitations, internal control over financial reporting may not prevent or detect misstatements. Projections on any evaluation of effectiveness to future periods are subject to the risk that the controls may become inadequate because of changes in conditions or that the degree of compliance with policies and procedures may deteriorate.
As of the Evaluation Date, management assessed the effectiveness of the Company’s internal control over financial reporting based upon the framework established in Internal Control – Integrated Framework issued by the Committee of Sponsoring Organizations of the Treadway Commission (“COSO”). Based upon management’s assessment, with input from our independent registered public accounting firm, and as a result of the material weakness discussed above, management concluded that the Company’s internal control over financial reporting as of September 30, 2010 is not effective using these criteria. This annual report does not include an attestation report of the Company’s independent registered public accounting firm regarding internal control over financial reporting. Management’s report was not subject to attestation by the Company’s independent registered public accounting firm pursuant to SEC rules that permit smaller reporting companies to provide only management’s report in this annual report.
|
|
(c)
|
Changes in Internal Controls over Financial Reporting.
|
There were no significant changes made in our internal controls during the period covered by this report or, to our knowledge, in other factors that has materially affected or is reasonably likely to materially affect, the Company’s internal control over financial reporting. However, following the Evaluation Date, the Company has changed it procedures for dealing with appraisals as part of its determination of the Bank’s allowance for loan losses, as described above, to remediate the material weakness identified in its procedures for the determination of the allowance for loan losses.
Item 9B. Other Information
None.
105
PART III.
INFORMATION ABOUT THE COMPANY’S BOARD OF DIRECTORS AND EXECUTIVE OFFICERS
The Company’s Board of Directors consists of seven members, and is divided into three classes, with one class of directors elected each year. Directors of the Company are generally elected to serve for a three-year period and until their respective successors have been elected and qualified.
Current Directors and Former Directors Who Left the Company’s Board After September 30, 2010
|
Age(1)
|
Position with Company
|
Director Since(2)
|
Term Expires
|
||||||||||
|
Current
|
|||||||||||||
|
Daniel O. Reich
|
79 |
Chairman of the Board
|
1985 | 2011 | |||||||||
|
Rebecca Northey(3)
|
62 |
Director
|
2010 | 2011 | |||||||||
|
Mark Hughes(4)
|
58 |
Director
|
2011 | 2011 | |||||||||
|
Gregg J. Wagner(5)
|
50 |
Director, President and Chief Executive Officer
|
2011 | 2011 | |||||||||
|
Angelo J. Di Lorenzo
|
70 |
Vice Chairman
|
1976 | 2012 | |||||||||
|
Arthur R. Williams
|
56 |
Director
|
2007 | 2012 | |||||||||
|
Richard A. Kielty(6)
|
63 |
Director
|
2009 | 2012 | |||||||||
|
Former Directors Who Left the Company’s Board After September 30, 2010
|
|||||||||||||
|
John A. Loconsolo(7)
|
91 |
Former Director
|
1980 – 2011 | -- | |||||||||
|
John C. Gallin(8)
|
69 |
Former Director
|
1980 -- 2011 | -- | |||||||||
(1) As of September 30, 2010.
|
(2)
|
Reflects initial appointment to the Board of Directors of the mutual predecessor to Brooklyn Federal Savings Bank, if applicable.
|
|
(3)
|
Ms. Northey was appointed to the Boards of Directors of the Company, the Bank and BFS Bancorp, MHC on November 9, 2010, prior to which Ms. Northey had been an advisory, non-voting director of the Bank since December 2009.
|
|
(4)
|
Mr. Hughes was appointed to the Boards of Directors of the Company, the Bank and BFS Bancorp, MHC on May 9, 2011, prior to which Mr. Hughes had been an advisory, non-voting director of the Bank since January 2011.
|
|
(5)
|
Mr. Wagner was appointed to the Boards of Directors of the Company, the Bank and BFS Bancorp, MHC on June 6, 2011. Mr. Wagner has served as President and Chief Executive Officer of the Company, the Bank and BFS Bancorp, MHC since May 23, 2011.
|
|
(6)
|
Mr. Kielty resigned as President and Chief Executive Officer of the Company, the Bank, and BFS Bancorp, MHC, effective May 23, 2011.
|
|
(7)
|
Mr. Loconsolo resigned as a director of the Company, the Bank and BFS Bancorp, MHC on April 7, 2011. His term as a director had been scheduled to expire in 2013.
|
|
(8)
|
Mr. Gallin resigned from the Board in January 2011.
|
106
Directors Biographical Information
The biographies of each of the board members below contain information regarding the person’s business experience and the experiences, qualifications, attributes or skills that caused the Nominating Committee of the Board of Directors and the Board of Directors to determine that the person should serve as a director. The principal occupation during the past five years of each of our directors is set forth below. All directors have held their present positions for at least five years unless otherwise stated. Each director is also a director of Brooklyn Federal Savings Bank.
A majority of the directors are or were long-time residents of the communities served by the Company and the Bank and many of such individuals have operated, or currently operate, businesses located in such communities. As a result, each director has significant knowledge of the businesses that operate in the Company’s market area, an understanding of the general real estate market, values and trends in such communities and an understanding of the overall demographics of such communities. As the holding company for a community banking institution, the Company believes that the local knowledge and experience of its directors assists the Company in assessing the credit and banking needs of its customers, developing products and services to better serve its customers and assessing the risks inherent in its lending operations, and provides the Company with greater business development opportunities.
Current Directors
Daniel O. Reich. Mr. Reich is Chairman of Reich Paper, Inc., an importer and marketer of proprietary paper brands for graphic arts applications. Mr. Reich’s specific experience and qualifications that led to the Board of Directors’ conclusion that he should serve as a director include his experience as a business owner as well as his knowledge of and relationships with participants in the local business markets, which allow him to bring a unique perspective to the Board of Directors.
Rebecca Northey. Ms. Northey is a partner at the law firm of Menaker & Herrmann LLP, New York, New York, where her practice concentrates in the fields of employment law and commercial and civil rights litigation. The Board of Directors values Ms. Northey’s legal training, depth of experience in employment related matters and knowledge of corporate governance issues, which make her an invaluable member of the Board.
Angelo J. Di Lorenzo. Mr. Di Lorenzo retired as an executive officer from the Bank and the Company, effective January 2, 2009. Mr. Di Lorenzo served as Chief Executive Officer of the Bank from 1972 to January 2, 2009. Mr. Di Lorenzo has served as a director since 1976. Mr. Di Lorenzo possesses a far-ranging depth of experience in the financial services industry. His extensive knowledge of the industry and strong leadership skills provides the Company and Bank with invaluable insight and guidance into the business and regulatory requirements of today’s banking environment.
Arthur R. Williams. Mr. Williams is a certified public accountant and has served as a partner of the certified public accounting practice of A&A Williams LLP, Shelter Island, New York since 1993. Mr. Williams is a member of the Company’s audit committee and is designated as an “audit committee financial expert,” as that term is defined by SEC regulations. The Board of Directors values Mr. Williams’ strong background in accounting, which assists the Company in its oversight of financial reporting and disclosure issues.
Mark Hughes. Mr. Hughes is a private investor and has thirty years of extensive banking and financial experience. Mr. Hughes has been an advisory, non-voting director of the Bank since January 2011. Mr. Hughes’ keen knowledge of the investment markets and focused experience in the banking and financial sectors allow him to bring a unique and valuable perspective to the Board.
107
Richard A. Kielty. Mr. Kielty served as an employee of the Bank since 1970, and became President and Chief Operating Officer effective January 1, 2008. Prior to that, he served as Chief Financial Officer since 2002. Effective January 2, 2009, Mr. Kielty became President and Chief Executive Officer, serving until his resignation in May 2011.
Gregg J. Wagner. Mr. Wagner is a Certified Public Accountant with 29 years of community banking experience. From 2008 through 2010, Mr. Wagner was President and Chief Executive Officer of Allegiance Bank of North America, located in Bala Cynwyd, Pennsylvania. From 2007 through 2008, Mr. Wagner was Chief Financial Officer at Royal Bank of America, Narberth, Pennsylvania. From 1994 through 2006, Mr. Wagner was employed as an executive officer of Harleysville National Corporation and served as President and Chief Executive Officer from 2005 through 2006. The Board of Directors believes that Mr. Wagner’s far-ranging depth of experience in the banking industry, as well as his strong financial analysis and organizational skills, make him an excellent candidate as a Director, as well as in his current leadership positions as President and Chief Executive Officer of the Company and Bank. Mr. Wagner’s extensive knowledge of the industry provides the Company and Bank with invaluable insight and guidance into the business and regulatory requirements of today’s banking environment.
Former Directors Serving During Fiscal Year 2010
John A. Loconsolo. Mr. Loconsolo is President of Locon Corp., a real estate holding company of New York City properties; President of Loconsolo, Properties, L.L.C., a real estate holding company of New Jersey properties; and President of Jack Loconsolo & Co., a wholesale and retail paint, wallpaper and sundries distributor.
John C. Gallin. Mr. Gallin is retired. He previously was president and the majority owner of John Gallin & Son, Inc., a building contractor.
Executive Officers Who Are Not Directors and Former Executive Officers Who Left the Company After September 30, 2010
Our Board of Directors has the authority to appoint our officers. Each officer will hold office for such term as may be prescribed by the board of directors and until such person’s successor is chosen and qualified or until such person’s death, resignation or removal.
Michael A. Trinidad. Mr. Trinidad, age 53, was hired in April, 2009 as the Vice President and Controller and became Vice President and Chief Financial Officer in March, 2010 and became Senior Vice President and Chief Financial Officer in May 2011. Prior to joining the Bank and the Company, he was Senior Vice President and Controller at Carver Bancorp, Inc., a position he held from June, 2007. Before Carver Bancorp, Inc., Mr. Trinidad was First Vice President and Corporate Accounting Manager at Independence Community Bank, a position he held since 1997. Mr. Trinidad was employed at Independence Community Bank since 1989, where he held various managerial roles with increasing responsibilities in the Corporate Accounting Group. In 2006, Independence Community Bank was acquired by Sovereign Bancorp Inc.
Joanne Gallo. Ms. Gallo age 59, became Vice President and Chief Credit Officer in November, 2010 and became Senior Vice President and Chief Credit Officer in May 2011. Ms. Gallo commenced her career at Chase Manhattan Bank, NA where she worked for 21 years rising to the level of Division Executive. She spent a number of years at Prudential Financial where she was a Department Vice President. Prior to joining Brooklyn Federal Savings Bank she was an independent consultant providing loan review services to numerous banks in the New York City metropolitan area.
Marc Leno. Mr. Leno, age 53, served as Chief Lending Officer at the Bank from 2001 until his resignation in March 2011. Prior to that, he was a commercial mortgage-lending officer at various local financial institutions.
Marilyn Alberici. Ms. Alberici, age 66, served as Loan Servicing Officer from 1981 until her retirement in January 2011.
108
SECTION 16(a) BENEFICIAL OWNERSHIP REPORTING COMPLIANCE
The Company’s common stock is registered with the SEC pursuant to Section 12(b) of the Exchange Act. The executive officers and directors of the Company and beneficial owners of greater than 10% of the common stock are required to file reports on Forms 3, 4 and 5 with the SEC disclosing beneficial ownership and changes in beneficial ownership of the Common Stock. SEC rules require disclosure in the Company’s Proxy Statement or Annual Report on Form 10-K of the failure of an officer, director or 10% beneficial owner of the common stock to file a Form 3, 4 or 5 on a timely basis. Based on the Company’s review of ownership reports, no officer or director failed to file ownership reports on a timely basis for the fiscal year ended September 30, 2010.
CODE OF ETHICS
The Company has adopted a Code of Business Conduct and Ethics that is applicable to all directors, officers and employees of the Company and the Bank, including the principal executive officer, principal financial officer, principal accounting officer or controller, and all persons performing similar functions. The Code of Business Conduct and Ethics is posted on the Company’s website at www.brooklynbank.com. Amendments to and waivers from the Code of Business Conduct and Ethics will also be disclosed on the Company’s website at www.brooklynbank.com.
NO MATERIAL CHANGES TO DIRECTOR NOMINATION PROCEDURES BY SECURITY HOLDERS
There have been no material changes to the procedures by which security holders may recommend nominees to the Company’s board of directors since the Company last described such procedures in “Procedures for the Recommendation by Stockholders of Director Nominees” in the Company’s definitive proxy statement for the 2010 Annual Meeting of Shareholders filed with the Securities and Exchange Commission on January 7, 2010.
AUDIT COMMITTEE MATTERS
The Company has a separately-designated standing Audit Committee. The Audit Committee currently consists of directors Arthur R. Williams (Chairman), Rebecca Northey and Daniel O. Reich. John C. Gallin also served on the committee until his retirement in February 2011. Each member of the Audit Committee is considered “independent” as defined in the NASDAQ corporate governance listing standards and under SEC Rule 10A-3. The Board of Directors has determined that Director Williams qualifies as an “audit committee financial expert” as that term is defined by the rules and regulations of the SEC.
Item 11. Executive Compensation
Summary Compensation Table. The following table sets forth for the fiscal years ended September 30, 2010 and 2009, certain information as to the total remuneration paid by the Bank to its Principal Executive Officer and its two other most highly compensated executive officers of the Bank who received salary and bonus in excess of $100,000.
109
Summary Compensation Table as of September 30, 2010
|
Name and Principal
Position
|
Year
|
Salary
($)
|
Bonus
($)
|
Stock
Awards
($)
|
Option
Awards
($)
|
Nonqualified
Deferred
Compensation
Earnings ($)(3)
|
|
All Other
Compensation
($) (4)
|
|
Total
($)
|
||||||||||||||
|
Richard A. Kielty,
Former President and Chief Executive Officer(1) |
2010
|
260,467
|
10,000
|
—
|
—
|
236,323
|
149,805
|
656,596
|
||||||||||||||||
|
2009
|
241,535
|
35,200
|
—
|
—
|
219,938
|
83,717
|
580,390
|
|||||||||||||||||
|
Marc Leno,
Former Senior Vice
President and Chief |
2010
|
205,800
|
8,266
|
—
|
—
|
—
|
60,567
|
274,633
|
||||||||||||||||
|
Lending Officer(2)
|
2009
|
193,685
|
30,800
|
—
|
—
|
—
|
111,041
|
335,526
|
||||||||||||||||
|
Michael A. Trinidad, Senior Vice President and Chief Financial Officer
|
2010
|
136,654
|
3,283
|
—
|
—
|
—
|
4,060
|
143,997
|
||||||||||||||||
|
2009
|
48,231
|
—
|
—
|
—
|
—
|
—
|
48,231
|
|||||||||||||||||
|
(1)
|
Mr. Kielty resigned as President and Chief Executive Officer of the Company, the Bank, and BFS Bancorp, MHC, effective May 23, 2011. Mr. Kielty served as President and Chief Operating Officer during the fiscal year ended September 30, 2008 and a portion of the fiscal year ended September 30, 2009. Mr. Kielty became President and Chief Executive Officer on January 2, 2009.
|
|
(2)
|
Mr. Leno resigned as the Bank’s Executive Vice President and Chief Lending Officer as of March 15, 2011.
|
|
(3)
|
2009 compensation includes a $219,938 increase in value of Mr. Kielty’s Supplemental Executive Retirement Plan Agreement, and 2010 compensation includes $236,323 increase in value of his Supplemental Executive Retirement Plan Agreement.
|
|
(4)
|
All other compensation includes the following:
|
|
Year
|
Reimbursement
for Unused
Sick
Leave ($)
|
Brooklyn
Federal
Bancorp,
Inc.
Board Fees
($)
|
REIT
Board
Fees
($) |
ESOP
($)
|
Money
Purchase
Plan
|
Mortgage
Commission
($)
|
Automobile
Allowance/
Other
($)
|
Restricted
Stock
Dividends
|
Split
Dollar
|
Total
($)
|
||||||||||||||||||||||||||||||||
|
Richard A. Kielty
|
2010
|
5,769 | — | 7,440 | 1,665 | 20,434 | — | 4,321 | 110,175 | 149,805 | ||||||||||||||||||||||||||||||||
|
2009
|
5,077 | — | 7,185 | 8,981 | 20,088 | — | 5,581 | — | 36,805 | 83,717 | ||||||||||||||||||||||||||||||||
|
Marc Leno
|
2010
|
4,798 | 1,733, | 20,434 | 21,164 | 5,470 | 6,968 | 60,567 | ||||||||||||||||||||||||||||||||||
|
2009
|
4,442 | — | — | 9,271 | 20,088 | 62,941 | 6,627 | 7,672 | 111,041 | |||||||||||||||||||||||||||||||||
|
Michael A. Trinidad
|
2010
|
4,060 | 4,060 | |||||||||||||||||||||||||||||||||||||||
|
2009
|
||||||||||||||||||||||||||||||||||||||||||
110
Benefit Plans and Arrangements
The Company and Bank currently do not have employment agreements with either Mr. Wagner or Mr. Trinidad. Mr. Wagner joined the Company and Bank on May 23, 2011. The terms of his employment provide for an initial base salary of $25,000 per month, with a monthly housing allowance of up to $5,000 and an automobile allowance. In addition, the Bank will seek the approval of the OTS to provide Mr. Wagner with a severance agreement under which the Bank will pay up to three months of base salary in the event of an involuntary termination for any reason other than termination for cause.
The following is a summary of compensation plans in place as of September 30, 2010, which should be read in conjunction with the information provided in the Summary Compensation Table above.
Employment Agreements. The Bank entered into similar employment agreements with Messrs. Kielty and Leno. As noted above, Mr. Kielty resigned as President and Chief Executive Officer of the Company, the Bank, and BFS Bancorp, MHC, effective May 23, 2011. Mr. Leno resigned as the Bank’s Executive Vice President and Chief Lending Officer as of March 15, 2011. The employment agreement with Mr. Kielty was initially dated as of April 1, 2005, and the employment agreement with Mr. Leno was initially dated as of February 1, 2006. Each of the employment agreements were amended and restated effective as of January 1, 2008, in order to conform the agreement to changes in the tax laws under Section 409A of the Internal Revenue Code and the regulations issued thereunder. The Company is a signatory to each of the agreements for the sole purpose of guaranteeing payments thereunder. The agreement with Mr. Kielty had a term of three years and the agreement with Mr. Leno had a term of two years. On January 1 of each year the employment agreements would renew for an additional year so that the remaining term will be three years for Mr. Kielty and two years for Mr. Leno, unless notice of nonrenewal is provided to the executives prior to such anniversary date. In 2009, the Bank delivered notices of non-renewal of the employment agreements, such that Mr. Kielty’s agreement would expire on December 31, 2012 and Mr. Leno’s agreement would expire on December 31, 2011. This action was not taken as a reflection of the executive’s performance. The Board indicated that they would determine whether to offer any employment agreements to these officers in the future, and the terms thereof would be based upon a variety of factors, including the economic and regulatory environment. The disinterested members of the Board were required to conduct an annual performance evaluation of each executive for purposes of determining whether to renew the employment agreement. Under the agreements, the base salaries for Messrs. Kielty and Leno were $268,275 and $212,474, respectively, assuming termination of employment on September 30, 2010. In addition to the base salary, each agreement provided for, among other things, participation in bonus programs and other employee pension benefit and fringe benefit plans applicable to executive employees. Each executive’s employment was terminable for cause at any time, in which event the executive would have no right to receive compensation or other benefits under the employment agreement for any period after termination.
Certain events resulting in the executive’s termination or resignation entitled the executive to payments of severance benefits following termination of employment. In the event the executive’s employment was terminated for reasons other than for cause, disability or retirement, or if executive is involuntarily terminated in connection with or following a change in control, or in the event the executive resigned during the term of the agreement following (i) failure to elect or reelect or to appoint or reappoint the executive to his executive position, (ii) a material change in the nature or scope of the executive’s authority, (iii) the liquidation or dissolution of the Bank or the Company that would affect the status of the executive, (iv) a reduction in the executive’s annual compensation, or a relocation of the executive’s principal place of employment by more than 25 miles, or (v) a material breach of the employment agreement by the Bank, then the executive would be entitled to a severance payment under the agreement equal to three times for Mr. Kielty and two times for Mr. Leno the sum of the executive’s base salary and the highest rate of bonus awarded to the executive during the prior three years, payable in a lump sum. In addition, the executive would be entitled, at no expense to the executive, to the continuation of substantially comparable life, and non-taxable medical, dental and disability coverage for 36 months for Mr. Kielty and 24 months for Mr. Leno following the date of termination. The executive would also receive a lump sum cash payment equal to the present value (discounted at 6%) of contributions that would have been made on his behalf under the Bank’s 401(k) plan, money purchase plan and employee stock ownership plan as if the executive had continued working for the 36-month period for Mr. Kielty and 24-month period for Mr. Leno following his termination of employment. In the event that their employment terminated for a reason entitling them to severance payments other than a change in control, Messrs. Kielty and Leno would receive severance payments of approximately $1,033,301 and $585,493, respectively, pursuant to their employment agreements assuming a termination as of September 30, 2010. In the event payments to the executives would result in an “excess parachute payment” as defined in Section 280G of the Internal Revenue Code, payments under the employment agreements with the Bank would be reduced in order to avoid this result. Accordingly, assuming termination of employment on September 30, 2010, in the event that the severance payment provisions of the employment agreements are triggered following a change in control, Mr. Kielty’s severance payment would have been reduced to $831,366 and the payment to Mr. Leno would not constitute an “excess parachute payment.” Certain severance payments and other benefits to Messrs. Kielty and Leno may be delayed for up to six months following their “separation from service” with the Bank in the event the executive is determined to be a “specified employee” as defined in Code Section 409A.
111
Under each employment agreement, if an executive becomes “disabled,” as defined for purposes of Code Section 409A, the Bank would continue to pay the executive’s salary for the longer of one year, or the remaining term of the agreement, reduced by payments to the executive under any applicable disability program. In the event of executive’s death, his estate or beneficiaries would have been paid executive’s base salary for one year from executive’s death, and would receive continued medical, dental, family and other benefits for one year. Upon retirement at age 65 or such later date determined by the Board, executive will receive only those benefits to which he is entitled under any retirement plan of the Bank to which he is a party.
Upon termination of the executive’s employment other than in connection with a change in control, the executive is subject to an agreement not to compete with the Bank for a period of one year following termination of employment within 25 miles of any existing branch of the Bank or any subsidiary of the Company, or within 25 miles of any office for which the Bank, or a subsidiary has filed an application for regulatory approval to establish an office, or to solicit employees or customers of the Bank during the same period.
Neither Mr. Kielty nor Mr. Leno received any severance payments or other benefits upon resignation under their Employment Agreements. Their Employment Agreements terminated upon their resignation.
Money Purchase Pension Plan. On November 1, 1984, the Bank established the tax-qualified Brooklyn Federal Savings Bank Money Purchase Pension Plan for the benefit of its employees who are at least 21 years of age, and who have two years of employment with the Bank in which the employee has completed at least 1,000 hours of service. Participants are 100% vested in their accounts upon entering the plan. The Bank will make contributions each year under the plan in an amount equal to 5.4% of each participant’s total taxable compensation, up to a maximum limit of $245,000 (as indexed), plus 5.4% of such compensation in excess of 80% of the Social Security Taxable Wage Base plus $1.00. Amounts contributed to the plan are not taxable to participants until such amounts are withdrawn from the plan. Participants will be entitled to receive a benefit under the plan if they have an account balance in the plan upon termination of employment due to normal or early retirement, death, disability or other separation from service. Participants who are married when benefits begin will generally receive payments in the form of a joint and 50% survivor’s annuity, and unmarried participants will generally receive benefits in the form of a life annuity, unless an alternative form of payment is elected by the participant. In the event a participant dies while employed by the Bank, 100% of the participant’s account balance will be used to provide such participant’s beneficiary with a death benefit. For a married participant, the participant’s spouse will be the beneficiary of at least 50% of the death benefit, unless the participant’s spouse consents in writing to an alternative beneficiary designation. Benefits upon a participant’s death are generally paid in the form of an annuity, unless an alternative distribution form is timely selected by the participant. The plan was frozen on October 31, 2009, such that no further contributions were made after that date. The Money Purchase Plan was merged into the 401(k) plan.
Split Dollar Death Benefits. In November, 1994, the Bank adopted a collateral assignment split dollar agreement with Mr. Kielty. As noted above, Mr. Kielty resigned as President and Chief Executive Officer of the Company, the Bank, and BFS Bancorp, MHC, effective May 23, 2011. Under the Split Dollar Agreements, Mr. Kielty owns the life insurance policy on his life and the Bank pays the premiums with an assignment by Mr. Kielty to the Bank of the policy proceeds payable at death sufficient to repay all of the premium payments that the Bank has made on behalf of Mr. Kielty. At September 30, 2010, the aggregate net premiums paid by the Bank for the policies of Mr. Kielty were $495,154. Upon Mr. Kielty’s death, the Bank will recover from the death benefit under the policy an amount sufficient to cover its net premium outlay. Any residual death benefit amounts shall be paid to the beneficiary(ies) designated by Mr. Kielty. If the policy is cancelled for any reason during Mr. Kielty’s lifetime, only the portion of the cash surrender value equal to the Bank’s net premium outlay shall be repaid to the Bank, and any excess shall be paid to Mr. Kielty.
112
The Sarbanes-Oxley Act of 2002 generally prohibits a direct or indirect extension of credit from a publicly traded company or its subsidiary to any of its directors or executive officers, but it contains a specific exemption from such prohibition for loans made by a financial institution to its executive officers and directors that are in compliance with federal banking regulations. The Sarbanes-Oxley Act provides that an extension of credit maintained on the date of enactment of the Sarbanes-Oxley Act will be “grandfathered” and will not be subject to Section 402, so long as there is no material modification to any term of any such extension of credit. The ongoing payment of premiums by the Bank, which are repaid to the Bank from the proceeds of the policy on the death of Mr. Kielty as set forth in the policy, may be considered a loan for purposes of the Sarbanes-Oxley Act. However, the split dollar agreements does not permit the Bank to unilaterally discontinue the payment of premiums on the policies. On the basis of these facts, the Company believes that to the extent that the split dollar arrangement may be considered a loan, the arrangement is grandfathered under the Sarbanes-Oxley Act and is not prohibited.
Supplemental Executive Retirement Plan. In April, 1999, the Bank established a non-qualified supplemental executive retirement plan for Mr. Kielty. As noted above, Mr. Kielty resigned as President and Chief Executive Officer of the Company, the Bank, and BFS Bancorp, MHC, effective May 23, 2011. The 1999 plan was amended and restated in 2005 in order to conform the plan with changes in the tax laws and for certain other purposes, and was subsequently amended and restated effective as of December 1, 2007, in order to conform to changes in the tax laws under Code Section 409A and the regulations issued thereunder. The 2007 supplemental executive retirement plan provides Mr. Kielty with a supplemental retirement benefit following his retirement on or after age 65 equal to (a) 60% times the highest of his average annual compensation in any consecutive 36-month period during the 10 years prior to retirement, reduced by (b) the sum of (i) the annuitized value of his benefits under the Bank’s Money Purchase Pension Plan payable as a single life annuity with 240 payments guaranteed; (ii) the annuitized value of his benefit commencing at normal retirement, attributable to Bank contributions to the Bank’s 401(k) Plan payable as a single life annuity with 240 payments guaranteed; and (iii) the annuitized value of one-half of his annual Social Security retirement benefit commencing at normal retirement. Benefits under the supplemental executive retirement plan commence on the first day of the month following retirement from the Bank or the first day of the seventh month following termination of employment if required under the tax laws, and shall be payable for the longer of Mr. Kielty’s life or 240 months. Alternatively, Mr. Kielty may elect to receive his benefit in a single lump sum payment or in installment payments over a period of up to 10 years. Mr. Kielty’s plan provides for a reduced benefit in the event he becomes disabled or a change in control occurs prior to his 65th birthday. If Mr. Kielty terminates employment prior to normal retirement for a reason other than death, disability or a change in control, he will be entitled to the accrued benefit under the supplemental executive retirement plan as reflected on the financial statements of the Bank, annuitized and paid in installments over a 20-year period, or in a lump sum payment or in installments over a period of up to 10 years if elected by Mr. Kielty in compliance with the tax laws. Upon his resignation, Mr. Kielty became entitled to $926,282.33. The supplemental executive retirement plan for Mr. Kielty is considered an unfunded plan for tax and Employee Retirement Income Security Act purposes. All obligations owing under the plan are payable from the general assets of the Bank, and are subject to the claims of the Bank’s creditors. During the year ended September 30, 2010, the expense of the supplemental executive retirement plan to the Bank was approximately $236,323.
Employee Stock Ownership Plan and Trust. The Bank sponsors the Brooklyn Federal Savings Bank Employee Stock Ownership Plan for the benefit of its employees. Employees who are at least 21 years old with at least two years of service during which the employee has completed at least 1,000 hours of service with the Bank are eligible to participate. As part of Brooklyn Federal Savings Bank’s 2005 reorganization and stock offering, the employee stock ownership plan trust borrowed funds from the Company and used those funds to purchase a number of shares equal to 8% of the common stock sold in the offering (317,400 shares). Collateral for the loan is the common stock purchased by the employee stock ownership plan. The loan will be repaid principally from the Bank’s discretionary contributions to the employee stock ownership plan over a period of up to 20 years. The loan documents provide that the loan may be repaid over a shorter period, without penalty for prepayments. Shares purchased by the employee stock ownership plan will be held in a suspense account for allocation among participants as the loan is repaid.
113
Contributions to the employee stock ownership plan and shares released from the suspense account in an amount proportional to the repayment of the employee stock ownership plan loan will be allocated among employee stock ownership plan participants on the basis of compensation in the year of allocation. Participants will be 100% vested in benefits under the plan upon completion of two years of credited service, with credit given to participants for years of credited service with the Bank’s mutual predecessor. A participant’s interest in his account under the plan will also fully vest in the event of termination of service due to a participant’s early or normal retirement, death, disability, or upon a change in control (as defined in the plan). Vested benefits will be payable in the form of common stock and/or cash. The Bank’s contributions to the employee stock ownership plan are discretionary, subject to the loan terms and tax law limits. Therefore, benefits payable under the employee stock ownership plan cannot be estimated. Pursuant to SOP 93-6, we are required to record compensation expense each year in an amount equal to the fair market value of the shares released or committed to be released from the suspense account. In the event of a change in control, the employee stock ownership plan will terminate and participants will become fully vested in their account balances.
401(k) Plan. The Bank also sponsors the Brooklyn Federal Savings 401(k) Savings Plan, which provides for participant elective deferrals up to the limits set under the Code. Participants are fully vested at all times in their elective deferrals. The 401(k) plan does not provide for a Company matching contribution. Effective October 31, 2009, the Bank’s Money Purchase Pension Plan was frozen and its assets were transferred into the 401(k) Plan.
Stock-Based Incentive Plan. The Company has adopted the Brooklyn Federal Bancorp, Inc. 2006 Stock-Based Incentive Plan (the “Incentive Plan”), to provide officers, employees and directors of the Company, and Brooklyn Federal Savings Bank with additional incentives to promote the growth and performance of the Company. Stockholders approved the Incentive Plan on April 11, 2006. Under this plan, individuals may receive awards of common stock and grants of options to purchase common stock. The Compensation Committee of the Company’s Board of Directors believes that stock ownership provides a significant incentive in building stockholder value by further aligning the interests of officers and employees with stockholders. The importance of this component of compensation increases as the Company’s common stock appreciates in value. In addition, stock option grants and stock awards vest over seven and five years, respectively, thereby providing an additional retention incentive.
The Incentive Plan authorizes the issuance of up to 907,235 shares of Company common stock pursuant to grants of incentive and non-statutory stock options, stock appreciation rights, and restricted stock awards. No more than 259,210 shares may be issued as restricted stock awards, and no more than 648,025 shares may be issued pursuant to the exercise of stock options; provided, however, that subject to Office of Thrift Supervision approval, and without increasing the number of shares available for award under the Incentive Plan (907,235), the maximum number of shares of the Company’s common stock that may be awarded as restricted stock awards may be increased by up to 100,000 shares in the event shares that underlie or are subject to awards for stock options become available for future awards as a result of forfeiture, cancellation or any other reason pursuant to Section 5(c) of the Incentive Plan.
Employees and outside directors of the Company or its subsidiaries are eligible to receive awards under the Incentive Plan.
114
Awards may be granted in a combination of incentive and non-statutory stock options, stock appreciation rights or restricted stock awards as follows.
(i) Stock Options. A stock option gives the recipient or “optionee” the right to purchase shares of common stock at a specified price for a specified period of time. The exercise price may not be less than the fair market value on the date the stock option is granted. Fair market value for purposes of the Incentive Plan means the final sales price of the Company’s common stock as reported on the NASDAQ Stock Market on the date the option is granted, or if the Company’s common stock was not traded on such date, then on the day prior to such date or on the next preceding day on which the Company’s common stock was traded, and without regard to after-hours trading activity. However, if the Company’s common stock is not reported on the NASDAQ Stock Market (or over-the-counter market), fair market value will mean the average sale price of all shares of Company common stock sold during the 30-day period immediately preceding the date on which such stock option was granted, and if no shares of stock have been sold within such 30-day period, the average sale price of the last three sales of Company common stock sold during the 90-day period immediately preceding the date on which such stock option was granted. The Committee will determine the fair market value if it cannot be determined in the manner described above. Stock options are either “incentive” stock options or “non-qualified” stock options. Incentive stock options have certain tax advantages and must comply with the requirements of Section 422 of the Internal Revenue Code. Only employees are eligible to receive incentive stock options. Shares of common stock purchased upon the exercise of a stock option must be paid for in full at the time of exercise (i) either in cash or with stock of the Company which was owned by the participant for at least six months prior to delivery, or (ii) by reduction in the number of shares deliverable pursuant to the stock option, or (iii) subject to a “cashless exercise” through a third party. Cash may be paid in lieu of any fractional shares under the Incentive Plan and generally no fewer than 100 shares may be purchased on exercise of an award unless the total number of shares available for purchase or exercise pursuant to an award is less than 100 shares. Stock options are subject to vesting conditions and restrictions as determined by the Committee.
(ii) Stock Appreciation Rights. Stock appreciation rights give the recipient the right to receive a payment in Company common stock of an amount equal to the excess of the fair market value of a specified number of shares of Company common stock on the date of the exercise of the stock appreciation rights over the fair market value of the common stock on the date of grant of the stock appreciation right, as set forth in the recipient’s award agreement. Stock appreciation rights will not be granted unless (i) the stock appreciation right is settled solely in Company common stock; and (ii) there is no further ability to defer the income received on the exercise of the stock appreciation right.
(iii) Stock Awards. Stock awards under the Incentive Plan will be granted only in whole shares of common stock. Stock awards will be subject to conditions established by the Committee which are set forth in the award agreement. Any stock award granted under the Incentive Plan will be subject to vesting as determined by the Committee. Awards will be evidenced by agreements approved by the Committee, which set forth the terms and conditions of each award.
Generally, all awards, except non-statutory stock options, granted under the Incentive Plan will be non-transferable except by will or in accordance with the laws of intestate succession. Stock awards may be transferable pursuant to a qualified domestic relations order. At the Committee’s sole discretion, non-statutory stock options may be transferred for valid estate planning purposes that are permitted by the Code and the Exchange Act. During the life of the participant, awards can only be exercised by him or her. The Committee may permit a participant to designate a beneficiary to exercise or receive any rights that may exist under the Incentive Plan upon the participant’s death. Upon the occurrence of an event constituting a change in control of the Company as defined in the Incentive Plan, all stock options will become fully vested, and all stock awards then outstanding will vest free of restrictions.
115
Outstanding Equity Awards at September 30, 2010
The following table sets forth information with respect to our outstanding equity awards as of September 30, 2010 for our named executive officers.
|
Outstanding Equity Awards at Fiscal Year End
|
||||||||||||||||||||||
|
Option Awards
|
Stock Awards
|
|||||||||||||||||||||
|
Name
|
Grant Date
|
Number of
securities
underlying
exercisable
options (#)
|
Number of
securities
underlying
unexercisable
options (#)(1)
|
Option
exercise price
($)
|
Option
expiration
date
|
Number of
shares or units
of stock that
have not
vested ($)(2)
|
|
Market
value of
shares or
units of
stock that
have
not vested
($)
|
|
|||||||||||||
|
Richard A. Kielty,
Former President and
|
1/6/2007
|
80,000
|
—
|
13.30
|
1/16/2017
|
—
|
—
|
|||||||||||||||
|
Chief Executive
Officer
|
8/21/2007
|
12,000
|
—
|
13.74
|
8/21/2017
|
—
|
—
|
|||||||||||||||
|
Marc Leno, Former Senior
|
1/16/2007
|
65,000
|
27,857
|
13.30
|
1/16/2017
|
5,600
|
10,080
|
(3)
|
||||||||||||||
|
Vice President and
|
6/19/2007
|
—
|
—
|
—
|
—
|
800
|
440
|
(3)
|
||||||||||||||
|
Chief Lending Officer
|
8/21/2007
|
11,000
|
6,286
|
13.74
|
8/21/2017
|
—
|
—
|
|||||||||||||||
|
Michael A. Trinidad, Vice
|
—
|
—
|
—
|
—
|
||||||||||||||||||
|
President and Chief
|
||||||||||||||||||||||
|
Financial Officer
|
||||||||||||||||||||||
|
(1)
|
Stock options vest ratably on each of the first seven anniversaries of grant.
|
|
(2)
|
Restricted stock awards vest ratably on each of the first five anniversaries of grant.
|
|
(3)
|
Represents market value based on the closing market price of the Company’s common stock of $1.80 on September 30, 2010.
|
116
Options Exercised and Stock Vested. The following table sets forth information with respect to option exercises and common stock awards that have vested during the year ended September 30, 2010.
|
Option Exercises and Stock Vested for the 2010 Fiscal Year
|
|||||||||||||
| Option awards |
|
Stock awards
|
|||||||||||
|
Name
|
Number of
shares
acquired
on exercise (#)
|
|
Value realized on
exercise ($)
|
|
Number of shares
acquired
on vesting (#)
|
|
Value realized on
vesting ($) (1)
|
|
|||||
|
Richard A. Kielty, Former President and Chief Executive Officer
|
—
|
—
|
—
|
—
|
|||||||||
|
Marc Leno, Former Senior Vice President and Chief
|
—
|
—
|
5,200
|
46,176
|
(2)
|
||||||||
|
Lending Officer
|
—
|
—
|
400
|
1,816
|
(3)
|
||||||||
|
Michael A. Trinidad, Senior Vice President and
|
—
|
—
|
—
|
—
|
|||||||||
|
Chief Financial Officer
|
—
|
—
|
—
|
—
|
|||||||||
|
(1)
|
The value realized on vesting represents the market value on the day the stock is vested.
|
|
(2)
|
The market value on the day of vesting was $8.88.
|
(3) The market value on the day of vesting was $4.54.
Director Compensation for the 2010 Fiscal Year
Director Fees. The Bank pays each non-employee director a monthly fee of $2,625, a board attendance fee of $590.00 for each board meeting attended and a committee attendance fee of $780.00 for each committee meeting attended. The Company pays a quarterly fee of $5,620.00 to each non-employee director. The Bank subsidiary, BFS REIT, Inc., pays non-employee and employee directors a monthly board attendance fee of $660.00. The Bank subsidiary, Thrift Investors Service Corp., pays each of two non-employee directors an annual meeting attendance fee of $150.00. The consolidated Company paid fees in cash totaling $530,890 to directors for the fiscal year ended September 30, 2010.
The following table sets forth information regarding compensation earned by the non-employee directors of the Company during the last fiscal year.
|
Name
|
Fees
earned
or paid in
cash ($)
|
Option
Awards
($)
|
|
All Other
Compensation
($)
|
|
Total ($)
|
||||||
|
John A. Loconsolo(1)
|
91,166
|
—
|
—
|
91,166
|
||||||||
|
Daniel O. Reich
|
107,172
|
—
|
—
|
107,172
|
||||||||
|
John C. Gallin(2)
|
91,502
|
—
|
—
|
91,502
|
||||||||
|
Arthur R. Williams
|
87,768
|
—
|
—
|
87,768
|
||||||||
|
Angelo J. Di Lorenzo
|
98,972
|
—
|
—
|
98,972
|
||||||||
|
Rebecca Northey
|
26,367
|
—
|
—
|
26,367
|
117
|
(1)
|
Mr. Loconsolo resigned as a member of the Boards of Directors of the Company, Bank and BFS Bancorp, MHC on April 7, 2011.
|
|
(2)
|
Mr. Gallin resigned as a member of the Boards of Directors of the Company and the Bank effective January 21, 2011.
|
Compensation Committee Interlocks and Insider Participation
The Compensation Committee is composed entirely of independent directors. None of these directors had any transactions or relationships with the Company in 2010 requiring specific disclosures under SEC requirements.
Item 12. Security Ownership of Certain Beneficial Owners and Management and Related Stockholder Matters
Set forth below is information, as of September 30, 2010, regarding equity compensation plans categorized by those plans that have been approved by stockholders. At September 30, 2010, there were no plans that have not been approved by stockholders.
|
Number of
|
||||||||
|
Number of
|
Securities
|
|||||||
|
Securities to be
|
Weighted |
Remaining
|
||||||
|
Issued Upon
|
Average |
Available For
|
||||||
|
Exercise of
|
Exercise Price |
Future
|
||||||
|
Outstanding
|
of Outstanding |
Issuance Under
|
||||||
|
Options,
|
Options, |
Equity
|
||||||
|
Warrants and
|
Warrants and |
Compensation
|
||||||
|
Plan
|
Rights (1)
|
Rights (2) |
Plans (3)
|
|||||
|
Equity compensation plans approved by stockholders
|
587,025
|
$ | 13.37 |
61,000
|
||||
|
Total
|
587,025
|
$ | 13.37 |
61,000
|
||||
|
(1)
|
Consists of options to purchase 648,025 shares of common stock under the Brooklyn Federal Bancorp, Inc. 2006 Stock-Based Incentive Plan.
|
|
(2)
|
The weighted average exercise price reflects the weighted average exercise price of stock options awarded from the Brooklyn Federal Bancorp, Inc. 2006 Stock-Based Incentive Plan.
|
|
(3)
|
Consists of stock options for 61,000 shares of common stock available to be granted from the Brooklyn Federal Bancorp, Inc. 2006 Stock-Based Incentive Plan.
|
Security Ownership of Certain Beneficial Owners and Management
Principal Stockholders of the Company:
Persons and groups who beneficially own in excess of 5% of the Company’s common stock are required to file certain reports with the SEC regarding such ownership. The following table sets forth, as of June 20, 2011, the shares of common stock beneficially owned by each person who was the beneficial owner of more than 5% of the Company’s outstanding shares of common stock, and all directors and executive officers of the Company as a group.
|
Title of Class
|
Name and Address of
Beneficial Owners
|
Amount of
Shares
Owned and
Nature
of Beneficial
Ownership (1)
|
Percent of
Shares
of Common
Stock
Outstanding(2)
|
|||||||
|
Common Stock, $.01 par value
|
BFS Bancorp, MHC
81 Court Street
Brooklyn, New York 11201
|
9,257,500 | 71.82 | % | ||||||
|
Common Stock, $.01 par value
|
BFS Bancorp, MHC (2)
and all Directors and Executive Officers as a group (9 persons)
|
9,896,529 | 76.78 | % | ||||||
118
|
(1)
|
For purposes of this table, a person is deemed to be the beneficial owner of shares of common stock if he or she has shared voting or investment power with respect to such security, or has a right to acquire beneficial ownership at any time within 60 days from June 20, 2011. As used herein, “voting power” is the power to vote or direct the voting of shares, and “investment power” is the power to dispose of or direct the disposition of shares. The table includes all shares held directly as well as by spouses and minor children, in trust and other indirect ownership, over which shares the named individuals effectively exercise sole or shared voting and investment power.
|
||||||
|
(2)
|
Percentages with respect to each person or group of persons have been calculated based upon 12,882,607 shares of the Company’s common stock outstanding as of June 20, 2011.
|
||||||
|
(3)
|
The Company’s executive officers and directors are also executive officers and directors of BFS Bancorp, MHC. Excluding shares held by BFS Bancorp, MHC, the Company’s executive officers and directors owned an aggregate of 639,029 shares, or 4.96 % of the outstanding shares. Includes shares owned by John C. Gallin, who retired as a member of the Boards of Directors of the Company and the Bank effective February 15, 2011.
|
||||||
Security Ownership of Management:
The following table sets forth information with respect to the shares of our common stock beneficially owned by each current director, by each named executive officer of the Company identified in the Summary Compensation Table included in Part III, Item 11 above, and all directors and executive officers of the Company or the Bank, as a group as of June 20, 2011. The percent of common stock outstanding for each person identified below was based on a total of 12,882,607 shares of our common stock as of June 20, 2011, plus shares of Company common stock that such person or group has the right to acquire within 60 days after June 20, 2011, by the exercise of stock options. Except as otherwise indicated, each person and each group shown in the table has sole voting and investment power with respect to the shares of Company common stock listed next to their name.
|
Title of Class
|
Name and Title of
Beneficial Owner(1)
|
Amount and
Nature
of Beneficial
Ownership (1)
|
Percent of
Shares
of Common
Stock
Outstanding(2)
|
|||||||
|
Common Stock, $.01 par value
|
Daniel O. Reich, Chairman of the Board
|
47,546 | .37 | |||||||
|
Common Stock, $.01 par value
|
Rebecca Northey, Director
|
0 | 0 | |||||||
|
Common Stock, $.01 par value
|
Angelo J. Di Lorenzo, Director
|
183,982 | (3) | 1.43 | ||||||
|
Common Stock, $.01 par value
|
Arthur R. Williams, Director
|
200 | * | |||||||
|
Common Stock, $.01 par value
|
Mark Hughes, Director
|
0 | 0 | |||||||
|
Common Stock, $.01 par value
|
Richard A. Kielty, Director
|
123,656 | (3) | .96 | ||||||
|
Common Stock, $.01 par value
|
Gregg J. Wagner, Director, President and Chief Executive Officer
|
0 | 0 | |||||||
|
Common Stock, $.01 par value
|
Michael A. Trinidad, Senior Vice President and Chief Financial Officer
|
0 | 0 | |||||||
|
Common Stock, $.01 par value
|
Joanne Gallo, Senior Vice President and Chief Credit Officer
|
0 | 0 | |||||||
|
All Current Directors and Executive Officers as a Group (9 Persons)
|
355,384 | 2.76 | ||||||||
119
|
(1)
|
The mailing address for each person listed is 81 Court Street, Brooklyn, New York 11201. Each of the persons listed is also a director of BFS Bancorp, MHC, which owns the majority of the Company’s issued and outstanding shares of common stock.
|
||||||
|
(2)
|
Percentages with respect to each person or group of persons have been calculated based upon 12,882,607 shares of the Company’s common stock outstanding as of June 20, 2011.
|
||||||
|
(3)
|
Includes 6,434 shares of common stock allocated to the account of Director Di Lorenzo under Brooklyn Federal Savings Bank’s ESOP. Under the terms of the ESOP, shares of common stock allocated to the accounts of employees are voted in accordance with the instructions of the respective employees. Unallocated shares are voted by the ESOP trustee in the manner calculated to most accurately reflect the instructions it has received from the participants regarding the allocated shares, unless its fiduciary duties require otherwise.
|
||||||
Item 13. Certain Relationships and Related Transactions and Director Independence
Transactions with Certain Related Persons
Federal law and regulations generally require that all loans or extensions of credit to executive officers and directors must be made on substantially the same terms, including interest rates and collateral, as those prevailing at the time for comparable transactions with the general public and must not involve more than the normal risk of repayment or present other unfavorable features. However, applicable regulations permit executive officers and directors to receive the same terms through loan programs that are widely available to other employees, as long as the director or executive officer is not given preferential treatment compared to the other participating employees. Brooklyn Federal Savings Bank makes loans to its directors, officers and employees on the same rates and terms it offers to the general public.
Section 402 of the Sarbanes-Oxley Act of 2002 generally prohibits an issuer from: (1) extending or maintaining credit; (2) arranging for the extension of credit; or (3) renewing an extension of credit in the form of a personal loan for an officer or director, except for certain types of loans provided such loan is made or provided in the ordinary course of the consumer credit business of such issuer, of a type that is generally made available by such issuer to the public, and made by such issuer on market terms, or terms that are no more favorable than those offered by the issuer to the general public for such extensions of credit. Sarbanes-Oxley does not apply to loans made by a depository institution that is insured by the FDIC and is subject to the insider lending restrictions of the Federal Reserve Act. All loans extended by the Bank to the Company’s directors and officers are made in conformity with the Federal Reserve Act and Regulation O. The aggregate amount of our loans to our officers and directors and their related entities was $85,236 at September 30, 2010. These loans were performing according to its original terms at September 30, 2010.
120
Board Independence
The Board of Directors has determined that, except for Messrs. Di Lorenzo, Kielty and Wagner, each member of the Board is an “independent director” within the meaning of the NASDAQ corporate governance listing standards. Mr. Wagner is not considered independent because he is an executive officer of the Company and Mr. Di Lorenzo and Mr. Kielty are not considered independent because they were executive officers of the Company. Mr. Di Lorenzo will continue to serve as a member of the Company’s Nominating Committee pursuant to the “controlled company” exception to the independence requirements under the NASDAQ corporate governance standards. The Board of Directors also determined that, except for Messrs. Di Lorenzo and Kielty, each member of the Board serving during fiscal year 2010 was an “independent director” under such standard.
Item 14. Principal Accounting Fees and Services
Audit Fees. The aggregate fees billed to the Company by Crowe Horwath, Grant Thornton and ParenteBeard for professional services rendered for the audit of the Company’s annual financial statements, review of the financial statements included in the Company’s Quarterly Reports on Form 10-Q and services that are normally provided by Crowe Horwath, Grant Thornton and ParenteBeard in connection with statutory and regulatory filings and engagements were $327,877, $160,760 and $109,000 for the fiscal years ended September 30, 2010 and 2009, respectively.
Audit Related Fees. There were no fees billed to the Company by Crowe Horwath, Grant Thornton and ParenteBeard in fiscal 2010 or fiscal 2009 for assurance and related services reasonably related to the performance of the audit of and review of the financial statements that are not already reported in “Audit Fees” above.
Tax Fees. No fees were billed to the Company by Crowe Horwath, Grant Thornton or ParenteBeard during the fiscal years ended September 30, 2010 and 2009 for federal, state and city tax compliance services.
All Other Fees. No other fees were billed to the Company by Crowe Horwath, Grant Thornton or ParenteBeard during the fiscal years ended September 30, 2010 and 2009. The full Audit Committee pre-approves all audit and non-audit services to be performed by the independent registered public accounting firm and the related fees.
Policy on Audit Committee Pre-Approval of Audit and Non-Audit Services of Independent Auditor
The Audit Committee’s policy is to pre-approve all audit and non-audit services provided by the Company’s independent registered public accounting firm. These services may include audit services, audit-related services, tax services and other services. Pre-approval is generally provided for up to one year and any pre-approval is detailed as to a particular service or category of services and is generally subject to a specific budget. The Audit Committee has delegated pre-approval authority to its Chairman when expedition of services is necessary. The independent registered public accounting firm and management are required to periodically report to the full Audit Committee regarding the extent of services provided by the independent registered public accounting firm in accordance with this pre-approval, and the fees for the services performed to date. .
PART IV.
Item 15. Exhibits and Financial Statement Schedules
The exhibits and financial statement schedules filed as a part of this Form 10-K is as follows:
(a)(1) Financial Statements
|
|
●
|
Reports of Independent Registered Public Accounting Firms
|
|
|
●
|
Consolidated Statements of Financial Condition, September 30, 2010 and 2009
|
|
|
●
|
Consolidated Statements of Operations, Years Ended September 30, 2010 and 2009
|
|
|
●
|
Consolidated Statements of Changes in Stockholders’ Equity, Years Ended September 30, 2010 and 2009
|
121
|
|
●
|
Consolidated Statements of Cash Flows, Years Ended September 30, 2010 and 2009
|
|
|
●
|
Notes to Consolidated Financial Statements
|
(a)(2) Financial Statement Schedules
No financial statement schedules are filed because the required information is not applicable or is included in the consolidated financial statements or related notes.
(a)(3) Exhibits
3.1 Certificate of Incorporation of Brooklyn Federal Bancorp, Inc.*
3.2 Amended and Restated Bylaws of Brooklyn Federal Bancorp, Inc.**
|
|
4.1
|
Form of Common Stock Certificate of Brooklyn Federal Bancorp, Inc. *
|
|
|
10.1
|
Cease and Desist by and between Brooklyn Savings Bank and the OTS******
|
|
|
10.2
|
Cease and Desist by and between BFS Bancorp, MHC, Brooklyn Federal Bancorp, Inc. and the OTS******
|
|
|
10.3
|
Amended and Restated Employment Agreement by and between Brooklyn Federal Bancorp, Inc., Brooklyn Federal Savings Bank and Richard A. Kielty***
|
|
|
10.4
|
Amended and Restated Executive Supplemental Retirement Income Agreement between Brooklyn Federal Savings Bank and Richard A. Kielty****
|
|
|
10.5
|
Amendment to the Split Dollar Insurance Agreement between Brooklyn Federal Savings Bank and Richard A. Kielty****
|
|
|
10.6
|
Brooklyn Federal Bancorp, Inc. 2006 Stock-Based Incentive Plan*****
|
|
|
21
|
Subsidiaries of the Registrant*
|
|
|
23.1
|
Consent of Crowe Horwath LLP
|
|
|
23.2
|
Consent of Parente Beard LLC********
|
|
|
31.1
|
Certification of Chief Executive Officer pursuant to Section 302 of the Sarbanes-Oxley Act of 2002
|
|
|
31.2
|
Certification of Chief Financial Officer pursuant to Section 302 of the Sarbanes-Oxley Act of 2002
|
|
|
32.1
|
Certification of Chief Executive Officer pursuant to Section 906 of the Sarbanes-Oxley Act of 2002
|
|
|
32.2
|
Certification of Chief Financial Officer pursuant to Section 906 of the Sarbanes-Oxley Act of 2002
|
122
|
|
99.1
|
Form of Non-Renewal Notice of Employment Agreement by and between the Bank, the Company, and each of Richard A. Kielty, Marilyn Alberici, Marc Leno and Ralph Walther, dated November 28, 2009.*******
|
|
*
|
Filed as exhibits to the Company’s Registration Statement on Form S-1, and any amendments thereto, with the SEC (Registration No. 333-121580).
|
| ** |
Filed as exhibit to the Company’s Current Report on Form 8-K filed January 6, 2010.
|
|
***
|
Filed as exhibits to the Company’s Current Report on Form 8-K filed on December 20, 2007.
|
|
****
|
Filed as exhibits to the Company’s Current Report on Form 8-K filed on December 6, 2007.
|
|
*****
|
Filed as Appendix B in the Company’s Definitive Proxy Statement filed with the SEC on March 7, 2006.
|
|
******
|
Filed as exhibits to the Company’s Current Report on Form 8-K filed with the SEC on April 1, 2011. |
|
*******
|
Filed as an exhibit to the Company’s Annual Report of Form 10-K filed on January 6, 2010. |
123
SIGNATURES
Pursuant to the requirements of Section 13 or 15(d) of the Securities Exchange Act of 1934, the registrant has duly caused this report to be signed on its behalf by the undersigned, thereunto duly authorized.
|
BROOKLYN FEDERAL BANCORP, INC.
|
|||
| By: | /s/ Gregg J. Wagner | ||
|
Gregg J. Wagner
President and Chief Executive Officer
(Duly Authorized Representative)
|
|||
| Signatures | Title | Date | ||
|
/s/ Gregg J. Wagner
|
President, Chief Executive Officer and Director
|
June 27, 2011
|
||
| Gregg J. Wagner | ||||
|
/s/ Michael Trinidad
|
Senior Vice President and Chief Financial Officer (Principal Financial and Accounting Officer)
|
June 27, 2011
|
||
|
Michael Trinidad
|
||||
|
/s/ Daniel O. Reich
|
Chairman
|
June 27, 2011
|
||
| Daniel O. Reich | ||||
|
/s/ Angelo J. Di Lorenzo
|
Vice Chairman
|
June 27, 2011
|
||
| Angelo J. Di Lorenzo | ||||
|
/s/ Mark Hughes
|
Director
|
June 27, 2011
|
||
| Mark Hughes | ||||
|
/s/ Arthur R. Williams
|
Director
|
June 27, 2011
|
||
| Arthur R. Williams | ||||
|
/s/ Rebecca Northey
|
Director
|
June 27, 2011
|
||
| Rebecca Northey | ||||
|
/s/ Richard A. Kielty
|
Director
|
June 27, 2011
|
||
| Richard A. Kielty |
124
EXHIBIT INDEX
|
|
3.1
|
Certificate of Incorporation of Brooklyn Federal Bancorp, Inc.*
|
|
|
3.2
|
Amended and Restated Bylaws of Brooklyn Federal Bancorp, Inc.**
|
|
|
4.2
|
Form of Common Stock Certificate of Brooklyn Federal Bancorp, Inc. *
|
|
|
10.1
|
Cease and Desist by and between Brooklyn Savings Bank and the OTS******
|
|
|
10.2
|
Cease and Desist by and between BFS Bancorp, MHC, Brooklyn Federal Bancorp, Inc. and the OTS******
|
|
|
10.3
|
Amended and Restated Employment Agreement by and between Brooklyn Federal Bancorp, Inc., Brooklyn Federal Savings Bank and Richard A. Kielty***
|
|
|
10.4
|
Amended and Restated Executive Supplemental Retirement Income Agreement between Brooklyn Federal Savings Bank and Richard A. Kielty****
|
|
|
10.5
|
Amendment to the Split Dollar Insurance Agreement between Brooklyn Federal Savings Bank and Richard A. Kielty****
|
|
|
10.6
|
Brooklyn Federal Bancorp, Inc. 2006 Stock-Based Incentive Plan*****
|
|
|
21
|
Subsidiaries of the Registrant*
|
|
|
23.1
|
Consent of Crowe Horwath LLP
|
|
|
23.2
|
Consent of Parente Beard LLC********
|
|
|
31.1
|
Certification of Chief Executive Officer pursuant to Section 302 of the Sarbanes-Oxley Act of 2002
|
|
|
31.2
|
Certification of Chief Financial Officer pursuant to Section 302 of the Sarbanes-Oxley Act of 2002
|
|
|
32.1
|
Certification of Chief Executive Officer pursuant to Section 906 of the Sarbanes-Oxley Act of 2002
|
|
|
32.2
|
Certification of Chief Financial Officer pursuant to Section 906 of the Sarbanes-Oxley Act of 2002
|
|
|
99.1
|
Form of Non-Renewal Notice of Employment Agreement by and between the Bank, the Company, and each of Richard A. Kielty, Marilyn Alberici, Marc Leno and Ralph Walther, dated November 28, 2009.*******
|
|
*
|
Filed as exhibits to the Company’s Registration Statement on Form S-1, and any amendments thereto, with the SEC (Registration No. 333-121580).
|
|
**
|
Filed as exhibit to the Company’s Current Report on Form 8-K filed January 6, 2010.
|
|
***
|
Filed as exhibits to the Company’s Current Report on Form 8-K filed on December 20, 2007.
|
|
****
|
Filed as exhibits to the Company’s Current Report on Form 8-K filed on December 6, 2007.
|
|
*****
|
Filed as exhibit to the Company’s Definitive Proxy Statement filed with the SEC on March 7, 2006.
|
****** Filed as exhibits to the Company’s Current Report on Form 8-K filed with the SEC on April 1, 2011.
******* Filed as an exhibit to the Company’s Annual Report of Form 10-K filed on January 6, 2010.
125