Attached files
UNITED STATES
SECURITIES AND EXCHANGE COMMISSION
Washington, D.C. 20549
FORM 10-K
(Mark One)
x Annual Report Pursuant to Section 13 or 15(d) of the Securities Exchange Act of 1934
For the fiscal year ended September 30, 2009; OR
o Transition Report Pursuant to Section 13 or 15(d) of the Securities Exchange Act of 1934
For the transition period from ______ to _______
Commission file Number: 000-51208
|
BROOKLYN FEDERAL BANCORP, INC. |
||
| (Exact name of registrant as specified in its charter) | ||
| Federal | 20-2659598 | |||||
| (State or other jurisdiction of incorporation or organization) | (I.R.S. Employer Identification No.) | |||||
| 81 Court Street, Brooklyn, New York | 11201 | ||||
| (Address of principal executive offices) | (Zip Code) | ||||
| (718) 855-8500 | ||
| (Registrant’s telephone number, including area code) | ||
| None | ||
| (Securities registered pursuant to Section 12(b) of the Act) | ||
| Common Stock, $.01 par value | ||
| (Securities registered pursuant to Section 12(g) of the Act) | ||
Indicate by check mark if the registrant is a well-known seasoned issuer, as defined in Rule 405 of the Securities Act.
Yes o No x
Indicate by check mark if the registrant is not required to file reports pursuant to Section 13 or Section 15(d) of the Act. Yes o No x
Indicate by check mark whether the registrant (1) has filed all reports required to be filed by Section 13 or 15(d) of the Securities Exchange Act of 1934 during the preceding 12 months (or for such shorter period that the registrant was required to file such reports), and (2) has been subject to such filing requirements for the past 90
days. Yes x No o
Indicate by check mark whether the registrant has submitted electronically and posted on its corporate Web site, if any, every Interactive Data File required to be submitted and posted pursuant to Rule 405 of Regulation S-T (§232.405 of this chapter) during the preceding 12 months (or for such shorter period that the registrant was
required to submit and post such files). Yes o No o.
Indicate by check mark if disclosure of delinquent filers pursuant to Item 405 of Regulation S-K is not contained herein, and will not be contained, to the best of the registrant’s knowledge, in definitive proxy or information statements incorporated by reference in Part III of this Form 10-K of any amendment to this Form 10-K. x
Indicate by check mark whether the registrant is a large accelerated filer, an accelerated filer, a non-accelerated filer or a smaller reporting company. See the definitions of “large accelerated filer,” “accelerated filer” and “smaller reporting company” in Rule 12b-2 of the Exchange Act.
| Large accelerated filer o | Accelerated filer o |
| Non-accelerated filer o (Do not check if a smaller reporting company) | Smaller reporting company x |
Indicate by check mark whether the registrant is a shell company. Yes o No x
The aggregate market value of the voting and non-voting common equity held by non-affiliates of the registrant, computed by reference to the price at which the common equity was last sold on the NASDAQ Stock Market as of the last business day of the registrant’s most recently completed second fiscal quarter was $34,879,242.
The number of shares outstanding of the registrant’s common stock was 12,890,754 as of December 29, 2009 (including 9,257,500 shares owned by BFS Bancorp, MHC, a federal mutual holding company).
DOCUMENTS INCORPORATED BY REFERENCE
Proxy Statement for 2010 Annual Meeting of Stockholders of the Registrant (Part III).
BROOKLYN FEDERAL BANCORP, INC.
2009 FORM 10-K
TABLE OF CONTENTS
|
Page
Number | |||
|
PART I |
|||
|
Item 1. |
Business |
1 | |
|
Item 1A. |
Risk Factors |
32 | |
|
Item 1B. |
Unresolved Staff Comments |
35 | |
|
Item 2. |
Properties |
36 | |
|
Item 3. |
Legal Proceedings |
36 | |
|
Item 4. |
Submission of Matters to a Vote of Security Holders |
36 | |
|
PART II |
|||
|
Item 5. |
Market for Registrant’s Common Equity, Related Stockholder Matters and Issuer Purchases of Equity Securities |
37 | |
|
Item 6. |
Selected Financial Data |
40 | |
|
Item 7. |
Management’s Discussion and Analysis of Financial Condition and Results of Operation |
42 | |
|
Item 7A. |
Quantitative and Qualitative Disclosures about Market Risk |
53 | |
|
Item 8. |
Financial Statements and Supplementary Data |
55 | |
|
Item 9. |
Changes in and Disagreements With Accountants on Accounting and Financial Disclosure |
99 | |
|
Item 9A.(T) |
Controls and Procedures |
99 | |
|
Item 9B. |
Other Information |
100 | |
|
PART III |
|||
|
Item 10. |
Directors, Executive Officers and Corporate Governance |
100 | |
|
Item 11. |
Executive Compensation |
101 | |
|
Item 12. |
Security Ownership of Certain Beneficial Owners and Management and Related Stockholder Matters |
101 | |
|
Item 13. |
Certain Relationships and Related Transactions, and Director Independence |
101 | |
|
Item 14. |
Principal Accounting Fees and Services |
101 | |
|
PART IV |
|||
|
Item 15. |
Exhibits, Financial Statement Schedules |
101 | |
|
SIGNATURES |
104 | ||
Certain statements contained herein are not based on historical facts and are “forward-looking statements” within the meaning of Section 27A of the Securities Act of 1933
and Section 21E of the Securities Exchange Act of 1934. Such forward-looking statements may be identified by reference to a future period or periods, or by the use of forward-looking terminology, such as “may,” “could,” “will,” “believe,” “expect,” “intend,” “should,” “potential,” “will likely result,” “are expected to,” “projected,” “estimate,” “anticipate,”
“continue,” or similar terms or variations on those terms, or the negative of those terms. Forward-looking statements are subject to numerous risks and uncertainties, including, but not limited to, those related to the economic environment, particularly in the market areas in which the Company operates and which affect the creditworthiness of borrowers; competitive products and pricing; the timing and occurrence or non-occurrence of events that may be subject to circumstances beyond our control;
the difficulty or expense of implementing successfully our new business strategy; fiscal and monetary policies of the U.S. Government; the ability of customers to repay their obligations; the adequacy of the allowance for loan losses (and position of banking regulators with respect to the adequacy of loan losses); changes in deposit flows; changes in loan delinquency rates or in our levels of non-performing assets; changes in real estate values; changes in accounting or tax principles, policies, or guidelines;
changes in legislation and regulation, particularly those affecting financial institutions, including regulatory fees and capital requirements; changes in prevailing interest rates; acquisitions and the integration of acquired businesses; credit risk management; asset-liability management; the financial and securities markets and the availability of and costs associated with sources of liquidity.
The Company wishes to caution readers not to place undue reliance on any forward-looking statements, which speak only as of the date made. The Company wishes to advise readers
that the factors listed above could affect the Company’s financial performance and could cause the Company’s actual results for future periods to differ materially from any opinions or statements expressed with respect to future periods in any current statements. The Company does not undertake and specifically declines any obligation to publicly release the result of any revisions which may be made to any forward-looking statements to reflect events or circumstances after the date of the
original statement or to reflect the occurrence of anticipated or unanticipated events.
PART I
Item 1 Business
BFS Bancorp, MHC
BFS Bancorp, MHC is the federally chartered mutual holding company parent of Brooklyn Federal Bancorp, Inc. The only business that BFS Bancorp, MHC has engaged in is the majority ownership of Brooklyn Federal Bancorp, Inc. BFS Bancorp, MHC was formed upon completion of Brooklyn Federal Savings Bank’s reorganization
into the mutual holding company structure. So long as BFS Bancorp, MHC exists, it will own a majority of the voting stock of Brooklyn Federal Bancorp, Inc.
Brooklyn Federal Bancorp, Inc.
Brooklyn Federal Bancorp, Inc. (the “Company”) was formed to serve as the stock holding company for Brooklyn Federal Savings Bank (the “Bank”) as part of the Bank’s reorganization into the mutual holding company structure. For further discussion of the Company’s formation and operations, see
the Company’s Registration Statement on Form S-1, as amended, declared effective by the Securities and Exchange Commission (the “SEC”) on February 11, 2005 (File Number 333-121580). The Company completed its initial public offering on April 5, 2005.
The Company issued 9,257,500 shares to BFS Bancorp, MHC, resulting in a total of 13,225,000 shares issued and outstanding after completion of the reorganization. At September 30, 2009, there were 12,890,754 total shares outstanding resulting in a 71.8% ownership by BFS Bancorp, MHC.
Brooklyn Federal Savings Bank
The Bank is a federally chartered savings bank headquartered in Brooklyn, New York. The Bank was originally founded in 1887. We conduct our business from our main office and four branch offices. The Bank opened its fifth full-service office in Commack, Suffolk County, New York on April 30, 2008. All
of our offices are located in New York. The telephone number at our main office is (718) 855-8500.
At September 30, 2009, we had total assets of $521.4 million, total deposits of $402.1 million and stockholders’ equity of $81.9 million. Our net income for the fiscal year ended September 30, 2009 was $1.3 million. Our principal business activity is the origination of mortgage loans secured by one- to four-family
residential real estate, multi-family real estate, commercial real estate, construction loans, land loans and, to a limited extent, a variety of consumer loans and home equity loans. The Bank offers a variety of deposit accounts, including checking, savings and certificates of deposit, and it emphasizes personal and efficient service for its customers.
Our website address is www.brooklynbank.com. Information on our website should not be considered a part of this document.
Competition
We face intense competition within our market area both in making loans and attracting deposits. The New York City metropolitan area has a high concentration of financial institutions including large money center and regional banks, community banks and credit unions. Some of our competitors offer products and services
that we currently do not offer, such as trust services and private banking. As of June 30, 2009, our market share of deposits represented 0.57%, 0.15% and 0.22% of deposits in each of Kings, Nassau and Suffolk Counties, New York, respectively.
Our competition for loans and deposits comes principally from commercial banks, savings institutions, mortgage banking firms and credit unions. We face additional competition for deposits from short-term money market funds, brokerage firms, mutual funds and insurance companies. Our primary focus is to develop and
build profitable customer relationships across all lines of business while maintaining our role as a community bank.
1
Market Area
We are part of the diverse economy of the New York City metropolitan area. Brooklyn (Kings County) is an urban market area while Nassau and Suffolk Counties are suburban. Our market area has a stable population and household base. In 2008, the median household income for Kings, Nassau, and Suffolk Counties
was $43,172, $94,856 and $85,091, respectively. Our primary lending area is concentrated in Brooklyn and Nassau and Suffolk Counties, New York, although we originate loans in all five boroughs of New York City as well as Westchester County, New York. One- to four-family residential real estate in our market area is characterized by a large number of attached and semi-detached houses, including a number of two- and three-family homes and cooperative apartments. Most of our deposit
customers are residents of the greater New York metropolitan area. Our customer base consists primarily of middle-income households, and to a lesser extent, low- to moderate-income households. The median household income for Brooklyn is below the national and New York state median household incomes. In addition, the unemployment rate in Kings County is higher than in the surrounding suburbs.
Lending Activities
Although historically, our principal lending activity was the origination of first mortgage loans for the purchase or refinancing of one- to four-family residential real property, our focus has been increasingly towards the origination of multi-family, commercial real estate, construction and land loans in an effort to increase interest
income. These loans have increased from 72.9% of our total loans receivable at September 30, 2005 to 82.0% of our total loans receivable at September 30, 2009. Commercial real estate loans totaled $143.2 million, or 33.2% of our total loans receivable at September 30, 2009. One- to four-family residential real estate mortgage loans represented $77.1 million, or 17.9%, of our loans receivable at September 30, 2009. Multi-family real estate loans totaled $92.4 million,
or 21.4% of the total loans receivable at September 30, 2009. Construction loans totaled $73.3 million, or 17.0% and land loans totaled $45.0 million, or 10.4% of the total loans receivable at September 30, 2009. At September 30, 2009, we had no loans in loans held-for-sale compared to $8.6 million in loans held-for-sale at September 30, 2005. On a limited basis, we originate consumer loans. We sell most of our longer-term residential loans to the Federal Home Loan
Bank of New York and other investors, on a servicing-retained basis. We syndicate and sell participation interests in portions of our multi-family, commercial real estate and construction loans because of our legal lending limits and our internal portfolio management guidelines.
2
Loans Receivable Portfolio Composition. The following table sets forth the composition of our loan portfolio, excluding loans held-for-sale (which
declined from $135 million in 2008 to zero in 2009), by type of loan at the dates indicated.
|
At September 30, |
||||||||||||||||||||||||||||||||||||||||
|
2009 |
2008 |
2007 |
2006 |
2005 |
||||||||||||||||||||||||||||||||||||
|
Amount |
Percent |
Amount |
Percent |
Amount |
Percent |
Amount |
Percent |
Amount |
Percent |
|||||||||||||||||||||||||||||||
|
(Dollars in thousands) |
||||||||||||||||||||||||||||||||||||||||
|
Mortgage loans: |
||||||||||||||||||||||||||||||||||||||||
|
One-to four-family |
$ | 77,064 | 17.85 | % | $ | 82,144 | 33.99 | % | $ | 74,103 | 32.57 | % | $ | 56,722 | 28.87 | % | $ | 54,840 | 27.85 | % | ||||||||||||||||||||
|
Multi-family |
92,399 | 21.40 | % | 32,243 | 13.34 | % | 42,192 | 18.54 | % | 46,255 | 23.55 | % | 46,244 | 23.48 | % | |||||||||||||||||||||||||
|
Commercial real estate |
143,239 | 33.18 | % | 103,336 | 42.76 | % | 96,534 | 42.43 | % | 71,805 | 36.56 | % | 71,596 | 36.35 | % | |||||||||||||||||||||||||
|
Construction |
73,314 | 16.98 | % | 13,761 | 5.69 | % | 11,926 | 5.24 | % | 18,169 | 9.25 | % | 20,305 | 10.31 | % | |||||||||||||||||||||||||
|
Land |
45,027 | 10.43 | % | 9,288 | 3.84 | % | 1,793 | 0.79 | % | 2,924 | 1.49 | % | 3,570 | 1.81 | % | |||||||||||||||||||||||||
|
Consumer and other |
684 | 0.16 | % | 909 | 0.38 | % | 970 | 0.43 | % | 551 | 0.28 | % | 398 | 0.20 | % | |||||||||||||||||||||||||
|
Total loans receivable |
431,727 | 100.00 | % | 241,681 | 100.00 | % | 227,518 | 100.00 | % | 196,426 | 100.00 | % | 196,953 | 100.00 | % | |||||||||||||||||||||||||
|
Other items: |
||||||||||||||||||||||||||||||||||||||||
|
Unearned discounts |
(87 | ) | - | - | - | - | ||||||||||||||||||||||||||||||||||
|
Net deferred loan fees |
(1,205 | ) | (327 | ) | (245 | ) | (314 | ) | (368 | ) | ||||||||||||||||||||||||||||||
|
Allowance for loan losses |
(10,750 | ) | (2,205 | ) | (1,806 | ) | (1,757 | ) | (1,321 | ) | ||||||||||||||||||||||||||||||
|
Total loans receivable, net |
$ | 419,685 | $ | 239,149 | $ | 225,467 | $ | 194,355 | $ | 195,264 | ||||||||||||||||||||||||||||||
Due to the impact of the recent economic downturn and increased tightening in the credit markets affecting the Company’s ability to sell the loans in the held-for-sale portfolio
during fiscal year 2009, the Company transferred $200.5 million in loans held-for-sale to the loans receivable portfolio. These loan transfers occurred throughout the fiscal year ended September 30, 2009 and are reflected in the loans receivable portfolio balances as of September 30, 2009. As of September 30, 2009, the Company held no loans in the loans held-for-sale portfolio.
3
Loans Held-For-Sale Portfolio Composition. The following table sets forth the composition of our held-for-sale loan portfolio, by type of loan
at the dates indicated.
|
At September 30, |
||||||||||||||||||||||||||||||||||||||||
|
2009 |
2008 |
2007 |
2006 |
2005 |
||||||||||||||||||||||||||||||||||||
|
Amount |
Percent |
Amount |
Percent |
Amount |
Percent |
Amount |
Percent |
Amount |
Percent |
|||||||||||||||||||||||||||||||
|
(Dollars in thousands) |
||||||||||||||||||||||||||||||||||||||||
|
Mortgage loans: |
||||||||||||||||||||||||||||||||||||||||
|
One-to four-family |
$ | - | 0.00 | % | $ | 714 | 0.53 | % | $ | 314 | 0.53 | % | $ | 720 | 0.78 | % | $ | 540 | 6.28 | % | ||||||||||||||||||||
|
Multi-family |
- | 0.00 | % | 43,249 | 32.03 | % | 14,238 | 23.99 | % | 27,278 | 29.42 | % | 850 | 9.88 | % | |||||||||||||||||||||||||
|
Commercial real estate |
- | 0.00 | % | 35,664 | 26.41 | % | 10,972 | 18.49 | % | 26,871 | 28.98 | % | 6,058 | 70.42 | % | |||||||||||||||||||||||||
|
Construction |
- | 0.00 | % | 20,637 | 15.28 | % | 12,226 | 20.60 | % | 13,385 | 14.44 | % | 480 | 5.58 | % | |||||||||||||||||||||||||
|
Land |
- | 0.00 | % | 34,774 | 25.75 | % | 21,601 | 36.39 | % | 24,463 | 26.38 | % | 675 | 7.84 | % | |||||||||||||||||||||||||
|
Total loans held-for-sale |
- | 0.00 | % | 135,038 | 100.00 | % | 59,351 | 100.00 | % | 92,717 | 100.00 | % | 8,603 | 100.00 | % | |||||||||||||||||||||||||
|
Other items: |
||||||||||||||||||||||||||||||||||||||||
|
Net deferred loan fees |
- | (867 | ) | (198 | ) | (474 | ) | - | ||||||||||||||||||||||||||||||||
|
Total loans held-for-sale, net |
$ | - | $ | 134,171 | $ | 59,153 | $ | 92,243 | $ | 8,603 | ||||||||||||||||||||||||||||||
4
Loan Portfolio Maturities. The following table summarizes the scheduled repayments of our loan portfolio at September 30, 2009. Demand
loans, loans having no stated repayment schedule or maturity, and overdraft loans are reported as being due in one year or less.
|
One-to |
Commercial |
Consumer |
||||||||||||||||||||||||||
|
Four-Family |
Multi-Family |
Real Estate |
Construction |
Land |
and other |
Total |
||||||||||||||||||||||
|
(In thousands) | ||||||||||||||||||||||||||||
|
Due During the Years |
||||||||||||||||||||||||||||
|
Ending September 30, |
||||||||||||||||||||||||||||
|
2010 |
$ | 13,359 | $ | 71,875 | $ | 73,766 | $ | 72,333 | $ | 44,404 | $ | 318 | $ | 276,055 | ||||||||||||||
|
2011 |
7,900 | 2,979 | 18,287 | 981 | 623 | 224 | 30,994 | |||||||||||||||||||||
|
2012 |
4,569 | 1,189 | 19,726 | - | - | 115 | 25,599 | |||||||||||||||||||||
|
2013 to 2014 |
8,288 | 10,743 | 28,836 | - | - | 27 | 47,894 | |||||||||||||||||||||
|
2015 to 2019 |
16,201 | 5,613 | 2,438 | - | - | - | 24,252 | |||||||||||||||||||||
|
2020 to 2024 |
8,173 | - | 142 | - | - | - | 8,315 | |||||||||||||||||||||
|
2025 and beyond |
18,574 | - | 44 | - | - | - | 18,618 | |||||||||||||||||||||
|
Total |
$ | 77,064 | $ | 92,399 | $ | 143,239 | $ | 73,314 | $ | 45,027 | $ | 684 | $ | 431,727 | ||||||||||||||
5
The following table sets forth the scheduled repayments of fixed- and adjustable-rate loans at September 30, 2009 that are contractually due after September 30, 2010.
|
Due After September 30, 2010 |
||||||||||||
|
Fixed |
Adjustable |
Total |
||||||||||
|
(In thousands) |
||||||||||||
|
One-to four-family |
$ | 55,893 | $ | 7,812 | $ | 63,705 | ||||||
|
Multi-family |
15,361 | 5,163 | 20,524 | |||||||||
|
Commercial real estate |
56,085 | 13,388 | 69,473 | |||||||||
|
Construction |
- | 981 | 981 | |||||||||
|
Land |
- | 623 | 623 | |||||||||
|
Consumer and other |
366 | - | 366 | |||||||||
|
Total loans |
$ | 127,705 | $ | 27,967 | $ | 155,672 | ||||||
Loan Originations, Sales and Repayments. Historically, we have originated one- to four-family mortgage loans pursuant to underwriting standards that generally conform
to government-sponsored agency guidelines. Loan origination activities are primarily concentrated in New York, Kings, Nassau and Suffolk Counties, New York. New loans are generated primarily from walk-in customers, customer referrals, a network of mortgage brokers, and other parties with whom we do business, and from the efforts of employees and advertising. Loan applications are underwritten and processed at our main office in Brooklyn, New York. We syndicate and sell
participation interests in portions of our multi-family, commercial real estate and construction loans because of our legal lending limits and our internal portfolio management guidelines. We generally sell longer-term, fixed rate mortgage loans and generally retain in our portfolio the majority of our adjustable rate and shorter-term, fixed rate mortgage loans.
6
The following table shows loan originations (including loans held-for-sale), sales and principal repayments for the years indicated.
|
Years Ended September 30, |
||||||||||||
|
2009 |
2008 |
2007 |
||||||||||
|
(In thousands) |
||||||||||||
|
Total gross loans at beginning of period |
$ | 376,719 | $ | 286,869 | $ | 289,143 | ||||||
|
Loans originated: |
||||||||||||
|
One- to four-family |
21,255 | 26,071 | 30,092 | |||||||||
|
Multi-family |
24,966 | 56,421 | 9,320 | |||||||||
|
Commercial real estate |
13,443 | 70,930 | 59,111 | |||||||||
|
Construction |
62,392 | 35,583 | 31,016 | |||||||||
|
Land |
9,745 | 10,892 | 11,431 | |||||||||
|
Consumer and other |
340 | 574 | 787 | |||||||||
|
Total gross loans originated |
132,141 | 200,471 | 141,757 | |||||||||
|
Loans purchased |
- | 5,848 | - | |||||||||
|
Deduct: |
||||||||||||
|
Principal repayments |
(61,696 | ) | (82,623 | ) | (73,950 | ) | ||||||
|
Sales of whole loans |
(8,476 | ) | (4,430 | ) | (2,970 | ) | ||||||
|
Sales of participation interests |
(6,961 | ) | (29,416 | ) | (67,111 | ) | ||||||
|
Net loan activity |
55,008 | 89,850 | (2,274 | ) | ||||||||
|
Total gross loans at end of period |
$ | 431,727 | $ | 376,719 | $ | 286,869 | ||||||
In loan participation transactions, we originate and fund the full loan amount and subsequently identify other lending institutions who purchase participation interests in the loan. For purposes of the table above, originations of these loans are included within our total origination activity and the subsequent sales are shown
as deductions. Participations differ from loan syndication transactions that are not transfers of financial assets for financial reporting purposes. As the manager of a loan syndication, prior to closing the loan, we identify other lenders who agree to fund portions of the total loan at closing. We record our share of the loan syndication as a loans receivable and therefore have included in the table above only those amounts within total loan originations in the above table. The
amounts funded by other syndication lenders, which are not reflected as loan originations and sales in our consolidated financial statements and therefore are excluded from the table, totaled $54.9 million, $129.7 million and $76.8 million for syndications completed during the years ended September 30, 2009, 2008 and 2007, respectively.
One- to Four-Family Residential Loans. Historically,
our primary lending activity has consisted of the origination of one- to four-family residential mortgage loans secured primarily by properties located in Kings, Nassau and Suffolk Counties, New York. At September 30, 2009, approximately $77.1 million, or 17.9% of our loans receivable consisted of one- to four-family residential loans. Our originations of one- to four-family loans decreased by $4.8 million compared to 2008. Generally, one- to four-family residential mortgage loans
are originated in amounts up to 80% of the lesser of the appraised value or purchase price of the property. Private mortgage insurance is required on loans with a loan-to-value ratio in excess of 80%. We originate and sell in the secondary market one- to four-family residential mortgage loans in excess of the 80% loan-to-value ratio without private mortgage insurance. Fixed-rate loans are originated for terms of 10, 15, 20, 25 and 30 years. At September 30, 2009, our
largest loan secured by one- to four-family real estate had a principal balance of approximately $2.6 million and our second largest loan secured by one- to four-family real estate had a principal balance of approximately $1.8 million. The loans were secured by a two-family and a one-family residence, respectively.
We also offer adjustable rate mortgage loans with one and three-year adjustment periods based on changes in a designated U.S. Treasury index and prime rate. We originated $9.3 million of adjustable rate one- to four-family residential loans during the year ended September 30, 2009 and $2.4 million during the year ended September
30, 2008. Our adjustable rate mortgage loans provide for maximum rate adjustments of 200 basis points per adjustment, with a lifetime maximum adjustment of 600 basis points. We currently do not offer adjustable rate mortgage loans with interest rates that adjust below the initial interest rate or adjustable rate mortgage loans with terms that provide the borrower options with regard
to the amount or timing of periodic payments. Our adjustable rate mortgage loans amortize over terms of up to 30 years.
7
Adjustable rate mortgage loans decrease the risk associated with changes in market interest rates by periodically repricing, but involve other risks because, as interest rates increase, the interest payments on the loan increase, thus increasing the potential for default by the borrower. At the same time, the marketability of
the underlying collateral may be adversely affected by higher interest rates. Upward adjustment of the contractual interest rate is also limited by the maximum periodic and lifetime interest rate adjustments permitted by our loan documents, and therefore, is potentially limited in effectiveness during periods of extended or rapidly rising interest rates. At September 30, 2009, $8.8 million, or 11.4%, of our one- to four-family residential loans had adjustable rates of interest.
All one- to four-family residential mortgage loans that we originate include “due-on-sale” clauses, which give us the right to declare a loan immediately due and payable in the event that, among other things, the borrower sells or otherwise disposes of the real property subject to the mortgage and the loan is not repaid.
Regulations limit the amount that a savings association may lend relative to the appraised value of the real estate securing the loan, as determined by an appraisal of the property at the time the loan is originated. For all loans, we utilize outside independent appraisers approved by our board of directors. All borrowers
are required to obtain title insurance, except for equity loans with balances under $50,000. We also require fire and casualty insurance and, where circumstances warrant, flood insurance.
Multi-Family Real Estate Loans. Loans secured
by multi-family real estate totaled approximately $92.4 million, or 21.4% of the total loans receivable at September 30, 2009. Multi-family real estate loans generally are secured by rental properties (including multi-family apartment buildings). Substantially all multi-family real estate loans are secured by properties located within our lending area. At September 30, 2009, we had 63 multi-family real estate loans with an average principal balance of $1.47 million. At
September 30, 2009, our largest multi-family real estate loan balance was $10.2 million. Multi-family real estate loans generally are offered with fixed interest rates. Multi-family real estate loans also generally are originated for terms ranging from one year to 15 years with the majority of these loans being originated for shorter terms within this range. The Bank agreed with the OTS that, other than contractual
commitments entered into prior to December 3, 2009, the Bank will not originate any multi-family loans without prior OTS approval.
We consider a number of factors in originating multi-family real estate loans. We evaluate the qualifications and financial condition of the borrower (including credit history), profitability and expertise, as well as the value and condition of the mortgaged property securing the loan. When evaluating the qualifications
of a borrower, we consider the financial resources of the borrower, the borrower’s experience in owning or managing similar property and the borrower’s payment history with us and other financial institutions. In evaluating the property securing the loan, the factors we consider include the net operating income of the mortgaged property before debt service and depreciation, the ratio of the loan amount to the appraised value of the mortgaged property and the debt service coverage ratio
(the ratio of net operating income to debt service) to ensure that it is at least 120% of the monthly debt service. Multi-family real estate loans are originated in amounts up to 75% of the appraised value of the mortgaged property securing the loan. All multi-family loans are appraised by outside independent appraisers approved by our board of directors.
Loans secured by multi-family real estate generally involve a greater degree of credit risk than one- to four-family residential mortgage loans and carry larger loan balances. This increased credit risk is a result of several factors, including the concentration of principal in a limited number of loans and borrowers, the effects
of general economic conditions on income producing properties, and the increased difficulty of evaluating and monitoring these types of loans. Furthermore, the repayment of loans secured by multi-family real estate typically depends upon the successful operation of the real estate property securing the loan. If the cash flow from the project is reduced, the borrower’s ability to repay the loan may be impaired. All borrowers are required to obtain title insurance. We
also require fire and casualty insurance and, where circumstances warrant, flood insurance.
8
Commercial Real Estate Loans. At September 30,
2009, $143.2 million, or 33.2% of our total loans receivable, consisted of commercial real estate loans. Commercial real estate loans are secured by office buildings, mixed-use properties and other commercial properties. We generally originate fixed-rate commercial real estate loans with an initial term ranging from one to five years and a repricing option, and a maximum term of up to 20 years. The majority of commercial real estate loans originated have shorter terms within this range. The
maximum loan-to-value ratio of our commercial real estate loans is 75%. At September 30, 2009, we had 88 commercial real estate loans with an average outstanding balance of $1.6 million. At September 30, 2009, our largest commercial real estate loan balance was $8.8 million. The Bank agreed with the OTS that, other than contractual commitments entered into prior to December 3, 2009, the Bank will not originate any
commercial real estate loans without prior OTS approval.
We consider a number of factors in originating commercial real estate loans. We evaluate the qualifications and financial condition of the borrower, including credit history, profitability and expertise, as well as the value and condition of the mortgaged property securing the loan. When evaluating the qualifications
of the borrower, we consider the financial resources of the borrower, the borrower’s experience in owning or managing similar property and the borrower’s payment history with us and other financial institutions. In evaluating the property securing the loan, the factors we consider include the net operating income of the mortgaged property before debt service and depreciation, the ratio of the loan amount to the appraised value of the mortgaged property and the debt service coverage ratio
(the ratio of net operating income to debt service) to ensure that it is at least 120% of the monthly debt service. All commercial real estate loans are appraised by outside independent appraisers approved by our board of directors. Personal guarantees are obtained from commercial real estate borrowers although we will consider waiving this requirement based upon the loan-to-value ratio of the proposed loan. All borrowers are required to obtain title insurance. We also
require fire and casualty insurance and, where circumstances warrant, flood insurance.
Loans secured by commercial real estate generally are larger than one- to four-family residential loans and involve greater credit risk. Commercial real estate loans often involve large loan balances to single borrowers or groups of related borrowers. Repayment of these loans depends to a large degree on the results
of operations and management of the properties securing the loans or the businesses conducted on this property, and may be affected to a greater extent by adverse conditions in the real estate market or the economy in general. Accordingly, the nature of these loans makes them more difficult for management to monitor and evaluate.
Construction Loans. At September 30, 2009,
$73.3 million, or 17.0%, of our total loans receivable consisted of construction loans. Most of our construction loans are for the construction of multi-family and mixed-use properties. The majority of our construction loans are referred by mortgage brokers who make the initial contact with the potential borrower and forward to us additional loan information that we review to determine whether the applicant satisfies our underwriting criteria. If the loan information meets our
criteria, we issue a letter of intent listing the terms and conditions of any potential loan. If the potential borrower agrees to these terms and conditions, we will continue our standard underwriting practice. We offer primarily adjustable rate residential construction loans. Construction loans are generally structured with an option for permanent mortgage financing once the construction is completed. Construction loans generally have a two-year term and are generally
repaid from the sale of units or refinancing upon completion. These loans generally have interest rates that adjust daily with prime and generally will not have an interest rate that adjusts below the initial interest rate. Construction loans require only the payment of interest during the construction period. Construction loans will generally be made in amounts of up to 75% of the appraised value of the completed property, or the actual cost of the improvements. Funds
are disbursed based on our inspections in accordance with a schedule reflecting the completion of portions of the project. At September 30, 2009, our largest construction loan balance was $5.1 million. The Bank agreed with the OTS that, other than contractual commitments entered into prior to December 3, 2009, the Bank will not originate any construction loans without prior OTS approval.
Construction loans generally involve a greater degree of credit risk than one- to four-family residential mortgage loans. The risk of loss on a construction loan depends upon the accuracy of the initial estimate of the value of the property at completion of construction compared to the estimated cost of construction as well
as the ability to complete construction on a timely basis, and the ability to sell or refinance the property. For all loans, we utilize outside independent appraisers approved by our board of directors. All borrowers are required to obtain title insurance. We also require fire and casualty insurance and, where circumstances warrant, flood insurance.
9
Land Loans. In 2005, we began to originate land loans based on our increased construction loan activity. At September 30, 2009, $45.0
million, or 10.4% of our total loans receivable consisted of land loans. Our land loans are made generally in conjunction with anticipated construction loan financing. The highest combined exposure is $11.6 million. In most cases the value of the land represents the borrower’s up-front equity in our construction loans. When the land value exceeds the borrower’s equity requirement, which is usually 25% of total project costs, including land, we will consider
originating this type of land loan. The majority of our land loans are referred by mortgage brokers who make the initial contact with the potential borrower and forward to us additional loan information that we review to determine whether the applicant satisfies our underwriting criteria. If the loan information meets our criteria, we issue a letter of intent listing the terms and conditions of any potential loan. If the potential borrower agrees to these terms and conditions,
we will continue our standard underwriting practice. We currently offer primarily adjustable rate residential land loans. At September 30, 2009, our largest land loan balance was $7.9 million, and the average land loan balance was $1.6 million. Land loans are generally repaid at the end of a two-year period. These loans generally have interest rates that adjust daily in conjunction with the prime rate and generally will not have an interest rate that adjusts below the
initial interest rate. Land loans will generally be made in amounts of up to 75% of the appraised value. The Bank agreed with the OTS that, other than contractual commitments entered into prior to December 3, 2009, the Bank will not originate any land loans without prior OTS approval.
Land loans generally involve a greater degree of credit risk than one- to four-family residential mortgage loans. The risk of loss on a land loan depends upon the accuracy of the initial estimate of the value of the property as well as being able to complete development on a timely basis. For all loans, we utilize
outside independent appraisers approved by our board of directors. All borrowers are required to obtain title insurance. We also require fire and casualty insurance and, where circumstances warrant, flood insurance.
Other Loans. We offer loans that are either
unsecured or secured by property other than real estate. These loans include loans secured by deposits and personal loans. At September 30, 2009, these other loans totaled $684,000 or 0.2% of the loans receivable portfolio.
Loan Approval Procedures and Authority. The
loan approval process is intended to assess the borrower’s ability to repay the loan, the viability of the loan, and the adequacy of the value of the property that will secure the loan. To assess the borrower’s ability to repay, we review each borrower’s employment and credit history and information on the historical and projected income and expenses of mortgagors. All one- to four-family mortgage loans up to $850,000 must be approved by two members of the Management Loan
Committee, which is comprised of senior corporate officers, including the Chief Executive Officer and the Chief Financial Officer. All other mortgage loans up to $850,000 must be approved by two of the following officers: the President, the Chief Lending Officer, the Senior Vice President and the Manager of Residential Lending. All loans in excess of $850,000 must be approved by the Directors’ Loan Committee. In addition, the board of directors ratifies all loans
approved by management including those approved by the Management Loan Committee.
Non-Performing Loans and Potential Problem Assets
After a one- to four-family residential loan becomes 15 days late, we deliver a computer-generated late charge notice to the borrower. Approximately one week later, we deliver a reminder notice. When a loan becomes 30 days delinquent, the loan servicing department manager determines whether to send an acceleration
letter to the borrower and attempts to make personal contact. After 60 days, we will generally refer the matter to legal counsel who is authorized to commence foreclosure proceedings. Management is authorized to begin foreclosure proceedings on any loan after 60 days, after determining that it is prudent to do so and the proper acceleration letter has been sent.
After a multi-family, commercial real estate or construction loan becomes 10 days delinquent, we deliver a computer-generated late charge notice to the borrower and attempt to make personal contact with the borrower. If there is no successful resolution of the delinquency at that time, we may accelerate the payment terms of
the loan and issue a letter notifying the borrower of this acceleration. After such a loan is 15 days delinquent, we may refer the matter to legal counsel who is authorized to commence foreclosure proceedings. Management is authorized to begin foreclosure proceedings on any loan after determining that it is prudent to do so.
Mortgage loans are reviewed on a regular basis by management’s Asset Classification Committee and are placed on non-accrual status when they become 90 days or more delinquent and collection is doubtful or when, regardless of how many days delinquent the loan is, other factors indicate that the collection of these amounts is doubtful. When
loans are placed on non-accrual status, unpaid accrued interest is reversed, and further income is recognized only to the extent received.
10
Non-Performing Loans. Non-performing loans are
either in non-accrual status and/or past contractual maturity date. At September 30, 2009, $22.1 million of our loans net of specific allowances, or 5.13% of our total loans, were non-accrual and/or past maturity and therefore non-performing. These loans consist of multi-family, commercial real estate, construction and land loans.
Non-Performing Assets. The table below sets forth the amounts and categories of our non-performing assets, net of specific allowances at the dates
indicated. We may from time to time agree to modify the contractual terms of a borrower’s loan. In cases where these modifications represent a concession (for which a portion of interest or principal has been forgiven and loans modified at interest rates materially less than current market rates) to a borrower experiencing financial difficulty, the modification is considered a troubled debt restructuring. At September 30, 2009, loans modified in a troubled debt restructuring
totaled $0.4 million. These loans were performing loans at the time their terms were modified and are performing in accordance with their new terms. Therefore, they are not included in the table below. For the periods presented from September 2005 through 2008, we had no troubled debt restructurings. The recent sharp deterioration in the real estate market has resulted in a deterioration of the Bank’s loans receivable portfolio, which in turn has caused increases
in non-performing loans. At September 30, 2009, nine loans totaling $22.1 million were in non-performing status versus two loans totaling $2.0 million in non-performing status at September 30, 2008.
|
At September 30, |
||||||||||||||||||||
|
2009 |
2008 |
2007 |
2006 |
2005 |
||||||||||||||||
|
(Dollars in thousands) |
||||||||||||||||||||
|
Non-performing loans: |
||||||||||||||||||||
|
One- to four-family |
$ | - | $ | - | $ | - | $ | 154 | $ | - | ||||||||||
|
Multi-family |
902 | 1,883 | 41 | 145 | 282 | |||||||||||||||
|
Commercial real estate |
15,623 | 130 | - | - | 1,807 | |||||||||||||||
|
Construction |
832 | - | 611 | - | 1,422 | |||||||||||||||
|
Land |
4,722 | - | - | - | - | |||||||||||||||
|
Consumer |
- | - | - | - | - | |||||||||||||||
|
Total non-performing assets |
$ | 22,079 | $ | 2,013 | $ | 652 | $ | 299 | $ | 3,511 | ||||||||||
|
Ratios: |
||||||||||||||||||||
|
Total non-performing loans to total loans |
5.13 | % | 0.54 | % | 0.23 | % | 0.10 | % | 1.71 | % | ||||||||||
|
Total non-performing loans to total assets |
4.23 | % | 0.42 | % | 0.17 | % | 0.07 | % | 1.03 | % | ||||||||||
|
Total non-performing assets to total assets |
4.23 | % | 0.42 | % | 0.17 | % | 0.07 | % | 1.03 | % | ||||||||||
Delinquencies. The following table sets forth certain information with respect to our loan portfolio delinquencies at the dates indicated, net
of specific reserves.
11
|
Loans Delinquent For |
||||||||||||||||||||||||
|
60-89 Days |
90 Days and Over |
Total |
||||||||||||||||||||||
|
Number |
Amount |
Number |
Amount |
Number |
Amount |
|||||||||||||||||||
|
(Dollars in thousands) |
||||||||||||||||||||||||
|
At September 30, 2009 |
||||||||||||||||||||||||
|
Mortgage Loans: |
||||||||||||||||||||||||
|
1-4 Family (secured by first liens) |
- | $ | - | $ | - | - | $ | - | ||||||||||||||||
|
1-4 Family (secured by junior liens) |
- | - | - | - | ||||||||||||||||||||
|
Multi-family |
1 | 345 | 1 | 902 | 2 | 1,247 | ||||||||||||||||||
|
Construction |
2 | 311 | 1 | 832 | 3 | 1,143 | ||||||||||||||||||
|
Commercial real estate |
2 | 3,979 | 6 | 15,623 | 8 | 19,602 | ||||||||||||||||||
|
Land |
- | - | 1 | 4,722 | 1 | 4,722 | ||||||||||||||||||
|
Nonmortgage Loans : |
||||||||||||||||||||||||
|
Other - Personal Loan (64-) |
- | - | - | - | - | - | ||||||||||||||||||
|
Total |
5 | $ | 4,635 | 9 | $ | 22,079 | 14 | $ | 26,714 | |||||||||||||||
|
At September 30, 2008 |
||||||||||||||||||||||||
|
Multi-family |
- | $ | - | - | $ | - | - | $ | - | |||||||||||||||
|
Construction |
- | - | - | - | - | - | ||||||||||||||||||
|
Total |
- | $ | - | - | $ | - | - | $ | - | |||||||||||||||
|
At September 30, 2007 |
||||||||||||||||||||||||
|
Multi-family |
- | $ | - | 1 | $ | 41 | 1 | $ | 41 | |||||||||||||||
|
Construction |
- | - | 1 | 611 | 1 | 611 | ||||||||||||||||||
|
Total |
- | $ | - | 2 | $ | 652 | 2 | $ | 652 | |||||||||||||||
For the fiscal year ended September 30, 2009, there was $0.7 million in interest income that would have been recorded had our non-accruing loans been current in accordance with their original terms.
Classified Assets. Office of Thrift Supervision
regulations and our Asset Classification Policy provide that loans and other assets should be classified as “substandard,” “doubtful” or “loss” assets where a significant question as to collectability arises. An asset is considered “substandard” if it is inadequately protected by the current net worth and paying capacity of the obligor or of the collateral pledged, if any. “Substandard” assets include those characterized by the “distinct
possibility” that the institution will sustain “some loss” if the deficiencies are not corrected. Assets classified as “doubtful” have all of the weaknesses inherent in those classified “substandard,” with the added characteristic that the weaknesses present make “collection or liquidation in full,” on the basis of currently existing facts, conditions, and values, “highly questionable and improbable.” Assets classified as “loss”
are those considered “uncollectible” and of such little value that they should be entirely charged-off. We classify an asset as “special mention” if the asset has a potential weakness that warrants management’s close attention. While “special mention” assets have not deteriorated to the point of being classified as “substandard,” management has concluded that if the potential weakness in the asset is not addressed, the value of the asset
may deteriorate, thereby adversely affecting the repayment of the asset.
An institution is required to establish general allowances for loan losses in an amount deemed prudent by management for loans classified as “special mention.” General
allowances represent loss allowances which have been established to recognize the inherent losses associated with lending activities, but which, unlike specific allowances, have not been allocated to particular problem assets. When an institution classifies assets as “substandard or doubtful”, it is required either to establish a specific allowance for losses equal to the amount its internal analysis determines the potential loss to be on the asset or to charge off the amount. When
an institution classifies problem assets as “loss,” it is required either to establish a specific allowance for losses equal to 100% of the amount of the asset so classified or deemed uncollectable to charge off the amount. An institution’s determination as to the classification of its assets and the amount of its valuation allowances is subject to review by the Office of Thrift Supervision which can order the establishment of additional general or specific loss allowances.
12
On the basis of management’s review of assets, at September 30, 2009, we classified $56.4 million of our assets as special mention or potential problem loans compared to $5.4 million
at September 30, 2008. This increase was due to the recent sharp deterioration in the real estate market that resulted in a deterioration of the Bank’s loans receivable portfolio. In addition, at September 30, 2009 we classified $54.4 million as substandard compared to $6.8 million at September 30, 2008. We have provided $5.1 million in specific allowances for $23.0 million of the loans classified as substandard, which were comprised of five commercial real estate loans
(consisting of three relationships), one multi-family loan and one land loan. We classified as doubtful one unsecured consumer loan for $16,000 and provided $16,000 in specific allowance.
The first commercial real estate relationship consists of two loans having an aggregate outstanding balance of $9.8 million which are secured by fee and leasehold mortgage on two adjoining properties. These loans are currently in default and the Company is recording a $2.3 million specific allowance for potential foreclosure costs. The
loans are cross-collateralized and have a current appraised value of $8.8 million. The second relationship also consists of two loans with an aggregate balance of $5.3 million that are secured by an industrial warehouse. These loans are currently in default and the Company is recording a $0.8 million specific allowance based upon the properties’ current appraised value of $5.6 million and potential foreclosure costs. The third relationship is a $0.3 million loan for which the Company is recording
a $30,000 specific allowance for potential foreclosure costs. The property was appraised at approximately $4.0 million in 2004 and the Company is awaiting receipt of a new appraisal. The multi-family loan is a $1.9 million loan secured by vacant corner residential property in Manhattan for which the Company is recording a $1.0 million specific allowance based on the property’s current appraised value and anticipated foreclosure costs. The Company is also recording a $1.0 million specific
allowance on a $5.7 million land loan which was prompted by a decrease in the current appraised value of the property.
The loan portfolio is reviewed on a regular basis by management’s Asset Classification Committee to determine whether any loans require classification in accordance with applicable regulations. Not all classified assets constitute non-performing assets.
Allowance for Loan Losses
Our allowance for loan losses is intended to be maintained at a level necessary to absorb loan losses that are both probable and reasonably estimable. Management, in determining
the allowance for loan losses, considers the losses inherent in its loan portfolio and changes in the nature and volume of loan activities, along with the general economic and real estate market conditions. We utilize a two-tier approach: (1) identification of impaired loans and establishment of specific loss allowances on impaired loans, if any; and (2) establishment of general valuation allowances on the remainder of our loan portfolio. We maintain a loan review system, which provides
for a periodic review of our loan portfolio and the identification of potential impaired loans. This system takes into consideration, among other things, delinquency status, size of loans, type and market value of collateral and financial condition of the borrowers. Specific loan loss allowances are established for identified losses based on a review of this information. A loan evaluated for impairment is considered to be impaired when, based on current information and events,
it is probable that we will be unable to collect all amounts due according to the contractual terms of the loan agreement. We do not aggregate these loans for evaluation purposes. Loan impairment is measured based on the present value of expected future cash flows discounted at the loan’s effective interest rate or, as a practical expedient, at the loan’s observable market price or the fair value of the collateral if the loan is collateral dependent. General loan loss
allowances are based upon a combination of factors including, but not limited to, actual loan loss experience, composition of the loan portfolio, current economic conditions and management’s judgment. The allowance is increased through provisions charged against current earnings and recoveries of previously charged-off loans. Loans that are determined to be uncollectible are charged against the allowance. While management uses available information to recognize probable
and reasonably estimable loan losses, future loss provisions may be necessary based on changing economic conditions, particularly in the real estate sector.
13
A federally chartered savings association’s determinations as to the classification of its assets, charge-offs and the amount of its valuation allowances are subject to review by the Office of Thrift Supervision. The Office of Thrift Supervision, in conjunction with the other federal banking
agencies, provides guidance for financial institutions on both the responsibilities of management for the assessment and establishment of adequate valuation allowances and guidance for banking agency examiners to use in determining the adequacy of valuation allowances. All institutions are required to have effective systems and controls to identify, monitor and address asset quality problems, analyze all significant factors that affect the collectability of the portfolio in a reasonable manner and
establish acceptable allowance evaluation processes that meet the objectives of the federal regulatory agencies. There can be no assurance that the Office of Thrift Supervision, as a result of reviewing our loan portfolio and/or allowance, will not request that we alter our allowance for loan losses or require additional charge-offs, thereby affecting our financial condition and earnings.
Allowance for loan losses increased by $8.5 million, to $10.7 million for the fiscal year ended September 30, 2009 from $2.2 million for the fiscal year ended September 30, 2008. The increase is primarily the result of a $5.1 million increase in the specific allowances for impaired loans and a $3.4 million increase in general
allowances for increases in its loan receivable portfolio, loans classified as special mention and the general decline in economic conditions in our lending footprint. Over the last four years, there were no charge-offs or recoveries.
The loan loss provision also increased $8.1 million to $8.5 million for fiscal year 2009 compared to $0.4 million for fiscal year 2008. The increase is primarily the result of a $5.1 million increase in the specific allowances on five commercial real estate loans (consisting of three relationships), one multi-family loan and
one land loan, as described in the prior section titled “Business-Classified Assets.” The remaining $3.0 million increase in loan loss provision was attributable to a) the transfer of $200.5 million from its held-for-sale loan portfolio to its loan receivable portfolio during the current fiscal year, b) the increase in potential problem loans, and c) the general decline in economic conditions on the balance of the loan receivable portfolio.
The transfer of the held-for-sale portfolio was due to the increased tightening in the credit markets, which has hampered the Company’s ability to sell these loans. Management decided to transfer these loans to its loans receivable portfolio and in accordance with its allowance for loan and lease losses policy established
a general provision. Loans held-for-sale are carried at the lower of cost or market and therefore do not require a general allowance for loan losses. The Company also increased its general provision due to an increase of $51.0 million in potential problem loans. Potential problem loans are loans that may or may not be delinquent. These are loans that the Company has identified as showing characteristics of potential inability on the part of the borrower to make payments
in accordance with the terms of the loan agreement.
14
The following table sets forth activity in our allowance for loan losses for the periods indicated.
|
At or For the Years Ended September 30, |
|||||||||||||||||||||
|
2009 |
2008 |
2007 |
2006 |
2005 |
|||||||||||||||||
|
(Dollars in thousands) |
|||||||||||||||||||||
|
Balance at beginning of year |
$ | 2,205 | $ | 1,806 | $ | 1,757 | $ | 1,321 | $ | 920 | |||||||||||
|
Charge-offs: |
|||||||||||||||||||||
|
Consumer and other |
- | - | - | - | (1 | ) | |||||||||||||||
|
Recoveries |
- | - | - | - | - | ||||||||||||||||
|
Net charge-offs |
- | - | - | - | (1 | ) | |||||||||||||||
|
Provision for loan losses |
8,545 | 399 | 49 | 436 | 402 | ||||||||||||||||
|
Balance at end of year |
$ | 10,750 | $ | 2,205 | $ | 1,806 | $ | 1,757 | $ | 1,321 | |||||||||||
|
Ratios: |
|||||||||||||||||||||
|
Net charge-offs to average loans outstanding |
0.00 | % | 0.00 | % | 0.00 | % | 0.00 | % | 0.00 | % | (1) | ||||||||||
|
Allowance for loan losses to total loans at end of period |
2.50 | % | 0.59 | % | 0.63 | % | 0.61 | % | 0.64 | % | |||||||||||
(1) Percentage is less than 0.01%.
We have charged-off one consumer loan with a balance of $1,000 since fiscal year 2005. We have not charged-off a real estate mortgage loan since 2001, due in part, to what
has been, until recently, a stable local economy, prudent underwriting of loans and continuous monitoring of the loan portfolio to attempt to identify and address non-performing loans and potential problem assets at an early date. The amount of foreclosures we incurred in the last five years was not material to our consolidated financial statements taken as a whole and the Bank suffered no losses on foreclosed
assets during that period. The recent sharp deterioration in the real estate market, however, has resulted in a deterioration of the Bank’s loan portfolio, including increases in non-performing loans and problem assets, and will lead to charge-offs.
Allocation of Allowance for Loan Losses. The following table sets forth the allowance for loan losses allocated by loan category, the percentage
of the allowance for loan losses in each category to the total allowance for loan losses, and the percent of loans in each category to total loans at the dates indicated. The allowance for loan losses allocated to each category is not necessarily indicative of future losses in any particular category and does not restrict the use of the allowance to absorb losses in other categories.
15
|
At September 30, |
||||||||||||||||||||||||||||||||||||
|
2009 |
2008 |
2007 |
||||||||||||||||||||||||||||||||||
|
Amount |
Percent of
Allowance to Total
Allowance |
Percent of
Loans in
Each
Category to
Total
Loans |
Amount |
Percent of
Allowance
to Total
Allowance |
Percent of
Loans in
Each
Category to
Total
Loans |
Amount |
Percent of
Allowance
to Total
Allowance |
Percent of
Loans in
Each
Category to
Total
Loans |
||||||||||||||||||||||||||||
|
(Dollars in thousands) |
||||||||||||||||||||||||||||||||||||
|
Mortgage loans: |
||||||||||||||||||||||||||||||||||||
|
One- to four-family |
$ | 79 | 0.73 | % | 17.85 | % | $ | 80 | 3.63 | % | 33.99 | % | $ | 69 | 3.82 | % | 32.57 | % | ||||||||||||||||||
|
Multi-family |
1,682 | 15.65 | % | 21.40 | % | 248 | 11.25 | % | 13.34 | % | 365 | 20.21 | % | 18.54 | % | |||||||||||||||||||||
|
Commercial real estate |
5,529 | 51.43 | % | 33.18 | % | 1,316 | 59.68 | % | 42.76 | % | 1,089 | 60.30 | % | 42.43 | % | |||||||||||||||||||||
|
Construction |
1,170 | 10.89 | % | 16.98 | % | 196 | 8.89 | % | 5.69 | % | 185 | 10.24 | % | 5.24 | % | |||||||||||||||||||||
|
Land |
2,268 | 21.10 | % | 10.43 | % | 357 | 16.19 | % | 3.84 | % | 90 | 4.98 | % | 0.79 | % | |||||||||||||||||||||
|
Consumer and other |
22 | 0.20 | % | 0.16 | % | 8 | 0.36 | % | 0.38 | % | 8 | 0.44 | % | 0.43 | % | |||||||||||||||||||||
|
Total allowance for loan losses |
$ | 10,750 | 100.00 | % | 100.00 | % | $ | 2,205 | 100.00 | % | 100.00 | % | $ | 1,806 | 100.00 | % | 100.00 | % | ||||||||||||||||||
|
At September 30, |
||||||||||||||||||||||||
|
2006 |
2005 |
|||||||||||||||||||||||
|
Amount |
Percent of
Allowance
to Total
Allowance |
Percent of
Loans in
Each
Category to
Total
Loans |
Amount |
Percent of
Allowance
to Total
Allowance |
Percent of
Loans in
Each
Category to
Total
Loans |
|||||||||||||||||||
|
Mortgage loans: |
||||||||||||||||||||||||
|
One- to four-family |
$ | 60 | 3.41 | % | 28.87 | % | $ | 54 | 4.09 | % | 27.85 | % | ||||||||||||
|
Multi-family |
496 | 28.23 | % | 23.55 | % | 417 | 31.57 | % | 23.48 | % | ||||||||||||||
|
Commercial real estate |
666 | 37.91 | % | 36.56 | % | 609 | 46.10 | % | 36.35 | % | ||||||||||||||
|
Construction |
292 | 16.62 | % | 9.25 | % | 194 | 14.68 | % | 10.31 | % | ||||||||||||||
|
Land |
239 | 13.60 | % | 1.49 | % | 45 | 3.41 | % | 1.81 | % | ||||||||||||||
|
Consumer and other |
4 | 0.23 | % | 0.28 | % | 2 | 0.15 | % | 0.20 | % | ||||||||||||||
|
Total allowance for loan losses |
$ | 1,757 | 100.00 | % | 100.00 | % | $ | 1,321 | 100.00 | % | 100.00 | % | ||||||||||||
16
Each quarter, management evaluates the total balance of the allowance for loan losses based on several factors that are reflective of the inherent losses in the loan portfolio. This process includes, but is not limited to, a periodic review of loan collectability in light of historical experience, the nature and volume of loan
activity, conditions that may affect the ability of the borrower to repay, the underlying value of collateral, if applicable, and economic conditions in our immediate market area. First, we group loans by delinquency status. All loans deemed impaired are evaluated individually, based primarily on the value of the collateral securing the loan. Specific loss allowances are established as required by this analysis. All loans for which a specific loss allowance has not
been assigned are segregated by type and delinquency status and a loss allowance is established by using loss experience data and management’s judgment concerning other matters it considers significant. The allowance is allocated to each category of loans based on the results of the above analysis.
This analysis process is inherently subjective, as it requires us to make estimates that are susceptible to revisions as more information becomes available. Although we believe that we have established the allowance at levels to absorb probable and estimable losses, future additions may be necessary if economic or other conditions
continue to deteriorate in the future from the current environment.
Investments
Investments and Mortgage-Backed Securities. Our
investment portfolio at September 30, 2009 included $66.2 million of mortgage-backed securities, all of which are classified as held to maturity, and $2.4 million of Federal Home Loan Bank of New York stock. In addition, our investment portfolio at September 30, 2009 included $3.3 million of mutual fund shares, comprised primarily of a $2.8 million ultra-short term mutual fund classified as available-for-sale. Our investment policy objectives are to maintain liquidity within the guidelines
established by the board of directors.
At September 30, 2009, we held $20.5 million of mortgage-backed securities issued by Freddie Mac and Fannie Mae, which are United States government-sponsored enterprises. The
remaining $45.7 million of our mortgage-backed securities represents securities of private issuers and United States government agencies. Private issuer securities typically offer rates above those paid on securities of government-sponsored enterprises, but lack the guaranty of those enterprises and are often less liquid. The government-sponsored enterprises’ portion of the mortgage-backed securities portfolio consisted of $16.8 million in fixed-rate mortgage-backed securities
and $3.7 million in adjustable rate mortgage-backed securities.
For further discussion of our securities portfolio, please see Note 3 of Notes to Consolidated Financial Statements in Item 8, “Financial Statements and Supplementary Data.”
17
The following table sets forth the composition of our investment securities portfolio at the dates indicated
|
2009 |
At September 30, 2008 |
2007 |
||||||||||||||||||||||
|
Carrying |
Estimated |
Carrying |
Estimated |
Carrying |
Estimated |
|||||||||||||||||||
|
Cost |
Fair Value |
Cost |
Fair Value |
Cost |
Fair Value |
|||||||||||||||||||
|
Securities available-for-sale: |
(In thousands) |
|||||||||||||||||||||||
|
Mutual fund shares |
$ | 3,305 | $ | 3,305 | $ | 3,655 | $ | 3,655 | $ | 4,704 | $ | 4,601 | ||||||||||||
|
Total securities available-for-sale |
$ | 3,305 | $ | 3,305 | $ | 3,655 | $ | 3,655 | $ | 4,704 | $ | 4,601 | ||||||||||||
|
Securities held-to-maturity: |
||||||||||||||||||||||||
|
Mortgage-backed securities: |
||||||||||||||||||||||||
|
Government-sponsored enterprises |
$ | 20,474 | $ | 20,863 | $ | 30,136 | $ | 29,222 | $ | 40,323 | $ | 39,074 | ||||||||||||
|
Government agency |
125 | 123 | 152 | 146 | 173 | 175 | ||||||||||||||||||
|
Private issuers |
45,602 | 38,348 | 47,798 | 41,628 | 32,856 | 32,781 | ||||||||||||||||||
|
Other debt obligations |
- | - | - | - | 2 | 2 | ||||||||||||||||||
|
Total securities held-to-maturity |
$ | 66,201 | $ | 59,334 | $ | 78,086 | $ | 70,996 | $ | 73,354 | $ | 72,032 | ||||||||||||
Portfolio Maturities and Yields. The composition and maturities of the investment securities portfolio at September 30, 2009 are summarized in
the following table. Maturities are based on the final contractual payment dates, and do not reflect the impact of prepayments or early redemptions that may occur. This table does not reflect the Bank’s investment in mutual funds which have no contractual maturity date and are classified as available-for-sale.
|
One Year or Less |
More than One Year through
Five Years |
More than Five Years through Ten Years |
More than Ten Years |
Total Securities |
||||||||||||||||||||||||||||||||||||||||
|
Carrying |
Weighted Average |
Carrying |
Weighted Average |
Carrying |
Weighted Average |
Carrying |
Weighted Average |
Carrying |
Fair |
Weighted Average |
||||||||||||||||||||||||||||||||||
|
Value |
Yield |
Value |
Yield |
Value |
Yield |
Value |
Yield |
Value |
Value |
Yield |
||||||||||||||||||||||||||||||||||
| (Dollars in thousands) | ||||||||||||||||||||||||||||||||||||||||||||
|
Securities held-to-maturity: |
||||||||||||||||||||||||||||||||||||||||||||
|
Mortgage-backed securities: |
||||||||||||||||||||||||||||||||||||||||||||
|
Government-sponsored enterprises |
$ | - | 0.00 | % | $ | 399 | 4.16 | % | $ | 10,360 | 4.12 | % | $ | 9,715 | 3.40 | % | $ | 20,474 | $ | 20,863 | 3.78 | % | ||||||||||||||||||||||
|
Government agency |
- | - | - | - | 87 | 4.19 | % | 38 | 7.35 | % | 125 | 123 | 5.14 | % | ||||||||||||||||||||||||||||||
|
Private issuers |
- | - | - | - | 11,165 | 4.89 | % | 34,437 | 4.96 | % | 45,602 | 38,348 | 4.95 | % | ||||||||||||||||||||||||||||||
|
Total securities held-to-maturity |
$ | - | 0.00 | % | $ | 399 | 4.16 | % | $ | 21,612 | 4.51 | % | $ | 44,190 | 4.67 | % | $ | 66,201 | $ | 59,334 | 4.62 | % | ||||||||||||||||||||||
18
Sources of Funds
General. Deposits have traditionally been our primary
source of funds for our lending and investment activities. In addition to deposits, funds are derived from scheduled loan payments, investment maturities, loan prepayments and income on earning assets. While scheduled loan payments and income on earning assets have been relatively stable sources of funds, deposit inflows and outflows can vary widely and are influenced by prevailing interest rates, market conditions and levels of competition. Borrowings from the Federal Home Loan Bank of
New York may be used to compensate for reductions in deposits and to fund loan and securities growth. As of September 30, 2009, we had $27.3 million of borrowings outstanding from the Federal Home Loan Bank of New York.
Deposits. Substantially
all of our depositors are persons who work or reside in Kings, Nassau or Suffolk Counties, New York. We offer a variety of deposit instruments. These include demand deposits consisting of non-interest bearing checking accounts, NOW accounts, money market accounts, passbook savings and club accounts, and fixed-term certificates of deposit. Deposit account terms vary, with the principal differences being the minimum balance required, the amount of time the funds must remain on deposit
and the interest rate. We do not have any brokered deposits at this time.
We establish and adjust periodically the interest rates paid, maturity terms, service fees and withdrawal penalties on our deposits. Deposit rates and terms are based primarily
on current operating strategies and market rates, liquidity requirements, rates paid by competitors and growth goals. We rely on personalized customer service and long-standing relationships with customers to attract and retain deposits.
The flow of deposits is influenced significantly by general economic conditions, changes in money market and other prevailing interest rates and competition. The variety of
deposit accounts offered allows us to be competitive in obtaining funds and responding to changes in consumer demand. Based on experience, management believes that our deposits are relatively stable. However, our ability to attract and maintain certificates of deposit, and the rates paid on these deposits, have been and will continue to be significantly affected by market conditions. At September 30, 2009, $250.8 million, or 62.38%, of our deposit accounts were certificates of
deposit, of which $190.8 million had maturities of one year or less.
Deposit Accounts. The following table sets forth the distribution of total deposit accounts, by account type, at the dates indicated.
|
At September 30, |
||||||||||||||||||||||||||||||||||||
|
2009 |
2008 |
2007 |
||||||||||||||||||||||||||||||||||
|
Balance |
Percent |
Weighted Average Rate |
Balance |
Percent |
Weighted Average Rate |
Balance |
Percent |
Weighted Average Rate |
||||||||||||||||||||||||||||
|
(Dollars in thousands) |
||||||||||||||||||||||||||||||||||||
|
Deposit type: |
||||||||||||||||||||||||||||||||||||
|
NOW accounts |
$ | 11,068 | 2.75 | % | 0.75 | % | $ | 10,251 | 2.99 | % | 0.75 | % | $ | 10,609 | 3.70 | % | 0.75 | % | ||||||||||||||||||
|
Checking accounts |
16,595 | 4.13 | % | 0.00 | % | 18,773 | 5.48 | % | 0.00 | % | 16,000 | 5.57 | % | 0.00 | % | |||||||||||||||||||||
|
Money market accounts |
61,716 | 15.35 | % | 1.48 | % | 44,890 | 13.11 | % | 2.58 | % | 37,304 | 12.99 | % | 3.98 | % | |||||||||||||||||||||
|
Total deposit accounts |
89,379 | 22.23 | % | 1.11 | % | 73,914 | 21.58 | % | 1.67 | % | 63,913 | 22.26 | % | 2.45 | % | |||||||||||||||||||||
|
Passbook savings accounts |
61,880 | 15.39 | % | 0.65 | % | 58,162 | 16.98 | % | 1.05 | % | 60,394 | 21.03 | % | 1.00 | % | |||||||||||||||||||||
|
Certificates of deposit |
250,811 | 62.38 | % | 2.87 | % | 210,399 | 61.44 | % | 3.87 | % | 162,848 | 56.71 | % | 4.78 | % | |||||||||||||||||||||
|
Total deposits |
$ | 402,070 | 100.00 | % | 2.14 | % | $ | 342,475 | 100.00 | % | 2.92 | % | $ | 287,155 | 100.00 | % | 3.47 | % | ||||||||||||||||||
Deposit Activity. The
following table sets forth our deposit activity for the periods indicated.
19
|
Years Ended September 30, |
||||||||||||
|
2009 |
2008 |
2007 |
||||||||||
|
(In thousands) |
||||||||||||
|
Beginning balance |
$ | 342,475 | $ | 287,155 | $ | 271,003 | ||||||
|
Net increase before interest credited |
50,146 | 45,721 | 6,990 | |||||||||
|
Interest credited |
9,449 | 9,599 | 9,162 | |||||||||
|
Net increase in deposits |
59,595 | 55,320 | 16,152 | |||||||||
|
Ending balance |
$ | 402,070 | $ | 342,475 | $ | 287,155 | ||||||
Large Certificates of Deposits. As of September
30, 2009 the aggregate amount of outstanding certificates of deposit in amounts greater than or equal to $250,000 was approximately $11.1 million. The following table sets forth the maturity of those certificates as of September 30, 2009.
|
At |
|||||
|
September 30, 2009 |
|||||
|
(In thousands) |
|||||
|
Three months or less |
$ | 3,752 | |||
|
Over three months through six months |
3,033 | ||||
|
Over six months through one year |
2,129 | ||||
|
Over one year to three years |
1,336 | ||||
|
Over three years |
833 | ||||
|
Total |
$ | 11,083 | |||
Certificate of Deposit Maturity Schedule. The following table presents, by rate category, the remaining period to maturity of certificate of deposit
accounts outstanding as of September 30, 2009.
|
Less than one year |
Over one year to two years |
Over two years to three years |
Over three years to four years |
Over four years to five years |
Total |
Percentage of total certificate accounts |
||||||||||||||||||||||
|
(Dollars in thousands) |
||||||||||||||||||||||||||||
|
Interest Rate |
||||||||||||||||||||||||||||
|
0.00% -1.99% |
$ | 48,535 | $ | 3,832 | $ | - | $ | - | $ | - | $ | 52,367 | 20.88 | % | ||||||||||||||
|
2.00% -2.99% |
92,516 | 12,504 | 1,973 | - | 10 | 107,003 | 42.66 | % | ||||||||||||||||||||
|
3.00%-3.99% |
26,827 | 6,186 | - | 1,936 | 11,913 | 46,862 | 18.68 | % | ||||||||||||||||||||
|
4.00% -4.99% |
22,922 | 4,171 | 5,363 | 8,720 | 2,754 | 43,930 | 17.52 | % | ||||||||||||||||||||
|
5.00% -5.99% |
- | 649 | - | - | - | 649 | 0.26 | % | ||||||||||||||||||||
|
Total |
$ | 190,800 | $ | 27,342 | $ | 7,336 | $ | 10,656 | $ | 14,677 | $ | 250,811 | 100.00 | % | ||||||||||||||
20
Certificates of Deposit Classified By Rate. The following table sets forth certificates of deposit classified by range of interest rates as of
the dates indicated.
|
At September 30, |
|||||||||||||
|
2009 |
2008 |
2007 |
|||||||||||
|
(In thousands) |
|||||||||||||
|
Interest Rate |
|||||||||||||
|
Less than 2% |
$ | 52,367 | $ | - | $ | - | |||||||
|
2.00% -2.99% |
107,003 | 27,861 | - | ||||||||||
|
3.00% -3.99% |
46,862 | 101,909 | 15,919 | ||||||||||
|
4.00% -4.99% |
43,930 | 59,950 | 89,106 | ||||||||||
|
5.00% -5.99% |
649 | 20,679 | 57,823 | ||||||||||
|
Total |
$ | 250,811 | $ | 210,399 | $ | 162,848 | |||||||
Borrowings. Our borrowings consist of advances from the Federal Home Loan Bank of New York. At September 30, 2009, we had access to
Federal Home Loan Bank advances of up to $76.0 million. The following table sets forth information concerning balances and interest rates on our borrowings at the dates and for the periods indicated.
|
At or For the Years Ended September 30, |
||||||||||||
|
2009 |
2008 |
2007 |
||||||||||
|
(Dollars in thousands) |
||||||||||||
|
Balance at end of year |
$ | 27,300 | $ | 44,239 | $ | 9,271 | ||||||
|
Average balance during year |
42,281 | 21,480 | 29,236 | |||||||||
|
Maximum outstanding at any month end |
64,439 | 44,239 | 51,307 | |||||||||
|
Weighted average interest rate at end of year |
0.78 | % | 1.73 | % | 4.83 | % | ||||||
|
Average interest rate during the year |
0.84 | % | 3.03 | % | 5.29 | % | ||||||
Subsidiary Activities
Office of Thrift Supervision regulations permit federal savings associations to invest in the capital stock, obligations or other specified types of securities of subsidiaries (referred
to as “service corporations”) and to make loans to service corporations and joint ventures in which service corporations are participants in an aggregate amount not exceeding 2% of the association’s assets, plus an additional 1% of assets if the amount over 2% is used for specified community or inner-city development purposes. Service corporations may engage in certain activities not otherwise permissible for the Company but may not take deposits. In addition,
Federal regulations permit associations to make specified types of loans to service corporations (other than special-purpose finance subsidiaries) in which the association owns more than 10% of the stock, in an aggregate amount not exceeding 50% of the association’s regulatory capital if the association’s regulatory capital is in compliance with applicable regulations.
3D Holding Company was incorporated in New York in 1993, for the purpose of acquiring, managing, and disposing of real estate held by the Bank. As of September 30, 2009, the
subsidiary did not hold any real estate owned. As of September 30, 2009, total assets of 3D Holding Company were $158,000, and consisted solely of cash at that date.
BFS REIT, Inc. was incorporated in New York in 1999. The corporation is a wholly-owned subsidiary created for the purpose of acquiring, holding, and investing in certain real
estate-related loans and other assets that constitute permissible investments by the Bank. As of September 30, 2009, BFS REIT, Inc.’s total aggregate assets were $91.1 million.
21
TISCO was incorporated in New York in 1982, for the purpose of holding BFS Agency, Inc., a company that sells insurance and fixed annuity products through licensed employees in the Bank’s
branches. As of September 30, 2009, TISCO’s total aggregate assets were $278,000 of which $242,000 represented the investment in BFS Agency, Inc.
Legal Proceedings
We are not involved in any pending legal proceedings as a defendant other than routine legal proceedings occurring in the ordinary course of business. At September 30, 2009, we were not involved in any legal proceedings, the outcome of which would be material to our financial condition or results of operations.
Personnel
As of September 30, 2009, we had 74 full-time employees and 30 part-time employees. Our employees are not represented by any collective bargaining group. Management believes that we have good relations with our employees.
FEDERAL, STATE AND LOCAL TAXATION
General. The Bank’s Federal and state tax returns
have not been audited during the past five years. At this time the Company’s New York City tax returns are being audited for the 2005, 2006 and 2007 tax years.
Federal Taxation
General. The Company and the Bank are subject to Federal income taxation in the same general manner as other corporations, with some exceptions
discussed below. The Company and the Bank file consolidated income tax returns. The following discussion of Federal taxation is intended only to summarize certain pertinent Federal income tax matters and is not a comprehensive description of the tax rules applicable to the Company or the Bank.
Method of Accounting. For Federal income
tax purposes, the Bank and Company report their income and expenses on the accrual method of accounting and use a tax year ending September 30 for filing Federal income tax returns.
Bad Debt Reserve and Recapture. Prior to the Small Business Protection Act of 1996 (the “1996 Act”), the Bank was permitted to establish
a reserve for bad debts and to make annual additions to the reserve. These additions could, within specified formula limits, be deducted in arriving at our taxable income. The Bank was required to use the specific charge off method (i.e., to claim a deduction equal to its actual loan loss experience) in computing its bad debt deduction beginning with its 1996 Federal tax return. The Bank was required
to recapture any excess reserves established after December 31, 1987. The Bank now maintains a frozen reserve equal to the balance of the bad debt reserves as of December 31, 1987 (the “base year reserve”).
As more fully discussed below, the Bank files a New York State franchise tax return. New York State and New York City enacted legislation in 1996, which among other things, decoupled the Federal tax laws in connection with thrift bad debt deductions and continued to permit the use of the bad debt provisions that applied under
Federal law prior to the enactment of the 1996 Act. Provided the Bank continues to satisfy certain definitional tests and other conditions, for New York State and New York City income tax purposes, it is permitted to continue to use a reserve method for bad debt deductions. The deductible annual addition to such reserves may be computed using a specific formula based on an institution’s loss history (the “experience method”) or a statutory percentage equal to 32% of its
New York State and New York City taxable income (the “percentage method”) before bad debt deduction.
22
Taxable Distributions and Recapture. As described above, the 1996 Act modified the methods by which the Bank computes its bad debt deduction and
the Bank now maintains a frozen base year reserve. The base year reserve is subject to recapture if the Bank makes certain non-dividend distributions. In such cases, an amount based on the amounts distributed will be includable into the Bank’s taxable income. “Non-dividend distributions” include distributions in excess of the Bank’s current and accumulated earnings and profits, as calculated for federal income tax purposes; distributions in redemption of its stock; and distributions
in partial or complete liquidation.
At September 30, 2009, our total Federal pre-1988 base year tax bad debt reserve was approximately $1.6 million.
Alternative Minimum Tax. The Internal Revenue
Code of 1986, as amended (the “Code”) imposes an alternative minimum tax (“AMT”) at a rate of 20% on a base of regular taxable income plus certain tax preferences (“alternative minimum taxable income” or “AMTI”). The AMT is payable to the extent such AMTI is in excess of an exemption amount and the AMT exceeds the regular income tax. Net operating losses can offset no more than 90% of AMTI. Certain payments of AMT may be used as
credits against regular tax liabilities in future years. The Bank has not been subject to the AMT and has no such amounts available as credits for carryover.
Net Operating Loss Carryovers. The Company may carry back net operating losses to the preceding two taxable years and forward to the succeeding
20 taxable years. The Worker, Homeownership, and Business Assistance Act of 2009 generally allows the Bank to elect a 3, 4, or 5-year carry-back period on net operating losses incurred in either 2008 or 2009. At September 30, 2009, the Company had no net operating loss carry-forwards for Federal income tax purposes.
Corporate Dividends-Received Deduction. The
Company may exclude from its income 100% of dividends received from the Bank as a member of the same affiliated group of corporations. The corporate dividends-received deduction is 80% in the case of dividends received from corporations with which a corporate recipient does not file a consolidated return, and corporations which own less than 20% of the stock of a corporation distributing a dividend may deduct only 70% of dividends received or accrued on their behalf.
State and Local Taxation
New York State Taxation. The Company and the Bank are subject to the New York State banking corporation tax. This tax is imposed in
an amount equal to the greater of (a) 7.1% of “entire net income” allocable to New York State, (b) 3% of “alternative entire net income” allocable to New York State, (c) 0.01% of the average value of assets allocable to New York State, or (d) a nominal minimum tax. Entire net income is based on Federal taxable income, subject to certain modifications. Alternative entire net income is equal to entire net income without certain modifications. The Company
and the Bank are also subject to the New York State tax surcharge equal to 17.0% of the New York State banking corporation tax allocable to business activities carried on in the Metropolitan Commuter Transportation District. There may be a reform of the New York State banking corporation tax that would change the way in which the Company and the Bank’s New York States taxes are computed. Please see “State and Local Taxation—Possible New York State Legislative Changes”
below for additional discussion.
Dividends received by the Bank from BFS REIT, Inc., a real estate investment trust, are subject to a 60% dividends-received deduction, which generally results in only 40% of BFS REIT, Inc.’s earnings being subject to New York State tax. The possible reform of the New York State banking corporation tax mentioned above could eliminate
the 60% dividends-received deduction in future years. Please see “State and Local Taxation—Possible New York State Legislative Changes” below.
New York City Taxation. The Bank is also subject to the New York City banking corporation tax, which is calculated, subject to a New
York City income and expense allocation, on a similar basis as the New York State banking corporation tax. The New York City tax on entire net income is imposed at a 9.0% tax rate.
Bad Debt Reserves. New York State and New York City enacted legislation in 1996, which among other things, decoupled from the Federal tax laws
in connection with bad debt deductions for thrifts and continued to permit the use of the bad debt provisions that applied under Federal tax law prior to the enactment of the 1996 Act. Provided the Bank continues to satisfy certain definitional tests of a thrift and a specified qualifying-assets ratio for New York State and New York City income tax purposes, it is permitted to continue to take deductions from entire net income for additions to reserves for losses on bad debts. The deductible
annual addition to such reserves may be computed using a specific formula based on an institution’s loss history (the “experience method”) or a statutory percentage equal to 32% of its New York State and New York City taxable income (the “percentage method”) before bad debt deduction. There may be a reform of the New York State banking corporation tax that could eliminate the use of our current bad debt reserve method. Please see “State and Local Taxation—Possible
New York State Legislative Changes” below for additional discussion.
23
Recapture of Bad Debt Reserves. Bad debt reserves consist of a defined “base-year” amount, plus additional amounts accumulated after
the base year. As of September 30, 2009, our New York State and New York City pre-1988 base-year reserve for the purposes of calculating any recapture of bad debt reserves was approximately $2.6 million. Under current New York State and New York City tax laws, bad debt reserves are subject to recapture if the Bank (i) makes certain “non-dividend distributions” or (ii) ceases to satisfy certain definitional tests of a thrift and fails to maintain a specified qualifying-assets
ratio.
Possible New York State Legislative Changes. At the time of this filing, the New York State Department of Taxation and Finance is considering proposing
a legislative reform of the New York State corporate franchise and banking corporation tax rules. The proposed reform package that the New York State Department of Taxation and Finance has publicly released would substantially alter how the Company and the Bank are taxed in New York State and may materially increase their combined effective New York State tax rate. In particular, the current proposal by the New York State Department of Taxation and Finance would eliminate the 60% dividends-received
deduction for dividends the Bank receives from BFS REIT, Inc. as described above under “State and Local Taxation – New York State Taxation”, which would increase the portion of those dividends subject to New York State tax. Also, as described above under “State and Local Taxation – Bad Debt Reserves”, the current proposal may also require the Bank to utilize a different bad debt reserve method than the method it is currently using, which may result in an increase
in the Bank’s New York State taxes. More specifically, the proposal would re-couple New York State’s treatment of bad debt reserves and deductions with the Federal tax treatment after the 1996 Act so that the Bank would be entitled to claim a deduction equal only to its actual loan loss experience.
It is not possible to predict whether the Department of Taxation and Finance’s proposal will be included in the New York State Governor’s Proposed Budget for 2010 (expected to be released in January 2010), whether any tax reform legislation will actually be proposed in the New York State legislature, whether any such legislation
would be enacted, how any enacted legislation would differ from the current law or the most current proposal released by the Department of Taxation and Finance, and how any such legislative changes would impact the Company and the Bank’s effective New York State tax rate. It is also uncertain at this time whether there would be any similar changes made to the New York City banking corporation tax.
SUPERVISION AND REGULATION
General
The Bank is examined and supervised by the Office of Thrift Supervision. The Bank also is regulated to a lesser extent by the Board of Governors of the Federal Reserve System, governing reserves to be maintained against deposits and other matters, and
the Federal Deposit Insurance Corporation as the insurer of deposit accounts. This regulation and supervision establishes a comprehensive framework of activities in which an institution may engage and is intended primarily for the protection of the Federal Deposit Insurance Corporation’s deposit insurance funds and depositors. Under this system of Federal regulation, financial institutions are periodically examined to ensure that they satisfy applicable standards with respect
to their capital adequacy, assets, management, earnings, liquidity and sensitivity to market interest rates. Following completion of its examination, the Federal agency critiques the institution’s operations and assigns its rating (known as an institution’s CAMELS rating). Under Federal law, an institution may not disclose its CAMELS rating to the public. The Bank also is a member of and owns stock in the Federal Home Loan Bank of New York, which is one of the 12 regional
banks in the Federal Home Loan Bank System. The Office of Thrift Supervision examines the Bank and prepares reports for the consideration of its board of directors on any operating deficiencies. The Bank’s relationship with its depositors and borrowers also is regulated to a great extent by both Federal and state laws, especially in matters concerning the ownership of deposit accounts and the form and content of the Bank’s mortgage documents.
24
Any change in these laws or regulations, whether by the Federal Deposit Insurance Corporation, Office of Thrift Supervision, Board of Governors of the Federal Reserve System or United States Congress, could have a material adverse impact on the Company
and the Bank and their operations.
Federal Banking Regulation
Business Activities. A federal savings association derives its lending and investment powers from the Home Owners’ Loan Act, as amended,
and the regulations of the Office of Thrift Supervision. Under these laws and regulations, the Bank may originate mortgage loans secured by residential and commercial real estate, commercial business and consumer loans, and it may invest in certain types of debt securities and certain other assets. Certain types of lending, such as commercial and consumer loans, are subject to an aggregate limit calculated as a specified percentage of the Bank’s capital assets. The Bank
also may establish subsidiaries that may engage in activities not otherwise permissible for the Bank, including real estate investment and securities and insurance brokerage.
Capital Requirements. Office of Thrift Supervision regulations require savings associations to meet three minimum capital standards: a
1.5% tangible capital ratio, a 4% leverage ratio (3% for associations receiving the highest CAMELS rating) and an 8% risk-based capital ratio. The prompt corrective action standards discussed below, in effect, establish a minimum 2% tangible capital standard.
The risk-based capital standard for savings associations requires the maintenance of Tier 1 (core) and total capital (which is defined as core capital and supplementary capital) to risk-weighted assets of at least 4% and 8%, respectively. In determining the amount of risk-weighted assets, all assets, including certain off-balance
sheet assets, are multiplied by a risk-weight factor of 0% to 100% assigned by the Office of Thrift Supervision based on the risks believed inherent in the type of asset. Core capital is defined to include common stockholders’ equity (including retained earnings), certain noncumulative perpetual preferred stock, certain accounts and deposits and related surplus and minority interests in equity accounts of consolidated subsidiaries, less goodwill,
certain credit-enhancing credit only strips, certain deferred tax assets and intangibles other than certain servicing assets and credit card relationships. The components of supplementary capital currently include cumulative preferred stock, long-term perpetual preferred stock, mandatory convertible securities, subordinated debt and intermediate preferred stock, the allowance for loan and lease losses limited to a maximum of 1.25% of risk-weighted assets and up to 45% of net unrealized gains
on available-for-sale equity securities with readily determinable fair market values. Overall, the amount of supplementary capital included as part of total capital cannot exceed 100% of core capital.
At September 30, 2009, the Bank’s capital exceeded all applicable requirements.
Loans to One Borrower. A federal savings association
generally may not make a loan or extend credit to a single or related group of borrowers in excess of 15% of unimpaired capital and surplus. An additional amount may be loaned, equal to 10% of unimpaired capital and surplus, if the loan is secured by readily marketable collateral, which generally does not include real estate. As of September 30, 2009, the Bank was in compliance with the loans-to-one borrower limitations.
Qualified Thrift Lender Test. As a federal savings
association, the Bank is subject to a qualified thrift lender, or “QTL,” test. Under the QTL test, the Bank must maintain at least 65% of its “portfolio assets” in “qualified thrift investments” in at least nine months of the most recent 12-month period. “Portfolio assets” generally means total assets of a savings institution, less the sum of specified liquid assets up to 20% of total assets, goodwill and other intangible assets, and the value
of property used in the conduct of the savings association’s business.
“Qualified thrift investments” includes various types of loans made for residential and housing purposes, investments related to those purposes, including certain mortgage-backed and related securities, and loans for personal, family, household and certain other purposes up to a limit of 20% of portfolio assets. “Qualified
thrift investments” also include 100% of an institution’s credit card loans, education loans and small business loans. The Bank also may satisfy the QTL test by qualifying as a “domestic building and loan association” as defined in the Internal Revenue Code.
25
A savings association that fails the qualified thrift lender test must either convert to a commercial bank charter or operate under specified restrictions. At September 30, 2009, the Bank maintained substantially all of its portfolio assets in qualified thrift investments.
Capital Distributions. Office of Thrift Supervision
regulations govern capital distributions by a federal savings association, which include cash dividends, stock repurchases and other transactions charged to the capital account. A savings association must file an application for approval of a capital distribution if:
|
● |
the total capital distributions for the applicable calendar year exceed the sum of the association’s net income for that year to date plus the association’s retained net income for the preceding two years; | |
|
● |
the association would not be at least adequately capitalized following the distribution; | |
|
● |
the distribution would violate any applicable statute, regulation, agreement or Office of Thrift Supervision-imposed condition; or | |
|
● |
the association is not eligible for expedited treatment of its filings. |
Even if an application is not otherwise required, every savings association that is a subsidiary of a holding company must still file a notice with the Office of Thrift Supervision at least 30 days before the board of directors declares a dividend or approves a capital distribution.
The Office of Thrift Supervision may disapprove a notice or application if:
|
● |
the association would be undercapitalized following the distribution; | |
|
● |
the proposed capital distribution raises safety and soundness concerns; or | |
|
● |
the capital distribution would violate a prohibition contained in any statute, regulation or agreement. |
In addition, the Federal Deposit Insurance Act provides that an insured depository institution shall not make any capital distribution, if after making the distribution the institution would be undercapitalized.
Liquidity. A federal savings association is required to maintain a sufficient amount of liquid assets to ensure its safe and sound operation.
Community Reinvestment Act and Fair Lending Laws. All savings associations have a responsibility under the Community Reinvestment Act and related
regulations of the Office of Thrift Supervision to help meet the credit needs of their communities, including low- and moderate-income neighborhoods. In connection with its examination of a federal savings association, the Office of Thrift Supervision is required to assess the association’s record of compliance with the Community Reinvestment Act. In addition, the Equal Credit Opportunity Act and the Fair Housing Act prohibit lenders from discriminating in their lending practices on
the basis of characteristics specified in those statutes. An association’s failure to comply with the provisions of the Community Reinvestment Act could result in denial of certain corporate applications, such as branches or mergers, or restrictions on its activities. The failure to comply with the Equal Credit Opportunity Act and the Fair Housing Act could result in enforcement actions by the Office of Thrift Supervision, as well as other Federal regulatory agencies and the Department
of Justice. The Bank received a satisfactory Community Reinvestment Act rating in its most recent Federal examination.
Transactions with Related Parties. A federal savings association’s authority to engage in transactions with its “affiliates”
is limited by Sections 23A and 23B of the Federal Reserve Act (the “FRA”) and its implementing regulations. The term “affiliates” for these purposes generally means any company that controls, is controlled by, or is under common control with an institution. The Company is an affiliate of the Bank. In general, transactions with affiliates must be on terms that are as favorable to the association as comparable transactions with non-affiliates. In
addition, certain types of these transactions are restricted to an aggregate percentage of the association’s capital. Collateral in specified amounts must usually be provided by affiliates in order to receive loans from the association. In addition, Office of Thrift Supervision regulations prohibit a savings association from lending to any of its affiliates that are engaged in activities that are not permissible for bank holding companies and from purchasing the securities of any affiliate,
other than the shares of a subsidiary.
26
The Bank’s authority to extend credit to its directors, executive officers and 10% shareholders (“Insiders”), as well as to entities controlled by insiders, is currently governed by the requirements of Sections 22(g) and 22(h) of the FRA and Regulation O of the Board of Governors of the Federal Reserve System. Among
other things, these provisions require that extensions of credit to Insiders (i) be made on terms that are substantially the same as, and follow credit underwriting procedures that are not less stringent than, those prevailing for comparable transactions with unaffiliated persons and that do not involve more than the normal risk of repayment or present other unfavorable features, and (ii) not exceed certain limitations on the amount of credit extended to Insiders, individually and in the aggregate, which limits
are based, in part, on the amount of the Bank’s capital. In addition, the Bank’s board of directors must approve extensions of credit in excess of certain limits.
Enforcement. The Office of Thrift Supervision has primary enforcement responsibility over federal savings institutions and has the authority to
bring enforcement action against all “institution-affiliated parties,” including stockholders, attorneys, appraisers and accountants who knowingly or recklessly participate in wrongful action likely to have an adverse effect on an insured institution. Formal enforcement action may range from the issuance of a capital directive or cease and desist order to removal of officers and/or directors of the institution, receivership, conservatorship or the termination of deposit insurance. Civil
penalties cover a wide range of violations and actions, and range up to $25,000 per day, unless a finding of reckless disregard is made, in which case penalties may be as high as $1 million per day. The Federal Deposit Insurance Corporation also has the authority to recommend to the Director of the Office of Thrift Supervision that enforcement action be taken with respect to a particular savings institution. If the Director does not take action, the Federal Deposit Insurance Corporation
has authority to take action under specified circumstances.
Standards for Safety and Soundness. Federal law requires each federal banking agency to prescribe certain standards for all insured depository
institutions. These standards relate to, among other things, internal controls, information systems and audit systems, loan documentation, credit underwriting, interest rate risk exposure, asset growth, compensation, and other operational and managerial standards as the agency deems appropriate. The federal banking agencies adopted Interagency Guidelines Establishing Standards for Safety and Soundness to implement the safety and soundness standards required under Federal law. The
guidelines set forth the safety and soundness standards that the federal banking agencies use to identify and address problems at insured depository institutions before capital becomes impaired. The guidelines address internal controls and information systems, internal audit systems, credit underwriting, loan documentation, interest rate risk exposure, asset growth, compensation, fees and benefits. If the appropriate federal banking agency determines that an institution fails to meet any
standard prescribed by the guidelines, the agency may require the institution to submit to the agency an acceptable plan to achieve compliance with the standard. If an institution fails to meet these standards, the appropriate federal banking agency may require the institution to submit a compliance plan.
Prompt Corrective Action Regulations. Under
the prompt corrective action regulations, the Office of Thrift Supervision is required and authorized to take supervisory actions against undercapitalized savings associations. For this purpose, a savings association is placed in one of the following five categories based on the association’s capital:
|
● |
well-capitalized (at least 5% leverage capital, 6% Tier 1 risk-based capital and 10% total risk-based capital); | |
|
● |
adequately capitalized (at least 4% leverage capital (or at least 3% for associations receiving the highest CAMELS rating) 4% Tier 1 risk-based capital and 8% total risk-based capital); | |
|
● |
undercapitalized (less than 8% total risk-based capital, 4% Tier 1 risk-based capital or 3% leverage capital (or less than 3% for associations receiving the highest CAMELS rating)); | |
|
● |
significantly undercapitalized (less than 6% total risk-based capital, 3% Tier 1 risk-based capital or 3% leverage capital); and | |
|
● |
critically undercapitalized (less than 2% tangible capital). |
27
Generally, the banking regulator is required to appoint a receiver or conservator for an association that is “critically undercapitalized” within specific time frames. The regulations also provide that a capital restoration plan must be filed with the Office of Thrift Supervision within 45 days of the date an association
receives notice that it is “undercapitalized,” “significantly undercapitalized” or “critically undercapitalized,” the performance of which must be guaranteed by any company controlling the association up to specified limits. In addition, numerous mandatory supervisory actions become immediately applicable to the association, including, but not limited to, restrictions on growth, investment activities, capital distributions and affiliate transactions. The
Office of Thrift Supervision may also take any one of a number of discretionary supervisory actions against undercapitalized associations, including the issuance of a capital directive and the replacement of senior executive officers and directors.
At September 30, 2009, the Bank met the criteria for being considered “well-capitalized.”
Insurance of Deposit Accounts. Deposit accounts
in the Bank are insured by the Federal Deposit Insurance Corporation, generally up to a maximum of $100,000 per separately insured depositor and up to a maximum of $250,000 for self-directed retirement accounts. However, pursuant to its statutory authority, the Board of Directors of the Federal Deposit Insurance Corporation increased the deposit insurance available on deposit accounts to $250,000 effective until December 31, 2013.
The Bank’s deposits are subject to Federal Deposit Insurance Corporation (“FDIC”) deposit insurance assessments. On March 4, 2009, the FDIC revised its
risk-based system for determining deposit insurance assessments. This assessment is based on the risk category of the institution and currently ranges from 7 to 77.5 basis points of the institution’s deposits. To determine the total base assessment
rate, the FDIC first establishes an institution’s initial base assessment rate. This initial base assessment rate ranges, depending on the risk category of the institution, from 12 to 45 basis points. The FDIC then adjusts the initial base assessment (higher or lower) to obtain the total base assessment rate. The adjustments to the initial base assessment rate are based upon an institution’s levels of unsecured debt, secured liabilities, and brokered deposits. The
total base assessment rate would range from 7 to 77.5 basis points of the institution’s deposits.
On May 22, 2009, the FDIC adopted a final rule imposing a five basis point special assessment on each insured depository institution’s assets minus Tier 1 capital as of June 30, 2009. As a result, our expense for deposit insurance for the fiscal year ended September 30, 2009 includes approximately $0.2 million for this emergency
assessment which was levied as of June 30, 2009 and collected on September 30, 2009. The May 22nd final rule also permitted the FDIC to impose up to two additional special assessments of up to five basis points later in 2009 if necessary to maintain public confidence in federal deposit insurance. However, on September 30, 2009, the FDIC filed a notice of proposed rulemaking, which was adopted as a final rule on November 12, 2009 and amended its assessment regulations to require insured
institutions to prepay, on December 30, 2009, their estimated quarterly risk-based assessments for the fourth quarter of calendar 2009 and for all of the calendar years 2010, 2011 and 2012. The amount of the prepayment generally will be determined based upon an institution’s assessment rate in effect on September 30, 2009 and will reflect a 5% annualized growth factor applied to the institution’s assessment base as well as an assessment rate increase of three cents per $100 of deposits
effective January 1, 2011. The Bank’s prepayment amount is $2.3 million.
In addition to the FDIC assessments, the Financing Corporation (“FICO”) is authorized to impose and collect, with the approval of the FDIC, assessments for anticipated payments, issuance costs and custodial fees on bonds issued by FICO in the 1980s to recapitalize
the former Federal Savings and Loan Insurance Corporation. The bonds issued by FICO are due to mature in 2017 through 2019. For the quarter ended September 30, 2009, the annualized FICO assessment was equal to 1.06 basis points for each $100 in domestic deposits maintained at an institution. Assessments related to the FICO bond obligations are not subject to the prepayment requirements.
The Bank has opted in to the Federal Deposit Insurance Corporation’s Transaction Guarantee Program and is subject to a 0.10% surcharge applied to non-interest bearing transaction deposit
account balances in excess of $250,000, which surcharge has been added to the institution’s existing risk-based deposit insurance assessments. The Bank has elected to continue in the Transaction Guarantee Program through
June 30, 2010.
28
Prohibitions Against Tying Arrangements. Federal
savings associations are prohibited, subject to some exceptions, from extending credit to or offering any other service, or fixing or varying the consideration for an extension of credit or service, on the condition that the customer obtain some additional service from the institution or its affiliates or not obtain services of a competitor of the institution.
Federal Home Loan Bank System. The Bank is a member of the Federal Home Loan Bank System, which consists of 12 regional Federal Home Loan Banks. The
Federal Home Loan Bank System provides a central credit facility primarily for member institutions. As a member of the Federal Home Loan Bank of New York, the Bank is required to acquire and hold shares of capital stock in the Federal Home Loan Bank in an amount equal to the greater of (i) $1,000 or (ii) 0.20% of the aggregate principal amount of its unpaid residential mortgage loans and similar obligations, also referred
to as Mortgage Related Assets (“MRA”), at the beginning of each year, plus 4.50% of the total dollar amount of its Advances (“borrowings”) and Mortgage Partnership Finance (“MPF”) transactions from the Federal Home Loan Bank, also referred to as the activity-based capital requirement, whichever is greater. During the year the activity-based capital requirement will increase or decrease depending on our activity with the Federal Home Loan Bank of New York. As
of September 30, 2009, the Bank was in compliance with this requirement.
Federal Reserve System
The Federal Reserve Board regulations require savings associations to maintain non-interest-earning reserves against their transaction accounts, such as negotiable orders of withdrawal (NOW) and regular checking accounts. At September 30, 2009, the Bank was in compliance with these reserve requirements.
The USA PATRIOT Act
The USA PATRIOT Act of 2001 gave the federal government new powers to address terrorist threats through enhanced domestic security measures, expanded surveillance powers, increased information sharing and broadened anti-money laundering requirements. The USA PATRIOT Act also required the federal banking agencies to take into
consideration the effectiveness of controls designed to combat money laundering activities in determining whether to approve a merger or other acquisition application of a member institution. Accordingly, if we engage in a merger or other acquisition, our controls designed to combat money laundering would be considered as part of the application process. We have established policies, procedures and systems designed to comply with these regulations.
Sarbanes-Oxley Act of 2002
The Sarbanes-Oxley Act of 2002 was enacted in response to public concerns regarding corporate accountability in connection with certain accounting scandals. The stated goals of the Sarbanes-Oxley Act are to increase corporate responsibility, to provide for enhanced penalties for accounting and auditing improprieties at publicly
traded companies, and to protect investors by improving the accuracy and reliability of corporate disclosures pursuant to the securities laws. The Sarbanes-Oxley Act generally applies to all companies that file or are required to file periodic reports with the SEC, under the Securities Exchange Act of 1934.
The Sarbanes-Oxley Act includes specific additional disclosure requirements, requires the SEC and national securities exchanges to adopt extensive additional disclosure, corporate governance and other related rules, and mandates further studies of certain issues by the SEC. The Sarbanes-Oxley Act represents significant Federal
involvement in matters traditionally left to state regulatory systems, such as the regulation of the accounting profession, and to state corporate law, such as the relationship between a board of directors and management and between a board of directors and its committees.
We have incurred and anticipate that we will continue to incur additional expense in complying with the provisions of the Sarbanes-Oxley Act and the regulations that have
been promulgated to implement the Sarbanes-Oxley Act, particularly those regulations relating to the establishment of internal controls over financial reporting.
29
Holding Company Regulation
General. BFS Bancorp,
MHC and the Company are non-diversified savings and loan holding companies within the meaning of the Home Owners’ Loan Act. Accordingly, BFS Bancorp, MHC and the Company are registered with the Office of Thrift Supervision and are subject to Office of Thrift Supervision regulations, examinations, supervision and reporting requirements. In addition, the Office of Thrift Supervision has enforcement authority over the Company and BFS Bancorp, MHC, and their subsidiaries. Among
other things, this authority permits the Office of Thrift Supervision to restrict or prohibit activities that are determined to be a serious risk to the subsidiary savings institution. As federal corporations, the Company and BFS Bancorp, MHC are generally not subject to state business organization laws.
Permitted Activities. Pursuant to Section 10(o) of the Home Owners’ Loan Act and Office of Thrift Supervision regulations and policy, a mutual
holding company and a federally chartered mid-tier holding company such as the Company may engage in the following activities: (i) investing in the stock of a savings association; (ii) acquiring a mutual association through the merger of the association into a savings association subsidiary of the holding company or an interim savings association subsidiary of the holding company; (iii) merging with or acquiring another holding company, one of whose subsidiaries is a savings association; (iv) investing in a corporation,
the capital stock of which is available for purchase by a savings association under Federal law or under the law of any state where the subsidiary savings association or associations share their home offices; (v) furnishing or performing management services for a savings association subsidiary of the company; (vi) holding, managing or liquidating assets owned or acquired from a savings subsidiary of the company; (vii) holding or managing properties used or occupied by a savings association subsidiary of the company;
(viii) acting as trustee under deeds of trust; (ix) any other activity (A) that the Federal Reserve Board, by regulation, has determined to be permissible for bank holding companies under Section 4(c) of the Bank Holding Company Act of 1956, unless the Director, by regulation, prohibits or limits that activity for savings and loan holding companies; or (B) in which multiple savings and loan holding companies were authorized (by regulation) to directly engage on March 5, 1987; (x) any activity permissible for
financial holding companies under Section 4(k) of the Bank Holding Company Act, including securities and insurance underwriting; and (xi) purchasing, holding, or disposing of stock acquired in connection with a qualified stock issuance if the purchase of the stock by the savings and loan holding company is approved by the Director of the Office of Thrift Supervision. If a mutual holding company acquires or merges with another holding company, the holding company acquired or the holding company resulting
from the merger or acquisition may only invest in assets and engage in activities listed in (i) through (xi) above, and has a period of two years to cease any nonconforming activities and divest of any nonconforming investments.
The Home Owners’ Loan Act prohibits a savings and loan holding company, including the Company and BFS Bancorp, MHC, directly or indirectly, or through one or more subsidiaries, from acquiring more than 5% of another savings institution or holding company thereof, without prior written approval of the Office of Thrift Supervision. It
also prohibits the acquisition or retention of, with certain exceptions, more than 5% of a non-subsidiary company engaged in activities other than those permitted by the Home Owners’ Loan Act; or acquiring or retaining control of an institution that is not federally insured. In evaluating applications by holding companies to acquire savings institutions, the Office of Thrift Supervision must consider the financial and managerial resources, future prospects of the company and institution involved,
the effect of the acquisition on the risk to the insurance fund, the convenience and needs of the community and competitive factors.
The Office of Thrift Supervision is prohibited from approving any acquisition that would result in a multiple savings and loan holding company controlling savings institutions in more than one state, subject to two exceptions: (i) the approval of interstate supervisory acquisitions by savings and loan holding companies, and
(ii) the acquisition of a savings institution in another state if the laws of the state of the target savings institution specifically permit those acquisitions. The states vary in the extent to which they permit interstate savings and loan holding company acquisitions.
30
Waivers of Dividends by BFS Bancorp, MHC. The Office of Thrift Supervision regulations require BFS Bancorp, MHC to notify the Office of Thrift
Supervision of any proposed waiver of its receipt of dividends from the Company. The Office of Thrift Supervision reviews dividend waiver notices on a case-by-case basis, and, in general, does not object to any waiver if: (i) the mutual holding company’s board of directors determines that the waiver is consistent with the directors’ fiduciary duties to the mutual holding company’s members; and (ii) the waiver would not be detrimental to the safe and sound operations of
the savings association. If the Company pays any dividends, we anticipate that BFS Bancorp, MHC would waive the receipt of any dividends paid by the Company. From February 2007 to September 30, 2009, the Company has waived dividends of $7.3 million. For the current fiscal year, the Company has waived dividends of $3.7 million. Under Office of Thrift Supervision regulations, our public stockholders would not be diluted because of any dividends waived by BFS Bancorp, MHC (and waived
dividends would not be considered in determining an appropriate exchange ratio) in the event BFS Bancorp, MHC converts to stock form.
Conversion of BFS Bancorp, MHC to Stock Form. The Office of Thrift Supervision regulations permit BFS Bancorp, MHC to convert from the mutual form
of organization to the capital stock form of organization (a “Conversion Transaction”). There can be no assurance when, if ever, a Conversion Transaction will occur, and the board of directors has no current intention or plan to undertake a Conversion Transaction. In a Conversion Transaction, a new holding company would be formed as the successor to the Company (the “New Holding Company”), BFS Bancorp, MHC’s corporate existence would end, and certain depositors
of the Bank would receive the right to subscribe for additional shares of the New Holding Company. In a Conversion Transaction, each share of common stock held by stockholders other than BFS Bancorp, MHC (“Minority Stockholders”) would be automatically converted into a number of shares of common stock of the New Holding Company determined pursuant to an exchange ratio that ensures that Minority Stockholders own the same percentage of common stock in the New Holding Company as they owned
in the Company immediately prior to the Conversion Transaction. Under Office of Thrift Supervision regulations, Minority Stockholders would not be diluted because of any dividends waived by BFS Bancorp, MHC (and waived dividends would not be considered in determining an appropriate exchange ratio), in the event BFS Bancorp, MHC converts to stock form. The total number of shares held by Minority Stockholders after a Conversion Transaction also would be increased by any purchases by Minority
Stockholders in the stock offering conducted as part of the Conversion Transaction.
Emergency Economic Stabilization Act of 2008
In response to recent unprecedented market turmoil, the Emergency Economic Stabilization Act (“EESA”) was enacted on October 3, 2008. EESA authorizes the Secretary
of the Treasury to purchase up to $700 billion in troubled assets from financial institutions under the Troubled Asset Relief Program (“TARP”). EESA and subsequent regulations increase the maximum deposit insurance amount up to $250,000 until December 31, 2013 and remove the statutory limits on the FDIC’s ability to borrow from the Treasury during this period. The FDIC may not take the temporary
increase in deposit insurance coverage into account when setting assessments. Under EESA certain financial institutions will receive ordinary income or loss on the sale or exchange
of preferred stock of the Federal National Mortgage Association or Federal Home Loan Mortgage Corporation as an ordinary loss for U.S. Federal income tax purposes.
Pursuant to his authority under EESA, the Secretary of the Treasury created the TARP Capital Purchase Program under which the Treasury Department allocated $250 billion to purchase senior
preferred stock of U.S. banks and savings associations or their holding companies. Qualifying financial institutions may issue senior preferred stock with a value equal to not less than 1% of risk-weighted assets and not more than the lesser of $25 billion or 3% of risk-weighted assets. The Company did not participate in the Capital Purchase Program.
Federal Securities Laws
The Company filed with the SEC a registration statement under the Securities Act of 1933 for the registration of the shares of common stock to be issued pursuant to the offering. The Company’s common stock is registered with the SEC under the Securities Exchange Act of 1934. The Company will continue to be subject
to the information, proxy solicitation, insider trading restrictions and other requirements under the Securities Exchange Act of 1934.
31
The registration under the Securities Act of 1933 of shares of common stock to be issued in the offering does not cover the resale of those shares. Shares of common stock purchased by persons who are not affiliates of the Company may be resold without registration. Shares purchased by an affiliate of the Company will
be subject to the resale restrictions of Rule 144 under the Securities Act of 1933. If the Company meets the current public information requirements of Rule 144 under the Securities Act of 1933, each affiliate of the Company that complies with the other conditions of Rule 144, including those that require the affiliate’s sale to be aggregated with those of other persons, would be able to sell in the public market, without registration, a number of shares not to exceed, in any three-month period,
the greater of 1% of the outstanding shares of the Company, or the average weekly volume of trading in the shares during the preceding four calendar weeks. In the future, the Company may permit affiliates to have their shares registered for sale under the Securities Act of 1933.
Item 1A. Risk
Factors
If Economic Conditions Deteriorate, Particularly in the Metropolitan New York Area, Our Results of Operations and Financial Condition Could Be Adversely Affected as Borrowers’ Ability to Repay Loans Declines and the Value of the Collateral Securing Our Loans Decreases.
Our financial results may be adversely affected by changes in prevailing economic conditions, particularly in the metropolitan New York area, including decreases in real estate values, changes in interest rates which may cause a decrease in interest rate spreads, adverse employment conditions, the monetary and fiscal policies of the Federal
government and other significant external events. At September 30, 2009, loans secured by real estate represented nearly all of our total loans, with substantially all of these loans being made in the New York metropolitan area. Decreases in local real estate values would adversely affect the value of property used as collateral for our loans. Adverse changes in the economy also may have a negative effect on the ability of our borrowers to make timely repayments of their loans,
which would have an adverse impact on our earnings.
The Current Economic Downturn Coupled With Turmoil and Uncertainty in the Financial Markets May Adversely Impact Our Earnings and Our Ability to Successfully Execute Our Business Plan.
The current economic downturn may adversely impact the financial condition of the households and businesses comprising our loan customers. Such a deteriorating financial condition could arise from loss of employment or business revenue exacerbated by a reduction in the value of real estate collateralizing our customers’
loans. As a consequence, we may experience an increase in nonperforming loans that will negatively impact earnings through reduced collections of interest income coupled with possible increases in the provision for loan losses and associated charge offs. Additionally, our ability to originate new loans in accordance with our business plan goals and objectives may be diminished as a result of these same factors.
Commercial Real Estate Loan Originations Have Increased, Increasing the Risk that Some of Our Loans Will Not Be Paid.
Our lending in commercial real estate, construction and land has expanded during the previous five years. Lending in these sectors has increased as a percentage of our total loan portfolio from 48.5% at September 30, 2005 to 60.6% at September 30, 2009. Lending in these sectors generally exposes a lender to greater
credit risk than loans secured by residential lending. At September 30, 2009, we had eight loans for an aggregate of $22.1 million in non-performing status compared to two loans for an aggregate of $2.0 million representing two loans in non-performing status at September 30, 2008. In addition, our multi-family, commercial real estate and construction loan portfolio is not as seasoned as the loan portfolio of some of our competitors. If the local real estate market or economy continues
to weaken, we may continue to experience higher levels of non-performing loans. The Bank agreed with the OTS that, other than contractual commitments entered into prior to December 3, 2009, the Bank will not originate any commercial real estate loans without prior OTS approval.
If Our Allowance for Loan Losses is Not Sufficient to Cover Actual Loan Losses, Our Earnings Could Decrease.
We make various assumptions and judgments about the collectability of our loan portfolio, including the creditworthiness of our borrowers and the value of the real estate and other assets serving as collateral for the repayment of many of our loans. In determining the amount of the allowance for loan losses, we review our loans
and our loss and delinquency experience, and we evaluate economic conditions. If our assumptions are incorrect, our allowance for loan losses may not be sufficient to cover losses inherent in our loan portfolio, resulting in additions to our allowance. Material additions to our allowance would materially decrease our net income.
32
In addition, bank regulators periodically review our allowance for loan losses and may require us to increase our provision for loan losses or recognize further loan charge-offs. Any increase in our allowance for loan losses or loan charge-offs as required by these regulatory authorities might have a material adverse effect
on our financial condition and results of operations.
Higher FDIC Deposit Insurance Premiums and Assessments Could Adversely Affect Our Financial Condition.
FDIC insurance premiums have increased substantially in 2009, and we may have to pay significantly higher FDIC premiums in the future. Market developments have significantly depleted the insurance fund of the FDIC and reduced the ratio of reserves to insured deposits. The FDIC adopted a revised risk-based deposit insurance assessment schedule
on February 27, 2009, which raised regular deposit insurance premiums. On May 22, 2009, the FDIC also implemented a five basis point special assessment of each insured depository institution’s total assets minus Tier 1 capital as of June 30, 2009, but no more than ten basis points times the institution’s assessment base for the second quarter of 2009, collected by the FDIC on September 30, 2009. The amount of this special assessment was $0.2 million. Additional special assessments may be imposed by
the FDIC for future quarters at the same or higher levels.
In addition, the FDIC recently adopted a rule that would require insured depository institutions to prepay their estimated quarterly risk-based assessments for the fourth quarter of 2009 and for all of 2010, 2011 and 2012. The prepaid assessments collected on December 30, 2009 were $2.3 million, all of which was recorded as a prepaid expense
(an asset) as of December 30, 2009. As of December 31, 2009 and each quarter thereafter, we would record an expense for our regular quarterly assessment for the quarter and an offsetting credit to the prepaid assessment until the asset is exhausted.
These changes may cause the premiums charged by the FDIC to increase and could significantly increase our non-interest expense in 2009 and in future periods. The prepayment of our FDIC assessments also may temporarily reduce our liquidity.
We Operate in a Highly Regulated Environment and May Be Adversely Affected by Changes in Laws and Regulations.
We are subject to extensive regulation, supervision and examination by the Office of Thrift Supervision, our chartering authority, and by the Federal Deposit Insurance Corporation, as insurer of deposits. This regulation and supervision governs the activities in which a financial institution and its holding company may engage
and are intended primarily for the protection of the insurance fund and depositors. Regulatory authorities have extensive discretion in connection with their supervisory and enforcement activities, including the imposition of restrictions on the operation of an institution, the classification of assets by the institution and the adequacy of an institution’s allowance for loan losses. Any change in this regulation and oversight, whether in the form of regulatory policy, regulations,
or legislation, may have a material impact on our operations.
An Increase in Interest Rates is Expected to Adversely Affect Our Earnings.
Our earnings largely depend on our net interest income, which could be negatively affected by changes in interest rates. Net interest income is the difference between the interest income we earn on our interest-earning assets, such as mortgage loans and investment securities, and the interest expense we pay on our interest-bearing
liabilities, such as deposits and borrowings.
The rates we earn on our assets are generally fixed for a contractual period of time. We, like many savings institutions, have liabilities that generally have shorter contractual maturities than our assets or no contractual maturities, such as savings and money market deposits. This imbalance can create significant earnings volatility
because market interest rates change over time. In addition, short-term and long-term interest rates do not necessarily change at the same time or at the same rate.
33
In a period of rising interest rates, the interest income earned on our assets may not increase as rapidly as the interest paid on our liabilities. We are vulnerable to volatility in our earnings as a result of an increase in interest rates because the majority of our interest-earning assets are long-term, fixed-rate assets. In
an increasing interest rate environment, our cost of funds is expected to increase more rapidly than the interest earned on our loan portfolio and securities portfolio because our primary source of funds is deposits with generally shorter maturities than the maturities on our loans and investment securities. This could cause our net interest rate spread to compress because the increase in interest income we would earn on our securities and loan portfolios may be less than the increase in the interest
expense we would pay on our deposits and borrowings. In addition, the expected duration of our mortgage-backed securities may increase during a rising interest rate environment, thereby lengthening the period during which they would reprice at higher rates.
In a period of decreasing interest rates, prepayments of loans and mortgage-backed securities generally will increase as borrowers refinance their debt in order to reduce their borrowing costs. In a decreasing rate environment we are generally not able to reinvest the proceeds of loan and securities prepayments at rates that
are comparable to the rates we earned on the prepaid loans or securities. A decreasing interest rate environment would result in a decrease in rates we pay on deposits and borrowings, but the decrease in the cost of our funds may not be as great as the decrease in the yields on our mortgage-backed securities and loan portfolios. This could cause a narrowing of our net interest rate spread and could cause a decrease in our earnings. We are further exposed to interest rate risk due to the
large portion of our total deposits that can reprice at any time.
The Bank monitors its interest rate sensitivity through the use of an asset/liability management model that estimates the change in its net portfolio value (defined as the current market value of assets, less the current market value of liabilities, plus or minus the current value of off-balance sheet items) in the event of a range of
assumed changes in market interest rates. Our net portfolio value analysis, as calculated by the Office of Thrift Supervision using information as of September 30, 2009, indicates that in the event of an immediate and permanent 2.0% increase in interest rates, our net portfolio value would be expected to decrease by 1.0%.
Strong Competition Within Our Market Area May Limit Our Growth and Profitability.
Competition in the banking and financial services industry is intense. In our market area, we compete with commercial banks, savings institutions, mortgage brokerage firms, credit unions, finance companies, mutual funds, insurance companies, and brokerage and investment banking firms operating locally and elsewhere. Most
of these competitors have substantially greater resources and lending limits than we have and offer certain services that we do not or cannot provide. In addition, our competition recently has been offering loans with lower fixed rates and loans on more attractive terms than the Bank has been willing to offer. Our profitability depends upon our continued ability to successfully compete in our market area. The greater resources and broader range of deposit and loan products offered
by our competition may limit our ability to increase our interest-earning assets and profitability.
Persons Who Own Our Stock Own a Minority of Brooklyn Federal Bancorp, Inc.’s Common Stock and Will Not Be Able To Exercise Voting Control Over Most Matters Put To a Vote of Stockholders.
Public stockholders own a minority of the outstanding shares of the Company’s common stock. As a result, stockholders other than BFS Bancorp, MHC will not be able to
exercise voting control over most matters put to a vote of stockholders. BFS Bancorp, MHC owns a majority of the Company’s common stock and, through its board of directors, is able to exercise voting control over most matters put to a vote of stockholders. The same directors and officers who manage the Company and the Bank also manage BFS Bancorp, MHC. In addition, BFS Bancorp, MHC may exercise its voting control to prevent a sale or merger transaction in which stockholders could receive
a premium for their shares.
Our Stock Value May be Negatively Affected by Federal Regulations Restricting Takeovers and our Mutual Holding Company Structure.
Federal Regulations Restricting Takeovers. Current Office of Thrift Supervision policy prohibits the acquisition of a mutual holding company subsidiary
by any person or entity other than a mutual holding company or a mutual institution. Please see “Business—Supervision and Regulation” for a discussion of applicable Office of Thrift Supervision Regulations regarding acquisitions.
34
The Mutual Holding Company Structure May Impede Takeovers. BFS Bancorp, MHC, as the majority stockholder of the Company, is able to control the
outcome of virtually all matters presented to stockholders for their approval, including a proposal to acquire the Company. Accordingly, BFS Bancorp, MHC may prevent the sale of control or merger of the Company or its subsidiaries even if the transaction was favored by a majority of the public stockholders of the Company.
The Corporate Governance Provisions in Our Charter and Bylaws May Prevent or Impede the Holders of a Minority of Our Common Stock from Obtaining Representation on Our Board of Directors.
Provisions in our charter and bylaws may prevent or impede holders of a minority of our common stock from obtaining representation on our board of directors. For example, our board of directors is divided into three staggered classes. A staggered board makes it more difficult for stockholders to change a majority
of the directors because it generally takes at least two annual elections of directors for this to occur. Second, our charter provides that there will not be cumulative voting by stockholders for the election of our directors, which means that BFS Bancorp, MHC, as the holder of a majority of the shares eligible to be voted at a meeting of stockholders, may elect all of our directors to be elected at that meeting. Third, our bylaws contain procedures and timetables for a stockholder wanting
to make a nomination for the election of directors or a proposal for new business at a meeting of stockholders, the effect of which may be to give our management time to solicit its own proxies in an attempt to defeat any dissident slate of nominations if management thinks it is in the best interests of stockholders generally.
Possible New York State Legislative Changes May Negatively Affect the Amount of Taxes We Pay in Future Years
At the time of this filing, the New York State Department of Taxation and Finance is considering proposing a legislative reform of the New York State corporate franchise and banking corporation tax rules. The proposed reform package that the New York State Department of Taxation and Finance has publicly released would substantially
alter how the Company and the Bank are taxed in New York State and may materially increase their combined effective New York State tax rate. In particular, the current proposal by the New York State Department of Taxation and Finance would eliminate the 60% dividends-received deduction for dividends the Bank receives from BFS REIT, Inc. as described above under “Item 1. Business—State and Local Taxation – New York
State Taxation”, which would increase the portion of those dividends subject to New York State tax. Also, as described above under “Item 1. Business—State and Local Taxation – Bad Debt Reserves”, the current proposal may also require the Bank to utilize a different bad debt reserve method than the method it is currently using, which may result in an increase in the Bank’s New York State taxes. More
specifically, the proposal would re-couple New York State’s treatment of bad debt reserves and deductions with the Federal tax treatment after the 1996 Act so that the Bank would be entitled to claim a deduction equal only to its actual loan loss experience.
It is not possible to predict whether the Department of Taxation and Finance’s proposal will be included in the New York State Governor’s Proposed Budget for 2010 (expected to be released in January 2010), whether any tax reform legislation will actually be proposed in the New York State legislature, whether any such legislation
would be enacted, how any enacted legislation would differ from the current law or the most current proposal released by the Department of Taxation and Finance, and how any such legislative changes would impact the Company and the Bank’s effective New York State tax rate. It is also uncertain at this time whether there would be any similar changes made to the New York City banking corporation tax.
Item 1B. Unresolved
Staff Comments
None.
35
Item 2. Properties
Properties
The following table provides certain information with respect to our offices as of September 30, 2009:
|
|
Leased |
Year Acquired | |||
| Location |
or Owned |
or Leased | |||
|
Main Office |
Owned |
1965 | |||
|
81 Court Street |
|||||
|
Brooklyn, NY 11201 |
|||||
|
Branch Office |
Leased |
1960 | |||
|
3780 Nostrand Avenue |
|||||
|
Brooklyn, NY 11235 |
|||||
|
Branch Office |
Leased |
1973 | |||
|
1164 Wantagh Avenue |
|||||
|
Wantagh, NY 11793 |
|||||
|
Branch Office |
Leased |
1999 | |||
|
1752 Veterans Memorial Highway |
|||||
|
Islandia, NY 11749 |
|||||
|
Branch Office |
Leased |
2007 | |||
|
1174 Jericho Turnpike |
|||||
|
Commack, NY 11725 |
|||||
The net book value of our premises and equipment was approximately $2.0 million at September 30, 2009.
Item 3. Legal
Proceedings
The Company is involved in various legal actions and claims arising in the normal course of its business. In the opinion of management, these legal actions and claims are
not expected to have a material adverse impact on the Company’s financial condition and results of operations.
Item 4. Submission
of Matters to a Vote of Security Holders
No matters were submitted during the fourth quarter of the year ended September 30, 2009 to a vote of the Company’s stockholders.
36
PART II.
Item 5. Market
for Registrant’s Common Equity, Related Stockholder Matters and Issuer Purchases of Equity Securities
The Company’s common stock trades on the Nasdaq Global Market under the symbol “BFSB.” Trading in the Company’s common stock commenced on April
6, 2005.
As of September 30, 2009, there were 13,484,210 shares of Company common stock issued and 12,890,754 common shares outstanding and approximately 736 stockholders of record. Of
the total outstanding shares 9,257,500 were held by BFS Bancorp, MHC and 3,633,254 were held by other shareholders.
The table below shows the high and low closing prices reported on the Nasdaq Global Market for the Company’s common stock during the periods indicated.
| 2009 |
High |
Low |
Dividend |
||||||||||
|
Fourth Quarter (July 1, 2009 – September 30, 2009) |
$ | 14.19 | $ | 11.15 | $ | 0.10 | |||||||
|
Third Quarter (April 1, 2009 – June 30, 2009) |
$ | 12.67 | $ | 10.25 | $ | 0.10 | |||||||
|
Second Quarter (January 1, 2009 – March 31, 2009) |
$ | 14.20 | $ | 9.50 | $ | 0.10 | |||||||
|
First Quarter (October 1, 2008- December 31, 2008) |
$ | 14.99 | $ | 12.31 | $ | 0.10 | |||||||
| 2008 |
|
High |
Low |
Dividend |
|||||||||
|
Fourth Quarter (July 1, 2008 – September 30, 2008) |
$ | 15.09 | $ | 11.87 | $ | 0.10 | |||||||
|
Third Quarter (April 1, 2008 – June 30, 2008) |
$ | 13.45 | $ | 11.76 | $ | 0.07 | |||||||
|
Second Quarter (January 1, 2008 – March 31, 2008) |
$ | 13.58 | $ | 11.79 | $ | 0.07 | |||||||
|
First Quarter (October 1, 2007- December 31, 2007) |
$ | 13.83 | $ | 12.17 | $ | 0.05 | |||||||
Set forth below is information, as of September 30, 2009, regarding equity compensation plans categorized by those plans that have been approved by stockholders and those plans that have not been approved by stockholders.
|
Plan |
Number of Securities to be Issued Upon Exercise of Outstanding Options, Warrants and Rights (1) |
Weighted Average Exercise Price (2)
of Outstanding Options, Warrants
and Rights |
Number of
Securities
Remaining
Available For
Future Issuance
Under Equity Compensation
Plans (3) |
|||||||||
|
Equity compensation plans approved by stockholders |
620,525 | $ | 13.37 | 27,500 | ||||||||
|
Total |
620,525 | $ | 13.37 | 27,500 | ||||||||
|
(1) |
Consists of options to purchase 648,025 shares of common stock under the Brooklyn Federal Bancorp, Inc. 2006 Stock-Based Incentive Plan. |
|
(2) |
The weighted average exercise price reflects the weighted average exercise price of stock options awarded from the Brooklyn Federal Bancorp, Inc. 2006 Stock-Based Incentive Plan. |
|
(3) |
Consists of stock options for 27,500 shares of common stock available to be granted from the Brooklyn Federal Bancorp, Inc. 2006 Stock-Based Incentive Plan. |
37
Stock Performance Graph
Set forth hereunder is a stock performance graph comparing (a) the cumulative total return on the Common Stock between April 6, 2005 (the date the Company completed its initial public offering) and September 30, 2009, (b) the cumulative total return on stock included in the SNL Thrift Index over those periods, and (c) the cumulative
total return on stocks included in the Russell 2000 Index over those periods. Cumulative return assumes the reinvestment of dividends, and is expressed in dollars based on an assumed investment of $100.
| Brooklyn Federal Bancorp, Inc. |
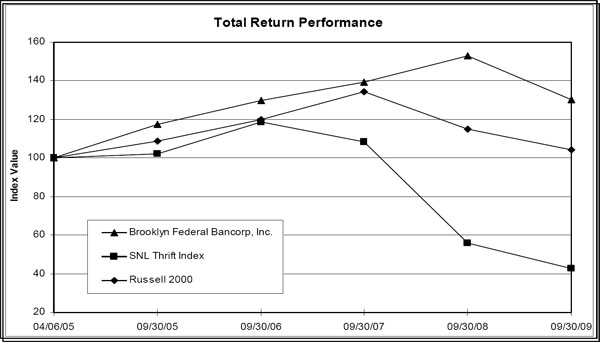
|
Period Ending |
||||||||||||||||||||||||
|
Index |
04/06/05 |
09/30/05 |
09/30/06 |
09/30/07 |
09/30/08 |
09/30/09 |
||||||||||||||||||
|
Brooklyn Federal Bancorp, Inc. |
100.00 | 117.49 | 129.65 | 139.18 | 152.93 | 130.19 | ||||||||||||||||||
|
SNL Thrift Index |
100.00 | 101.99 | 118.71 | 108.34 | 55.80 | 42.74 | ||||||||||||||||||
|
Russell 2000 |
100.00 | 108.99 | 119.81 | 134.59 | 115.10 | 104.11 | ||||||||||||||||||
Source: SNL Financial LC
38
There can be no assurance that the Company’s stock performance will continue in the future with the same or similar trend depicted in the graph. The Company will not make or endorse any predictions as to future stock performance.
When the Company pays dividends to its stockholders, it also is required to pay dividends to BFS Bancorp, MHC, unless BFS Bancorp, MHC elects to waive the receipt of dividends. We anticipate that BFS Bancorp, MHC would waive any dividends paid by the Company. Any decision to waive dividends is subject to regulatory
approval. BFS Bancorp, MHC received regulatory approval to waive dividends for the fiscal year ended September 30, 2009. Under Office of Thrift Supervision regulations, public stockholders would not be diluted for any dividends waived by BFS Bancorp, MHC in the event BFS Bancorp, MHC converts to stock form.
Dividends are payable at the sole discretion of the Company, and any dividends will depend, in part, upon receipt of dividends from the Bank, because the Company presently has no source
of income other than dividends from the Bank, earnings from the investment of offering proceeds it retained and interest on the Company’s loan to the employee stock ownership plan. During the 12 months ended September 30, 2009 we paid a quarterly dividend on common stock of $0.10 for all four quarters compared to $0.05 per common share during the first quarter of fiscal year 2008, $0.07 per common share during the second and third quarters and $0.10 per common share during the last quarter
of fiscal year 2008. Office of Thrift Supervision regulations impose limitations on “capital distributions” by savings institutions such as the Bank. The Company, however, is not subject to Office of Thrift Supervision regulatory restrictions on the payment of dividends.
The Company repurchased Common Stock in the quarter ending September 30, 2009. Through September 30, 2009 the Board of Directors of the Company approved four common stock repurchase plans. The first repurchase plan was completed in August 2007, purchasing $1.5 million or 102,370 shares at an average cost of $14.65
per share. The second repurchase plan was completed in March 2008, purchasing $2.0 million or 147,339 shares at an average cost of $13.57 per share. The third repurchase plan was completed in October 2008, purchasing $3.0 million or 238,483 shares at an average cost of $12.58 per share. The fourth plan was authorized in November 2008 and through September 30, 2009 the Company has repurchased 105,264 shares at an average cost of $11.47 per share. Stock repurchases will
be made from time to time and may be effected through open market purchases, block trades and in privately negotiated transactions. Repurchased stock will be held as treasury stock and will be available for general corporate purposes. As of September 30, 2009, 593,456 shares have been repurchased with repurchases in the quarter described in the following table:
Company Purchases of Common Stock
|
Period |
Total number of shares purchased |
Average price paid per share |
Total number of
shares purchased as part of publicly
announced plans or programs |
Approximate
dollar value of shares that may yet be purchased under the plans or programs |
||||||||||||
|
July 1, 2009 through July 31, 2009 |
900 | $ | 11.29 | 593,456 | $ | 792,423 | ||||||||||
|
August 1, 2009 through August 31, 2009 |
- | - | - | - | ||||||||||||
|
September 1, 2009 through September 30, 2009 |
- | - | - | - | ||||||||||||
|
Total |
900 | $ | 11.29 | 593,456 | $ | 792,423 | ||||||||||
39
Item 6. Selected Financial Data
The summary information presented below is derived in part from and should be read in conjunction with the consolidated financial statements of the Company presented in Item 8. On
April 5, 2005, the Bank completed its reorganization into the mutual holding company structure, and in connection therewith the Company sold 3,967,500 shares of common stock which resulted in $37.9 million of net proceeds of which $20.5 million was utilized to acquire all of the outstanding common stock of the Bank. The Company issued 9,257,500 shares of its common stock to BFS Bancorp, MHC.
|
At September 30, |
||||||||||||||||||||
|
2009 |
2008 |
2007 |
2006 |
2005 |
||||||||||||||||
|
(In thousands) |
||||||||||||||||||||
|
Selected Financial Condition Data: |
||||||||||||||||||||
|
Total assets |
$ | 521,445 | $ | 483,833 | $ | 390,434 | $ | 408,045 | $ | 340,858 | ||||||||||
|
Cash and cash equivalents |
3,472 | 5,053 | 5,398 | 4,078 | 8,384 | |||||||||||||||
|
Investments in certificates of deposit |
- | 1,397 | 3,890 | 7,160 | 9,268 | |||||||||||||||
|
Securities available-for-sale |
3,305 | 3,655 | 4,601 | 4,389 | 4,190 | |||||||||||||||
|
Securities held-to-maturity |
66,201 | 78,086 | 73,354 | 86,972 | 99,574 | |||||||||||||||
|
Loans receivable, net |
419,685 | 239,149 | 225,467 | 194,355 | 195,264 | |||||||||||||||
|
Loans held-for-sale |
- | 134,171 | 59,153 | 92,243 | 8,603 | |||||||||||||||
|
Deposits |
402,070 | 342,475 | 287,155 | 271,003 | 251,634 | |||||||||||||||
|
Borrowings |
27,300 | 44,239 | 9,271 | 49,407 | 8,107 | |||||||||||||||
|
Stockholders’ equity |
81,874 | 86,323 | 85,259 | 79,963 | 75,209 | |||||||||||||||
|
Years Ended September 30, |
||||||||||||||||||||
|
2009 |
2008 |
2007 |
2006 |
2005 |
||||||||||||||||
|
(In thousands, except per share data) |
||||||||||||||||||||
|
Selected Operating Data: |
||||||||||||||||||||
|
Interest income |
$ | 34,111 | $ | 28,314 | $ | 27,736 | $ | 22,035 | $ | 17,323 | ||||||||||
|
Interest expense |
9,810 | 10,265 | 10,703 | 7,338 | 4,896 | |||||||||||||||
|
Net interest income before provision for loan losses |
24,301 | 18,049 | 17,033 | 14,697 | 12,427 | |||||||||||||||
|
Provision for loan losses |
8,545 | 399 | 49 | 436 | 402 | |||||||||||||||
|
Net interest income after provision for loan losses |
15,756 | 17,650 | 16,984 | 14,261 | 12,025 | |||||||||||||||
|
Non-interest income (loss) |
(736 | ) | 2,703 | 3,135 | 2,336 | 2,140 | ||||||||||||||
|
Non-interest expense |
13,648 | 11,454 | 14,091 | 9,274 | 8,214 | |||||||||||||||
|
Income before income taxes |
1,372 | 8,899 | 6,028 | 7,323 | 5,951 | |||||||||||||||
|
Provision for income taxes |
85 | 3,318 | 2,181 | 2,765 | 2,171 | |||||||||||||||
|
Net income |
$ | 1,287 | $ | 5,581 | $ | 3,847 | $ | 4,558 | $ | 3,780 | ||||||||||
|
Dividends paid per common share |
$ | 0.40 | $ | 0.29 | $ | 0.10 | $ | - | $ | - | ||||||||||
40
|
At or For the Years Ended September 30, |
||||||||||||||||||||
|
2009 |
2008 |
2007 |
2006 |
2005 |
||||||||||||||||
|
Selected Financial Ratios and Other Data: |
||||||||||||||||||||
|
Performance Ratios: |
||||||||||||||||||||
|
Return on average assets |
0.25 | % | 1.30 | % | 0.96 | % | 1.25 | % | 1.16 | % | ||||||||||
|
Return on average equity |
1.47 | % | 6.49 | % | 4.61 | % | 5.91 | % | 7.09 | % | ||||||||||
|
Interest rate spread (1) |
4.32 | % | 3.67 | % | 3.55 | % | 3.52 | % | 3.52 | % | ||||||||||
|
Net interest margin (2) |
4.88 | % | 4.40 | % | 4.43 | % | 4.21 | % | 3.96 | % | ||||||||||
|
Efficiency ratio (3) |
57.92 | % | 55.19 | % | 69.87 | % | 54.45 | % | 56.39 | % | ||||||||||
|
Non-interest expense to average total assets |
2.65 | % | 2.66 | % | 3.50 | % | 2.55 | % | 2.52 | % | ||||||||||
|
Average interest-earning assets to average interest-bearing liabilities |
128.51 | % | 129.55 | % | 131.40 | % | 132.97 | % | 128.21 | % | ||||||||||
|
Asset Quality Ratios: |
||||||||||||||||||||
|
Non-performing assets as a percent of total assets |
4.23 | % | 0.42 | % | 0.17 | % | 0.07 | % | 1.03 | % | ||||||||||
|
Non-performing loans as a percent of total loans |
5.13 | % | 0.54 | % | 0.23 | % | 0.10 | % | 1.71 | % | ||||||||||
|
Allowance for loan losses as a percent of total loans |
2.50 | % | 0.59 | % | 0.63 | % | 0.61 | % | 0.64 | % | ||||||||||
|
Capital Ratios (4): |
||||||||||||||||||||
|
Total risk-based capital (to risk weighted assets) |
14.5 | % | 20.9 | % | 25.5 | % | 21.9 | % | 28.2 | % | ||||||||||
|
Tier 1 risk-based capital (to risk weighted assets) |
13.0 | % | 20.2 | % | 24.9 | % | 21.4 | % | 27.6 | % | ||||||||||
|
Tangible capital (to tangible assets) |
13.8 | % | 15.6 | % | 18.0 | % | 15.5 | % | 17.1 | % | ||||||||||
|
Tier 1 leverage (core) capital (to adjusted tangible assets) |
13.8 | % | 15.6 | % | 18.0 | % | 15.5 | % | 17.1 | % | ||||||||||
|
Equity to total assets (consolidated) |
15.7 | % | 17.8 | % | 21.8 | % | 19.6 | % | 22.1 | % | ||||||||||
|
Other Data: |
||||||||||||||||||||
|
Number of full service offices |
5 | 5 | 4 | 4 | 4 | |||||||||||||||
|
(1) |
Represents the difference between the weighted-average yield on interest-earning assets and the weighted-average cost of interest-bearing liabilities for the period. |
| (2) | Represents net interest income as a percent of average interest-earning assets for the period. |
| (3) | Represents non-interest expense divided by the sum of net interest income and non-interest income. |
| (4) | Ratios other than equity to total assets are for the Bank. |
41
Item 7. Management’s
Discussion and Analysis of Financial Condition and Results of Operations
Overview
Our results of operations depend mainly on our net interest income, which is the difference between the interest income earned on our loan and investment portfolios and interest expense paid on our deposits and borrowed funds. Results of operations are also affected by fee income from banking operations, provisions for loan losses, gains
(losses) on sales of loans and securities available-for-sale and other miscellaneous income. Our non-interest expenses consist primarily of compensation and employee benefits, office occupancy, technology, marketing, general administrative expenses and income tax expense.
Our results of operations are also significantly affected by general economic and competitive conditions, particularly with respect to changes in interest rates, government policies and actions of regulatory authorities. Future changes in applicable laws, regulations or government policies may materially affect our financial condition
and results of operations.
Critical Accounting Policies
We consider accounting policies that require management to exercise significant judgment or discretion or make significant assumptions that have, or could have, a material impact on
the carrying value of certain assets or on income, to be critical accounting policies. We consider the following to be our critical accounting policies:
Allowance for Loan Losses. The allowance for
loan losses is the estimated amount considered necessary to cover credit losses inherent in the loan portfolio at the balance sheet date. The allowance is established through the provision for loan losses that is charged against income. In determining the allowance for loan losses, management makes significant estimates and has identified this policy as one of the most critical for the Bank. The methodology for determining the allowance for loan losses is considered a critical
accounting policy by management due to the high degree of judgment involved, the subjectivity of the assumptions utilized and the potential for changes in the economic environment that could result in changes to the amount of the recorded allowance for loan losses.
As a substantial amount of our loan portfolio is collateralized by real estate, appraisals of the underlying value of property securing loans and discounted cash flow valuations of properties are critical in determining the amount of the allowance required for specific loans. Assumptions for appraisals and discounted cash flow
valuations are instrumental in determining the value of properties. Overly optimistic assumptions or negative changes to assumptions could significantly impact the valuation of a property securing a loan and the related allowance determined. The assumptions supporting appraisals and discounted cash flow valuations are carefully reviewed by management to determine that the resulting values reasonably reflect amounts realizable on the related loans.
Management performs a quarterly evaluation of the adequacy of the allowance for loan losses. Consideration is given to a variety of factors in establishing this estimate including, but not limited to, current economic conditions, delinquency statistics, geographic and industry concentrations, the adequacy of the underlying collateral,
the financial strength of the borrower, results of internal and external loan reviews and other relevant factors. This evaluation is inherently subjective as it requires material estimates that may be susceptible to significant revision based on changes in economic and real estate market conditions.
The analysis of the allowance for loan losses has two components: specific and general allocations. Specific allocations are made for loans that are determined to be impaired. Impairment is measured by determining the present value of expected future cash flows or, for collateral-dependent loans, the fair
value of the collateral adjusted for market conditions and selling expenses. The general allocation is determined by segregating the remaining loans by type of loan, risk weighting (if applicable) and payment history. We also analyze historical loss experience, delinquency trends, general economic conditions and geographic and industry concentrations. This analysis establishes factors that are applied to the loan groups to determine the amount of the general allocations. Actual
loan losses may be significantly more than the allowance for loan losses we have established which could have a material negative effect on our financial results.
42
Other-than-Temporary Impairment of Securities. We evaluate on a quarterly basis whether any securities are other-than-temporarily impaired. In
making this determination, we consider the extent and duration of the impairment, the nature and financial health of the issuer and our intent to hold or requirement to sell the securities for a period sufficient to allow for any anticipated recovery in market value. Other considerations include, without limitation, a review of the credit quality of the issuer and the existence of a guarantee or insurance, if applicable to the security. If a security is determined to be other-than-temporarily
impaired, we record an impairment loss as a charge to income for the period in which the impairment loss is determined to exist, resulting in a reduction to our earnings for that period.
The fair value of the Bank’s investment in a mutual fund that invests primarily in agency and private label mortgage-backed securities has been steadily decreasing, which has caused a corresponding decrease in the fund’s net asset value. In addition, the fund implemented a temporary prohibition on cash redemptions,
lessening the ability of the Bank to dispose of its remaining $2.8 million investment in this asset. During the year ended September 30, 2009, we concluded that this available-for-sale investment did incur an other-than-temporary impairment and the Bank charged current earnings for the impairment.
Regarding the securities held-to-maturity, which are composed completely of debt securities, an other-than-temporarily impairment loss must be fully recognized in earnings if an investor has the intent to sell the debt security or if it is more likely than not that the investor will be required to sell the debt security before recovery
of its amortized cost basis. However, even if an investor does not expect to sell a debt security, it must evaluate the expected cash flows to be received and determine if a credit loss has occurred. In the event of an other-than-temporarily impairment loss, only the amount of impairment associated with the credit loss is recognized in earnings. An other-than-temporarily impairment loss relating to factors other than credit losses are recorded in accumulated other comprehensive
loss. For the securities held-to-maturity, we concluded that part of the unrealized loss was an other-than-temporarily impairment in nature due to marketability and market interest rates and not the underlying credit quality of the issuers of the securities and did incur an other-than-temporary impairment. The Bank charged current earnings for the impairment and recorded the remaining portion of the unrealized
loss in accumulated other comprehensive loss. Additionally, we have the intent to hold these investments and it is unlikely that we will be required to sell these investments for the time necessary to recover the amortized costs. Future events that would materially change this conclusion and require a charge to operations for an impairment loss include a change in the credit quality of the issuers.
Deferred Income Taxes. We use the asset and liability method of accounting for income taxes. Under this method, deferred tax assets
and liabilities are recognized for the future tax consequences attributable to differences between the financial statement carrying amounts of existing assets and liabilities and their respective tax bases. Deferred tax assets and liabilities are measured using enacted tax rates expected to apply to taxable income in the years in which those temporary differences are expected to be recovered or settled. If current available information raises doubt as to the realization of the deferred tax
assets, a valuation allowance is established. We consider the determination of this valuation allowance to be a critical accounting policy because of the need to exercise significant judgment in evaluating the amount and timing of recognition of deferred tax liabilities and assets, including projections of future taxable income. These judgments and estimates are reviewed on a continual basis as regulatory and business factors change. A valuation allowance for deferred tax assets
may be required if the amount of taxes recoverable through loss carry-back declines, or if we project lower levels of future taxable income. Such a valuation allowance would be established through a charge to income tax expense which would adversely affect our operating results.
Business Strategy
Our business strategy is to operate as a well-capitalized and profitable community bank dedicated to providing quality customer service. Our business strategy historically has been to emphasize one- to four-family residential mortgage lending. While we will continue to engage in this type of lending, management has
decided to broaden the range of our products and services to enhance profitability, consistent with safety and soundness. In recent years, we have significantly expanded our multi-family, commercial real estate and construction lending. We have also introduced additional products and services, such as debit cards and internet banking. We cannot assure you that we will successfully implement our business strategy.
43
Highlights of our business strategy are as follows:
|
● |
Remaining a Community Oriented Institution. We were established in Brooklyn, New York in 1887, and we have been operating continuously since that time. We have been, and continue to be, committed to meeting the financial needs of the communities in which we operate, and we are dedicated
to providing quality personal service to our customers. Although historically our principal business activity has been accepting deposits from the public and using those funds to originate one- to four-family mortgage loans, in recent years we have been originating more commercial real estate loan products and a wider variety of residential real estate loan products to meet the needs of our customers. If these loans do not satisfy our criteria for retention in our loan portfolio, they generally can be sold in
the secondary market. | |
|
● |
Increasing Our Real Estate Lending Capacity. The additional capital raised in the stock offering increased our lending capacity by enabling us to originate more loans and loans with larger balances. This permits us to serve borrowers with larger lending needs and to originate larger
loans than we have originated in the past. | |
|
● |
Utilizing the Net Proceeds We Received in the Offering to Better Manage Our Interest Rate Risk and Grow Our Assets. With long-term interest rates at low levels, we have managed our interest rate risk by maintaining a portion of our assets in short-term liquid assets, such as cash
and cash equivalents, short-term investment securities and mortgage-related securities that provide significant cash flows. This strategy positioned us to reinvest our short-term liquid assets in higher yielding loans and investments. Maintaining a high level of short-term liquid assets, however, generates less interest income than would have been generated if we had invested in longer-term loans and investments. At September 30, 2009, $3.5 million, or 0.7% of our assets, was invested in cash or cash equivalents. | |
|
● |
The net proceeds from the stock offering increased our capital and provided management with greater flexibility to manage interest rate risk and increase our interest-earning assets, including our investment in longer-term, higher yielding loans and securities. | |
|
● |
Facilitate Growth Through De Novo Branching. We have established financial, geographic and other criteria to evaluate potential new branch offices in our market area. While we continue to review potential branch sites, there can be no assurance as to whether or when we will open new
offices. The Bank opened its fifth full-service office in Commack, Suffolk County, New York on April 30, 2008. | |
|
● |
Maintaining High Asset Quality. We have focused on improving and maintaining strong asset quality by following conservative underwriting criteria, and primarily originating loans secured by real estate. |
Comparison of Financial Condition At September 30, 2009 and September 30, 2008
Total Assets. Total assets increased by $37.6 million, or 7.8%, to $521.4 million at September 30, 2009 from $483.8 million at September 30, 2008. This
increase was primarily due to increases in net loans, bank owned life insurance, accrued interest receivable, and prepaid expenses and other assets offset by decreases in cash due from banks, certificates of deposit, securities, Federal Home Loan Bank of New York stock and premises and equipment, net.
Cash and Due from Banks. Cash and due from banks decreased by $1.6 million, or 31.3%, to $3.5 million at September 30, 2009 from $5.1 million at
September 30, 2008.
44
Certificates of Deposit. Investments in certificates of deposit decreased by $1.4 million, or 100%, to zero at September 30, 2009 from $1.4 million
at September 30, 2008. This decrease was due to maturities of the certificates.
Securities. Investment securities, which represent the available-for-sale and held-to-maturity portfolios, decreased $12.2 million, or 15.0%, to
$69.5 million at September 30, 2009, from $81.7 million at September 30, 2008. This decrease was primarily due to the repayments of mortgage-backed related securities, recording of an other-than-temporary impairment and repayments of other securities, offset by purchases of mortgage-backed related securities. Our holdings of mortgage-backed securities held-to-maturity and securities available-for-sale totaled $66.2 million and $3.3 million, respectively, at September 30, 2009.
Loans receivable. Loans
receivable before allowance for loan losses, which include deferred fees and loans held-for-sale increased $54.9 million, or 14.6%, to $430.4 million at September 30, 2009 from $375.5 million at September 30, 2008. Loans held-for-sale decreased by $134.2 million, or 100%, to zero at September 30, 2009 from $134.2 million at September 30, 2008 and our loans receivable portfolio increased by $189.1 million, or 78.4%, to $430.4 million at September 30, 2009 from $241.3 million at September 30, 2008. Due
to the impact of the recent economic downturn and increased tightening in the credit markets affecting the Company’s ability to sell the loans in the held-for-sale portfolio during fiscal year 2009, the Company transferred $200.5 million in loans held-for-sale to the loans receivable portfolio. These loan transfers occurred throughout the fiscal year ended September 30, 2009 and are reflected in the loans receivable portfolio balances as of September 30, 2009. As of September
30, 2009, the Company held no loans in the loans held-for-sale portfolio.
Federal Home Loan Bank of New York Stock. Federal Home Loan Bank of
New York stock decreased by $0.4 million, or 15.0%, to $2.4 million at September 30, 2009, from $2.8 million at September 30, 2008.
Bank-Owned Life Insurance. Bank-owned life insurance increased $0.4 million, or 4.2%, to $9.5 million at September 30, 2009, from $9.1 million
at September 30, 2008. This increase was primarily due to the increase in the cash surrender value of the policies.
Accrued interest receivable. Accrued interest receivable increased $0.3 million, or 13.0%, to $2.8 million at September 30, 2009, from
$2.5 million at September 30, 2008. This increase was primarily due to the increase in the loans receivable portfolio.
Premises and equipment, net. Premises and equipment decreased $0.3 million, or 11.2%, to $2.0 million at September 30, 2009, from $2.3 million
at September 30, 2008. The decrease was primarily due to the accumulated depreciation of $0.5 million offset by equipment purchases of $0.2 million.
Prepaid Expenses and Other Assets. Prepaid expenses and other assets increased $6.5 million, or 114.3%, to $12.1 million at September 30, 2009,
from $5.6 million at September 30, 2008. The increase was primarily due to $7.3 million in the net deferred tax assets caused by the increase in temporary charges for other-than-temporary impairment on investment securities and the increase in provision for loan losses.
Deposits. Deposits increased by $59.6 million, or 17.4%, to $402.1 million at September 30, 2009, from $342.5 million at September 30, 2008. The
increase was attributable to a $40.4 million increase in certificates of deposit, an increase in other interest bearing deposits of $21.4 million, offset by a decrease in non-interest bearing deposits of $2.2 million. The net deposit inflow was primarily used to fund our mortgage loan portfolio. The Bank maintains marketing and promotional efforts in its market area, including efforts to remain competitive in all of its deposit offerings.
Borrowed Funds. Borrowed funds from the Federal Home Loan Bank of New York decreased by $16.9 million, or 38.3%, to $27.3 million at September
30, 2009, from $44.2 million at September 30, 2008.
Accrued Expenses and Other Liabilities. Accrued expenses and other liabilities decreased by $0.3 million, or 4.1%, to $8.1 million at September
30, 2009 from $8.4 million at September 30, 2008. The decrease was attributable to a decrease in Supplemental Executive Retirement Plan (“SERP”) benefit of $1.1 million offset by an increase in income taxes payable of $0.7 million.
45
Stockholders’ Equity. Stockholders’ equity decreased by $4.4 million, or 5.2%, to $81.9 million at September 30, 2009, from $86.3
million at September 30, 2008. The primary reasons for the decrease were a $3.5 million net unrealized loss, net of tax, in the securities portfolio, $1.5 million in payments of dividends and $1.3 million in purchases of treasury stock pursuant to the Company’s stock repurchase plans offset by net income of $1.3 million.
Comparison of Operating Results for the Years Ended September 30, 2009 and September 30, 2008
Net Income. Net income decreased by $4.3 million, or 76.9%, to $1.3 million in fiscal year 2009 from $5.6 million in fiscal year 2008. The
primary reasons for the decrease in net income were an $8.1 million increase in provision for loan losses, a $2.2 million increase in non-interest expense and a reduction of $3.4 million in non-interest income, offset in part by an increase of $5.8 million in interest income and a reduction of $3.2 million and $0.5 million in the provision for income taxes and interest expense, respectively.
Net Interest Income Before Provision for Loan Losses. Net interest income increased by $6.3 million, or 34.6%, to $24.3 million for fiscal
year 2009 from $18.0 million for fiscal year 2008. This increase was primarily due to a $87.2 million, or 21.3%, increase in total average interest-earning assets to $497.8 million in fiscal year 2009 from $410.0 million in fiscal year 2008, offset in part by increased average interest-bearing liabilities of $70.9 million, or 22.4%, to $387.3 million in fiscal year 2009 from $316.4 million in fiscal year 2008. The Bank’s interest rate spread was 4.32% and 3.67% for the
fiscal years 2009 and 2008, respectively.
Interest Income. Interest income increased by $5.8 million, or 20.5%, to $34.1 million for fiscal year 2009 from $28.3 million for the prior fiscal
year. The increase was due to an $5.7 million increase in interest income on first mortgage and other loans and $0.3 million in interest income from mortgage-backed securities, offset by a reduction in interest income of $0.2 million from investment securities and other interest-earning assets. The yield on the mortgage loan portfolio decreased 22 basis points to 7.33% in fiscal year 2009 from 7.55% in fiscal year 2008. The yield on mortgage-backed securities increased 39 basis
points to 4.75% in fiscal year 2009 from 4.40% in fiscal year 2008. The yield on investment securities and other interest-earning assets decreased 223 basis points to 3.57% in fiscal year 2009 from 5.80% in fiscal year 2008. Average balances of interest-earning assets increased $87.2 million, or 21.3%, to $497.8 million in fiscal year 2009 from $410.0 million in fiscal year 2008. The average yield on total interest-earning assets decreased by six basis points to 6.85%
in fiscal year 2009 from 6.91% in fiscal year 2008.
Interest Expense. Interest expense decreased $0.5 million, or 4.4%, to $9.8 million for fiscal year 2009 from $10.3 million in fiscal year 2008. The
decrease in interest expense reflected a 71 basis point decrease in the cost of interest-bearing liabilities to 2.53% for fiscal year 2009 from 3.24% for fiscal year 2008 offset by a $70.9 million increase in average balances of interest-bearing liabilities. The decrease in interest expense reflected reduced market interest rates during fiscal year 2009 compared to fiscal year 2008. Interest expense on savings accounts decreased by $42,000, or 7.0%, to $557,000 for fiscal year 2009 from
$599,000 for fiscal year 2008, as the average cost on savings accounts decreased by ten basis points to 0.93% for fiscal year 2009 compared to 1.03% for fiscal year 2008. The average balance of savings accounts increased $1.7 million, or 2.9%, to $60.1 million for fiscal year 2009 from $58.4 million for fiscal year 2008. Interest expense on Money Market and NOW accounts decreased $0.3 million, or 21.5% to $1.0 million in fiscal year 2009 from $1.3 million in fiscal year 2008, as the average
cost on these deposits decreased 31 basis points to 1.96% in fiscal year 2009 from 2.27% in fiscal year 2008 and the average balances decreased $5.2 million, or 9.1%, to $52.6 million in fiscal year 2009 from $57.8 million in fiscal year 2008. Interest expense on certificates of deposit increased by $0.2 million, or 2.3%, to $7.9 million for fiscal year 2009 from $7.7 million for fiscal year 2008, as the average cost on certificates of deposit decreased by 92 basis points to 3.39% in fiscal year 2009
from 4.31% in fiscal year 2008. The average balance of certificates of deposit increased $54.0 million, or 30.3%, to $232.4 million for fiscal year 2009 from $178.4 million for fiscal year 2008. Interest expense on Federal Home Loan Bank advances decreased by $.03 million, or 46.4%, to $0.4 million in fiscal year 2009 from $0.7 million in fiscal year 2008, as the average cost on these borrowings decreased 219 basis points to 0.84% in fiscal year 2009 from 3.03% in fiscal year 2008, partially
offset by an increase in the average balance of the Federal Home Loan Bank advances of $20.5 million, or 93.6%, to $42.3 million in fiscal year 2009 from $21.8 million in fiscal year 2008.
46
Provision for Loan Losses. Our provision for loan losses increased $8.1 million to $8.5 million for fiscal year 2009 compared to $0.4 million for
fiscal year 2008. The increase is primarily due to a significant increase in non-performing commercial real estate and land loans. Total non-performing loans in non-accrual status totaled $22.1 million at September 30, 2009. There were no non-performing loans in non-accrual status at September 30, 2008. The allowance for loan losses at September 30, 2009 represented 2.50% of total loans, compared to 0.59% of total loans at September 30, 2008. During the quarter
ended September 30, 2009, non-performing loans and related to problem assets increased significantly requiring an increase in the provision for loan losses of $5.1 million for specific problem assets and $2.2 million due to the economic downturn and increase in potential problem loans. Please see “Business—Classified Assets” for a discussion relating to non-performing loans and problem assets.
Non-interest Income. Non-interest income decreased by $3.4 million, or 127.2% to a loss of $0.7 million for fiscal year 2009, from $2.7 million
for fiscal year 2008. The decrease was the result of an increase in other-than-temporary charges of $1.6 million, or 125.8%, to $2.9 million for fiscal year 2009 from $1.3 million for fiscal year 2008 and decreases of $1.4 million in banking fees and service charges, $0.1 million in net gain on sale of loans held-for-sale and $0.3 million in other income. The impairment charges for fiscal year 2009 were $2.0 million for securities held for maturity and $0.9 million for available for sale
securities, compared to a $1.3 million impairment charge for available-for-sale securities in fiscal year 2008. The decrease in banking fees and service charges was primarily the result of decreased loan syndication and other related loan fees earned of approximately $1.4 million. The decrease in other income was primarily due to the proceeds received on the Bank Owned Life Insurance policies of $0.2 million in fiscal year 2008.
Non-interest Expense. Non-interest expense increased by $2.2 million, or 19.2%, to $13.7 million in fiscal year 2009 compared to $11.5 million
in fiscal year 2008. The largest component of the increase was in compensation and fringe benefits. Compensation and fringe benefits increased $1.0 million, or 13.7%, to $8.6 million for fiscal year 2009 from $7.6 million in fiscal year 2008. This increase was due to increases of $0.7 million for a supplemental executive retirement plan, health care and other employee costs of $0.2 million and employee and director compensation costs of approximately $0.2 million. In
addition, the Bank incurred an increase in its FDIC insurance assessment. The increase consists of its ongoing FDIC insurance assessment of $0.5 million and the banking industry-wide special assessment of five basis points on the Bank’s reported regulatory assets less its tier one (1) capital of approximately $0.2 million. The Bank did not record any FDIC assessment charges in fiscal year 2008 since the assessment was offset by utilizing its one-time assessment credits, which have
been fully utilized this fiscal year. Also, occupancy and equipment expense increased $0.3 million, professional fees increased $0.2 million and data processing fees increased $0.1 million, while other miscellaneous expenses, which is comprised of advertising and public relations, insurance and other expenses, decreased $0.1 million.
Income Taxes. Income tax expense decreased $3.2 million, or 97.4%, to $0.1 million for fiscal year 2009, from $3.3 million for fiscal year 2008. This
decrease was primarily due to decreased income before taxes. The effective tax rate decreased to 6.2% in fiscal year 2009, as compared to 37.3% in fiscal year 2008.
Comparison of Operating Results for the Years Ended September 30, 2008 and September 30, 2007
Net Income. Net income increased by $1.8 million, or 45.1%, to $5.6 million in fiscal year 2008 from $3.8 million in fiscal year 2007. The
primary reasons for the increase in net income were a $578,000 increase in interest income, a reduction in interest expense of $438,000 and a reduction in non-interest expense of $2.6 million, offset in part by increases in the provision for income taxes of $1.1 million, loan loss provision of $350,000 and a reduction in non-interest income of $432,000.
Net Interest Income Before Provision for Loan Losses. Net interest income increased by $1.0 million, or 6.0%, to $18.0 million for fiscal
year 2008 from $17.0 million for fiscal year 2007. This increase was primarily due to a $25.4 million, or 6.6%, increase in total average interest-earning assets to $410.0 million in fiscal year 2008 from $384.6 million in fiscal year 2007, offset in part by increased average interest-bearing liabilities of $23.7 million, or 8.1%, to $316.4 million in fiscal year 2008 from $292.7 million in fiscal year 2007. The Bank’s interest rate spread was 3.67% and 3.55% for the
fiscal years 2008 and 2007, respectively.
47
Interest Income. Interest income increased by $0.6 million, or 2.1%, to $28.3 million for fiscal year 2008 from $27.7 million for the prior fiscal
year. The increase was due to a $0.8 million increase in interest income on first mortgage and other loans, offset in part by reductions in interest income from mortgage-backed securities of $22,000 and other securities and interest-earning assets of $0.2 million. The yield on the mortgage loan portfolio decreased 60 basis points to 7.55% in fiscal year 2008 from 8.15% in fiscal year 2007. The yield on mortgage-backed securities increased 43 basis points to 4.40% in fiscal year
2008 from 3.97% in fiscal year 2007. The yield on investment securities and other interest-earning assets decreased 244 basis points to 5.80% in fiscal year 2008 from 8.24% in fiscal year 2007. Average balances of interest-earning assets increased $25.4 million, or 6.6%, to $410.0 million in fiscal year 2008 from $384.6 million in fiscal year 2007. The average yield on total interest-earning assets decreased by 30 basis points to 6.91% in fiscal year 2008 from 7.21% in fiscal year 2007.
Interest Expense. Interest expense decreased $0.4 million, or 4.1%, to $10.3 million for fiscal year 2008 from $10.7 million in fiscal year 2007. The
decrease in interest expense reflected a 42 basis point decrease in the cost of interest-bearing liabilities to 3.24% for fiscal year 2008 from 3.66% for fiscal year 2007 as well as a $23.7 million increase in average balances. The decrease in interest expense reflected reduced market interest rates during fiscal year 2008 compared to fiscal year 2007. Interest expense on savings accounts decreased by $51,000, or 7.8%, to $599,000 for fiscal year 2008 from $650,000 for fiscal year 2007,
as the average cost on savings accounts increased by three basis points to 1.03% for the fiscal year 2008 compared to 1.00% for the fiscal year 2007. The average balance of savings accounts decreased $6.5 million, or 10.0%, to $58.4 million for fiscal year 2008 from $64.9 million for fiscal year 2007. Interest expense on Money Market and NOW accounts increased $0.3 million, or 35.3% to $1.3 million in fiscal year 2008 from $1.0 million in fiscal year 2007, as the average cost on these deposits
decreased 23 basis points while the average balances increased $19.1 million, or 49.4%, to $57.8 million in fiscal year 2008 from $38.7 million in fiscal year 2007. Interest expense on certificates of deposit increased by $0.2 million, or 2.1%, to $7.7 million for fiscal year 2008 from $7.5 million for fiscal year 2007, as the average cost on certificates of deposit decreased by 41 basis points to 4.31% in fiscal year 2008 from 4.72% in fiscal year 2007. The average balance of certificates of deposit
increased $18.6 million, or 11.6%, to $178.4 million for fiscal year 2008 from $159.8 million for fiscal year 2007. Interest expense on Federal Home Loan Bank advances decreased by $0.9 million, or 57.2%, to $661,000 in fiscal year 2008 from $1.5 million in fiscal year 2007, as the average balance of the Federal Home Loan Bank advances decreased by $7.4 million, or 25.3%, to $21.8 million in fiscal year 2008 from $29.2 million in fiscal year 2007. The average cost on these borrowings
decreased 226 basis points to 3.03% in fiscal year 2008 from 5.29% in fiscal year 2007.
Provision for Loan Losses. Our provision for loan losses increased $350,000, or 714.3%, to $0.4 million for fiscal year 2008 compared to $49,000
for fiscal year 2007. The increase is primarily due to the originations and increases of higher risk loans, as well as the performance of the loan portfolio. There were no non-performing loans in non-accrual status at September 30, 2008. Total non-performing loans in non-accrual status totaled $652,000 at September 30, 2007. The allowance for loan losses at September 30, 2008 represented 0.59% of total loans, compared to 0.63% of total loans at September 30, 2007. Please
see “Business—Classified Assets” for a discussion relating to non-performing loans and problem assets.
Non-interest Income. Non-interest income decreased by $0.4 million, or 13.8% to $2.7 million for fiscal year 2008, from $3.1 million for fiscal
year 2007. The decrease was primarily the result of an other-than-temporary charge of $1.3 million, offset by increases of $0.5 million in banking fees and service charges, $0.1 million in net gain on sale of loans held-for-sale and $0.3 million in other income. The increase in banking fees and service charges was primarily the result of increased loan syndication and other related loan fees earned of approximately $0.5 million, partially offset by a reduction in deposit related fees of
approximately $16,000. The increase in the net gain on sale of loans reflects the increased profits of loans sold including net gains for servicing rights. The increase in other income was primarily due to the proceeds received on the Bank Owned Life Insurance policies of approximately $0.2 million, Bank Owned Life Insurance income of $16,000, miscellaneous income of approximately $10,000 and depositor related fees of approximately $1,000, which include ATM fees, debit card fees and safe
deposit rental income.
48
Non-interest Expense. Non-interest expense decreased by $2.6 million, or 18.7%, to $11.5 million in fiscal year 2008 compared to $14.1 million
in fiscal year 2007. The largest component of the decrease was in compensation and fringe benefits. Compensation and fringe benefits decreased $2.9 million, or 27.7%, to $7.6 million for fiscal year 2008 from $10.5 million in fiscal year 2007. This decrease was primarily due to the stock-based incentive plan reduced expenses of $3.8 million, offset in part by increases in compensation of $0.8 million, which included general salary increases for officers and employees and hiring
of staff, health care expenses of $0.1 million, pension expense of $34,000 and other miscellaneous employee expenses of $75,000, offset in part by reductions in SERP expense of $0.2 million and ESOP expense of $16,000. In addition, occupancy and equipment expense increased $0.4 million primarily due to rental expenses and other miscellaneous expenses increased approximately $0.1 million, which is comprised of advertising and public relations, insurance and other expenses. Professional fees
decreased approximately $0.2 million due to reduced services and data processing fees decreased approximately $26,000.
Income Taxes. Income tax expense increased $1.1 million, or 52.1%, to $3.3 million for fiscal year 2008, from $2.2 million for fiscal year 2007. This
increase was primarily due to increased income before taxes. The effective tax rate increased to 37.3% in fiscal year 2008, as compared to 36.2% in fiscal year 2007.
The following table sets forth average balance sheets, average yields and costs, and certain other information for the periods indicated. All average balances are daily average balances at and for the years ended September 30, 2009, 2008 and 2007, respectively. Non-accrual loans were included in the computation of average balances but
have been reflected in the table as loans carrying a zero yield. The yields set forth below include the effect of deferred fees, discounts and premiums that are amortized or accreted to interest income.
49
|
Years Ended September 30, |
||||||||||||||||||||||||||||||||||||
|
2009 |
2008 |
2007 |
||||||||||||||||||||||||||||||||||
|
Average Balance |
Interest |
Yield/ Cost |
Average Balance |
Interest |
Yield/ Cost |
Average Balance |
Interest |
Yield/ Cost |
||||||||||||||||||||||||||||
|
Interest-earning assets: |
||||||||||||||||||||||||||||||||||||
|
Loans |
$ | 410,445 | $ | 30,074 | 7.33 | % | $ | 322,388 | $ | 24,327 | 7.55 | % | $ | 288,410 | $ | 23,506 | 8.15 | % | ||||||||||||||||||
|
Mortgage-backed securities |
77,784 | 3,696 | 4.75 | % | 77,791 | 3,419 | 4.40 | % | 86,602 | 3,441 | 3.97 | % | ||||||||||||||||||||||||
|
Investment securities and other interest-earning assets |
9,546 | 341 | 3.57 | % | 9,788 | 568 | 5.80 | % | 9,578 | 789 | 8.24 | % | ||||||||||||||||||||||||
|
Total interest-earning assets |
497,775 | 34,111 | 6.85 | % | 409,967 | 28,314 | 6.91 | % | 384,590 | 27,736 | 7.21 | % | ||||||||||||||||||||||||
|
Non interest-earning assets |
18,049 | 20,093 | 17,860 | |||||||||||||||||||||||||||||||||
|
Total assets |
$ | 515,824 | $ | 430,060 | $ | 402,450 | ||||||||||||||||||||||||||||||
|
Interest-bearing liabilities: |
||||||||||||||||||||||||||||||||||||
|
Savings accounts |
$ | 60,110 | $ | 557 | 0.93 | % | $ | 58,426 | $ | 599 | 1.03 | % | $ | 64,893 | $ | 650 | 1.00 | % | ||||||||||||||||||
|
Money market/NOW accounts |
52,561 | 1,028 | 1.96 | % | 57,808 | 1,310 | 2.27 | % | 38,697 | 968 | 2.50 | % | ||||||||||||||||||||||||
|
Certificates of deposit |
232,398 | 7,871 | 3.39 | % | 178,373 | 7,695 | 4.31 | % | 159,865 | 7,539 | 4.72 | % | ||||||||||||||||||||||||
|
Total interest-bearing deposits |
345,069 | 9,456 | 2.74 | % | 294,607 | 9,604 | 3.26 | % | 263,455 | 9,157 | 3.48 | % | ||||||||||||||||||||||||
|
FHLB advances |
42,281 | 354 | 0.84 | % | 21,840 | 661 | 3.03 | % | 29,236 | 1,546 | 5.29 | % | ||||||||||||||||||||||||
|
Total interest-bearing |
||||||||||||||||||||||||||||||||||||
|
liabilities |
387,350 | 9,810 | 2.53 | % | 316,447 | 10,265 | 3.24 | % | 292,691 | 10,703 | 3.66 | % | ||||||||||||||||||||||||
|
Non interest-bearing liabilities |
41,214 | 27,677 | 26,279 | |||||||||||||||||||||||||||||||||
|
Total liabilities |
428,564 | 344,124 | 318,970 | |||||||||||||||||||||||||||||||||
|
Retained earnings |
87,260 | 85,936 | 83,480 | |||||||||||||||||||||||||||||||||
|
Total liabilities and retained earnings |
$ | 515,824 | $ | 430,060 | $ | 402,450 | ||||||||||||||||||||||||||||||
|
Net interest income |
$ | 24,301 | $ | 18,049 | $ | 17,033 | ||||||||||||||||||||||||||||||
|
Interest rate spread |
4.32 | % | 3.67 | % | 3.55 | % | ||||||||||||||||||||||||||||||
|
Net interest-earning assets |
$ | 110,425 | $ | 93,520 | $ | 91,899 | ||||||||||||||||||||||||||||||
|
Net interest margin |
4.88 | % | 4.40 | % | 4.43 | % | ||||||||||||||||||||||||||||||
|
Interest-earning assets to interest-bearing liabilities |
128.51 | % | 129.55 | % | 131.40 | % | ||||||||||||||||||||||||||||||
50
Rate/Volume Analysis
The following table presents the dollar amount of changes in interest income and interest expense for the major categories of our interest-earning assets and interest-bearing liabilities. Information is provided for each category of interest-earning assets and interest-bearing liabilities with respect to (i) changes attributable to changes
in volume (i.e., changes in average balances multiplied by the prior-period average rate) and (ii) changes attributable to rate (i.e., changes in average rate multiplied by prior-period average balances). For purposes of this table, changes attributable to both rate and volume, which cannot be
segregated, have been allocated proportionately to the change due to volume and the change due to rate.
|
Years Ended September 30, |
Years Ended September 30, |
|||||||||||||||||||||||
|
2009 vs. 2008 |
2008 vs. 2007 |
|||||||||||||||||||||||
|
Increase (Decrease) Due to |
Increase (Decrease) Due to |
|||||||||||||||||||||||
|
Volume |
Rate |
Net |
Volume |
Rate |
Net |
|||||||||||||||||||
|
(In thousands) |
||||||||||||||||||||||||
|
Interest-earning assets: |
||||||||||||||||||||||||
|
Loans receivable |
$ | 6,548 | $ | (801 | ) | $ | 5,747 | $ | 2,667 | $ | (1,846 | ) | $ | 821 | ||||||||||
|
Mortgage-backed securities |
(27 | ) | 304 | 277 | (369 | ) | 347 | (22 | ) | |||||||||||||||
|
Investment securities and other interest-earning assets |
(11 | ) | (216 | ) | (227 | ) | 15 | (236 | ) | (221 | ) | |||||||||||||
|
Total interest-earning assets |
6,510 | (713 | ) | 5,797 | 2,313 | (1,735 | ) | 578 | ||||||||||||||||
|
Interest-bearing liabilities: |
||||||||||||||||||||||||
|
Savings accounts |
17 | (59 | ) | (42 | ) | (66 | ) | 15 | (51 | ) | ||||||||||||||
|
Money market/NOW accounts |
(111 | ) | (171 | ) | (282 | ) | 456 | (114 | ) | 342 | ||||||||||||||
|
Certificates of deposit |
2,080 | (1,904 | ) | 176 | 836 | (680 | ) | 156 | ||||||||||||||||
|
Total interest-bearing deposits |
1,986 | (2,134 | ) | (148 | ) | 1,226 | (779 | ) | 447 | |||||||||||||||
|
FHLB advances |
395 | (702 | ) | (307 | ) | (307 | ) | (578 | ) | (885 | ) | |||||||||||||
|
Total interest-bearing liabilities |
2,381 | (2,836 | ) | (455 | ) | 919 | (1,357 | ) | (438 | ) | ||||||||||||||
|
Net change in net interest income |
$ | 4,129 | $ | 2,123 | $ | 6,252 | $ | 1,394 | $ | (378 | ) | $ | 1,016 | |||||||||||
Liquidity and Capital Resources
We maintain liquid assets at levels we consider adequate to meet our liquidity needs. We adjust our liquidity levels to fund deposit outflows, pay real estate taxes on mortgage
loans, repay our borrowings and to fund loan commitments. We also adjust liquidity as appropriate to meet asset and liability management objectives.
Our primary sources of liquidity are deposits, amortization and prepayment of loans and mortgage-backed securities, maturities of investment securities and other short-term investments,
and earnings and funds provided from operations, as well as access to Federal Home Loan Bank advances. While scheduled principal repayments on loans and mortgage-backed securities are a relatively predictable source of funds, deposit flows and loan prepayments are greatly influenced by market interest rates, economic conditions and rates offered by our competition. We set the interest rates on our deposits to maintain a desired level of total deposits. In addition, we invest excess
funds in short-term interest-earning assets, which provide liquidity to meet lending requirements.
51
A significant portion of our liquidity consists of cash and cash equivalents, which are a product of our operating, investing and financing activities. At September 30, 2009,
$3.5 million of our assets were invested in cash and due from banks. Our primary sources of cash are principal repayments on loans, proceeds from the calls and maturities of investment securities, principal repayments of mortgage-backed securities and increases in deposit accounts. Currently, we sell longer-term fixed rate mortgage loans, and we syndicate and sell participation interests in portions of our multi-family, commercial real estate and construction loans. This
activity may continue so long as it meets our operational and financial needs. In addition, we invest excess funds in short-term interest-earning assets and other assets, which provide liquidity to meet our lending requirements. There were no certificates of deposit and short-term investment securities (maturing in less than three years) at September 30, 2009. As of September 30, 2009, we had $27.3 million in borrowings outstanding from the Federal Home Loan Bank of New York and
we have access to additional Federal Home Loan Bank advances of up to $48.7 million.
At September 30, 2009, we had $121.4 million in loan commitments outstanding, which included $81.7 million in undisbursed construction loans, $0.4 million in one- to four-family loans,
$10.6 million in commercial real estate lines of credit, $4.0 million in unused home equity lines of credit, and $24.7 million to originate primarily multi-family and nonresidential mortgage loans. We also have one commercial letter of credit of $2.1 million. Certificates of deposit due within one year of September 30, 2009 totaled $190.8 million, or 76.1%, of certificates of deposit. The large percentage of certificates of deposits that mature within one year reflects customers’
hesitancy to invest their funds for long periods in the current low interest rate environment. If these maturing deposits do not remain with us, we will be required to seek other sources of funds, including other certificates of deposit and borrowings. Depending on market conditions, we may be required to pay higher rates on these deposits or other borrowings than we currently pay on the certificates of deposit due on or before September 30, 2010. We believe, however, based on
past experience that a significant portion of our certificates of deposit will remain with us. We have the ability to attract and retain deposits by adjusting the interest rates offered.
As reported in the consolidated statements of cash flows, our cash flows are classified by source for financial reporting purposes as operating, investing or financing cash flows. Net cash (used in) provided by operating activities was $(58.3) million and $(79.3) million and $26.7 million for the years ended September
30, 2009, 2008, and 2007, respectively. These amounts differ from our net income because of a variety of cash receipts and disbursements that did not affect net income for the respective periods, the most significant of which are originations and sales of loans held-for-sale. The net effect of these originations and sales was a cash outflow of $78.1 million, a cash outflow of $110.7 million and a cash outflow of $10.6 million in fiscal years 2009, 2008, and 2007, respectively. Net
cash (used in) provided by investing activities was $17.0 million, $(6.2) million, and $1.1 million in fiscal years 2009, 2008 and 2007, respectively, principally reflecting our loan and investment security activities in the respective periods. Investment securities net cash (purchases net of sales, principal repayments and maturities) provided by (used in), amounted to $3.5 million, $(4.9) million and $13.4 million in the years ended September 30, 2009, 2008 and 2007, respectively. In
fiscal year 2009, the cash flows generated from financing activities were utilized primarily for the repayment of borrowings after funding loan originations and investment security purchases. In fiscal year 2008, the cash flows generated from financing activities were utilized primarily for loan originations and investment security purchases. Net deposit inflow of $59.6 million, net repayments of Federal Home Loan Bank overnight and term advances of $16.9 million, purchase of treasury shares
of $1.3 million and payment of dividends of $1.5 million comprised most of our financing activities that resulted in net cash provided by financing activities of $39.7 million in fiscal year 2009, net proceeds of $34.9 million of Federal Home Loan Bank advances, purchase of treasury shares of $4.0 million and net deposit inflow of $55.3 million comprised most of our financing activities which resulted in net cash provided by financing activities of $85.1 million in fiscal year 2008 and net repayment of $40.1
million of Federal Home Loan Bank advances, purchase of treasury shares of $2.5 million and net deposit inflow of $16.2 million resulted in net cash used in of $26.6 million in fiscal year 2007. The net effect of our operating, investing and financing activities was to decrease our cash and cash equivalents from $4.1 million at the beginning of fiscal year 2007 to $3.5 million at the end of fiscal year 2009.
Off-Balance Sheet Arrangements. In the normal course
of operations, we engage in a variety of financial transactions that, in accordance with generally accepted accounting principles, are not recorded in our financial statements. These transactions involve, to varying degrees, elements of credit, interest rate and liquidity risk and are used primarily to manage customers’ requests for funding and take the form of loan commitments and lines of credit. For information about our loan commitments and unused lines of credit, see note 15 of
the Notes to the Consolidated Financial Statements.
52
For fiscal year 2009, we did not engage in any off-balance-sheet transactions other than loan origination and loan sale commitments in the normal course of our lending activities.
Impact of Inflation and Changing Prices
The consolidated financial statements and related notes have been prepared in accordance with United States generally accepted accounting principles (“GAAP”). GAAP
generally requires the measurement of financial position and operating results in terms of historical dollars without consideration for changes in the relative purchasing power of money over time due to inflation. The impact of inflation is reflected in the increased cost of our operations. Unlike industrial companies, our assets and liabilities are primarily monetary in nature. As a result, changes in market interest rates have a greater impact on performance than do the effects
of inflation.
Item 7A. Quantitative and Qualitative Disclosures About Market Risk
General. The majority of our assets and liabilities
are monetary in nature. Consequently, our most significant form of market risk is interest rate risk. Our assets, consisting primarily of mortgage loans, have longer maturities than our liabilities, consisting primarily of deposits. As a result, a principal part of our business strategy is to manage interest rate risk and reduce the exposure of our net interest income to changes in market interest rates. Accordingly, our board of directors has approved guidelines for
managing the interest rate risk inherent in our assets and liabilities, given our business strategy, operating environment, capital, liquidity and performance objectives. Senior management monitors the level of interest rate risk on a regular basis and the audit committee of the board of directors meets as needed to review our asset/liability policies and interest rate risk position.
We have sought to manage our interest rate risk in order to minimize the exposure of our earnings and capital to changes in interest rates. During the low interest rate environment
that has existed in recent years, we have implemented the following strategies to manage our interest rate risk: (i) maintaining a high level of short-term liquid assets invested in cash and cash equivalents, short-term securities and mortgage-related securities that provide significant cash flows; (ii) generally selling longer-term mortgage loans; and (iii) lengthening the average term of our certificates of deposit. By investing in short-term, liquid instruments, we believe we are
better positioned to react to increases in market interest rates. However, investments in shorter-term securities and cash and cash equivalents generally bear lower yields than longer-term investments. Thus, during periods of declining interest rates, our strategy of investing in liquid instruments has resulted in lower levels of interest income than would have resulted from investing in longer-term loans and investments. The net proceeds from the offering have increased our capital
and provided management with greater flexibility to manage our interest rate risk. In particular, management has leveraged the capital we received to increase our interest-earning assets. Management intends to lengthen the maturity of our earning assets as interest rates increase, which, in turn, should result in a higher yielding portfolio of interest-earning assets.
Net Portfolio Value. The Office of Thrift Supervision requires the computation of amounts by which the net present value of an institution’s
cash flow from assets, liabilities and off-balance sheet items (the institution’s net portfolio value or “NPV”) would change in the event of a range of assumed changes in market interest rates. The Office of Thrift Supervision provides all institutions that file a Consolidated Maturity/Rate Schedule as a part of their quarterly Thrift Financial Report with an interest rate sensitivity report of net portfolio value. The Office of Thrift Supervision simulation model uses
a discounted cash flow analysis and an option-based pricing approach to measuring the interest rate sensitivity of net portfolio value. Historically, the Office of Thrift Supervision model estimated the economic value of each type of asset, liability and off-balance sheet contract under the assumption that the United States Treasury yield curve increases or decreases instantaneously by 100 to 300 basis points in 100 basis point increments. A basis point equals one-hundredth of one percent,
and 100 basis points equals one percent. An increase in interest rates from 3% to 4% would mean, for example, a 100 basis point increase in the “Change in Interest Rates” column below. The Office of Thrift Supervision provides us the results of the interest rate sensitivity model, which is based on information we provide to the Office of Thrift Supervision to estimate the sensitivity of our net portfolio value.
53
The table below sets forth, as of September 30, 2009, the latest date for which the Office of Thrift Supervision has provided the Bank an interest rate sensitivity report of its net portfolio value and the estimated changes in the Bank’s net portfolio value that would result from the designated instantaneous changes in the United
States Treasury yield curve.
|
NPV as a Percentage of |
|||||||||||||||||||||
|
Estimated Increase |
Present Value of Assets (3) |
||||||||||||||||||||
|
Change in |
(Decrease) in NPV |
Increase |
|||||||||||||||||||
|
Interest Rates |
Estimated |
NPV Ratio |
(Decrease) |
||||||||||||||||||
|
(basis points) (1) |
NPV (2) |
Amount |
Percent |
(4) |
(basis points) |
||||||||||||||||
|
(Dollars in thousands) |
|||||||||||||||||||||
| +300 | 55,896 | (1,937 | ) | -3.00 | % | 11.13 | % | (18 | bp) | ||||||||||||
| +200 | 57,199 | (634 | ) | -1.00 | % | 11.31 | % | 0 | bp | ||||||||||||
| +100 | 58,078 | 245 | 0.00 | % | 11.41 | % | 10 | bp | |||||||||||||
| +50 | 57,944 | 112 | 0.00 | % | 11.36 | % | 5 | bp | |||||||||||||
| 0 | 57,833 | 11.31 | % | ||||||||||||||||||
| (50) | 57,212 | 621 | -1.00 | % | 11.17 | % | (14 | bp) | |||||||||||||
| (100) | 56,811 | (1,021 | ) | -2.00 | % | 11.08 | % | (22 | bp) | ||||||||||||
|
(1) |
Assumes an instantaneous uniform change in interest rates at all maturities. |
|
(2) |
NPV is the discounted present value of expected cash flows from assets, liabilities and off-balance sheet contracts. |
|
(3) |
Present value of assets represents the discounted present value of incoming cash flows on interest-earning assets. |
|
(4) |
NPV Ratio represents NPV divided by the present value of assets. |
The table above indicates that at September 30, 2009, in the event of a 100 basis point decrease in interest rates, we would experience a 2% decrease in net portfolio value. In
the event of a 200 basis point increase in interest rates, we would experience a 1% decrease in net portfolio value. Our interest rate risk management policy in the low interest rate environment that has existed in recent years has emphasized maintaining a significant percentage of our assets in cash and cash equivalents, shorter-term securities and mortgage-related securities that provide significant cash flows. The effect of this policy has been to reduce our level of net interest income. We
have been willing to accept reduced levels of income in low interest rate environments in order to be better positioned to reinvest our assets in longer-term, higher yielding investments as interest rates rise.
Certain shortcomings are inherent in the methodology used in the above interest rate risk measurement. Modeling changes in net portfolio value requires making certain assumptions
that may or may not reflect the manner in which actual yields and costs respond to changes in market interest rates. In this regard, the net portfolio value table presented assumes that the composition of our interest-sensitive assets and liabilities existing at the beginning of a period remains constant over the period being measured and assumes that a particular change in interest rates is reflected uniformly across the yield curve regardless of the duration or repricing of specific assets and liabilities. Accordingly,
although the net portfolio value table provides an indication of our interest rate risk exposure at a particular point in time, it is not intended to and does not provide a precise forecast of the effect of changes in market interest rates on our net interest income and will differ from actual results.
54
PART II
Item 8. Financial Statements and Supplementary Data
| The following are included in this item: | |||
|
(a) |
Report of Independent Registered Public Accounting Firm | ||
|
(b) |
Consolidated Financial Statements: | ||
|
1. |
Consolidated Statements of Financial Condition as of September 30, 2009 and 2008. | ||
|
2. |
Consolidated Statements of Income for the years ended September 30, 2009 and 2008. | ||
|
3. |
Consolidated Statements of Changes in Stockholders’ Equity for the years ended September 30, 2009 and 2008. | ||
|
4. |
Consolidated Statements of Cash Flows for the years ended September 30, 2009 and 2008. | ||
|
5. |
Notes to the Consolidated Financial Statements. | ||
| The supplementary data required by this Item (selected quarterly financial data) is provided in Note 21 of the Notes to Consolidated Financial Statements. | |||
55
BROOKLYN FEDERAL BANCORP, INC.
AND SUBSIDIARY
Index to Consolidated Financial Statements
|
Page | |
|
Report of Independent Registered Public Accounting Firm |
57 |
|
Consolidated Statements of Financial Condition at September 30, 2009 and 2008 |
58 |
|
Consolidated Statements of Income for the Years Ended September 30, 2009 and 2008 |
59 |
|
Consolidated Statements of Changes in Stockholders’ Equity for the Years Ended September 30, 2009 and 2008 |
60 |
|
Consolidated Statements of Cash Flows for the Years Ended September 30, 2009 and 2008 |
61 |
|
Notes to Consolidated Financial Statements |
62 |
All schedules are omitted because the required information is not applicable or is included in the consolidated financial statements and related notes.
56
REPORT OF INDEPENDENT REGISTERED PUBLIC ACCOUNTING FIRM
To the Board of Directors and Stockholders
Brooklyn Federal Bancorp, Inc.
We have audited the accompanying consolidated statements of financial condition of Brooklyn Federal Bancorp, Inc. and Subsidiary (collectively, the “Company”) as of September 30, 2009 and 2008, and the related consolidated statements of income, changes in stockholders’ equity
and cash flows for each of the years in the two year period ended September 30, 2009. The Company’s management is responsible for these consolidated financial statements. Our responsibility is to express an opinion on these consolidated financial statements based on our audits.
We conducted our audits in accordance with the standards of the Public Company Accounting Oversight Board (United States). Those standards require that we plan and perform the audit to obtain reasonable assurance about whether the consolidated financial statements are free of material
misstatement. The Company is not required to have, nor were we engaged to perform, an audit of its internal control over financial reporting. Our audit included consideration of internal control over financial reporting as a basis for designing audit procedures that are appropriate in the circumstances, but not for the purpose of expressing an opinion on the effectiveness of the Company’s internal control over financial reporting. Accordingly, we express no such opinion. An
audit also includes examining, on a test basis, evidence supporting the amounts and disclosures in the consolidated financial statements, assessing the accounting principles used and significant estimates made by management, as well as evaluating the overall consolidated financial statement presentation. We believe that our audits provide a reasonable basis for our opinion.
In our opinion, the consolidated financial statements referred to above present fairly, in all material respects, the financial position of Brooklyn Federal Bancorp, Inc. and Subsidiary as of September 30, 2009 and 2008 and the results of their operations and cash flows for each of the years
in the two year period ended September 30, 2009, in conformity with accounting principles generally accepted in the United States of America.
/
s / ParenteBeard LLC
ParenteBeard LLC
Clark, New Jersey
January 6, 2010
57
BROOKLYN FEDERAL BANCORP, INC. AND SUBSIDIARY
Consolidated Statements of Financial Condition
September 30, 2009 and 2008
(In thousands, except per share amounts and share data)
|
Assets |
2009 |
2008 |
||||||
|
Cash and due from banks (including interest-earning balances of $2,105 and $3,134, respectively) |
$ | 3,472 | $ | 5,053 | ||||
|
Certificates of deposit |
-- | 1,397 | ||||||
|
Securities: |
||||||||
|
Available-for-sale |
3,305 | 3,655 | ||||||
|
Held-to-maturity (estimated fair value of $59,334 and $70,996, respectively) |
66,201 | 78,086 | ||||||
|
Total securities |
69,506 | 81,741 | ||||||
|
Loans held-for-sale |
-- | 134,171 | ||||||
|
Loans receivable |
430,435 | 241,354 | ||||||
|
Less: Allowance for loan losses |
10,750 | 2,205 | ||||||
|
Loans receivable, net |
419,685 | 239,149 | ||||||
|
Federal Home Loan Bank of New York (“FHLB”) stock, at cost |
2,382 | 2,802 | ||||||
|
Bank owned life insurance |
9,511 | 9,131 | ||||||
|
Accrued interest receivable |
2,799 | 2,477 | ||||||
|
Premises and equipment, net |
2,030 | 2,285 | ||||||
|
Prepaid expenses and other assets |
12,060 | 5,627 | ||||||
|
Total assets |
$ | 521,445 | $ | 483,833 | ||||
|
Liabilities and Stockholders’ Equity |
||||||||
|
Liabilities: |
||||||||
|
Deposits: |
||||||||
|
Non-interest-bearing deposits |
$ | 16,595 | $ | 18,773 | ||||
|
Interest-bearing deposits |
134,664 | 113,303 | ||||||
|
Certificates of deposit |
250,811 | 210,399 | ||||||
|
Total deposits |
402,070 | 342,475 | ||||||
|
Borrowings |
27,300 | 44,239 | ||||||
|
Advance payments by borrowers for taxes and insurance |
2,142 | 2,389 | ||||||
|
Accrued expenses and other liabilities |
8,059 | 8,407 | ||||||
|
Total liabilities |
439,571 | 397,510 | ||||||
|
Stockholders’ equity: |
||||||||
|
Preferred stock, $0.01 par value, 1,000,000 shares authorized; none issued |
-- | -- | ||||||
|
Common stock, $0.01 par value, 20,000,000 shares authorized; 13,484,210 issued and 12,890,754 and 13,000,081 outstanding, respectively |
135 | 135 | ||||||
|
Additional paid-in capital |
43,112 | 42,939 | ||||||
|
Retained earnings - substantially restricted |
52,671 | 52,839 | ||||||
|
Treasury shares - at cost, 593,456 shares and 484,129 shares, respectively |
(7,707 | ) | (6,443 | ) | ||||
|
Unallocated common stock held by employee stock ownership plan (“ESOP”) |
(2,394 | ) | (2,552 | ) | ||||
|
Unallocated shares of the stock-based incentive plan |
(417 | ) | (595 | ) | ||||
|
Accumulated other comprehensive loss: |
||||||||
|
Net unrealized loss on securities, net of income tax benefit |
(3,526 | ) | -- | |||||
|
Total stockholders’ equity |
81,874 | 86,323 | ||||||
|
Total liabilities and stockholders’ equity |
$ | 521,445 | $ | 483,833 | ||||
See accompanying notes to consolidated financial statements.
58
BROOKLYN FEDERAL BANCORP, INC. AND SUBSIDIARY
Consolidated Statements of Income
Years Ended September 30, 2009 and 2008
(In thousands, except per share amounts and share data)
|
2009 |
2008 |
|||||||
|
Interest income: |
||||||||
|
First mortgage and other loans |
$ | 30,074 | $ | 24,327 | ||||
|
Mortgage-backed securities |
3,696 | 3,419 | ||||||
|
Other securities and interest-earning assets |
341 | 568 | ||||||
|
Total interest income |
34,111 | 28,314 | ||||||
|
Interest expense: |
||||||||
|
Deposits |
9,456 | 9,604 | ||||||
|
Borrowings |
354 | 661 | ||||||
|
Total interest expense |
9,810 | 10,265 | ||||||
|
Net interest income before provision for loan losses |
24,301 | 18,049 | ||||||
|
Provision for loan losses |
8,545 | 399 | ||||||
|
Net interest income after provision for loan losses |
15,756 | 17,650 | ||||||
|
Non-interest income: |
||||||||
|
Total loss on OTTI of securities |
(8,951 | ) | (1,280 | ) | ||||
|
Less: |
||||||||
|
Non-credit portion of OTTI recorded in other comprehensive income (before taxes) |
6,061 | -- | ||||||
|
Net loss on OTTI recognized in earnings |
(2,890 | ) | (1,280 | ) | ||||
|
Banking fees and service charges |
1,358 | 2,758 | ||||||
|
Net gain on sale of loans held-for-sale |
277 | 349 | ||||||
|
Other |
519 | 876 | ||||||
|
Total non-interest income (loss) |
(736 | ) | 2,703 | |||||
|
Non-interest expense: |
||||||||
|
Compensation and fringe benefits |
8,591 | 7,557 | ||||||
|
Occupancy and equipment |
1,750 | 1,480 | ||||||
|
FDIC Insurance |
687 | -- | ||||||
|
Professional fees |
489 | 327 | ||||||
|
Data processing fees |
718 | 614 | ||||||
|
Other |
1,413 | 1,476 | ||||||
|
Total non-interest expense |
13,648 | 11,454 | ||||||
|
Income before income tax expense |
1,372 | 8,899 | ||||||
|
Income tax expense |
85 | 3,318 | ||||||
|
Net income |
$ | 1,287 | $ | 5,581 | ||||
|
Earnings per common share: |
||||||||
|
Basic |
$ | 0.10 | $ | 0.43 | ||||
|
Diluted |
$ | 0.10 | $ | 0.43 | ||||
|
Average common shares outstanding: |
||||||||
|
Basic |
12,638,722 | 12,865,569 | ||||||
|
Diluted |
12,643,613 | 12,874,764 | ||||||
See accompanying notes to consolidated financial statements.
59
BROOKLYN FEDERAL BANCORP, INC. AND SUBSIDIARY
Consolidated Statements of Changes in Stockholders’ Equity
Years Ended September 30, 2009 and 2008
(In thousands, except share data)
|
Common Stock |
Additional Paid-in Capital |
Retained Earnings-Substantially Restricted |
Treasury Stock |
Unallocated Common Stock Held by ESOP |
Unallocated Shares of the Stock-based Incentive Plan |
Accumulated Other Comprehensive (Loss) |
Total |
|||||||||||||||||||||||||
|
Balance at September 30, 2007 |
$ | 135 | $ | 42,758 | $ | 48,379 | $ | (2,468 | ) | $ | (2,711 | ) | $ | (774 | ) | $ | (60 | ) | $ | 85,259 | ||||||||||||
|
Comprehensive income: |
||||||||||||||||||||||||||||||||
|
Net income |
-- | -- | 5,581 | -- | -- | -- | -- | 5,581 | ||||||||||||||||||||||||
|
Net unrealized loss on securities available-for-sale, net of income tax benefit of $486 |
-- | -- | -- | -- | -- | -- | (691 | ) | (691 | ) | ||||||||||||||||||||||
|
Loss on impairment of securities available-for- sale, net of income tax benefit of $529 |
-- | -- | -- | -- | -- | -- | 751 | 751 | ||||||||||||||||||||||||
|
Total comprehensive income |
5,641 | |||||||||||||||||||||||||||||||
|
Treasury stock purchased (222,102 shares) |
-- | -- | -- | (3,975 | ) | -- | -- | -- | (3,975 | ) | ||||||||||||||||||||||
|
Allocation of ESOP stock |
-- | 48 | -- | -- | 159 | -- | -- | 207 | ||||||||||||||||||||||||
|
Stock-based incentive plan expense |
-- | 133 | -- | -- | -- | 179 | -- | 312 | ||||||||||||||||||||||||
|
Dividends paid on common stock, $0.29 per share |
-- | -- | (1,121 | ) | -- | -- | -- | -- | (1,121 | ) | ||||||||||||||||||||||
|
Balance at September 30, 2008 |
$ | 135 | $ | 42,939 | $ | 52,839 | $ | (6,443 | ) | $ | (2,552 | ) | $ | (595 | ) | $ | -- | $ | 86,323 | |||||||||||||
|
Balance at September 30, 2008 |
$ | 135 | $ | 42,939 | $ | 52,839 | $ | (6,443 | ) | $ | (2,552 | ) | $ | (595 | ) | $ | -- | $ | 86,323 | |||||||||||||
|
Comprehensive loss: |
||||||||||||||||||||||||||||||||
|
Net income |
-- | -- | 1,287 | -- | -- | -- | -- | 1,287 | ||||||||||||||||||||||||
|
Net unrealized loss on securities available-for-sale, net of income tax benefit of $377 |
-- | -- | -- | -- | -- | -- | (473 | ) | (473 | ) | ||||||||||||||||||||||
|
Loss on impairment of securities available-for- sale, net of income tax benefit of $383 |
-- | -- | -- | -- | -- | -- | 483 | 483 | ||||||||||||||||||||||||
|
Unrealized loss on securities held-to-maturity, net of income tax benefit of $3,386 |
-- | -- | -- | -- | -- | -- | (4,666 | ) | (4,666 | ) | ||||||||||||||||||||||
|
Loss on impairment of securities held-to-maturity, net of income tax benefit of $894 |
-- | -- | -- | -- | -- | -- | 1,130 | 1,130 | ||||||||||||||||||||||||
|
Total comprehensive loss |
(2,239 | ) | ||||||||||||||||||||||||||||||
|
Treasury stock purchased (109,327 shares) |
-- | -- | -- | (1,264 | ) | -- | -- | -- | (1,264 | ) | ||||||||||||||||||||||
|
Allocation of ESOP stock |
-- | 38 | -- | -- | 158 | -- | -- | 196 | ||||||||||||||||||||||||
|
Stock-based incentive plan expense |
-- | 135 | -- | -- | -- | 178 | -- | 313 | ||||||||||||||||||||||||
|
Dividends paid on common stock, $0.40 per share |
-- | -- | (1,455 | ) | -- | -- | -- | -- | (1,455 | ) | ||||||||||||||||||||||
|
Balance at September 30, 2009 |
$ | 135 | $ | 43,112 | $ | 52,671 | $ | (7,707 | ) | $ | (2,394 | ) | $ | (417 | ) | $ | (3,526 | ) | $ | 81,874 | ||||||||||||
See accompanying notes to consolidated financial statements.
60
BROOKLYN FEDERAL BANCORP, INC. AND SUBSIDIARY
Consolidated Statements of Cash Flows
Years Ended September 30, 2009 and 2008
|
|
||||||||
|
|
For the Year Ended |
|||||||
|
|
September 30, |
|||||||
|
Cash flows from operating activities: |
2009 |
2008 |
||||||
|
Net income |
$ | 1,287 | $ | 5,581 | ||||
|
Adjustments to reconcile net income to net cash used in operating activities: |
||||||||
|
ESOP expense |
196 | 207 | ||||||
|
Stock-based incentive plan expense |
313 | 312 | ||||||
|
Depreciation and amortization |
447 | 306 | ||||||
|
Provision for loan losses |
8,545 | 399 | ||||||
|
Income from bank-owned life insurance |
(365 | ) | (358 | ) | ||||
|
Net loss on OTTI recognized in earnings |
2,890 | 1,280 | ||||||
|
Amortization of servicing rights |
188 | 181 | ||||||
|
Accretion of deferred loan fees, net |
(508 | ) | (335 | ) | ||||
|
Accretion of discounts, net of amortization of premiums |
(186 | ) | (26 | ) | ||||
|
Originations of loans held-for-sale |
(93,695 | ) | (142,147 | ) | ||||
|
Purchase of loans held-for-sale |
-- | (2,475 | ) | |||||
|
Proceeds from sales of loans held-for-sale |
15,560 | 33,956 | ||||||
|
Principal repayments on loans held-for-sale |
11,887 | 22,593 | ||||||
|
Net gain on sales of loans held-for-sale |
(277 | ) | (349 | ) | ||||
|
(Increase) in accrued interest receivable |
(322 | ) | (172 | ) | ||||
|
Deferred income tax benefit |
(4,791 | ) | (870 | ) | ||||
|
Decrease in prepaid expenses and other assets |
911 | 526 | ||||||
|
(Decrease) Increase in accrued expenses and other liabilities |
(348 | ) | 2,099 | |||||
|
Net cash used in operating activities |
(58,268 | ) | (79,292 | ) | ||||
|
Cash flows from investing activities: |
||||||||
|
Repayments in excess of loan originations |
11,884 | 2,792 | ||||||
|
Purchase of loans receivable |
-- | (3,373 | ) | |||||
|
Principal repayments on mortgage-backed securities held-to-maturity |
19,247 | 14,698 | ||||||
|
Purchases of mortgage-backed securities held-to-maturity |
(15,228 | ) | (19,406 | ) | ||||
|
Maturities and principal pay downs of other securities held-to-maturity |
-- | 2 | ||||||
|
Purchases of securities available-for-sale |
(500 | ) | (232 | ) | ||||
|
Maturities of certificates of deposit |
1,397 | 2,493 | ||||||
|
Redemption (purchases) of FHLB stock |
420 | (1,770 | ) | |||||
|
Purchases of bank-owned life insurance |
(15 | ) | (15 | ) | ||||
|
Proceeds from bank-owned life insurance |
-- | 203 | ||||||
|
Purchases of premises and equipment |
(192 | ) | (1,572 | ) | ||||
|
Net cash provided by (used in) investing activities |
17,013 | (6,180 | ) | |||||
|
Cash flows from financing activities: |
||||||||
|
Increase in deposits |
59,595 | 55,320 | ||||||
|
Net (decrease) increase in short term borrowings |
(20,439 | ) | 30,500 | |||||
|
Proceeds from long term borrowings |
3,500 | 20,800 | ||||||
|
Repayments of long term borrowings |
-- | (16,332 | ) | |||||
|
Decrease in advance payments by borrowers for taxes and insurance |
(247 | ) | (52 | ) | ||||
|
Purchase of treasury stock |
(1,264 | ) | (3,975 | ) | ||||
|
Payment of cash dividend |
(1,471 | ) | (1,134 | ) | ||||
|
Net cash provided by financing activities |
39,674 | 85,127 | ||||||
|
Net decrease in cash and cash equivalents |
(1,581 | ) | (345 | ) | ||||
|
Cash and cash equivalents at beginning of year |
5,053 | 5,398 | ||||||
|
Cash and cash equivalents at end of period |
$ | 3,472 | $ | 5,053 | ||||
|
Supplemental disclosure of cash flow information: |
||||||||
|
Cash paid during the period for: |
||||||||
|
Interest |
$ | 9,829 | $ | 10,277 | ||||
|
Taxes |
4,120 | 3,014 | ||||||
|
Other: |
||||||||
|
Mortgage loans held-to-maturity transferred to held-for-sale |
-- | 1,523 | ||||||
|
Mortgage loans held-for-sale transferred to held-to-maturity |
200,455 | 14,688 | ||||||
See accompanying notes to consolidated financial statements.
61
Notes to Consolidated Financial Statements
|
(1) |
Reorganization and Stock Offering |
On April 5, 2005, Brooklyn Federal Savings Bank (the “Bank”) completed its reorganization into a mutual holding company structure (the “Reorganization”). As part of the Reorganization, the Bank converted from a federally-chartered mutual savings bank to a federally-chartered stock savings bank (the “Conversion”). The
Bank became the wholly-owned subsidiary of Brooklyn Federal Bancorp, Inc., a federal corporation (the “Company”), which became the majority-owned subsidiary of Brooklyn Bancorp, MHC (the “Mutual Holding Company”). The Company issued a total of 13,225,000 common shares on April 5, 2005, consisting of 3,967,500 shares (30%) sold to the public (the “Offering”) and 9,257,500 shares (70%) issued to the Mutual Holding Company. The gross proceeds from the offering
were approximately $39.7 million, less offering costs of approximately $1.8 million.
|
(2) |
Nature of Business and Summary of Significant Accounting Policies |
The Bank is a community-oriented savings institution whose business primarily consists of accepting deposits from customers within its market area (Brooklyn, Nassau and Suffolk Counties, New York) and investing those funds principally in mortgage loans secured by one- to four-family residences, multi-family properties and commercial properties,
and in mortgage-backed securities. Substantially all of the Bank’s loans are collateralized or dependent on real estate.
Effective July 1, 2009, we adopted the provisions of Financial Accounting Standards Board, or FASB, Accounting Standards Codification™, (the “FASB ASC”), which is now the source of authoritative, non-governmental U.S. generally accepted accounting principles (“GAAP”). While the FASB ASC did not change
GAAP, all existing authoritative accounting literature, with certain exceptions, was superseded and codified into the FASB ASC. The references to authoritative accounting literature contained in our disclosures have been modified to refer to general accounting topics within the FASB ASC.
Deposits are insured up to applicable limits by the Deposit Insurance Fund of the Federal Deposit Insurance Corporation (“FDIC”). The Bank’s and the Company’s primary regulator is the Office of Thrift Supervision (“OTS”).
|
|
(a) |
Basis of Presentation |
The accompanying consolidated financial statements are prepared in conformity with GAAP and include the accounts of the Company, the Bank and the Bank’s wholly owned subsidiaries (collectively, the “Company”). The Bank’s wholly-owned subsidiaries are Thrift Investors Service Corporation (“TISCO”),
3D Holding Corp., Inc., and BFS REIT, Inc. (“BFS REIT”). BFS REIT is a real estate investment trust formed to hold mortgage-related assets. TISCO’s wholly owned subsidiary, BFS Agency, provides insurance services to the customers of the Bank. 3D Holding Corp., Inc., was formed to hold title to certain properties acquired by the Bank through foreclosure. All significant inter-company balances and transactions are eliminated in consolidation.
62
The preparation of consolidated financial statements, in conformity with GAAP, requires management to make estimates and assumptions that affect the reported amounts of assets and liabilities and disclosures of contingent assets and liabilities at the date of the financial statements and the reported amounts of revenues and expenses during
the reporting periods. Material estimates that are particularly susceptible to significant change relate to the determination of the allowance for loan losses, identification of other-than-temporary impairment of securities and the determination of the amount of deferred tax assets that are more likely than not to be realized. Management believes that the allowance for loan losses represents its best estimate of losses known and inherent in the loan portfolio that are both probable and reasonable
to estimate, evaluation for other-than-temporary impairment of securities are done in accordance with GAAP, and deferred tax assets are properly recognized. The determination of the amount of deferred tax assets more likely than not to be realized is dependent on projections of future earnings, which are subject to frequent change. Actual results may differ from those estimates. The estimate of the allowance for loan losses is particularity susceptible to significant near-term changes, as discussed below.
| (b) | Cash and Cash Equivalents |
Cash and cash equivalents include cash, due from banks, federal funds sold and term deposits with the Federal Home Loan Bank with original maturities of less than 90 days.
| (c) | Securities |
The Company reports debt and equity securities in one of the following categories: (i) “held-to-maturity” (management has positive intent and ability to hold debt securities to maturity) which are reported at cost adjusted for the amortization of premiums and accretion of discounts; (ii) “trading” (held
for current resale) which are reported at fair value, with unrealized gains and losses included in earnings; or (iii) “available-for-sale” (all other debt and equity securities) which are reported at fair value, with unrealized gains and losses excluded from earnings and reported net of deferred income taxes as a separate component of accumulated other comprehensive income (loss), a component of stockholders’ equity. The Company classifies its securities in one of these categories
based upon determinations made at the time of purchase.
Premiums and discounts on debt securities are amortized and accreted to interest income using the level-yield method over the term of the security, adjusted for the effect of actual prepayments in the case of mortgage-backed securities. Gains and losses on the sales of securities are recognized when sold using the specific identification
method.
In April 2009, the FASB issued guidance regarding the recognition and presentation of Other-Than-Temporary Impairments (“OTTI”). Equity securities deemed to be other-than-temporarily impaired are written down from their original cost basis to fair value by a charge to current earnings. The guidance clarified
the interaction of the factors that should be considered when determining whether a debt security is other-than-temporarily impaired. For debt securities, management must assess whether (a) it has the intent to sell the security or (b) it is more likely than not that it will be required to sell the security prior to its anticipated recovery. These steps are done before assessing whether the entity will recover the cost basis of the investment. Previously, this assessment required
management to assert it has both the intent and the ability to hold a security for a period of time sufficient to allow for an anticipated recovery in fair value to avoid recognizing an OTTI charge. This change does not affect the need to forecast recovery of the value of the security through either cash flows or market price. For equity securities, when OTTI has been determined, OTTI charge is recognized through earnings.
63
In instances when a determination is made that an OTTI exists but the investor does not intend to sell the debt security and it is not more likely than not that it will be required to sell the debt security prior to its anticipated recovery, the guidance changes the presentation and amount of the OTTI recognized in the income statement. The
OTTI is separated into (a) the amount of the total OTTI related to a decrease in cash flows expected to be collected from the debt security (the credit loss) and (b) the amount of the total OTTI related to all other factors. The amount of the total OTTI related to the credit loss is recognized in earnings. The amount of the total OTTI related to all other factors is recognized in accumulated other comprehensive income.
Management evaluates securities for other-than-temporary impairment on a quarterly basis.
| (d) | Federal Home Loan Bank of New York Stock |
As a member of the Federal Home Loan Bank, the Bank is required by law to hold a certain amount of Federal Home Loan Bank stock. The stock is a nonmarketable equity security and, accordingly, is recorded at cost.
| (e) | Loan Sales and Syndications |
From time to time, the Company sells whole loans (principally commercial mortgage and residential mortgage loans) and loan participation interests (principally portions of multi-family, commercial mortgage and construction loans). Sales are generally made on a servicing-retained basis, except for certain sales of whole commercial mortgage
loans for which servicing is released to the purchaser. These transactions are accounted for as sales based on application of the criteria set forth in FASB-issued guidance. These criteria provide that the Company, as transferor, must surrender control over the transferred assets (i.e., the loans sold) in order to record a sale. The criteria specify that (i) the transferred assets have been isolated from the
transferor (put presumptively beyond the reach of the transferor and its creditors, even in bankruptcy or other receivership); (ii) each transferee has the right to pledge or exchange the assets it received; and (iii) the transferor does not maintain effective control over the transferred assets through an agreement to repurchase the assets or an ability to unilaterally cause the holder to return specific assets. For sales of loan participation interests, FASB-issued guidance specifies that the criteria are met
if the purchaser has the right to pledge or exchange its participation interests after obtaining the Company’s permission to do so (which permission shall not be unreasonably withheld). All of the Company’s whole loan and loan participation transactions have met the required criteria and, accordingly, have been accounted for as sales. The principal effects of sales accounting are the de-recognition of the whole loans and loan participation interests sold, and the recognition of a gain or loss on sale.
Gains and losses on sales of whole loans and loan participation interests are recognized when the sales proceeds are received, and are measured in accordance with FASB-issued guidance. The cost basis of the loan sold is allocated, based on relative fair values, between the loan sold and the servicing right retained which is included in
other assets. All but a minor portion of the Company’s loan sales have been made on a non-recourse basis. Recourse obligations, if any, are determined based on an estimate of probable credit losses over the term of the loans. Servicing assets and recourse liabilities on loan sales through September 30, 2009 have had an immaterial effect on the Company’s financial position and results of operations. Loan servicing income is reported in non-interest income.
64
The Company also engages in loan syndication transactions, which are not transfers of financial assets. A syndication of a loan is distinguished from a loan participation in that, in a syndication, the other lenders are identified prior to loan closing and are committed to fund a portion of the total loan at closing. In a loan
participation, however, the other participants purchase a portion of the total loan from the lead lender after the lead lender has closed and funded the entire loan. As the enterprise managing loan syndications, the Company receives loan syndication fees from the borrower and accounts for these fees in accordance with FASB-issued guidance. Accordingly, syndication fees are recognized in income when the syndication is complete if the yield on the portion of the loan retained by the Company is at least equal to
the average yield earned by the other lenders in the syndication. The Company does not assume any recourse obligations on its loan syndications, as each lender’s credit risk is based on its own portion of the loan.
| (f) | Loans Held-for-Sale and Related Commitments |
Loans held-for-sale represent commercial and other mortgage loans originated for sale. These loans are carried at the lower of cost or estimated fair value, as determined on an aggregate basis. Net unrealized losses are recognized in a valuation allowance by charges to operations. Premiums and discounts and origination fees and costs
on loans held-for-sale are deferred and recognized as a component of the gain or loss on sale. Commitments to originate loans that will be held-for-sale and forward commitments to sell these loans are derivative instruments that are required to be recognized as assets or liabilities at fair value. Fair value is determined based solely on the effect of changes in secondary market interest rates and yield requirements from the commitment date to the date of the financial statements. The fair value of these commitments
has had an immaterial effect on the Company’s financial position and results of operations.
| (g) | Loans Receivable, Net |
Loans receivable are stated at unpaid principal balances adjusted for net deferred loan origination fees and the allowance for loan losses. Loan origination fees, net of certain loan origination costs, are deferred and subsequently recognized in interest income as a yield adjustment using the level-yield method over the contractual life
of the loan. When loans are prepaid prior to contractual maturity, any remaining deferred amounts are recognized in interest income. Prepayment penalties are also recognized in interest income, at the time of receipt, when the borrower does not refinance with the Company or when the terms (including effective yield) of a refinanced loan are at least as favorable as the terms of comparable loans to other borrowers of similar creditworthiness.
Interest is accrued monthly on the outstanding balance of mortgages and other loans unless management considers collection to be doubtful. Loans are generally placed on non-accrual status when principal or interest payments are in arrears 90 days or more or when other factors indicate that the collection of these amounts is
doubtful. When loans are placed on non-accrual status, interest previously accrued but not received is reversed and charged against current income. Income on non-accrual loans is subsequently recognized only to the extent cash is received and full collectability of principal is anticipated.
| (h) | Allowance for Loan Losses |
The allowance for loan losses is established through provisions for losses charged to earnings. Losses on loans (including impaired loans) are charged to the allowance for loan losses when management believes that the collection of principal is unlikely. Recoveries of loans previously charged-off are credited to the allowance when realized.
Loans are charged-off in whole or in part when it has been determined that there has been a loss of principal. For real estate secured loans, this determination is normally made in conjunction with a current appraisal analysis. Initial write-downs on foreclosed assets are also charged-off against the allowance for loan losses.
65
Factors considered in management’s periodic evaluation of the adequacy of the allowance for loan losses include the Company’s historical loss experience, current economic conditions, delinquency statistics, geographic concentrations, the financial strength of the borrower, the estimated value of underlying collateral and the
results of internal and external loan reviews. While management uses available information to recognize losses on loans, future additions to the allowance may be necessary based on changes in economic conditions.
The Company considers a loan to be impaired when, based upon current information and events, it is probable that it will be unable to collect all principal and interest contractually due. The Company applies these criteria primarily to its commercial, multi-family and construction loans on at least a quarterly basis. Impairment is measured
as the excess of the loan balance over (i) the present value of the loan’s expected future cash flows (including principal and interest) discounted at the loan’s effective interest rate or (ii) the fair value of the underlying collateral if the loan is collateral dependent. These impairments are specific allocations within the allowance for loan losses. Impairment criteria generally do not apply to those smaller-balance homogeneous loans that are collectively evaluated for impairment, such as the
Company’s one-to-four family mortgage loans. These collective evaluations result in general allocations within the allowance for loan losses that are determined by applying loss factors to the loan balances in the various portfolio categories. These loss factors are determined by management in consideration of the degree of credit risk involved in each portfolio category, historical loss experience, current economic conditions, delinquency statistics and geographic concentrations.
| (i) | Premises and Equipment |
Premises and equipment are carried at cost less accumulated depreciation and amortization. Depreciation expense is provided on a straight-line basis over the estimated useful lives of the related assets, which are 50 years for buildings and three to ten years for furniture and equipment. Amortization of leasehold improvements is recognized
on a straight-line basis over the shorter of the terms of the related leases or the estimated useful lives of the assets, resulting in amortization periods ranging from 12 to 15 years.
| (j) | Bank-Owned and Split-Dollar Life Insurance |
The Bank owns life insurance policies on the lives of certain of its officers. The cash surrender value of the policies is recorded as an asset and the change in that value is recorded as non-interest income. Death benefit proceeds received in excess of a policy’s cash surrender value are recognized in income upon receipt. Cash
surrender values totaling $9.5 million and $9.1 million are reflected in the consolidated statements of financial condition as of September 30, 2009 and 2008, respectively. There are no policy loans offset against the cash surrender values or restrictions on the use of the proceeds.
The Bank has also entered into agreements with certain of its officers with respect to split-dollar life insurance policies owned by the officer. The Bank pays the policy premiums and holds an assignment of policy proceeds payable at death sufficient to repay all premiums. The amount by which any death benefits exceeds the premiums paid
by the Bank will be paid to the beneficiary or beneficiaries designated by the Bank officer. Aggregate premiums paid by the Bank of $0.6 million and $1.3 million are included in other assets in the consolidated statements of financial condition as of September 30, 2009 and 2008, respectively. The decline in aggregate premiums paid was due to a retired officer purchasing the Bank’s investment in the policy.
66
|
(k) |
Income Taxes |
Using the asset and liability method, deferred tax assets and liabilities are recognized for the future tax consequences attributable to differences between the financial statement carrying amounts of existing assets and liabilities and their respective tax bases. To the extent that current available evidence about the future raises doubt
about the realization of a deferred tax asset, a valuation allowance is established. Deferred tax assets and liabilities are measured using enacted tax rates expected to apply to taxable income in the years in which those temporary differences are expected to be recovered or settled. The effect on deferred tax assets and liabilities of a change in tax rates is recognized in income tax expense in the period that includes the enactment date.
The Company follows FASB guidance which provides clarification on accounting for uncertainty in income taxes recognized in an enterprise’s financial statements in accordance with FASB ASC 740. The guidance prescribes a recognition threshold and measurement attribute for the financial statement recognition and measurement of a tax
position taken or expected to be taken in a tax return, and also provides guidance on derecognition, classification, interest and penalties, accounting in interim periods, disclosure and transition. As a result of the Company’s evaluation of the FASB-issued guidance, no significant income tax uncertainties were identified. Therefore, the Company recognized no adjustment for unrecognized income tax benefits for the year ended September 30, 2009. Our policy is to recognize interest and
penalties on unrecognized tax benefits in income taxes expense in the Consolidated Statements of Income. The Company recognized no interest and penalties during the fiscal year ended September 30, 2009. The tax years subject to examination by the taxing authorities are the years ended September 30, 2008, 2007 and 2006. On December 22, 2009, the New York City Department of Finance commenced an audit for the 2008, 2007 and 2006 fiscal year ends.
|
(l) |
Comprehensive Income |
Comprehensive income consists of net income, the change in net unrealized appreciation or depreciation in the fair value of securities available-for-sale, net of taxes, and the non-credit related unrealized losses of other-than-temporarily impaired held-to-maturity securities, net of taxes.
|
(m) |
Employee Stock Ownership Plan (“ESOP”) |
Compensation expense is recognized for the ESOP equal to the fair value of shares that have been allocated or committed to be released for allocation to participants. Any difference between the fair value at that time and the ESOP’s original acquisition cost is charged or credited to stockholders’ equity (additional paid-in
capital). The cost of ESOP shares that have not yet been allocated or committed to be released for allocation is deducted from stockholders’ equity.
| (n) | Stock Compensation Plans |
The Company follows FASB ASC 718-10 for equity instruments awarded under the Brooklyn Federal Bancorp, Inc. 2006 Stock-Based Incentive Plan which became effective on April 11, 2006. Under FASB-issued guidance, the Company measures the cost of employee services received in exchange for any award of equity instruments based on
the grant-date fair value of the award and recognizes that cost over the period during which an employee is required to provide service in exchange for the award (usually the vesting period). For stock options and similar instruments, grant-date fair value will be estimated using option-pricing models adjusted for the unique characteristics of instruments.
67
| (o) | Advertising |
The company expenses advertising and marketing costs as incurred. For the fiscal year ended September 30, 2009, these costs were $0.1 million compared to $0.2 million for the year ended September 30, 2008.
| (p) | Earnings Per Share (“EPS”) |
Basic EPS is based on the weighted average number of common shares actually outstanding, and is adjusted for ESOP shares not yet committed to be released, unvested restricted stock awards and deferred compensation obligations required to be settled in shares of Company stock. Diluted EPS reflects the potential dilution that could occur
if securities or other contracts to issue common stock, such as unvested restricted stock awards and outstanding stock options, were exercised or converted into common stock or resulted in the issuance of common stock that then shared in the earnings of the Company. Diluted EPS is calculated by adjusting the weighted average number of shares of common stock outstanding to include the effect of contracts or securities exercisable (such as stock awards and options) or which could be converted into common stock,
if dilutive, using the treasury stock method. The calculation of diluted EPS for the year ended September 30, 2009 includes incremental shares related to unvested restricted stock awards of 4,891. At September 30, 2009, there were no incremental shares related to outstanding stock options. The calculation of diluted EPS for the year ended September 30, 2008 includes incremental shares related to outstanding stock options and unvested restricted stock awards of 3,847 and 5,348, respectively. Shares
issued and reacquired during any period are weighted for the portion of the period they were outstanding.
| (q) | Segment Information |
Public companies are required to report certain financial information about significant revenue-producing segments of the business for which this financial information is available and utilized by the chief operating decision maker. As a community-oriented financial institution, substantially all of the Company’s operations involve
the delivery of loan and deposit products to customers. Management makes operating decisions and assesses performance based on an ongoing review of these community banking operations, which constitute the Company’s only operating segment for financial reporting purposes.
| (r) | Subsequent Events |
The Company has evaluated events and transactions occurring subsequent to the balance sheet date of September 30, 2009, for items that should potentially be recognized or disclosed in these financial statements. The evaluation was conducted through January 6, 2010, the date these financial statements were issued.
| (s) | Concentration of Risk |
Financial instruments which potentially subject the Company and its subsidiaries to concentrations of credit risk consist of cash and cash equivalents, loans receivable and mortgage-backed securities. Cash and cash equivalents include deposits placed in other financial institutions. At September 30, 2009, the Company had $2.1 million,
$0.1 million and $0.1 million on deposit with the Federal Home Loan Bank of New York, Federal Reserve Bank of New York, and a money center bank, respectively. Securities include concentrations of investments in mortgage-backed securities of private issuers and to a lesser extent in U.S. Government-sponsored enterprises and U.S. Government agency securities. The Bank’s lending activity is primarily concentrated in loans collateralized by real estate in the State of New York. As a result, credit
risk is broadly dependent on the real estate market and general economic conditions in the state. Additionally, the Bank’s lending policies limit the amount of credit extended to any single borrower and their related interests thereby limiting the concentration of credit risk to any single borrower.
68
| (t) | Interest Rate Risk |
The Bank is principally engaged in the business of attracting deposits from the general public and using these deposits, together with other funds, to originate or purchase loans for its portfolio and invest in securities. Taken together, these activities present interest rate risk to the Company’s earnings and capital that generally
arise from differences between the timing of rate changes and the timing of cash flows (re-pricing risk); from changing rate relationships among yield curves that affect bank activities (basis risk); from changing rate relationships across the spectrum of maturities (yield curve risk); and from interest-rate-related options embedded in bank products (option risk).
In particular, interest rate risk within the Bank’s balance sheet results from the generally shorter duration of its interest-sensitive liabilities compared to the generally longer duration of its interest-sensitive assets. In a rising rate environment, liabilities will re-price faster than assets. As a result, the Bank’s
cost of interest-bearing liabilities will increase faster than its yield on interest-earning assets, thereby reducing the Bank’s net interest rate spread and net interest margin and adversely impacting net income. A similar result occurs when the interest rate yield curve “flattens”; that is, when increases in shorter term market interest rates outpace the change in longer term market interest rates or when decreases in longer term interest rates outpace the change in shorter term interest rates.
In both cases, the re-pricing characteristics of the Bank’s assets and liabilities result in a decrease in the Bank’s net interest rate spread and net interest margin.
Conversely, an overall reduction in market interest rates, or a “steepening” of the yield curve, generally enhances the Bank’s net interest rate spread and net interest margin which, in turn, enhances net income. However, the positive effect on earnings from movements in interest rates may be diminished as the pace of
borrower refinancing increases resulting in the Company’s higher yielding loans and mortgage-backed securities being replaced with lower yielding assets at an accelerated rate.
For these reasons, management regularly monitors the maturity and re-pricing structure of the Bank’s assets and liabilities throughout a variety of interest rate scenarios in order to measure and manage its level of interest-rate risk in relation to the goals and objectives of its strategic business plan.
69
|
(3) |
Securities |
Investments in securities available-for-sale and held-to-maturity at September 30, 2009 and 2008 are summarized as follows:
|
2009 |
||||||||||||||||||||
|
Amortized
cost |
Carrying
cost |
Gross
unrealized
gains |
Gross unrealized losses |
Estimated
fair value |
||||||||||||||||
|
(In thousands) |
||||||||||||||||||||
|
Securities available-for-sale: |
||||||||||||||||||||
|
Mutual fund shares |
$ | 3,289 | $ | 3,289 | $ | 16 | $ | - | $ | 3,305 | ||||||||||
|
Securities held-to-maturity: |
||||||||||||||||||||
|
Mortgage-backed securities: |
||||||||||||||||||||
|
Government-sponsored enterprises |
$ | 20,474 | $ | 20,474 | $ | 391 | $ | (2 | ) | $ | 20,863 | |||||||||
|
Government agency |
125 | 125 | 3 | (5 | ) | 123 | ||||||||||||||
|
Private issuers |
51,630 | 45,602 | 259 | (7,513 | ) | 38,348 | ||||||||||||||
|
Total securities held-to-maturity |
$ | 72,229 | $ | 66,201 | $ | 653 | $ | (7,520 | ) | $ | 59,334 | |||||||||
| 2008 | ||||||||||||||||||||
|
Amortized
cost |
Carrying
cost |
Gross unrealized gains |
Gross unrealized losses |
Estimated
fair value |
||||||||||||||||
|
(In thousands) |
||||||||||||||||||||
|
Securities available-for-sale: |
||||||||||||||||||||
|
Mutual fund shares |
$ | 3,655 | $ | 3,655 | $ | - | $ | - | $ | 3,655 | ||||||||||
|
Securities held-to-maturity: |
||||||||||||||||||||
|
Mortgage-backed securities: |
||||||||||||||||||||
|
Government-sponsored enterprises |
$ | 30,136 | $ | 30,136 | $ | 29 | $ | (943 | ) | $ | 29,222 | |||||||||
|
Government agency |
152 | 152 | 5 | (11 | ) | 146 | ||||||||||||||
|
Private issuers |
47,798 | 47,798 | - | (6,170 | ) | 41,628 | ||||||||||||||
|
Total securities held-to-maturity |
$ | 78,086 | $ | 78,086 | $ | 34 | $ | (7,124 | ) | $ | 70,996 | |||||||||
All of the Company’s mortgage-backed securities were acquired by purchase (none resulted from retained interests in loans sold or securitized by the Company). Mortgage-backed
securities issued by government-sponsored enterprises at September 30, 2009 consist of (i) Freddie Mac securities with an amortized cost of $12,247,000 (compared to $19,150,000 at September 30, 2008) and an estimated fair value of $12,516,000 (compared to $18,706,000 at September 30, 2008) and (ii) Fannie Mae securities with an amortized cost of $8,227,000 (compared to $10,986,000 at September 30, 2008) and an estimated fair value of $8,347,000 (compared to $10,516,000 at September 30, 2008). These
are the only securities of individual issuers held by the Company with an aggregate book value exceeding 10% of the Company’s equity at September 30, 2009. Government agency mortgage-backed securities represent securities issued by Ginnie Mae.
70
The Company recognized an other-than-temporary impairment (“OTTI”) charge of $0.9 million on securities available-for-sale for the year ended September 30, 2009, compared to $1.3 million for the year ended September 30, 2008. The impairment charge relates to our investment in a mutual fund with a book value of $2.8
million that invests primarily in agency and private label mortgage-backed securities. The Bank’s investment in a mutual fund that invests primarily in agency and private label mortgage backed securities has been steadily losing value, which has caused a corresponding decrease in the fund’s net asset value. In addition, the fund implemented a temporary prohibition on cash redemptions, lessening the ability of the Bank to dispose of its remaining $2.8 million investment in this
asset.
The Company recognized an OTTI charge in earnings of $2.0 million on securities held-to-maturity for the year ended September 30, 2009. This charge related to credit loss and was attributable to private issued mortgage-backed securities and was determined through a present-value analysis of expected cash flows on the securities.
Total pre-tax OTTI for the year ended September 30, 2009 was $9.0 million and the net OTTI that was recognized in earnings was $2.9 million. OTTI is a non-cash charge and not necessarily an indicator of a permanent decline in value.
There were no sales of securities during the years ended September 30, 2009 and 2008.
At September 30, 2009, the Bank pledged securities of $44.2 million in amortized cost, with an estimated fair value of $42.5 million, as collateral for advances from the Federal Home Loan Bank.
The following table summarizes securities held-to-maturity at amortized cost and estimated fair value by contractual final maturity as of September 30, 2009. Actual maturities
will differ from contractual final maturity due to scheduled monthly payments and due to borrowers having the right to prepay obligations with or without prepayment penalty.
|
Amortized |
Carrying |
Estimated |
||||||||||
|
cost |
cost |
Fair Value |
||||||||||
|
(In thousands) |
||||||||||||
|
Mortgage-backed securities: |
||||||||||||
|
One year or less |
$ | - | $ | - | $ | - | ||||||
|
Over one year through five years |
399 | 399 | 409 | |||||||||
|
Over five years through ten years |
21,612 | 21,612 | 21,637 | |||||||||
|
More than ten years |
50,218 | 44,190 | 37,288 | |||||||||
|
Total securities held-to-maturity |
$ | 72,229 | $ | 66,201 | $ | 59,334 | ||||||
The following table summarizes those securities held-to-maturity at September 30, 2009 with gross unrealized losses, segregated by the length of time the securities had been in a continuous
loss position:
71
|
As of September 30, 2009 |
||||||||||||||||||||||||
|
Less than 12 months |
12 months or more |
Total |
||||||||||||||||||||||
|
Estimated |
Gross unrealized |
Estimated |
Gross unrealized |
Estimated |
Gross unrealized |
|||||||||||||||||||
|
fair value |
losses |
fair value |
losses |
fair value |
losses |
|||||||||||||||||||
| (In thousands) | ||||||||||||||||||||||||
|
Securities held-to-maturity: |
||||||||||||||||||||||||
|
Mortgage-backed securities: |
||||||||||||||||||||||||
|
Government-sponsored enterprises |
$ | 450 | $ | (1 | ) | $ | 39 | $ | (1 | ) | $ | 489 | $ | (2 | ) | |||||||||
|
Government agency |
- | - | 104 | (5 | ) | 104 | (5 | ) | ||||||||||||||||
|
Private issuers |
7,493 | (152 | ) | 22,418 | (7,361 | ) | 29,911 | (7,513 | ) | |||||||||||||||
|
Total temporarily impaired securities held-to-maturity |
$ | 7,943 | $ | (153 | ) | $ | 22,561 | $ | (7,367 | ) | $ | 30,504 | $ | (7,520 | ) | |||||||||
The following table summarizes those securities held-to-maturity at September 30, 2008 with gross unrealized losses, segregated by length of time the securities had been in continuous loss position:
|
As of September 30, 2008 |
||||||||||||||||||||||||
|
Less than 12 months |
12 months or more |
Total |
||||||||||||||||||||||
|
Estimated |
Gross unrealized |
Estimated |
Gross unrealized |
Estimated |
Gross unrealized |
|||||||||||||||||||
|
fair value |
losses |
fair value |
losses |
fair value |
losses |
|||||||||||||||||||
|
(In thousands) |
||||||||||||||||||||||||
|
Securities held-to-maturity: |
||||||||||||||||||||||||
|
Mortgage-backed securities: |
||||||||||||||||||||||||
|
Government-sponsored enterprises |
$ | 6,870 | $ | (251 | ) | $ | 19,772 | $ | (692 | ) | $ | 26,642 | $ | (943 | ) | |||||||||
|
Government agency |
24 | (1 | ) | 92 | (10 | ) | 116 | (11 | ) | |||||||||||||||
|
Private issuers |
28,419 | (3,757 | ) | 13,209 | (2,413 | ) | 41,628 | (6,170 | ) | |||||||||||||||
|
Total temporarily impaired securities held-to-maturity |
$ | 35,313 | $ | (4,009 | ) | $ | 33,073 | $ | (3,115 | ) | $ | 68,386 | $ | (7,124 | ) | |||||||||
In April 2009, the FASB amended the OTTI model for debt securities. The impairment model for equity securities was not affected. Under the new guidance, an
OTTI loss must be fully recognized in earnings if an investor has the intent to sell the debt security or if it is more likely than not that the investor will be required to sell the debt security before recovery of its amortized cost basis. However, even if an investor does not expect to sell a debt security, it must evaluate the expected cash flows to be received and determine if a credit loss has occurred. In the event of OTTI, only the amount of impairment associated with the credit
loss is recognized in earnings. Amounts relating to factors other than credit losses are recorded in accumulated other comprehensive loss (“AOCL”). The guidance also requires additional disclosures regarding the calculation of credit losses as well as factors considered in reaching a conclusion that an investment is not other-than-temporarily impaired. The Company adopted the new guidance effective April 1, 2009.
72
Securities in unrealized loss positions are analyzed as part of the Company’s ongoing assessment of OTTI. When the Company intends to sell or is required to sell securities,
the Company recognizes an impairment loss equal to the full difference between the amortized cost basis and fair value of those securities. When the Company does not intend to sell or is required to sell equity or debt securities in an unrealized loss position, potential OTTI is considered based on a variety of factors, including the length of time and extent to which the fair value has been less than cost; adverse conditions specifically related to the industry, the geographic area or financial condition
of the issuer or the underlying collateral of a security; the payment structure of the security; changes to the rating of the security by a rating agency; the volatility of the fair value changes; and changes in fair value of the security after the balance sheet date. For debt securities, the Company estimates cash flows over the remaining lives of the underlying collateral to assess whether credit losses exist and determine if any adverse changes in cash flows have occurred. The Company’s
cash flow estimates take into account expectations of relevant market and economic data as of the end of the reporting period. As of September 30, 2009, the Company does not intend to sell the securities with an unrealized loss position in AOCL, and it is not more likely than not that the Company will be required to sell these securities before recovery of their amortized cost basis. The Company believes that the securities with an unrealized loss in AOCL are not other-than-temporarily
impaired as of September 30, 2009.
U.S. Government Agency and Government Sponsored Enterprise Mortgage-backed Securities
The carrying value of the Company’s U.S. Government Agency and Government Sponsored mortgage-backed securities totaled $20.6 million at September 30, 2009 and comprised 31.1%
of total held-to-maturity investments and 4.0% of total assets as of that date. At September 30, 2009, there was one security of this type in a unrealized loss position for less than 12 months and five securities of this type in an unrealized loss position for 12 months or longer. This category of securities generally includes mortgage pass-through securities and collateralized mortgage obligations issued by U.S. government agencies, such as Ginnie Mae which guarantees the contractual cash
flows associated with those securities and U.S. government-sponsored entities such as Fannie Mae and Freddie Mac that carried the implicit guarantee of the U.S. government to guarantee the contractual cash flows associated with those securities. Those guarantees were strengthened during the 2008-2009 financial crisis during which time Fannie Mae and Freddie Mac were placed into receivership by the federal government. Through those actions, the U.S. government effectively reinforced the guarantees of
those agencies, thereby assuring the creditworthiness of the mortgage-backed securities issued by those agencies.
With credit risk being reduced to negligible levels due to the U.S. government’s support of these agencies, the unrealized losses on the Company’s investment in U.S. Government
Agency mortgage-backed securities are due largely to the combined effects of several market-related factors. First, movements in market interest rates significantly impact the average lives of mortgage-backed securities by influencing the rate of principal prepayment attributable to refinancing activity. Changes in the expected average lives of these securities significantly impact their fair values due to the extension or contraction of the cash flows that an investor expects to receive over the life of the
security.
Historically, lower market interest rates generally prompt greater refinancing activity thereby shortening the average lives of mortgage-backed securities and vice-versa. However, prepayment
rates are also influenced by fluctuating real estate values and the overall availability of credit in the marketplace which significantly impacts the ability of borrowers to refinance. The deteriorating real estate market values and reduced availability of credit that has characterized the residential real estate marketplace over the past two years has significantly slowed both real estate purchase and refinancing activities. Consequently, prepayment rates on mortgage-backed securities have generally slowed thereby
extending their average lives.
The market price of mortgage-backed securities, being the key measure of the fair value to an investor in those securities, is also influenced by the overall supply and demand for those
securities in the marketplace. Absent other factors, an increase in the demand for, or a decrease in the supply of a security increases its price. Conversely, a decrease in the demand for, or an increase in the supply of a security decreases its price. The recent volatility and uncertainty in the marketplace has reduced the overall level of demand for mortgage-backed securities which has generally had an adverse impact on their prices in the open market. This has been further exacerbated by many larger institutions
shedding mortgage-related assets to shrink their balance sheets for capital adequacy purposes thereby increasing the supply of those securities.
73
In sum, the factors influencing the fair value of the Company’s U.S. Government Agency mortgage-backed securities, as described above, generally result from movements in market
interest rates and changing real estate and financial market conditions which affect the supply and demand for those securities. Inasmuch as market conditions fluctuate over time, the impairments of value arising from these changing market conditions are both “noncredit-related” and “temporary” in nature.
The Company has the stated ability and intent to “hold-to-maturity” those securities so designated. More specifically, as of September 30, 2009 the Company has not decided
to sell the securities. Additionally, the Company has concluded that the possibility of being required to sell the securities prior to their anticipated recovery is unlikely based upon its strong liquidity, asset quality and capital position as of that date.
Finally, the Company purchased these securities at either discounts or nominal premiums relative to their par amounts. Accordingly, the Company expects that the securities will not
be settled for a price less than their amortized cost.
In light of the factors noted above, the Company does not consider its U.S. Government Agency mortgage-backed securities with unrealized losses at September 30, 2009 to be “other-than-temporarily”
impaired as of that date.
Private Issuer Mortgage-backed Securities
The carrying value of the Company’s private issuer mortgage-backed securities totaled $45.6 million at September 30, 2009 and 68.9% of total held-to-maturity investments and 8.7%
of total assets as of that date. At September 30, 2009, there was four securities of this type in an unrealized loss position for less than 12 months and 22 securities of this type in an unrealized loss position for 12 months or longer.
Unlike agency mortgage-backed securities, private issuer collateralized mortgage obligations are not explicitly guaranteed by a U.S. government sponsored entity. Rather, these securities
generally utilize the structure of the larger investment vehicle to reallocate credit risk among the individual tranches comprised within that vehicle. Through this process, investors in different tranches are subject to varying degrees of risk that the cash flows of their tranche will be adversely impacted by borrowers defaulting on the underlying mortgage loans. The creditworthiness of certain tranches may also be further enhanced by additional credit insurance protection embedded within the terms of the total
investment vehicle.
The Company monitors the general level of credit risk for each of its private issuer mortgage-backed securities based upon the ratings assigned to its specific tranches by one or more
credit rating agencies. The level of these ratings, and changes thereto, is one of several factors considered by the Company in identifying those securities that may be other-than-temporarily impaired. For example, all impaired private issuer mortgage-backed securities that are rated below investment grade are reviewed individually to determine if the impairment is other-than temporary.
Additional factors considered by the Company in identifying its other-than-temporarily impaired securities include, but are not limited to, the severity and duration of the impairment,
the payment performance of the underlying mortgage loans and trends relating thereto, the original terms of the underlying loans regarding credit quality (ex. Prime, Alt-A), the geographic distribution of the real estate collateral supporting those loans and any current or anticipated declines in associated collateral values, as well as the degree of protection against credit losses afforded to the Company’s security through the structural characteristics of the larger investment vehicle as noted above.
Based upon these additional factors, the impairment of certain investment grade securities may also be reviewed for other-than-temporary impairment.
74
Securities determined to be potentially other-than-temporarily impaired are individually analyzed to determine the “credit-related” and “noncredit-related” portions
of the impairment. As noted earlier, a credit-related impairment generally represents the amount by which the present value of the cash flows that are expected to be collected on an other-than-temporarily impaired security fall below its amortized cost. Projected cash flows for the Company’s private issuer mortgage-backed securities are modeled using an automated securities analytics system that is commonly used by institutional investors and the broker/dealer community. The system generates an individual
tranche’s projected cash flows based upon several input assumptions regarding the payment performance of the mortgage loans underlying the larger investment vehicle of which the Company’s tranche is a part. These assumptions include, but may not be limited to, loan prepayment rates, loan default rates, and the severity of actual losses on defaulting loans. The Company generally bases the input values for these assumptions on historical data reported by the analytics system. The Company then calculates
the present value of those cash flows based upon the appropriate discount rate required by the applicable accounting guidance.
The impairments of those securities whose cash flows, when present valued, fall below the Company’s carrying value due to expected principal losses are identified as other-than-temporary.
The amount by which the present value of the expected cash flows falls below the Company’s carrying value of the security is identified as the credit-related portion of the other-than-temporary impairment. The remaining portion, where applicable, is identified as noncredit-related, other-than-temporary impairment.
The impairments of those individually analyzed securities whose cash flows, when present valued, exceed the Company’s carrying value or otherwise reflect no expected principal
losses, are generally identified as temporary. Similarly, the impairments associated with those securities that have generally retained their investment-grade credit rating and whose additional factors, as noted above, are not characterized by potentially adverse attributes, are also generally identified as temporary. In these cases, the Company attributes the unrealized losses to the same fluctuating market-related factors as those affecting agency mortgage-backed securities, noting, in particular, the comparatively
greater temporary adverse effect on fair value arising from the general illiquidity of private issuer, investment grade mortgage-backed securities in the marketplace compared to agency-guaranteed mortgage-backed securities. In light of these factors, the related impairments are defined as “temporary”.
The classification of impairment as “temporary” is further reinforced by the Company’s stated intent and ability to “hold-to-maturity” all of its private
issuer mortgage-backed securities which allows for an adequate timeframe during which the fair values of the impaired securities are expected to recover to the level of their amortized cost. More specifically, as of September 30, 2009 the Company has not decided to sell the securities. Additionally, the Company has concluded that the possibility of being required to sell the securities prior to their anticipated recovery is unlikely based upon the its strong liquidity, asset quality and capital position as of
that date.
In light of the factors noted above, the Company concluded that six of its 33 private issuer mortgage-backed securities with amortized costs, excluding impairments, totaling approximately
$9.4 million were “other-than-temporarily” impaired by approximately $8.1 million as of September 30, 2009 comprising $2.0 million and $6.1 million of credit-related and non-credit related impairments, respectively. The Company does not consider the 26 private issuer mortgage-backed securities in an unrealized loss position with amortized costs of approximately $37.2 million to be “other-than-temporarily” impaired as of that date.
75
The following tables present a roll-forward of the credit loss component of OTTI on private issuer mortgage-backed securities for which a non-credit component of OTTI was recognized in other comprehensive loss for the year ended September 30, 2009. OTTI recognized in earnings after that date for credit-impaired debt securities
is presented as additions in two components, based upon whether the current period is the first time a debt security was credit-impaired (initial credit impairment) or is not the first time a debt security was credit impaired (subsequent credit impairment). Changes in the credit loss component of credit-impaired debt securities were as follows:
|
For the year ended September 30, 2009 |
Total Other-
Than-
Temporary Impairment
Loss |
Other-Than-
Temporary Impairment
Credit Losses
recorded in
Earnings |
Other-Than-
Temporary
Impairment Credit
Losses recorded
in Other
Comprehensive
Income |
|||||||||
|
(in thousands) |
||||||||||||
|
Beginning balance as of September 30, 2008 |
$ | - | $ | - | $ | - | ||||||
|
Add: Initial other-than-temporary credit losses |
8,085 | 2,024 | 6,061 | |||||||||
|
Additional other-than-temporary credit losses |
- | - | - | |||||||||
|
Ending balance as of September 30, 2009 |
$ | 8,085 | $ | 2,024 | $ | 6,061 | ||||||
|
(4) |
Loans, Sales and Syndications |
Gross loans held-for-sale at September 30, 2009 and 2008 are summarized as follows:
|
2009 |
2008 |
||||||||
|
(In thousands) |
|||||||||
|
Mortgage loans: |
|||||||||
|
One- to four-family |
$ | - | $ | 714 | |||||
|
Multi-family |
- | 43,249 | |||||||
|
Commercial |
- | 35,664 | |||||||
|
Construction |
- | 20,637 | |||||||
|
Land |
- | 34,774 | |||||||
|
Total |
$ | - | $ | 135,038 | |||||
The following is a summary, by type of loans, of the principal balances of whole loans and loan participation interests sold during the years ended September 30, 2009 and 2008.
76
|
2009 |
2008 |
||||||||
|
(In thousands) |
|||||||||
|
Mortgage loans: |
|||||||||
|
Multi-family |
$ | 2,183 | $ | 13,200 | |||||
|
Commercial |
1,474 | 10,625 | |||||||
|
Construction |
3,903 | 3,882 | |||||||
|
One- to four-family |
7,877 | 6,139 | |||||||
|
Total |
$ | 15,437 | $ | 33,846 | |||||
The portion of loans retained by the Bank on sales of participation interests during the years ended September 30, 2009 and 2008 were $34.5 million and $23.8 million, respectively.
In loan participation transactions, the Bank originates the full loan amount and subsequently identifies participants that purchase participation interests from the Bank. This differs from loan syndication transactions where, prior to closing the loan, the Bank identifies other lenders who agree to fund a portion of the total loan at
closing. The Bank records its share of the loan syndication as a loan receivable. The amounts funded by other lenders are not reflected as loan originations and sales in the Bank’s consolidated financial statements.
The following is a summary of loan syndication transactions completed during the years ended September 30, 2009 and 2008:
|
2009 |
2008 |
||||||||
|
(In thousands) |
|||||||||
|
Total loan amounts |
$ | 102,201 | $ | 236,562 | |||||
|
Less portion funded by other lenders |
59,357 | 135,569 | |||||||
|
Loans receivable recorded by the Bank |
$ | 42,844 | $ | 100,993 | |||||
The unpaid principal balances of whole loans and loan participation interests sold by the Bank and serviced for others at September 30, 2009 and 2008 are summarized as follows:
|
2009 |
2008 |
|||||||
|
(In thousands) |
||||||||
|
Mortgage loans: |
||||||||
|
Multi-family |
$ | 45,012 | $ | 43,126 | ||||
|
Commercial |
17,268 | 28,046 | ||||||
|
Construction |
14,788 | 15,059 | ||||||
|
One- to four-family |
14,573 | 10,963 | ||||||
|
Total |
$ | 91,641 | $ | 97,194 | ||||
In addition, the Bank serviced syndicated loan balances owned by other lenders totaling $202.6 million and $204.7 million at September 30, 2009 and 2008, respectively. At September 30, 2009 and 2008, the Bank serviced one- to four-family loans involving limited recourse of $11.3 million and $7.1 million, respectively.
77
|
(5) |
Loans Receivable, Net |
The components of the loan portfolio, excluding loans held-for-sale at September 30, 2009 and 2008, are summarized as follows:
|
2009 |
2008 |
||||||||
|
(In thousands) |
|||||||||
|
Mortgage loans: |
|||||||||
|
One- to four-family |
$ | 77,064 | $ | 82,144 | |||||
|
Multi-family |
92,399 | 32,243 | |||||||
|
Commercial |
143,239 | 103,336 | |||||||
|
Construction |
73,314 | 13,761 | |||||||
|
Land |
45,027 | 9,288 | |||||||
| 431,043 | 240,772 | ||||||||
|
Consumer and other loans: |
|||||||||
|
Personal loans |
605 | 848 | |||||||
|
Loans secured by deposit accounts |
79 | 61 | |||||||
| 684 | 909 | ||||||||
|
Total loans receivable |
431,727 | 241,681 | |||||||
|
Unearned discounts |
(87 | ) | - | ||||||
|
Deferred net loan origination fees |
(1,205 | ) | (327 | ) | |||||
|
Allowance for loan losses |
(10,750 | ) | (2,205 | ) | |||||
|
Total loans receivable, net |
$ | 419,685 | $ | 239,149 | |||||
At September 30, 2009 the Bank pledged $50.6 million in mortgage loans as collateral for borrowings from the Federal Home Loan Bank.
The Company’s loan portfolio consists primarily of residential and commercial real estate mortgage loans secured by properties located in the Company’s primary market area of New York, Kings, Nassau and Suffolk Counties of New York. The ability of the Company’s borrowers to make principal and interest payments is dependent
upon, among other things, the level of overall economic activity and the real estate market conditions prevailing within the Company’s concentrated lending area. Commercial real estate and construction loans are considered by management to be of somewhat greater credit risk than loans to fund the purchase of a primary residence due to the generally larger loan amounts and dependency on income production or sale of the real estate.
The principal balances of non-accrual loans, net of specific allowances, were as follows:
78
|
2009 |
2008 |
||||||||
|
(In thousands) |
|||||||||
|
Mortgage Loans: |
|||||||||
|
One- to four-family residential mortgage loans |
$ | - | $ | - | |||||
|
Multi-family loans |
902 | - | |||||||
|
Commercial real estate loans (except land) |
15,623 | - | |||||||
|
Land |
832 | - | |||||||
|
Construction loans |
4,722 | - | |||||||
|
Nonmortgage Loans |
|||||||||
|
Other (Personal loan) |
- | - | |||||||
|
Total non-accrual loans |
$ | 22,079 | $ | - | |||||
The Company’s total recorded investment in impaired loans, as defined by FASB ASC 310-40, was $32.4 million and $2.0 million at September 30, 2009 and September 30, 2008, respectively. All of these loans were collateral-dependent loans based on the fair value of the collateral. The Company determines the need for an allowance
for loan impairment under FASB-issued guidance on a loan-by-loan basis. An impairment allowance of $5.1 million was required at September 30, 2009 due to the adequacy of collateral values on $23.0 million in impaired loans. $9.4 million did not require an impairment allowance at September 30, 2009. No impairment allowance was required at September 30, 2008 due to the adequacy of collateral values. Interest income on impaired loans was $38,000 for the period of impairment. The
Company’s average recorded investment in impaired loans was $4.8 million during the year ended September 30, 2009, $1.4 million during the year ended September 30, 2008.
Activity in the allowance for loan losses for each of the years in the two-year period ended September 30, 2009 is summarized below. There were no charge-offs or recoveries during these years.
|
2009 |
2008 |
|||||||
|
(In thousands) |
||||||||
|
Balance, beginning of year |
$ | 2,205 | $ | 1,806 | ||||
|
Provision for loan losses |
8,545 | 399 | ||||||
|
Balance, end of year |
$ | 10,750 | $ | 2,205 | ||||
79
|
(6) |
Premises and Equipment |
Premises and equipment at September 30, 2009 and 2008 is summarized as follows:
|
2009 |
2008 |
||||||||
|
Land |
$ | 115 | $ | 115 | |||||
|
Buildings and improvements |
1,635 | 1,582 | |||||||
|
Leasehold improvements |
2,279 | 2,279 | |||||||
|
Furnishings and equipment |
1,579 | 1,435 | |||||||
|
Construction in progress |
- | 5 | |||||||
| $ | 5,608 | $ | 5,416 | ||||||
|
Less accumulated depreciation |
3,578 | 3,131 | |||||||
| $ | 2,030 | $ | 2,285 | ||||||
|
(7) |
Accrued Interest Receivable |
Accrued interest receivable at September 30, 2009 and 2008 is summarized as follows:
|
2009 |
2008 |
||||||||
|
(In thousands) |
|||||||||
|
First mortgage and other loans |
$ | 2,495 | $ | 2,130 | |||||
|
Mortgage-backed securities |
287 | 301 | |||||||
|
Other securities and interest-earning assets |
17 | 46 | |||||||
| $ | 2,799 | $ | 2,477 | ||||||
|
(8) |
Deposits |
Scheduled maturities of certificates of deposit at September 30, 2009 and 2008 are summarized as follows:
|
2009 |
2008 |
||||||||||||||||
|
Amount |
Percent |
Amount |
Percent |
||||||||||||||
|
(Dollars in thousands) |
|||||||||||||||||
|
Within one year |
$ | 190,800 | 76.07 | % | $ | 153,364 | 72.89 | % | |||||||||
|
After one but within two years |
27,342 | 10.90 | % | 35,553 | 16.90 | % | |||||||||||
|
After two but within three years |
7,336 | 2.93 | % | 5,623 | 2.67 | % | |||||||||||
|
After three but within four years |
10,656 | 4.25 | % | 5,271 | 2.51 | % | |||||||||||
|
After four years |
14,677 | 5.85 | % | 10,588 | 5.03 | % | |||||||||||
| $ | 250,811 | 100.00 | % | $ | 210,399 | 100.00 | % | ||||||||||
The aggregate amount of certificates of deposit with balances equal to or greater than $100,000 was $76.9 million and $55.1 million at September 30, 2009 and 2008, respectively. The FDIC generally insures deposit amounts up to $100,000, as defined in the applicable regulations. The maximum deposit insurance amount
has been increased from $100,000 to $250,000 until December 31, 2013. (The expiration date does not apply to retirement accounts, which are generally insured up to $250,000 per plan participant.)
80
|
(9) |
Borrowings |
The Bank’s borrowings at September 30, 2009 and 2008 consist of Federal Home Loan Bank advances with interest rates and maturity dates as summarized below. None of these advances are callable by the Federal Home Loan Bank prior to maturity.
As a member of the Federal Home Loan Bank, the Bank may have outstanding Federal Home Loan Bank borrowings of up to approximately $76.0 million and $95.5 million at September 30, 2009 and 2008, respectively, in a combination of term advances and overnight funds. The Bank’s unused Federal Home Loan Bank borrowing capacity was approximately
$48.7 million and $51.2 million at September 30, 2009 and 2008, respectively.
Borrowings are secured by the Bank’s investment in Federal Home Loan Bank stock and by a security agreement. This agreement requires the Bank to maintain as collateral certain qualifying assets (principally securities and residential mortgage loans) not otherwise pledged, with a fair value (as defined) at least equal to 120% of
outstanding advances, or $32.8 million as of September 30, 2009. The Bank satisfied its collateral requirement at September 30, 2009 and 2008.
At September 30, 2009 the Bank pledged $50.6 million of its mortgage portfolio and $44.2 million in amortized cost of its securities portfolio having a fair market value of $42.5 million.
81
| 2009 | 2008 | |||||||||||||||||
|
Principal |
Rate |
Maturity |
Principal |
Rate |
Maturity | |||||||||||||
|
(Dollars in thousands) | ||||||||||||||||||
| $ | 23,000 | 0.36 | % |
10/1/2009 |
$ | 32,300 | 1.61 | % |
10/1/2008 | |||||||||
| 10,000 | 1.56 | % |
10/10/2008 | |||||||||||||||
| 439 | 4.35 | % |
2/25/2009 | |||||||||||||||
| - | 200 | 4.61 | % |
8/31/2009 | ||||||||||||||
| - | 500 | 4.70 | % |
9/28/2009 | ||||||||||||||
|
Short-term |
23,000 | 0.36 | % | 43,439 | 1.68 | % | ||||||||||||
| 300 | 4.65 | % |
8/30/2010 |
300 | 4.65 | % |
8/30/2010 | |||||||||||
| 500 | 1.64 | % |
7/25/2011 |
300 | 4.67 | % |
8/30/2011 | |||||||||||
| 300 | 4.67 | % |
8/30/2011 |
200 | 4.71 | % |
8/30/2012 | |||||||||||
| 500 | 2.36 | % |
8/20/2012 |
|||||||||||||||
| 500 | 2.29 | % |
8/22/2012 |
|||||||||||||||
| 200 | 4.71 | % |
8/30/2012 |
|||||||||||||||
| 1,000 | 2.94 | % |
5/14/2013 |
|||||||||||||||
| 1,000 | 3.20 | % |
6/18/2014 |
|||||||||||||||
|
Long-term |
4,300 | 3.03 | % | 800 | 4.67 | % | ||||||||||||
|
Total |
$ | 27,300 | $ | 44,239 | ||||||||||||||
|
(10) |
Federal, State, and Local Taxes |
The Bank’s provision (benefit) for income taxes included in the consolidated statements of income for the years ended September 30, 2009 and 2008 are as follows:
|
2009 |
2008 |
|||||||
|
(In thousands) |
||||||||
|
Current tax expense: |
||||||||
|
Federal |
$ | 3,556 | $ | 3,285 | ||||
|
State and local |
1,320 | 903 | ||||||
|
Total current tax expense |
4,876 | 4,188 | ||||||
|
Deferred tax benefit: |
||||||||
|
Federal |
(3,136 | ) | (682 | ) | ||||
|
State and local |
(1,655 | ) | (188 | ) | ||||
|
Total deferred tax benefit |
(4,791 | ) | (870 | ) | ||||
|
Total provision for income taxes |
$ | 85 | $ | 3,318 | ||||
The reconciliation of the Bank’s U.S. statutory rate to the Bank’s effective tax rate for the years ended September 30, 2009 and 2008 is as follows:
82
|
2009 |
2008 |
||||||||
|
Statutory Federal income tax rate |
34.0 | % | 34.0 | % | |||||
|
State and local income taxes, net of Federal income tax benefits |
-16.0 | % | 5.3 | % | |||||
|
Bank owned life insurance |
-8.9 | % | -3.0 | % | |||||
|
Other |
-2.9 | % | 1.0 | % | |||||
|
Effective tax rate |
6.2 | % | 37.3 | % | |||||
The Company files a consolidated Federal income tax return on a September 30 fiscal year basis. The Company also filed New York State franchise tax and New York City financial corporation tax returns on a September 30 fiscal year basis. The Company’s annual state and city tax liability for each tax year is the greater
of a tax based on entire net income, as defined, taxable assets or an alternative tax based on a specified formula. Further, the Company is subject to a metropolitan transportation business tax surcharge based upon New York State tax liability.
The tax effects of temporary differences that give rise to significant portions of the deferred tax assets and deferred tax liabilities at September 30, 2009 and 2008 are as follows:
|
2009 |
2008 |
||||||||
|
(In thousands) |
|||||||||
|
Deferred tax assets: |
|||||||||
|
Allowance for loan losses |
$ | 4,734 | $ | 970 | |||||
|
Supplemental retirement plan |
278 | 758 | |||||||
|
Employee benefits |
165 | - | |||||||
|
Stock-based incentive plan |
819 | 688 | |||||||
|
Depreciation |
- | 220 | |||||||
|
Other than temporary impairment |
1,806 | 529 | |||||||
|
Net unrealized loss on securities |
2,485 | - | |||||||
|
Non-accrual interest |
325 | - | |||||||
|
Net loan servicing asset |
- | 25 | |||||||
|
Other |
28 | 85 | |||||||
|
Total deferred tax assets |
10,640 | 3,275 | |||||||
|
Deferred tax liabilities: |
|||||||||
|
Deferred loan costs |
(291 | ) | (251 | ) | |||||
|
Depreciation |
(39 | ) | - | ||||||
|
Net loan servicing liabilities |
(10 | ) | - | ||||||
|
Total deferred liabilities |
(340 | ) | (251 | ) | |||||
|
Net deferred tax assets (included in other assets) |
$ | 10,300 | $ | 3,024 | |||||
83
Management believes that it is more likely than not that the consolidated results of future operations of the Bank will generate sufficient taxable income to realize the deferred tax assets of the Bank. Management believes that it is more likely than not to generate sufficient capital gains to realize the deferred tax asset associated
with the other than temporary impairment charge on the mutual fund investment. Therefore, a valuation allowance against the gross deferred tax assets was not considered necessary at September 30, 2009 and 2008.
As a thrift institution, the Bank is subject to special provisions in the tax laws regarding its allowable tax bad debt deductions and related tax bad debt reserves. These deductions are determined using methods based on loss experience or a percentage of taxable income. Tax bad debt reserves represent the excess of allowable deductions
over actual bad debt losses, and include a defined base-year amount. Deferred tax liabilities are recognized with respect to reserves in excess of the base-year amount, as well as any portion of the base-year amount that is expected to become taxable (or “recaptured”) in the foreseeable future.
The Bank’s base-year tax bad debt reserves totaled $1.6 million for Federal tax purposes and $2.6 million for State tax purposes at September 30, 2009 and 2008. Deferred tax liabilities have not been recognized with respect to these reserves, since the Bank does not expect that these amounts will become taxable in the foreseeable
future. Under the tax laws, events that would result in taxation of these reserves include failure of the Bank to maintain a specified qualifying assets ratio or meet other thrift definition tests for New York State tax purposes. Federal base-year reserves are subject to recapture if the Bank makes certain non-dividend distributions, repurchases any of its stock, pays dividends in excess of tax earnings and profits, or ceases to maintain a thrift or bank charter. The unrecognized deferred tax liabilities
with respect to the Bank’s base-year reserves totaled approximately $0.8 million at both September 30, 2009 and 2008.
|
(11) |
Defined Contribution Plan and Supplemental Executive Retirement Plan |
The Company has a non-contributory defined contribution plan, which covers all employees with a minimum of two years of service who are at least 21 years of age. The Company recorded pension expenses of $275,000 and $220,000 for the years ended September 30, 2009 and 2008, respectively. Contributions are made annually for each
employee based upon a fixed percentage of compensation and were $230,000 and $187,000 for the years ended September 30, 2009 and 2008, respectively.
The Company has also established a Supplemental Executive Retirement Plan, which is a non-qualified plan providing certain executives with supplemental retirement benefits. The periodic pension expense for the supplemental plan amounted to $851,000 and $126,000 for the years ended September 30, 2009 and 2008, respectively. The
accrued liability on the supplemental plan was $0.6 million and $1.7 million at September 30, 2009 and 2008, respectively, all of which is unfunded. The accrued liability decreased due to a payout made during the year to a retired officer.
|
(12) |
Employee Stock Ownership Plan |
In connection with the Reorganization and Offering in April 2005, the Company established an ESOP for eligible employees who meet certain age and service requirements. The ESOP borrowed $3,174,000 from the Company and used the funds to purchase 317,400 shares of common stock as part of the Offering. The Bank makes
a periodic contribution to the ESOP sufficient to satisfy the debt service requirements of the loan, which has a 20-year term and bears interest at the prime rate set on November 1st of each year. The ESOP uses this contribution and any dividends received by the ESOP on unallocated shares to make the principal and interest payment on the loan.
84
ESOP shares are held by the plan trustee in a suspense account until allocated to participant accounts. Shares released from the suspense account are allocated to participants on the basis of their relative compensation in the year of allocation. Participants become vested in the allocated shares over a period not
to exceed five years. Any forfeited shares are allocated to other participants in the same proportion as contributions.
ESOP expense was $196,000 and $207,000 for the years ended September 30, 2009 and 2008, respectively. At September 30, 2009, 14,548 shares have been committed to be released for allocation and 63,480 shares have been allocated. The cost of ESOP shares that have not yet been allocated to participants or committed
to be released for allocation is deducted from stockholders’ equity (239,372 shares with a cost of approximately $2,393,720 and fair value of approximately $2,920,338 at September 30, 2009).
|
(13) |
Stock-Based Incentive Plan |
The Company has a stock-based incentive plan that consists of: stock options and restricted stock awards. At the annual meeting held on April 11, 2006, stockholders of the Company approved the Brooklyn Federal Bancorp, Inc. 2006 Stock-Based Incentive Plan. The plan authorizes the award of up to 648,025 shares as stock options and 259,210
shares as restricted stock awards. On January 16, 2007, non-employee directors received in aggregate 137,500 options with an exercise price of $13.30 and 55,000 shares of restricted stock. On January 16, 2007, certain officers of the Company and Bank received in aggregate 415,000 options with an exercise price of $13.30 and 166,000 shares of restricted stock. During the quarter ended March 31, 2007 a resigned officer forfeited 10,050 options and 4,000 restricted stock shares. On June 19, 2007 the remaining
42,210 restricted stock shares were granted to non-employee directors of 9,802 shares, officers and employees of the Company and the Bank of 32,408 shares. On August 21, 2007, 24,506 stock options were granted to a non-employee director and 81,069 were granted to officers and employees of the Company and the Bank at an exercise price of $13.74. During the quarter ended September 30, 2007, 27,500 granted stock options and 11,096 granted restricted stock awards were forfeited due to the resignation of
a non-employee director. On September 18, 2007 the 11,096 forfeited restricted stock awards were granted to non-employee directors. The Company adopted FASB-issued guidance upon approval of the Plan, and began to expense the fair value of all options over their vesting periods and began to expense the fair value of all restricted stock grants over the requisite vesting periods.
Employee options and non-employee director options generally vest over a seven-year service period, except in cases where retirement qualifications come into effect, which accelerates the vesting upon granting. Management estimated the fair values relating to all of the fiscal year 2007 option grants using the Black-Sholes option-pricing
model. Since there was limited historical information on the volatility of the Company’s stock, management based expectations about future volatility on the average volatilities of similar entities for an appropriate period following their initial public offering. Management estimated the expected life of the options assuming that it must be more than the vesting period, and no greater than the contractual life, ten years, in conjunction with an evaluation of the grantees’ ages and lengths of service.
The Treasury yield in effect at the time of the grant provides the risk-free rate for periods within the vesting life of the option. Management recognizes compensation expense for the fair values of these awards, which have graded vesting, on a straight-line basis over the requisite vesting and service period of the awards. The weighted-average grant-date fair value of options granted during the year ended September 30, 2007 was $3.57. There were no options granted during the years ended September
30, 2009 and 2008.
Management used the following assumptions to estimate the fair values of options granted:
|
Year Ended September 30, 2007 | |||||
|
Weighted average risk-free interest rate |
4.68 | % | |||
|
Expected dividend yield |
1.87 | % | |||
|
Weighted average volatility factor of the expected market price of the Company’s common stock |
21.90 | % | |||
|
Weighted average expected life of the options |
6.8 | years | |||
85
Restricted shares generally vest in full after five years. The product of the number of shares granted and the grant date market price of the Company’s common stock determine the fair value of restricted shares under the Company’s stock-based incentive plan. Management recognizes compensation expense for the fair value of
restricted shares on a straight-line basis over the requisite vesting or service period of five years. The weighted-average grant-date fair value of restricted stock awards during the year ended September 30, 2007 was $13.68. There were no restricted stock awards during the years ended September 30, 2009 and 2008.
During the years ended September 30, 2009 and 2008, the Company recorded $313,000 and $312,000 of stock-based incentive compensation expense, comprised of stock option expense of $133,000 and $133,000 and $180,000 and $179,000 of restricted stock expense, respectively. The tax benefit recognized on the stock-based incentive
compensation was $102,000 for both years ended September 30, 2009 and 2008.
The following is a summary of the Company’s stock option activity and related information for its option plan for the year ended September 30, 2009:
|
Options |
Weighted Average Exercise Price |
Weighted Average Remaining
Contractual Term |
Aggregate
Intrinsic Value |
||||||||||
|
(In thousands, except per share amounts) |
|||||||||||||
|
Outstanding at September 30, 2008 |
621 |
$ |
13.37 |
8.4 |
years |
$ |
881 |
||||||
|
Granted |
— |
$ |
— |
$ |
— |
||||||||
|
Exercised |
— |
$ |
— |
$ |
— |
||||||||
|
Forfeited |
— |
$ |
— |
$ |
— |
||||||||
|
Outstanding at September 30, 2009 |
621 |
$ |
13.37 |
7.4 |
years |
$ |
— |
||||||
|
Exercisable at September 30, 2009 |
454 |
$ |
13.34 |
7.4 |
years |
$ |
— |
||||||
Upon exercise of vested options, management expects to draw on treasury stock as the source of the shares. As of September 30, 2009, the Company has 593,456 shares of treasury stock.
Expected future compensation expense relating to the 167,089 unexercisable options outstanding as of September 30, 2009 is approximately $600,404 over a weighted average period of 4.4 years. As of September 30, 2009, there were 27,500 shares remaining available for future option grants under the plan.
86
The following is a summary of the status of the Company’s restricted share awards as of September 30, 2009:
|
|
Restricted
Shares |
Weighted Average
Grant Date Fair
Value |
||||||
|
(In thousands, except per share amounts) |
||||||||
|
Non-vested at September 30, 2008 |
53 | $ | 13.50 | |||||
|
Granted |
— | $ | — | |||||
|
Vested |
(13 | ) | $ | 13.50 | ||||
|
Forfeited |
— | $ | — | |||||
|
Non-vested at September 30, 2009 |
40 | $ | 13.50 | |||||
During the years ended September 30, 2009 and 2008, the total fair value of restricted shares that vested was $175,000 and $164,000, respectively. Expected future compensation expense relating to the 39,664 non-vested restricted shares at September 30, 2009 is $417,000 over a weighted average period of 2.4 years. As of September
30, 2009, there were no shares remaining available for future restricted stock grants under the plan.
|
(14) |
Regulatory Capital |
The Bank is subject to various regulatory capital requirements administered by the federal banking agencies. Failure to meet minimum capital requirements can initiate certain mandatory, and possibly additional discretionary, actions by regulators that, if undertaken, could have a direct material effect on a bank’s financial statements.
Under capital adequacy guidelines and the regulatory framework for prompt corrective action, the Bank must meet specific capital guidelines that involve quantitative measures of the Bank’s assets, liabilities, and certain off-balance-sheet items as calculated under regulatory accounting practices. The Bank’s capital amounts and classifications are also subject to qualitative judgments by the regulators about components, risk weightings, and other factors.
Quantitative measures established by regulation to ensure capital adequacy requires the Bank to maintain minimum amounts and ratios (set forth in the table below) of total and Tier I risk-based capital to risk-weighted assets, and of leverage and tangible capital to adjusted total assets. Management believes, as of September 30, 2009
and 2008, that the Bank met all capital adequacy requirements to which it was subject.
As of September 30, 2009, the most recent notification from the FDIC categorized the Bank as “well capitalized” under the regulatory framework for prompt corrective action. To be categorized as “well capitalized” the Bank must maintain minimum total risk-based, Tier I risk-based and Tier I leverage ratios as set
forth in the table. There are no conditions or events since that notification that management believes have changed the Bank’s category.
87
The Bank’s actual capital amounts and ratios are also presented in the table:
|
Actual |
For capital adequacy purposes |
To be well
capitalized under
prompt corrective
action provisions |
||||||||||||||||||||||
|
Amount |
Ratio |
Amount |
Ratio |
Amount |
Ratio |
|||||||||||||||||||
|
(Dollars in thousands) |
||||||||||||||||||||||||
|
At September 30, 2009: |
||||||||||||||||||||||||
|
Total risk-based capital (to risk weighted assets) |
$ | 79,779 | 14.5 | % | $ | 43,938 | 8.0 | % | $ | 54,922 | 10.0 | % | ||||||||||||
|
Tier I risk-based capital (to risk weighted assets) |
71,192 | 13.0 | % | 21,969 | 4.0 | % | 32,953 | 6.0 | % | |||||||||||||||
|
Tangible capital (to tangible assets) |
71,192 | 13.8 | % | 7,760 | 1.5 | % | N/A | N/A | ||||||||||||||||
|
Tier I leverage (core) capital (to adjusted tangible assets) |
71,192 | 13.8 | % | 15,521 | 3.0 | % | 25,868 | 5.0 | % | |||||||||||||||
|
At September 30, 2008: |
||||||||||||||||||||||||
|
Total risk-based capital (to risk weighted assets) |
$ | 77,973 | 20.9 | % | $ | 29,791 | 8.0 | % | $ | 37,238 | 10.0 | % | ||||||||||||
|
Tier I risk-based capital (to risk weighted assets) |
75,182 | 20.2 | % | 14,895 | 4.0 | % | 22,343 | 6.0 | % | |||||||||||||||
|
Tangible capital (to tangible assets) |
75,182 | 15.6 | % | 7,242 | 1.5 | % | N/A | N/A | ||||||||||||||||
|
Tier I leverage (core) capital (to adjusted tangible assets) |
75,182 | 15.6 | % | 14,483 | 3.0 | % | 24,139 | 5.0 | % | |||||||||||||||
The following is a reconciliation of the Bank’s equity under GAAP and its regulatory capital amounts at September 30, 2009 and 2008:
|
2009 |
2008 |
|||||||
|
(In thousands) |
||||||||
|
Equity under GAAP |
$ | 74,161 | $ | 75,768 | ||||
|
Deduct: |
||||||||
|
Disallowed servicing assets, disallowed deferred tax assets |
2,959 | 586 | ||||||
|
Net unrealized gain on securities available for sale, net of income taxes |
10 | - | ||||||
|
Tangible capital, Tier I (core) capital and Tier 1 risk-based capital |
71,192 | 75,182 | ||||||
|
Allowance for loan losses includable in regulatory capital |
5,618 | 2,205 | ||||||
|
Net unrealized gain on securities available for sale, net of income taxes |
10 | - | ||||||
|
Disallowed servicing assets, disallowed deferred tax assets |
2,959 | 586 | ||||||
|
Total risk-based capital |
$ | 79,779 | $ | 77,973 | ||||
Dividends
When the Company pays dividends to its stockholders, it is also required to pay dividends to BFS Bancorp, MHC, unless BFS Bancorp, MHC elects to waive the receipt of dividends. Any decision to waive dividends will be subject to regulatory approval. Under OTS regulations, public stockholders would not be diluted for
any dividends waived by BFS Bancorp, MHC in the event BFS Bancorp, MHC converts to stock form. The cumulative amount of dividends waived by BFS Bancorp, MHC through September 30, 2009 was $7.3 million. The amount of dividends waived by BFS Bancorp, MHC for fiscal year 2009 was $3.7 million. The dividends waived are considered as a restriction on the retained earnings of the Company.
88
Dividends from the Company will depend, in part, upon receipt of dividends from the Bank, because the Company presently has no source of income other than dividends from the Bank, earnings from the investment of offering proceeds it retained and interest on the Company’s loan to the employee stock ownership plan. A regulation
of the OTS imposes limitations on “capital distributions” by savings institutions such as the Bank. The Company, however, will not be subject to OTS regulatory restrictions on the payment of dividends.
|
(15) |
Commitments and Contingencies |
In the ordinary course of the Bank’s business, there are various outstanding legal proceedings. In the opinion of management, after consultation with legal counsel, the outcome of these legal proceedings will not have a material effect on the financial position, results of operations or liquidity position of the Bank or the Company.
The principal commitments and contingent liabilities of the Bank are discussed below.
Lease Commitments
At September 30, 2009, the Bank was obligated under non-cancelable operating leases on property used for banking purposes. These leases contain escalation clauses, which provide for minimum annual rental payments and payment of real estate taxes and other occupancy expense, that may be increased based upon increases in real estate taxes
and in the other occupancy expenses. Rental expense was $690,000 and $670,000 for the years ended September 30, 2009 and 2008, respectively.
The projected minimum rental payments by fiscal year under the terms of the leases at September 30, 2009 are approximately as follows:
|
Year |
Amount |
|||
|
(In thousands) |
||||
|
2010 |
534 | |||
|
2011 |
546 | |||
|
2012 |
495 | |||
|
2013 |
351 | |||
|
2014 |
325 | |||
|
Thereafter |
890 | |||
| $ | 3,141 | |||
Loan Commitments
At September 30, 2009 and 2008, outstanding commitments made by the Bank for commercial and residential mortgages, undisbursed construction loans, and home equity lines of credit approximated $121.4 million and $175.8 million, respectively. The commitments at September 30, 2009 consisted of adjustable or variable rate commitments of $120.0
million and fixed-rate commitments of $1.4 million. The adjustable or variable rate commitments carry interest rates ranging from 2.25% to 10.25%. The fixed-rate commitments carried interest rates ranging from 4.875% to 7.5%. At September 30, 2009 there were no commitments to sell whole loans and the Bank had one standby letter of credit of approximately $2.1 million.
89
For commitments to originate loans, the Bank’s maximum exposure to credit risk is represented by the contractual amount of those instruments. Commitments represent exposure to credit risk only to the extent that they are subsequently drawn upon by customers. Some commitments have fixed expirations and, consequently, may not represent
future cash requirements. The Bank uses the same credit policies and underwriting standards in making loan commitments as it does for on-balance-sheet instruments. For loan commitments, the Bank would generally be exposed to interest rate risk from the time a commitment is issued with a defined contractual interest rate.
|
(16) |
Related Party Transactions |
As of September 30, 2009 and 2008, the Bank had approximately $0.1 million and $0.2 million, respectively, of mortgage loans to its officers and related parties, with interest rates at 5.00% at September 30, 2009 and varying between 5.00% and 5.13% at September 2008. During the
year ended September 30, 2009, related party loans repaid were approximately $0.1 million which included the repayment of two loans. There were no new loans or advances during the year ended September 30, 2009, and the one remaining loan will mature within 30 years.
|
(17) |
Financial Instrument Fair Value Disclosures |
FASB issued guidance regarding Fair Value Measurements, which defines fair value, establishes a framework for measuring fair value under GAAP, and expands disclosures about fair value measurements. This guidance applies to other accounting pronouncements that require or permit fair value measurements. The Company
adopted the guidance effective for its fiscal year beginning October 1, 2008. The primary effect of the FASB-issued guidance on the Company was to expand the required disclosures pertaining to the methods used to determine fair values.
The FASB-issued guidance establishes a fair value hierarchy that prioritizes the inputs to valuation methods used to measure fair value. The hierarchy gives the highest priority to unadjusted quoted prices in active markets for identical assets or liabilities (Level 1 measurements) and the lowest priority to unobservable inputs
(Level 3 measurements). The three levels of the fair value hierarchy under this guidance are as follows:
Level 1: Quoted prices in active markets for identical assets or liabilities.
Level 2: Observable inputs other than Level 1 prices, such as quoted for similar assets or liabilities; quoted prices in markets that are not active; or inputs that are observable or can be corroborated by observable market data for substantially the
full term of the assets or liabilities.
Level 3: Unobservable inputs that are supported by little or no market activity and that are significant to the fair value of the assets or liabilities. Level 3 assets and liabilities include financial instruments whose value is determined using pricing
models, discounted cash flow methodologies, or similar techniques, as well as instruments for which the determination of fair value requires significant management judgment or estimation.
An asset’s or liability’s level within the fair value hierarchy is based on the lowest level of input that is significant to the fair value measurement.
For financial assets measured at fair value on a recurring basis, the fair value measurements by level within the fair value hierarchy as reported on the consolidated statement of financial condition at September 30, 2009 and 2008 are as follows (in thousands):
90
|
(Level 1) |
||||||||||||||||
|
Quoted Prices |
(Level 2) |
|||||||||||||||
|
in Active |
Significant |
(Level 3) |
||||||||||||||
|
Markets for |
Other |
Significant |
||||||||||||||
|
Identical |
Observable |
Unobservable |
||||||||||||||
|
Description |
September 30, 2009 |
Assets |
Inputs |
Inputs |
||||||||||||
|
Securities available-for-sale |
$ | 3,305 | $ | 3,305 | $ | -- | $ | -- | ||||||||
|
(Level 1) |
||||||||||||||||
|
Quoted Prices |
(Level 2) |
|||||||||||||||
|
in Active |
Significant |
(Level 3) |
||||||||||||||
|
Markets for |
Other |
Significant |
||||||||||||||
|
Identical |
Observable |
Unobservable |
||||||||||||||
|
Description |
September 30, 2008 |
Assets |
Inputs |
Inputs |
||||||||||||
|
Securities available-for-sale |
$ | 3,655 | $ | 3,655 | $ | -- | $ | -- | ||||||||
For financial assets measured at fair value on a nonrecurring basis, the fair value measurements by level within the fair value hierarchy as reported on the consolidated statement of financial condition at September 30, 2009 is as follows (in thousands):
|
(Level 1) |
||||||||||||||||
|
Quoted Prices |
(Level 2) |
|||||||||||||||
|
in Active |
Significant |
(Level 3) |
||||||||||||||
|
Markets for |
Other |
Significant |
||||||||||||||
|
Identical |
Observable |
Unobservable |
||||||||||||||
|
Description |
September 30, 2009 |
Assets |
Inputs |
Inputs |
||||||||||||
|
Impaired loans |
$ | 17,880 | $ | - | $ | - | $ | 17,880 | ||||||||
|
Impaired securities |
724 | - | 724 | - | ||||||||||||
The following valuation techniques were used to measure fair value of assets in the tables above:
Securities available-for-sale – The fair value of the securities was obtained through a primary broker/dealer from readily available price quotes as of September 30, 2009.
Impaired loans –The Company has measured impairment generally based on the fair value of the loan’s collateral. Fair value is generally determined based upon independent third party appraisals of the properties, or discounted cash flows based upon the expected proceeds. These assets are included as Level
3 fair values, based upon the lowest level of input that is significant to the fair value measurements. The fair value consists of the loan balances less their specific valuation allowances.
Impaired securities – The Company has measured impairment generally based on the fair values of securities (impaired) that are primarily determined by obtaining matrix pricing, which is a mathematical technique widely used in the industry to value debt securities without relying exclusively on quoted prices for the specific
securities but rather by relying on the securities’ relationship to other benchmark quoted securities (Level 2 inputs).
91
Fair value disclosures are required for financial instruments for which it is practicable to estimate fair value. The definition of a financial instrument includes many of the assets and liabilities recognized in the Bank’s consolidated statements of financial condition, as well as certain off-balance sheet items. Fair value is
defined as the amount at which a financial instrument could be exchanged in a current transaction between willing parties, other than in a forced sale or liquidation.
Quoted market prices are used to estimate fair values when those prices are available. However, active markets do not exist for many types of financial instruments. Consequently, fair values for these instruments must be estimated by management using techniques such as discounted cash flow analysis and comparison to similar instruments.
Estimates developed using these methods are highly subjective and require judgments regarding significant matters such as the amount and timing of future cash flows and the selection of discount rates that appropriately reflect market and credit risks. Changes in these judgments often have a material effect on the fair value estimates. Since these estimates are made as of a specific point in time, they are susceptible to material near-term changes. Fair values disclosed do not reflect any premium or discount
that could result from the sale of a large volume of a particular financial instrument, nor do they reflect possible tax ramifications or estimated transaction costs.
The following table summarizes the carrying value and estimated fair value of the Company’s financial instruments at September 30, 2009 and 2008:
|
September 30, 2009 |
September 30, 2008 |
|||||||||||||||
|
Carrying |
Estimated |
Carrying |
Estimated |
|||||||||||||
|
value |
fair value |
value |
fair value |
|||||||||||||
|
(In thousands) |
||||||||||||||||
|
Financial assets: |
||||||||||||||||
|
Cash and due from banks |
$ | 3,472 | $ | 3,472 | $ | 5,053 | $ | 5,053 | ||||||||
|
Certificates of deposit |
-- | -- | 1,397 | 1,405 | ||||||||||||
|
Securities available-for-sale |
3,305 | 3,305 | 3,655 | 3,655 | ||||||||||||
|
Securities held-to-maturity |
66,201 | 59,334 | 78,086 | 70,996 | ||||||||||||
|
Loans held-for-sale |
-- | -- | 134,171 | 134,312 | ||||||||||||
|
Loans receivable, net |
419,685 | 421,085 | 239,149 | 239,403 | ||||||||||||
|
FHLB stock |
2,382 | 2,382 | 2,802 | 2,802 | ||||||||||||
|
Accrued interest receivable |
2,799 | 2,799 | 2,477 | 2,477 | ||||||||||||
|
Financial liabilities: |
||||||||||||||||
|
Deposits |
402,070 | 405,548 | 342,475 | 346,053 | ||||||||||||
|
Borrowings |
27,300 | 27,390 | 44,239 | 44,830 | ||||||||||||
|
Accrued Interest Payable |
24 | 24 | 43 | 43 | ||||||||||||
The following methods and assumptions were utilized by the Company in estimating the fair values of its financial instruments at September 30, 2009 and 2008:
|
(a) |
Cash and Due from Banks |
The estimated fair values of cash and due from banks are assumed to equal the carrying values, as these balances are due on demand.
92
|
(b) |
Certificates of Deposit |
The estimated fair values of the investment of certificates of deposit represent contractual cash flows discounted using interest rates that would be currently received on these deposits with similar characteristics and remaining maturities.
| (c) | Securities Available-for-Sale and Held-to-Maturity |
The estimated fair values for securities available-for-sale were based principally on quoted market prices. The fair values of securities held-to-maturity (carried at amortized cost) are primarily determined by obtaining
matrix pricing, which is a mathematical technique widely used in the industry to value debt securities without relying exclusively on quoted prices for the specific securities but rather by relying on the securities’ relationship to other benchmark quoted securities (Level 2 inputs).
| (d) | Loans Held-for-Sale |
The estimated fair value of loans held-for-sale is based on current prices established in the secondary market, or for those loans committed to be sold, based upon the price established by the commitment.
| (e) | Loans Receivable, Net |
The loan portfolio was segregated into various components for valuation purposes in order to group loans based on their significant financial characteristics, such as type of interest rate (adjustable or fixed) and payment status (performing or non-performing).
Fair values were estimated for each component as described below.
The fair values of performing mortgage loans and consumer loans were estimated by discounting the anticipated cash flows from the respective portfolios. The discount rates reflected current market rates for loans with similar terms to borrowers of similar credit quality.
The fair values of non-performing mortgage loans and consumer loans were based on recent collateral appraisals or management’s analysis of estimated cash flows discounted at rates commensurate with the credit risk involved.
| (f) | Federal Home Loan Bank Stock |
The estimated fair value of the Bank’s investment in Federal Home Loan Bank stock is deemed to equal its carrying value, which represents the price at which it may be redeemed.
| (g) | Accrued Interest Receivable and Payable |
The fair value of accrued interest receivable and payable is estimated to be the carrying value since it is currently due.
| (h) | Deposits |
The estimated fair value of deposits with no stated maturity, which include NOW, money market, and passbook savings accounts are deemed to be equal to the amount payable on demand at the valuation date. The estimated fair values of certificates of deposit represent contractual cash flows discounted using interest rates currently offered
on deposits with similar characteristics and remaining maturities.
93
| (i) | Borrowings |
The fair values of borrowings are estimated using a discounted cash flow analysis based on the current incremental borrowing rates for similar types of borrowing arrangements.
| (j) | Commitments |
Fair values of commitments outstanding are estimated based on the fees that would be charged for similar agreements, considering the remaining term of the agreement, the rate offered and the creditworthiness of the parties. The estimated fair values of commitments outstanding as of September 30, 2009 and 2008 are not considered significant
and are not included in the above table.
|
(18) |
Earnings Per Common Share |
The following is a summary of the calculation of earnings per share (EPS):
|
Years Ended September 30, |
||||||||
|
2009 |
2008 |
|||||||
|
Net Income |
$ | 1,287 | $ | 5,581 | ||||
|
Weighted average common shares outstanding for computation of basic EPS |
12,638,722 | 12,865,569 | ||||||
|
Dilutive common-equivalent shares |
4,891 | 9,195 | ||||||
|
Weighted average common shares for computation of diluted EPS |
12,643,613 | 12,874,764 | ||||||
|
Earnings per common share: |
||||||||
|
Basic |
$ | 0.10 | $ | 0.43 | ||||
|
Diluted |
$ | 0.10 | $ | 0.43 | ||||
|
(19) |
Impact of Accounting Standards and Interpretations |
In June 2009, FASB issued a standard that establishes the FASB Accounting Standards Codification (the “Codification”) as the source of authoritative GAAP for nongovernmental entities. The Codification supersedes all existing non-SEC accounting and reporting standards. Rules and interpretative releases of the SEC under
the authority of Federal securities laws remain authoritative GAAP for SEC registrants. The Codification is effective for financial statements issued for interim and annual periods ending after September 15, 2009. The adoption of the Codification did not have any impact on the Company’s financial condition, results of operations or amounts reported in financial statement disclosures.
94
In December 2008, the FASB issued new accounting guidance related to employer’s disclosures about plan assets of a defined benefit pension or other postretirement plan. This guidance clarifies that the objectives of the disclosures about postretirement benefit plan assets are to provide users of financial statements with
an understanding of: (1) how investment allocation decisions are made, including the factors that are pertinent to an understanding of investment policies and strategies; (2) the major categories of plan assets; (3) the inputs and valuation techniques used to measure the fair value of plan assets; (4) the effect of fair value measurements using significant unobservable inputs (Level 3) on changes in plan assets for the period; and (5) significant concentrations of risk within plan assets. In addition,
this guidance expands the disclosures related to these overall objectives. The disclosures about plan assets required by this guidance are effective for fiscal years ending after December 15, 2009. Upon initial application, the disclosures are not required for earlier periods that are presented for comparative purposes, although earlier application is permitted.
In June 2009, the FASB issued new accounting guidance related to accounting for transfers of financial assets. This guidance eliminates the concept of a qualifying special-purpose entity; changes the requirements for derecognizing financial assets; and requires additional disclosures. This guidance enhances information
reported to users of financial statements by providing greater transparency about transfers of financial assets and an entity’s continuing involvement in transferred financial assets. This guidance is effective as of the beginning of a reporting entity’s first annual reporting period that begins after November 15, 2009. We are currently evaluating the impact this guidance will have on our financial condition and results of operations.
In August 2009, the FASB issued new accounting guidance related to the measurement of the fair value of a liability in the absence of a quoted price in an active market for an identical liability. This guidance is effective for the first reporting period, including interim periods, beginning after August 2009, with early
application permitted if financial statements for prior periods have not been issued. Revisions resulting from a change in valuation technique or its application shall be accounted for as a change in accounting estimate. In the period of adoption, a reporting entity shall disclose a change, if any, in valuation technique and related inputs resulting from the application of this guidance and quantify the total effect, if practicable. As we do not have any material liabilities measured
at fair value on a recurring or non-recurring basis, this guidance will not have a material effect on our financial condition or results of operations.
In June 2008, the FASB issued guidance that requires unvested share-based payment awards that contain non-forfeitable rights to dividends or dividend equivalents to be treated as participating securities and, therefore, included in the earnings allocation in computing earnings per share under the two-class method. This guidance is
effective for financial statements issued for fiscal years beginning after December 15, 2008, and interim periods within those years. Upon adoption, all previously reported earnings per share data must be retroactively adjusted to conform with the requirements of this guidance. The adoption of this guidance will not have a material impact on the Company’s calculation of earnings per share.
In December 2007, the FASB issued a new standard on accounting for business combinations that requires the acquiring entity in a business combination to recognize all (and only) the assets acquired and liabilities assumed in the transaction; establishes the acquisition-date fair value as the measurement objective for all assets acquired
and liabilities assumed; and requires the acquirer to disclose the information necessary to evaluate and understand the nature and financial effect of the business combination. This standard applied prospectively to business combinations for which the acquisition date is on or after the beginning of the first fiscal year that commences after December 15, 2008. The Company will apply this standard to any business combinations that may occur after the effective date, and believes that its application could
have a material impact on its accounting for these transactions.
In August 2009, the FASB issued new accounting guidance related to the measurement of the fair value of a liability in the absence of a quoted price in an active market for an identical liability. This guidance is effective for the first reporting period, including interim periods, beginning after August 2009, with early application
permitted if financial statements for prior periods have not been issued. Revisions resulting from a change in valuation technique or its application shall be accounted for as a change in accounting estimate. In the period of adoption, a reporting entity shall disclose a change, if any, in valuation technique and related inputs resulting from the application of this guidance and quantify the total effect, if practicable. As we do not have any material liabilities measured at fair
value on a recurring or non-recurring basis, this guidance will not have a material effect on our financial condition or results of operations.
95
|
(20) |
Condensed Parent Company Financial Statements |
Set forth below are the condensed statements of financial condition and related condensed statements of income and cash flows as of September 30, 2009 and 2008:
|
2009 |
2008 |
|||||||
|
Condensed Statements of Financial Condition |
(In thousands) |
|||||||
|
Assets: |
||||||||
|
Cash |
$ | 4,594 | $ | 6,009 | ||||
|
Loans receivable from ESOP |
2,768 | 2,857 | ||||||
|
Investment in Brooklyn Federal Savings Bank |
74,100 | 75,706 | ||||||
|
Other investments |
100 | 100 | ||||||
|
Accrued interest receivable |
101 | 196 | ||||||
|
Other assets |
1,232 | 1,604 | ||||||
|
Total assets |
$ | 82,895 | $ | 86,472 | ||||
|
Liabilities |
$ | 1,021 | $ | 149 | ||||
|
Stockholders’ equity |
81,874 | 86,323 | ||||||
|
Total liabilities and stockholders’ equity |
$ | 82,895 | $ | 86,472 | ||||
| 2009 | 2008 | |||||||
|
(In thousands) |
||||||||
|
Condensed Statements of Income |
||||||||
|
Interest income |
$ | 119 | $ | 219 | ||||
|
Non-interest expense |
898 | 730 | ||||||
|
Income tax benefit |
(343 | ) | (226 | ) | ||||
|
Loss before equity in undistributed earnings of subsidiary |
(436 | ) | (285 | ) | ||||
|
Equity in undistributed earnings of Brooklyn Federal Savings Bank |
1,723 | 5,866 | ||||||
|
Net income |
$ | 1,287 | $ | 5,581 | ||||
96
|
2009 |
2008 |
|||||||
|
Condensed Statements of Cash Flows |
(In thousands) |
|||||||
|
Cash flows from operating activities: |
||||||||
|
Net income: |
$ | 1,287 | $ | 5,581 | ||||
|
Adjustments to reconcile net income to net cash provided by operating activities: |
||||||||
|
Equity in undistributed earnings of the Bank |
(1,723 | ) | (5,866 | ) | ||||
|
Stock-based incentive plan |
313 | 312 | ||||||
|
Decrease (increase) in accrued interest receivable |
95 | 26 | ||||||
|
Decrease in other assets |
372 | 1,767 | ||||||
|
Increase (decrease) in other liabilities |
872 | (1,028 | ) | |||||
|
Net cash provided by operating activities |
1,216 | 792 | ||||||
|
Cash flows from investing activities: |
||||||||
|
Repayment on ESOP loan |
88 | 76 | ||||||
|
Net cash provided by investing activities |
88 | 76 | ||||||
|
Cash flows from financing activities: |
||||||||
|
Purchase of treasury stock |
(1,264 | ) | (3,975 | ) | ||||
|
Payment of cash dividend |
(1,455 | ) | (1,121 | ) | ||||
|
Net cash used in financing activities |
(2,719 | ) | (5,096 | ) | ||||
|
Net decrease in cash |
(1,415 | ) | (4,228 | ) | ||||
|
Cash at beginning of period |
6,009 | 10,237 | ||||||
|
Cash at end of period |
$ | 4,594 | $ | 6,009 | ||||
97
|
(21) |
Quarterly Results of Operations (Unaudited) |
The following is a condensed summary of quarterly results of operations for the years ended September 30, 2009 and 2008:
|
First |
Second |
Third |
Fourth |
|||||||||||||
|
Quarter |
Quarter |
Quarter |
Quarter |
|||||||||||||
|
(In thousands, except per share amount) |
||||||||||||||||
|
Year ended September 30, 2009 |
||||||||||||||||
|
Interest income |
$ | 8,175 | $ | 8,427 | $ | 8,820 | $ | 8,689 | ||||||||
|
Interest expense |
2,622 | 2,555 | 2,377 | 2,256 | ||||||||||||
|
Net interest income before provision for loan losses |
5,553 | 5,872 | 6,443 | 6,433 | ||||||||||||
|
Provision for loan losses |
747 | 93 | 376 | 7,329 | ||||||||||||
|
Non-interest income (loss) |
(34 | ) | 222 | 458 | (1,382 | ) | ||||||||||
|
Non-interest expense |
3,226 | 3,709 | 3,560 | 3,153 | ||||||||||||
|
Income (loss) before income tax expense |
1,546 | 2,292 | 2,965 | (5,431 | ) | |||||||||||
|
Income tax expense (benefit) |
571 | 843 | 1,226 | (2,555 | ) | |||||||||||
|
Net income (loss) |
$ | 975 | $ | 1,449 | $ | 1,739 | $ | (2,876 | ) | |||||||
|
Earnings (loss) per common share: |
||||||||||||||||
|
Basic |
$ | 0.08 | $ | 0.11 | $ | 0.14 | $ | (0.23 | ) | |||||||
|
Diluted |
$ | 0.08 | $ | 0.11 | $ | 0.14 | $ | (0.23 | ) | |||||||
|
Year ended September 30, 2008 |
||||||||||||||||
|
Interest income |
$ | 6,700 | $ | 6,833 | $ | 7,022 | $ | 7,759 | ||||||||
|
Interest expense |
2,640 | 2,581 | 2,465 | 2,579 | ||||||||||||
|
Net interest income before provision for loan losses |
4,060 | 4,252 | 4,557 | 5,180 | ||||||||||||
|
Provision for loan losses |
68 | 52 | (7 | ) | 286 | |||||||||||
|
Non-interest income |
682 | 883 | 640 | 498 | ||||||||||||
|
Non-interest expense |
2,812 | 2,669 | 2,993 | 2,980 | ||||||||||||
|
Income before income tax expense |
1,862 | 2,414 | 2,211 | 2,412 | ||||||||||||
|
Income tax expense |
689 | 921 | 773 | 935 | ||||||||||||
|
Net income |
$ | 1,173 | $ | 1,493 | $ | 1,438 | $ | 1,477 | ||||||||
|
Earnings per common share: |
||||||||||||||||
|
Basic |
$ | 0.09 | $ | 0.12 | $ | 0.11 | $ | 0.12 | ||||||||
|
Diluted |
$ | 0.09 | $ | 0.12 | $ | 0.11 | $ | 0.12 | ||||||||
98
Item 9. Changes in and Disagreements With Accountants on Accounting and Financial Disclosure
None.
Item 9A.(T) Controls and Procedures
|
(a) |
Evaluation of disclosure controls and procedures. |
Under the supervision and with the participation of our management, including our Chief Executive Officer and Chief Financial Officer, we evaluated the effectiveness of the design and operation of our disclosure controls and procedures (as defined in Rule 13a-15(e) and 15d-15(e) under the Exchange Act) as of the end of the fiscal year
(the “Evaluation Date”). Based upon that evaluation, the Chief Executive Officer and Chief Financial Officer concluded that, as of the Evaluation Date, our disclosure controls and procedures were effective in alerting them in a timely manner to material information relating to us (or our consolidated subsidiary) required to be included in our periodic SEC filings.
|
(b) |
Management’s Annual Report on Internal Control over Financial Reporting. |
Management of the Company is responsible for establishing and maintaining adequate internal control over financial reporting. The Company’s system of internal control is designed under the supervision of management, including our Chief Executive Officer and Chief Financial Officer, to provide reasonable assurance regarding
the reliability of our financial reporting and the preparation of the Company’s consolidated financial statements for external reporting purposes in accordance with U.S. generally accepted accounting principles (“GAAP”).
Our internal control over financial reporting including policies and procedures that pertain to the maintenance of records that, in reasonable detail, accurately and fairly reflect transactions and dispositions of assets; provide reasonable assurances that transactions are recorded as necessary to permit preparation of financial statements
in accordance with GAAP, and that receipts and expenditures are made only in accordance with the authorization of management and the Board of Directors; and provide reasonable assurance regarding prevention or timely detection of unauthorized acquisition, use, or disposition of the Company’s assets that could have a material effect on our consolidated financial statements.
Because of its inherent limitations, internal control over financial reporting may not prevent or detect misstatements. Projections on any evaluation of effectiveness to future periods are subject to the risk that the controls may become inadequate because of changes in conditions or that the degree of compliance with policies
and procedures may deteriorate.
As of September 30, 2009, management assessed the effectiveness of the Company’s internal control over financial reporting based upon the framework established in Internal Control – Integrated Framework issued by the Committee of Sponsoring Organizations of the Treadway
Commission (“COSO”). Based upon its assessment, management believes that the Company’s internal control over financial reporting as of September 30, 2009 is effective using these criteria. This annual report does not include an attestation report of the Company’s independent registered public accounting firm regarding internal control over financial reporting. Management’s report was not subject to attestation by the Company’s independent registered
public accounting firm pursuant to temporary rules of the SEC that permit the Company to provide only management’s report in this annual report.
|
(c) |
Changes in Internal Controls over Financial Reporting. |
There were no significant changes made in our internal controls during the period covered by this report or, to our knowledge, in other factors that has materially affected or is reasonably likely to materially affect, the Company’s internal control over financial reporting.
99
See the Certifications pursuant to Section 302 of the Sarbanes-Oxley Act of 2002.
Item 9B. Other Information
On November 30, 2009, the boards of directors of the Bank and the Company notified Mr. Richard A. Kielty, President and Chief Executive Officer, Ms. Marilyn Alberici, Senior Vice President and Loan Servicing Manager and Mr. Marc Leno, Senior Vice President and Chief Lending Officer, that their respective employment agreements would not
be automatically renewed upon expiration. On December 1, 2009, the boards of directors of the Bank and the Company notified Mr. Ralph Walther, Vice President and Chief Financial Officer, that his employment agreement would not be automatically renewed upon expiration. The employment agreements for Ms. Alberici, Mr. Leno, and Mr. Walther are set to expire on December 31, 2011; the employment agreement for Mr. Kielty is set to expire on December 31, 2012.
This action was not taken as a reflection of the affected employee’s performance. The boards of directors indicated that they would determine whether to offer any employment agreements to these officers in the future, and the terms thereof would be based upon a variety of factors, including the economic and regulatory
environment.
The form of non-renewal notice is attached to this report as Exhibit 99.1.
PART III.
Item 10. Directors, Executive Officers and Corporate Governance
Information regarding director nominees, incumbent directors, executive officers, the Audit Committee of the Board of Directors, Audit Committee financial experts and procedures by which stockholders may recommend director nominees required by this item is set forth under “Proposal
1-Election of Directors” in the Proxy Statement filed for the Annual Meeting of Stockholders to be held on February 16, 2010 and is incorporated herein by reference.
Information regarding compliance with Section 16(a) of the Securities Exchange Act of 1934 is set forth under “Proposal 1-Election of Directors” in the Proxy Statement filed for the Annual Meeting of Stockholders to be held on February 16, 2010 and is incorporated herein by reference.
The Company had adopted a Code of Business Conduct and Ethics that is applicable to all directors, officers and employees of the Company and the Bank, including the principal executive officer, principal financial officer, principal accounting officer, and all persons performing similar functions. The
Code of Business Conduct and Ethics is posted on the Bank’s website at www.brooklynbank.com. Amendments to and waivers from the Code of Business Conduct and Ethics will also be disclosed on the Bank’s website.
100
Item 11. Executive Compensation
The information required by this item is set forth under “Proposal 1-Election of Directors” under the caption “Directors’ Compensation” and “Executive Officers Compensation” in the Proxy Statement for the Annual Meeting of Stockholders to be held
on February 16, 2010 and is incorporated herein by reference.
Item 12. Security Ownership of Certain Beneficial Owners and Management and Related Stockholder Matters
The information required by this item regarding security ownership of certain beneficial owners and management is set forth under “Security Ownership of Certain Beneficial Owners” and “Proposal 1-Election of Directors” in the Proxy Statement filed for the Annual Meeting
of Stockholders to be held on February 16, 2010 and is incorporated herein by reference.
The information regarding the Company’s compensation plans under which equity securities of Brooklyn Federal are authorized for issuance as of September 30, 2009 is included under “Proposal 1-Election of Directors” under the caption “Benefit Plans and Arrangements”
in the Proxy Statement filed for the Annual Meeting of Stockholders to be held on February 16, 2010 and is incorporated herein by reference.
Item 13. Certain Relationships and Related Transactions and Director Independence
The information required by this item is set forth under “Proposal 1-Election of Directors” under the captions “Transactions With Certain Related Persons” and “Board Independence” in the Proxy Statement filed for the Annual Meeting of Stockholders to be
held on February 16, 2010 and is incorporated herein by reference.
Item 14. Principal Accounting Fees and Services
The information required by this item is set forth under “Proposal 2-Ratification of Appointment of Independent Registered Public Accounting Firm” in the Proxy Statement filed for the Annual Meeting of Stockholders to be held on February 16, 2010 and is incorporated herein by
reference.
PART IV.
Item 15. Exhibits and Financial Statement Schedules
| The exhibits and financial statement schedules filed as a part of this Form 10-K are as follows: | |||
|
(a)(1) |
Financial Statements | ||
|
● |
Report of Independent Registered Public Accounting Firm | ||
|
● |
Consolidated Statements of Financial Condition, September 30, 2009 and 2008 | ||
|
● |
Consolidated Statements of Income, Years Ended September 30, 2009 and 2008 | ||
|
● |
Consolidated Statements of Changes in Stockholders’ Equity, Years Ended September 30, 2009 and 2008 | ||
|
● |
Consolidated Statements of Cash Flows, Years Ended September 30, 2009 and 2008 | ||
|
● |
Notes to Consolidated Financial Statements | ||
101
|
(a)(2) |
Financial Statement Schedules | ||
|
No financial statement schedules are filed because the required information is not applicable or is included in the consolidated financial statements or related notes. | |||
|
(a)(3) |
Exhibits | ||
|
3.1 |
Certificate of Incorporation of Brooklyn Federal Bancorp, Inc.* | ||
|
3.2 |
Bylaws of Brooklyn Federal Bancorp, Inc. | ||
|
4.1 |
Form of Common Stock Certificate of Brooklyn Federal Bancorp, Inc. * | ||
|
10.1 |
Amended and Restated Employment Agreement by and between Brooklyn Federal Bancorp, Inc., Brooklyn Federal Savings Bank and Angelo J. Di Lorenzo** | ||
|
10.2 |
Amended and Restated Employment Agreement by and between Brooklyn Federal Bancorp, Inc., Brooklyn Federal Savings Bank and Richard A. Kielty** | ||
|
10.3 |
Amended and Restated Employment Agreement by and between Brooklyn Federal Bancorp, Inc., Brooklyn Federal Savings Bank and Marc Leno** | ||
|
10.4 |
Amended and Restated Employment Agreement by and between Brooklyn Federal Bancorp, Inc., Brooklyn Federal Savings Bank and Marilyn Alberici** | ||
|
10.5 |
Employment Agreement by and between Brooklyn Federal Bancorp, Inc., Brooklyn Federal Savings Bank and Ralph Walther** | ||
|
10.6 |
Amended and Restated Executive Supplemental Retirement Income Agreement between Brooklyn Federal Savings Bank and Angelo J. Di Lorenzo*** | ||
|
10.7 |
Amended and Restated Executive Supplemental Retirement Income Agreement between Brooklyn Federal Savings Bank and Richard A. Kielty*** | ||
|
10.8 |
Amendment to the Split Dollar Insurance Agreement between Brooklyn Federal Savings Bank and Angelo J. Di Lorenzo*** | ||
|
10.9 |
Amendment to the Split Dollar Insurance Agreement between Brooklyn Federal Savings Bank and Richard A. Kielty*** | ||
|
10.10 |
Amendment to the Split Dollar Insurance Agreement between Brooklyn Federal Savings Bank and Marilyn Alberici*** | ||
|
10.11 |
Brooklyn Federal Bancorp, Inc. 2006 Stock-Based Incentive Plan**** | ||
|
21 |
Subsidiaries of the Registrant* | ||
|
23.1 |
Consent of ParenteBeard LLC | ||
|
31.1 |
Certification of Chief Executive Officer pursuant to Section 302 of the Sarbanes-Oxley Act of 2002 | ||
102
|
31.2 |
Certification of Chief Financial Officer pursuant to Section 302 of the Sarbanes-Oxley Act of 2002 | ||
|
32.1 |
Certification of Chief Executive Officer pursuant to Section 906 of the Sarbanes-Oxley Act of 2002 | ||
|
32.2 |
Certification of Chief Financial Officer pursuant to Section 906 of the Sarbanes-Oxley Act of 2002 | ||
|
99.1 |
Form of Non-Renewal Notice of Employment Agreement by and between the Bank, the Company, and each of Richard A. Kielty, Marilyn Alberici, Marc Leno and Ralph Walther, dated November 28, 2009. |
|
* |
Filed as exhibits to the Company’s Registration Statement on Form S-1, and any amendments thereto, with the SEC (Registration No. 333-121580). |
|
** |
Filed as exhibits to the Company’s Current Report on Form 8-K filed on December 20, 2007. |
|
*** |
Filed as exhibits to the Company’s Current Report on Form 8-K filed on December 6, 2007. |
|
**** |
Filed as exhibit to the Company’s Definitive Proxy Statement filed with the SEC on March 7, 2006. |
103
SIGNATURES
Pursuant to the requirements of Section 13 or 15(d) of the Securities Exchange Act of 1934, the registrant has duly caused this report to be signed on its behalf by the undersigned, thereunto duly authorized.
|
BROOKLYN FEDERAL BANCORP, INC. | |||
|
|
By: |
/s/ Richard A. Kielty | |
| Richard A. Kielty | |||
| President and Chief Executive Officer | |||
| (Duly Authorized Representative) | |||
|
Signatures |
|
Title |
|
Date |
| |||||
|
s/ Richard A. Kielty |
President, Chief Executive Officer and Director |
January 6, 2010 | ||||||||
|
Richard A. Kielty |
||||||||||
|
/s/ Ralph Walther |
Vice President and Chief Financial Officer (Principal Financial and Accounting Officer) |
January 6, 2010 | ||||||||
|
Ralph Walther |
||||||||||
|
/s/ Daniel O. Reich |
Chairman |
January 6, 2010 | ||||||||
|
Daniel O. Reich |
||||||||||
| /s/ Angelo J. Di Lorenzo | Vice Chairman | January 6, 2010 | ||||||||
| Angelo J. Di Lorenzo | ||||||||||
| /s/ John C. Gallin | Director | January 6, 2010 | ||||||||
| John C. Gallin | ||||||||||
| /s/ John A. Loconsolo | Director | January 6, 2010 | ||||||||
| John A. Loconsolo | ||||||||||
| /s/ Arthur R. Williams | Director | January 6, 2010 | ||||||||
| Arthur R. Williams | ||||||||||
| /s/ Robert J. A. Zito | Director | January 6, 2010 | ||||||||
| Robert J. A. Zito | ||||||||||
104
EXHIBIT INDEX
|
3.1 |
Certificate of Incorporation of Brooklyn Federal Bancorp, Inc.* | |
|
3.2 |
Bylaws of Brooklyn Federal Bancorp, Inc. | |
|
4.1 |
Form of Common Stock Certificate of Brooklyn Federal Bancorp, Inc. * | |
|
10.1 |
Amended and Restated Employment Agreement by and between Brooklyn Federal Bancorp, Inc., Brooklyn Federal Savings Bank and Angelo J. Di Lorenzo** | |
|
10.2 |
Amended and Restated Employment Agreement by and between Brooklyn Federal Bancorp, Inc., Brooklyn Federal Savings Bank and Richard A. Kielty** | |
|
10.3 |
Amended and Restated Employment Agreement by and between Brooklyn Federal Bancorp, Inc., Brooklyn Federal Savings Bank and Marc Leno** | |
|
10.4 |
Amended and Restated Employment Agreement by and between Brooklyn Federal Bancorp, Inc., Brooklyn Federal Savings Bank and Marilyn Alberici** | |
|
10.5 |
Employment Agreement by and between Brooklyn Federal Bancorp, Inc., Brooklyn Federal Savings Bank and Ralph Walther** | |
|
10.6 |
Amended and Restated Executive Supplemental Retirement Income Agreement between Brooklyn Federal Savings Bank and Angelo J. Di Lorenzo*** | |
|
10.7 |
Amended and Restated Executive Supplemental Retirement Income Agreement between Brooklyn Federal Savings Bank and Richard A. Kielty*** | |
|
10.8 |
Amendment to the Split Dollar Insurance Agreement between Brooklyn Federal Savings Bank and Angelo J. Di Lorenzo*** | |
|
10.9 |
Amendment to the Split Dollar Insurance Agreement between Brooklyn Federal Savings Bank and Richard A. Kielty*** | |
|
10.10 |
Amendment to the Split Dollar Insurance Agreement between Brooklyn Federal Savings Bank and Marilyn Alberici*** | |
|
10.11 |
Brooklyn Federal Bancorp, Inc. 2006 Stock-Based Incentive Plan**** | |
|
21 |
Subsidiaries of the Registrant* | |
|
23.1 |
Consent of ParenteBeard LLC | |
|
31.1 |
Certification of Chief Executive Officer pursuant to Section 302 of the Sarbanes-Oxley Act of 2002 | |
|
31.2 |
Certification of Chief Financial Officer pursuant to Section 302 of the Sarbanes-Oxley Act of 2002 | |
|
32.1 |
Certification of Chief Executive Officer pursuant to Section 906 of the Sarbanes-Oxley Act of 2002 | |
|
32.2 |
Certification of Chief Financial Officer pursuant to Section 906 of the Sarbanes-Oxley Act of 2002 | |
|
99.1 |
Form of Non-Renewal Notice of Employment Agreement by and between the Bank, the Company, and each of Richard A. Kielty, Marilyn Alberici, Marc Leno and Ralph Walther, dated November 28, 2009. |
105
|
* |
Filed as exhibits to the Company’s Registration Statement on Form S-1, and any amendments thereto, with the SEC (Registration No. 333-121580). |
|
** |
Filed as exhibits to the Company’s Current Report on Form 8-K filed on December 20, 2007. |
|
*** |
Filed as exhibits to the Company’s Current Report on Form 8-K filed on December 6, 2007. |
|
**** |
Filed as exhibit to the Company’s Definitive Proxy Statement filed with the SEC on March 7, 2006. |
106