Attached files
| file | filename |
|---|---|
| 8-K - FORM 8-K - TIDEWATER INC | d8k.htm |
 2011 RBC CAPITAL
MARKETS’ ENERGY AND POWER
CONFERENCE
June 7, 2011
DEAN E. TAYLOR
Chairman, President and CEO
JOSEPH M. BENNETT
Executive Vice President and
Chief Investor Relations Officer
DEAN E. TAYLOR
Chairman, President and CEO
JOSEPH M. BENNETT
Executive Vice President and
Chief Investor Relations Officer
Exhibit 99.1 |
 FORWARD-LOOKING STATEMENTS
FORWARD-LOOKING STATEMENTS
2
In accordance with the safe harbor provisions of the Private Securities Litigation
Reform Act of 1995, the Company notes that certain statements set forth in this
presentation provide other than historical information and are forward looking. The
actual achievement of any forecasted results, or the unfolding of future economic or
business developments in a way anticipated or projected by the Company, involve
numerous risks and uncertainties that may cause the Company’s actual performance
to be materially different from that stated or implied in the forward-looking
statement. Among those risks and uncertainties, many of which are beyond the
control of the Company, include, without limitation, volatility in worldwide energy
demand and oil and gas prices; fleet additions by competitors and industry
overcapacity; changes in capital spending by customers in the energy industry for
offshore
exploration,
field
development
and
production;
changing
customer
demands
for vessel specifications, which may make some of our older vessels technologically
obsolete for certain customer projects or in certain markets; uncertainty of global
financial market conditions and difficulty in accessing credit or capital; acts of
terrorism and piracy; significant weather conditions; unsettled political conditions,
war, civil unrest and governmental actions, such as expropriation, especially in higher
risk countries where we operate; foreign currency fluctuations; labor influences
proposed by international conventions; increased regulatory burdens and oversight
following
the
Deepwater
Horizon
incident;
and
enforcement
of
laws
related
to
the
environment,
labor
and
foreign
corrupt
practices.
Readers
should
consider
all
of
these
risk factors as well as other information contained in this report.
Web:
www.tdw.com
Email:
connect@tdw.com
Phone:
504.568.1010
Fax:
504.566.4580 |
 KEY
TAKEAWAYS KEY TAKEAWAYS
KEY TAKEAWAYS
3
•
Culture of safety & operating excellence
•
History of earnings growth and solid returns
•
World’s largest and newest fleet provides
basis for continued earnings growth
•
Strong balance sheet allows us to act upon
available opportunities |
 SAFETY –
A TOP PRIORITY
SAFETY –
SAFETY –
A TOP PRIORITY
A TOP PRIORITY
4
SM |
 5
0.00
0.25
0.50
0.75
1.00
Total Recordable Incident Rates
Calendar Years
2002
2003
2004
2005
2006
2007
2008
2009
TIDEWATER
DUPONT
DOW CHEMICAL
EXXON MOBIL
SAFETY RECORD RIVALS
SAFETY RECORD RIVALS
LEADING COMPANIES
LEADING COMPANIES |
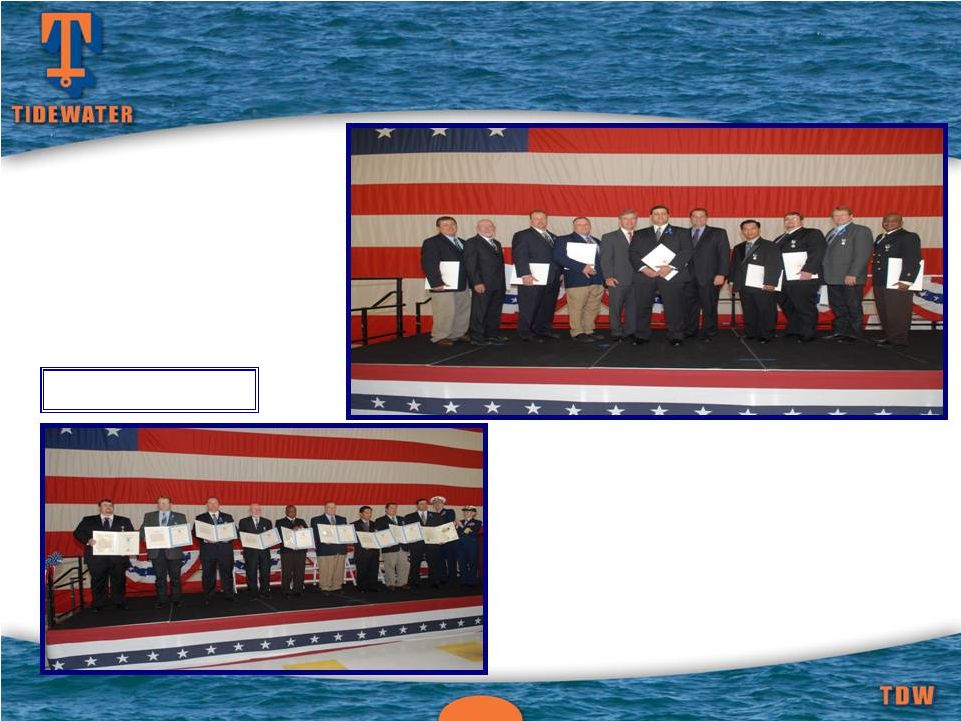 U.S.
COAST GUARD AWARDS FOR CREW OF M/V DAMON B BANKSTON
U.S. COAST GUARD AWARDS FOR
U.S. COAST GUARD AWARDS FOR
CREW OF M/V DAMON B BANKSTON
CREW OF M/V DAMON B BANKSTON
6
CONFIDENTIAL:
Contains assumptions and alternative projections.
FOR DISCUSSION PURPOSES ONLY
A Proud
Moment
For
Tidewater
Certificate of Valor:
ALWIN JAMES LANDRY
Gold Lifesaving Medal:
ANTHONY ROBERT GERVASIO
Silver Lifesaving Medal:
LOUIS PAUL LONGLOIS
Distinguished Public Service Award:
CREW OF DAMON B BANKSON
April 15, 2011 |
 7
32% Six-Year Compounded
Annual Earnings Growth Rate
**
EPS in Fiscal 2004 is exclusive of the $.30 per share after tax impairment charge.
EPS in Fiscal 2006 is exclusive of the $.74 per share after tax gain from the
sale of six KMAR vessels. EPS in Fiscal 2007 is exclusive of $.37 per share of after tax gains from the sale of 14 offshore
tugs. EPS in Fiscal 2010 is exclusive of $.66 per share Venezuelan provision,
a $.70 per share tax benefit related to favorable resolution of tax
litigation and a $0.22 per share charge for the proposed settlement with the SEC of the company’s FCPA matter. EPS in Fiscal 2011
is exclusive of total $0.21 per share charges for settlements with DOJ and Government
of Nigeria for FCPA matters, a $0.08 per share charge related to participation
in a multi-company U.K.-based pension plan and a $0.06 per share impairment charge related to certain
vessels.
Adjusted Return
On Avg. Equity
4.3% 7.2%
12.4%
18.5% 18.3%
19.5%
11.4% 4.0%
HISTORICAL EARNINGS SUMMARY
HISTORICAL EARNINGS SUMMARY
“A Full Cycle”
“A Full Cycle”
$2.40
$5.20
$7.89
$1.03
$1.78
$3.33
$5.94
$6.39
$0.00
$2.00
$4.00
$6.00
$8.00
Fiscal
2004
Fiscal
2005
Fiscal
2006
Fiscal
2007
Fiscal
2008
Fiscal
2009
Fiscal
2010
Fiscal
2011
Adjusted EPS** |
 8
Avg. Dayrates
$14,381*
$15,819
(+ 10%)
$17,400
(+ 10%)
85.8%*
85.0%
90.0%
~$4.00
EPS
~$5.60
EPS
~$9.10
EPS
269
vessels
assumes
(193
current
new
vessels
+
36
under
construction
+
~
20
additional
new
vessels per year for two years).
WHERE COULD FISCAL 2014 FIND US?
WHERE COULD FISCAL 2014 FIND US?
Potential for Earnings Acceleration
Potential for Earnings Acceleration
* 3/31/11 fiscal year actual stats
This info is not meant to be a
prediction of future earnings
performance, but simply an
indication of earning sensitivities
resulting from future fleet
additions and reductions and
varying operating assumptions.
~$400M+
EBITDA
~$520M+
EBITDA
~$730M+
EBITDA |
 9
•
Unique global footprint; 50+ years of Int’l
experience
•
Unmatched scale and scope of operations
•
International market opportunities
•
Growth
•
Longer contracts
•
Better utilization
•
Higher dayrates
•
Solid customer base of NOC’s and IOC’s
INTERNATIONAL
INTERNATIONAL
STRENGTH
STRENGTH |
           10
10
OUR GLOBAL FOOTPRINT
OUR GLOBAL FOOTPRINT
Vessel Distribution by Region
Vessel Distribution by Region
(excludes
(excludes
stacked
stacked
vessels
vessels
–
–
as
as
of
of
3/31/11)
3/31/11)
North America
16
(6%)
Central/South America
54
(20%)
West Africa
129
(47%)
Europe / M.E.
40
(14%)
Far East
35
(13%)
International / U.S.
2011: 94% / 6%
2000: 62% / 38% |
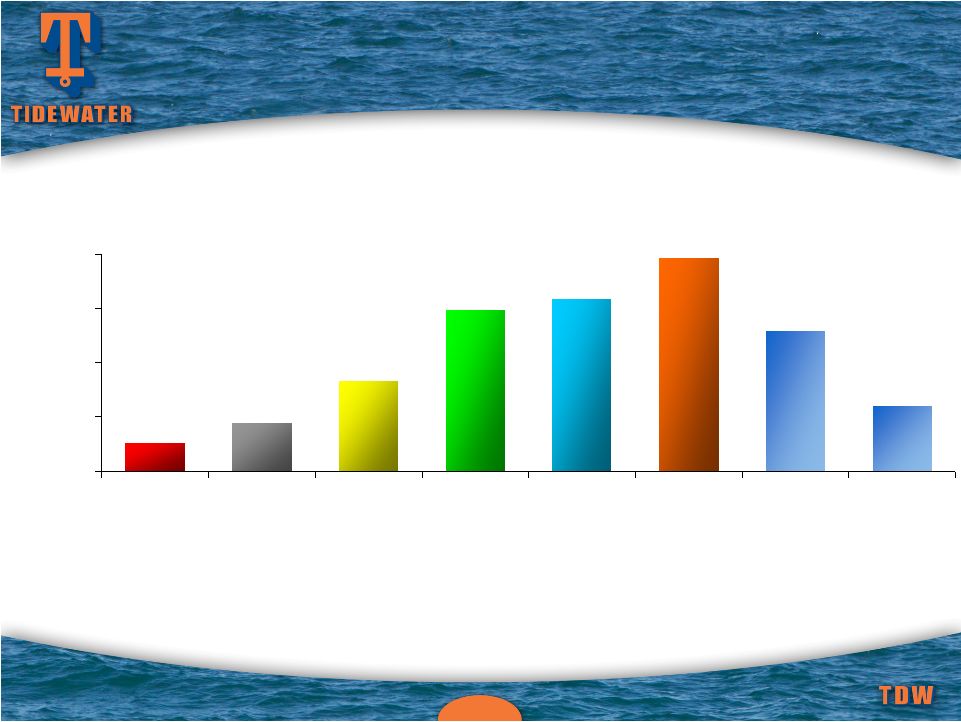
 11
VESSEL POPULATION BY OWNER
VESSEL POPULATION BY OWNER
Source: ODS-Petrodata and Tidewater
Tidewater
Competitor #2
Competitor #3
Competitor #4
Competitor # 5
Competitor #1
Avg.
All Others (1,887
total
vessels for
350+ owners)
5
65
66
73
106
124
281
0
100
200
300
400
500
Tidewater fleet includes 144 vessel additions since 2000
(Includes AHTS and PSV’s only) Estimated as of Early-May 2011
|
 12
Others
36%
NOC's
28%
Super Majors
36%
Our top 10 customers in Fiscal 2011 (5 Super Majors,
3 NOC’s and 2 large independents) accounted for 63% of our revenue
CURRENT REVENUE MIX
CURRENT REVENUE MIX
Quality of Customer Base
Quality of Customer Base |
 13
Vessel Count
Estimated Cost
AHTS
99
$1,743m
PSV’s
84
$1,755m
Crewboats & Tugs
67
$289m
TOTALS:
250
$3,787m
(1)
(1) $3,293m (87%) funded through 3/31/11
.
THE
THE
LARGEST
LARGEST
MODERN
MODERN
FLEET
FLEET
IN THE INDUSTRY…
IN THE INDUSTRY…
At 3/31/11, 193 new vessels in fleet with ~5.4 year average age
Vessel Commitments
Jan. ’00 –
March ‘11 |
 14
0
5
10
15
20
25
30
35
2001
2002
2003
2004
2005
2006
2007
2008
2009
2010
2011
2012
2013
2014
Built
Acquired
VESSEL DELIVERIES
VESSEL DELIVERIES
Fiscal Year
Actual deliveries through 3/31/11 and estimated vessel deliveries to build or acquire
as of 3/31/11 At 3/31/11, total 250 vessels with a
capital cost of $3.79 billion |
 15
Count
AHTS
15
PSV
20
Crew and Tug
1
Total
36
Vessels Under Construction*
As of March 31, 2011
…
…
AND OUR LEAD IS GROWING
AND OUR LEAD IS GROWING
* Includes eight new vessels committed to purchase as of 3/31/11
Estimated delivery schedule –
25 in FY ‘12, 10 in FY ‘13 and
1 thereafter
CAPX of $368m in FY ‘12, $110m in FY
‘13 and $16m in FY ‘14 |
 16
0
5
10
15
20
3/31/06
3/31/07
3/31/08
12/31/08
12/31/09
12/31/10
12/31/11
12/31/12
12/31/13
12/31/14
SIGNIFICANT AVERAGE AGE IMPROVEMENT
SIGNIFICANT AVERAGE AGE IMPROVEMENT
Assumptions: 1) Average 45 vessel disposals per year in future (averaged 47 per
year last three years). 2) Includes 36 vessels under construction (including
eight purchase commitments) in year delivered plus additional
newbuilds/acquisitions from approximately $500 million per year of future
commitments (average additional 20 vessels per year). Tidewater is not
committed to spending $500 million annually, but this level is used as an assumption in
estimating average fleet age in the future.
20
16
6
The current average “economic age”
of our
vessel fleet is ~6.2 years (based upon NBV) |
 17
2
2
4
6
9
8
10
0
2
4
6
8
10
12
9/30/09
Qtr
12/31/09
Qtr
3/31/10
Qtr
6/30/10
Qtr
9/30/10
Qtr
12/31/10
Qtr
3/31/11
Qtr
RECENT VESSEL COMMITMENTS
RECENT VESSEL COMMITMENTS
Amounts
depict
vessel
count
and
total
cost
in
quarter
commitment
was
made
to
acquire
(not
when
delivery
or
payments
were
made)
$96M
$55M
$72M
$179M
1 MPSV
1 PSV
4 AHTS
6 AHTS
6 AHTS
3 PSV’s
41 vessels over seven quarters w/
total capital cost of $819 million
$177M
4 PSV’s
4 AHTS
1 PSV
9 AHTS
$139M
$101M
2 PSV’s |
 18
Senior Unsecured Notes
$425 million
Average Life to Maturity
~ 9 years
Weighted Average Coupon
4.25%
RECENT FINANCINGS
RECENT FINANCINGS
Term Loan*
$125 million
Revolving Line of Credit
$450 million
Term
Five years
Interest Rate
LIBOR plus 1.5% to 2.25%,
based on leverage
Private Placement Financing:
Private Placement Financing:
New Credit Facilities:
New Credit Facilities:
*
Term loan allows for multiple draws for up to 180 days from 1/27/11
“Only $240M of Total Debt is due through Fiscal 2015”
“Only $240M of Total Debt is due through Fiscal 2015”
|
 19
A STRONG BALANCE SHEET
A STRONG BALANCE SHEET
AND READY LIQUIDITY
AND READY LIQUIDITY
March 31, 2011 info:
Cash & Cash Equivalents
$246 million
Total Debt
$700 million
Shareholders Equity
$2,514 million
Net Debt / Net Capitalization
15%
Total Debt / Capitalization
22%
Pro forma liquidity as of 12/31/10 of ~ $825 million,
including $575 million available under credit facilities
|
 20
Over
a
12-year
period,
Tidewater
invested
$3.8
billion
in
CAPX
($3.4
billion
in
the
“new”
fleet),
and paid out $994 million through dividends and share repurchases. Over the
same period, CFFO and proceeds from dispositions were $3.4 billion and $677
million, respectively PRIMARY USES OF CASH
PRIMARY USES OF CASH
$0
$100
$200
$300
$400
$500
$600
$700
2000
2001
2002
2003
2004
2005
2006
2007
2008
2009
2010
2011
CAPX
Dividend
Share Repurchase
In $ millions
CFFO
Fiscal Year |
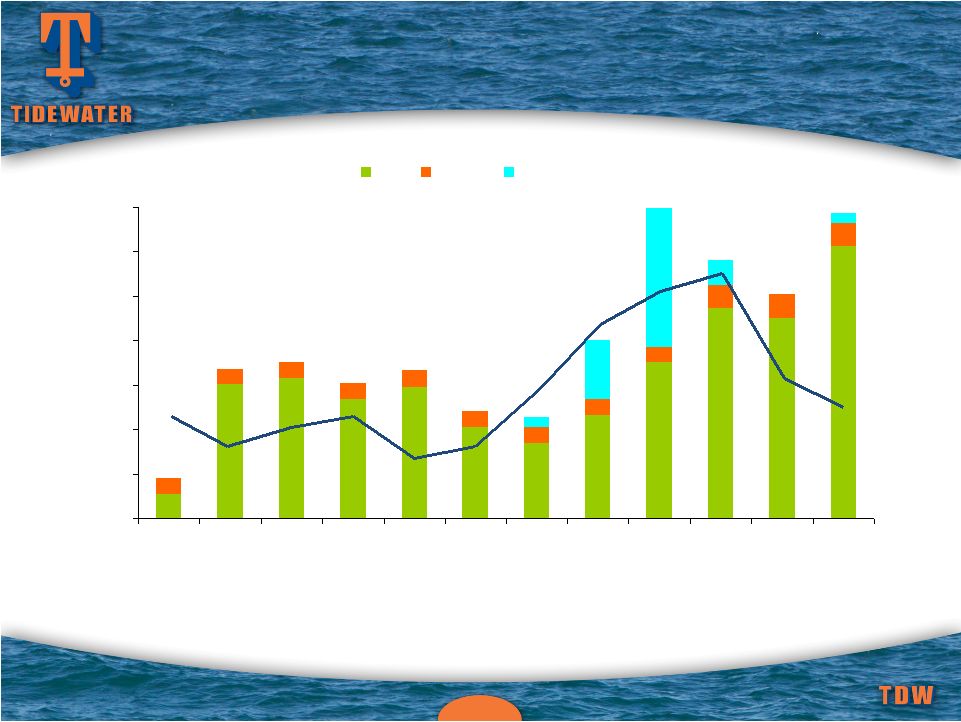
 21
FLEET CASH OPERATING MARGINS
FLEET CASH OPERATING MARGINS
Note: Cash operating margins are defined as
vessel revenue less vessel operating expenses
Total Fleet
Operating Margin %
$0
$100
$200
$300
$400
$500
$600
$700
$800
2000
2001
2002
2003
2004
2005
2006
2007
2008
2009
2010
2011
Traditional Vessels
New Vessels
Fleet Oper. Margin % 38.6%
37.6% 46.5%
41.9%
36.9% 38.7% 49.1%
54.6%
51.9% 51.3% 46.8%
39.3%
Fiscal Years |
 22
Maintain
Maintain
Financial Strength
Financial Strength
EVA-Based Investments
EVA-Based Investments
On Through-cycle Basis
On Through-cycle Basis
Deliver Results
Deliver Results
FINANCIAL STRATEGY FOCUSED ON
FINANCIAL STRATEGY FOCUSED ON
CREATING LONG-TERM SHAREHOLDER VALUE
CREATING LONG-TERM SHAREHOLDER VALUE |
 2011 RBC CAPITAL
MARKETS’ ENERGY AND POWER
CONFERENCE
June 7, 2011
DEAN E. TAYLOR
Chairman, President and CEO
JOSEPH M. BENNETT
Executive Vice President and
Chief Investor Relations Officer |
 24
Appendix
Appendix |
 25
RECENT ACCOMPLISHMENTS
RECENT ACCOMPLISHMENTS
•
Had two full years without a lost time accident (two
years ended August 2010) –
None since August 2010
•
Respectable earnings & returns in a trough (tough)
market
•
Selected acquisitions of choice assets
•
Disciplined disposal of traditional equipment
•
Delivery of 74 new vessels over last three fiscal years
•
Balance sheet still solid
•
Strategy working –
Poised to seize opportunities |
 26
Years Ended
3/31/11
3/31/10
Revenues
$1,055
$1,169
Adjusted Net Earnings*
$123
$269
Adjusted EPS*
$2.40
$5.20
Net Cash from Operations
$264
$328
Capital Expenditures
$615
$452
* Adjusted Net Earnings and Adjusted EPS for the year ended 3/31/11 exclude an
after-tax $4.35 million, or $0.09 per share, charge related to
settlement with DOJ and an after-tax $6.3 million, or $0.12 per share, charge
related to settlement with the Government of Nigeria for FCPA matters, an
after-tax $3.9 million, or $0.08 per share, charge related to participation in a multi-company U.K.-based pension plan, and an after-tax
$3.0
million,
or
$0.06
per
share,
impairment
charge
related
to
certain
vessels.
Adjusted
net
earnings
and
EPS
for
the
year
ended
3/31/10
exclude
charges of $33.6 million, or $0.66 per share, related to provisions for Venezuelan
operations, $36.1 million, or $0.70 per share, tax benefit related to
favorable resolution of tax litigation and $11.4 million, or $0.22 per share, charge related to settlement with the SEC for FCPA matters.
SELECTED FINANCIAL HIGHLIGHTS
SELECTED FINANCIAL HIGHLIGHTS
$ in Millions,
Except Per Share Data |
 27
0
50
100
150
200
250
300
1965
1970
1975
1980
1985
1990
1995
2000
2005
2010
THE WORLDWIDE FLEET -
THE WORLDWIDE FLEET -
RETIREMENTS
RETIREMENTS
EXPECTED TO EXCEED NEW DELIVERIES
EXPECTED TO EXCEED NEW DELIVERIES
Source: ODS-Petrodata and Tidewater
As of early-May 2011, there are approximately 405 additional AHTS and
PSV’s (~16% of the global fleet) under construction.
Global
fleet
estimated
at
2,602
vessels,
including
364
vessels
that
are
30+
yrs
old
(14%),
and
another
415
vessels
that
are
25-29
yrs
old
(16%)
Vessels > 25 years old today
(Includes AHTS and PSV’s only) Estimated as of Early-May 2011
|
 28
0
100
200
300
400
500
600
Active Fleet
Dispositions
CONTINUALLY ACQUIRING NEW AND
CONTINUALLY ACQUIRING NEW AND
DISPOSING
DISPOSING
OF
OF
MATURE
MATURE
VESSELS
VESSELS
(As of 3/31/11)
(As of 3/31/11)
310
(B)
543
(C)
227 New Vessels (A)
436 Sold
107 Scrapped
(A) Net new vessels added to the fleet since January 2000, including 36 vessels under
construction at 3/31/11. This new vessel total excludes 21 new vessels that
were acquired, then disposed (many to a TDW joint venture.) (B) Total fleet
count excludes 90 stacked vessels as of 3/31/11. (C) 543 vessel dispositions
generated $606 million of proceeds and $279 million of gains over the last 12 years. |
 29
50%
60%
70%
80%
90%
3/08
9/08
3/09
9/09
3/10
9/10
3/11
Utilization
$4,000
$6,000
$8,000
$10,000
$12,000
$14,000
Dayrate
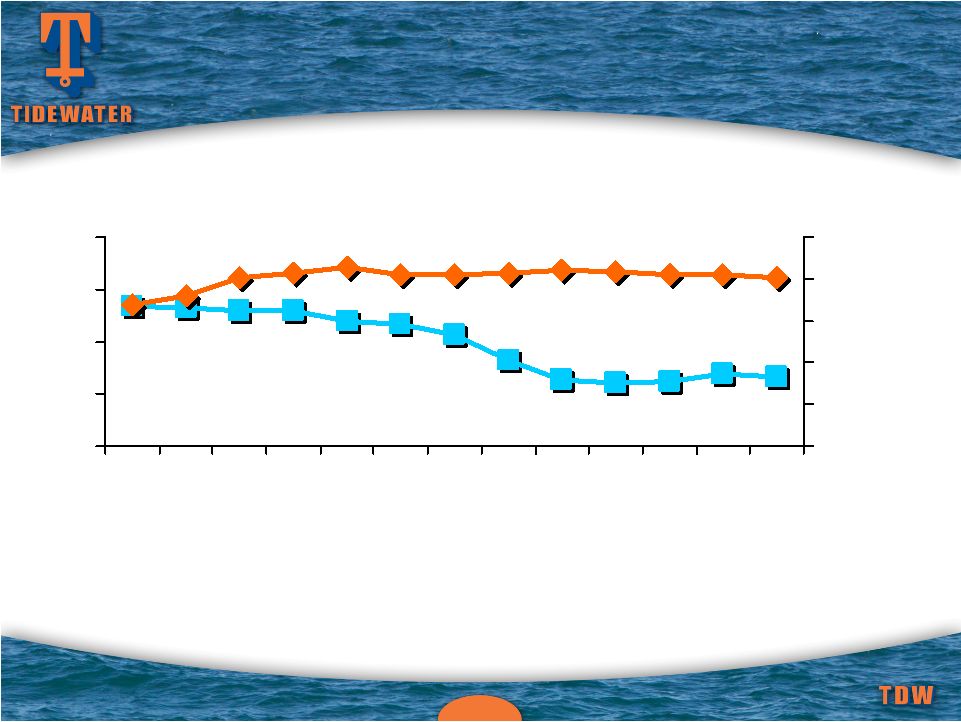
* Dayrate and utilization information is for all classes of vessels operating
international INTERNATIONAL VESSELS
INTERNATIONAL VESSELS
Dayrates and Utilization
Dayrates and Utilization
$100 change in dayrate = ~$7.9M in annual revenue
$100 change in dayrate = ~$7.9M in annual revenue
1% change in utilization = ~$15.1M in annual revenue
1% change in utilization = ~$15.1M in annual revenue |
 30
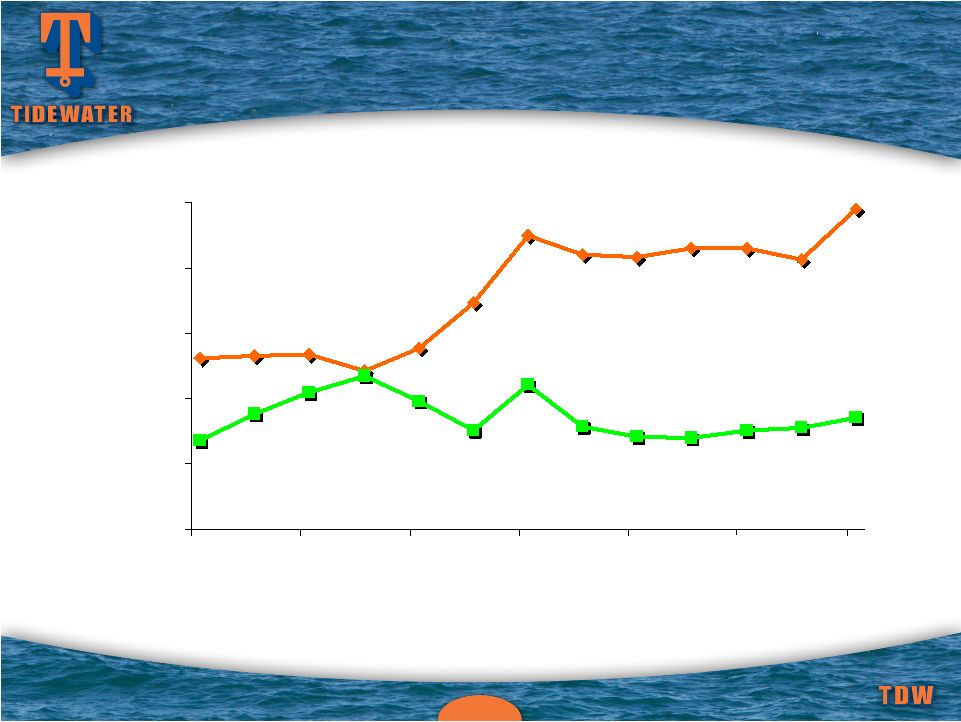
INTERNATIONAL VESSEL DAYRATES
INTERNATIONAL VESSEL DAYRATES
* Dayrate and utilization information is for all classes of vessels operating
international $3,000
$6,000
$9,000
$12,000
$15,000
$18,000
03/08
09/08
03/09
09/09
03/10
09/10
03/11
Traditional Vessels
New Vessels |
 31
30%
50%
70%
90%
3/08
9/08
3/09
9/09
3/10
9/10
3/11
Utilization
$4,000
$9,000
$14,000
$19,000
Dayrate
DOMESTIC VESSELS
DOMESTIC VESSELS
Dayrates and Utilization
Dayrates and Utilization
* Dayrate and utilization information is for all classes of vessels operating in the
U.S. |
 32
DOMESTIC VESSEL DAYRATES
DOMESTIC VESSEL DAYRATES
* Dayrate and utilization information is for all classes of vessels operating in the
U.S. $4,000
$8,000
$12,000
$16,000
$20,000
$24,000
03/08
09/08
03/09
09/09
03/10
09/10
03/11
Traditional Vessels
New Vessels |
 33
Source: ODS-Petrodata and Tidewater
WORKING RIG COUNTS
WORKING RIG COUNTS
“Peak to Present”
“Peak to Present”
GOM
accounts
for
30
of
the
58
working
jackup
count
variance
from
June
2008
(Peak) to May 2011 (post-Horizon)
GOM Semi & Drillship count drops by 17 units (from 31 to 14) between April 2010
and May 2011; offset by an increase of 20 units in the rest of world
Jackups
Semis
Drillships
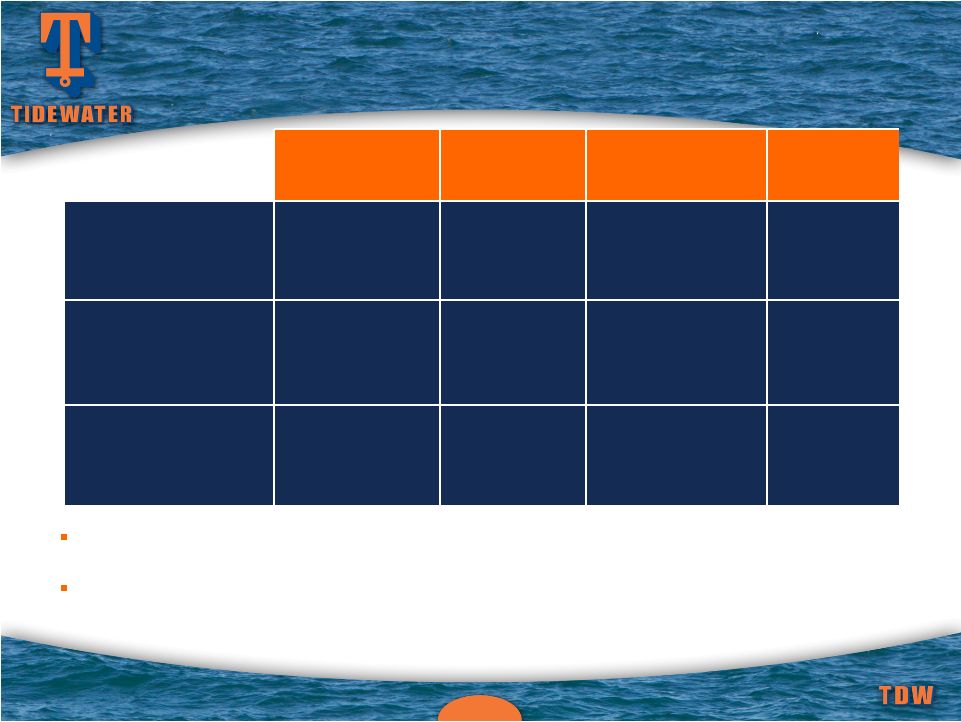
Total
June 2008
(Peak)
379
145
30
554
Late-April 2010
(pre-Horizon)
323
150
46
519
Early-May 2011
(post-Horizon)
321
152
47
520 |
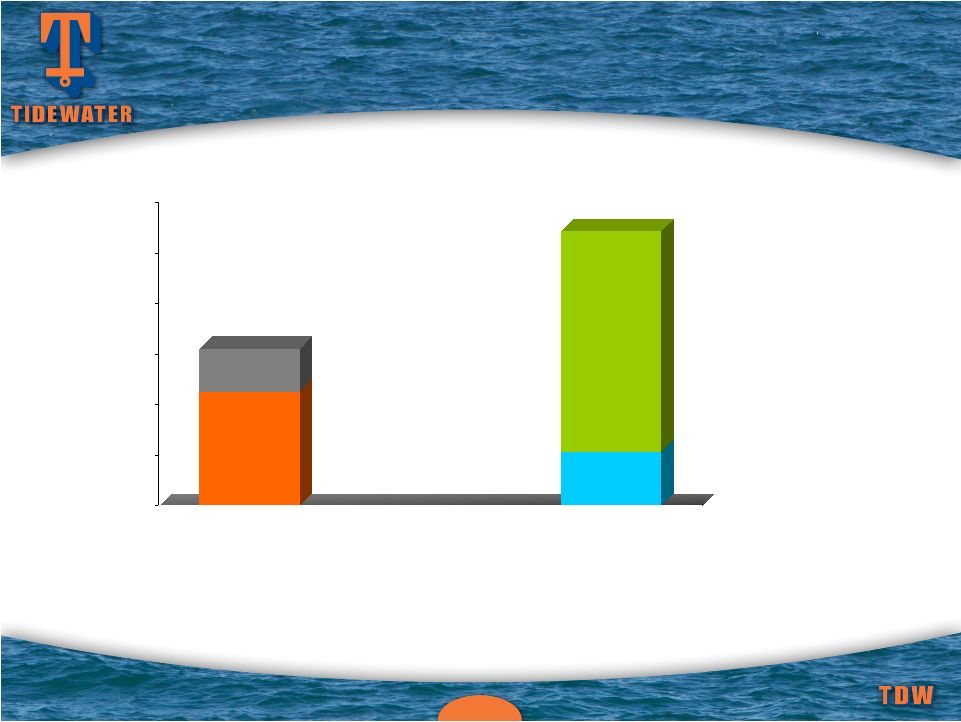
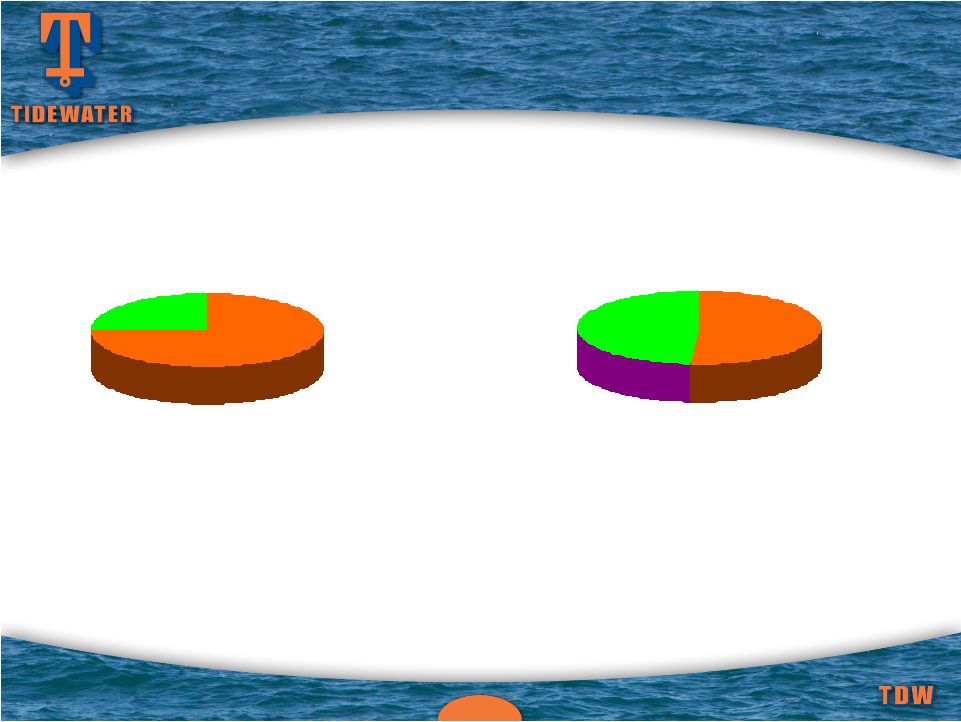 34
Other Operators
Top 10 Customers
Tidewater’s
top
10
customers
contract
~20%
of
the
working
worldwide
jackup
fleet
and
~47%
of
the
working
worldwide
floater
fleet
Jackups
(321 Working Rigs)
Floater Rigs
(199 Working Rigs)
65
256
94
RIGS CONTRACTED BY OUR
RIGS CONTRACTED BY OUR
TOP 10 CUSTOMERS
TOP 10 CUSTOMERS
(Estimated as of Early-May 2011)
Source: ODS-Petrodata and Tidewater
Other Operators
Top 10 customers
105 |
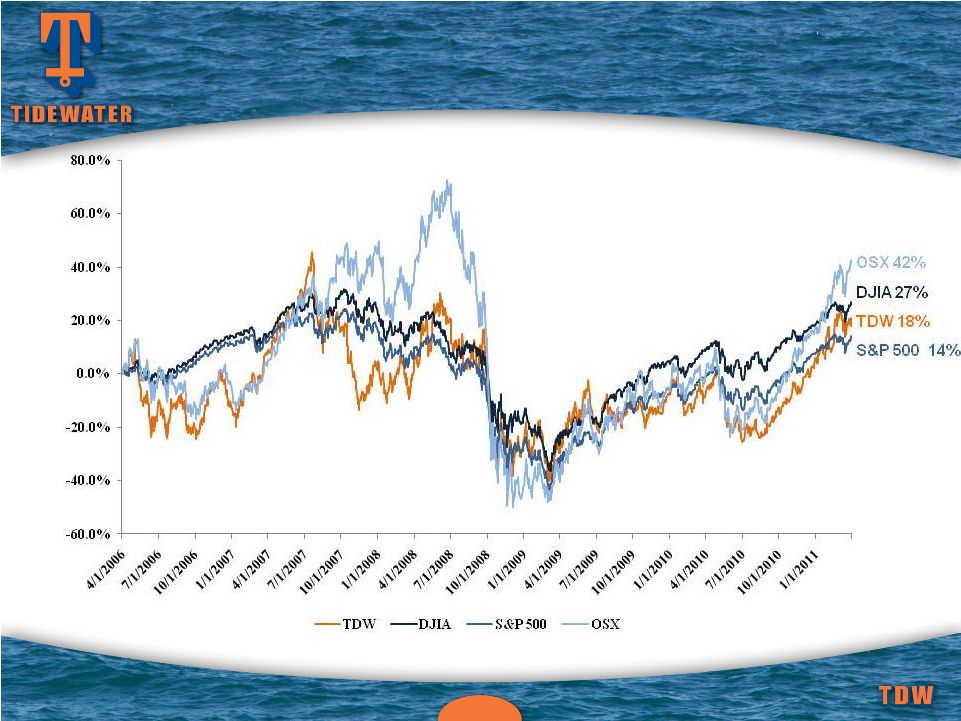 35
RETURNS vs the MARKET
RETURNS vs the MARKET
FIVE YEAR STOCKHOLDER RETURN
FIVE YEAR STOCKHOLDER RETURN |