Attached files
| file | filename |
|---|---|
| 8-K - PORTER BANCORP, INC. 8-K - LIMESTONE BANCORP, INC. | a6751698.htm |
| EX-99.1 - EXHIBIT 99.1 - LIMESTONE BANCORP, INC. | a6751698-ex991.htm |
Exhibit 99.2

Porter Bancorp, Inc. INVESTKentucky Conference June 9, 2011 1
Disclaimer This presentation contains forward-looking statements that involve risks and uncertainties. These forward-looking statements are based on management’s current expectations. Porter Bancorp’s actual results in future periods may differ materially from those currently expected due to various factors, including those risk factors described in documents that the Company files with the Securities and E h C i i i l di thC ’ t tA l Exchange Commission, including the Company’s most recent Annual Report on Form 10-K and Quarterly Report on Form 10-Q. The forward-looking statements in this presentation are made as of the date of the presentation and Porter Bancorp does not assume any responsibility to update these statements. 2
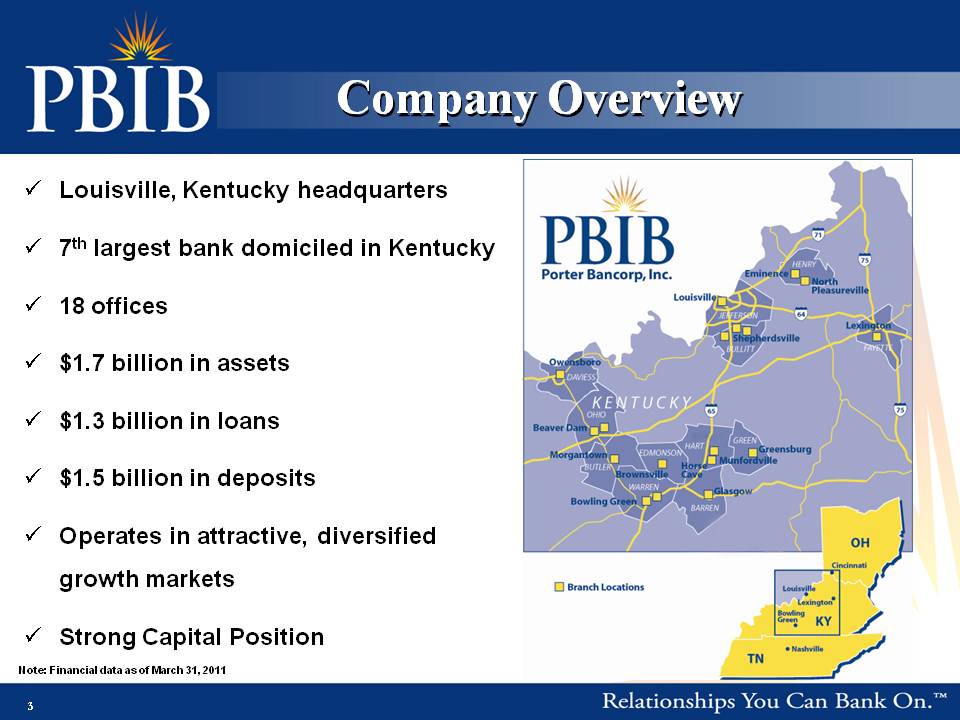
Company Overview Louisville, Kentucky headquarters 7th largest bank domiciled in Kentucky 18 offices $1.7 billion in assets $ 1.3 billion in loans $1.5 billion in deposits Operates in attractive, diversified growth markets 3 Strong Capital Position Note: Financial data as of March 31, 2011 3
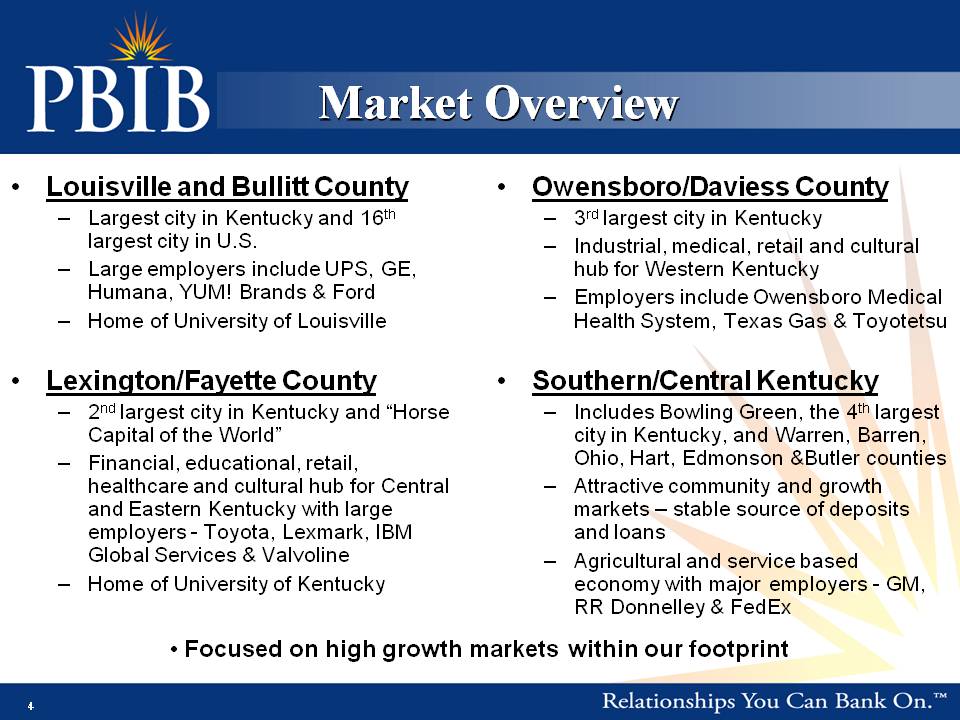
Market Overview • Louisville and Bullitt County • Owensboro/Daviess County – Largest city in Kentucky and 16th largest city in U.S. – Large employers include UPS, GE, Humana, YUM! Brands & Ford – 3rd largest city in Kentucky – Industrial, medical, retail and cultural hub for Western Kentucky – Employers include Owensboro Medical – Home of University of Louisville • Lexington/Fayette County 2nd largest city in and “Horse p y Health System, Texas Gas & Toyotetsu • Southern/Central Kentucky Includes Green the 4th largest – Kentucky Capital of the World” – Financial, educational, retail, healthcare and cultural hub for Central and Eastern large – Bowling Green, city in Kentucky, and Warren, Barren, Ohio, Hart, Edmonson &Butler counties – Attractive community and growth markets – stable deposits Kentucky with employers - Toyota, Lexmark, IBM Global Services & Valvoline – Home of University of Kentucky source of and loans – Agricultural and service based economy with major employers - GM, RR Donnelley & FedEx 4 y • Focused on high growth markets within our footprint 4
Company Overview PBIB has expanded its footprint to the 4 largest Kentucky markets – the fastest growing segments of the state Experienced management team with extensive market knowledge and community relationships Acquisition and integration experience and expertise Efficient operating model Strong core franchise results in solid NIM – strong core earnings engine Proactive offensive well capital raise of $32 million during 2010 – positioned to withstand current economic cycle Continued weakness in real estate sales and collateral values, 5 high unemployment and recession have had a negative effect on earnings 5
Financial Highlights 6
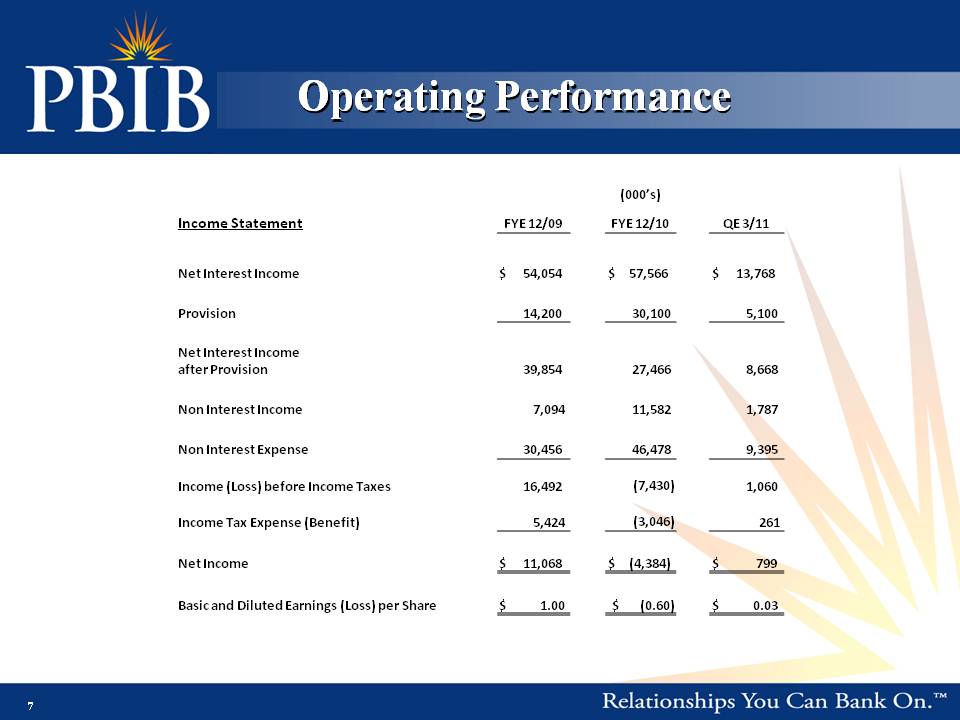
Operating Performance (000’s) Income Statement FYE 12/09 FYE 12/10 QE 3/11 Net Interest Income $ 54,054 $ 57,566 $ 13,768 Provision 14,200 30,100 5,100 Net Interest Income after Provision 39,854 27,466 8,668 Non 7 094 11 582 1 787 Interest Income 7,094 11,582 1,787 Non Interest Expense 30,456 46,478 9,395 Income (Loss) before Income Taxes 16,492 (7,430) 1,060 Income Tax Expense (Benefit) 5,424 (3,046) 261 Net Income $ 11,068 $ (4,384) $ 799 Basic and Diluted Earnings (Loss) per Share $ 1.00 $ (0.60) $ 0.03 7
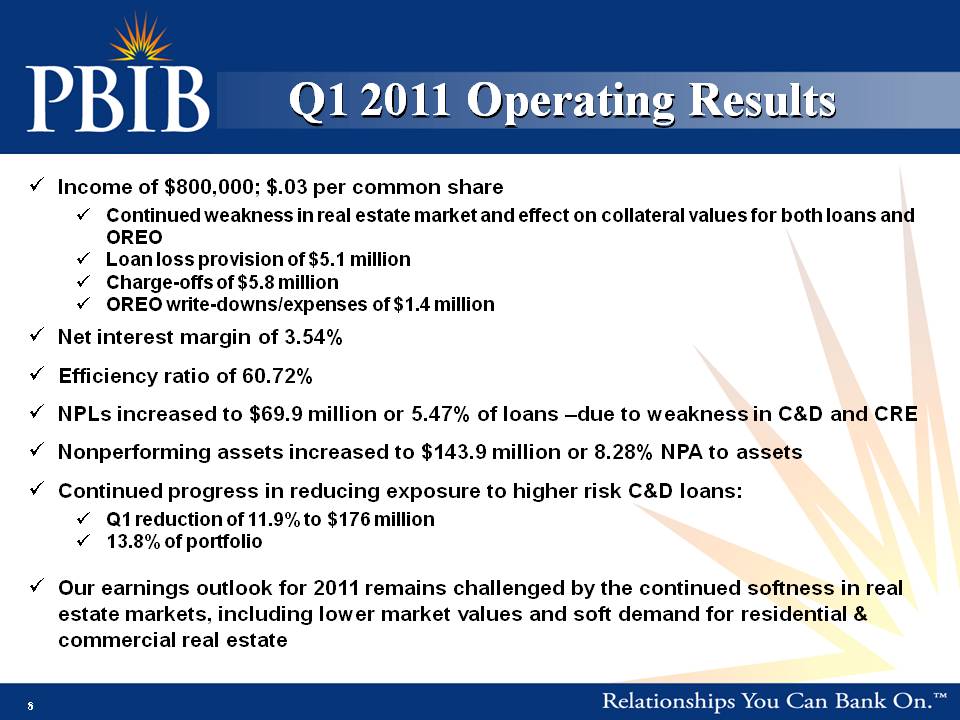
Q1 2011 Operating Results Income of $800,000; $.03 per common share Continued weakness in real estate market and effect on collateral values for both loans and OREO Loan loss provision of $5.1 million Charge-offs of $5.8 million OREO write-downs/expenses of $1.4 write million Net interest margin of 3.54% Efficiency ratio of 60.72% increased 69 9 5 47% due weakness in C&D and CRE NPLs to $69.9 million or 5.47% of loans –to Nonperforming assets increased to $143.9 million or 8.28% NPA to assets Continued progress in reducing exposure to higher risk C&D loans: Q1 reduction of 11.9% to $176 million 13.8% of portfolio Our earnings outlook for 2011 remains challenged by the continued softness in real estate markets 8 markets, including lower market values and soft demand for residential & commercial real estate Balance 8
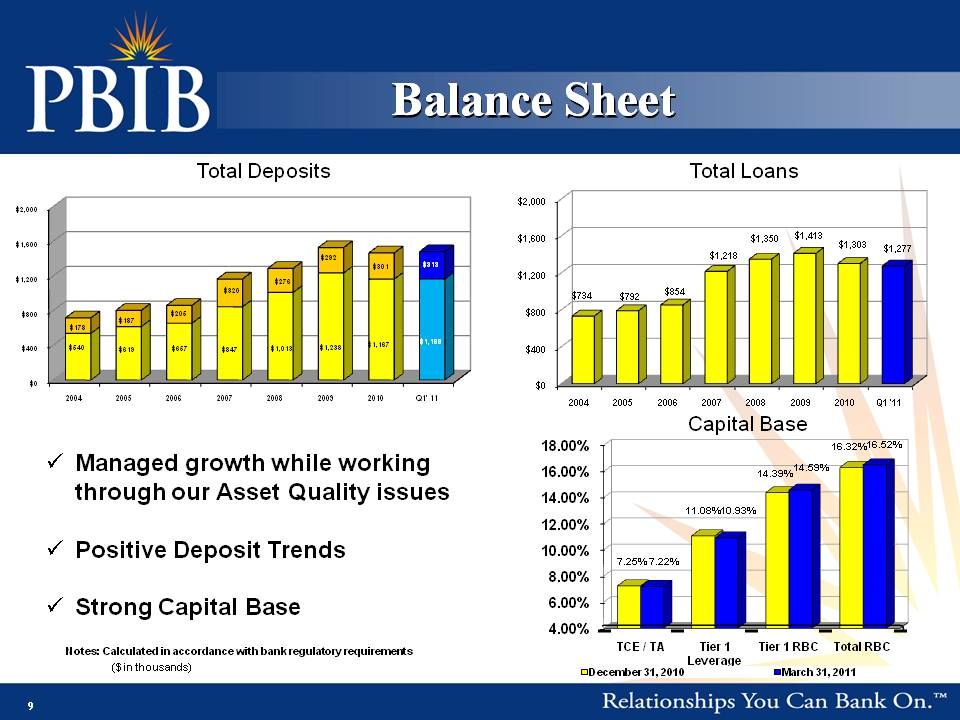
Balance Sheet Total Deposits $2,000 Total Loans $1,200 $1,600 $2,000 $320 $276 $292 $301 $313 $1,200 $1,600 $734 $792 $854 $1,218 $1,350 $1,413 $1,303 $1,277 $0 $400 $800 2004 2005 2006 2007 2008 2009 2010 Q1' 11 $540 $619 $657 $847 $1,013 $1,238 $1,167 $1,169 $178 $187 $205 $0 $400 $800 2004 2005 2006 2007 2008 2009 2010 Q1 '11 Capital Base Managed growth while working through our Asset Quality issues 14.00% 16.00% 18.00% 11.08% 14.39% 16.32% 10.93% 14.59% 16.52% Positive Deposit Trends Strong Capital Base 6.00% 8.00% 10.00% 12.00% 7.25% 7.22% 0 93% 9 ($ in thousands) Notes: Calculated in accordance with bank regulatory requirements 4.00% TCE / TA Tier 1 Leverage Tier 1 RBC Total RBC December 31, 2010 March 31, 2011 Operating 9
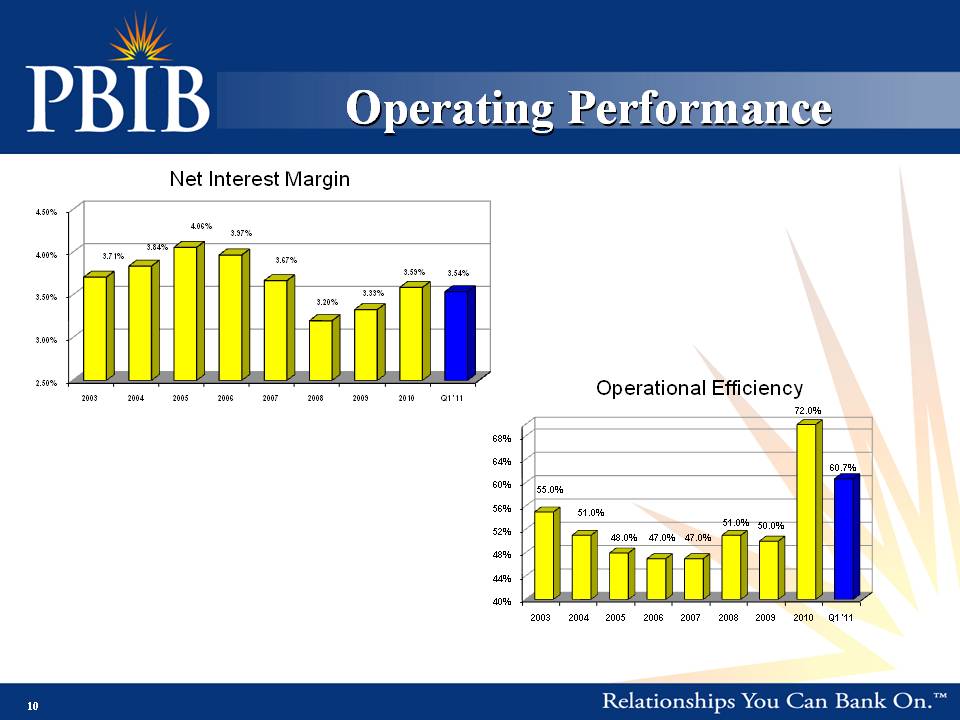
Operating Performance Net Interest Margin 3.50% 4.00% 4.50% 3.71% 3.84% 4.06% 3.97% 3.67% 3.20% 3.33% 3.59% 3.54% Operational Efficiency 72 0% 2.50% 3.00% 2003 2004 2005 2006 2007 2008 2009 2010 Q1 '11 56% 60% 64% 68% 55.0% 51 0% 72.0% 60.7% 40% 44% 48% 52% 2003 2004 2005 2006 2007 2008 2009 2010 Q1 '11 48.0% 47.0% 47.0% 51.0% 50.0%
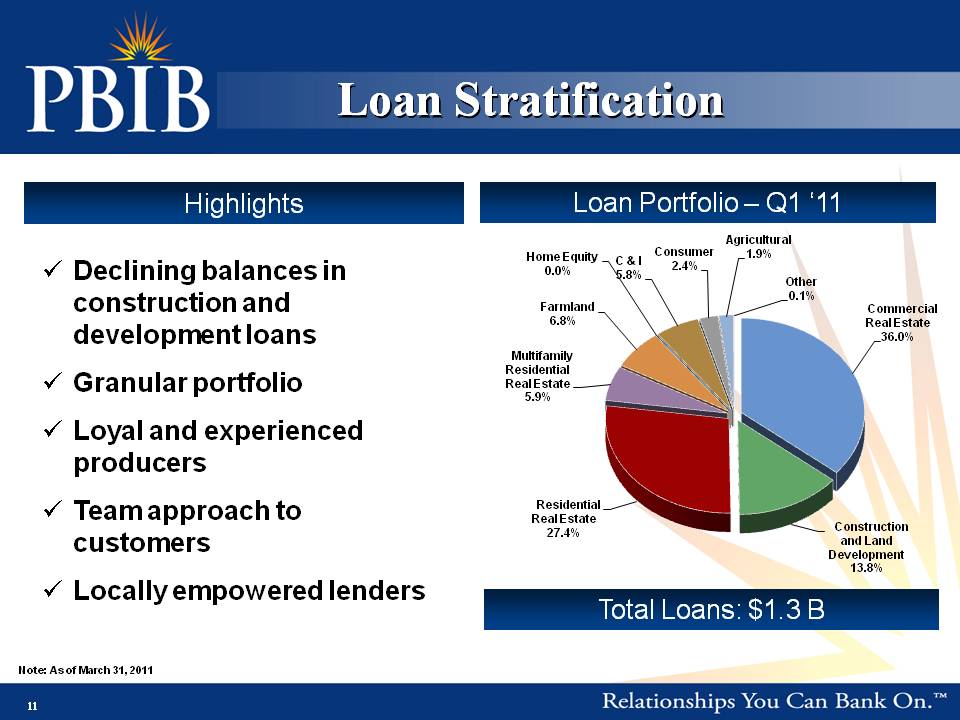
Loan ‘Stratification Declining balances in Loan Portfolio – Q1 11 Highlights Commercial Farmland Home Equity 0.0% C & I 5.8% Consumer 2.4% Agricultural 1.9% Other 0.1% construction and development loans Granular portfolio Real Estate 36.0% Multifamily Residential Real Estate 5.9% 6.8% Loyal and experienced producers Team to Residential approach customers Locally empowered lenders Total Loans: $1.3 B Construction and Land Development 13.8% Real Estate 27.4% 11 Note: As of March 31, 2011 11
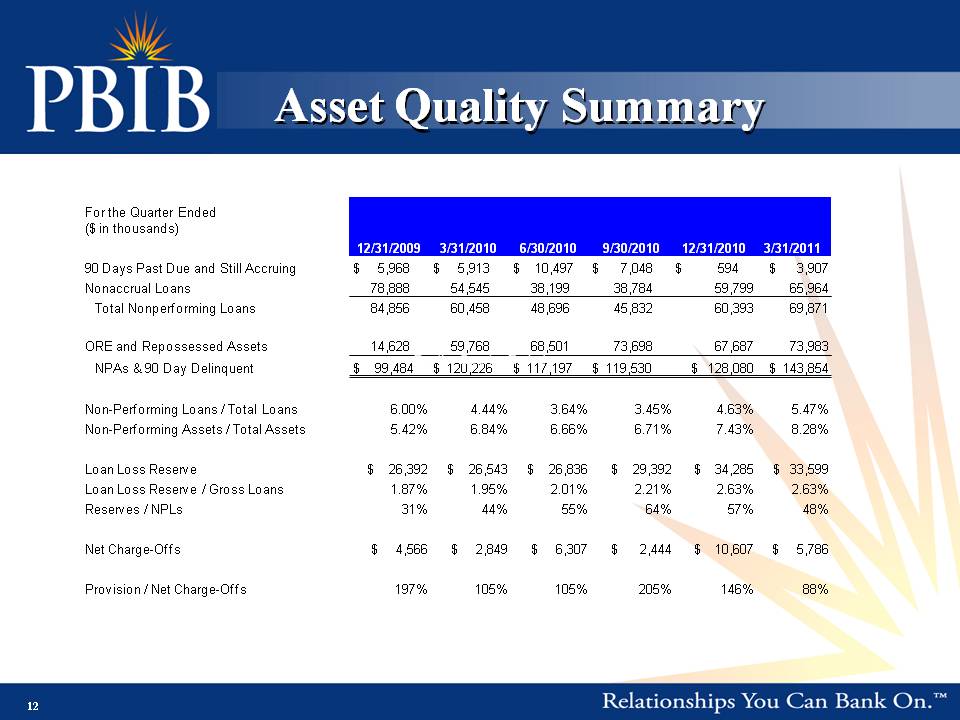
Asset Quality Summary For the Quarter Ended ($ in thousands) 12/31/2009 3/31/2010 6/30/2010 9/30/2010 12/31/2010 3/31/2011 90 Days Past Due and Still Accruing $ 5,968 $ 5,913 $ 10,497 $ 7,048 $ 594 $ 3,907 Nonaccrual Loans 78,888 54,545 38,199 38,784 59,799 65,964 Total Nonperforming Loans 84 856 60 458 48 696 45 832 60 393 69 871 84,856 60,458 48,696 45,832 60,393 69,871 ORE and Repossessed Assets 14,628 59,768 68,501 73,698 67,687 73,983 NPAs & 90 Day Delinquent $ 99,484 $ 120,226 $ 117,197 $ 119,530 $ 128,080 $ 143,854 Non-Total 6 00% 4 44% 3 64% 3 45% 4 63% 5 47% Non Performing Loans / Loans 6.00% 4.44% 3.64% 3.45% 4.63% 5.47% Non-Performing Assets / Total Assets 5.42% 6.84% 6.66% 6.71% 7.43% 8.28% Loan Loss Reserve $ 26,392 $ 26,543 $ 26,836 $ 29,392 $ 34,285 $ 33,599 Loan Loss Reserve / Gross Loans 1.87% 1.95% 2.01% 2.21% 2.63% 2.63% Reserves / NPLs 31% 44% 55% 64% 57% 48% 3 % % 6 % 5 % 8% Net Charge-Offs $ 4,566 $ 2,849 $ 6,307 $ 2,444 $ 10,607 $ 5,786 Provision / Net Charge-Offs 197% 105% 105% 205% 146% 88% 12
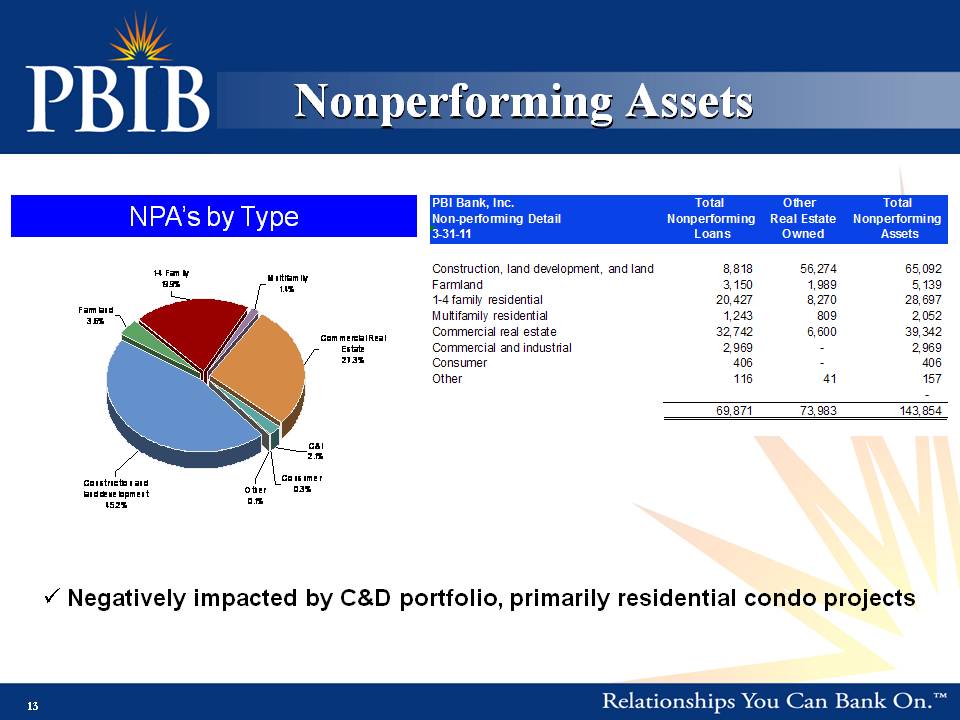
Nonperforming Total Other Total NPA’s by Type Multifamily 1.4% 1-4 Family 19.9% Farmland PBI Bank, Inc. Non-performing Detail Nonperforming Real Estate Nonperforming 3-31-11 Loans Owned Assets Construction, land development, and land 8,818 56,274 65,092 Farmland 3,150 1,989 5,139 1-4 family residential 20,427 8,270 28,697 Commercial Real Estate 27.3% 3.6% Multifamily residential 1,243 809 2,052 Commercial real estate 32,742 6,600 39,342 Commercial and industrial 2,969 - 2,969 Consumer 406 - 406 Other 116 41 157 - 69 871 73 983 143 854 Consumer 0.3% Construction and land development 45.2% Other 0.1% C&I 2.1% 69,871 73,983 143,854 Negatively impacted by C&D portfolio, primarily residential condo projects Assets 13
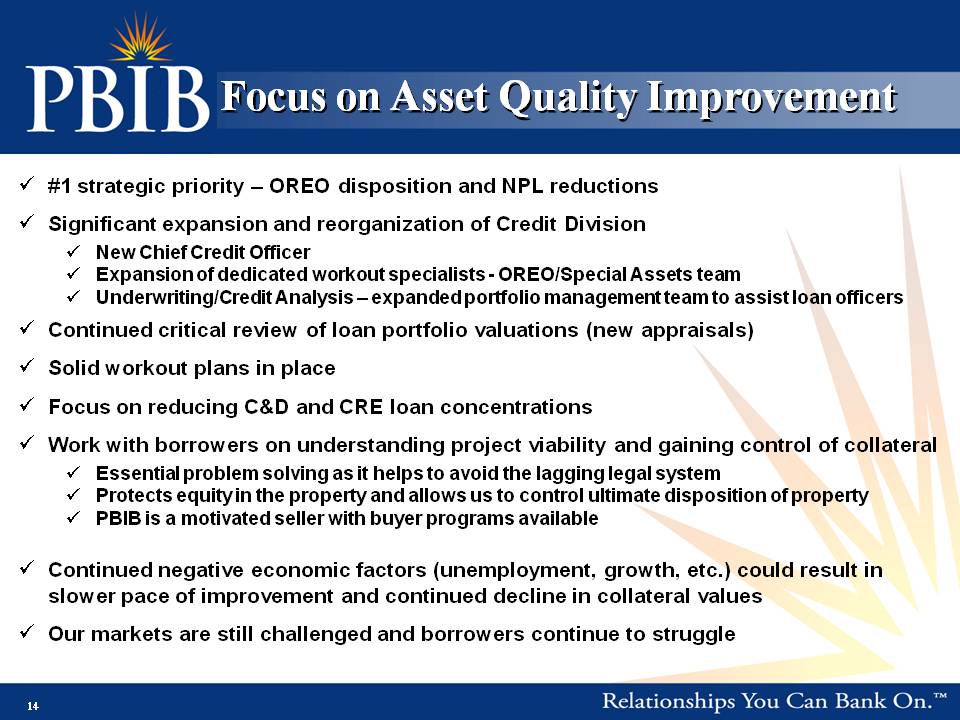
Focus on Asset Quality #1 strategic priority – OREO disposition and NPL reductions Significant expansion and reorganization of Credit Division New Chief Credit Officer Expansion of dedicated workout specialists - OREO/Special Assets team Underwriting/Credit Analysis – expanded portfolio management team to assist loan officers Continued critical review of loan portfolio valuations (new appraisals) Solid workout plans in place Focus on reducing C&D and loan concentrations CRE Work with borrowers on understanding project viability and gaining control of collateral Essential problem solving as it helps to avoid the lagging legal system Protects equity in the property and allows us to control ultimate disposition of property PBIB is a motivated seller with buyer programs available Continued negative economic factors (unemployment, growth, etc.) could result in slower pace of improvement and continued decline in collateral values 14 Our markets are still challenged and borrowers continue to struggle Improvement 14
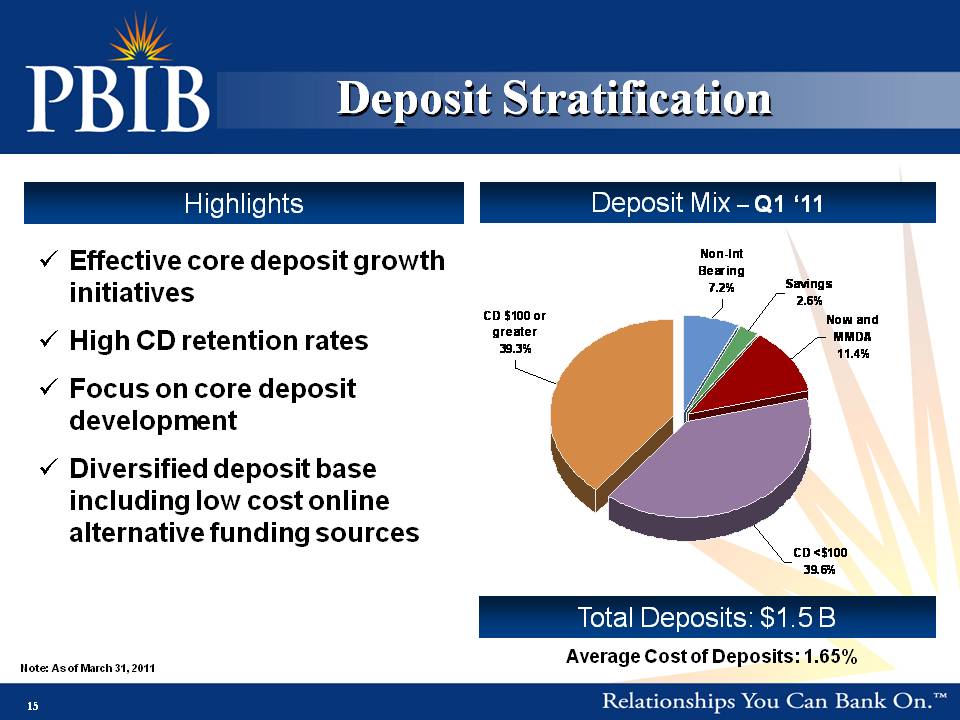
Deposit Stratification Q1 ‘11 Highlights Deposit Mix – Effective core deposit growth initiatives Non-Int Bearing 7.2% Savings 2.6% High CD retention rates Focus on core deposit CD $100 or greater 39.3% Now and MMDA 11.4% development Diversified deposit base including low cost online Total $1 5 B alternative funding sources CD <$100 39.6% 15 Deposits: 1.5 Note: As of March 31, 2011 Average Cost of Deposits: 1.65%
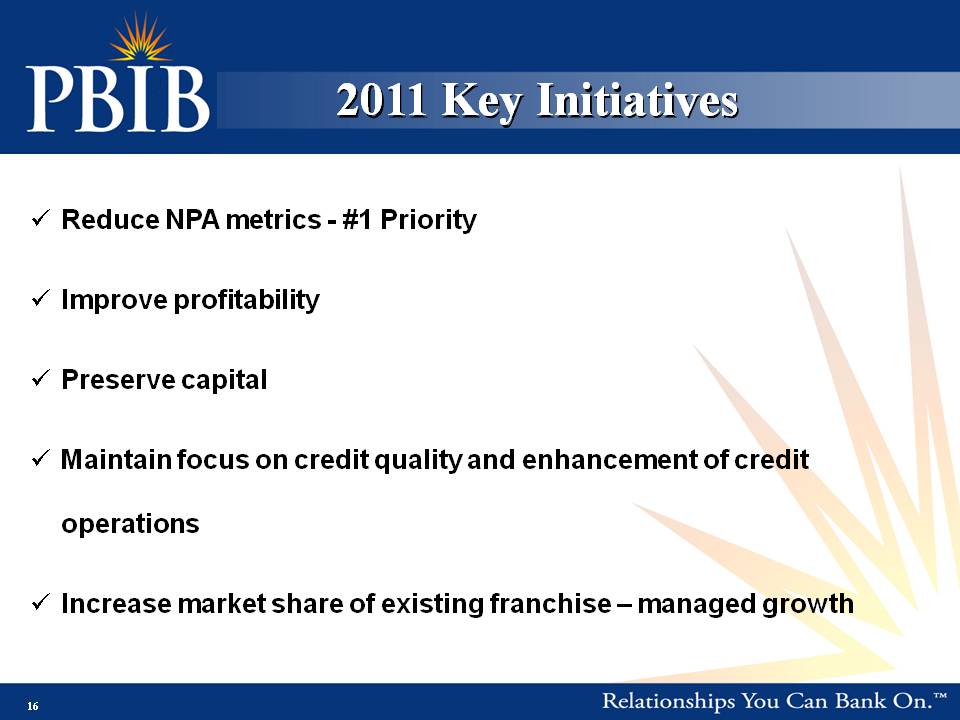
2011 Key Initiatives Reduce NPA metrics - #1 Priority Improve profitability Preserve capital Maintain focus on credit quality and enhancement of credit operations Increase market share of existing franchise – managed growth 16
Addendum
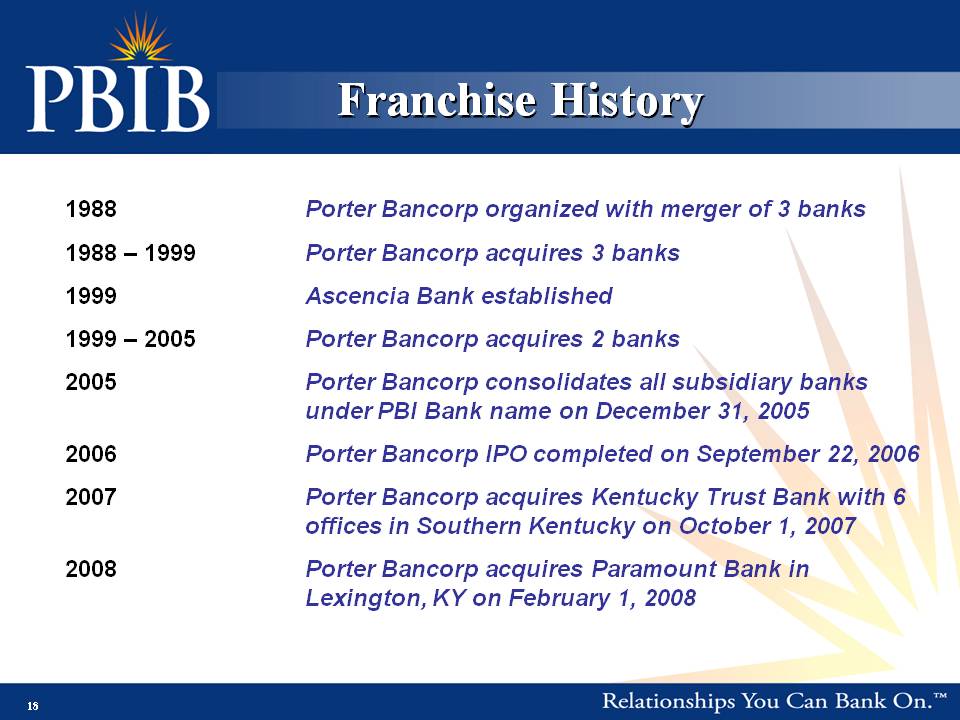
Franchise 1988 with merger 3 banks Porter Bancorp organized of 1988 – 1999 Porter Bancorp acquires 3 banks 1999 Ascencia Bank established 1999 – 2005 Porter Bancorp acquires 2 banks 2005 Porter Bancorp consolidates all subsidiary banks under PBI Bank on 31 name December 31, 2005 2006 Porter Bancorp IPO completed on September 22, 2006 2007 Porter Bancorp acquires Kentucky Trust Bank with 6 offices in Southern Kentucky on October 1, 2007 2008 Porter Bancorp acquires Paramount Bank in Lexington, KY on February 1, 2008 History 18
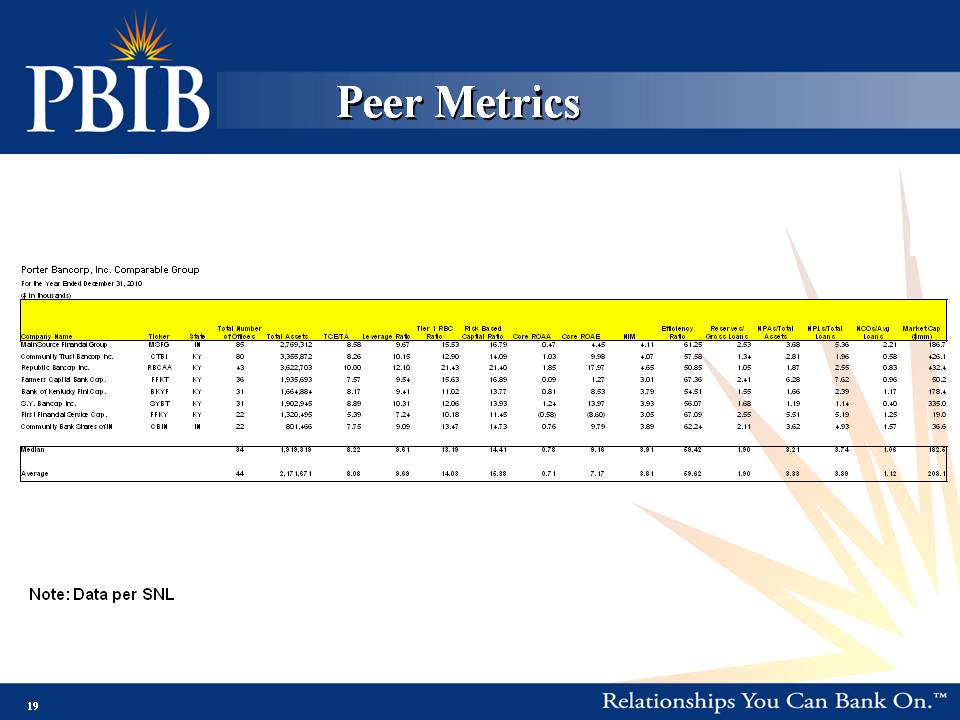
Peer Porter Bancorp, Inc. Comparable Group For the Year Ended December 31, 2010 ($ in thousands) Company Name Ticker State Total Number of Offices Total Assets TCE/TA Leverage Ratio Tier 1 RBC Ratio Risk Based Captial Ratio Core ROAA Core ROAE NIM Efficiency Ratio Reserves/ Gross Loans NPAs/Total Assets NPLs/Total Loans NCOs/Avg Loans Market Cap ($mm) MainSource Financial Group MSFG IN 85 2,769,312 8.58 9.67 15.53 16.79 0.47 4.45 4.11 61.25 2.53 3.68 5.36 2.21 186.7 Community Trust Bancorp Inc. CTBI KY 80 3,355,872 8.26 10.15 12.90 14.09 1.03 9.98 4.07 57.58 1.34 2.81 1.96 0.58 426.1 Republic Bancorp Inc. RBCAA KY 43 3,622,703 10.00 12.10 21.43 21.40 1.85 17.97 4.65 50.85 1.05 1.87 2.55 0.83 432.4 Farmers Capital Bank Corp. FFKT KY 36 1,935,693 7.57 9.54 15.63 16.89 0.09 1.27 3.01 67.36 2.41 6.28 7.62 0.96 50.2 Bank of Kentucky Finl Corp. BKYF KY 31 1,664,884 8.17 9.41 11.02 13.77 0.81 8.53 3.79 54.51 1.55 1.66 2.39 1.17 178.4 S.Y. Bancorp Inc. SYBT KY 31 1,902,945 8.89 10.31 12.06 13.93 1.24 13.97 3.93 56.07 1.68 1.19 1.14 0.40 335.0 First Financial Service Corp. FFKY KY 22 1,320,495 5.39 7.24 10.18 11.45 (0.58) (8.60) 3.05 67.09 2.55 5.51 5.19 1.25 19.0 Community Bank Shares of IN CBIN IN 22 801,466 7.75 9.09 13.47 14.73 0.76 9.79 3.89 62.24 2.11 3.62 4.93 1.57 36.6 Median 34 1,919,319 8.22 9.61 13.19 14.41 0.78 9.16 3.91 59.42 1.90 3.21 3.74 1.06 182.5 Average 44 2,171,671 8.08 9.69 14.03 15.38 0.71 7.17 3.81 59.62 1.90 3.33 3.89 1.12 208.1 Metrics Note: Data per SNL 19
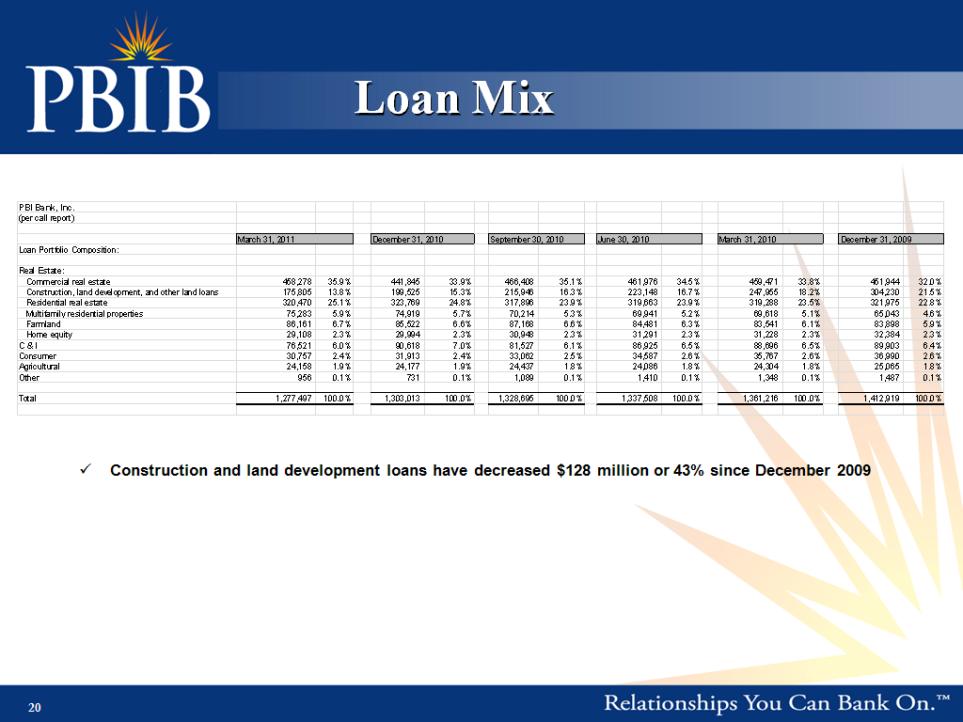
Loan Mix PBI Bank Inc Bank, Inc. (per call report) March 31, 2011 December 31, 2010 September 30, 2010 June 30, 2010 March 31, 2010 December 31, 2009 Loan Portfolio Composition: Real Estate: Commercial real estate 458,278 35.9% 441,845 33.9% 466,408 35.1% 461,976 34.5% 459,471 33.8% 451,944 32.0% Construction, land development, and other land loans 175,805 13.8% 199,525 15.3% 215,946 16.3% 223,148 16.7% 247,955 18.2% 304,230 21.5% Residential real estate 320,470 25.1% 323,769 24.8% 317,896 23.9% 319,663 23.9% 319,288 23.5% 321,975 22.8% Multifamily residential properties 75,283 5.9% 74,919 5.7% 70,214 5.3% 69,941 5.2% 69,618 5.1% 65,043 4.6% Farmland 86,161 6.7% 85,522 6.6% 87,168 6.6% 84,481 6.3% 83,541 6.1% 83,898 5.9% Home equity 29,108 2.3% 29,994 2.3% 30,948 2.3% 31,291 2.3% 31,228 2.3% 32,384 2.3% C & I 76,521 6.0% 90,618 7.0% 81,527 6.1% 86,925 6.5% 88,696 6.5% 89,903 6.4% Consumer 30,757 2.4% 31,913 2.4% 33,062 2.5% 34,587 2.6% 35,767 2.6% 36,990 2.6% Agricultural 24,158 1.9% 24,177 1.9% 24,437 1.8% 24,086 1.8% 24,304 1.8% 25,065 1.8% Other 956 0.1% 731 0.1% 1,089 0.1% 1,410 0.1% 1,348 0.1% 1,487 0.1% Total 1,277,497 100.0% 1,303,013 100.0% 1,328,695 100.0% 1,337,508 100.0% 1,361,216 100.0% 1,412,919 100.0% Construction and land development loans have decreased $128 million or 43% since December 2009 20
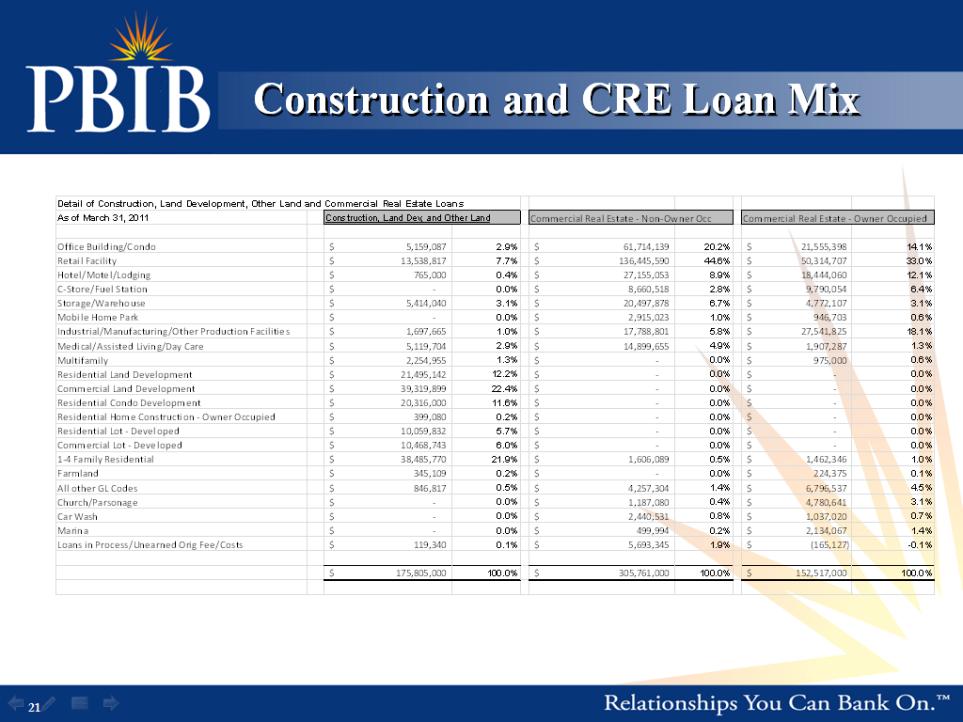
Construction and CRE Loan Mix Detail of Construction, Land Development, Other Land and Commercial Real Estate Loans etaAs of March 31, 2011 Construction, Land Dev, and Other Land Commercial Real Estate ‐ Non‐Owner Occ Commercial Real Estate ‐ Owner Occupied Office Building/Condo 5,159,087 $ 2.9% 61,714,139 $ 20.2% 21,555,398 $ 14.1% Retail Facility 13,538,817 $ 7.7% 136,445,590 $ 44.6% 50,314,707 $ 33.0% Hotel/Motel/Lodging 765,000 $ 0.4% 27,155,053 $ 8.9% 18,444,060 $ 12.1% C‐Store/Fuel Station ‐ $ 0.0% 8,660,518 $ 2.8% 9,790,054 $ 6.4% Storage/Warehouse 5,414,040 $ 3.1% 20,497,878 $ 6.7% 4,772,107 $ 3.1% Mobile Home Park ‐ $ 0.0% 2,915,023 $ 1.0% 946,703 $ 0.6% Industrial/Manufacturing/Other Production Facilities 1,697,665 $ 1.0% 17,788,801 $ 5.8% 27,541,825 $ 18.1% Medical/Assisted Living/Day Care 5,119,704 $ 2.9% 14,899,655 $ 4.9% 1,907,287 $ 1.3% Multifamily 2,254,955 $ 1.3% ‐ $ 0.0% 975,000 $ 0.6% Residential Land Development 21,495,142 $ 12.2% ‐ $ 0.0% ‐ $ 0.0% Commercial Land Development 39,319,899 $ 22.4% ‐ $ 0.0% ‐ $ 0.0% Residential Condo Development 20,316,000 $ 11.6% ‐ $ 0.0% ‐ $ 0.0% Residential Home Construction ‐ Owner Occupied 399,080 $ 0.2% ‐ $ 0.0% ‐ $ 0.0% Residential Lot ‐ Developed 10,059,832 $ 5.7% ‐ $ 0.0% ‐ $ 0.0% Commercial Lot ‐ Developed 10,468,743 $ 6.0% ‐ $ 0.0% ‐ $ 0.0% 1‐4 Family Residential 38,485,770 $ 21.9% 1,606,089 $ 0.5% 1,462,346 $ 1.0% Farmland 345,109 $ 0.2% ‐ $ 0.0% 224,375 $ 0.1% All other GL Codes 846,817 $ 0.5% 4,257,304 $ 1.4% 6,796,537 $ 4.5% Church/Parsonage ‐ $ 0.0% 1,187,080 $ 0.4% 4,780,641 $ 3.1% Car $ 0 0% 2 440 531 $ 0 8% 1 037 020 $ 0 7% Wash ‐ 0.0% 2,440,531 0.8% 1,037,020 0.7% Marina ‐ $ 0.0% 499,994 $ 0.2% 2,134,067 $ 1.4% Loans in Process/Unearned Orig Fee/Costs 119,340 $ 0.1% 5,693,345 $ 1.9% (165,127) $ -0.1% 175,805,000 $ 100.0% 305,761,000 $ 100.0% 152,517,000 $ 100.0% 21