Attached files
| file | filename |
|---|---|
| 8-K - FORM 8-K - NuStar GP Holdings, LLC | d8k.htm |
 Curt Anastasio, CEO and
President May 26, 2011
2011 Master Limited Partnership
Investor Conference
Exhibit 99.1 |
 Statements contained in this presentation that state management’s
expectations or predictions of the future are forward-looking statements as
defined
by
federal
securities
law.
The
words
“believe,”
“expect,”
“should,”
“targeting,”
“estimates,”
and other similar expressions identify forward-
looking
statements.
It
is
important
to
note
that
actual
results
could
differ
materially from those projected in such forward-looking statements. We
undertake no duty to update any forward-looking statement to conform the
statement to actual results or changes in the company’s expectations.
For more information concerning factors that could cause actual results to
differ from those expressed or forecasted, see NuStar Energy L.P.’s and
NuStar GP Holdings, LLC’s respective annual reports on Form 10-K and
quarterly reports on Form 10-Q, filed with the Securities and Exchange
Commission and
available
on
NuStar’s
websites
at
www.nustarenergy.com
and
www.nustargpholdings.com.
Forward Looking Statements
2 |
 NuStar Overview
3 |
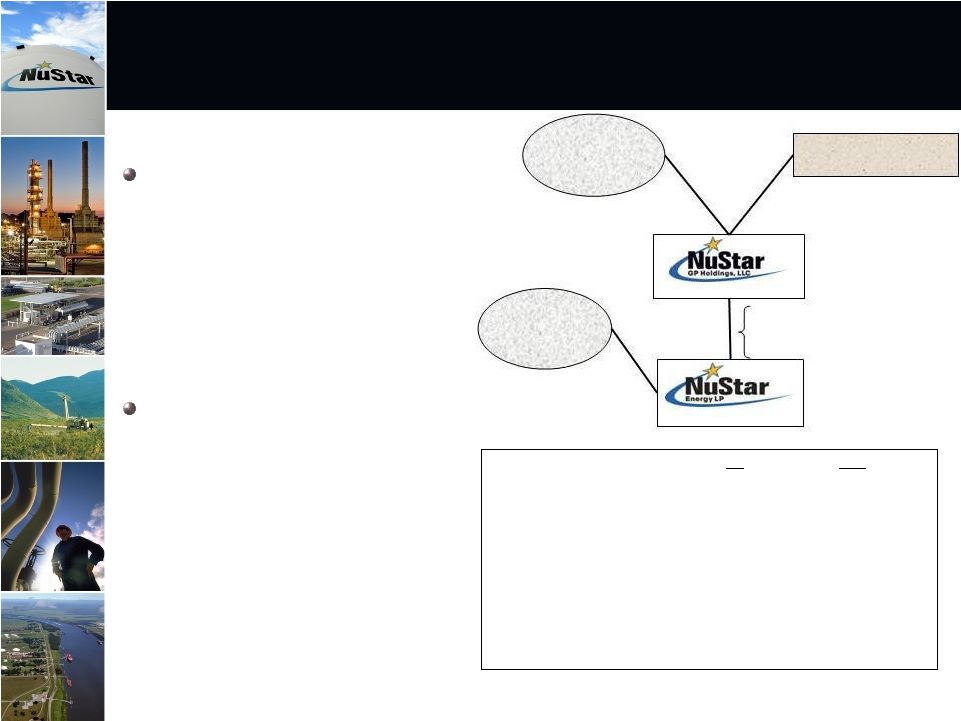 NuStar Energy L.P. (NYSE: NS) is
a leading publicly traded
partnership with a market
capitalization of around $4.0 billion
and an enterprise value of
approximately $6.3 billion
NuStar GP Holdings, LLC (NYSE:
NSH) holds the 2% general
partner interest, incentive
distribution rights and 15.6% of the
common units in NuStar Energy
L.P. with a market capitalization of
around $1.5 billion
Two Publicly Traded Companies
NS
NSH
IPO Date:
4/16/2001
7/19/2006
Unit Price (05/20/11):
$62.09
$36.22
Annual Distribution/Unit:
$4.30
$1.92
Yield (05/20/11):
6.93%
5.30%
Market Capitalization:
$4,012 million
$1,542 million
Enterprise Value
$6,304 million
$1,551 million
Credit Ratings –
Moody’s
Baa3/Stable
n/a
S&P and Fitch
BBB-/Stable
n/a
82.9%
Membership Interest
82.4%
L.P. Interest
Public Unitholders
35.3 Million NSH Units
Public Unitholders
54.4 Million NS Units
17.1%
Membership
Interest
2.0% G.P. Interest
15.6% L.P. Interest
Incentive Distribution Rights
William E. Greehey
7.3 Million NSH Units
NYSE: NSH
NYSE: NS
4 |
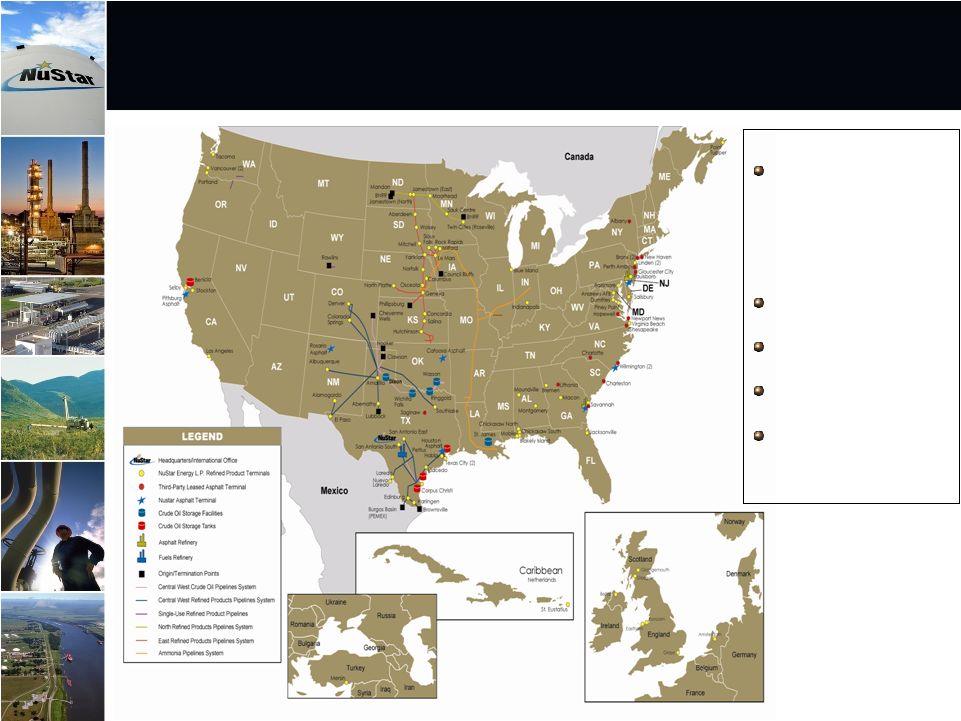 Large
and Diverse Geographic Footprint
with Assets in Key Locations
Asset Stats:
Operations in eight different
countries including the U.S.,
Mexico, the Netherlands,
including St. Eustatius in
the Caribbean, England,
Ireland, Scotland, Canada
and Turkey.
Own 90 terminal and
storage facilities
Over 94 million barrels of
storage capacity
8,417 miles of crude oil and
refined product pipelines
2 asphalt refineries and a
fuels refinery capable of
processing 118,500 bpd of
crude oil
5 |
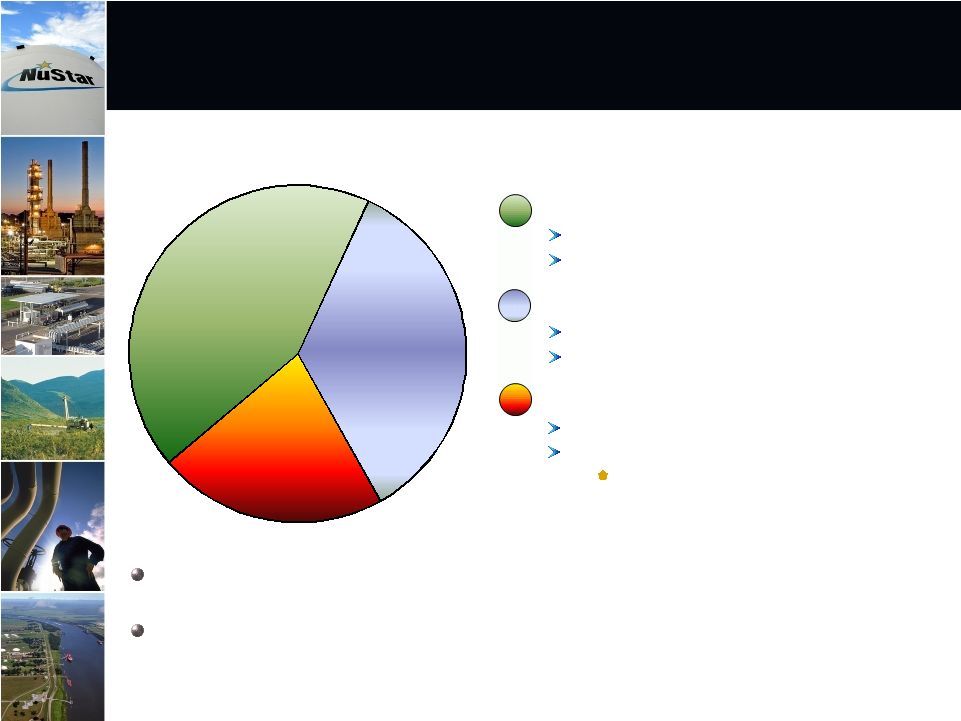 43%
35%
22%
Percentage of 2010
Segment Operating Income
Approximately 78% of NuStar Energy’s 2010 segment operating income came
from fee-based transportation and storage segments
Approximately 75% of 2011 segment operating income should come from fee-
based transportation and storage segments
Storage: 43%
Transportation: 35%
Refined Product Terminals
Crude Oil Storage
Refined Product Pipelines*
Crude Oil Pipelines
Asphalt & Fuels Marketing: 22%
Asphalt
Fuels Marketing
Product Supply, Bunkering and Fuel Oil
Marketing
Diversified Operations from Three
Business Segments
* Includes primarily distillates, gasoline, propane, jet fuel, ammonia and
other light products. Does not include natural gas. 6
|
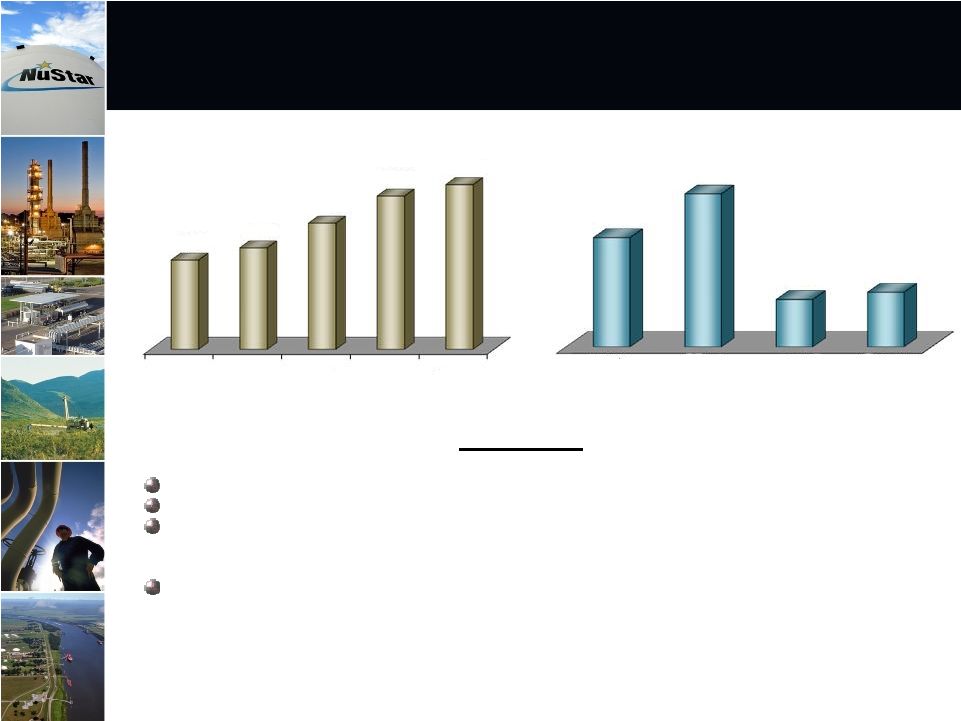
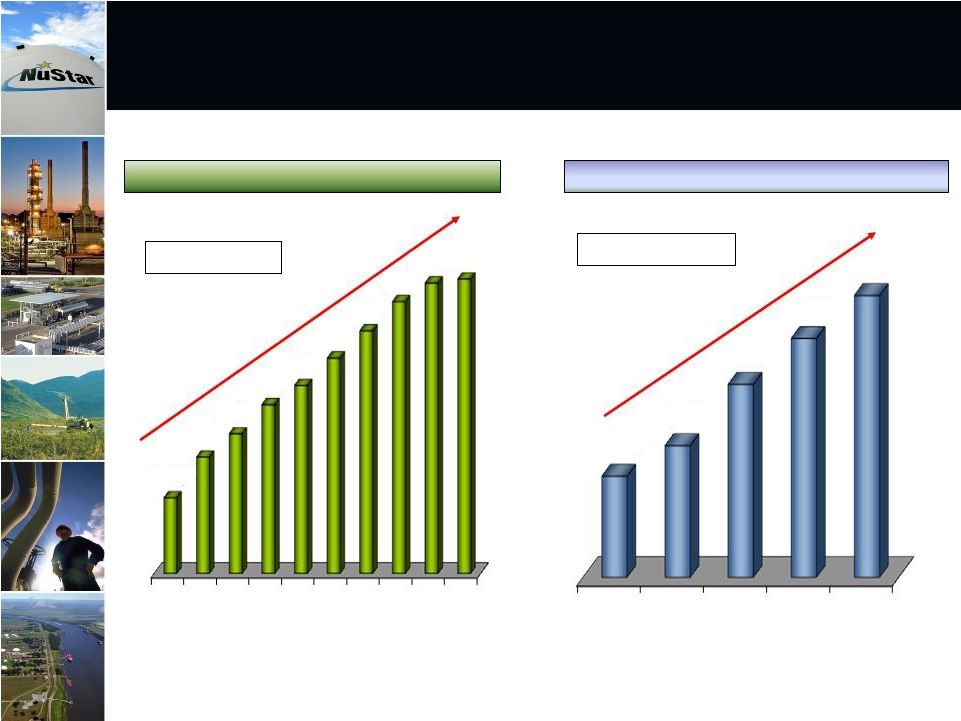 Distributions for both NS and NSH have grown every year since IPO’s…
Expect 2011 distribution growth rate to be higher than 2010
7
NS Distribution ($ per Unit)
NSH Distribution ($ per Unit)
~6.6% CAGR
~9.9% CAGR
* Annualized Distribution
*
*
2001
2002
2003
2004
2005
2006
2007
2008
2009
2010
$2.75
$2.95
$3.20
$3.37
$3.60
$3.84
$4.09
$4.245
$4.28
2006
2007
2008
2009
2010
$1.38
$1.58
$1.73
$1.87
$2.40
$1.28 |
 Storage Segment Overview
8 |
 9
Storage Segment EBITDA ($ in Millions)
Storage Contract Renewals (% of Revenues)
1 Year
or Less
1 to 3
Years
3 to 5
Years
Greater
Than 5
Years
2011 Storage Segment
EBITDA Expected to be Higher than 2010
2006
2007
2008
2009
2010
$162
$177
$208
$242
$256
30%
42%
13%
15%
2011 Outlook
Full year 2011 segment EBITDA expected to be $25 to $35 million higher than 2010 2
Full year of EBITDA from May 2010 Mobile, AL terminal acquisition and St. Eustatius
terminal
acquisition that closed in February 2011 quarter
2011
segment
EBITDA
should
be
slightly
higher
than
2
nd
quarter
2010
project
completed
in
4
th
quarter
2010;
partial
year
of
EBITDA
from
Turkey
terminal
Benefits
from
St.
James
Phase
1
storage
project
should
begin
in
3
rd
quarter
2011
nd |
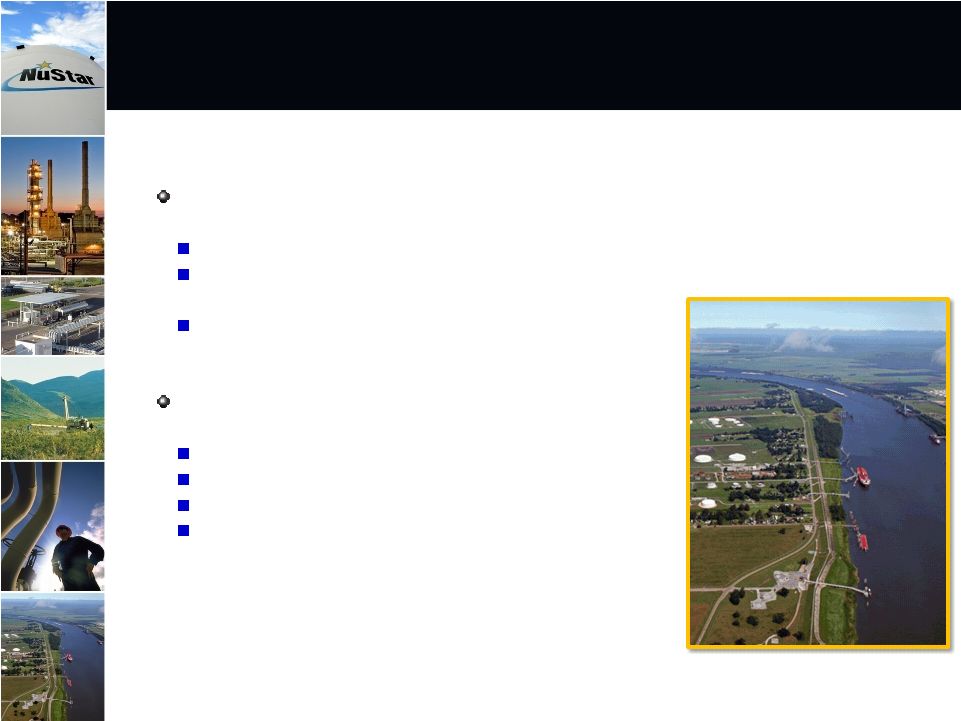 Plan
to expand our St. James, Louisiana terminal in two phases
Phase 1 –
Third-Party Crude Oil Storage
Construct 3.2 million barrels of crude oil storage
Projected CAPEX of $125 to $145 million, with projected average annual
EBITDA of $15 to $25 million
Expected in-service 3
rd
quarter 2011
Phase 2 –
Third-Party Crude Oil Storage
Project in early planning stages
Should be similar in size to Phase 1 project
Could grow in size based on customer demand
Expected in-service last half of 2012
10 |
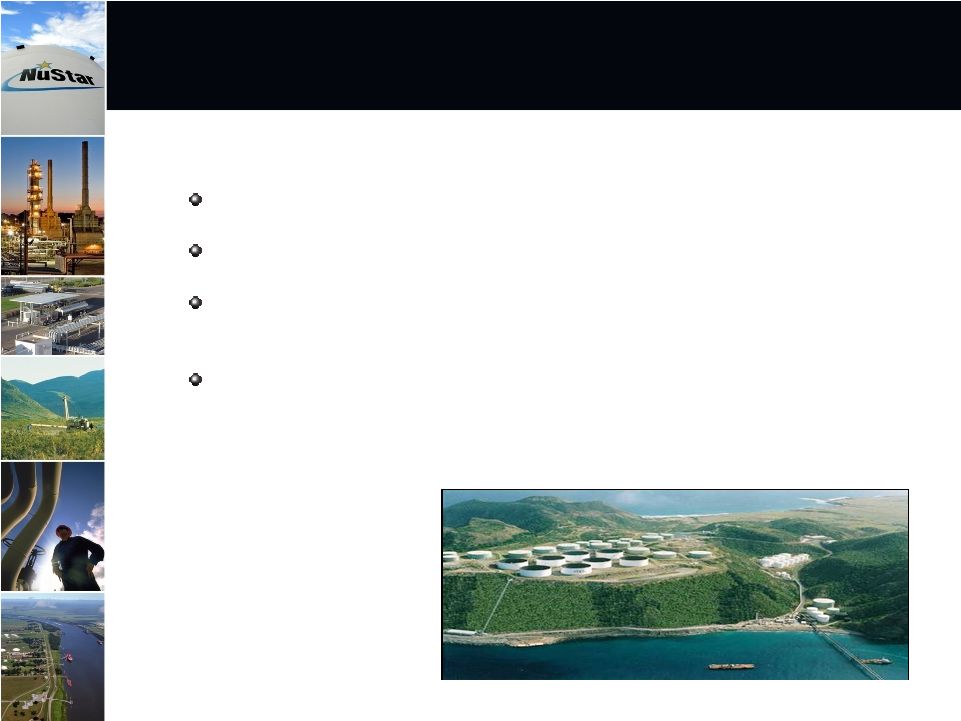 Plan
to construct new tanks for distillate service at our St. Eustatius
terminal Construct one million barrels of new storage for distillate
service Interested customers include several large oil companies
Projected CAPEX of $45 to $55 million, with projected average
annual EBITDA of $5 to $10 million
Expected in-service 3 quarter 2012
11
rd |
 Transportation Segment
Overview
12 |
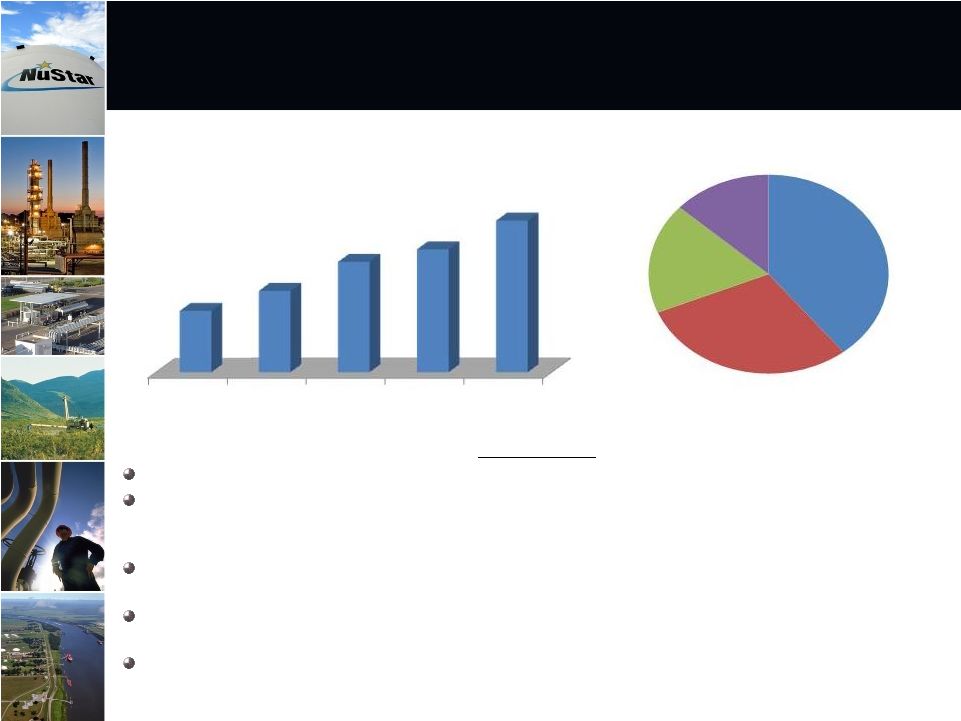 13
Transportation Segment EBITDA ($ in Millions)
2010 Pipeline Receipts by Commodity
Lower throughputs should cause
Transportation Segment EBITDA to be down in 2011
Gasoline
29%
Other*
13%
*Other includes ammonia, jet fuel, propane, naphtha
and light end refined products
Crude Oil
40%
Distillate
18%
2011 Outlook
Full year 2011 segment EBITDA expected to be $10 to $20 million lower than
2010 $1-$5 million of additional EBITDA from internal growth
projects. Eagle Ford shale crude project with Koch Pipeline Company
should increase throughputs 30,000 BPD and should be completed in
mid-2011. Throughputs projected to be down ~8%. Heavy customer
refinery turnaround schedule and changing market conditions could negatively
impact throughputs Tariff increase of 6.9%, effective July 1, 2011, includes a
2.65% FERC approved index adjustment factor that will be applicable on an
annual basis through June 30, 2016 2
quarter
2011
segment
EBITDA
should
be
$5
to
$10
million
lower
than
2
quarter
2010
nd
nd
2006
2007
2008
2009
2010
$170
$176
$186
$190
$199 |
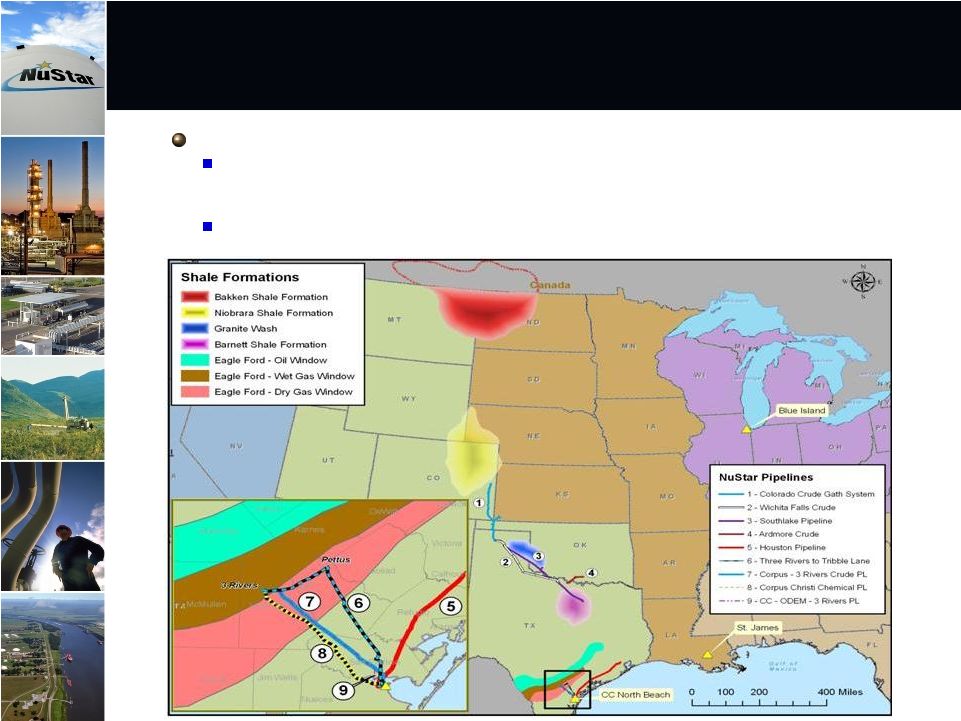 Transportation Segment Assets in close
proximity to key Shale Formations
Shale Development Strategy should increase
Transportation Segment Throughputs
Shale Development Strategy
There are key shale developments located in NuStar’s Mid-Continent and Gulf
Coast regions, including the Eagle Ford, Bakken, Granite Wash, Barnett, and
Niobrara
Our
strategy is to optimize and grow the existing asset base, and maximize the
value of the assets located in or near shale developments
14 |
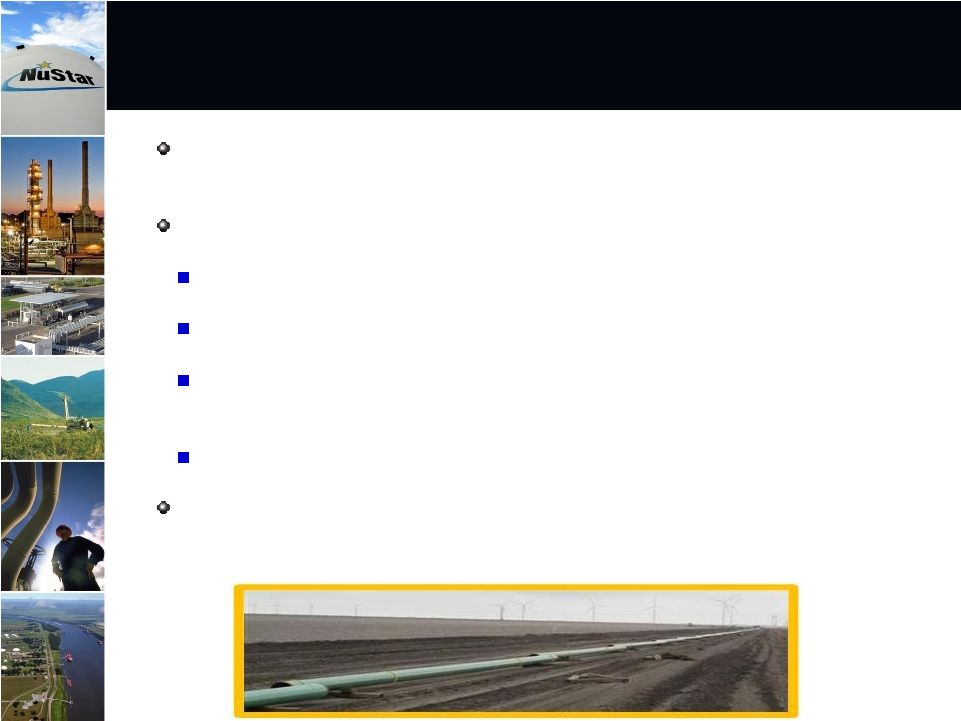 15
Two Eagle Ford Shale Projects have been
announced to date….expect to announce
additional projects in the near future
Previously discussed Pipeline Connection & Capacity Lease Agreement
with Koch Pipeline
In April 2011, announced the signing of a LOI with TexStar Midstream
Services to develop a new pipeline system
TexStar plans to construct a 65-mile, 12-inch pipeline to transport crude
and condensate from Frio County, TX to Three Rivers, TX
Pipeline
should
be
interconnected
with
a
new
storage
facility
to
be
constructed at Three Rivers, TX by NuStar
Plan to connect storage facility to NuStar’s existing 16-inch pipeline that
can transport 200,000 BPD to NuStar’s Corpus Christi North Beach
storage terminal
Expected in-service date of system 2Q 2012
Currently in discussions with several parties regarding the potential of
converting some of our underutilized assets into Eagle Ford, Granite Wash
and Barnett shale service |
 Asphalt & Fuels Marketing
Segment Overview
16 |
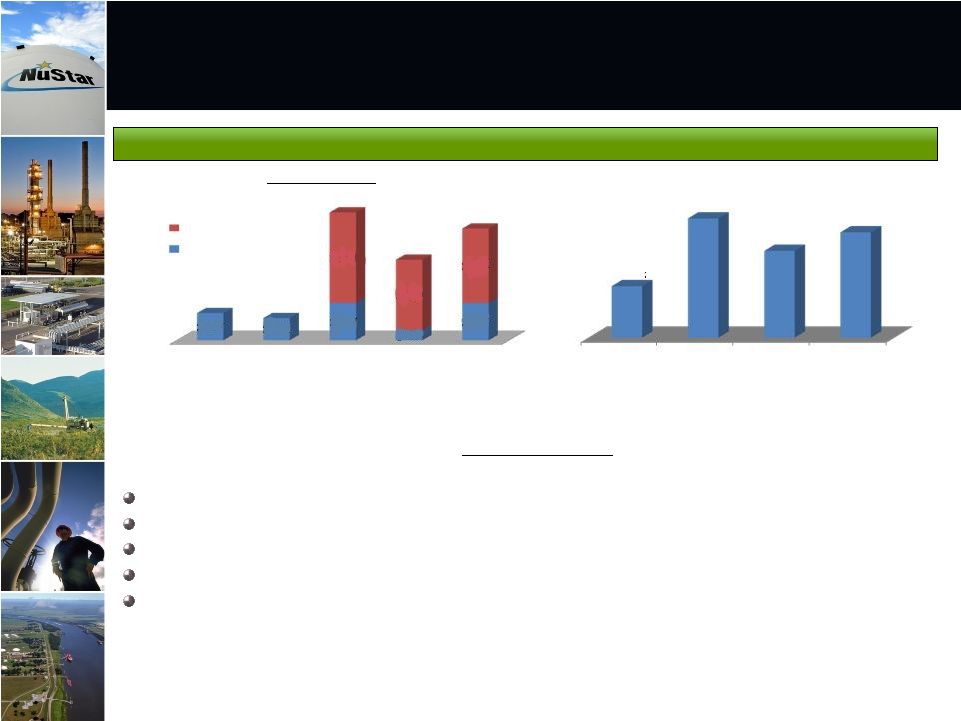 Earnings from recent refinery acquisition as well as
improved earnings in Asphalt and Fuels Marketing
operations should lead to improved segment results
Asphalt & Fuels Marketing
U.S. East Coast Product Margin ($ per barrel)
17
2009
Actual
2008
Actual
2000-2007
Average
2011 Outlook
April
2011
San
Antonio
refinery
acquisition
already
contributing
to
2011
earnings
Comparable to slightly lower asphalt demand more than offset by tight supply
Full year benefit from new U.S. heavy fuels and bunker fuels markets entered in
2010 2
nd
quarter
2011
segment
EBITDA
should
be
$40
to
$45
million
higher
than
2
nd
quarter
2010
Full year 2011 segment EBITDA expected to be $45 to $55 million higher than
2010 EBITDA (MM$)
2010
Actual
2006
2007
2008
2009
2010
$80
$111
$127
$27
$22
$37
$10
$37
$90
$70
$74
Asphalt
Fuels Marketing
$3.78
$8.75
$6.37
$7.73 |
 18
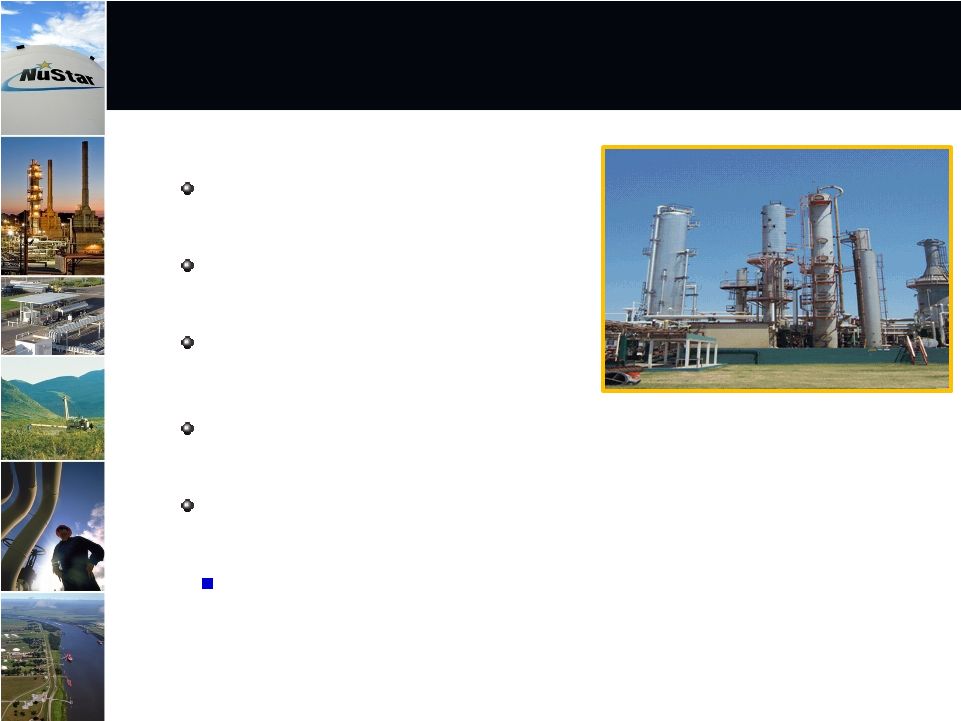
San Antonio Refinery acquisition immediately
accretive to Distributable Cash Flow
Approximately 70% of current refinery production of 12,000 BPD is
hedged over the next three to four years
Expect refinery to generate $30 to $40 million of EBITDA and $20
to $30
million
of
distributable
cash
flow
per
year
over
the
life
of
the
hedges
$18 to $22 million of EBITDA and $12 to $16 million of
distributable cash flow projected for 2011
14,500 BPD refinery acquired for $41
million
Processes crude and condensate from
Eagle Ford shale formation
Produces and sells jet fuel, ULSD,
naphtha, reformate and LPG’s |
 Financial Overview
19 |
 20
3/31/11 Revolver Availability
NuStar Revolver Availability close to $300 million….
Credit Metrics improving as earnings increase
Total Bank Credit
$1,222
Less:
Borrowings
(421)
Letters of Credit
Go Zone Financing
(294)
Other
(5)
Revolver Availability
$502
Standard
&
Poor’s:
BBB
-
(Stable
Outlook)
Moody’s: Baa3 (Stable Outlook)
Fitch: BBB-
(Stable Outlook)
Debt/EBITDA (3/31/11): 4.4x
Debt/Capitalization (3/31/11): 47%
Credit Ratings/Metrics
(Dollars in Millions)
5.0x Revolver Debt/EBITDA covenant limits true Revolver availability to
~$300 million at 3/31/11 |
 21
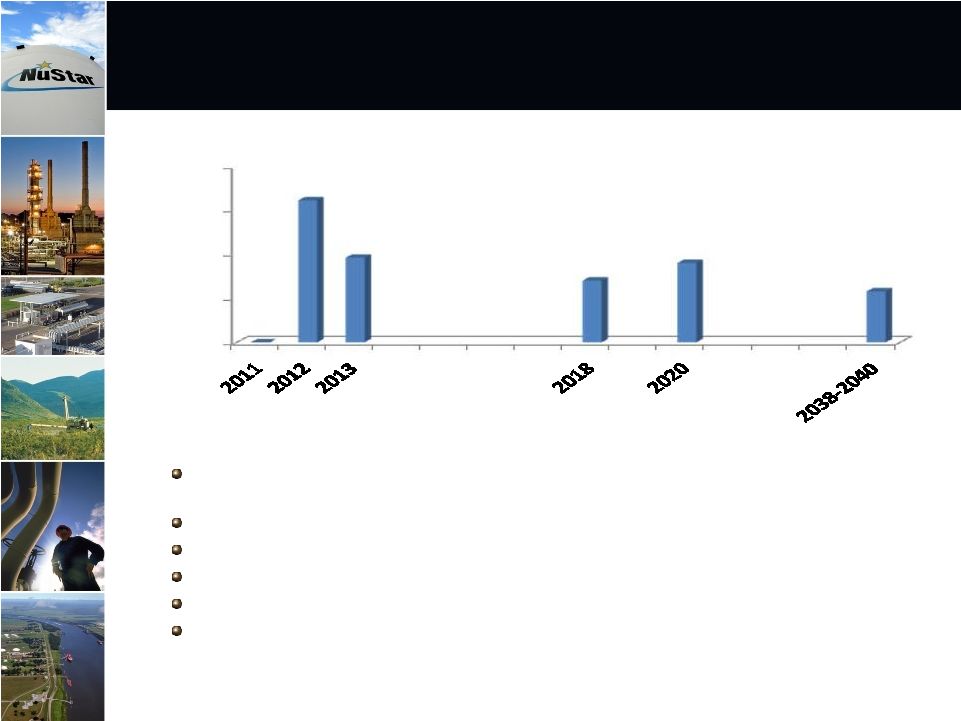
No Significant Debt Maturities Until 2012
No significant debt maturities until 2012 at which time the revolver and some
senior notes become due
New Credit Revolver terms & pricing seem to be improving as economy
improves Current plan is to hold off closing on a new Revolver until
2012 $290
million
worth
of
GO
Zone
financing
matures
in
2038
–
2040
Debt
structure
approximately
40%
fixed
rate
–
60%
variable
rate
Entered into $200 million Equity Distribution Agreement on May 23, 2011
Debt Maturities as of March 31, 2011
(Millions $)
0
250
500
750
1000
1
806
480
350
450
290 |
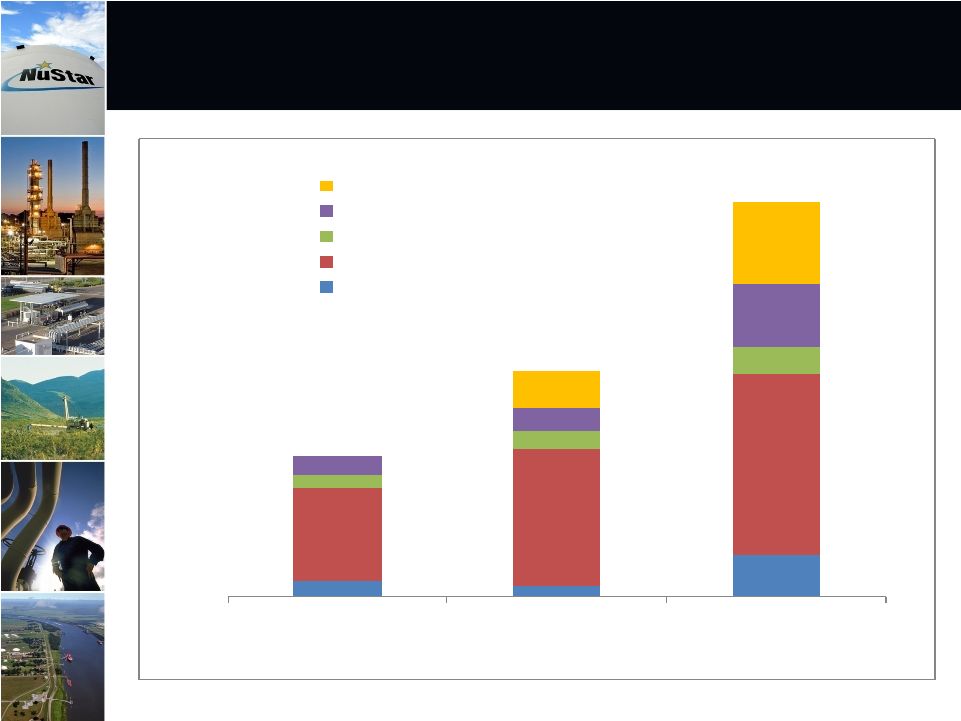 $20
$13
$49
$107
$159
$210
$14
$20
$31
$23
$27
$73
$43
$94
2009 Actual
2010 Actual
2011 Forecast
Acquisitions
Corporate
Asphalt & Fuels Marketing
Storage
Transportation
2011 Total Spending on Internal Growth Projects &
Acquisitions currently projected to be around
$450 million
22
(
Dollars in Millions)
$164
$262
$457 |
 High quality, large and diverse asset footprint supporting energy infrastructure
both in the U.S. and internationally
Contracted fee-based storage and transportation assets provide stable cash
flows, delivering 78% of 2010 operating income
Fourth largest independent liquids terminal operator in the world
Diverse and high quality customer base composed of large integrated oil companies,
national oil companies and refiners
Strong balance sheet, credit metrics and commitment to maintain investment grade
credit ratings
Lower cost of capital than majority of peers
Experienced and proven management team with substantial equity ownership and
industry experience
Recognized nationally for safety and environmental record as well as one of the
best places to work
Why Invest in NuStar?
23 |
 |
 25
Appendix |
 Reconciliation of Non-GAAP Financial
Information: Transportation Segment
26
(Unaudited, Dollars in Thousands)
The following is a reconciliation of operating income to EBITDA for the
Transportation Segment: 2006
2007
2008
2009
2010
Operating income
122,714
$
126,508
$
135,086
$
139,869
$
148,571
$
Plus depreciation and amortization expense
47,145
49,946
50,749
50,528
50,617
EBITDA
169,859
$
176,454
$
185,835
$
190,397
$
199,188
$
Projected incremental operating income range
$ 1,000 -
4,000
Plus projected incremental depreciation and
amortization expense range
0 -
1,000
Projected incremental EBITDA range
$ 1,000 -
5,000
The following is a reconciliation of projected decrease in operating income to
projected decrease in EBITDA: Projected decrease in operating income
($ 5,000 -
10,500)
($ 10,000 -
20,500)
Plus projected incremental depreciation and
amortization expense range
0 -
500
0 -
500
Projected decrease in EBITDA range
($ 5,000 -
10,000)
($ 10,000 -
20,000)
Three Months
Ended
June 30, 2011
Year Ended
December 31,
2011
Year Ended December 31,
NuStar
Energy
L.P.
utilizes
two
financial
measures,
EBITDA
and
distributable
cash
flow,
which
are
not
defined
in
United
States
generally
accepted
accounting
principles
(GAAP).
Management
uses
these
financial
measures
because
they
are
widely
accepted
financial
indicators
used
by
investors
to
compare
partnership
performance.
In
addition,
management
believes
that
these
measures
provide
investors
an
enhanced
perspective
of
the
operating
performance
of
the
partnership's
assets
and
the
cash
that
the
business
is
generating.
EBITDA
in
the
following
reconciliations
relate
to
our
reportable
segments
or
a
portion
of
a
reportable
segment.
We
do
not
allocate
general
and
administrative
expenses
to
our
reportable
segments
because
those
expenses
relate
primarily
to
the
overall
management
at
the
entity
level.
Therefore,
EBITDA
reflected
in
the
following
reconciliations
excludes
any
allocation
of
general
and
administrative
expenses
consistent
with
our
policy
for
determining
segmental
operating
income,
the
most
directly
comparable
GAAP
measure.
EBITDA
should
not
be
considered
in
isolation
or
as
a
substitute
for
a
measure
of
performance
prepared
in
accordance
with
GAAP.
Neither
EBITDA
nor
distributable
cash
flow
are
intended
to
represent
cash
flows
for
the
period,
nor
are
they
presented
as
an
alternative
to
net
income.
They
should
not be considered in isolation or as a substitute for a measure of performance
prepared in accordance with GAAP. Year Ended
December 31,
2011
The following is a reconciliation of projected incremental operating income to
projected incremental EBITDA related to our internal growth program: |
 Reconciliation of Non-GAAP Financial
Information: Storage Segment
27
(Unaudited, Dollars in Thousands)
The following is a reconciliation of operating income to EBITDA for the Storage Segment:
2006
2007
2008
2009
2010
Operating income
108,486
$
114,635
$
141,079
$
171,245
$
178,947
$
Plus depreciation and amortization expense
53,121
62,317
66,706
70,888
77,071
EBITDA
161,607
$
176,952
$
207,785
$
242,133
$
256,018
$
Projected incremental operating income range
$ 16,500 - 25,500
Plus projected incremental depreciation and
amortization expense range
8,500 - 9,500
Projected incremental EBITDA range
$ 25,000 - 35,000
St. James, LA
Terminal
Expansion
Phase 1
St. Eustatius
Distillate
Project
Projected annual operating income range
$ 11,000 - 20,000
$ 4,000 - 8,000
Plus projected annual depreciation and
amortization expense range
4,000 - 5,000
1,000 - 2,000
Projected annual EBITDA range
$ 15,000 - 25,000
$ 5,000 - 10,000
The
following
is
a
reconciliation
of
projected
annual
operating
income
to
projected
annual
EBITDA
for
certain
projects
in
our
storage
segment
related
to
our internal growth program:
The following is a reconciliation of projected incremental operating income to projected incremental
EBITDA: Year Ended December 31,
Year Ended
December 31, 2011
NuStar
Energy
L.P.
utilizes
two
financial
measures,
EBITDA
and
distributable
cash
flow,
which
are
not
defined
in
United
States
generally
accepted
accounting
principles
(GAAP).
Management
uses
these
financial
measures
because
they
are
widely
accepted
financial
indicators
used
by
investors
to
compare
partnership
performance.
In
addition,
management
believes
that
these
measures
provide
investors
an
enhanced
perspective
of
the
operating
performance
of
the
partnership's
assets
and
the
cash
that
the
business
is
generating.
EBITDA
in
the
following
reconciliations
relate
to
our
reportable
segments
or
a
portion
of
a
reportable
segment.
We
do
not
allocate
general
and
administrative
expenses
to
our
reportable
segments
because
those
expenses
relate
primarily
to
the
overall
management
at
the
entity
level.
Therefore,
EBITDA
reflected
in
the
following
reconciliations
excludes
any
allocation
of
general
and
administrative
expenses
consistent
with
our
policy
for
determining
segmental
operating
income,
the
most
directly
comparable
GAAP
measure.
EBITDA
should
not
be
considered
in
isolation
or
as
a
substitute
for
a
measure
of
performance
prepared
in
accordance
with
GAAP.
Neither
EBITDA
nor
distributable
cash
flow
are
intended
to
represent
cash
flows
for
the
period,
nor
are
they
presented
as
an
alternative
to
net
income.
They
should
not
be
considered
in
isolation
or
as
a
substitute for a measure of performance prepared in accordance with GAAP.
|
 Reconciliation of Non-GAAP Financial Information:
Asphalt and Fuels Marketing Segment
28
(Unaudited, Dollars in Thousands)
Asphalt
Operations
Fuels Marketing
Operations
Asphalt and
Fuels Marketing
Segment
Operating income
53,977
$
36,884
$
90,861
$
Plus depreciation and amortization expense
20,164
93
20,257
EBITDA
74,141
$
36,977
$
111,118
$
Asphalt
Operations
Fuels Marketing
Operations
Asphalt and
Fuels Marketing
Segment
Operating income
50,710
$
9,919
$
60,629
$
Plus depreciation and amortization expense
19,463
-
19,463
EBITDA
70,173
$
9,919
$
80,092
$
Year Ended
December 31, 2007
Year Ended
December 31, 2006
Asphalt
Operations
Fuels Marketing
Operations
Asphalt and
Fuels Marketing
Segment
Asphalt and Fuels
Marketing
Segment
Asphalt and Fuels
Marketing
Segment
Operating income
76,267
$
36,239
$
112,506
$
21,111
$
26,815
$
Plus depreciation and amortization expense
14,182
552
14,734
423
-
EBITDA
90,449
$
36,791
$
127,240
$
21,534
$
26,815
$
NuStar
Energy
L.P.
utilizes
two
financial
measures,
EBITDA
and
distributable
cash
flow,
which
are
not
defined
in
United
States
generally
accepted
accounting
principles
(GAAP).
Management
uses
these
financial
measures
because
they
are
widely
accepted
financial
indicators
used
by
investors
to
compare
partnership
performance.
In
addition,
management
believes
that
these
measures
provide
investors
an
enhanced
perspective
of
the
operating
performance
of
the
partnership's
assets
and
the
cash
that
the
business
is
generating.
EBITDA
in
the
following
reconciliations
relate
to
our
reportable
segments
or
a
portion
of
a
reportable
segment.
We
do
not
allocate
general
and
administrative
expenses
to
our
reportable
segments
because
those
expenses
relate
primarily
to
the
overall
management
at
the
entity
level.
Therefore,
EBITDA
reflected
in
the
following
reconciliations
excludes
any
allocation
of
general
and
administrative
expenses
consistent
with
our
policy
for
determining
segmental
operating
income,
the
most
directly
comparable
GAAP
measure.
EBITDA
should
not
be
considered
in
isolation
or
as
a
substitute
for
a
measure
of
performance
prepared
in
accordance
with
GAAP.
Neither
EBITDA
nor
distributable
cash
flow
are
intended
to
represent
cash
flows
for
the
period,
nor
are
they
presented
as
an
alternative
to
net
income.
They
should
not
be
considered
in
isolation
or
as
a
substitute
for
a
measure
of
performance
prepared
in
accordance
with GAAP.
The following tables reconcile operating income to EBITDA for asphalt operations and fuels marketing
operations in our asphalt and fuels marketing segment: Year Ended December 31, 2010
Year Ended December 31, 2009
Year Ended December 31, 2008 |
 Reconciliation of Non-GAAP Financial Information:
Asphalt and Fuels Marketing Segment (continued)
29
(Unaudited, Dollars in Thousands)
The following is a reconciliation of projected incremental operating income to
projected incremental EBITDA: Projected incremental operating income
range $ 39,500 -
44,000
$ 43,000 -
52,000
Plus projected incremental depreciation and
amortization expense range
500 -
1,000
2,000 -
3,000
Projected incremental EBITDA range
$ 40,000 -
45,000
$ 45,000 -
55,000
Annually Over
Life of Hedges
Year Ended
December 31, 2011
Projected incremental operating income range
$ 26,000 -
34,000
$ 17,000 -
20,000
Plus projected incremental depreciation
and amortization expense range
4,000 -
6,000
1,000 -
2,000
Projected incremental EBITDA range
$ 30,000 -
40,000
$ 18,000 -
22,000
Less projected allocations for distributable
cash flow purposes
(10,000)
(6,000)
Projected incremental distributable cash
flow range
$ 20,000 -
30,000
$ 12,000 -
16,000
The
following
is
a
reconciliation
of
projected
incremental
operating
income
to
projected
incremental
EBITDA
to
projected
distributable
cash
flow
for
the
San
Antonio Refinery acquisition:
Three Months
Ended
June 30, 2011
Year Ended
December 31, 2011
NuStar
Energy
L.P.
utilizes
two
financial
measures,
EBITDA
and
distributable
cash
flow,
which
are
not
defined
in
United
States
generally
accepted
accounting
principles
(GAAP).
Management
uses
these
financial
measures
because
they
are
widely
accepted
financial
indicators
used
by
investors
to
compare
partnership
performance.
In
addition,
management
believes
that
these
measures
provide
investors
an
enhanced
perspective
of
the
operating
performance
of
the
partnership's
assets
and
the
cash
that
the
business
is
generating.
EBITDA
in
the
following
reconciliations
relate
to
our
reportable
segments
or
a
portion
of
a
reportable
segment.
We
do
not
allocate
general
and
administrative
expenses
to
our
reportable
segments
because
those
expenses
relate
primarily
to
the
overall
management
at
the
entity
level.
Therefore,
EBITDA
reflected
in
the
following
reconciliations
excludes
any
allocation
of
general
and
administrative
expenses
consistent
with
our
policy
for
determining
segmental
operating
income,
the
most
directly
comparable
GAAP
measure.
EBITDA
should
not
be
considered
in
isolation
or
as
a
substitute
for
a
measure
of
performance
prepared
in
accordance
with
GAAP.
Neither
EBITDA
nor
distributable
cash
flow
are
intended
to
represent
cash
flows
for
the
period,
nor
are
they
presented
as
an
alternative
to
net
income. They should not be considered in isolation or as a substitute for a
measure of performance prepared in accordance with GAAP. |