Attached files
| file | filename |
|---|---|
| 8-K - FORM 8-K 5/20/11 - KITE REALTY GROUP TRUST | form8k_52311.htm |
EXHIBIT 99.1

Kite Realty Group Trust
Investor Presentation

2
COMPANY OVERVIEW
|
§ Stable Portfolio
|
§ 64 Properties in 10 states
§ Total GLA of 9.6 million square feet
§ 52 Properties in the Retail Operating Portfolio; 92.3% leased
§ Diverse tenant base: Largest tenant represents only 3.2% of annualized base rent
§ 5 mile demographics: Population 127,000; Average HHI $86,000
|
|
§ Increased Leasing Productivity
|
§ Over 1.1 million square feet of leasing production in 2010 - the highest level in company history
§ Retail Operating Portfolio leased percentage increased 220 basis points since Q1 2010
§ Increased shop leased percentage 270 basis points since Q1 2010
§ 34 new and renewal anchor leases for 1.1 million square feet completed since Q1 2009
|
|
§ Development & Redevelopment
Progress |
§ Commenced vertical construction on Whole Foods at Cobblestone Plaza in Pembroke Pines,
Florida as well as on the South Elgin Commons II project in Chicago, Illinois § Rivers Edge redevelopment in Indianapolis is under construction and 95% pre-leased including
anchors Nordstrom Rack, The Container Store, BuyBuy Baby, Arhaus Furniture, and BGI Fitness § Signed a lease with Whole Foods to anchor the redevelopment of recently acquired Oleander
Point in Wilmington, North Carolina |
|
§ Earnings Upside
|
§ $5.5 million of annualized EBITDA from recently executed leases anticipated to
commence by the end of 2011 § Same Property Net Operating Income up 1% in Q1 2011
|
Information as of March 31, 2011

3
GROWTH SOURCES
§ Rent commencement on executed leases
§ $5.5 million in annualized EBITDA anticipated to commence by the end of 2011
§ Increase small shop occupancy
§ From current 78% to historical 85%
§ Execute on redevelopments
§ Rivers Edge in Indianapolis, IN is 95% leased and under construction
§ Signed Whole Foods at recently acquired Oleander Point in Wilmington, North Carolina
§ Complete tenant construction and interior build-outs at Cobblestone Plaza
§ With Whole Foods under construction, Cobblestone Plaza in Pembroke Pines, FL is 84%
leased but only 51% occupied
leased but only 51% occupied
§ Future development potential
§ Anticipate commencing construction at Delray Marketplace in second half of 2011

4
§ We have been continually improving the quality and predictability of our FFO
stream.
stream.
Recurring Real Estate Income as a Percent of FFO
(1) 2011 projection is based on the Company’s previously released earnings guidance.
IMPROVING FFO QUALITY
(1)
5
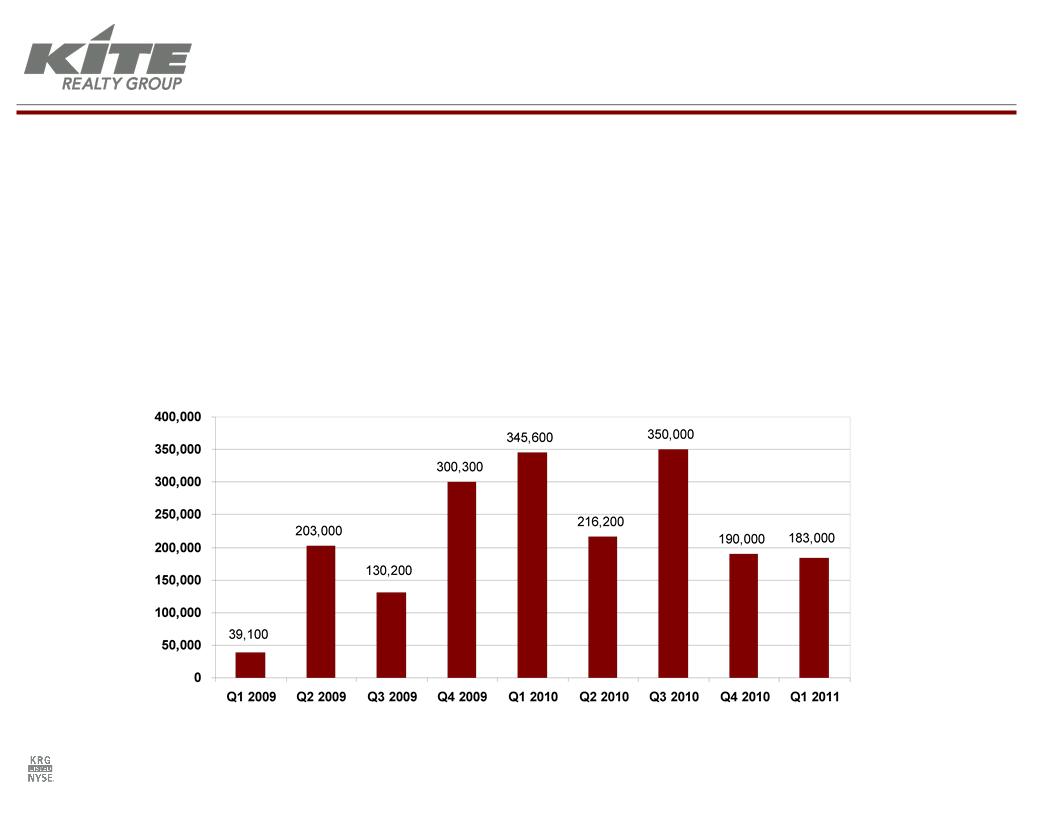
§ Leasing production is a constant company-wide focus
§ Leased 1.1 million square feet during 2010, the highest level of production in company
history and a 64% increase over 2009 levels
history and a 64% increase over 2009 levels
§ 36 new and renewal anchor leases for 1.2 million square feet completed since Q1 2009
§ Q1 2011 had aggregate positive leasing spreads of 5.8%
Total Leasing Production - New and Renewal Leases
LEASING PRODUCTION

6
DIVERSE TENANT BASE
(1) Annualized base rent represents the monthly contractual rent for March 2011 for each applicable tenant multiplied by 12.
(2) S&P credit ratings for parent company as of 4/22/2011.
(3) Rating is by Moody's; S&P does not rate Toys R Us
§ Largest single retail tenant comprises only 3.2% of total annualized base rent
§ Top 10 retail tenants account for only 22.0% of total annualized base rent
Information as of March 31, 2011
(unless otherwise noted)

7
DIVERSE TENANT BASE
Peer Group Assessment:
Top Tenant as a Percent of Annualized Base Rent
|
Kroger
|
Bed Bath
Beyond |
Home
Depot |
Publix
|
TJ Maxx
|
Wal-Mart/
Sam’s |
Kroger
|
A&P
|
Supervalu
|
Publix
|
Giant
Foods |
Source: Company SEC filings.
Information as of March 31, 2011

8
STRONG DEMOGRAPHICS
Source: Applied Geographic Solutions.
§ High quality assets with an average age (including redevelopment) of
less than 9 years
less than 9 years
§ Approximately half of the current portfolio was developed by KRG
§ Portfolio benefits from 100% non-owned anchor occupancy
Portfolio Demographics Summary

9
STRONG DEMOGRAPHICS
Source: Applied Geographic Solutions.
§ We have a history of selecting strong markets for investment
§ Average household incomes in our Florida, Texas and Indiana portfolios are
significantly higher than statewide levels
significantly higher than statewide levels

10
WELL-STAGGERED LEASE EXPIRATIONS
(1) Lease expirations of operating portfolio and excludes option periods and ground leases. Annualized base rent represents the monthly contractual rent
for March 2011 for each applicable property multiplied by 12.
for March 2011 for each applicable property multiplied by 12.
§ Average 8.2% of annualized base rent is expected to roll each year from 2011
through 2020
through 2020
§ With the exception of 2015, our annual exposure to expirations is limited to 10.5% or
less
less
Information as of March 31, 2011

11
IN-PROCESS DEVELOPMENT STATUS
§ Cobblestone Plaza, Ft. Lauderdale, FL
§ 133,000 sf owned GLA
§ 84% pre-leased or committed
§ Whole Foods anchored
§ 94% of projected costs incurred
§ Construction of Whole Foods underway with tenant anticipated to
take possession in the second half of 2011
take possession in the second half of 2011
Information as of March 31, 2011
§ South Elgin Commons, Chicago, IL
§ 128,000 sf owned GLA
§ Phase II 100% pre-leased
§ Ross Stores and Toys R Us will join LA Fitness and Target (non-
owned) (open and operating in Phase I) as anchor tenants prior to
year-end
owned) (open and operating in Phase I) as anchor tenants prior to
year-end

12
RIVERS EDGE REDEVELOPMENT
BEFORE
AFTER
BEFORE
§ Vertical construction
commenced in Q4 2010 at 95%
pre-leased.
commenced in Q4 2010 at 95%
pre-leased.
§ Anchor leases are executed with
Nordstrom Rack, Buy Buy Baby,
The Container Store, Arhaus
Furniture, and BGI Fitness.
Nordstrom Rack, Buy Buy Baby,
The Container Store, Arhaus
Furniture, and BGI Fitness.
§ Secured construction financing
with a 5-year term at LIBOR +
325 bps.
with a 5-year term at LIBOR +
325 bps.
§ Several rent commencements
anticipated for the second half of
2011.
anticipated for the second half of
2011.
13
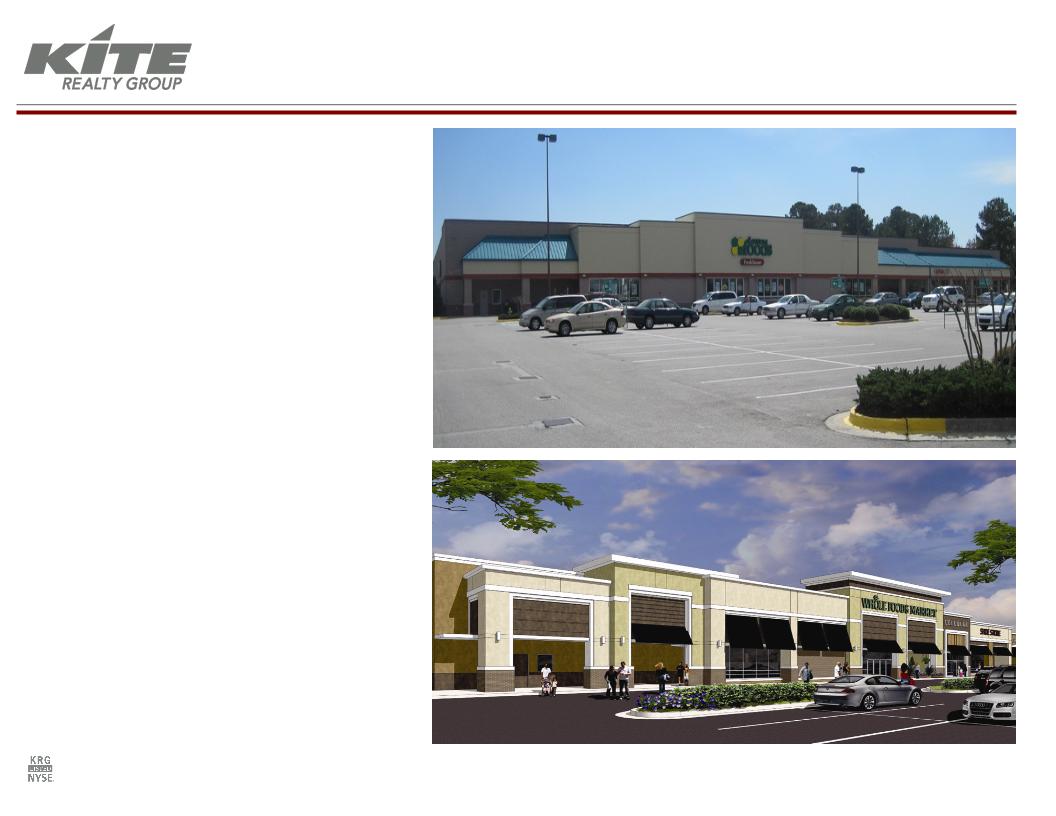
OLEANDER POINT ACQUISITION &
REDEVELOPMENT
REDEVELOPMENT
§ The Company acquired the
neighborhood shopping center
as a redevelopment opportunity
in February 2011.
neighborhood shopping center
as a redevelopment opportunity
in February 2011.
§ Whole Foods will anchor the
shopping center and is
anticipated to open in spring of
2012.
shopping center and is
anticipated to open in spring of
2012.
§ Center will also include 14,000
square feet of shops and an
outparcel tenant.
square feet of shops and an
outparcel tenant.
BEFORE
AFTER

14
Scheduled Debt Maturities (1)
MANAGING LEVERAGE
(1) Dollars in thousands. Maturities exclude annual principal amortization.
§ Nearly all 2011 and 2012 maturities are held by relationship banks
§ Our strategy is to secure long term financing, however 60% of 2011 maturities have extension options
§ Received commitments with our bank group for a 3-year (plus one year extension option) renewal on
our line of credit
our line of credit

15
§ Goal 8.0x in 12 months and 7.0x over long-term
§ Foundation for accomplishing this goal
§ $5.5 million of annualized EBITDA from recently executed
leases anticipated to commence by the end of 2011
leases anticipated to commence by the end of 2011
§ Successful completion of in-process development and
redevelopment projects
redevelopment projects
§ Improving small shop leased percentage to historical 85%
§ Potential value-add acquisition opportunities to be funded with
equity
equity
IMPROVING DEBT/EBITDA

16
DISCLAIMER
This presentation contains certain statements that are not historical fact and may constitute forward-looking
statements within the meaning of the Private Securities Litigation Reform Act of 1995. Such forward-
looking statements involve known and unknown risks, uncertainties and other factors which may cause the
actual results of the Company to differ materially from historical results or from any results expressed or
implied by such forward-looking statements, including, without limitation: national and local economic,
business, real estate and other market conditions, particularly in light of the current challenging economic
conditions; financing risks, including the availability of and costs associated with sources of liquidity; the
Company’s ability to refinance, or extend the maturity dates of, its indebtedness; the level and volatility of
interest rates; the financial stability of tenants, including their ability to pay rent and the risk of tenant
bankruptcies; the competitive environment in which the Company operates; acquisition, disposition,
development and joint venture risks; property ownership and management risks; the Company’s ability to
maintain its status as a real estate investment trust (“REIT”) for federal income tax purposes; potential
environmental and other liabilities; impairment in the value of real estate property the Company owns; risks
related to the geographical concentration of our properties in Indiana, Florida and Texas; assumptions
underlying our anticipated growth sources; and other factors affecting the real estate industry generally.
The Company refers you the documents filed by the Company from time to time with the Securities and
Exchange Commission, specifically the section titled “Risk Factors” in the Company’s Annual Report on
Form 10-K for the year ended December 31, 2010, which discuss these and other factors that could
adversely affect the Company’s results. The Company undertakes no obligation to publicly update or
revise these forward-looking statements (including the FFO and net income estimates), whether as a result
of new information, future events or otherwise.