Attached files
| file | filename |
|---|---|
| 8-K - 8-K - EMRISE Corp | a11-12647_18k.htm |
Exhibit 99.1
|
|
OTC BB: EMRI EMRISE CORPORATION A multi-national manufacturer of electronic devices and communications equipment for the aerospace, defense, commercial and industrial markets in North America, Europe and Asia May 2011 Strategies for Growth and Maximizing Stockholder Value Following a Major Divestiture, an Organizational Realignment and a Financial Overhaul |
|
|
Safe Harbor Statement The matters discussed in this presentation, including any oral comments that accompany the presentation or given in response to questions, may contain forward-looking statements within the meaning of the Private Securities Litigation Reform Act of 1995. Forward-looking statements include, but are not limited to, orders, backlog, financial results, products, and/or other events that have not yet occurred. Actual results may differ materially from those forward-looking statements. Factors that could contribute to such differences include, but are not limited to, variations in forecasted growth rate of markets for the company’s products, changes in EMRISE’s financial condition and financial results, the company’s ability to distinguish itself and it’s products from current and future competitors and those factors contained in the “Risk Factors” Section of the Company’s most recent filings with the U.S. Securities and Exchange Commission on Forms 10-K, Forms 10-Q and Forms 8-K. May 2011 1Unless otherwise indicated the financial information presented in this presentation for all periods shown is “from continuing operations” 2 |
|
|
3 Overview Sale of Advanced Control Components (ACC) for $20 million completed August 31, 2010 Net proceeds used to repay all but $3.8 million of $16 million debt to principal lender and former ACC owners Former ACC founder/owner accepted $450,000 of EMRI shares at premium of $1.07778/share as part payment of amount owed him EMRISE retained $3.8 million in cash from proceeds of sale Significantly improved balance sheet Greatly reduced interest payments More than $6.6 Million in new credit sources $4 million – Lloyds UK; $1.8 million – CIC subsidiary in France; $0.8 million in US Focused on organic growth Working on synergistic acquisition opportunities |
|
|
First Quarter 2011 Overview Revenues up 13% year-over-year Loss from continuing ops down 41% year-over-year Backlog, up 66% to $29.3 million from Q1 2010 $4 million in cash at 3/31/11 Working capital positive $9.2 million at 3/31/11 from negative $7.6 million at 3/31/10 Positioned Company to increase sales, achieve profitability during second half of 2011 Expanded Board 2 outside independent directors with extensive public company and C-level executive experience – Julie Abraham and Frank Russomanno 1 inside director with strong engineering, marketing, operations, M&A experience – Graham Jefferies, President and COO 4 |
|
|
Growth Est. $33 million to $35 million revenue in 2011 Solid platform for growth Anticipate profitability during second half 2011 Manufacturing ramp up in first half 2011 requires upfront investments in engineering and inventory; shipments of large backlog scheduled for Q3 & Q4 will contribute to profitability in last half 2011 Organic growth Core markets in communications and electronic devices well positioned to return to higher growth rates of approximately15% or more Strategic transactions Seeking transactions in Communications Equipment with potential to attract strategic partners – principal focus on network access business Opportunistically explore add-ons to aerospace & defense business 5 |
|
|
Cost Saving Initiatives Ongoing commitment to reducing/controlling costs >$5 million in annualized cost savings in 2009/2010/2011 $1 million of corporate overhead $2 million of unit level savings $1.3 million of annual interest savings from debt reduction >$500,000 annually from finance group consolidation after ACC sale Up to $280,000 annually from renegotiated rents for San Jose facility 6 |
|
|
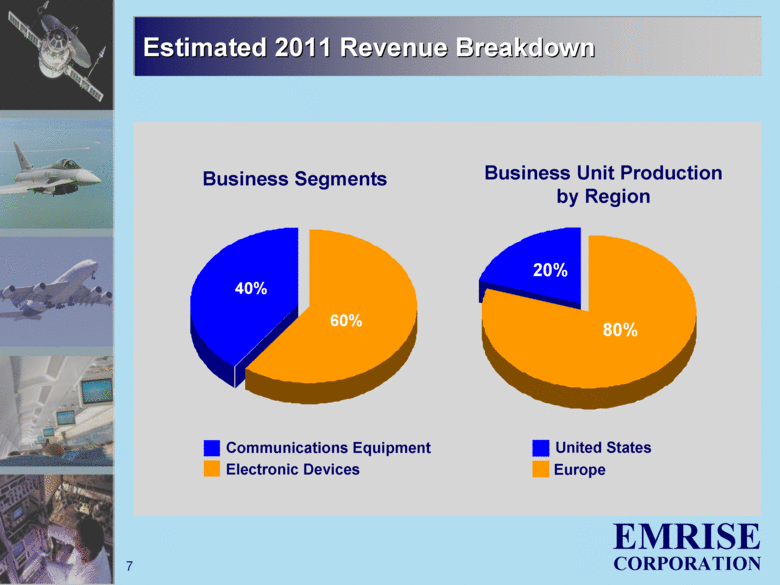
Estimated 2011 Revenue Breakdown Europe Business Unit Production by Region Electronic Devices Business Segments 7 40% 60% 20% 80% Communications Equipment United States |
|
|
Communications Equipment Highly differentiated business with proprietary, marketable products in high growth industry Robust edge network timing and synchronization technologies and products Technology validated by recent customer wins with key U.S. carriers and large U.S. Federal agency Based in U.S. at CXR Larus subsidiary One of small select group with skills/technology to produce complex synchronization and timing systems Identified and currently in discussions with strategic acquisition opportunities and evaluating other complementary strategic alliances 8 |
|
|
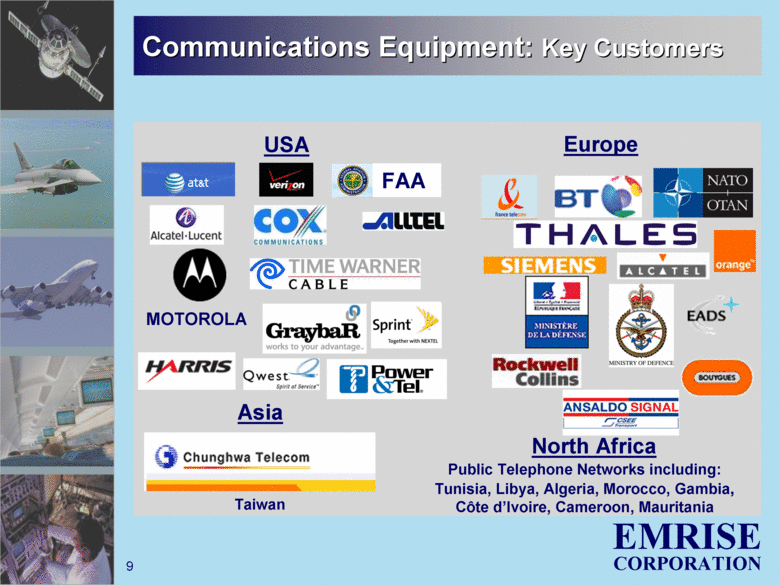
9 Communications Equipment: Key Customers Europe FAA MOTOROLA USA Taiwan Asia North Africa Public Telephone Networks including: Tunisia, Libya, Algeria, Morocco, Gambia, Côte d’Ivoire, Cameroon, Mauritania |
|
|
Communications Equipment: Strategy Capitalize on product line and technology for network timing and synchronization Proliferation of streaming video, data, expanding homeland security needs driving industry growth Application of timing and synchronization products in edge networks will be primary growth driver Expect meaningful future revenue impact Expand business through Organic growth Strategic alliance/partnership transactions Customer list, next generation edge networking technology/products key to future strategic transactions 10 |
|
|
Communications Equipment Significant Market Opportunity Constrained by Company Size/Resources Relatively small size restricts growth prospects Solution – pursue strategic mergers and acquisitions Core focus – complete strategic transactions that increase EMRISE’s product and geographic reach Drive larger revenue Increase access to international markets Identified list of potential complementary partners Talking with one potential partner, evaluating other strategic transactions 11 |
|
|
Electronic Devices European-based Aerospace & Defense business Power supply and RF devices and subsystems Used in broad array of defense, aerospace, commercial, industrial applications Based in the U.K. ~ 40% of revenue in U.S. dollars from U.S. customers Expected to drive organic growth and cash flow 12 |
|
|
Electronic Devices European-based Aerospace & Defense business U.S. Military market has remained robust European Military market has grown slowly in 2010 Eurofighter and other similar long-term programs could drive faster growth in 2012 and 2013 In-flight entertainment & connectivity (IFE&C) market is principal focus EMRISE expects IFE&C market in U.S. and Europe to continue robust order growth seen in Q4 2010 and Q1 2011 Growing pipeline of anticipated new IFE&C orders 13 |
|
|
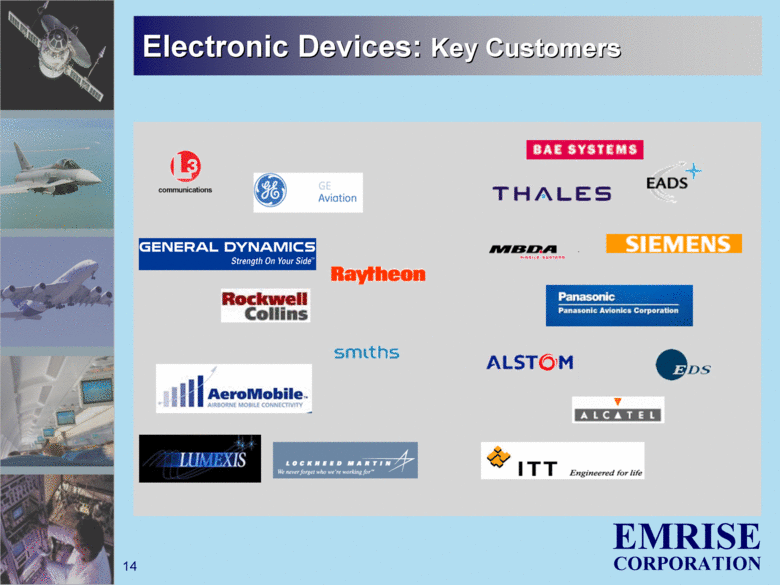
14 Electronic Devices: Key Customers |
|
|
Electronic Devices: Strategy Increase Focus of U.K. divisions on U.S. and European-based subsidiaries of U.S. companies Aerospace and defense IFE&C Industrial Capitalize on strengths to deliver solid organic growth, robust profit contributions Brand name Validated products and technology High quality customer base 15 |
|
|
Recent Track Record of Innovation Communications Equipment Provides critical infrastructure facilitating reliable voice, video, or data transmission across TDM and next generation digital broadband networks for wireline, wireless and cable networks Next Generation PTP/NTP network timing and synchronization equipment Network Access IP Gateway for traffic solutions Electronic Devices Provides mission critical sub systems and devices for commercial aerospace and the military Frequency control devices World leading high performance oscillators Exceptional, high efficiency power systems 16 |
|
|
Organic Growth Drivers Communications Equipment Edge network timing & synchronization market growing rapidly Increased penetration within existing customers Sales of communications products exceeding historical levels Backlog for all communications products highest in 10 years Electronic Devices Focus on higher-margin products Standard products Broader product range Increased IFE&C penetration 17 |
|
|
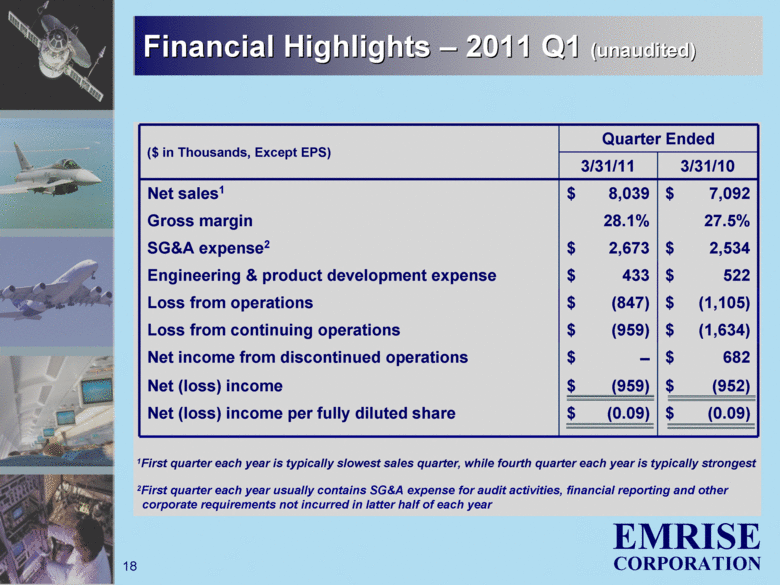
Financial Highlights – 2011 Q1 (unaudited) ($ in Thousands, Except EPS) Quarter Ended 3/31/11 3/31/10 Net sales1 $ 8,039 $ 7,092 Gross margin 28.1% 27.5% SG&A expense2 $ 2,673 $ 2,534 Engineering & product development expense $ 433 $ 522 Loss from operations $ (847) $ (1,105) Loss from continuing operations $ (959) $ (1,634) Net income from discontinued operations $ – $ 682 Net (loss) income $ (959) $ (952) Net (loss) income per fully diluted share $ (0.09) $ (0.09) 18 1First quarter each year is typically slowest sales quarter, while fourth quarter each year is typically strongest 2First quarter each year usually contains SG&A expense for audit activities, financial reporting and other corporate requirements not incurred in latter half of each year |
|
|
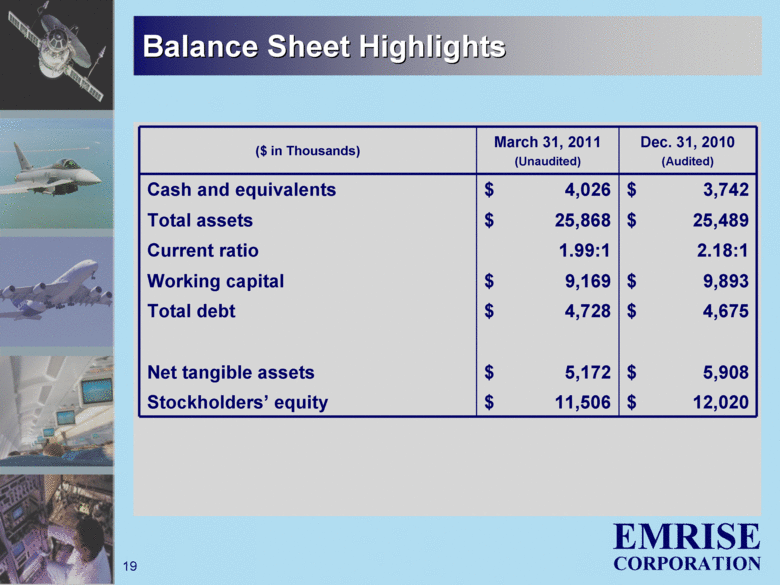
19 Balance Sheet Highlights ($ in Thousands) March 31, 2011 (Unaudited) Dec. 31, 2010 (Audited) Cash and equivalents $ 4,026 $ 3,742 Total assets $ 25,868 $ 25,489 Current ratio 1.99:1 2.18:1 Working capital $ 9,169 $ 9,893 Total debt $ 4,728 $ 4,675 Net tangible assets $ 5,172 $ 5,908 Stockholders’ equity $ 11,506 $ 12,020 |
|
|
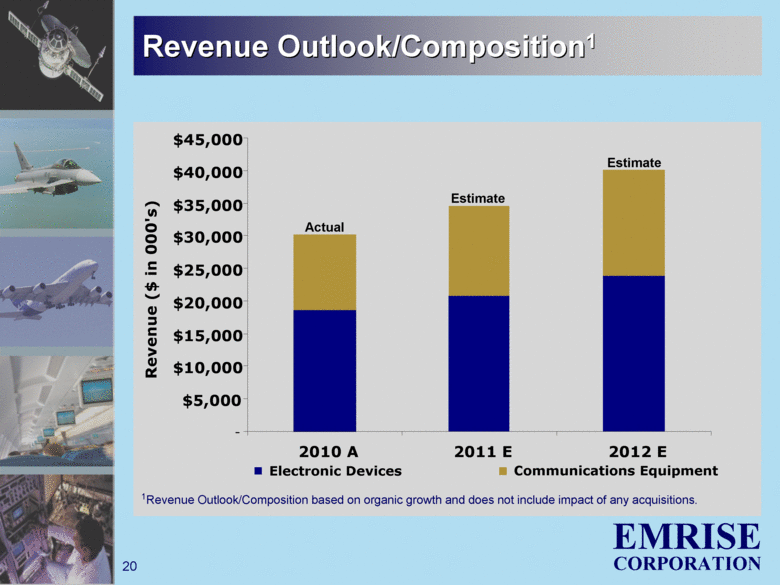
Revenue Outlook/Composition1 - $5,000 $10,000 $15,000 $20,000 $25,000 $30,000 $35,000 $40,000 $45,000 2010 A 2011 E 2012 E Revenue ($ in 000's) Electronic Devices Communications Equipment 20 1Revenue Outlook/Composition based on organic growth and does not include impact of any acquisitions. Estimate Estimate Actual |
|
|
EMRISE Strengths/Investment Thesis Focused with high-growth-potential businesses Excellent brands and products, validated technologies Strong management/engineering, world class customers 2011 revenue estimate of $33 to $35 million reconfirmed Delivery of growing backlog contributes to profitability in last half 2011 Stronger balance sheet with substantial increase in working capital following debt pay down Significantly reduced costs, breakeven point, cash burn Strategic transaction(s) can increase size, resources and scale, help drive revenue growth 21 |
|
|
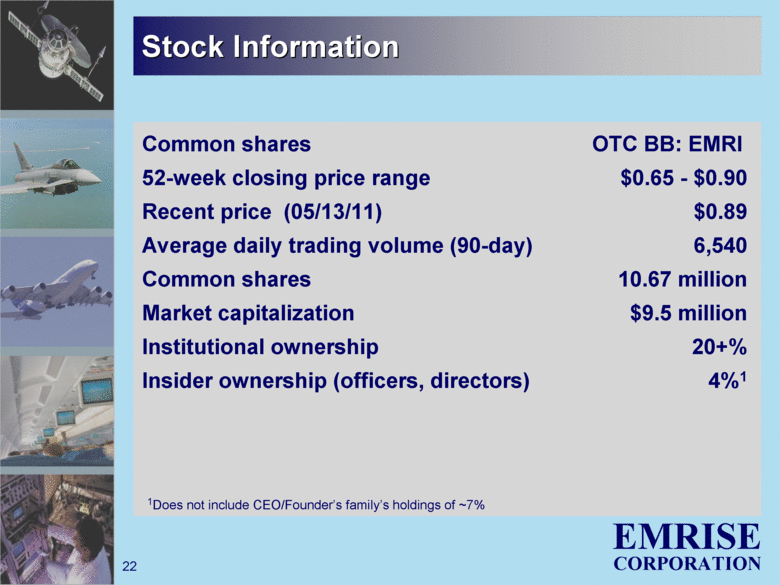
22 Stock Information Common shares OTC BB: EMRI 52-week closing price range $0.65 - $0.90 Recent price (05/13/11) $0.89 Average daily trading volume (90-day) 6,540 Common shares 10.67 million Market capitalization $9.5 million Institutional ownership 20+% Insider ownership (officers, directors) 4%1 1Does not include CEO/Founder’s family’s holdings of ~7% |
|
|
OTC BB: EMRI EMRISE CORPORATION A multi-national manufacturer of electronic devices and communications equipment for the aerospace, defense, commercial and industrial markets in North America, Europe and Asia May 2011 Strategies for Growth and Maximizing Stockholder Value Following a Major Divestiture, an Organizational Realignment and a Financial Overhaul |

