Attached files
| file | filename |
|---|---|
| 8-K - FORM 8-K - REX ENERGY CORP | d8k.htm |
 Rex
Energy Rex Energy
Corporate Presentation
Corporate Presentation
Rex Energy Corporation | 476 Rolling Ridge Drive | State College, PA 16801
P: (814) 278-7267 | F: (814) 278-7286
E: InvestorRelations@RexEnergyCorp.com
www.rexenergy.com
Together We Can Make A Difference
May 2011
May 2011
Exhibit 99.1 |
 Forward
Looking Statements Except for historical information, statements made in this
release, including those relating to significant potential, future earnings, cash flow, capital expenditures,
production growth and planned number of wells (as well as the timing of rig operations,
natural gas processing plant commissioning and operations, fracture stimulation
activities and the completion of wells and the expected dates that wells are producing hydrocarbons that are sold), are forward-looking statements
within
the
meaning
of
Section
27A
of
the
Securities
Act
of
1933,
as
amended,
and
Section
21E
of
the
Securities
Exchange
Act
of
1934,
as
amended.
These
forward-
looking
statements
are
indicated
by
words
such
as
“expected”,
“expects”,
“anticipates”
and
similar
words.
These
statements
are
based
on
assumptions
and
estimates that management believes are reasonable based on currently available
information; however, management's assumptions and the company's future
performance are subject to a wide range of business risks and uncertainties, and there is
no assurance that these goals and projections can or will be met. Any number of
factors could cause actual results to differ materially from those in the forward-looking statements, including (without limitation) the following:
•adverse economic conditions in the United States and globally;
•the difficult and adverse conditions in the domestic and global capital and credit
markets; •domestic and global demand for oil and natural gas;
•sustained
or
further
declines
in
the
prices
the
company
receives
for
oil
and
natural
gas;
•the
effects
of
government
regulation,
permitting
and
other
legal
requirements;
•the geologic quality of the company’s properties with regard to, among other things, the existence of hydrocarbons in economic
quantities; •uncertainties about the estimates of the company’s oil and natural gas reserves;
•the company’s ability to increase production and oil and natural gas income through exploration and
development; •the company’s ability to successfully apply horizontal drilling techniques and tertiary recovery
methods; •the number of well locations to be drilled, the cost to drill and the time frame within
which they will be drilled; •the effects of adverse weather on operations;
•drilling and operating risks;
•the ability of contractors to timely and adequately perform their drilling, construction,
well stimulation, completion and production services;
•the availability of equipment, such as drilling rigs and transportation pipelines;
•changes in the company’s drilling plans and related budgets;
•the adequacy of capital resources and liquidity including (without limitation) access to
additional borrowing capacity; and •uncertainties associated with our legal proceedings and the outcome.
The company undertakes no obligation to publicly update or revise any forward-looking
statements. Further information on the company’s risks and uncertainties is
available in the company's filings with the Securities and Exchange Commission.
The company's internal estimates of reserves may be subject to revision and may be
different from estimates by the company's external reservoir engineers at year
end. Although the company believes the expectations and forecasts reflected in these and other forward-looking statements are reasonable, it can give no
assurance they will prove to have been correct. They can be affected by inaccurate
assumptions or by known or unknown risks and uncertainties. 2
Forward Looking Statements
Forward Looking Statements |
 Hydrocarbon Volume Estimates
Hydrocarbon Value Estimates
Hydrocarbon Value Estimates
3
This presentation includes management’s estimates of Marcellus Shale potential
recoverable resources, per well EUR (estimated ultimate recovery of resources)
and upside potential of recoverable resources. Except as noted, these have been estimated internally by the Company without review by
independent engineers and do not necessarily constitute reserves. These estimates
are included to demonstrate the potential for future drilling by the
Company. Actual recovery of these potential volumes is inherently more speculative
than recovery of estimated proved reserves. Estimates of potential
recoverable resources, per well EURs and upside potential for Company oil and gas shale
acreage are particularly speculative due to the limited experience in Marcellus
Shale horizontal development, with its limited production history. Ultimate recoveries will be dependent upon numerous factors including actual
encountered geological conditions, the impact of future oil and gas pricing and
exploration costs, and our future drilling decisions and budgets based upon our
future evaluation of risk, returns and the availability of capital and, in many areas, the outcome of negotiation of drilling arrangements with holders of
adjacent or fractional interest leases. In addition, potential recoverable
resources are based on undesignated future well locations under assumed acreage
spacing which may not have been specifically included in any definitive development plan
and ultimately may not be drilled. Accordingly, such estimates may differ
significantly from the hydrocarbon quantities that are ultimately recovered.
SEC rules prohibit a publicly-reporting oil and gas company from including oil and
gas resource estimates in their filings with the SEC, except proved, probable and
possible reserves that meet the SEC’s definitions of such terms. Illinois Basin estimates (including Lawrence Field) of oil in place and other
resource volumes, oil in place and other reserve volumes indicated herein are not based
on SEC definitions and guidelines. Unless otherwise indicated, estimates of
non-proved reserves and other hydrocarbons included herein may not meet specific definitions of reserves or resource categories within the
meaning of the SPE/SPEE/WPC Petroleum Resource Management System. |
 Rex Energy
Overview Rex Energy Overview
Significant upside in two high growth shale plays and tertiary oil recovery
•
1.4
–
2.1
Tcfe
in
non-proven
Marcellus
Shale
resource
potential
•
9.4
–
22.7
Mmboe
in
non-proven
Niobrara
Shale
resource
potential
(1)
•
24.9
–
62.2
Mmbls
in
non-proven
Tertiary
Recovery
oil
resource
potential
(1)
Liquids Rich Production & Proven Reserves
•
Total
production
of
27.8
Mmcfe/d
(4,628
BOE/d)
(2)
o
49% oil and NGLs
•
201.7
Bcfe
(33.6
Mmbls)
proven
reserves
(3)
o
62% of proved developed is attributable oil and NGLs
o
85% liquids rich capture
•
PV-10
value
of
$269.4
million
(3)
Strong
Balance
Sheet
&
Liquidity
•
$10.2 million cash
•
$30.0 million in debt
•
Borrowing base increased to $160.0 million in March 2011
•
$130.0 million available on line of credit
•
$6.4 million in Marcellus drilling carries
1. Assumptions
based
on
full
development
program.
Actual
results
may
vary
significantly.
Not
proved.
See
“Hydrocarbon
Volume
Estimates”
on
page
3
and
page
11.
2. First quarter 2011 results
3. Based on year-end 2010 reserves
4. Unaudited financial results as of 3/31/2011
4
(1)
(4) |
 Areas of
Operation Areas of Operation
Appalachian Region
•
~ 59,100 net acres in Marcellus Shale fairway
o
63% of acreage in liquids rich portion of the play
o
Total
non-proven
resource
potential
of
1.4
–
2.1
Tcfe
(1)
o
$6.4 million in drilling carries
(2)
Rockies Region
•
39,000 net acres in Niobrara Shale fairway
o
100% of acres in oil window of the
Niobrara in the DJ Basin
o
Total non-proven resource potential
of 9.4 –
22.7 MMBoe
(1)
Illinois Region
•
Tertiary recovery oil projects
o
Total
non-proven
resource
potential
of
24.9
–
62.2
MMBbls
from
ASP
flooding
in
the
Lawrence
Field
1. Assumptions
based
on
full
development
program.
Actual
results
may
vary
significantly.
Not
proved.
See
“Hydrocarbon
Volume
Estimates”
on
page
3
and
page
11.
2. Unaudited financial results as of 3/31/2011
3. Includes 8,300 net farm in acres
5
(3)
(1) |
 Key
Investment Highlights for 2011 Key Investment Highlights for 2011
•
Rex Energy is poised for growth
o
Strong position in oil and liquids-rich areas
o
Company expects 2011 production growth of 71%-95% over 2010
•
Strong core position in the Appalachian Basin
o
Solid core position in Butler County with 385 potential drill sites
in the Marcellus Shale, with additional potential in the Utica and
Upper Devonian Shale
•
Strong track record of growth with a historical reserve
CAGR of 75% and low F&D cost
•
Rex Energy is equipped to thrive in a low gas price
environment
o
79% of the 2011 capital budget is dedicated to oil and
liquids rich project areas
o
73% of the Appalachian capital budget is allocated to
liquids rich Butler County
•
Secured key drilling, fracture stimulation, and tubular
services for the next two years
•
Opportunities for growth within tertiary recovery projects in
the Illinois Basin and preliminary results in the Niobrara
•
Investment in human capital
6 |
 Positioned
For Growth Positioned For Growth
•
Poised to achieve 71% -
95% production growth in 2011
•
Expect to see 22% -
40% growth in oil and NGL production in 2011
•
A mid case December exit rate of 45.6 Mmcfe/day in 2011 represents an 83% increase
compared to the 2010 exit rate 7
0
5,000
10,000
15,000
20,000
25,000
30,000
35,000
40,000
45,000
50,000
2008 Actual
2009 Actual
2010 Actual
2011 Low Case
2011 High Case
2011 Mid Case Dec
Exit Rate
0%
20%
40%
60%
80%
100%
120%
140%
Dry Gas
Wet Gas
NGL & Condensate
Oil
Annual Growth |
 Reserve
Growth Reserve Growth
Proved Reserve & Compound Annual Growth Rate
Year-End 2010
(1)
•
33.6 Mmboe
(201.7Bcfe)
•
Drill Bit F&D cost of $0.68/ Mcfe
•
$269.4 million PV-10
o
42% proved developed
o
37% oil & NGLs
o
85% liquids rich capture
Year-End 2009
(2)
•
20.9 Mmboe
(125.2 Bcfe)
•
$190.5 million PV-10
o
54% proved developed
o
55% oil & NGLs
Year-End 2008
(3)
•
10.9 Mmboe
(65.4 Bcfe)
•
$84.0 million PV-10
o
62% proved developed
o
52% oil
1. Year-end 2010 reserves calculated using $75.96 per Bbl and $4.38 per Mcf.
2. Year-end 2009 reserves calculated using $57.65 per Bbl and $3.87 per Mcf.
3. Year-end 2008 reserves calculated using $41.00 per Bbl and $5.71 per Mcf.
8
0
50
100
150
200
250
300
Year-End
2008
Year-End
2009
Year-End
2010
Natural Gas
NGLs
Oil
CAGR |
 2011
Capital Budget 2011 Capital Budget
•79%
of
the
total
budget
is
allocated
to
oil
and
liquids
rich
gas
operations.
•73% of the Appalachian
budget is dedicated to liquids rich Butler County operations.
9 |
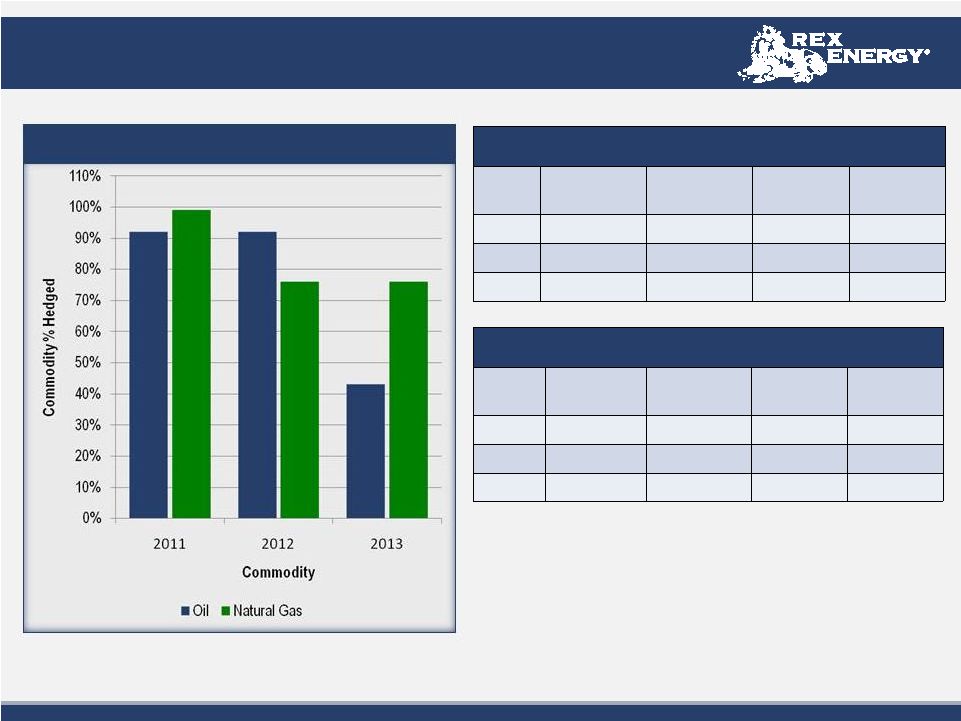 Current
Hedging Summary Current Hedging Summary
Current Production Hedged
Natural Gas
% of Current
with Floor
% of Current
with Ceiling
Avg. Floor
Price
Avg. Ceiling
Price
2011
(1)(2)
99%
87%
$ 5.26
$ 5.67
2012
(2)
76%
76%
$ 4.94
$ 5.89
2013
76%
76%
$ 5.00
$6.25
Crude Oil
% of Current
with Floor
% of Current
with Ceiling
Avg. Floor
Price
Avg. Ceiling
Price
2011
92%
92%
$68.54
$104.69
2012
92%
92%
$67.10
$112.03
2013
43%
43%
$70.50
$120.00
•
Percentage hedged based on low case of second quarter
guidance with decline built in
10
1. ~12%
of
current
natural
gas
production
covered
in
2011
by
put
spread
with
a
$3.68
short
put
price
for
a
$1.04
put
spread
2.
~13%
of
current
natural
gas
production
covered
in
2011
and
2012
by
put
spread
with
a
$4.00
short
put
price
for
a
$1.75
put
spread |
 Marcellus
Overview Marcellus Overview
Butler County (Operated)
•
~54,000 gross (37,000 net) acres
•
Joint Venture with Sumitomo in Butler County
o
70% Rex / 30% Sumitomo
•
Butler Midstream Joint Venture
o
60% Stonehenge / 28% Rex / 12% Sumitomo
o
Operation of 40 Mmcf/d cryogenic plant
o
Pipeline infrastructure
Westmoreland, Centre, and Clearfield Counties
(Non Operated)
•
~47,000 gross (19,000 net) acres
•
Joint Venture among Williams, Rex, and Sumitomo
o
50% Williams / 40% Rex / 10% Sumitomo
o
JV includes interest in gathering and transportation
o
$6.4 million in Sumitomo drilling carries remaining
Other Operated Marcellus Acreage
•
~17,700 gross (3,100 net) acres in areas of Clearfield, Centre, Somerset and Fayette
counties 1. Assumptions
based
on
full
development
program.
Individual
well
results
may
vary
significantly.
Not
proved.
See
“Hydrocarbon
Volume
Estimates”
on
page
3.
2. Includes
approximately
129
Bcfe
of
Marcellus
Shale
proved
reserves
as
of
December
31,
2010
11 |
 Marcellus
Operated Overview Marcellus Operated Overview
Butler County, PA
•
2011 Operational Assumptions
o
Drilling the full year with one rig, and two additional rigs
beginning in mid April
o
Plan to drill 34 gross (22 net) wells
o
Fracture and complete at least 24 gross (15 net) wells
o
Construction of the second cryogenic plant (Bluestone),
proposed commissioning in first quarter 2012
o
Primary leasing strategy will fill in future drilling units, and
other contiguous acreage blocks within the core operational
area
•
2011 Operational Update
o
Drilled 10 gross (6 net) wells
o
Fractured and completed 6 gross (4 net) wells
o
Placed in service 10 gross (7 net) wells
o
5 day average rate on four of the five Drushel
wells at 3.7
Mmcfe/day
Average lateral length of 3,200 feet
Fifth well not yet fractured
o
Bluestone cryogenic plant capacity permit request increased
from 40.0 Mmcf/d
to 50.0 Mmcf/d
o
Third cryogenic plant permit filed
Marcellus Operated Area in PA
12
Columbia
Dominion
Natural Fuel
REX Leasehold |
 •
Core acreage position of 36,000 gross (22,00 net) acres
o
Allows for minimal rig movement
o
Decreases in drilling time
o
Maximizes unitized acreage
•
Close access to infrastructure and pipelines
•
Terrain composition very accessible
•
Low risk geological area
•
Additional production possibilities in the Utica and
Upper Devonian Shale
•
Maintaining a two rig drilling program allows for
minimal lease expirations
Why Rex Values its Presence in Butler County
Why Rex Values its Presence in Butler County
Prospective Butler Units
13
•
Approximately 385 drilling locations
•
Favorable commodity price differentials |
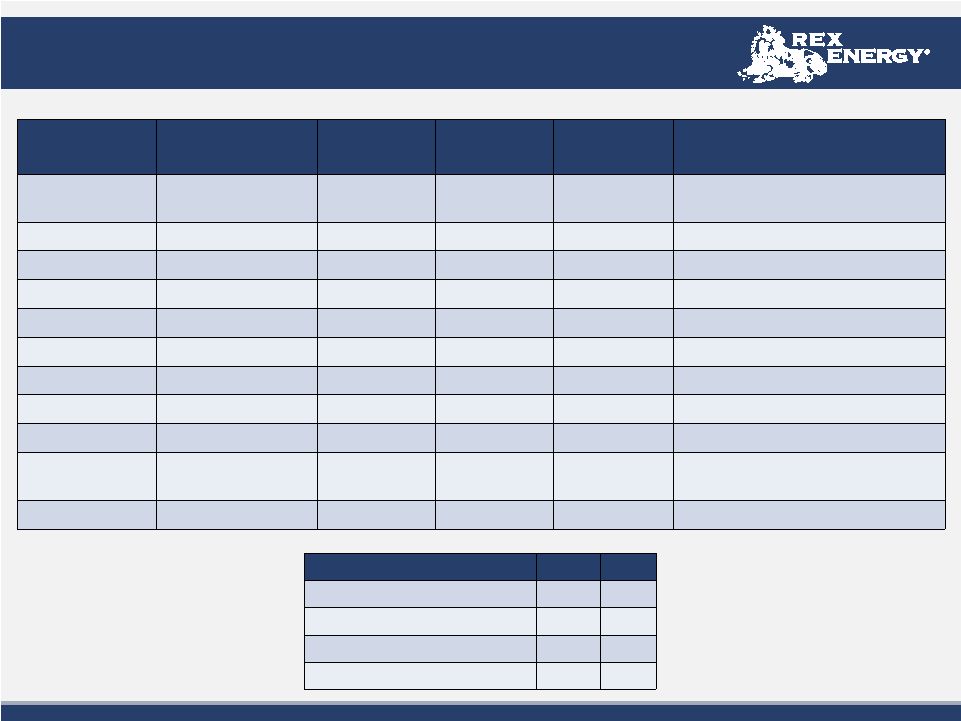
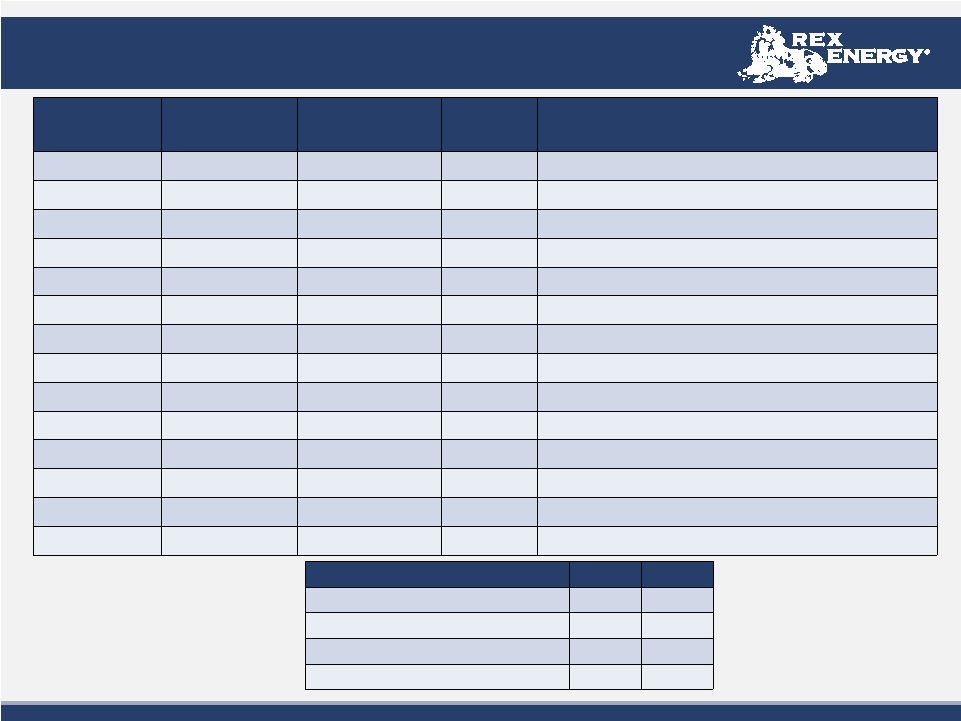 Butler
Operated Drilling & Completion Schedule Butler Operated Drilling &
Completion Schedule Rig
Pad
Pad
Gross Well
Gross Well
Count
Count
Net Well
Net Well
Count
Count
Status
Status
UDI 54
Drushel
(1)
5.0
3.5
4 of 5 wells frac’d with 5 day average rates of 3.7 Mmcfepd
UDI 54
Talarico
3.0
2.1
All wells drilled; frac initiated on 5/1
UDI 54
Grosick
(2)
7.0
3.0
Drilling
5
of
7
wells
UDI 54
Carson
3.0
2.1
Pad construction complete
UDI 54
Bricker
4.0
2.8
Permitting
Total UDI 54
22.0
13.5
UDI 52
McElhinney
2.0
1.4
Both wells drilled: Frac scheduled in June
UDI 52
Behm
3.0
2.1
Second of three wells drilling
UDI 52
Grahm
3.0
2.1
Pad construction complete
UDI 52
Meyer
2.0
1.4
Pad construction phase
Total UDI 52
10.0
7.0
Bronco 10
Gilliland
(3)
6.0
4.2
1
well drilling
Bronco 10
Cheeseman
(4)
1.0
0.7
Pad complete; conductor being set
Total Bronco 10
7.0
4.9
14
1. Four of the five Drushel wells were drilled in 2010
2. Rex has a 43.1% WI after Gastar and Sumitomo
3. Includes one Burkett test well
4. Utica test well
Gross
Net
YTD Wells Placed in Service
10.0
7.0
YTD Wells Awaiting Completion
11.0
4.4
YTD Wells Drilled
10.0
5.9
Wells Currently Drilling
3.0
1.7
th
st |
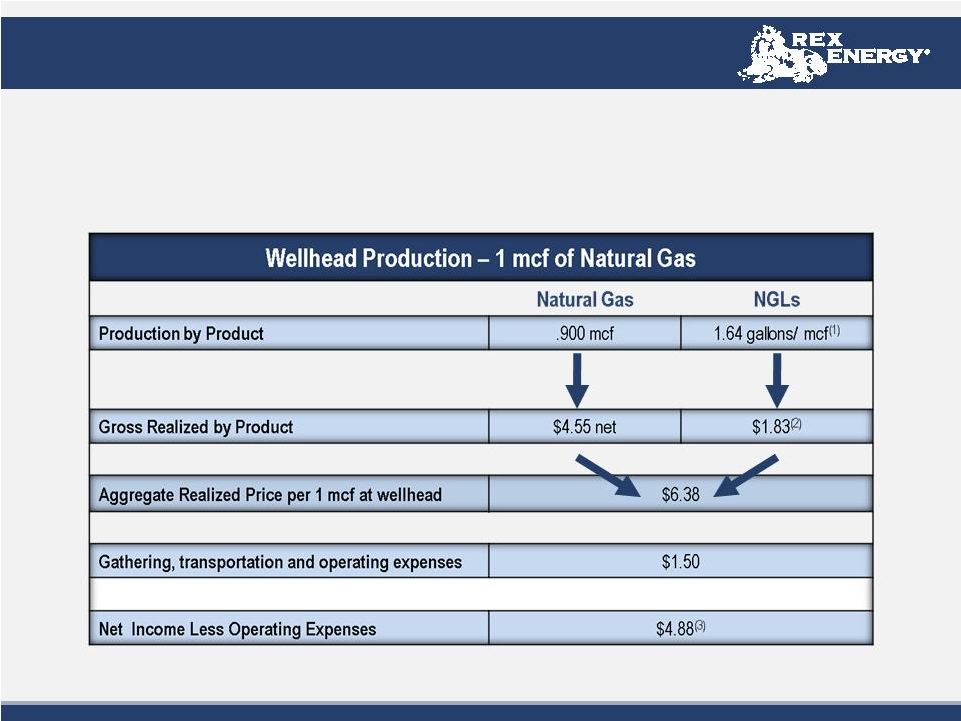 Wet Gas
Economic Yields Wet Gas Economic Yields
$5.00 NYMEX equates to $6.38 per mcf
price
•
$5.00 NYMEX Henry Hub
o
$0.05 added to NYMEX Henry Hub for premium
•
$90.00 NYMEX WTI
1.
.85 gallon/ mcf
is excluded since it is used as fuel for compressors at the cryogenic
plant 2.
Price assumption of 52% of $90.00 NYMEX WTI
3.
Does not include Rex’s 28% interest in cash flow from the cryogenic plant
partnership 15 |
 Marcellus
Non-Operated Overview Marcellus Non-Operated Overview
16
1. Includes non operated acreage only |
 County
Rig
Pad
Pad
Gross Well
Gross Well
Count
Count
Net Well
Net Well
Count
Count
Status
Status
Westmoreland
H&P 287
Uschak
#2
(1)
5.0
2.0
Two placed in service
Remaining three awaiting on completion
Westmoreland
H&P 287
Androstic
3.0
1.2
Drilled, awaiting completion
Westmoreland
H&P 287
National Metals
2.0
0.8
Drilled, awaiting completion
Westmoreland
H&P 287
Frye
2.0
0.8
Drilling the first well
Westmoreland
H&P 287
McBroom
3.0
1.2
Awaiting drilling rig
Total H&P 287
15.0
6.0
Westmoreland
Patterson 480
Uschak #1
4.0
1.6
Drilled, awaiting completion
Westmoreland
Patterson 480
Marco
3.0
1.2
Rig drilling second of three wells
Total Patterson 480
7.0
2.8
Clearfield
Patterson 332
Resource
Recovery #1
4.0
1.6
Rig Drilling first of four wells
Total Patterson 332
4.0
1.6
Westmoreland & Clearfield Non Operated
Westmoreland & Clearfield Non Operated
Drilling & Completion Schedule
Drilling & Completion Schedule
17
Gross
Net
YTD Wells Placed in Service
3.0
1.2
Wells Awaiting Completion
13.0
5.2
YTD Wells drilled
10.0
4.0
Wells Currently Drilling
3.0
1.2
1. Four of the five Uschak wells were drilled in 2010 |
 Conceptual Marcellus Economics
Butler County (Wet Gas) Assumptions
(1)
•
3.0 MMcfe/d IP Rate
•
4.4 Bcfe gross EUR
•
$4.7 million drilling and completion costs
•
15% royalties
•
Gas Price Basis Adjustment: $0.26/Mcf
•
NGL
&
condensate
volumes:
1.64
gallons
per
Mcf
(~39
Bbls
per MMcf)
•
NGL price assumptions: $0.94/gal (~52% of NYMEX oil price)
•
Gathering transportation & operating expenses: $1.50/Mcf
Westmoreland & Central PA (Dry Gas)
Assumptions
(1)
•
3.5 MMcf/d IP Rate
•
3.0 Bcf gross EUR
•
$4.7 million drilling and completion costs
•
15% royalties
•
Gas price basis adjustment: ($.09)/Mcf
•
Gathering transportation & operating expenses: $0.67/Mcf
Type Curves
Before Tax IRR
1.
Based on the 2010 reserve report & current NGL Pricing in Butler
18 |
 Marcellus
Well Cost Comparison Marcellus Well Cost Comparison
Reserve Well Economics
•Average Well Cost of $4.7
million •Average
Drilling and Completion cost -
$1.9 million
•Average Frac Cost -
$2.2 million
•Average Equipment cost
- $0.6
million 1. Results from the 2010 Drilling Program
19 |
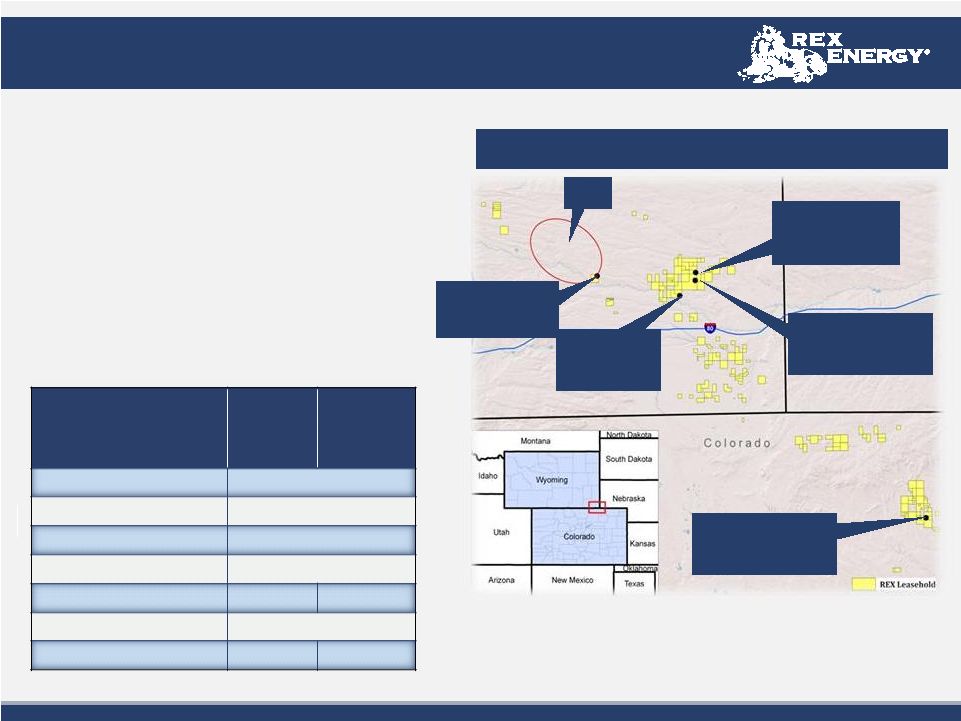 Niobrara
Overview Niobrara Overview
~56,000 gross (39,000 net) acres
•
3 horizontal wells drilled (infill and Matrix Porosity
results)
DJ Basin Niobrara Summary
•
Thick
“Source
Rock”
–
300+
ft.
•
High total organic content (TOC’s) of 2-10%
•
Strong matrix contribution from high porosity chalks
•
Production likely influenced by faults and fractures
•
Mature over large aerial extent
•
Expected
well
costs
of
$3.5
-
$4.2
MM
DJ Basin
Rex Energy
Silo State 41-22H
IP: 67 BOE/d
Rex Energy
BJB #1H
Appears Non-
Commercial
Rex Energy
Herrington Farms 1H
IP: 202 BOE/d
20
Silo
Field
Rex Energy
Shapley 14-45H
Drilling
Rex Energy
Steege 11-31H
Currently Drilling
Resource Potential
Low Case
“Matrix”
Porosity
High
Case
“Dual Matrix
Porosity”
Net Acres
~39k
Assumed % Drilled
75%
Well Spacing
320 acres
Net
Potential Wells
91
EUR (MBO)
(1)
125
300
Royalties
17%
Upside
Potential (MMBO)
9.4
22.7
1. Assumptions based on full development program. Individual well results may vary
significantly. Not proved. See “Hydrocarbon Volume Estimates” on page 3. |
 Conceptual Niobrara Economics
Niobrara Horizontal Well Assumptions
•
300 Bbls/d
IP
•
Gas sales start 18 months after oil sales
•
$4.2 million drilling and completion costs
•
18% royalties
•
Oil price basis adjustment: -$9.00/Bbls
•
Gathering transportation & operating expenses:
$13.05/Bbls
•
Severance & ad valorem taxes: 13%
21
Before Tax IRR
Silo Field Type Curve |
 Lawrence
Field ASP Overview Lawrence Field ASP Overview
~ASP Project Summary
•
ASP stands for Alkali-Surfactant-Polymer flood
•
Alkali-Surfactant mix reduces interfacial tension allowing remaining oil to flow
easier through the formation •
Polymer
improves
sweep
efficiency
by
forcing
fluid
into
parts
of
the
field
not
effectively
swept
by
the
waterflood
•
Based on NSAI geological analysis and high grading of the acreage, 27 separate ASP units
have been designed to date. •
Laboratory
analysis
on
the
effect
of
ASP
flooding
of
cores
from
the
field
recovered
23%
of
OOIP
(16%
PV
(1)
Recovery)
•
Single
well
pilot
test
of
ASP
flooding
in
the
field
recovered
27%
of
OOIP
(20%
PV
(1)
Recovery)
Illinois Basin
~13,100 gross (13,000 net) acres in Lawrence Field
•
1 billion barrels of original-oil-in-place (OOIP)
•
Field has produced 400 MMBbls since 1906
•
Waterflooded in the 1950’s
•
Two successful surfactant-polymer flood pilots completed by Marathon
with 15-20% of OOIP recovered
•
Field currently produces ~1,600 gross (1,250 net) barrels per day under
waterflood
1.
Pore
volume
recovery
assumptions
based
on
full
development
program.
Individual
ASP
unit
results
may
vary
significantly.
Not
proved.
See
“Hydrocarbon
Volume
Estimates”
on
page
3.
Middaugh Unit, ASP
Project
22
REX Acreage |
 ASP
Conceptual Economics ASP Conceptual Economics
•
Capital for the ASP plant has already been spent
•
90% of future capital will be chemical costs
•
North & Central areas of the field have been analyzed to date (~75% of the
field) o
Identified
18
target
continuous
sand
bodies
and
broke
these
down
into
27
separate
flood
units
(15
Bridgeport/
12 Cypress)
o
Base
case
probable
reserves
in
identified
floodable
sands:
39.4
MMBbls
(1)
in
the
Northern
&
Central
areas
of
the field at a 13% PV Recovery
Typical ASP Flood IRR vs Oil Price at Various PV Recoveries
1. Estimated
by
Netherland,
Sewell
&
Associates,
Inc.
Does
not
represent
proved
reserves.
See
“Hydrocarbon
Volume
Estimates”
on
page
3.
23
Total ASP Potential Reserves at Various PV Recoveries |
 Project
Update •
Preliminary oil response seen:
o
Production increased from
16-62 gross BOPD
o
Oil cuts increased from
1.0% to 5.0% in total unit
o
Individual well oil cuts
increased from 1.5% to 15%
in first responding producer
o
Three additional producers
in early stages of response
o
Continue to monitor response
of pilot to determine future
ASP recovery models
•
Initiate expansion into 58 acre
Perkins-Smith area for $3MM in 2011:
o
ASP Plant complete:
no additional capx required
o
Drill 9 replacement wells
o
Complete flow line tie-ins
o
Initiate brine injection in 3Q
o
Initiate ASP injection in late 4Q
Lawrence
Lawrence
Field
Field
ASP
ASP
Update
Update
(1)
(1)
Perkins-Smith Project Area
58 Acres
Griggs Project Area
72 Acres
Middagh Pilot
15 Acres
24
1. Update as of May 3, 2011 |
 •
Operationally
o
Estimated
annual
production
growth
of
71%
-
95%
in
2011
o
79% of 2011 capital budget allocated to oil and liquids rich operating areas
o
Strong growth with a historical reserve CAGR of 75%
o
Preliminary Niobrara results
o
Additional potential in the Utica and Upper Devonian shale
o
4 full time rig program in 2011
o
Large inventory of drilling locations
•
Financially
o
Conservative balance sheet
o
Total line of credit availability of $130 million
o
Diversified portfolio with both oil and gas
o
Strong hedging position
Why Invest in Rex Energy?
Why Invest in Rex Energy?
25 |