Attached files
| file | filename |
|---|---|
| 8-K - FORM 8-K - STERLING FINANCIAL CORP /WA/ | d8k.htm |
 D.A. Davidson & Co.
Financial Services Conference
Seattle, WA
May 11, 2011
Ticker: STSA
Spokane, Washington
www.sterlingfinancialcorporation-spokane.com
Exhibit 99.1 |
 Safe Harbor
(1) The Reform Act defines the term "forward-looking statements"
to include: statements of management plans and objectives, statements regarding the future economic performance, and projections of revenues and
other financial data, among others. The Reform Act precludes liability for
oral or written forward-looking statements if the statement is identified as such and accompanied by "meaningful cautionary statements
identifying important factors that could cause actual results to
differ materially from those made in the forward-looking
statements." In the course of our presentation, we may discuss
matters that are deemed to be forward-looking
statements,
which
are
intended
to
be
covered
by
the
safe
harbor
for
“forward-looking
statements”
provided
by
the
Private
Securities
Litigation
Reform
Act
of
1995
(the
“Reform
Act”)
(1)
.
Forward-looking
statements
involve
substantial
risks
and
uncertainties,
many
of
which
are
difficult
to
predict
and
are
generally beyond our control. Actual results may differ materially and
adversely from projected results. We assume no obligation to update
any forward-looking statements
(including
any
projections)
to
reflect
any
changes
or
events
occurring
after the date hereof. Additional information about risks of achieving
results suggested by any forward-looking statements may be found
in Sterling’s 10-K, 10-Q
and
other
SEC
filings,
including
under
the
headings
“Risk
Factors”
and
“Management’s Discussion and Analysis of Financial Condition and
Results of Operations.”
This presentation contains certain non-GAAP financial measures.
Reconciliations to the comparable GAAP measures are set forth on page
17. 2 |
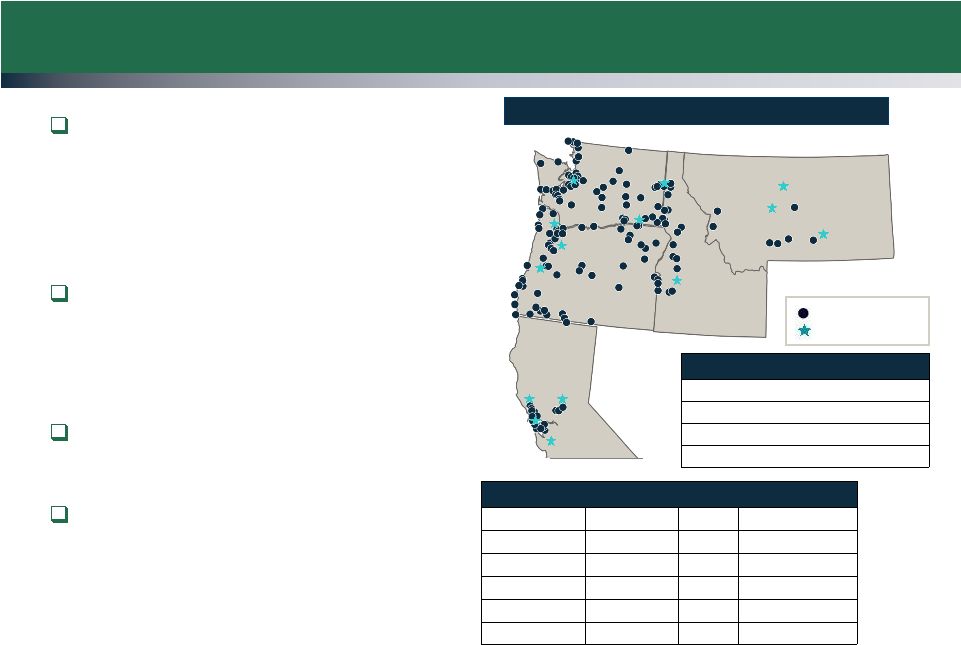 Based in Spokane, Wash.,
Sterling is one of the largest
commercial banks
headquartered in the Pacific
Northwest
(1)
More than 25,000
commercial accounts and
nearly 200,000 retail deposit
accounts
$6.7 billion of deposits with
an average cost of 1.01%
(3)
$730 million recapitalization
completed in August 2010
178 branches in 5 states
Source: SNL Financial, Company filings
Note: Financial data as of March 31, 2011.
(1)
Pacific Northwest defined as Idaho, Oregon and Washington.
(2)
Deposit market share data as of 6/30/2010.
(3)
For the quarter ended March 31, 2011
MONTANA
IDAHO
OREGON
WASHINGTON
San Jose
San
Francisco
Sacramento
Santa
Rosa
Eugene
Salem
Portland
Seattle
Spokane
Great Falls
Helena
Billings
Boise
Major cities
Sterling branches
Key Statistics as of 3/31/2011
(billions)
Total assets:
$9.4
Total deposits
$6.7
Net Loans
$5.3
Deposit
Market
Share
(2)
State
Branches
Rank
Market Share
Washington
72
7
3.20%
Oregon
67
7
3.58%
California
13
46
0.14%
Idaho
18
11
2.57%
Montana
8
14
1.21%
Franchise at a Glance
3 |
 Improving quarterly results
Reported Q1 net income of $5.4 million
Compares to loss of $88.8 million for Q1 2010
Net interest margin (FTE) of 3.22%, up 37 bps from
Q1 2010
Average cost of deposits declined by 44 bps from Q1 2010
Reduced credit provisioning
Provision for Q1 credit losses totaled $10.0 million
Compares to $88.6 million provision for Q1 2010
Declining levels of non-performing assets (NPAs)
NPAs of $628.8 million, reflecting a 41% decline compared to
$1.06 billion of NPAs at March 31, 2010
Focus on liquidating OREO, note sales, short sales and other
workouts
Q1 2011 Performance Highlights
4 |
 Formula for
Success Cost-
effective
Funding
Improved
Asset
Quality
High
Quality,
Relationship
Based Asset
Generation
Expense
Control
Profitable
Growth
Focus on customers
Delivering value proposition to customers
•
Fair pricing
•
Competitive products and services
Resolving credit challenges
Increased emphasis on sales and business development
Intelligent market segmentation
Expense control and organizational efficiency
Simplified, “Back to Basics”
banking drives growth
Strategic expansion in key markets and lines of business
Managing through emerging regulatory changes
5 |
 Deposit
Composition Source: SNL Financial and company filings.
(1)
Peers include: BANR, CATY, CYN, CVBF, GBCI, PACW, SIVB, UMPQ, and WABC.
Figures based on median of peers. Overall improvement in deposit
mix leading to lower cost of
deposits
Decreased brokered deposits by
$748 million since year end
2009, to $332 million
Deposit composition
Deposit balances
Reducing avg. cost of deposits (%)
(1)
(in millions)
3/31/2010
3/31/2011
Annual
% change
Retail deposits
$6,038
$5,701
-6%
Brokered deposits
723
332
-54%
Public funds
865
392
-55%
Total deposits
$7,626
$6,425
-16%
Basis Point
Change
Depost funding costs
1.45%
1.01%
-44
Net loans to deposits
88%
79%
6
Non-interest
$1,007 / 15%
Time deposits-retail
$2,912 / 43%
Time deposits-
brokered
$332 / 5%
Savings and money
market demand
$1,973 / 29%
Interest-bearing
transaction
$500 / 8%
Balance of $6,724 million as of Mar. 31, 2011
(in millions)
bearing transaction
3.66%
3.75%
3.75%
3.68%
3.26%
2.88%
2.82%
2.72%
2.31%
2.08%
1.98%
1.77%
1.45%
1.36%
1.27%
1.13%
1.01%
2.02%
2.12%
2.10%
2.18%
1.50%
1.10%
1.13%
1.33%
1.10%
0.90%
0.85%
0.73%
0.67%
0.66%
0.56%
0.50%
0.51%
0.00%
0.50%
1.00%
1.50%
2.00%
2.50%
3.00%
3.50%
4.00%
4.50%
5.00%
Q1
07
Q2
07
Q3
07
Q4
07
Q1
08
Q2
08
Q3
08
Q4
08
Q1
09
Q2
09
Q3
09
Q4
09
Q1
10
Q2
10
Q3
10
Q4
10
Q1
11
1Q 2010 Y-o-Y Improvement (42 bps)
STSA
Peer |
 Improving Trends
Summary (Q1 2011 vs. Q1 2010) Increased margins and improved expense
management
Net interest margin
37 bps
Non-interest expense
8%
Improved asset quality and reduced credit
provisioning
Classified assets
50%
Non-performing assets
41%
Provision for loan losses
89%
7 |
 Improving Trend
in Classified and Non-Performing Assets $1,648
8
$-
$200
$400
$600
$800
$1,000
$1,200
$1,400
$1,600
$1,800
Q1 08
Q2 08
Q3 08
Q4 08
Q1 09
Q2 09
Q3 09
Q4 09
Q1 10
Q2 10
Q3 10
Q4 10
Q1 11
Classified Assets
Non
-perfoming
Assets
Non
-performing Loans
$812 |
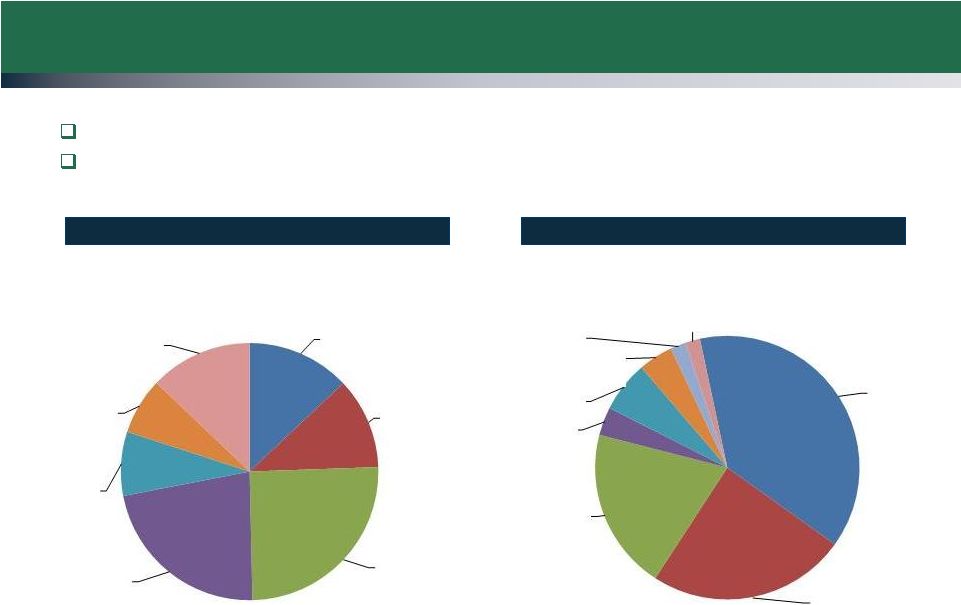 Loan Portfolio
Summary Reducing Construction Loan Exposure and Focusing on Relationship-Based
Lending Gross loans decreased by $1.5 billion since Q1 2010
Q1 2011 loan inflows (originations and purchases) increased by $197
million, or 36% over the same period a year ago
Source: Company filings.
(1)
Net of $244.7 million in FAS 114 writedowns.
Loan mix by geography
Loan mix by category
9
Washington
$2,123 / 38%
Oregon
$1,349 / 24%
N. California
$1,103 / 20%
S. California
$192 / 4%
Idaho
$348 / 6%
Arizona
$235 / 4%
Montana
$105 / 2%
Other $102 / 2%
Outstanding
balance
of
$5.6
billion
as
of
Mar.
31,
2011
(1)
(in millions)
Residential RE
$720 / 13%
Multi-family RE
$638 / 12%
CRE, NOO
$1,401 / 25%
CRE, OO
$1,240 / 22%
C&I
$447 / 8%
Construction
$396 / 7%
Consumer
$715 / 13%
Oustanding
balance of $5.6 billion as of Mar. 31, 2011
(1)
(in millions) |
 $-
$500.0
$1,000.0
$1,500.0
$2,000.0
$2,500.0
1Q09
2Q09
3Q09
4Q09
1Q10
2Q10
3Q10
4Q10
1Q11
(in millions)
Res
Multifam
Comm'l
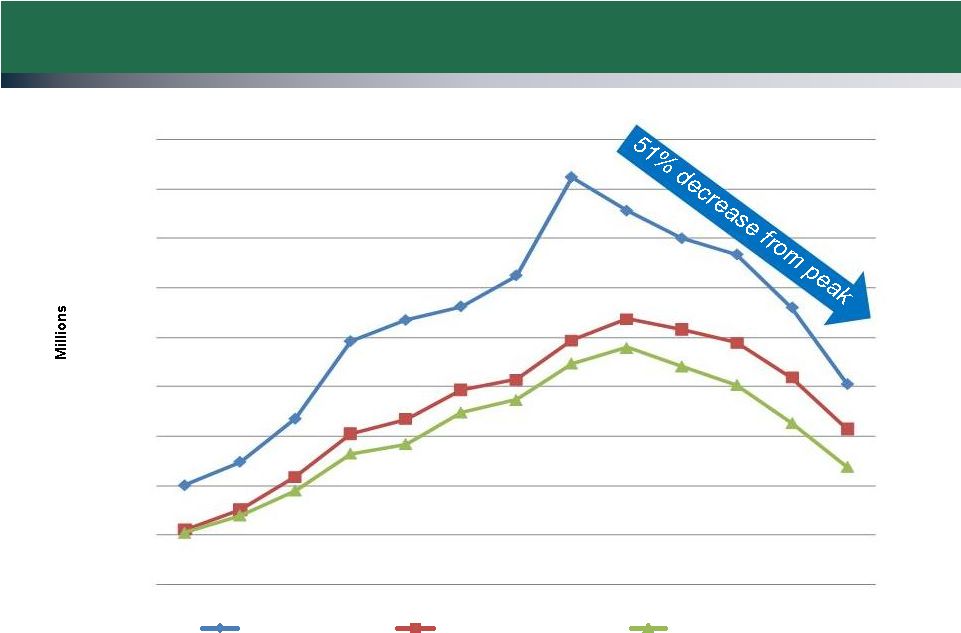
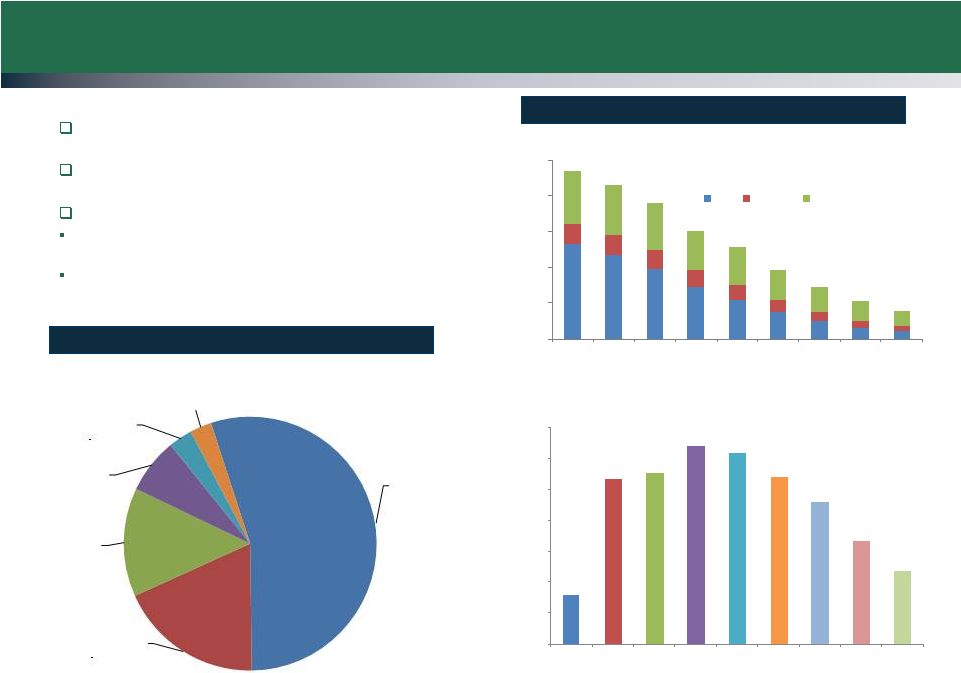
Construction Loan Exposure Decreasing
At 3/31/2011, 7% of total loans vs. 32% at
12/31/2007 (peak)
Construction non-performing loans of $238
million (50% of total NPLs) as of 3/31/2011
Aggressively shrinking construction portfolio
Construction balances have decreased $2.5
billion, or 87% since 2007
Residential construction concentration reduced to
2% at Q1 2011 from 8% at Q1 2010
Total construction loans
Construction loan balances
$158.3
$533.7
$551.9
$639.6
$618.5
$540.4
$458.6
$335.7
$238.0
$-
$100.0
$200.0
$300.0
$400.0
$500.0
$600.0
$700.0
1Q09
2Q09
3Q09
4Q09
1Q10
2Q10
3Q10
4Q10
1Q11
Non-performing construction loans
(in millions)
10
Commercial
$217 / 55%
Multi
-family
$73 / 18%
Residential -
vertical
$55 / 14%
Lots
$28 / 7%
Raw land
$12 / 3%
A&D
$11 / 3%
Outstanding balance of $396 million as of Mar. 31, 2011
(in millions) |
 Non-performing Loan (NPL) Flow Analysis
11
(in millions)
3/31/2010
6/30/2010
9/30/2010
12/31/2010
3/31/2011
NPLs
beginning-of-period
$895.9
$958.8
$884.2
$809.0
$654.6
Return to accruing status
(28.7)
(45.2)
(16.6)
(11.1)
(77.3)
Payments/sales
(48.2)
(108.0)
(78.8)
(115.8)
(54.9)
NPLs
end of period
$958.8
$884.2
$809.0
$654.6
$477.1
% decline since Q1 2010:
50%
For the quarter ended
Additions/increases
327.3
263.5
171.6
62.5
47.0
Charge-offs
(136.5)
(101.8)
(77.1)
(31.4)
(24.1)
Transfer to OREO
(51.0)
(83.1)
(74.3)
(58.6)
(68.2) |
 Summary
Capitalization
Exceeds
regulatory
levels
required
for
“well-capitalized”
status
Additional capital in place to support opportunistic growth
Strengthened corporate governance and management
Additions of experienced, talented board members
New CCO/CFO to further develop our strong regional franchise
Executing on our strategic plan
Valuable, core-deposit franchise drives earnings power
Continued improvement in asset quality metrics
High-quality, relationship-driven asset generation
Ongoing expense management
Emphasizing increased earnings power
Focused on increasing pre-tax, pre-provision earnings
Expected upon realization of Deferred Tax Asset of $359 million
12 |
 D.A. Davidson & Co.
Financial Services Conference
Seattle, WA
May 11, 2011
Ticker: STSA
Spokane, Washington
www.sterlingfinancialcorporation-spokane.com
Investor
Contacts
Patrick Rusnak
David Brukardt
Chief Financial Officer
EVP/Investor and Corporate Relations
(509) 227-0961
(509) 863-5423
patrick.rusnak@sterlingsavings.com
david.brukardt@sterlingsavings.com
Daniel Byrne
Media
Contact
EVP/Corporate Development Director
Cara Coon
(509) 458-3711
VP/Communications and Public Affairs Director
dan.byrne@sterlingsavings.com
(509) 626-5348
cara.coon@sterlingsavings.com
13 |
 Appendix
14 |
 Capital Compared
to Peers Source: SNL Financial and company filings. Sterling financial
data as of March 31, 2011. Peer group data as of most recent quarter available.
(1) Peers include all U.S. bank holding companies with between $7 billion and
$25 billion in assets. 15
3/31/2011
Peer median
(1)
TCE/TA
8.1%
7.3%
Tier 1 leverage:
10.6%
8.7%
Tier 1 risk-based capital
16.5%
13.5%
Total risk-based capital
17.8%
14.9%
NPA/Tier 1 Capital + ALLL
50.6%
17.9% |
 Last Five
Quarters Financial / Operating Highlights 16
(1)
Net of cumulative confirmed losses on loans and OREO of $423.8 million for
March 31, 2011, $516.3 million for Dec. 31, 2010, $588.4 million for Sept. 30, 2010, $592.8 million for June, 30, 2010,
and $626.3 million for March 31, 2010.
(2)
Core deposits defined as total deposits less brokered CDs.
(3)
Adjusted for provision for credit losses, interest reversal on
non-performing loans, OREO-related expenses and charges on prepayment of debt.
(4)
Adjusted FTE NIM includes interest reversal on non-performing
loans. (in millions)
3/31/2010
6/30/2010
9/30/2010
12/31/2010
3/31/2011
Asset Quality
NPAs
(1)
$1,063
$1,033
$979
$816
$629
Classified assets
$1,616
$1,401
$1,136
$1,100
$812
NPAs
/ assets
10.1%
10.6%
9.8%
8.6%
6.7%
ALLLs
/ NPLs
30.7
30.0
30.7
37.7
48.8
ALLL / loans
4.2
4.1
4.2
4.4
4.2
Net charge-offs (NCOs)
$137
$102
$77
$31
$24
NCOs / avg. loans
6.9%
5.5%
4.5%
2.0%
1.6%
Balance Sheet
Total assets
$10,555
$9,738
$10,030
$9,493
$9,352
Net loans
$6,745
$6,141
$5,666
$5,379
$5,321
Total construction loans
$1,283
$959
$720
$526
$396
Securities
$1,986
$1,956
$2,723
$2,838
$2,821
Core deposits
(2)
$6,902
$6,780
$6,592
$6,662
$6,393
Net loans/total deposits
88%
85%
82%
78%
79%
Capital
$245
$193
$845
$771
$774
TCE/TA
nm
nm
8.3%
8.0%
8.1%
Tier 1 leverage
2.6%
2.0%
10.5%
10.1%
10.6%
Operating Highlights
Operating income (loss) before taxes
($84.3)
($53.8)
($48.0)
($38.1)
$5.4
Provision for credit losses
$88.6
$70.8
$60.9
$30.0
$10.0
Adj. pre-tax, pre-provision income
(3)
$38.3
$54.9
$40.6
$42.7
$39.1
FTE net interest margin
2.85%
2.88%
2.77%
2.80%
3.22%
Adj. FTE net interest margin
(4)
3.72%
3.68%
3.47%
3.43%
3.75%
For the quarter ended |
 Adjusted
Pre-Tax, Pre-Provision Income (1)
Management believes that this presentation of non-GAAP results provides
useful information to investors regarding the effects of the credit cycle on the Company’s reported results of operations.
(in thousands, unaudited)
3/31/2010
6/30/2010
9/30/2010
12/31/2010
3/31/2011
Income (loss) before income taxes
($84,346)
($53,773)
($48,022)
($38,141)
$5,417
Provision for credit losses
88,556
70,781
60,892
30,000
10,000
OREO
10,923
17,206
10,456
23,993
11,400
Interest reversal on non-performing loans
23,158
20,711
17,302
15,527
12,271
Charge on prepayment of debt
0
0
0
11,296
0
Total
(1)
$38,291
$54,925
$40,628
$42,675
$39,088
For the quarter ended
17 |
 High Quality,
Low Risk Investment Portfolio Strategy remains to reduce exposure to
30-yr MBS and replace with 10-
and 15-year MBS
with good cash flows to fund loan growth
76% FNMA, FHLMC and GNMA pass-throughs
Rise in average life and duration in Q4
attributable to higher market interest rates
and reduction in balances of short-term CMOs
Source: Company filings.
(1)
Durations and average life measures are base case, under current
market rates.
(2)
Yield at quarter end.
Investment Portfolio
Weighted Avg. Life and Effective Duration
3.30%
overall
portfolio
yield
(2)
MBS Composition
18
MBS
$2,123 / 75%
Muni bonds
$201 / 7%
Corp
$23 / 1%
Tax credit
$13 / 1%
Non-agency
$36 / 1%
Ginnie Mae
$214 / 8%
Freddie Mac
$56 / 2%
Fannie Mae
$153 / 5%
Other $2 / 0%
$2.8 billion total portfolio
(in millions)
4.1
3.5
5.0
5.1
3.4
2.6
3.6
4.0
0
1
2
3
4
5
6
6/30/2010
9/30/2010
12/31/2010
3/31/2011
WA Life-Base case
Eff Dur -
Base case
$0.0
$0.5
$1.0
$1.5
$2.0
$2.5
$3.0
6/30/2010
9/30/2010
12/31/2010
3/31/2011
30-yr MBS
20-yr MBS
10-
& 15-yr MBS
CMO
Yield
(2)
4.18%
3.58% 3.12%
3.21%
$1.49B
$2.28B
$2.60B
$2.59B |
 Loan Portfolio
– CRE Non-Owner-Occupied
Includes Multi-family
Non-owner-occupied commercial real estate, including
multi-family portfolio totals $2.0 billion as of 3/31/2011
Increased by $162 million, or 9% since Q1 2010
Concentration
is
37%
of
gross
loans
as
of
3/31/2011,
up
from
27%
at
3/31/2010
4% of non-owner occupied CRE loans were non-performing as of
3/31/2011 Source: Company filings.
CRE NOO loan mix by geography
CRE NOO loan mix by property type
19
Washington
$667 / 33%
N. California
$612 / 30%
Oregon
$363 / 18%
Arizona
$125 / 6%
S. California
$96 / 5%
Idaho
$92 / 4%
Montana
$28 / 1%
Other, $56 / 3%
Outstanding balance of $2,039 million at Mar. 31, 2011
(in millions)
$638
$385
$252
$239
$235
$167
$123
$0
$100
$200
$300
$400
$500
$600
$700
(in millions)
Outstanding balance of $2,039 million at Mar. 31, 2011
|
 Loan Portfolio
– CRE Owner-Occupied
Includes SBA
Owner-occupied commercial real estate totaled $1.24 billion as of
3/31/2011 Concentration was 22% of gross loans at 3/31/2011
5% of owner-occupied CRE loans were non-performing at
3/31/2011 SBA loans are $111 million, or 7% of total
owner-occupied CRE loans at 3/31/2011 Source: Company
filings. CRE OO loan mix by geography
CRE OO loan mix by property type
20
Washington
$419 / 34%
N. California
$331 / 26%
Oregon
$282 / 23%
Arizona
$87 / 7%
Idaho
$71 / 6%
S. California
$25 / 2%
Montana
$14 / 1%
Other $11 / 1%
Outstanding balance of $1,240 million at Mar. 31, 2011
(in millions)
$339
$245
$233
$82
$73
$72
$52
$48
$44
$34
$18
$0
$50
$100
$150
$200
$250
$300
$350
$400
Outstanding balance of $1,240 million at Mar. 31, 2011
(in millions) |
 Loan
Re-pricing Characteristics Source: Company filings.
(1)
Index rate increase needed for loan rate to adjust.
(2)
Does not include $32 million of performing restructured loans.
Approximately 60% of the loan portfolio has variable/adjustable rates
(in millions)
<1 Year
1 - 3 Years
>3 Years
Total
% of Total
Variable Rate Loans - No Floors
$1,341
$721
$524
$2,586
46.5%
Variable Rate Loans with Floors
(1)
0 bps
110
3
10
123
1-50 bps
44
13
15
72
50-100 bps
103
15
10
128
100-200 bps
109
50
21
180
>200 bps
150
54
10
214
Subtotal
516
135
66
717
12.9%
Variable Rate Loans
1,857
856
590
3,303
59.4%
Fixed Rate Loans
1,809
32.6%
Non-performing Loans
(2)
445
8.0%
Total Loans
$5,557
Re-pricing Schedule
21 |
 D.A. Davidson & Co.
Financial Services Conference
Seattle, WA
May 11, 2011
Ticker: STSA
Spokane, Washington
www.sterlingfinancialcorporation-spokane.com
Investor
Contacts
Patrick Rusnak
David Brukardt
Chief Financial Officer
EVP/Investor and Corporate Relations
(509) 227-0961
(509) 863-5423
patrick.rusnak@sterlingsavings.com
david.brukardt@sterlingsavings.com
Daniel Byrne
Media
Contact
EVP/Corporate Development Director
Cara Coon
(509) 458-3711
VP/Communications and Public Affairs Director
dan.byrne@sterlingsavings.com
(509) 626-5348
cara.coon@sterlingsavings.com |