Attached files
| file | filename |
|---|---|
| 8-K - FORM 8-K - PTC INC. | form8k.htm |
| EX-99.1 - PRESS RELEASE - PTC INC. | pressrel.htm |
Q2 FISCAL 2011 PREPARED REMARKS
THE LONG-TERM VIEW: Technology leadership + winning in the market = 20% EPS CAGR
Our long-term financial goal is simple: We intend to deliver 20% non-GAAP EPS growth annually through FY’14. Our goal is to deliver this result through what we call our “Winning in the Market” strategy, which means primarily through accelerating organic revenue growth coupled with modest margin improvement. The table below illustrates these goals. Based on the strength of our FY’10 and our FY’11 outlook, we remain confident about our ability to achieve our FY’14 revenue growth and non-GAAP EPS growth targets. For H1’11, our actual Fx rate was $1.36 USD/EURO. Our guidance for Q3 and the remainder of FY’11 assumes $1.45 USD/EURO. Our actual FY’10 Fx rate was essentially $1.37 USD/EURO.

We believe we are the technology leader in attractive growth markets. We characterize the markets we participate in with the 4-box graphic below. Industry analysts estimate that from 2005 through 2010 the PLM market (right half of the 4-box below) has grown in the high single digits, faster than the low single digit growth of the CAD market (left half of the 4-box below). They expect this trend to continue through 2014, with the CAGR of both markets expanding over this time. We have seen our technology leadership position in the growth markets to translate into growth rates in excess of the market growth rates, especially in our PLM business, where we have had significantly higher than market growth rates. We expect our overall revenue growth rates to accelerate over the next few years as our revenue mix continues to shift from ‘Desktop’ to ‘Enterprise.’

We provide data points such as “Domino Account Wins” in the pages that follow to enable investors to further evaluate our claims that we are the technology leader, that we are gaining market share, and that ultimately we are “Winning in the Market.”
Non-GAAP Supplemental Information
We provide non-GAAP supplemental information to our GAAP information. PTC's reasons for providing this information are described at the end of this document. GAAP information corresponding to the non-GAAP information provided is contained in “Q2 FY’11 Expenses Commentary and FY’11 & Q3 Outlook” below and in the attached tables, along with a reconciliation between the GAAP and non-GAAP information.
Q2 RESULTS VS. GUIDANCE: Revenue and EPS at the high end of our guidance
Total revenue for Q2 of $269 million was at the high end of our Q2 revenue guidance range of $260 million to $270 million. Our Q2 non-GAAP EPS of $0.26 was at the high end of our guidance range of $0.22 to $0.26. Q2 non-GAAP results were not meaningfully impacted by foreign currency relative to the rates we used when we established our Q2 guidance ($1.37 USD/EURO). Q2 GAAP EPS was $0.16, which was above our guidance range of $0.11 to $0.15.
We delivered $74 million of license revenue in Q2 (up 15% year over year), which was below our expected range of $78 to $82 million. This is primarily due to lower than expected Federal, Aerospace & Defense revenue in North America. Our commercial license growth (excluding Federal & Defense) was up 27% year over year. We delivered stronger than anticipated maintenance revenue of $132 million (up 7%, compared to our guidance range of low to mid single-digit growth) and stronger than anticipated services revenue of $63 million (up 19%, compared to our guidance of up approximately 10%). The performance of these lines of business was driven primarily by strong execution and was also impacted by annuity focused business policy modifications.
Q2 FY’11: Overall strong performance
We delivered 12% year-over-year revenue growth, with license revenue up 15% (11% and 13% on a constant currency basis, respectively). We delivered non-GAAP EPS of $0.26, up from $0.20 in Q2 ’10. (GAAP EPS was $0.16 compared to $0.08 in Q2’10).
As is highlighted in the 4-box and domino account tables below:
|
1)
|
We are seeing a significant uptick in our CAD business (left half of the 4-box), with license revenue up 40% year over year, and are sensing a good market response to our Creo strategy.
|
|
2)
|
The large enterprise CAD market (upper left box) delivered significant year-over-year growth, with total revenue up 21% and license revenue up 57%.
|
|
3)
|
We are also seeing continued strength in our SMB business (bottom half of the 4-box), with year-over-year license revenue up 17%. This is our 5th consecutive quarter of year-over-year license and total revenue growth in the Channel.
|
|
4)
|
Total PLM revenue of $114.4 million (right half of the 4-box), while down 5% sequentially, was up 8% year over year.
|
|
5)
|
Large enterprise PLM market (upper right box) license revenue was down 19% year over year. We generated lower than expected Federal, Aerospace & Defense revenue in North America; additionally the strong Desktop revenue had a dilutive effect on PLM sales capacity; however this market continues to exhibit strength with 15% maintenance and 17% services revenue growth.
|
|
6)
|
We announced 3 new domino accounts in Q2 (current total of 25), one in the Industrial vertical, one in the Retail & Consumer vertical, and one in the Electronics & High-Tech vertical.
|
|
7)
|
We maintained our target of 30 domino account wins by the end of FY ’11 (an additional 5).
|
|
8)
|
We had 24 large deals (>$1M in license and services revenue), up from 18 in Q2 ’10, reflecting broader strength than a year ago.
|
Revenue by 4-Box
The horizontal axis highlights Desktop vs. Enterprise solutions
|
·
|
Desktop solutions include Creo Elements/Pro TM, Mathcad® and a portion of Creo Elements/Direct TM and Arbortext® revenue
|
|
·
|
Enterprise solutions include Windchill,Creo Elements/View, and a portion of Arbortext revenue
|
The vertical axis highlights Direct vs. Indirect go-to market strategies
|
·
|
Direct sales focuses primarily on the large enterprise market
|
|
·
|
Indirect sales (primarily our VAR reseller channel) focuses primarily on the SMB market
|

DOMINO ACCOUNT UPDATE: 25 down, 5 to go in FY’11 for a cumulative total of 30
At our June ‘09 investor event, we outlined what we call our “domino account strategy.” Domino wins are defined as competitive wins for PTC product development solutions at some of the world’s largest discrete manufacturing companies. Typically, these wins reflect companies whose incumbent PLM solutions are not PTC products. These wins are important because we believe they signal the technological superiority of our products. We believe the logical conclusion of winning in a significant number of ‘domino’ accounts is that PTC has become the unambiguous market leader. As we demonstrate the real value of our technology in the initial installation phase, we expect these accounts will be significant annuity customers for years to come.
We announced an additional 3 domino accounts in Q2. Of these, one is in the Industrial vertical, one is in the Electronics & High Tech vertical and one is in the Retail & Consumer vertical.
The table below outlines domino account announcements by major vertical since FY’08.

We believe our long-term PLM license revenue results and Domino account momentum continue to demonstrate what we believe is a fundamental shift in the competitive dynamic of our industry: Our Windchill PLM platform is separating itself from the pack and we are in an increasingly clear technology leadership position. In addition to domino account wins, we are also actively engaged in a significant number of important Windchill-led competitive displacement opportunities with other large companies around the world.
As we have stated previously, we intend to transition our Domino Account reporting into Annuity Account reporting in FY’12.
Q3 AND FY’11 OUTLOOK: Solid Q3 outlook. Increasing low-end of FY’11 revenue targets reflects revenue mix shift and favorable Fx; non-GAAP EPS target remains $1.20-$1.25.
In providing guidance for Q3 and setting targets for FY’11, we are weighing company specific factors such as our pipeline of opportunities and our maintenance and services base as well as external considerations, including the macroeconomic environment, currency, and visibility into customer spending patterns. We are using the following currency assumptions in our guidance: USD / EURO rate of $1.45 and YEN / USD of 82.
For Q3, we are initiating revenue guidance of $275 to $285 million with non-GAAP EPS of $0.28 to $0.32. (On a GAAP basis, we expect EPS of $0.16 to $0.20). Our Q3 guidance includes target license revenue of approximately $77 to $84 million, which is approximately 15% to 25% growth on a year-over-year basis, with our combined maintenance and services revenue expected to be up in the low teens on a year-over-year basis, resulting in approximately 13% to 17% year-over-year growth in total revenue.
Looking to the full year FY’11, we are adjusting our revenue target to $1,120 to $1,130 million, which represents 11% to 12% year-over-year growth. We are maintaining our non-GAAP EPS target of $1.20 to $1.25, but will
continue to balance our commitment of 20% non-GAAP EPS growth with investments to support future growth, especially given the dilutive effect of the strong Desktop revenue on PLM sales capacity. For FY’11 the GAAP EPS target is $0.73 to $0.78.
The current 11% to 12% FY’11 revenue target reflects the following adjustments: License revenue growth of 15% to 20%; low to mid teens services revenue growth; high single digit maintenance revenue growth; Fx assumption of $1.45 USD/Euro. We believe these adjustments result in lower risk relative to both the FY’11 revenue and EPS targets, given the implied smaller increase in Q4 license revenue, as well as the increasingly favorable mix of more predictable services and maintenance revenue.
Our product portfolio is being received very well in the market. We continue to sense a lot of excitement in the market around Creo, our new CAD platform, which we intend to launch in the summer of 2011. We believe Creo will be a significant enhancement over the functionality and usability of existing CAD products on the market. Creo will leverage a core set of technology assets unique to PTC and is intended to address 4 critical issues still impacting the CAD industry: usability, interoperability, assembly management and technology lock-in.
Customers continue to expand their view of PLM from an engineering-centric CAD data management solution into a robust enterprise solution with thousands of users across the extended enterprise. We launched Windchill® 10.0 in April, and have a significant new release of Arbortext® scheduled for the fall of 2011. We also launched Mathcad® Prime 1.0 early in Q2.
We also recently announced that we have entered into a definitive agreement to acquire MKS, a global application lifecycle management (ALM) technology leader. MKS Integrity™ coordinates and manages all activities and artifacts associated with developing software intensive products, including requirements, models, code and test, ensuring comprehensive lifecycle traceability. By unifying MKS’s ALM solutions with PTC’s industry-leading product lifecycle management (PLM) solutions, PTC will enable manufacturers to better align the management of a product’s hardware components and related software.
We agreed to acquire MKS for an aggregate purchase price of approximately CDN$292.5 million in an all cash transaction. We will finance the transaction by drawing on our existing credit facility in the amount of approximately $250 million and with cash on hand of approximately $54 million. The acquisition is expected to close in early June 2011, subject to customary conditions, including approval of the MKS shareholders, Ontario court approval, and regulatory approvals. The acquisition is expected to be neutral to our non-GAAP financial results in fiscal 2011 and slightly accretive to our non-GAAP financial results in fiscal 2012.
We are very optimistic about the long-term opportunity for PTC and will continue to make strategic investments that we believe are critical to delivering value to our customers and to enabling us to gain market share and help us continue to drive toward our goal of low- to mid-teens revenue growth and 20% non-GAAP EPS CAGR over the 5-year period through 2014.
REVENUE TRENDS
Certain reclassifications between Direct and Indirect and Desktop and Enterprise revenue from previously reported results (Q1’09 through Q1’11) are reflected below. Indirect revenue is comprised of revenue from our reseller channel and from customers classified as Indirect. To the extent a customer changes between the Direct and Indirect classification, we reclassify their historical revenue to align to the current period classification. The reclassifications of prior quarter and annual Direct and Indirect and Desktop and Enterprise revenue were not more than 2% for any single quarterly or annual reporting period.
DIRECT SALES: Strong large deal activity, strong Desktop and solid Enterprise
Our direct sales force is primarily focused on large enterprise customers. We have approximately 303 direct sales teams. These teams are primarily focused on selling our Product Development System, which incorporates all of our primary product families, to large enterprise customers. The table below shows direct revenue performance. Key metrics we provide in addition to revenue regarding our Direct Sales / Large Enterprise Market performance also include Large Deal Activity and Domino Account wins.

Q2 direct account revenue was up 13% year over year. As you can see from the 4-box detail on page 3, our growth in this space was driven by 21% growth in Desktop (CAD) revenue and 7% growth in Enterprise (PLM) revenue. License revenue in the large enterprise CAD market (upper left box) increased 57% year over year. License revenue in the large enterprise PLM market (upper right box) was down 19% year over year. Our lower than expected PLM revenue in Q2’11 was primarily related to lower than expected Federal, Aerospace & Defense revenue in North America as well as the dilutive effect of the strong Desktop results on PLM sales capacity; however this market continues to exhibit strength with maintenance and services revenue, up 15% and 17%, respectively.
LARGE DEAL ACTIVITY: Customers continue to make significant PLM investments; CAD strong too.
Large deal activity is a significant growth driver and has historically tended to generate 15% to 20% of our total revenue in any given quarter, with the exception of Q4, which historically has been higher. Large deal activity is driven primarily by direct sales teams. We define “large deals” as recognizing more than $1 million of license and service revenue from a customer during a quarter.

In Q2 we had 24 large deals totaling $52.4 million. 11 of these customers were in North America, 8 were in Europe and 5 were in Asia. Of the $52.4 million in license and service revenue, approximately $18 million was Desktop (CAD) related, compared to approximately $4 million in the year ago period. Approximately $34 million was Enterprise (PLM) related, compared to $35 million in Q2’10. We have a strong pipeline of large deals that we are working on worldwide. We are winning competitive deals with large global companies (see ‘Dominoes’
above) and are actively engaged in a substantial number of competitive opportunities with other large global companies.
UPPER LEFT BOX (DIRECT SPACE / DESKTOP PRODUCTS)

Historically, this market has been a highly penetrated market with limited long-term growth opportunity. Over the past 2 quarters, we have seen substantial year-over-year growth in this market. In Q2, we delivered 21% total revenue growth and 57% license revenue growth. We believe our results represent both the impact of macro factors (spending in this market had been muted since the end of 2008), as well as excitement about our new Creo CAD platform, which we believe will be a significant enhancement over the functionality and usability of existing CAD products on the market today. We expect to launch the first version of Creo in the summer of 2011. We believe this new platform could drive above industry average growth in our CAD business over the coming years.
Our primary products in this market are Creo Elements/Pro, Creo Elements/Direct and Arbortext authoring solutions.
UPPER RIGHT BOX (DIRECT SPACE / ENTERPRISE PRODUCTS)

From a near- to medium-term growth perspective, we believe this market offers the most significant opportunity for PTC. Large enterprises are increasingly investing in PLM solutions and we believe Windchill is the premier PLM solution on the market today. License revenue in Q2 was lower than expected, primarily due to lower than expected Federal, Aerospace & Defense revenue in North America as well as the dilutive effect of the strong Desktop results on PLM sales capacity. Importantly this is our 4th quarter of consecutive services and maintenance revenue growth on a year-over-year basis. The performance of these lines of business was driven primarily by strong execution and was also impacted by annuity focused business policy modifications.
Our primary products in this market are Windchill, Creo Elements/View, and Arbortext enterprise solutions.
INDIRECT SALES: Strong maintenance base and continued signs of improving end markets
Our indirect sales are primarily from the Small and Medium Businesses (SMB) market. Indirect revenue is comprised of revenue from our reseller channel and from customers we have designated as indirect. We continue to have approximately 118 channel business development managers supporting more than 420 channel partners who are focused primarily on selling our MCAD products such as Creo Elements/Pro, Creo Elements/View and Mathcad, and Windchill PDMLink® into the SMB marketplace. We began in fiscal 2009 to develop a network of enterprise resellers to further expand our core Windchill ecosystem. This program is progressing well.

In Q2 indirect account revenue was up 9% year over year. Given that this market is made up of SMB companies, we believe this market continues to be more heavily impacted by macroeconomic factors. Importantly, as reflected in the 4-box detail, we are continuing to see an important sign of improvement in the SMB space: license and total revenue are up year over year in both the lower left and lower right boxes for the 5th quarter in a row.
LOWER LEFT BOX (INDIRECT SPACE / DESKTOP PRODUCTS)

We believe this market continues to offer long-term growth potential. The customer base is primarily comprised of SMB customers which we believe are more heavily impacted by macroeconomic factors. Importantly, we are seeing signs of improvement in new license sales and our maintenance paying base in this market remains stable. This is our fifth quarter of total revenue improvement and 15%+ year-over-year license revenue improvement.
Our primary products in this market are Creo Elements/Pro, Creo Elements/Direct, Mathcad and Arbortext authoring solutions.
LOWER RIGHT BOX (INDIRECT SPACE / ENTERPRISE PRODUCTS)
From a medium- to long-term growth perspective, we believe this market offers a significant growth opportunity. Again, the customer base in this market is primarily comprised of SMB companies, which we believe are more heavily impacted by macroeconomic factors. Despite the soft macro-environment, this is our fifth consecutive quarter of year-over-year license revenue growth. SMB customers are increasingly interested in PLM solutions and we believe we are well positioned to provide those customers with the right PLM technology to meet their needs.
Our primary products in this market are Windchill and Arbortext enterprise solutions.
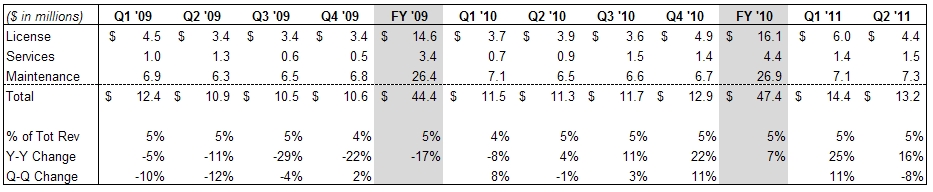
REVENUE BY LINE OF BUSINESS
LICENSE: Solid license quarter… Big Desktop revenue and Solid Enterprise revenue
License sales generate the highest gross margins, which are in the mid- to high 90% range on a non-GAAP basis. License revenue historically has tended to represent 28% to 35% of our total revenues in any given quarter, with Q4 generally being our strongest quarter. Given the macroeconomic environment in FY’09, license revenue was closer to 20% of total revenue, however, as expected, it has trended back towards 30% of total revenue in FY’10 and the first half of 2011.
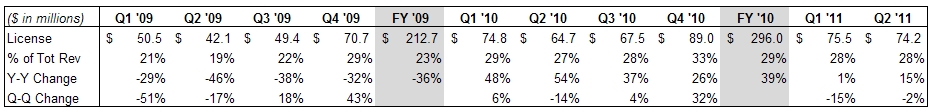
Q2 License revenue of $74.2 million was up 15% year over year (13% on a constant currency basis). We had 40% year-over-year growth in Desktop license revenue and a 15% year-over-year decline in Enterprise license revenue. Q2 License revenue was lower than expected primarily due to lower than expected Federal, Aerospace & Defense revenue in North America.
Our products continue to perform very well in competitive benchmarks, as demonstrated by our domino account and large deal (>$1 M in license and service revenue) momentum.
Looking forward to Q3, we are expecting license revenue of $77 to $84 million, up approximately 15% to 25% on a year-over-year basis. For FY’11, we are expecting license revenue growth of 15% to 20% on a year-over-year basis.
SERVICES: Year-over-year growth momentum continues to build
Our services business provides significant value to our customers, helping them re-engineer their global product development business processes and implement our solutions, and providing them with training on our software. Services revenue has historically tended to represent 20% to 25% of our total revenues in any given quarter.

Q2 Services revenue of $63.0 million was up 19% year over year (up 17% on a constant currency basis), primarily due to strong license revenue and ongoing engagements with PLM customers. Our training business, which typically represents about 15% of our total services revenue, was up 16% year over year. Our consulting business, which primarily supports Windchill implementations, was up 19% year over year. This is our 3rd consecutive quarter of accelerating services growth, suggesting that the impact of soft license revenue in FY’09 has bottomed. Our services non-GAAP net margin of 7.7% in Q2’11 (compared to 2.7% in Q2’10) reflects solid execution during Q2.
Looking forward to Q3, we are expecting services revenue to be up approximately 15% on a year-over-year basis. For FY’11 we are also expecting services revenue to grow in the low- to mid-teens on a year-over-year basis. We have a solid backlog of services engagements that provides near-term visibility into our services business. Relative to FY’10, we expect that our FY’11 services margins will be under pressure due to the impact of the contract accounting treatment related to our Hyundai Motor Company and Kia Motors Corporation win announced in Q1’11, as well as some investments we are making during FY’11 to enhance the longer-term profitability of our services business.
Our primary initiatives for the services business are to continue to enable our customers to realize value from their PLM implementations, improve our services net margins and expand our Windchill services ecosystem by adding Service Partners. We launched the “Service Advantage Program” at the beginning of fiscal 2009 and we are making solid progress. We already have a network of partners in North America and Europe, and are launching the program in Asia.
MAINTENANCE: Strong first half sets the tone
Our maintenance business is an important barometer of customer satisfaction with our solutions. It is also a strong source of recurring revenue for PTC. Maintenance gross margins are in the mid- to high 80% range. Maintenance revenue has historically tended to represent 45% to 50% of our total revenues in any given quarter, with Q4 usually being lower as a percent of total revenue due to historically strong performance of license sales in that quarter.

Q2 maintenance revenue of $132.0 million was up 7% year over year (also up 7% on a constant currency basis). Q2 is traditionally one of our softer quarters from a maintenance perspective due to the timing of maintenance renewals. Q2’11 was the first quarter since 2004 that our maintenance revenue is up sequentially from Q1 to Q2 (excluding Q2’08 which was the first full quarter of the CoCreate acquisition), reflecting strong execution and the impact of annuity focused business policy modifications. We believe our maintenance business reflects a solid customer base and the importance customers attribute to our products.
Looking forward to Q3, we are expecting low double-digit growth of maintenance revenue on a year-over-year basis. For FY’11 we are expecting a high single-digit maintenance revenue increase on a year-over-year basis, primarily due to improving license revenue, strong execution and annuity focused business policy modifications.
Active Maintenance Seats
We have more than 1.2 million active maintenance seats of PTC software in use today. We believe the solid base of maintenance-paying customers is a testament to the quality of our products and we also view it as one of our most important assets.
Active Maintenance Seats

We experienced an increase in active maintenance seats across all major product families in Q2. Our overall attach and renewal rates continue to remain strong.
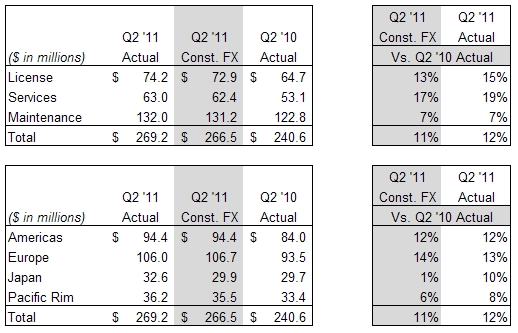
REVENUE BY REGION: Signs of global stability

Americas revenue in Q2 of $94.4 million was up 12% compared with last year, reflecting increases of 13% and 9% in direct and indirect revenue, respectively. Q2 license revenue in the Americas was up 20% year over year, with direct revenue up 23% and indirect revenue up 8%. Sequentially, total revenue was down 6% and license revenue was down 31%. Our lower than expected revenue in the Americas reflects lower than expected Federal, Aerospace & Defense revenue in North America. We believe this reflects recent uncertainty related to Federal and Defense budgets and program spending.

Europe revenue was $106.0 million in Q2, up 13% (14% on a constant currency basis) compared with last year, reflecting increases of 17% and 7% in direct and indirect revenue, respectively. Q2 license revenue in Europe was up 26% year over year, with direct revenue up 30% and indirect revenue up 20%. Sequentially, total revenue was down 2% and license revenue was down 5%.

Japan revenue was $32.6 million in Q2, up 10% (up 1% on a constant currency basis) compared with last year, reflecting revenue increases of 13% and 4% in direct and indirect revenue, respectively. Q2 license revenue in Japan was up 16% compared with last year, with direct revenue up 23% and indirect revenue up 2%. Sequentially, total revenue was up 31% and license revenue was up 264%, primarily due to seasonality and higher Desktop license revenue from large deals.

Pacific Rim revenue was $36.2 million in Q2, up 8% (6% on a constant currency basis) compared with last year, reflecting revenue increases of 3% and 23% in direct and indirect revenue, respectively. Q2 license revenue in the Pac Rim was down 5% compared with last year, with direct revenue down 16% and indirect revenue up 29%. (China, which represents a significant portion of our Pac Rim revenue, decreased 1% compared to Q2’10). The year-over-year comparison was impacted primarily by a large Windchill order in the Pac Rim in Q2’10. Sequentially, total revenue was up 8% and license revenue was up 21%.
CURRENCY IMPACT ON RESULTS COMPARED TO THE YEAR AGO PERIOD
Because we have a global business, with Europe and Asia historically representing approximately 65% of our revenue, our results are impacted by currency fluctuations. On a constant currency basis, our revenue increased 11% year over year. Currency fluctuations favorably impacted Q2 revenue by $2.7 million and unfavorably impacted Q2 non-GAAP expenses by $0.4 million compared to Q2’10.
Constant Currency (assumes Q2’10 currency rates)
Looking forward, the guidance we are providing assumes exchange rates of approximately 1.45 USD / EURO and 82 YEN / USD. Our actual simple average FY’10 Fx rate was essentially $1.37 USD / EURO. We do not forecast currency movements, rather we provide detailed constant currency commentary. Currency can significantly impact our results. For example, in FY’10 currency was a modest tailwind for PTC when compared to FY’09: revenue was positively impacted by $15 million and non-GAAP expenses were negatively impacted by $10 million. On the other hand, in FY’09 currency was a considerable headwind for PTC when compared to FY’08: revenue was negatively impacted by $39 million and non-GAAP expenses were positively impacted by $36 million.
As a simple rule of thumb, based on current revenue and expense levels, a $0.10 move on the USD/EURO exchange rate will impact annualized revenue by approximately $20 to $25 million and EPS by approximately $0.04 to $0.06.
Q2 FY’11 EXPENSES COMMENTARY AND Q3 & FY’11 OUTLOOK
Q2 non-GAAP results exclude $9.9 million of stock-based compensation expense, $7.6 million of acquisition- related intangible asset amortization, $0.6 million of acquisition-related expenses and $5.8 million of income tax adjustments. The Q2 non-GAAP results include a tax rate of 25% and 121.5 million diluted shares outstanding. The Q2 GAAP results include a tax rate of 19% and 121.5 million diluted shares outstanding.
Q3’11 non-GAAP guidance excludes the following estimated expenses and their tax effects:
|
·
|
Approximately $11.3 million of expense related to stock-based compensation
|
|
·
|
Approximately $7.7 million of acquisition-related intangible asset amortization expense
|
|
·
|
Any acquisition-related expenses
|
FY’11 non-GAAP guidance excludes the following full-year estimated expenses and their tax effects, as well as any one-time tax items:
|
·
|
Approximately $44.2 million of expense related to stock-based compensation
|
|
·
|
Approximately $29.9 million of acquisition-related intangible asset amortization expense
|
|
·
|
Any acquisition-related expenses (approximately $0.6 million through Q2)
|
|
·
|
Approximately $0.7 million of foreign currency transaction losses
|
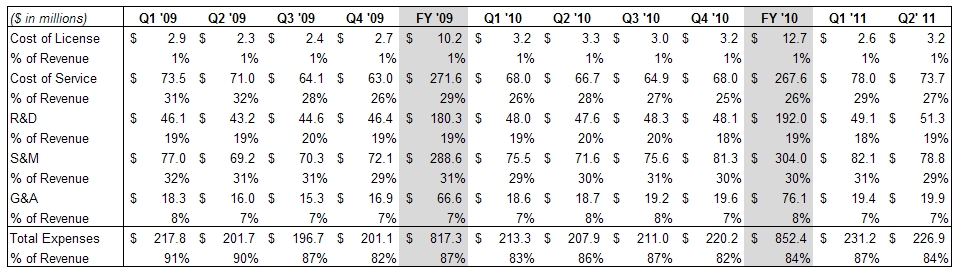
INCOME STATEMENT
Our Q2’11 non-GAAP gross margin was $192 million, or 71.5%, up from $171 million, or 70.9% in the year ago period, reflecting stronger license and service revenue, as well as a 500 bps improvement in services non-GAAP net margin (7.7% compared to 2.7%), reflecting solid services execution. Q2’11 GAAP gross margin was $187 million, or 69.6%, up from $163 million, or 67.9% in Q2’10.
Our Q2’11 non-GAAP operating expenses were $150 million, up from $138 million in Q2’10, reflecting investments we have made in the business to add sales capacity and to improve our product portfolio. Our Q2’11 non-GAAP operating expenses also include approximately $3 million of severance expenses, primarily in R&D, related to a strategic reprioritization effort to support our long-term market opportunity in the Automotive vertical.
Total non-GAAP expenses were $226.9 million, up 9% (9% on a constant currency basis) from Q2 of last year. Q2’11 total GAAP expenses were $245.0 million. From an operating performance perspective, we achieved 15.7% non-GAAP operating margin in Q2’11, compared to 13.6% last year. GAAP operating margin was 9.0% for Q2’11 compared to 4.8% in Q2’10.
Looking forward, we are expecting Q3 non-GAAP gross margins of approximately 72% and operating expenses of approximately $155 million, reflecting higher sales and marketing expense related primarily to higher sales expense (driven by higher commission expense due to higher anticipated license revenue, as well as costs related to planned hires), and costs related to our annual user event in June. We anticipate modestly lower sequential R&D expense as a result of the strategic reprioritization initiative mentioned above.
Our total Q3 non-GAAP expenses are expected to be approximately $230 to $235 million, depending on amount and mix of revenue. Q3 GAAP operating expenses are expected to be approximately $249 to $254 million, excluding any acquisition-related expenses.
For the full year, we are expecting non-GAAP gross margins of approximately 72% and non-GAAP operating margins of 17% to 18%. As reflected in our EPS guidance for FY ’11 we are committed to achieving our non-GAAP operating margin and EPS targets for FY’11.
Over the longer-term we intend to deliver 20% non-GAAP EPS growth annually through FY’14. Our goal is to deliver this result primarily through accelerating organic revenue growth coupled with modest margin improvement. We have made significant investments in FY’09 and FY’10 that have helped us achieve a technology leadership position and have driven substantial revenue growth.
Our R&D and S&M expense as a percentage of revenue in FY’09 and FY’10 were higher than in previous years, reflecting our strategy to continue to invest in our business in order to better position PTC for the future. Primary areas of investment in the business over this time included increased investment in our direct sales force and our reseller channel, investing in R&D to extend our technology leadership position, enhancing and leveraging the value of our services business, and expanding our services ecosystem. Looking forward, we expect to continue to increase our R&D investments, while having R&D as a percentage of revenue to begin to trend toward more normalized historical levels beginning in the back half of FY’11. We will continue to invest in initiatives to drive revenue growth and create further operating leverage opportunities over time.
NON-GAAP OPERATING EXPENSES
TAX RATE
Q2 non-GAAP tax rate was 25%, slightly above our expected non-GAAP tax rate of 24%. Our GAAP tax rate was 19%.
Looking forward, the Q3 guidance assumes a non-GAAP tax rate of 24% and a GAAP tax rate of 20%. The FY’11 target assumes a non-GAAP tax rate of 24% and a GAAP tax rate of 22%.
SHARE COUNT / SHARE REPURCHASE
We had 121.5 million fully diluted weighted average shares outstanding for Q2. We did not repurchase any shares during the quarter. Our repurchase authorization was increased in Q4’10 by $100 million through the end FY’11. We have $118 million remaining under our current authorization to repurchase shares.
Looking forward, we expect to have approximately 121 million fully diluted shares outstanding for Q3 and for the full fiscal year. We expect to resume our stock repurchases in Q3, with the goal of repurchasing approximately $55 million in total in FY’11. Our long-term goal is to repurchase stock to offset dilution.
BALANCE SHEET: Solid cash position and strong cash flow in Q2
CASH / CASH FLOW FROM OPERATIONS
For Q2’11, our cash balance was $260 million, up $77 million from the end of Q1’11. Q2 cash flow included $78 million provided by operations; $6 million of capital expenditures; and favorable foreign currency impact of $5 million.
Looking forward, we expect to have approximately $260 to $265 million in cash at the end of Q3 and we currently expect to end the year with approximately $280 to $285 million in cash after stock repurchases, but excluding any corporate development activities (we expect to use approximately $54 million of cash on hand to finance our previously announced acquisition of MKS).
DSO
We continue to have strong DSOs of 60 days in Q2’11, compared with 60 days in Q1’11 and 57 days in Q2’10.
OUTSTANDING DEBT
At the end of Q2’11 we had no outstanding balance on our $300 million revolving credit facility. We expect to draw approximately $250 million on our revolving credit facility in Q3 related to our acquisition of MKS.
MISCELLANEOUS COMMENTS
HEADCOUNT
Total headcount was 5,395 at the end of Q2, compared to 5,416 at the end of Q1, reflecting both planned hires as well as the strategic realignment initiative in Q2. Headcount at the end of Q4’10 was 5,317.
M&A
We view M&A primarily as a strategic vehicle to further enhance our product portfolio and growth opportunity. As previously announced, we have agreed to acquire MKS for an aggregate purchase price of approximately CDN$292.5 million in an all cash transaction. MKS is a global application lifecycle management (ALM) technology leader. By unifying MKS’s ALM solutions with our industry-leading product lifecycle management (PLM) solutions, PTC will enable manufacturers to better align the management of a product’s hardware components and related software. We expect this acquisition to further extend PTC’s long-term growth opportunity.
We intend to remain opportunistic as it relates to M&A. Historically, the majority of our M&A opportunities have comprised small, strategic technology tuck-ins. For example, in FY’09 we acquired Relex to expand our quality lifecycle management capabilities and Synapsis (InSight) to build out our product analytics platform, and in FY’10 we acquired technology in the fast growing carbon information management market, further enhancing our product analytics platform with “green product development” capabilities. We will evaluate other strategic acquisition opportunities as they arise.
WRAP-UP
We are very optimistic about the long-term opportunity for PTC. We are having a solid start to FY’11: We have won a cumulative total of 25 domino accounts, and expect to have a total of 30 by the end of FY’11; we had 24 large deals (>$1 M in license and service revenue) in Q2; our pipeline remains very robust; we are seeing significant year-over-year license growth in the CAD and SMB markets; we believe we have the best PLM technology platform on the market and we have very exciting opportunities with Creo and our Arbortext SIS strategy to continue to drive further growth in FY’12 and beyond.
We remain confident and committed to achieving accelerating revenue growth and our 20% non-GAAP EPS growth target through 2014. We intend to continue to make prudent, strategic investments that we believe are critical to delivering value to our customers and gaining market share.
Thank you for your on-going support.
Important Information About Non-GAAP References
PTC provides non-GAAP supplemental information to its financial results. Non-GAAP operating expenses, margin and EPS exclude stock-based compensation expense, gain on litigation resolution, foreign currency transaction losses related to a litigation resolution, amortization of acquired intangible assets, acquired in-process research and development expense, acquisition-related expenses, restructuring charges, and the related tax effects of the preceding items and any one-time tax items. We use these non-GAAP measures, and we believe that they assist our investors, to make period-to-period comparisons of our operational performance because they provide a view of our operating results without items that are not, in our view, indicative of our core operating results. We believe that these non-GAAP measures help illustrate underlying trends in our business, and we use the measures to establish budgets and operational goals, communicated internally and externally, for managing our business and evaluating our performance. We believe that providing non-GAAP measures affords investors a view of our operating results that may be more easily compared to the results of peer companies. In addition, compensation of our executives is based in part on the performance of our business based on these non-GAAP measures. However, non-GAAP information should not be construed as an alternative to GAAP information as the items excluded from the non-GAAP measures often have a material impact on PTC’s financial results. Management uses, and investors should consider, non-GAAP measures in conjunction with our GAAP results.
Forward-Looking Statements
Statements in these prepared remarks that are not historic facts, including statements about our fiscal 2011 and other future financial and growth expectations, future product releases, anticipated tax rates, the expected impact of our planned strategic investments and product releases on our future success, expected market growth rates and the long-term prospects for PTC are forward-looking statements that involve risks and uncertainties that could cause actual results to differ materially from those projected. These risks include the possibility that customers may not purchase our solutions when or at the rates we expect, the possibility the foreign currency exchange rates may vary from our expectations and thereby affect our reported revenue and expense, the possibility that we may not achieve the license, services or maintenance growth rates that we expect, which could result in a different mix of revenue between license, service and maintenance and could impact our EPS results, the possibility that strategic customer wins may not generate the revenue we expect, the possibility that our strategic investments may not have the effects or generate the revenue we expect, the possibility that we will experience a shortfall in revenue that causes us to decrease or eliminate planned strategic investments in our business, the possibility that we may be unable to attain or maintain a technology leadership position or that any such leadership position may not generate the revenue we expect, the possibility that planned product releases may be delayed or may not generate the revenue we expect, the possibility that resource constraints could adversely affect our revenue, and the possibility that our proposed acquisition of MKS Inc. may not be consummated or that such acquisition may not generate the revenues we expect. In addition, our assumptions concerning our future GAAP and non-GAAP effective income tax rates are based on estimates and other factors that could change, including the geographic mix of our revenue, expenses and profits and loans and cash repatriations from foreign subsidiaries. Other risks and uncertainties that could cause actual results to differ materially from those projected are detailed from time to time in reports we file with the Securities and Exchange Commission, including our Annual Report on Form 10-K and our Quarterly Reports on Form 10-Q.
|
NON-GAAP FINANCIAL MEASURES AND RECONCILIATIONS
|
||||||||||||||||||||||||||||||||||||||||||||||||
| (UNAUDITED) | ||||||||||||||||||||||||||||||||||||||||||||||||
| (in thousands) | ||||||||||||||||||||||||||||||||||||||||||||||||
|
GAAP OPERATING EXPENSES
|
||||||||||||||||||||||||||||||||||||||||||||||||
|
Q1 '09
|
Q2 '09
|
Q3 '09
|
Q4 '09
|
FY '09
|
Q1 '10
|
Q2 '10
|
Q3 '10
|
Q4 '10
|
FY '10
|
Q1 '11
|
Q2 '11
|
|||||||||||||||||||||||||||||||||||||
|
Cost of license revenue
|
$ | 7,584 | $ | 6,976 | $ | 7,644 | $ | 7,758 | $ | 29,962 | $ | 8,147 | $ | 8,232 | $ | 7,621 | $ | 7,047 | $ | 31,047 | $ | 5,954 | $ | 6,558 | ||||||||||||||||||||||||
|
Cost of service revenue
|
75,741 | 72,302 | 66,162 | 65,592 | 279,797 | 70,524 | 68,934 | 67,090 | 70,100 | 276,648 | 80,107 | 75,213 | ||||||||||||||||||||||||||||||||||||
|
Sales & marketing
|
79,862 | 71,387 | 73,823 | 76,297 | 301,369 | 78,598 | 75,137 | 79,121 | 84,676 | 317,532 | 84,521 | 81,163 | ||||||||||||||||||||||||||||||||||||
|
Research & development
|
48,361 | 44,752 | 46,562 | 48,826 | 188,501 | 50,690 | 49,960 | 50,597 | 50,320 | 201,567 | 51,522 | 53,051 | ||||||||||||||||||||||||||||||||||||
|
General & administrative
|
21,437 | 17,693 | 19,245 | 22,295 | 80,670 | 24,071 | 22,807 | 22,755 | 23,242 | 92,875 | 23,484 | 24,712 | ||||||||||||||||||||||||||||||||||||
|
Amortization of acquired
|
||||||||||||||||||||||||||||||||||||||||||||||||
|
intangible assetes
|
3,868 | 3,815 | 3,827 | 4,110 | 15,620 | 4,058 | 3,975 | 3,836 | 3,736 | 15,605 | 3,854 | 4,266 | ||||||||||||||||||||||||||||||||||||
|
In-process research &
|
||||||||||||||||||||||||||||||||||||||||||||||||
|
development
|
- | - | 300 | - | 300 | - | - | - | - | - | - | - | ||||||||||||||||||||||||||||||||||||
|
Restructuring charge, net
|
- | 9,788 | 6,609 | 6,274 | 22,671 | - | - | - | - | - | - | - | ||||||||||||||||||||||||||||||||||||
|
GAAP Operating Expenses
|
$ | 236,853 | $ | 226,713 | $ | 224,172 | $ | 231,152 | $ | 918,890 | $ | 236,088 | $ | 229,045 | $ | 231,020 | $ | 239,121 | $ | 935,274 | $ | 249,442 | $ | 244,963 | ||||||||||||||||||||||||
|
ADJUSTMENTS TO DERIVE NON-GAAP MEASURES
|
||||||||||||||||||||||||||||||||||||||||||||||||
|
Q1 '09
|
Q2 '09
|
Q3 '09
|
Q4 '09
|
FY '09
|
Q1 '10
|
Q2 '10
|
Q3 '10
|
Q4 '10
|
FY '10
|
Q1 '11
|
Q2 '11
|
|||||||||||||||||||||||||||||||||||||
|
Cost of license revenue:
|
||||||||||||||||||||||||||||||||||||||||||||||||
|
Acquired intangible
|
||||||||||||||||||||||||||||||||||||||||||||||||
|
amortization
|
$ | 4,668 | $ | 4,703 | $ | 5,221 | $ | 5,082 | $ | 19,674 | $ | 4,898 | $ | 4,928 | $ | 4,659 | $ | 3,882 | $ | 18,367 | $ | 3,363 | $ | 3,339 | ||||||||||||||||||||||||
|
Stock-based
|
||||||||||||||||||||||||||||||||||||||||||||||||
|
compensation
|
14 | 3 | 11 | 22 | 50 | 17 | 2 | 2 | 3 | 24 | 3 | 3 | ||||||||||||||||||||||||||||||||||||
|
Cost of service revenue:
|
||||||||||||||||||||||||||||||||||||||||||||||||
|
Acquired intangible
|
||||||||||||||||||||||||||||||||||||||||||||||||
|
amortization
|
8 | - | - | - | 8 | - | - | - | - | - | - | - | ||||||||||||||||||||||||||||||||||||
|
Stock-based
|
||||||||||||||||||||||||||||||||||||||||||||||||
|
compensation
|
2,255 | 1,291 | 2,055 | 2,562 | 8,163 | 2,580 | 2,241 | 2,186 | 2,115 | 9,122 | 2,137 | 1,583 | ||||||||||||||||||||||||||||||||||||
|
Sales & marketing:
|
||||||||||||||||||||||||||||||||||||||||||||||||
|
Stock-based
|
||||||||||||||||||||||||||||||||||||||||||||||||
|
compensation
|
2,908 | 2,193 | 3,491 | 4,205 | 12,797 | 3,074 | 3,520 | 3,471 | 3,367 | 13,432 | 2,429 | 2,350 | ||||||||||||||||||||||||||||||||||||
|
Research & development:
|
||||||||||||||||||||||||||||||||||||||||||||||||
|
Stock-based
|
||||||||||||||||||||||||||||||||||||||||||||||||
|
compensation
|
2,258 | 1,566 | 1,986 | 2,404 | 8,214 | 2,659 | 2,383 | 2,252 | 2,186 | 9,480 | 2,393 | 1,749 | ||||||||||||||||||||||||||||||||||||
|
General & administrative:
|
||||||||||||||||||||||||||||||||||||||||||||||||
|
Stock-based
|
||||||||||||||||||||||||||||||||||||||||||||||||
|
compensation
|
3,096 | 1,677 | 3,969 | 5,362 | 14,104 | 5,525 | 4,146 | 3,599 | 3,583 | 16,853 | 4,065 | 4,186 | ||||||||||||||||||||||||||||||||||||
|
Acquisition-related costs
|
- | - | - | - | - | - | - | - | - | - | - | 608 | ||||||||||||||||||||||||||||||||||||
|
Amortization of acquired
|
||||||||||||||||||||||||||||||||||||||||||||||||
|
intangible assets
|
3,868 | 3,815 | 3,827 | 4,110 | 15,620 | 4,058 | 3,975 | 3,836 | 3,736 | 15,605 | 3,854 | 4,266 | ||||||||||||||||||||||||||||||||||||
|
In-process research &
|
||||||||||||||||||||||||||||||||||||||||||||||||
|
development
|
- | - | 300 | - | 300 | - | - | - | - | - | - | - | ||||||||||||||||||||||||||||||||||||
|
Restructuring charge, net
|
- | 9,788 | 6,609 | 6,274 | 22,671 | - | - | - | - | - | - | - | ||||||||||||||||||||||||||||||||||||
|
Non-GAAP adjustments
|
$ | 19,075 | $ | 25,036 | $ | 27,469 | $ | 30,021 | $ | 101,601 | $ | 22,811 | $ | 21,195 | $ | 20,005 | $ | 18,872 | $ | 82,883 | $ | 18,244 | $ | 18,084 | ||||||||||||||||||||||||
|
NON-GAAP OPERATING EXPENSES
|
||||||||||||||||||||||||||||||||||||||||||||||||
|
Q1 '09
|
Q2 '09
|
Q3 '09
|
Q4 '09
|
FY '09
|
Q1 '10
|
Q2 '10
|
Q3 '10
|
Q4 '10
|
FY '10
|
Q1 '11
|
Q2 '11
|
|||||||||||||||||||||||||||||||||||||
|
Cost of license revenue
|
$ | 2,902 | $ | 2,270 | $ | 2,412 | $ | 2,654 | $ | 10,238 | $ | 3,232 | $ | 3,302 | $ | 2,960 | $ | 3,162 | $ | 12,656 | $ | 2,588 | $ | 3,216 | ||||||||||||||||||||||||
|
Cost of service revenue
|
73,478 | 71,011 | 64,107 | 63,030 | 271,626 | 67,944 | 66,693 | 64,904 | 67,985 | 267,526 | 77,970 | 73,630 | ||||||||||||||||||||||||||||||||||||
|
Sales & marketing
|
76,954 | 69,194 | 70,332 | 72,092 | 288,572 | 75,524 | 71,617 | 75,650 | 81,309 | 304,100 | 82,092 | 78,813 | ||||||||||||||||||||||||||||||||||||
|
Research & development
|
46,103 | 43,186 | 44,576 | 46,422 | 180,287 | 48,031 | 47,577 | 48,345 | 48,134 | 192,087 | 49,129 | 51,302 | ||||||||||||||||||||||||||||||||||||
|
General & administrative
|
18,341 | 16,016 | 15,276 | 16,933 | 66,566 | 18,546 | 18,661 | 19,156 | 19,659 | 76,022 | 19,419 | 19,918 | ||||||||||||||||||||||||||||||||||||
|
Amortization of acquired
|
||||||||||||||||||||||||||||||||||||||||||||||||
|
intangible assetes
|
- | - | - | - | - | - | - | - | - | - | - | - | ||||||||||||||||||||||||||||||||||||
|
In-process research &
|
||||||||||||||||||||||||||||||||||||||||||||||||
|
development
|
- | - | - | - | - | - | - | - | - | - | - | - | ||||||||||||||||||||||||||||||||||||
|
Restructuring charge, net
|
- | - | - | - | - | - | - | - | - | - | - | - | ||||||||||||||||||||||||||||||||||||
|
Non-GAAP Operating Expenses
|
$ | 217,778 | $ | 201,677 | $ | 196,703 | $ | 201,131 | $ | 817,289 | $ | 213,277 | $ | 207,850 | $ | 211,015 | $ | 220,249 | $ | 852,391 | $ | 231,198 | $ | 226,879 | ||||||||||||||||||||||||
|
PARAMETRIC TECHNOLOGY CORPORATION
|
||||||||||||||||||||
|
NON-GAAP FINANCIAL MEASURES AND RECONCILIATIONS (UNAUDITED)
|
||||||||||||||||||||
|
(in thousands, except per share data)
|
||||||||||||||||||||
|
Three Months Ended
|
Six Months Ended
|
|||||||||||||||||||
|
April 2,
|
April 3,
|
April 2,
|
April 3,
|
|||||||||||||||||
|
2011
|
2010
|
2011
|
2010
|
|||||||||||||||||
|
GAAP gross margin
|
$ | 187,418 | $ | 163,390 | $ | 367,909 | $ | 343,148 | ||||||||||||
|
Stock-based compensation
|
1,586 | 2,243 | 3,726 | 4,840 | ||||||||||||||||
|
Amortization of acquired intangible assets
|
||||||||||||||||||||
|
included in cost of license revenue
|
3,339 | 4,928 | 6,702 | 9,826 | ||||||||||||||||
|
Non-GAAP gross margin (1)
|
$ | 192,343 | $ | 170,561 | $ | 378,337 | $ | 357,814 | ||||||||||||
|
GAAP operating income
|
$ | 24,226 | $ | 11,511 | $ | 41,336 | $ | 33,852 | ||||||||||||
|
Stock-based compensation
|
9,871 | 12,292 | 20,898 | 26,147 | ||||||||||||||||
|
Amortization of acquired intangible assets
|
||||||||||||||||||||
|
included in cost of license revenue
|
3,339 | 4,928 | 6,702 | 9,826 | ||||||||||||||||
|
Amortization of acquired intangible assets
|
4,266 | 3,975 | 8,120 | 8,033 | ||||||||||||||||
|
Acquisition-related charges included in
|
||||||||||||||||||||
|
general and administrative expenses
|
608 | - | 608 | - | ||||||||||||||||
|
Non-GAAP operating income (2)
|
$ | 42,310 | $ | 32,706 | $ | 77,664 | $ | 77,858 | ||||||||||||
|
GAAP net income
|
$ | 19,017 | $ | 9,002 | $ | 32,277 | $ | 26,865 | ||||||||||||
|
Stock-based compensation
|
9,871 | 12,292 | 20,898 | 26,147 | ||||||||||||||||
|
Amortization of acquired intangible assets
|
||||||||||||||||||||
|
included in cost of license revenue
|
3,339 | 4,928 | 6,702 | 9,826 | ||||||||||||||||
|
Amortization of acquired intangible assets
|
4,266 | 3,975 | 8,120 | 8,033 | ||||||||||||||||
|
Acquisition-related charges included in
|
||||||||||||||||||||
|
general and administrative expenses
|
608 | - | 608 | - | ||||||||||||||||
|
Non-operating foreign currency transaction loss (3)
|
- | - | 722 | - | ||||||||||||||||
|
Income tax adjustments (4)
|
(5,848 | ) | (6,696 | ) | (11,658 | ) | (14,073 | ) | ||||||||||||
|
Non-GAAP net income
|
$ | 31,253 | $ | 23,501 | $ | 57,669 | $ | 56,798 | ||||||||||||
|
GAAP diluted earnings per share
|
$ | 0.16 | $ | 0.08 | $ | 0.27 | $ | 0.22 | ||||||||||||
|
Stock-based compensation
|
0.08 | 0.10 | 0.17 | 0.22 | ||||||||||||||||
|
Income tax adjusments
|
(0.05 | ) | (0.06 | ) | (0.10 | ) | (0.12 | ) | ||||||||||||
|
All other items identified above
|
0.07 | 0.08 | 0.14 | 0.15 | ||||||||||||||||
|
Non-GAAP diluted earnings per share
|
$ | 0.26 | $ | 0.20 | $ | 0.48 | $ | 0.47 | ||||||||||||
| (1 | ) |
Gross margin impact of non-GAAP adjustments:
|
||||||||||||||||||
|
Three Months Ended
|
Six Months Ended
|
|||||||||||||||||||
|
April 2,
|
April 3,
|
April 2,
|
April 3,
|
|||||||||||||||||
| 2011 | 2010 | 2011 | 2010 | |||||||||||||||||
|
GAAP gross margin
|
69.6 | % | 67.9 | % | 68.7 | % | 68.8 | % | ||||||||||||
|
Stock-based compensation
|
0.6 | % | 0.9 | % | 0.7 | % | 1.0 | % | ||||||||||||
|
Amortization of acquired intangibles
|
1.2 | % | 2.0 | % | 1.3 | % | 2.0 | % | ||||||||||||
|
Non-GAAP gross margin
|
71.5 | % | 70.9 | % | 70.6 | % | 71.7 | % | ||||||||||||
| (2 | ) |
Operating margin impact of non-GAAP adjustments:
|
||||||||||||||||||
|
Three Months Ended
|
Six Months Ended
|
|||||||||||||||||||
|
April 2,
|
April 3,
|
April 2,
|
April 3,
|
|||||||||||||||||
| 2011 | 2010 | 2011 | 2010 | |||||||||||||||||
|
GAAP operating margin
|
9.0 | % | 4.8 | % | 7.7 | % | 6.8 | % | ||||||||||||
|
Stock-based compensation
|
3.7 | % | 5.1 | % | 3.9 | % | 5.2 | % | ||||||||||||
|
Amortization of acquired intangibles
|
2.8 | % | 3.7 | % | 2.8 | % | 3.6 | % | ||||||||||||
|
Acquisition-related charges
|
0.2 | % | 0.0 | % | 0.1 | % | 0.0 | % | ||||||||||||
|
Non-GAAP operating margin
|
15.7 | % | 13.6 | % | 14.5 | % | 15.6 | % | ||||||||||||
| (3 | ) |
Reflects foreign currency transaction losses related to a previously announced litigation settlement in Japan.
|
||||||||||||||||||
| (4 | ) |
Reflects the tax effects of non-GAAP adjustments for the three and six months ended April 2, 2011 and April 3, 2010, which are calculated by applying the applicable tax rate by jurisdiction to the non-GAAP adjustments listed above.
|
||||||||||||||||||