Attached files
| file | filename |
|---|---|
| 8-K - CAMDEN NATIONAL CORPORATION 8-K - CAMDEN NATIONAL CORP | a6697340.htm |
| EX-99.1 - EXHIBIT 99.1 - CAMDEN NATIONAL CORP | a6697340-ex991.htm |
Exhibit 99.2
|
First Quarter Report - 2011 CamdenNational.com 800-860-8821 |
Dear Fellow Shareholders,
I am pleased to share with you our first quarter 2011 financial results. For the three months ending March 31, 2011, net income was $6.3 million, or $0.83 per diluted share, a 19% increase over the same time period in 2010. These results, in light of a weak recovery and overall economic uncertainty, are due in part to the Company's focus on long-term sustainable growth and the hard work of all of our employees.
Camden National's key financial performance ratios were strong. Return on assets was 1.11% during the first quarter of 2011, compared to 0.97% during the same period a year ago, and return on equity was 12.45% compared to 11.14% for the first quarters of 2011 and 2010, respectively. Based on the past two years' quarterly peer data, we expect these ratios to place us in the top 25% of our peers.
Net interest income increased $494,000, or 3%, over the first three months of 2010, and the provision for loan losses of $1.1 million for the first quarter of 2011 decreased $877,000 from a year ago. Non-interest income increased $546,000, or 12%, from the first quarter of 2010 and non-interest expense increased $363,000, or 3%, from the previous period. The Company's efficiency ratio, which measures how much it costs us to generate our revenues, improved to 55.27% in the first quarter of 2011, from 56.08% in the first quarter of 2010.
Continued general weakness in the national and regional economies continues to impact our asset quality. Our commercial loan portfolio has stabilized since the first quarter of 2010, however the consumer sector has softened as a result of the weak housing and employment markets in Maine. We work with customers who are experiencing financial stress and, where possible, have provided relief to them while also protecting our shareholders' capital, which is reflected in the balance of restructured loans of $2.6 million at the end of the first quarter of 2011, up from $677,000 at the end of the first quarter of 2010. This contributed to an increase in non-performing assets to $25.1 million, compared to $24.1 million at March 31, 2010.
In addition to our financially sound start to 2011, we also completed several important strategic initiatives during the first quarter. In February 2011, the Union Trust name was retired in our Downeast markets and, as a result, all of our banking services are now provided under the Camden National Bank name. Also in February 2011, a major branding campaign was launched which included changing the logo of Camden National Corporation to include the anchor icon. The anchor, which has been in use by Camden National Bank from as early as 1910, resonates in all of our markets as a sign of strength, stability and security, Additionally, we renamed our brokerage division "Camden Financial Consultants." These changes will align our banking and brokerage products under a common name, allowing us to be more focused and clear in our marketing efforts.
Another major initiative was launching a new web banking platform and website, supplemented by a state-of-the-art mobile banking function that includes Camden National Bank's own "app" for iPhones and iPads. Our investment in web and mobile technology reflects our determination to stay in step with our customers who now routinely use computers, smart-phones and computer-tablets, often in lieu of branch banking.
During the first quarter of 2011, we announced a $0.25 dividend per common share. We are very proud that during the recent economic recession and financial crisis, Camden National Corporation maintained its dividend and did not dilute our shareholders' ownership through common stock offerings. This performance was recognized during the first quarter as Camden National Corporation was named to the Keefe, Bruyette and Woods "Bank Honor Roll" of 40 financial institutions and superior performers who successfully weathered the financial storm. The firm of Seifried & Brew also recently recognized Camden National as a Top 15th Percentile Bank for optimization of managed risk.
Managing the capital strength of our organization has been one of our most important priorities during the past several quarters. Total tangible book value of $21.50 per share at March 31, 2011 increased 11% from a year ago. Additionally, total risk-based capital of 15.10% increased from 13.90% a year ago, and our tangible capital to tangible assets ratio of 7.20% increased from 6.85% a year ago. As of this writing, the Federal Reserve has not issued new guidance related to required capital ratios for financial institutions, which has resulted in management continuing its focus on building capital to provide long-term benefits to shareholders.
I am also pleased to announce that in February five individuals were named to newly created executive vice president positions and join me to form an executive committee. Joanne Campbell, Peter Greene, Deborah Jordan, Timothy Nightingale and June Parent are seasoned executives who have served our organization exceedingly well over the years, especially in the face of economic turmoil and financial crisis. These appointments, and the creation of an executive committee, also reflect our intent to continue to grow and prosper while remaining strategically focused on shareholder value through long-term sustainable growth. Whether it's witnessing an individual reach one of the highest ranks in our organization, or watching one of our newest tellers receive his or her first promotion, leadership development is one of our most important strategic priorities.
On behalf of all our employees and our Board of Directors, your support is greatly appreciated.
Sincerely,
/s/ Gregory A. Dufour
Gregory A. Dufour
President and Chief
Executive Officer
|
Assets: $2.3 Billion |
|||||
|
Board of Directors |
Locations: 39 |
||||
|
Karen W. Stanley, Chairman |
Robert J. Campbell |
David C. Flanagan |
Rendle A. Jones, Esq. |
John M. Rohman |
Employees: 436 |
|
Ann W. Bresnahan |
Gregory A. Dufour |
John W. Holmes |
James H. Page, Ph.D. |
Robin A. Sawyer, CPA |
NASDAQ Ticker: CAC |
|
Summary Financial Data (unaudited) (Dollars in thousands except per share data) |
|||||||||
|
|
|
||||||||
|
Financial Condition Data |
March 31, 2011 |
March 31, 2010 |
December 31, 2010 |
||||||
| Investments | $ | 643,920 | $ | 520,567 | $ | 611,643 | |||
| Loans and loans held for sale | 1,536,463 | 1,530,067 | 1,530,280 | ||||||
| Allowance for loan losses | 22,887 | 21,379 | 22,293 | ||||||
| Total assets | 2,338,317 | 2,218,556 | 2,306,007 | ||||||
| Deposits | 1,544,681 | 1,501,030 | 1,515,811 | ||||||
| Borrowings |
559,079 |
499,123 | 559,919 | ||||||
| Shareholders' equity |
210,725 |
195,157 | 205,995 | ||||||
|
At or for the Three Months Ended |
|||||||||
|
March 31, 2011 |
March 31, 2010 |
||||||||
|
Operating Data |
|||||||||
| Interest income | $ | 24,860 |
|
$ |
26,171 |
||||
| Interest expense |
6,301 |
|
8,106 |
||||||
| Net interest income |
18,559 |
|
18,065 |
||||||
| Provision for credit losses |
1,119 |
1,996 |
|||||||
| Net interest income after provision for credit losses | 17,440 |
|
16,069 |
||||||
| Non-interest income | 5,118 |
|
4,572 |
||||||
| Non-interest expense | 13,285 |
|
12,922 |
||||||
| Income before income taxes | 9,273 |
|
7,719 |
||||||
| Income taxes | 2934 |
|
2,406 |
||||||
| Net income |
$ |
6,339 |
|
$ |
5,313 |
||||
|
Per Share Data |
|||||||||
|
Basic earnings per share |
$ |
0.83 |
|
|
$ |
0.69 |
|||
| Diluted earnings per share | 0.83 |
|
0.69 |
||||||
| Cash dividends paid per share | 0.25 |
|
0.25 |
||||||
| Book value per share | 27.45 |
|
25.50 |
||||||
|
Tangible book value per share (1) |
21.50 |
|
19.45 |
||||||
|
Selected Financial Data |
|||||||||
|
Return on average assets |
1.11 |
% |
|
0.97 |
% |
||||
| Return on average equity | 12.45 |
% |
|
11.14 |
% |
||||
| Tier 1 leverage capital ratio | 8.93 | % |
|
8.42 |
% |
||||
| Tier 1 risk-based capital ratio | 13.84 | % |
|
12.65 |
% |
||||
| Total risk-based capital ratio | 15.10 | % |
|
13.90 |
% |
||||
|
Efficiency ratio (2) |
55.27 | % |
|
56.08 |
% |
||||
| Allowance for credit losses to total loans |
1.49 |
% |
|
1.40 |
% |
||||
| Net loan charge-offs to average loans (annualized) | 0.14 | % |
|
0.23 |
% |
||||
| Non-performing loans to total loans | 1.49 | % |
|
1.23 |
% |
||||
| Non-performing assets to total assets |
1.08 |
% |
|
1.08 |
% |
||||
(1) Computed by dividing shareholders' equity less goodwill
and other intangibles by the number of common shares outstanding.
(2)
Calculated by dividing non-interest expense by the sum of net interest
income (tax equivalent) and non-interest income (excluding securities
gains/losses).
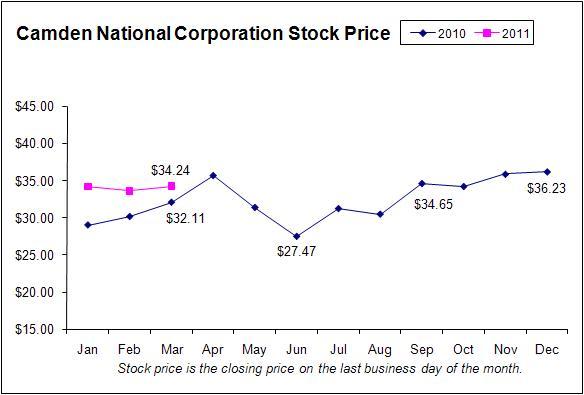
Camden National Corporation Stock Price 2010 2011 $45.00 $40.00 $35.00 $30.00 $25.00 $20.00 $15.00 Jan Feb Mar Apr May Jun Jul Aug Sep Oct Nov Dec Stock price is the closing price on the last business day of the month. $34.24 $32.11 $27.47 $34.65 $36.23
A complete set of financial statements for Camden National
Corporation may be obtained upon written request to
Susan M.
Westfall, SVP Clerk, Camden National Corporation, P.O. Box 310, Camden,
Maine 04843, 207-230-2096.