Attached files
| file | filename |
|---|---|
| 8-K - FORM 8-K - Williams Industrial Services Group Inc. | d8k.htm |
| EX-99.1 - PRESS RELEASE - Williams Industrial Services Group Inc. | dex991.htm |
 1
Investor Presentation
Exhibit 99.2 |
 2
This presentation contains "forward-looking statements" within the meaning of
that term set forth in the Private Securities Litigation Reform Act of 1995.
These statements reflect our current views of future events and financial performance
including, without limitations, our outlook and are subject to a number of risks and
uncertainties. Our actual results, performance or achievements may differ
materially from those expressed or implied in the forward-looking
statements. Risks and uncertainties that could cause or contribute to such material
differences include, but are not limited to: decreased demand for new gas turbine
power plants; reduced demand for, or increased regulation of, nuclear power; loss of
any of our major customers; cost increases
and
project
cost
overruns;
unforeseen
schedule
delays;
poor
performance
by
our
subcontractors; cancellation of projects; competition for the sale of our products and
services; shortages in, or increases in prices for, energy and materials such as steel
that we use to manufacture our products; damage to our reputation; warranty or product
liability claims; increased exposure to environmental or other liabilities; failure to
comply with various laws and regulations; failure to attract and retain
highly-qualified personnel; volatility of our stock price; deterioration or
uncertainty of credit markets; and changes in the economic, social and political
conditions in the United States and other countries in which we operate, including
fluctuations in foreign currency exchange rates, the banking environment or monetary
policy. Other important factors that may cause actual results to differ
materially from those expressed in the forward- looking statements are discussed in
our filings with the Securities and Exchange Commission, including the section of our
Annual Report on Form 10-K titled "Risk Factors." This presentation
speaks only as of the date hereof. We undertake no obligation to publicly update or
revise any forward-looking statements, whether as a result of new information,
future events or otherwise, and we caution you not to rely upon them unduly.
Forward-Looking Statements |
 Market
Overview Market Overview
1.
Power Generation equipment and service is one of the largest industries worldwide
2.
Technology is stable
–
owners are conservative due to the large capital investments
3.
Economics of power generation plants are dynamic due to fluctuating fuel prices and
environmental compliance costs
4.
Service market is stable / slow growth and consistently profitable
5.
OEM / new equipment market is global, cyclical and generates higher risks and earnings
swings
Global Power
Mission Statement
Mission Statement
We
will
safely
provide
superior
engineered
products
and
services
that
exceed
customer standards while affording employees opportunities for career growth and
earning our investors a superior rate of return on their investment. 3
|
 4
Global Power
What we do
Global
Power
Equipment
Group
Inc.
is
a
comprehensive
provider
of
power
generation
equipment
and
maintenance
services
for
customers
in
the
domestic
and
international
energy, power infrastructure and service industries. |
 5
Global Power
Executive management
Tracy Pagliara
General Counsel, Secretary &
VP Business Development
25 yrs experience
David Willis
CFO & SVP
17 yrs experience
Ken Robuck
SVP & President of Services
28 yrs experience
Dean Glover
SVP & President of Products
20 yrs experience
David Keller
President & CEO
30 yrs experience |
 6
A Global Presence
Cost effective / low risk OEM model takes us worldwide
Global Power Operations
Subcontract Fabricators |
 Financial Overview
12/31/10 Snapshot
Market cap (3/9/11):
$356 million
Total unrestricted cash:
$55 million
Cash position net of term loan:
$56
million
Total backlog:
$349 million
Fully diluted shares:
16.3 million
Operating revenues:
$520
million
Net income:
$41
million
Earnings per fully diluted share:
$2.49
Consolidated operating EBITDA:
$54
million
Fiscal Year
2010
As of
12/31/10
Backlog and EBITDA are non-GAAP measures. See appendix for
reconciliation of EBITDA to net income and following slide
for additional information on backlog.
7 |
 8
Snapshot of Backlog
Historical Backlog
Historical Backlog
Backlog (12/31/10)
Backlog (12/31/10)
$377
$333
$315
$349
Backlog is a non-GAAP measure and our methodology for determining backlog may
vary from the methodology used by other companies to determine their backlog. Backlog may not
be indicative of future operating results and projects in our backlog may be
cancelled, modified or otherwise altered by our customers. |
 9
Blue Chip Customer Base
Bad debt expense and warranty claims from top 10 customers
represent 0.204% of consolidated revenues from 2007
– 2010
1) Issuer ratings published on various dates; above reflects most recent ratings as
of March 2011 2) Bond issue rating
Credit
% of GPEG
Bad Debt
Warranty
Relationship
Rating [1]
Revenue
Exp
Claims
Tenure
($ in 000's)
($ in 000's)
1.
General Electric
AA+ / stable
43 years
2.
Southern Company
A / stable
41 years
3.
Entergy
BBB / stable
2 years
4.
Tennessee Valley Authority
A / stable [2]
35 years
5.
Florida Power & Light Group
A- / stable
35 years
6.
Energy Northwest
AA / stable [2]
6 years
7.
Siemens
A+ / stable
40 years
8.
Jacksonville Electric Authority
A+ / stable [2]
20 years
9.
Alstom
BBB+ / Neg
19 years
10.
Mitsubishi
A+ / stable
17 years
Subtotal - Top Customers
79%
1,386
$
2,742
$
All Others
21%
Total Revenue
100%
Customer
2007 - 2010 |
 10
Strategic Overview
Where we have been
Global Power has strengthened and repositioned itself over the last four
years Exited large-scale HRSG
product line
Divested foreign subsidiary
Successfully exited Chapter 11
Additional equity capital
Commenced trading under
“GLPW”
on Pink Sheets
Entered into $150m exit
facility:
-
$90m term loan
-
$60m revolver facility
New management
Successfully re-listed on NASDAQ to
capitalize on strong performance and
position company for growth
Solid financials/Operating Performance
(across 2008-10)
-
Unrestricted cash of $55.5m
-
Term loan repaid in full; access to
$25m under cash sub-facility of
revolver
Improving management systems and
controls |
 11
Strategic Overview
Where we are going
Organic Outlook
Organic Outlook
2010 consolidated
operating income included in excess of $12 million of non-recurring positive gains
Products
OEM market expected to stabilize in 2011 resulting in increasing bookings activity for
revenues recognized in subsequent periods
-
2011 revenues expected to increase back to levels realized in 2009, but
-
2011 gross margins anticipated to reflect competitive market pricing conditions throughout
2010 with reported margins 2-3% below 2009 levels
Services
is positioned to pursue more capital projects; shift in mix from maintenance and modification
work could result in “lumpy”
bookings activity
-
2011
revenues
anticipated
to
reflect
upper
single
digit
declines
compared
to
2010
due
to
the
completion of a large capital project
-
2011
margins
anticipated
to
stabilize
at
historical
run
rates
of
10%
-
13%
2011 consolidated
operating expenses as a percentage of revenues expected to remain in line with 2010
ratios |
 12
Strategic Overview
Where we are going
(cont’d) Acquisition Prospects
Acquisition Prospects
Products
acquisition potential targets include:
-
Bolt-on product lines
-
Product offerings that complement existing markets or broaden exposure beyond OEM
gas turbine cycle
Services
acquisitions potential targets include:
-
Specialty services that enhance our current capabilities
-
Engineering and design capabilities open additional EPC project opportunities (we
currently participate in this space through alliances with engineering firms or through
subcontract relationships)
Opportunities will be prioritized based on a disciplined valuation approach, strategic fit and
timeline for accretion to shareholders |
 13
Global Power
Strong fundamental structure for a growing industry
Strong commercial risk / reward profile
Flexible manufacturing model
Geographic and end-market diversity
Long-standing relationships with a blue-chip customer base
Strong free cash flow generation
Favorable end-market dynamics
Acquisition growth opportunities |
 14
Industry |
 15
Poised For Growth
In a changing industry
Source: EIA, DOE Annual Energy Outlook, December, 2009
* Includes storage
1,008
Gigawatts
250
Gigawatts
Natural gas-fired plants utilizing gas turbine power generation equipment are expected
to account for 46% of capacity additions through 2035
Environmental concerns favor gas-fired generation, especially in countries with a high
dependence on coal-fired output
Nuclear
20%
Other
Renewables
10%
Coal
47%
Natural Gas
23%
2009 Capacity
Nuclear
3%
Other
Renewables
37%
Other
1%
Natural Gas
46%
Coal
13%
Hydropower*
0.4%
Capacity Additions through 2035 |
 16
Comparative Economics
Source: Compiled by FERC staff from various sources
FERC forecast data demonstrates gas is expected to be a compelling fuel source for power
generation capacity additions
Nuclear
Conventional Coal
IGCC Coal
Combined Cycle (Gas)
Combustion Turbine (Gas)
Wind
2003-04
Geothermal
2008
Concentrated Solar
$/kw
$6,000
$7,000
$8,000
$0
$1,000
$2,000
$3,000
$4,000
$5,000 |
   17
Coal to Gas Trend
Aging coal retirements should benefit gas
Source: Ventyx, DBCCA analysis 2010
…many of which are expected to be replaced by natural gas plants:
Almost half the U.S. coal fleet is old and inefficient with significant retirements
anticipated… Gas
Coal
Gas
Coal
Gas
Coal
Capacity (GW)
454.6
337.3
480.6
185.6
26
(151.7)
% of US Supply
23%
47%
35%
22%
12%
(25%)
2009
2030 Est.
Inc. / (Dec.)
Source: EIA, DBCCA analysis 2010
Anticipated Future
Coal Retirements
Total GW
Avg. Age
(years)
% of Existing
Capacity
2010 - 2020 period
60
62
2020 - 2030 period
92
47
45% |
 United
States
currently
has
104
operating
nuclear
reactors
at
65
plant
sites
that
generate
about
20%
of
electricity used in the US. These plants have been in operation for an average of 30 years and
are operating at close to 90% capacity.
In 2000, the NRC issued the first license renewal to a nuclear power plant, extending its
license for an additional 20 years beyond its original 40-year license.
Capacity Factor Trend
Source: Department of Energy
Maintenance: A Multi-Billion Dollar Industry
Aging nuclear fleet that requires extensive ongoing services
18 |
 19
Services Spectrum 2011
Nuclear Power
Plant
Maintenance
Fossil Fuel,
Hydroelectric
Power Plant
Maintenance
Industrial
Painting and
Coatings
Insulation
Roofing
Systems
Abatement
Valve Services
What it is
Performed during
outages,
decommissioning
services
Routine maintenance,
repair and capital project
services
Clearing, surface
preparation, coatings
application, quality
control and inspection
testing
Industrial insulation
services commonly
packaged with industrial
coatings projects
Replace, repair and
upgrade industrial facility
roofing systems
Removal of asbestos
and heavy metal based
coatings such as lead
paint
Inspection, preventative
maintenance, repair of
valves and actuators
Nature of
contract award
Primarily Cost Plus
Primarily Cost Plus
Cost Plus
Cost Plus
Cost Plus
Cost Plus
Cost Plus/Fixed Price
Key Players
Bartlett, Day &
Zimmerman,
Shaw Group,
URS
Alstom,
Babcock & Wilcox,
Foster
Wheeler,
Jingoli, Kiweit, Matrix,
Shaw Group, Southern
Industrial, URS, WW
Gay,
Yates
Brock,
K2 Industrial,
Manta
Brock,
K2 Industrial, LVI,
Shook and Fletcher,
Vulcan
Brock,
Denard, K2
Industrial
K2 Industrial, LVI,
Shook
and Fletcher, Vulcan
Day & Zimmerman,
Ames,
Crane |
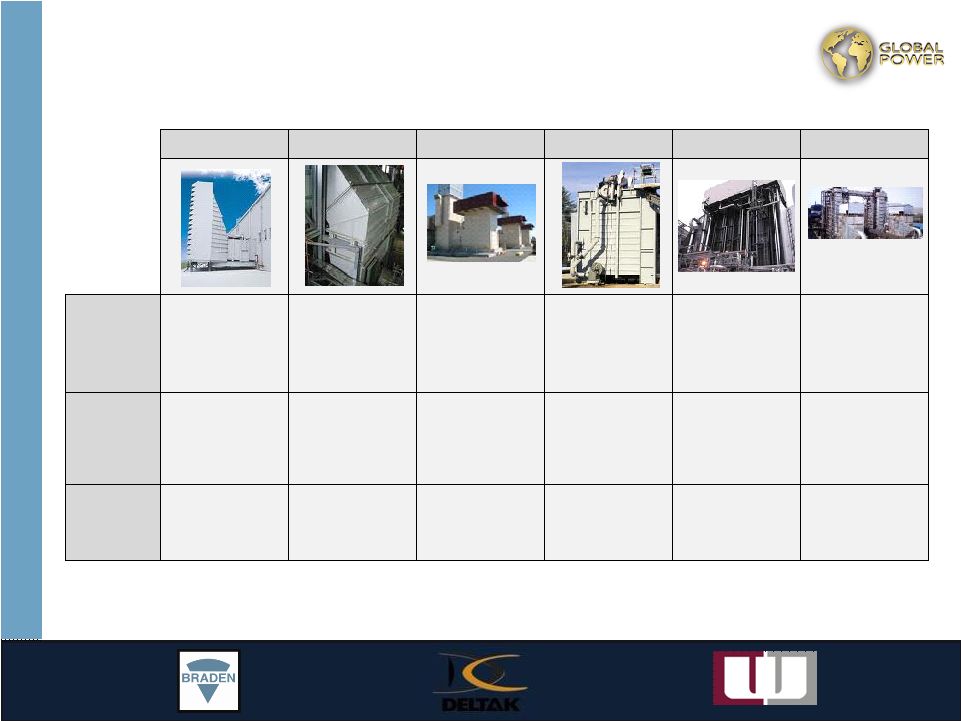 20
Products Spectrum 2011
Filter Houses
Inlet Systems
Exhaust Systems
Diverter Dampers
HRSGs
Specialty Boilers
What it is
Cleans debris and dirt from
air that enters gas turbine
Connects the filter house to
gas turbine and provides
noise control
Directs hot exhaust from the
turbine to the atmosphere
Diverts hot exhaust from
the gas turbine into a HRSG
at a CCS facility, or into
exhaust stack at a simple
cycle facility
Boiler that creates steam to
drive a steam turbine used
for industrial processing
Highly customized system
to capture waste heat and
convert it to steam
Nature of
contract award
Fixed Price
Fixed Price
Fixed Price
Fixed Price
Fixed Price
Fixed Price
Key Players
AAF,
BHA/Altair, Camfill
Farr Eng,
Donaldson,
J&G
Steel, Bilfinger & Burger,
G&H
AAF,
BHA/Altair, Camfill
Farr Eng, Donaldson, J&G
Steel,
Bilfinger & Burger AAF, Atco/Higgot Kane,
Bachmann, Camfill Farr
Eng,
G&H, NEM Power
Systems
,
Peerless
Bachmann,
Camfill Farr
Eng,
Donaldson, NEM Power Systems
, Stejasa
EIT,
Vogt, Aalborg, NEM
Power Systems,
Nooter
Erikson
Rentech,
NEM Power Systems
, Technotherm |
 21
Operating Divisions |
 22
Braden
Headquarters in Tulsa, OK and
Herleen, The Netherlands
Global sales representatives located in
the US, The Netherlands, Egypt, Korea
and China
Braden engineers work exclusively on
gas turbine plan designs
Highly flexible outsourced
manufacturing model
-
25-30% In-house
-
70-75% Outsourced |
 23
Supplied Filter Houses and Exhaust
Systems for 2 X 7FA Gas Turbine Power
Plant in Florida
All fabrication completed in house by
Braden Mexico
Stringent low noise acoustical
requirements
Two Customers:
-
Filter Houses Supplied to Turbine
OEM
-
Exhaust System supplied to the EPC
Braden
Greenland Energy Center Project -
Florida |
 24
One of the world’s largest natural gas transmission projects; 12,000 miles across
China
71 gas turbine exhaust systems; 100% market share
Order executed in local currency using Braden Shanghai Office
Fabricated In China using local fabrication partners and locally
available material,
100% on time
Braden
West to East Gas Pipeline Project -
China |
 Braden
The value model…attractive margins / low cost base
•
Proprietary designs
•
Extensive operating track record
•
High end quality
•
Commercial savvy
•
Low capital asset base
•
Low cost fabrication
•
Absence of performance
guarantees
Pricing Leverage
Attractive Profit Margins
Favorable Cost
Position
25 |
 Braden
Industry
Braden primarily serves the
worldwide gas turbine market
Natural gas-fired plants expected
to account for 46% of capacity
additions, as compared with 37%
for renewables, 12% for coal-fired
power plants and 3% for nuclear
through 2035
Upwards trend on average revenue
per new unit shipped
Average Revenue per Turbine Shipped
*Information per internal company estimates; 2005 is unaudited
Source: DOE Annual Energy Outlook 2010
Braden Revenue & EBITDA
26 |
 27
Williams
Headquarters in Tucker, GA
Seasoned Management/Project
Supervisory Staff
Top 5% in Industrial Safety Performance
Primarily Services US Nuclear Power
Plants
Multi-year Contracts for Nuclear Outage
Maintenance and Modification Work
Provider of Specialty Services at Nuclear and
Industrial Sites
-
On 35 of 65 Nuclear Plant Sites |
 Williams
Value proposition
Client Benefits
28 |
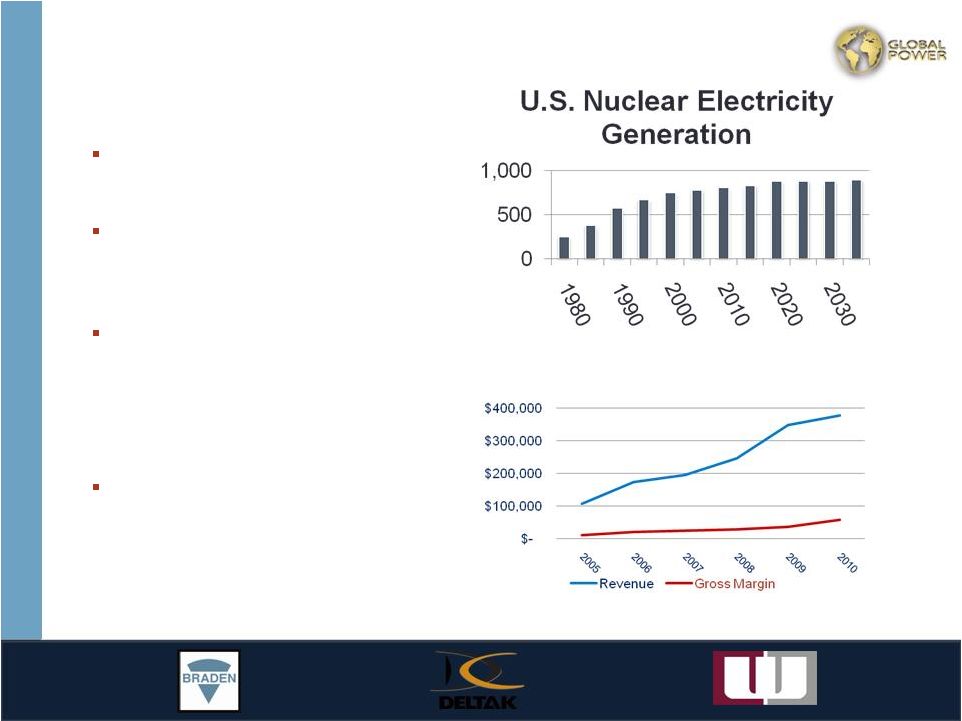 Williams
Industry
Williams primarily services U.S.
nuclear power plants
Nuclear power is a significant
component of the U.S. power
supply
Electricity generation from
nuclear power plants is expected
to grow from 806 billion kilowatt-
hours in 2008 to 898 billion
kilowatt-hours in 2035
The mix of future investments in
new power plants expected to
include fewer coal-fired plants
than other fuel technologies
Source: EIA Outlook, December 2009
*2005
is
unaudited;
reflects
results
post
acquisition
from
4/5/05
–
12/31/05
Billion
kwh
Williams Revenue & Gross Margin
29 |
 Security
upgrades
for
entire
nuclear
fleet
–
North
and
South
Integrated design / build contract
ENERCON has design scope
Williams has construction, purchasing, and
subcontracts
Cameras, fencing, observation towers and other
security upgrades
Williams/ENERCON
Alliance for nuclear capital project
30 |
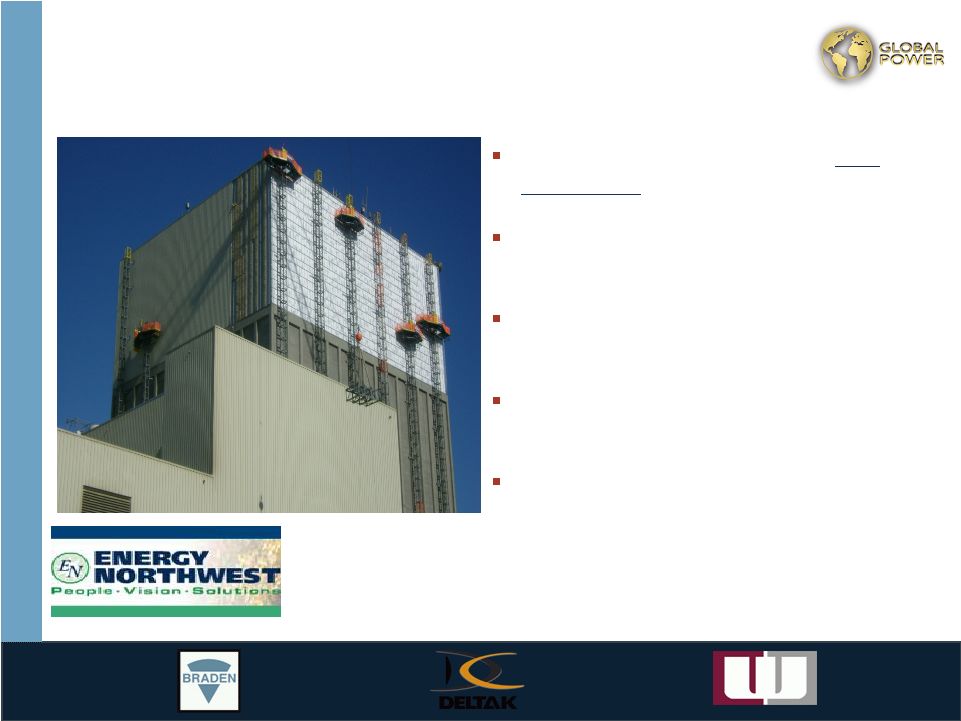 31
Williams
Energy Northwest reactor siding project
An excellent safety record with zero
recordables
while
working
200’
in
the
air
Only re-siding project in the world that was
performed while the station was on-line
Provided the client with specialized
methods for accessing the work area
Delivered the project under the estimated
funding and ahead of schedule
Completed extended condition repairs to
other buildings |
 32
Williams
Company information
Employees
-
Approximately 250 FT
-
Up to 6,000 Craft
-
(Average 3,000)
Work Type
-
60% maintenance
-
30% capital projects
-
10% new construction
Double-breasted
-
Union labor
-
Non-union labor
Customers
-
70% private sector
-
65% repeat business |
 33
Deltak
Headquarters in Plymouth, MN
Majority of manufacturing is completed
in-house for domestic projects
Specialty boiler systems for municipal
waste incinerators and chemical processes
Mid-sized HRSGs (<85MW) for power
applications, industrial process and
enhanced oil recovery |
 34
Deltak
Industry
Industrial and utility markets which include refineries, petrochemical,
pharmaceutical, paper and pulp and steel companies, in addition to
utilities, account for the bulk of the market for cogeneration equipment
Deltak anticipates growth in the mid-sized HRSG and CHP markets
General shift towards lowering carbon off take adding momentum to
generation
Sweet spot refineries |
 35
Global Power
Strong fundamental structure for a growing industry
Strong commercial risk / reward profile
Flexible manufacturing model
Geographic and end-market diversity
Long-standing relationships with a blue-chip customer base
Strong free cash flow generation
Favorable end-market dynamics
Acquisition growth opportunities |
 36
David L. Keller
President and Chief Executive Officer
David
L.
Keller
served
as
the
President
and
Chief
Operating
Officer
of
The
Babcock
&
Wilcox
Company
(B&W), a wholly owned subsidiary of McDermott International, Inc., from March 2001 until
his retirement in June 2007. B&W, a company with approximately $2 billion in
revenues in 2006, supplies fossil-fuel fired boilers, commercial nuclear steam
generators, environmental equipment and components, and boiler auxiliary equipment and
provides related services, including construction services.
Mr.
Keller’s
prior
position
was
President
of
Diamond
Power
International,
Inc.,
a
wholly
owned subsidiary of B&W, from March 1998 to February 2001. During his tenure with B&W,
Mr.
Keller served as a Board Chairman or Director of subsidiaries and joint ventures in the
Peoples Republic of China, Denmark, the United Kingdom, Australia and South Africa. He
holds a Bachelor of Science degree in Mathematics from the University of Akron.
David L. Willis
Chief Financial Officer and Senior Vice President
•
David L. Willis has a broad range of leadership experience across a range of industries:
restructuring advisory services, telecommunications, energy companies and public
accounting. From October 2001 to
January
2008,
he
was
with
the
restructuring
practice
of
Alvarez
&
Marsal
LLC,
a
global
professional
services firm, where he served clients in advisory and interim management capacities, most
recently as Senior Director, overseeing the development and implementation of
initiatives to improve operational and financial performance. Prior to Alvarez &
Marsal, Mr. Willis held positions with The Williams Communications Group and Ernst
& Young. Mr. Willis received his Bachelor of Business Administration degree from
the Price College of Business at the University of Oklahoma and holds an M.B.A. from
the University of Tulsa. He is a Certified Public Accountant and has a Certified Insolvency
and Restructuring Advisor certification (inactive).
Management
Years of
Experience
30
17 |
 37
Tracy D. Pagliara
General Counsel, Secretary and VP of Business Development
•
Tracy
D.
Pagliara
served
as
the
Chief
Legal
Officer
of
Gardner
Denver,
Inc.,
a
leading
global
manufacturer of highly engineered compressors, blowers, pumps and other fluid transfer
equipment, from
August
2000
through
August
2008.
He
also
had
responsibility
for
other
roles
during
his
tenure
with
Gardner
Denver,
including
Vice
President
of
Administration,
Chief
Compliance
Officer,
and
Corporate
Secretary.
Prior
to
joining
Gardner
Denver,
Mr.
Pagliara
held
positions
of
increasing
responsibility in the legal departments of Verizon Communications/GTE Corporation from August
1996 to August 2000 and Kellwood Company from May 1993 to August 1996, ultimately
serving in the role of
Assistant
General
Counsel
for
each
company.
Mr.
Pagliara
has
a
B.S.
in
Accounting
and
a
J.D.
from
the University of Illinois. He is a member of the Missouri and Illinois State Bars and a
Certified Public Accountant.
Kenneth W. Robuck
Senior Vice President and President of the Services Division
•
Kenneth W. Robuck originally joined the Williams Group in 1995; he left the company for a
brief period and
returned
in
2005
to
run
Williams
Plant
Services,
LLC,
the
largest
of
the
Williams’
subsidiaries,
which is responsible for all major maintenance and construction services work. In early 2006,
Mr. Robuck assumed the additional responsibility of Chief Operating Officer and was
appointed President of
the
Williams
Group
in
October
2007.
Mr.
Robuck
has
over
27
years
experience
in
the
nuclear
power,
fossil-fuel
power,
petrochemical
and
related
industrial
industries.
Mr.
Robuck
is
a
graduate
of
Auburn
University with a B.S. in Civil Engineering.
Management
Years of
Experience
25
28 |
 38
Dean J. Glover
Senior Vice President and President of the Products Division
Dean J. Glover joined Braden Manufacturing in December 2005 as Chief Operating Officer and was
promoted
to
his
positions
at
Global
Power
and
Deltak
in
September
2008.
Mr.
Glover
has
extensive
international experience having lived in various international locations for most of his
career. Mr. Glover has over 18 years of commercial and technical experience in the
power industry. Prior to joining Global Power, Mr. Glover led the global supply chain,
including manufacturing for Diebold Inc. Prior to this, Mr. Glover spent 13 years with
General Electric in various managerial and technical roles and is a certified Six Sigma
Master Blackbelt. Mr. Glover holds a Bachelors Degree in Mechanical Engineering from the
University of Nebraska and an M.B.A. from the Kellogg Graduate School of Management,
Northwestern University.
•
Management
Years of
Experience
20 |
 39
Appendix
Company history
The Braden Group founded as Braden Steel in 1923 in Tulsa
Various owners over the next six decades, vast assortment of products spanning several
industry sectors:
-
Metal buildings, air inlet and exhaust systems, large mining trucks, pump jacks, magnetic
containment enclosures, industrial incinerators, heat recovery boilers
The Williams Group formed in 1958 as a family owned specialty painting business
The Deltak Group formed in 1969 and spun out to employees in 1972
The Braden Group sold to Jason Incorporated in 1989, which also purchased the Deltak Group in
1994, forming Global Power’s predecessor, Jason Power Systems
GEEG Holdings L.L.C. created through leveraged buyout in 1998
-
Private equity sponsor —
Sawmill Capital
-
GEEG purchased by Harvest Partners in August 2000
-
Purchased Consolidated Fabricators in September 2000
Global Power Equipment Group formed through IPO in May, 2001
-
Purchased Deltak Power Equipment China (“DPEC”) in July
2004* -
Purchased the Williams Group in April 2005
* Sold in 2007 when Deltak exited the large-scale HRSG business
|
 40
Appendix
Balance sheet highlights
GPEG has strengthened its balance by building cash and paying down debt since the
emergence from Chapter 11 in January 2008
NOTE: Certain prior period balances have been reclassified to conform to current period
presentation.
Cumulative
(in thousands)
3/31/08
12/31/08
12/31/09
12/31/10
Variances
Unrestricted Cash
36,540
$
57,633
$
103,220
$
55,474
$
$ 18,934
Restricted Cash
3,006
3,013
2,018
1,019
Other Current Assets
138,092
124,154
106,565
101,946
Current Assets
177,638
184,800
211,803
158,439
Fixed Assets
12,639
12,610
12,945
12,234
Goodwill & Intangibles
98,414
96,909
95,149
93,389
Other Assets
6,227
6,720
6,114
1,663
Total Assets
294,918
301,039
326,011
265,725
Accounts Payable / Accruals
44,665
42,588
59,392
43,377
Deferred Revenue
17,895
8,695
3,006
-
Other Current Liabilities
53,222
44,174
42,511
21,178
Current Liabilities
115,782
95,457
104,909
64,555
Term Debt (including current portion)
88,750
85,000
65,325
-
$ (88,750)
Other Long-Term Liabilities
19,379
15,309
19,299
22,114
Total Liabilities
223,911
195,766
189,533
86,669
Stockholders Equity
71,007
105,273
136,478
179,056
$ 108,049
Total Liabilities & Equity
294,918
$
301,039
$
326,011
$
265,725
$ |
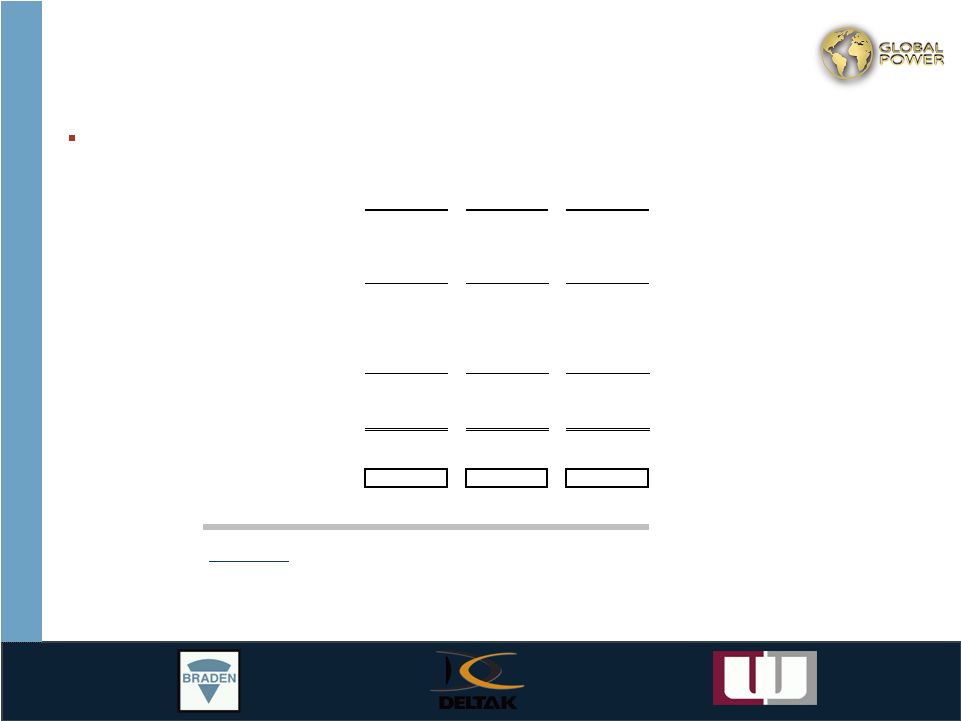 41
Appendix
Operations highlights
Over this period, GPEG’s Products and Services platforms have balanced one another
through the recent cycle in the gas turbine OEM space
EBITDA is a non-GAAP measure; see following page for reconciliation to net
income. (in thousands)
2008
2009
2010
Revenue
556,764
$
540,610
$
520,144
$
Cost of Sales
456,784
460,185
417,623
Gross Profit
99,980
80,425
102,521
% of Revenue
18.0%
14.9%
19.7%
Operating Expenses
50,418
46,664
52,872
% of Revenue
9.1%
8.6%
10.2%
Operating Profit (Loss)
49,562
33,761
49,649
% of Revenue
8.9%
6.2%
9.5%
EBITDA
53,354
$
37,912
$
53,709
$
% of Revenue
9.6%
7.0%
10.3%
Revenue Mix
Products
56%
36%
27%
Services
44%
64%
73% |
 42
Appendix
Reconciliation of EBITDA to net income
(in thousands)
2008
2009
2010
EBITDA
$ 53,354
$ 37,912
$ 53,709
Less:
Income tax provision
(3,151)
(5,282)
(6,410)
Interest expense
(11,667)
(9,667)
(7,052)
Depreciation and amortization
(3,792)
(4,151)
(4,060)
Reorganization items
(23,574)
(1,030)
1,477
Add:
Income from discontinued operations
23,668
10,105
2,971
Net Income
$ 34,838
$ 27,887
$ 40,635
NOTE: EBITDA reflected above excludes restructuring charges and
varies from EBITDA from Continuing Operations as
defined in our quarterly and annual press releases. |